Abstract
Accurate estimation of precipitation is crucial for fundamental input to various hydrometeorological applications. Ground-based precipitation data suffer limitations associated with spatial resolution and coverage; hence, satellite precipitation products can be used to complement traditional rain gauge systems. However, the satellite precipitation data need to be validated before extensive use in the applications. Hence, we conducted a thorough validation of the Global Precipitation Measurement (GPM) Integrated Multi-satellite Retrievals (IMERG) product for all of Iran. The study focused on investigating the performance of daily and monthly GPM IMERG (early, late, final, and monthly) products by comparing them with ground-based precipitation data at synoptic stations throughout the country (2014–2017). The spatial and temporal performance of the GPM IMERG was evaluated using eight statistical criteria considering the rainfall index at the country level. The rainfall detection ability index (POD) showed that the best IMERG product’s performance is for the spring season while the false alarm ratio (FAR) index indicated the inferior performance of the IMERG products for the summer season. The performance of the products generally increased from IMERG-Early to –Final according to the relative bias (rBIAS) results while, based on the quantile-quantile (Q-Q) plots, the IMERG-Final could not be suggested for the applications relying on extreme rainfall estimates compared to IMERG-Early and -Late. The results in this paper improve the understanding of IMERG product’s performance and open a door to future studies regarding hydrometeorological applications of these products in Iran.
1. Introduction
Precipitation plays a crucial role in the Earth’s hydrological cycle and is a fundamental input to a wide range of hydrological, meteorological, and climate model applications [1,2]. Thus, accurate estimation of the precipitation amount and pattern is vital for improved prediction of water-related processes as well as reducing uncertainties for effective water resource management practices [3,4]. To obtain precipitation amounts, ground-based measurements, i.e., rain gauges and weather radars, are considered a reliable source mainly at the local scale. At the regional and global scale, however, there are limitations for using ground-based measurements, particularly in most developing countries [5]. Radar networks are often available where there is a coverage by rain gauges. However, radars are subject to different errors and uncertainties, such as ground clutter, anomalous propagation, signal attenuation, beam blockage, and bright band contamination [6].
Rain gauges are limited in describing the spatial distribution of precipitation depending on the arrangement and density of the rain gauge network [7,8]. In order to spatially characterize precipitation, gauge measurements are transformed to a gridded precipitation dataset. This is carried out through interpolation of rain gauge measurements, using spatial interpolation and geo-statistical methods [9]. These may be prone to missing values, wind effects, insufficient numbers of rain gauges, and a sparse network, especially in less accessible mountainous and oceanic areas [4].
In view of the above, the spatial limitations, resolution, and coverage of ground-based measurements highlight the importance of satellite-based precipitation estimates at both the regional and global scale. Satellite-based precipitation estimates are also subject to uncertainties through cloud top reflectance, thermal radiance, infrequent satellite overpasses, and retrieval algorithm related to the nature of indirect measurement [10]. Therefore, a thorough validation of satellite precipitation data in any given area is necessary to achieve insight regarding is accuracy as well as identifying sources of errors to improve algorithms and satellite sensor development. Further, accuracy assessment taking into account the pros and cons of satellite precipitation estimates is imperative before using data in hydrological modeling in any given region [11,12]. Such findings help in selecting a supportive product for a special application under different circumstances [1].
Given the success of the Tropical Rainfall Measuring Mission (TRMM), the National Aeronautical and Space Administration (NASA) and Japan Aerospace Exploratory Agency (JAXA) launched a new generation Global Precipitation Measurement (GPM) mission in early 2014 to replace the TRMM mission [13]. The GPM mission is expected to compensate the limitations of TRMM precipitation products by providing higher resolution, larger spatial coverage, and more accurate global precipitation estimates [14]. The GPM precipitation algorithm, Integrated Multi-satellite Retrievals for GPM (IMERG), is based upon the experiences from the TRMM algorithm. As the spatiotemporal resolution and coverage of GPM have been extended beyond the TRMM resolution and coverage, the performance of the GPM IMERG products needs to be evaluated and validated globally.
Several studies have compared the GPM IMERG and TRMM products with ground-based measurements, i.e., rain gauge and weather radar [4,6,10,15,16,17,18,19], considering their hydrological applications [14,20,21,22]. Also, different GPM IMERG products regarding temporal resolutions have been evaluated considering various climatic and topographic conditions using various statistical measures across the world [5,23,24,25,26,27,28,29,30]. Although most of these studies confirmed the improvement of the IMERG products relative to those of the TRMM Multi-satellite Precipitation Analysis (TMPA), a more comprehensive investigation is still essential to better understand the IMERG performance in various regions of the world taking into consideration different products’ versions and temporal resolution. Countries in the Middle East suffer from acute hydrometeorological data shortage, both in terms of quality and quantity [15], and Iran is not an exception. Rain gauges are sparse and unevenly distributed throughout the country, particularly in remote areas of the center and eastern areas. Delays in data processing and publishing for public access and scientific use and an absence of data sharing in many trans-boundary basins constitute a main shortcoming for ground-based precipitation data in the country [5]. To our knowledge, there are very few investigations of the IMERG products´ performance over Iran on a basin scale [5,10]. There are no comprehensive studies that investigate the performance of the IMERG product at the country level.
According to the above, the newly available IMERG products have not been thoroughly explored for Iran as a whole. The country covers different climatic, geographic, and topographic features, with respect to temporal and spatial particularities and different satellite products´ versions. This study aimed to provide a better understanding of the IMERG product’s performance over the country and open a door to future studies regarding hydrological and hydrometeorological applications of these products at both the local and regional scale. Accordingly, we performed a comprehensive evaluation of the performance of IMERG products considering three time-latencies, IMERG-Early, IMERG-Late, and IMERG-Final, and two temporal resolutions, daily and monthly, based on eight criteria indices. We examined these criteria in view of spatial and temporal patterns related to features, such as elevation, slope, latitude, and longitude, over the entire Iran. Also, the statistical distributions of the precipitation products were compared to that of ground measurements for different seasons.
2. Materials and Methods
2.1. Study Area
Iran covers an area of about 1.648 million km2, located between 44–64° East and 25–40° North in the eastern part of the Middle East [31]. The country is bordered by Azerbaijan, Armenia, Turkmenistan, and the Caspian Sea to the north; Afghanistan and Pakistan to the east; Oman Sea and Persian Gulf to the south; and Turkey and Iraq to the west (Figure 1a). The temporal and seasonal distribution of precipitation is governed by the interaction of the tropical air mass from the Red Sea, the Mediterranean low pressure, and the Siberian and western high pressures [31].
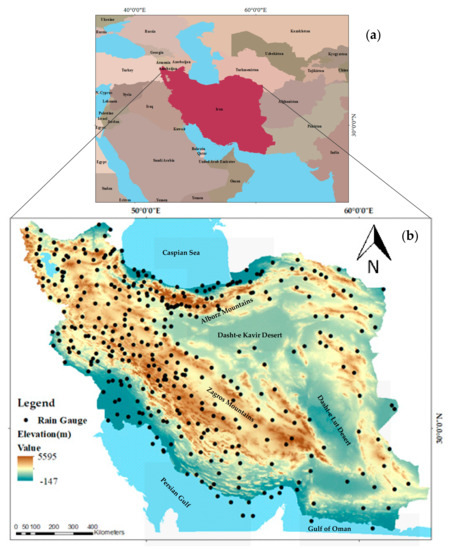
Figure 1.
(a) Map of Iran and (b) distribution of rain gauges with altitude.
Half of Iran’s land surface is mountainous, a quarter is covered by fertile and productive plains, and the final quarter by salty arid desert [32]. Zagros and Alborz are the two main mountainous areas, which are located along the western and northern borders of the country, respectively. These mountain ranges prevent much of the available humidity, mostly initiating from the Mediterranean and Caspian Sea in the West and North of the country, from reaching the interior parts, so singularly govern the spatial patterns of precipitation across Iran [31,33] (Figure 1b). As a result, the central parts of the country and the southwestern areas of the Caspian Sea receive an average of 100 and 1800 mm year-1, respectively [31].
Iran encircles a variety of climates, which range from extremely to subtropical dry in the central to eastern parts of the country, wet to extremely wet in the coastal plains of the Caspian Sea, relatively wet in some western areas, and arid to semiarid zones in the rest of the country [34]. The Mediterranean Synoptic System is the dominant weather system in the country, where the rainy season is from October to April, with a peak in December. The driest month is July.
2.2. Datasets
2.2.1. Satellite-Based Precipitation (GPM IMERG)
The GPM mission was launched on 27 February 2014 by NASA and JAXA as an international joint project for frequent measurements of near-global precipitation. Like the antecedent mission TRMM, the GPM is a constellation of multiple satellites, which comprise the GPM Core Observatory carrying combined passive/active sensors, and microwave measurements by partner satellites. The Core Observatory information acts as a reference standard to combine other satellites’ microwave precipitation measurements that orbit within the same constellation. The GPM Core Observatory technically consists of two major sensors: GPM Microwave Imager (GMI) and Dual-frequency Precipitation Radar (DPR). The GMI sensor measures precipitation characteristics, such as intensity, type, and size, while DPR observes the internal structure of storms within and under the clouds and measures precipitation in 3D throughout the atmospheric column and provides an insight into the structure of rain drops [7].
The success of the GPM mission depends upon algorithm development that combines both GMI and DPR observations and the partner satellites’ measurements. GPM data are available online at three various processing levels, including geo-located and calibrated (Level 1), geophysical data product derived from Level 1 data (Level 2), and a composite of Level 2 data products (Level 3) [35]. The GPM Level-3, namely IMERG, is derived from multiple satellites and available as three different types of daily products consisting of early run (IMERG-Early), late run (IMERG-Late), and final run (IMERG-Final), which are published with 4-h, 12-h, and 2.5-month latencies, respectively, and a monthly product (IMERG-Monthly). These products are accessible at 0.1° × 0.1° spatial resolution for regions between 60° S and 60° N globally and at several temporal resolutions, i.e., half-hourly, 3-hourly, daily, and monthly [15]. More detailed information and an algorithm description can be found in [35]. While IMERG-Early provides a quick estimate with only a 3-h latency period, IMERG-Late successively presents better estimates as data from more partner satellites is merged with a 12-h latency period. IMERG-Final estimates are, however, presented after bias adjustment with monthly rain-gauge measurements with a three-month latency. The IMERG-Early data can be used for potential flood or landslide warnings while the IMERG-Late and Final data can be used in agricultural forecasting, drought monitoring, and hydrological modeling [24].
It is noted that the IMERG-Final run algorithm provides two different types of precipitation estimates, including precipitationCal (with rain gauge-adjusted processes) and precipitationUnCal (without rain gauge-adjusted processes). Based on the literature, precipitationCal has indicated better performance relative to ground-based measurements [25]. Therefore, this algorithm together with the IMERG-Early, -Late, and -Monthly products from April 2014 until December 2017 were used in this study.
2.2.2. Ground-Based Precipitation
The ground-based precipitation data were obtained from the I.R. IRAN Meteorological Organization (IRIMO). IRIMO is responsible for recording hourly and daily precipitation and quality control is carried out before releasing recorded data to the user’s community across the country [33]. This dataset is considered as the most reliable precipitation data source in Iran [31].
Although these data are freely available for research purposes, the data are not available online and should be obtained in person. In total, 403 meteorological synoptic stations were under operation across the country, of which only 370 stations had at least one year of daily records and were selected for this study. Perfectly, 368 and 349 of the selected stations had at least two and three years of daily records for the studied period, respectively, between April 2014 and December 2017. While GPM IMERG data were historically complete (without missing data), the selection of this period is attributed to the availability of both satellite and rain gauge precipitation datasets. Figure 1b shows the distribution of the synoptic stations throughout the country.
2.3. Evaluation Processes and Indices
2.3.1. Data Preparation
The GPM IMERG products that cover the entire country from 1 April 1 2014 to 31 December 2017 at daily and monthly time scales and 0.1° × 0.1° (about 11 km on the equator) resolution were acquired. The RT-H5 file format, in which RT refers to real-time and H5 denotes an HDF5 file, was converted to the ASCII format and all days were stacked by a written algorithm in R programming language. The precipitation was converted to mm day−1 for all IMERG products for the purpose of consistency with ground-based data. As for the point (rain-gauges) to pixel (IMERG products) comparison, each IMERG pixel corresponding to single rain gauge locations was extracted. The extracted IMERG data and the corresponding rain gauge data for daily and monthly time scales were then used in the analyses.
2.3.2. Error Analysis of IMERG Products
To assess the performance of satellite-based precipitation products against measured precipitation by rain gauges, widely applied evaluation indices, including the mean absolute error (MAE), Pearson correlation coefficient (CC) [14], and relative bias (rBIAS) [36], were used. In this regard, MAE (Equation (1)) indicates the error distribution and mean magnitude of errors without considering direction. MAE has the same unit as the precipitation data (i.e., mm day−1). These criteria were calculated for each grid covering the attributed rain gauges. Daily and monthly products were separately analyzed, mainly due to the smooth nature of monthly data and superior performance relative to daily products. The CC (Equation (2)) shows the agreement between the precipitation estimated by the satellite and rain gauge measurements. CC is a dimensionless number, which varies between −1 and 1, with CC equal to zero when there is no correlation. The rBIAS (Equation (3)) represents the size and direction of the difference between the two datasets. Positive and negative rBIAS is an overall overestimation and underestimation of the satellite relative rain gauge measurements, respectively [7]. MAE and rBIAS close to 0 and CC close to 1 display the best performance of the IMERG products relative to the rain gauge measurements in this study:
where Oi and Si are the observed rain gauge and satellite-based precipitation data, respectively, and are the rainfall averages for pixel i associated to the rain gauge, and n is the total number of satellite-gauge data pairs, which are being compared.
In addition, to investigate how often a significant over/under-estimation by the satellite takes place regardless of the overall magnitude and direction of the errors, we introduced two new indices, named over and under, based on introducing a preliminary index of equal, which stands for an insignificant error. This corresponds to an error smaller than 10% as compared to measurements. However, errors smaller than 0.25 mm day−1 were considered insignificant as well. The over, under, and equal indices are presented as percentages.
Further, to quantify the precipitation detection ability of the satellite-based precipitation estimates against the ground-based observations, two indices, including the probability of detection (POD) and false alarm ratio (FAR) were calculated (Equations (4) and (5)). The POD expresses the ratio of the correct precipitation detection of the satellite and FAR measures the proportion of no-rain events that are recorded as rain by the satellite. The closest values to 100% and 0% display the best satellite performance for POD and FAR, respectively [14]. The following equations define the POD and FAR:
where n11 is the number of rainfall events that are observed by the rain gauge and detected by the satellite, n10 is the number of rainfall events that are observed by the rain gauge but not detected by the satellite, and n01 is the number of rainfall events that are detected by the satellite but not observed by the rain gauge.
2.3.3. Analysis of Statistical Distribution
The statistical distribution of rainfall data is an important component of hydrological and hydrometeorological studies, such as in intensity–duration–frequency (IDF) relationships and design storms. The quantile-quantile (Q-Q) plot is a graphical tool for determining whether the two datasets, i.e., ground- and satellite-based, have similar distributional shapes. The technique is conducted by plotting quantiles (or percentiles) of the two datasets versus one another and comparing the plot with a 45° reference line. Accordingly, the Q-Q plot is a scatter plot, with the points falling approximately along the reference line standing for a common distribution for the two datasets. On the contrary, the greater the departure from the reference line, the greater the evidence for refusing this assumption. It is worth noting that the quantiles of a dataset are the points below which a certain proportion of the data lies. For example, in a classic standard normal probability distribution with a mean of 0, the 0.5 quantile (or 50th percentile), 0 means that half the data are not exceeding 0.
There are also analytical methods, such as the chi-square and Kolmogorov–Smirnov 2-sample tests, that are used for assessing if two sets of quantiles follow the same distribution. However, the Q-Q plot is favorable as it provides more insight into the nature of the difference between two datasets than analytical methods. Although the Q-Q plot is only a visual check rather than an air-tight proof, it helps to observe if the assumption is plausible and, otherwise, which data points at which quantile cause the violation of the assumption.
The Q-Q plot can easily show the under/overestimation of a dataset, i.e., satellite, compared to the rain gauge, between percentiles of the datasets. Additionally, many distributional aspects, including shifts in location, shifts in scale, change in symmetry, tail behavior, and the presence of outliers, can be discerned. The behavior of the tail of the Q-Q plot can be important for extreme hydrology studies. The tail refers to data points associated to statistically rare incidents, such as values above the 95th or 99th percentile of the datasets.
2.3.4. Geospatial and Temporal Analysis
The difference between the IMERG products and rain gauge measurements may depend on geospatial conditions, time of the year, and the rainfall nature at the different geospatial locations. To investigate this dependency, the evaluation indices presented in Section 2.3.2 were calculated for different categories of geospatial factors, such as the elevation, slope, latitude, and longitude of satellite grids corresponding to rain gauges locations. The evaluation was carried out for additional factors, including the average annual rainfall, mean dry period (intervals between rainfall events), and rainfall index (average annual rainfall/mean dry period) for stations representative of the frequency and amount of rainfall at a given location. For simplicity, a location with a lower or higher rainfall index is, alternatively, mentioned as a dryer or wetter location, respectively.
We used box plots to illustrate the variation of the indices for 10 different categories of rain gauges. These categories were based on selecting 11 range limits of a given geospatial factor so that an equal number of rain gauges was placed into each category (37 rain gauges out of the selected 370 synoptic stations). Therefore, the 1st and the 11th limits were the minimum and the maximum values of the geospatial factor among the selected locations of the study.
Further, the spatiotemporal evaluations were separately reported for each month and season using combined maps. That is, plotting the spatial variation of the indices, e.g., POD, and, at the same time, the factors, e.g., topography, for a given month or season in a single map.
3. Results and Discussion
3.1. General Comparison of Precipitation Datasets
Monthly, seasonal, and annual average precipitation from daily IMERG-Early, -Late, -Final, and -Monthly products together with the corresponding ground observations are shown in Figure 2, Figure 3, and Figure 4. We defined the seasons as winter (Dec-Jan-Feb), spring (Mar-Apr-May), summer (Jun-Jul-Aug), and fall (Sep-Oct-Nov). Figure 2 shows the monthly averages of daily products, including IMERG-Early, -Late, -Final, and -Monthly, compared to rain gauge-measured precipitation during the study period. It can be seen that the difference between IMERG-Early, -Late products, and observations is maximum in April and May (Figure 2). The rain gauge corrected IMERG-Final and -Monthly products showed good agreement with observations during these two months. The correlation between IMERG-Early and -Late products and ground observations in Figure 2 is 0.93 and 0.99 for IMERG-Final and -Monthly products, respectively. In other words, the IMERG-Early and -Late daily products are generally less accurate in estimating the monthly average rainfall amounts as compared to the IMERG-Final. Further, the comparison indicates that IMERG-Final and -Monthly are highly correlated during all months and consistent with the rain gauge measurements.
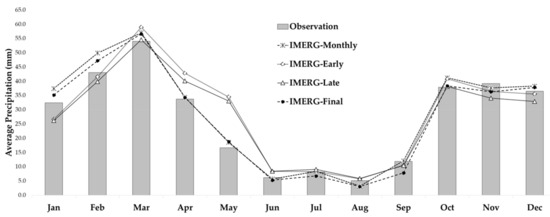
Figure 2.
Monthly averages of IMERG-Early, -Late, and -Final based on the daily time step and -Monthly products compared to ground-based precipitation measurements (Observation).
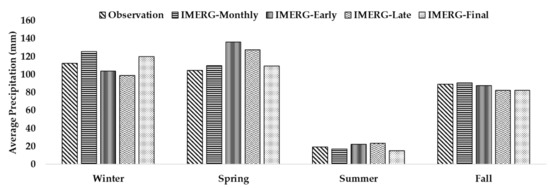
Figure 3.
Seasonal averages of monthly and daily precipitation products (IMERG-Early, -Late, and -Final), compared to ground-based precipitation measurements (Observation).
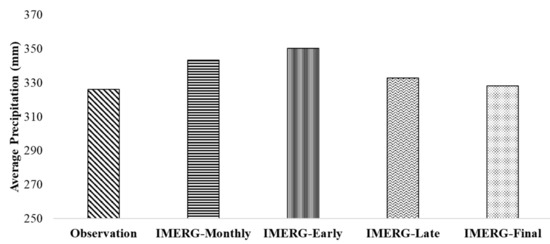
Figure 4.
Annual averages of monthly and daily precipitation products (IMERG-Early, -Late, and -Final), and ground-based precipitation measurements (Observation).
According to Figure 3, the IMERG-Early and -Late slightly underestimated the measured precipitation in winter (by −7% and −12%, respectively) and overestimated the measured precipitation in the spring (by 33% and 25%, respectively). In contrary, the IMERG-Final and -Monthly overestimated the rain gauge measurements in winter (by 6% and 12%, respectively) but adequately matched measured precipitation in the spring (overestimation by ~5%). Considering summer and fall, all daily products showed high performance for the entire country while the IMERG-Monthly product performed well for spring, summer, and fall with overestimation in the winter. Overall, IMERG-Final and -Monthly products showed high performance in estimating seasonal precipitation relative to measurements.
Average annual precipitation (Figure 4) showed no major discrepancy between the IMERG-Late and -Final (overestimation by only 2% and 1%, respectively) products relative to rain gauge measurements, but the IMERG-Early and -Monthly products overestimated by 7% and 5%, respectively, relative to the measurements.
3.2. Error Analyses of IMERG Products
A comparison of corresponding spatiotemporal rainfall data in the two datasets, i.e., satellite and rain gauge from the same location and time, was carried out using the evaluation indices introduced in Section 2.3.2. Table 1 presents these indices, including CC, MAE, rBIAS, POD, FAR, Equal, Over, and Under for the daily (IMERG-Early, -Late, and –Final) and monthly (IMERG-Final) time scale over the country. The indices were calculated based on the overlaid IMERG pixels and rain gauge data coordinates during the 2014–2017 period. For the comparison purposes, the daily products were accumulated for each month and presented in the monthly time scale, so all products can be compared in a monthly time scale supported with different values for the criteria indices monthly time scale presented in Table 1. It is noted that the algorithms used for producing the IMERG-Monthly product are different from those of the IMERG-Final, although both are gauge-corrected products.

Table 1.
Error analyses for daily and monthly IMERG products vs. rain gauge measurements in both monthly and daily time scales.
Generally, in the monthly time scale, the IMERG-Monthly product showed the best performance in comparison to rain gauge measurements, in relation to the daily IMERG products, especially for IMERG-Early and IMERG-Late. However, the IMERG-Final products indicated, generally, comparable results and even, to some degree, outperformed the IMERG-Monthly product according to the MAE, rBIAS, FAR, Over, and Equal criteria. The CC between monthly rainfall from gauges and satellite products was the highest, 0.68 for the IMERG-Monthly, and the MAE was the lowest, yielding 0.43 mm day−1 for the IMERG-Final. In the case of relative bias between rain gauges and satellite products, the results were excellent, yielding less than ±5% except for IMERG-Early in the daily time scale. The bias calculation showed that the IMERG-Early products slightly overestimated the rain gauge measurements at the country level, but a substantial improvement regarding rBIAS can be seen from IMERG-Early, 9% to Final, 0% in daily time scale (Table 1).
Generally, in the case of IMERG daily products, in the daily time scale, criteria indices for the three products did not significantly differ from each other, but the performance of the daily IMERG products relative to the rain gauge measurements improved from IMERG-Early to -Final. The IMERG-Final showed the highest correlation with rain gauge measurements, with a CC value of 0.47, followed by the IMERG-Late and -Early both yielding 0.41. The MAE and rBIAS decreased from the IMERG-Early to -Final products, showing a better performance of the IMERG-Final product relative to –Early and –Late in comparison with the rain gauge measurements in the daily time scale (Table 1).
The results were acceptable for the satellite precipitation detection ability in all daily IMERG products: POD = 0.68% in the daily time scale and POD = 98%–100% in the monthly time scale. The POD did not change from the IMERG-Early to -Final daily products, meaning that the satellite-gauge-adjusted algorithm, used in the IMERG-Final product, did not help for the detection improvement of the IMERG-Early and –Late products. As mentioned in Section 2.2.2, the GPM Core Observatory’s temporal resolution is three hours, which results in no calibration of the precipitation observed by the constellation satellites within this gap for a given area. However, this problem is resolved by accumulating the daily into monthly precipitation (POD = 1). Similar results were achieved for FAR calculations. The IMERG daily products showed low performance by having a false detection value of 0.6 while the monthly FAR was 0.23, indicating an acceptable rain detection ability at the monthly time scale (Table 1).
At the daily time scale, in principal, no significant improvement in rainfall detection ability regarding POD and FAR indices were observed. Further, no substantial differences between all three daily products were observed, as the monthly product showed a better performance in the estimation of precipitation considering MAE and rBIAS, and precipitation detection, POD, and FAR.
The over index did not change much from IMERG-Early to -Final and the under index decreased slightly from IMERG-Early (42%) to -Final (41%) products. For the daily products, equal was much smaller than both over and under, and over was 2% to 6% higher than under. However, for the monthly product, equal was about 47%, and over was 17% higher than under (Table 1). The more smoothed nature of the monthly data variation, as compared to daily, is a probable reason for the higher equal obtained for the monthly product. Also, the larger upper values as compared to under for all products is in line with the overall overestimation shown by the positive rBIAS. However, the cause of a larger difference between upper and under for the monthly product, compared to the daily ones, can be explained under some circumstances. For instance, suppose a month with only one (or few) rainy day is overestimated by the satellite. While, at a daily time scale, this will be counted as only one (a few) day of overestimation in the calculation of over, at the monthly time scale, this would be counted as one month as compared to the length of monthly data, which is almost 30 times shorter than the daily ones, therefore, resulting in higher over.
3.3. Evaluation of Statistical Distribution of IMERG Products
Figure 5 displays the Q-Q plots for each IMERG daily product and different seasons, including winter (December-February), spring (March-May), summer (June-August), and fall (September-November). It should be noted that these plots are not showing data from the tails of the distributions (close to the 100th percentile). For clarity, the Q-Q plots contain rainfall data at least until the 95.5th percentile. As a result, only rainfall lower than 37 mm day−1 (typical high rainfall amount for Iran) was taken into consideration, allowing a comparison between all Q-Q plots. In addition, the exact location of some typical quantiles is depicted by an arrow and a percentile value to better visualize the data distribution.
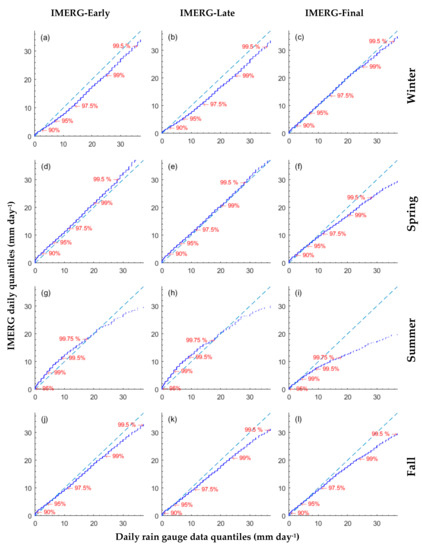
Figure 5.
Q-Q plots of daily rainfall (IMERG and rain gauge) during 2014–2017: (a) IMERG-Early for Winter, (b) IMERG-Late for Winter, (c) IMERG-Final for Winter, (d) IMERG-Early for Spring, (e) IMERG-Late for Spring, (f) IMERG-Final for Spring, (g) IMERG-Early for Summer, (h) IMERG-Late for Summer, (i) IMERG-Final for Summer, (j) IMERG-Early for Fall, (k) IMERG-Late for Fall, and (l) IMERG-Final for Fall. The arrows and percentile values in red depict the location of quantiles.
As an example, Figure 5a shows that the most obvious departures for the IMERG-Early product in comparison to rain gauge observations in winter start above the 90th percentile of data (i.e., rainfall >3 mm day−1) in the form of an underestimation that gradually increased until the 97.5th percentile (~14 mm day−1). This underestimation remained rather constant until the 99.5th percentile (~36 mm day−1) by an amount of about 2.5 to 3 mm day−1 while there was a slight overestimation for the more frequent rainfall events (lower than the 90th percentile), with rainfall amounts less than 1 mm day−1. Figure 5b shows that the IMERG-Late, to a lesser extent, overestimated low rainfall, but larger underestimations are seen for higher rainfall compared to the IMERG-Early product. However, as shown in Figure 5c, the higher accuracy of the IMERG-Final product leads to a significant reduction of departures from the 45-degree line that is observed for the IMERG-Early and -Late products in the form of underestimation. This result shows an acceptable fit for rainfall located approximately between the 95th and 99th percentile (~6–24 mm day−1) while the overestimation extends up to the 95th percentile (i.e., rainfall <7 mm day−1). That could be the reason for the overestimated average winter rainfall for the IMERG-Final product observed in Figure 3.
In Figure 5d, the scatter of points is linearly located to, and slightly above, the 45-degree line for rainfall less than the 99.5th percentile. This can be seen as a shift in the location of the statistical distribution of the IMERG-Early products in comparison to the distribution of rain gauge data. In other words, the IMERG-Early overestimated daily rainfall for values less than 29 mm in spring by an amount of about 1 to 1.5 mm. As seen in Figure 5e, the overestimation was reduced for the IMERG-Late product such that the points between the 97.5th and the 99.5th percentiles nearly overlaid the 45-degree line. On the other hand, as seen in Figure 5f, while the IMERG-Final product resulted in a better fit for the more frequent daily rainfalls in spring (i.e., less than 11 mm), major departures for higher values in the form of underestimation appear close to the 97.5th percentile. Therefore, a better fit for frequent rainfall by IMERG-Final suggested by Figure 5f seems to be the reason for the best estimation of average spring rainfall depicted in Figure 3. This product cannot be used as a firm reference dataset for extreme rainfall studies. Instead, a corrected IMERG-Early or -Late product, by removing the shift value for every data point, will be a better choice for the evaluation of extreme rainfall events in spring, which recently caused severe flood events in the country [37].
The worst distributional fit between IMERG daily products and rain gauge observations is observed for summer (Figure 5g–i). Among all daily products, the best fit with measurements in summer for the data lower than the 99th percentile (~2 mm day−1) is observed for the IMERG-Final (Figure 5i). However, the tail behavior for summer (>10 mm day−1) for the IMERG-Final indicates a large discrepancy relative to the other products (above 99.5th percentile). Finally, for the fall season (Figure 5j–l), all products indicate an overestimation of daily rainfall less than the 95th percentile and an underestimation of daily rainfall above the 95th percentile. However, the magnitude of overestimation is slightly reduced for IMERG-Late and IMERG-Final relative to IMERG-Early. While the IMERG-Final is the best product for fall daily rainfall lower than the 97.5th percentile, the underestimation deteriorates for extreme rainfall (obviously, above the 99th percentile) (Figure 5l). As a common result, while the bias-adjusted GPM IMERG products, which is the case for IMERG-Final datasets, resulted in better match with the gauge measurements for more frequent rainfall events (lower amounts of rainfall), uncorrected datasets of IMERG-Early and –Late products were shown to be more trusted related to the extreme events (heavy rainfall and flooding), especially in spring, summer, and fall seasons, as the bias-corrected data from the IMERG-Final product deteriorated underestimations observed for extreme rainfalls.
Figure 6a–d show Q-Q plots for the IMERG-Monthly product relative to rain gauge measurements for different seasons. The increasing underestimation from the 45-degree line for data above the 95th percentile for all seasons indicates that the IMERG-Monthly product might not be the best choice for the study of extreme monthly rainfall. It is noteworthy that the amount of extreme rainfall varies by season. For example, the average rainfall for the 99.5th percentile based on rain gauge measurements was about 4.3 and 13.5 mm day−1 for summer and fall, respectively. Based on the IMERG-Monthly product, however, the equivalent values for these months were 2 and 7.8 mm day−1. This implies an underestimation as big as 69 mm for summer and 171 mm for the fall months (considering a 30-day month) that can obviously bias extreme monthly rainfall study based on the IMERG-Monthly product across the country. For more frequent rainfall (below the 95th percentile), especially in spring (Figure 6b) and summer (Figure 6c), the distribution of monthly data from the IMERG-Monthly product adequately fits the measurements, with an exception of overestimation for data lower than the 75th percentile, especially for winter (Figure 6a), fall (Figure 6d), and spring (Figure 6b).
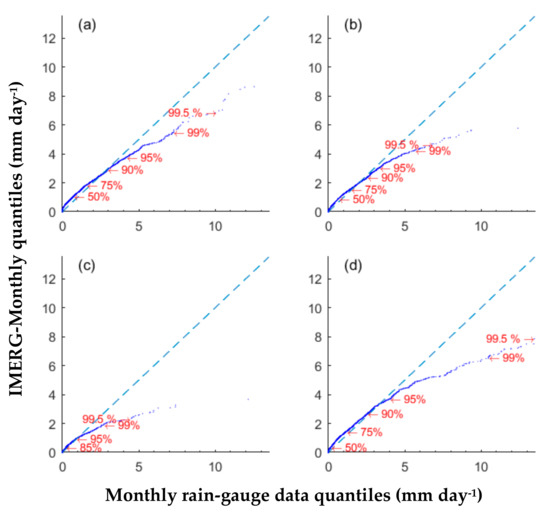
Figure 6.
Q-Q plots of average monthly rainfall (IMERG and rain gauge data) during the 2014–2017 period for (a) winter, (b) spring, (c) summer, and (d) fall seasons. The arrows and percentile values in red depict the location of quantiles.
3.4. Temporal Performance of IMERG Products
To explore the temporal characteristics of the calculated criteria for daily and monthly IMERG products, a monthly-based comparison was conducted using radar charts. It is noted that due to the similarity of the results for IMERG-Final and -Monthly, the monthly radar charts are separately displayed in the Supplementary Materials.
Figure 7a–h show a comparison of the eight criteria indices, including CC, rBIAS, MAE, FAR, POD, Under, Equal, and Over for each month considering IMERG-Early, -Late, and -Final products. The results show that, in general, there is a major temporal discrepancy in the criteria values obtained for different months. In most of the calculated criteria indices, the IMERG-Final shows noticeable improvements relative to IMERG-Early and -Late as compared to the rain gauge measurements.
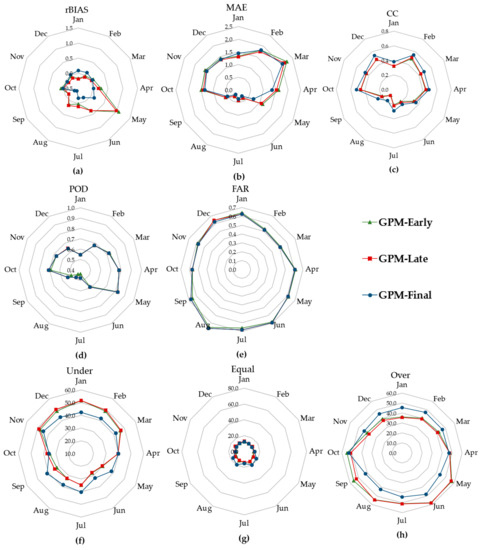
Figure 7.
Radar charts for criteria indices for IMERG daily products at the monthly time scale.
In the case of rBIAS (Figure 7a), it can be seen that the largest overestimation is in May for IMERG-Early (1.07) and IMERG-Late (0.98) while the overestimation reduced to 0.13 for the IMERG-Final product. It seems that the applied corrected algorithm considerably reduced the bias for the Final product relative to Early and Late products. All three products showed largest MAE in March and the lowest MAE in July (Figure 7b). The lowest CC is observed for the summer months, June, July, and August, for all products (Figure 7c) while the highest CC is obtained for February (0.49), December (0.48), and October (0.46), which is consistent with the rBIAS results. The weak performance of the IMERG products with regard to the detection ability of the satellite relative to gauges in the summer months is noticeable in the POD and FAR indices (Figure 7d,e). The detectability of the satellite is the highest from February to May, with POD between 0.68 and 0.82. The lowest FAR is obtained for the same months, between 0.51 and 0.62 (Figure 7d,e). The under, equal, and over values show that from IMERG-Early to -Final, the percentage of the under index increased from May to August for which the over index decreased (Figure 7f–h). On the other hand, the under index decreased from November to March while the over index increased.
3.5. Geospatial Performance of IMERG Products
Several studies have revealed the relationship between physical parameters, i.e., elevation, slope, latitude, and longitude, temperature etc., and satellite observation error [36]. Some of the errors are associated with the satellite sensor technology and applied algorithm while others are related to physical parameters on the ground. In the following section, we discuss the most prominent results obtained from the investigations of the relationships between rainfall index factors, introduced in Section 2.3.4, with multiple statistical criteria (i.e., rBIAS, CC, POD, etc.) that can introduce errors to the satellite data accuracy. The resulting boxplots for other geospatial factors can be found in the Supplementary Materials.
Relation to Location-Specific Rainfall
The charts presented in Figure 8 display the variation of location-specific criteria indices of IMERG daily products for different categories of stations based on the rainfall index factor, which, among all factors, showed a significant relationship with criteria indices. For these boxplots, limits of the bins (categories of rainfall index) are presented in the horizontal axis. For example, a hypothetical station with an average annual rainfall of 200 mm and a mean dry period of 20 days (i.e., rainfall index of 200/20 = 10) is located in the third bin. Accordingly, an equal number of stations fall inside each bin. The vertical axis shows the variation of a specific index, e.g., CC. Figure 9 represents the location map of the stations in each category using different colors. As shown in this map, rain gauges with the highest rainfall index are located in the northern regions, mostly adjacent to the Caspian Sea coastline, as well as in the western regions. However, by moving from north and west to the central, eastern and southern regions, the rainfall index generally decreases. This spatial pattern is mainly controlled by the effect of two major mountain ranges in Iran (Alborz along the northern and Zagros along the western borders).
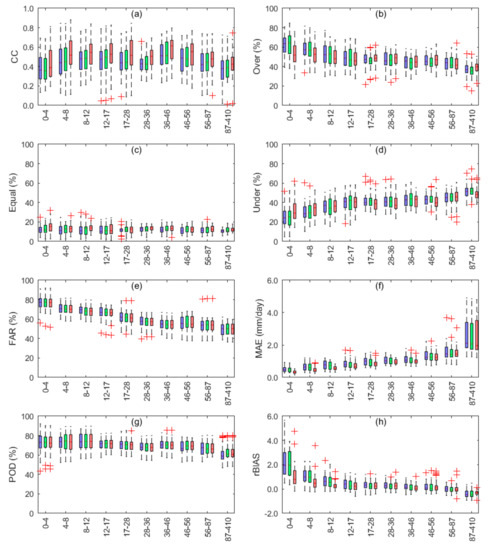
Figure 8.
Box plots of the criteria indices for 10 rainfall index bins in blue, green, and red corresponding to IMERG-Early, IMERG-Late, and IMERG-Final daily products, respectively. The horizontal line in the boxes, and the upper and lower bounds of the boxes are the 50th, 75th, and 25th percentiles, respectively. The red plus symbols denote the outlier data and the whiskers (dashed black lines) extend to the most extreme data not considered as outliers.
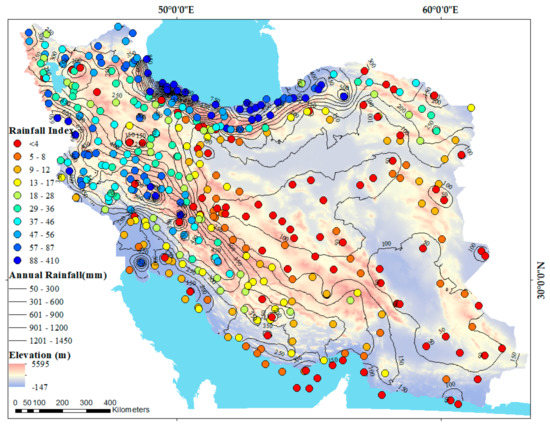
Figure 9.
Spatial distribution of rain gauges colored differently for different categories of the rainfall index on the map of digital elevation and average annual rainfall contour lines.
In Figure 8a–h, there are three boxplots for each bin in blue, green, and red corresponding to the IMERG-Early, -Late, and -Final product, respectively. According to the CC chart (Figure 8a), for instance, the IMERG-Final showed a higher correlation with rain gauge measurements in comparison to both IMERG-Early and –Late. These two displayed rather identical variation in each bin. Also, for the first and the last bins, there is a tendency to a lower correlation in comparison to other categories although the variation of CC in each bin is rather high. In general, the CC between the rain gauge data and satellite products in the daily time scale varies between 0 and 0.9 for different stations in the country.
As seen in Figure 8b–d, generally, by increasing the rainfall index (i.e., for stations in wetter locations), a lower frequency of overestimations (Figure 8b) and higher frequency of underestimations (Figure 8d) appear for all products. However, no significant change is observed for the equal index (i.e., negligible difference) at different bins (Figure 8c).
By comparing all three charts (Figure 8b–d), it appears that the frequency of overestimations (over) for stations in the first bin (i.e., the driest locations) decreases accompanied by increase in the frequency of underestimations (under) and, to some degree, the frequency of negligible differences (equal) of the IMERG-Final product compared to the other daily products. For stations in the last bin, the condition for over and under was reversed while the frequency of negligible differences (equal) increased again for the IMERG-Final product. It can be concluded that the correction process by the IMERG-final product results in different changes in the frequency of over- and underestimations for different locations in Iran while it provides an overall decrease in the error for a majority of locations. The latter statement is confirmed by looking at Figure 8f,h as the alterations in the IMERG-Final boxplots in each bin relative to the boxplots of two other products are mostly close to a reduced MAE, as well as a reduced magnitude (absolute value) of rBIAS.
MAE is the average magnitude of individual errors, so smaller MAE is favorable. However, it can result in a misleading interpretation. For example, at a dry location with zero rainfall for more than 90% of the entire length of the dataset, MAE will not reflect if there are a few major individual errors related to the extreme events. On the other hand, rBIAS calculates the accumulated individual errors (overall bias) relative to the accumulated observed rainfall during the period of comparison. Thus, it represents both overall under and overestimations (according to the negative or positive sign) and a comparable bias for different locations. As a result, the use of MAE together with rBIAS is essential. While a small magnitude of both MAE and rBIAS indicates a high performance of the satellite products, a combination of a large rBIAS with a low MAE for a location can be interpreted as a typical low individual error. This situation is more likely to appear for dryer locations with a higher frequency of smaller rainfall amounts. Also, a low rBIAS needs to be considered in the case of a large MAE value. Figure 10 illustrates these statements using Q-Q plots for a few locations selected from the different categories of the rainfall index.
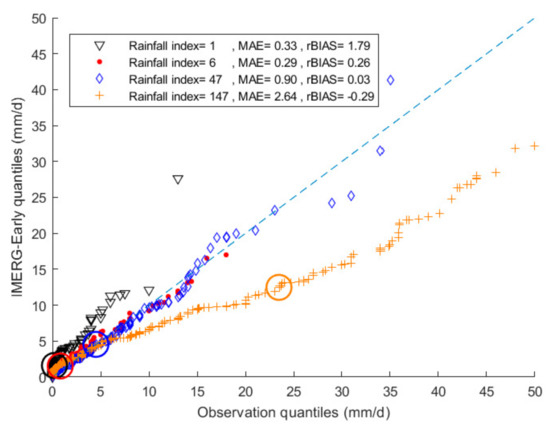
Figure 10.
Q-Q plots for comparing different combinations of rBIAS and MAE at different locations with variable rainfall indices where lower values of MAE and lower absolute values of rBIAS are favorable (the large circles’ center shows the position of the 95th percentile).
In theory, a low rBIAS means that the total amount of rainfall observed at a location is accurately estimated by the satellite during the period of comparison. In other words, the sum of the positive individual errors is almost equal to the sum of the absolute values of the negative individual errors, regardless of the magnitude of the individual errors. On the other hand, CC is an accuracy criterion showing the degree of linear correlation between two datasets, thus it is not aimed to be an error index. To be able to discuss how these indices may result in contradictory situations, Figure 11 shows Q-Q plots for five other locations, with different combinations of CC, MAE, and rBIAS. It can be discerned that at locations no. (1) and no. (2), deviations from the 45-degree line are smaller, compared to the other locations, so the satellite product showed a better performance relative to location no. (3) and an even higher performance relative to locations no. (4) and no. (5) in presenting the actual daily rainfall distribution. The correlation values for locations no. (1) and no. (2) are substantially different. On the other hand, the performance of the IMERG-Early product for the locations no. (3) and no. (5) seems to be completely different from each other while they both showed a high correlation (0.79) and a low MAE (~0.7 mm day−1). Therefore, rBIAS could play a more discriminating role than a misleading CC or MAE, in the comparison of satellite-gauge datasets for their statistical distribution.
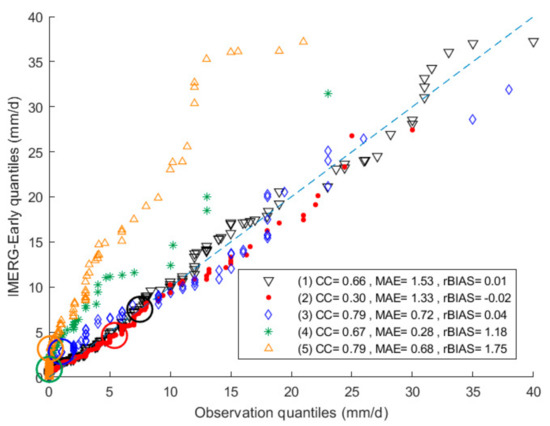
Figure 11.
Q-Q plots comparing different combinations of CC, rBIAS, and MAE at five different locations where very low values of rBIAS show better performance for different combinations of CC and rBIAS (large circles’ center shows the position of the 95th percentile).
To be able to evaluate the detection ability of the satellite products, the calculation of FAR and POD criteria is necessary (Figure 8e,g). As seen in Figure 8e, generally, FAR values were reduced with an increase of the rainfall index. The FAR values were higher for the majority of locations in the driest category (the first bin) as compared to wetter locations. For example, a median value of FAR at about 75% for the first category means that 75% of the rainy days detected by the satellite were not observed by the rain gauge. Also, the overall minimum value of FAR of around 35%, mostly, for the locations in the wetter locations indicated that, at least, 35% of the rainfall events detected by the satellite were not recorded by the rain gauges located within the corresponding satellite grids across the country. Regardless of errors due to the interruption of the rain gauge measurements or false detection by the satellite sensor, which are both possible, the increase of FAR for the dryer bins (Figure 8e) suggests that local rainfall events are more likely to appear at dryer locations. For such conditions, a rainfall event that partially affects a grid may not necessarily be observed by a rain gauge located in a dry part of the grid. Conversely, the chance for this condition is reduced for the wetter location, where uniform rainfall over a vast area is common.
According to Figure 8g, POD for different locations in Iran varied between 45% and 95% and more frequently between 60% and 80%. The higher PODs were more frequent at dryer locations and less frequent at wetter locations. POD indicates the chance for the satellite to detect a rainfall event, which is observed by a rain gauge within the satellite grid. According to this definition, the POD is not related to the spatial variability of rainfall in a grid. Instead, it indicates the sensor’s inability to detect rainfall due to the temporal variability and the satellite visiting time. The variation of FAR and POD was almost the same for different daily products of IMERG, hence the applied correction in the IMERG-Final product did not account for the detection ability of the sensors. It appears that the IMERG corrections to the final product are mostly targeting the bias in the satellite observation. There is, however, some consistency in the results of different criteria. For example, the highest frequency of underestimations (Figure 8d) and negative rBIAS values (Figure 8h) for the wettest locations (locations in the last bin) can share common reasons related to the detection problems as the lowest values of POD were observed for a majority of the locations located in the last bin (Figure 8g).
The boxplots comparing the IMERG-Monthly products’ performance for different categories of location (based on rainfall index) showed similar trends in the variation of the criteria indices for different categories of the rainfall index factor (Figure 12). The correlation for most of the locations was above 0.7 (Figure 12a). The over generally indicated a decreasing trend with the rainfall index (Figure 12b) similar to what was observed for the daily products while the frequencies of negligible differences (equal) between the IMERG-Monthly product and the rain gauge measurements showed a decreasing trend by the increase in the rainfall index (Figure 12c). The frequencies of the underestimations also showed an increase by the rainfall index (Figure 12d). The FAR decreased sharply compared to the daily FAR (Figure 12e). However, there are still considerable FAR values (i.e., above 40%) for the first three bins in Figure 12e (drier locations), which is related to local rainfall events in summer months (when there are only a few rainy days). This implies that the rainfall events are not uniformly distributed over a given satellite grid so the rain gauge located in the grid cannot, in some months, record any rainfall, but the satellite sensor does. MAE in Figure 12f shows an increase in the rainfall index, with a gentle slope compared to the increasing trend observed for the daily products (Figure 8f), which can be due to the smoother nature of the monthly data compared to the more erratic daily rainfall data. The POD for monthly data was close to 100% for almost all locations (Figure 12g), because there is a high chance that both the rain gauge and satellite recorded at least a rainy day in a given month. For the rBIAS, there is overestimation for almost all locations, with a rainfall index between 0 and 87, while the satellite underestimated monthly rainfall for a majority of the location in the 10th bin (the wettest category of locations) in Figure 12h.
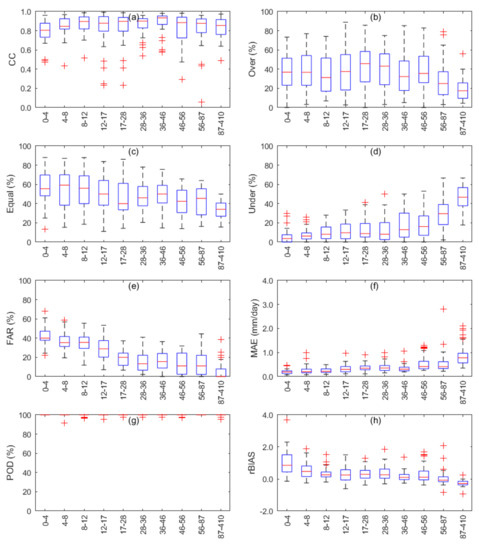
Figure 12.
Box plots of the criteria indices for the 10 rainfall index bins for the IMERG-Monthly product. The horizontal line in the boxes, and the upper and lower bounds of the boxes are the 50th, 75th, and 25th percentiles, respectively. The red plus symbols denote the outlier data and the whiskers (dashed black lines) extend to the most extreme rainfall data not considered outliers.
3.6. Spatiotemporal Distribution of Rainfall Detection Ability
According to the results discussed earlier, the error indices varied in different parts of Iran. Since the variation of the error indices, such as rBIAS and MAE, can partly be explained by the rainfall detection ability of the satellite sensors. In this section, the rainfall detection ability of the satellite precipitation products are further assessed through spatial maps of POD and FAR. Figure 13 illustrates the spatial pattern of POD and FAR for four different seasons over the country. It is noted that the three IMERG daily products exhibit a similar spatial pattern of criteria relative to the rain gauge measurements with a slightly higher accuracy and lower bias for the IMERG-Final. Hence, we only discuss the criteria indices obtained from the analyses of the IMERG-Final and rain gauge measurements in this section. These criteria indices were mapped using Kriging method in Arc GIS 10.4.1 environment.
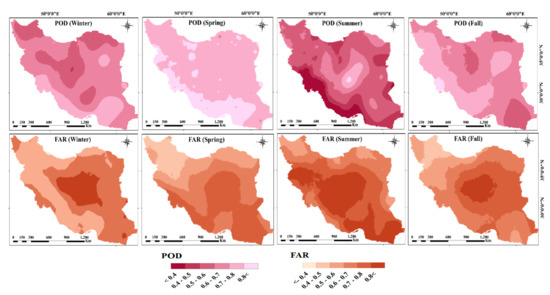
Figure 13.
Spatial distribution of POD and FAR for different seasons during the 2014–2017 period.
According to the POD spatial map over the country (Figure 13), the satellite performance regarding precipitation detection shows an acceptable performance in most parts of the country in spring, followed by fall and winter (POD > 0.5). On the contrary, in the summer season, the southwestern parts, which show the best POD in winter, spring, and fall, indicate a low performance of the satellite in precipitation detection (POD < 0.4). It should be mentioned that the southern part of the country receives the end of the monsoon during summer time, for which precipitation is characterized by high intensity short-term rainfall [38]. Since the GPM constellation satellites revisit a given spot approximately every three hours, there is a high possibility that some of these short-term events are not observed by the satellite but by the rain gauges. As discussed in [1,39], higher POD is typically observed in dryer areas, i.e., central deserts (Figure S8), and the lower POD are typical for coastal areas, which is consistent with our findings, i.e., Persian Gulf and Caspian Sea coastal regions for summer (Figure 13).
According to the FAR spatial map of the country, the northwestern followed by the western portion of the country shows lower FAR in winter, spring, and fall. Similar to the POD spatial map, higher FAR is obtained in summer for these regions. In all seasons, the central part of the country shows the highest FAR confirmed by a sparse rain gauge network (see Figure 1b) in the central deserts, i.e., Kavir and Lut deserts that cover the dry and extremely dry zones (Figure S8). As mentioned before, the FAR implies the ratio between the number of rain events that are observed by the satellite but not recorded by the rain gauges.
4. Conclusions
In this study, the performance of IMERG GPM products was evaluated at a daily (Early, Late, and Final) and monthly temporal resolution using a high-quality rain gauge network over Iran during 2014 to 2017. The study is one of the first IMERG GPM product assessments at a country level taking into account temporal and geospatial properties. In this regard, the study used eight criteria indices, including CC, MAE, rBIAS, POD, FAR, Under, Over, and Equal. Additional analyses were carried out based on these indices taking into account temporal and geospatial features.
The general performance of IMERG products relative to the rain gauge measurements indicated a major improvement in the IMERG accuracy from IMERG-Early to -Final products. However, the two indices of precipitation detection ability, POD and FAR, presented no major changes from Early to Final, which means that the correction algorithms do not account for the temporal correction of the satellite estimates. To evaluate the statistical distribution of rain gauge measurements versus satellite products, the Q-Q plots conclude that the IMERG-Final is not the best choice in extreme rainfall studies, but the IMERG-Early or Late can be used instead. Besides, the temporal performance of IMERG products, as displayed in the radar charts, showed a reduction of rBIAS from IMERG-Early to –Final.
Regarding POD, the best and worst performances were found in the spring and summer seasons, respectively. The FAR radar charts indicated an inferior performance of satellite products during the summer season.
The investigation of the relationship between various physical factors and location-specific factors of rainfall (rainfall index) with the eight mentioned criteria indices showed that CC varied for different rainfall indices. It appears that lower CC values were achieved both in the wettest and the driest locations. Further, by the increase of the rainfall index (from dryer to wetter locations), a lower and higher frequency of overestimation and underestimation, respectively, was observed for all IMERG products. Also, higher values of FAR were detected for the majority of the driest category of locations relative to wetter locations. Higher values of POD were found to be more frequent at dryer locations. As the POD investigated the spatial variability of rainfall within a particular grid, the results confirmed the superior detection ability of satellite sensors relative to gauge measurements (point measurement).
In general, the performance of satellite products increased from IMERG-Early to -Final products at the country level; however, these products need to be validated at the local scale and implemented in various hydrological models for verification. Higher values of FAR in the central part of the country, which is subjected to a sparse rain gauge network, require more caution when the IMERG data products are to be implemented in local-scale studies. This study provides an insight regarding the performance of the GPM IMERG products over all of Iran and can be used as a reference for further examination of the IMERG products in various hydrometeorological and hydrological applications.
Supplementary Materials
The following are available online at https://www.mdpi.com/2072-4292/12/1/48/s1, Figure S1, Figure S2, Figure S3, Figure S4, Figure S5, and Figure S6. Box plots of the criteria indices corresponding to the evaluation of IMERG-Early, IMERG-Late, and IMERG-Final products for the ten categories (bins) of location based on average dry period (in days), average annual rainfall (in mm year−1), elevation (in meter), slope, latitude (°N), and longitude (°E), respectively, Figure S7. Radar charts of criteria indices for IMERG-Monthly, and Figure S8. Iran’s climate zones.
Author Contributions
Conceptualization, H.H. and S.H.H.; Data curation, F.F.M. and S.H.H.; Formal analysis, F.F.M. and S.H.H.; Funding acquisition, H.H. and R.B.; Investigation, F.F.M., H.H. and S.H.H.; Methodology, F.F.M., H.H. and S.H.H.; Project administration, H.H. and R.B.; Resources, H.H. and R.B.; Software, F.F.M. and S.H.H.; Supervision, H.H.; Validation, F.F.M., H.H. and S.H.H.; Visualization, F.F.M. and S.H.H.; Writing – original draft, F.F.M., H.H. and S.H.H.; Writing – review & editing, H.H., S.H.H. and R.B. All authors have read and agreed to the published version of the manuscript.
Acknowledgments
The authors appreciate the I.R. Iran Meteorological Organization (IRIMO) for providing daily rain gauge precipitation datasets for the entire country. The GPM IMERG products were downloaded from the Goddard Space Flight Center, Precipitation Measurement Missions at National Aeronautics and Space Administration (NASA) at https://pmm.nasa.gov/data-access/downloads/gpm. All authors thank the Center of Middle Eastern Studies and the MECW strategic project at Lund University for the partial financial support. The first and the third authors appreciate partial scholarships by the Department of Scholarship and Overseas Student’s Affairs, Iran Ministry of Science, Research & Technology.
Conflicts of Interest
The authors declare no conflict of interest.
References
- Katiraie-Boroujerdy, P.S.; Nasrollahi, N.; Hsu, K.L.; Sorooshian, S. Evaluation of satellite-based precipitation estimation over Iran. J. Arid Environ. 2013, 97, 205–219. [Google Scholar] [CrossRef]
- Mahmoud, M.T.; Al-Zahrani, M.A.; Sharif, H.O. Assessment of global precipitation measurement satellite products over Saudi Arabia. J. Hydrol. 2018, 559, 1–12. [Google Scholar] [CrossRef]
- Sun, W.; Sun, Y.; Li, X.; Wang, T.; Wang, Y.; Qiu, Q.; Deng, Z. Evaluation and Correction of GPM IMERG Precipitation Products over the Capital Circle in Northeast China at Multiple Spatiotemporal Scales. Adv. Meteorol. 2018, 2018, 4714173. [Google Scholar] [CrossRef]
- Tan, M.; Duan, Z. Assessment of GPM and TRMM Precipitation Products over Singapore. Remote Sens. 2017, 9, 720. [Google Scholar] [CrossRef]
- Sharifi, E.; Steinacker, R.; Saghafian, B. Assessment of GPM-IMERG and other precipitation products against gauge data under different topographic and climatic conditions in Iran: Preliminary results. Remote Sens. 2016, 135. [Google Scholar] [CrossRef]
- Islam, T.; Rico-Ramirez, M.A.; Han, D.; Srivastava, P.K.; Ishak, A.M. Performance evaluation of the TRMM precipitation estimation using ground-based radars from the GPM validation network. J. Atmos. Sol. Terr. Phys. 2012, 77, 194–208. [Google Scholar] [CrossRef]
- Kim, K.; Park, J.; Baik, J.; Choi, M. Evaluation of topographical and seasonal feature using GPM IMERG and TRMM 3B42 over Far-East Asia. Atmos. Res. 2017, 187, 95–105. [Google Scholar] [CrossRef]
- De Coning, E. Optimizing satellite-based precipitation estimation for nowcasting of rainfall and flash flood events over the South African domain. Remote Sens. 2013, 5, 5702–5724. [Google Scholar] [CrossRef]
- Zhao, H.; Yang, B.; Yang, S.; Huang, Y.; Dong, G.; Bai, J.; Wang, Z. Systematical estimation of GPM-based global satellite mapping of precipitation products over China. Atmos. Res. 2018, 201, 206–217. [Google Scholar] [CrossRef]
- Khodadoust Siuki, S.; Saghafian, B.; Moazami, S. Comprehensive evaluation of 3-hourly TRMM and half-hourly GPM-IMERG satellite precipitation products. Int. J. Remote Sens. 2017, 38, 558–571. [Google Scholar] [CrossRef]
- Dembélé, M.; Zwart, S.J. Evaluation and comparison of satellite-based rainfall products in Burkina Faso, West Africa. Int. J. Remote Sens. 2016, 37, 3995–4014. [Google Scholar] [CrossRef]
- Mondal, A.; Lakshmi, V.; Hashemi, H. Intercomparison of trend analysis of Multisatellite Monthly Precipitation Products and Gauge Measurements for River Basins of India. J. Hydrol. 2018, 565, 779–790. [Google Scholar] [CrossRef]
- Hou, A.Y.; Kakar, R.K.; Neeck, S.; Azarbarzin, A.A.; Kummerow, C.D.; Kojima, M.; Oki, R.; Nakamura, K.; Iguchi, T. The global precipitation measurement mission. Bull. Am. Meteorol. Soc. 2014, 95, 701–722. [Google Scholar] [CrossRef]
- Wang, Z.; Zhong, R.; Lai, C.; Chen, J. Evaluation of the GPM IMERG satellite-based precipitation products and the hydrological utility. Atmos. Res. 2017, 196, 151–163. [Google Scholar] [CrossRef]
- Beria, H.; Nanda, T.; Bisht, D.S.; Chatterjee, C. Does the GPM mission improve the systematic error component in satellite rainfall estimates over TRMM? An evaluation at a pan-India scale. Hydrol. Earth Syst. Sci. 2017, 21, 6117–6134. [Google Scholar] [CrossRef]
- Yuan, F.; Zhang, L.; Wah, K.; Win, W.; Ren, L.; Zhao, C.; Zhu, Y.; Jiang, S.; Liu, Y. Assessment of GPM and TRMM Multi-Satellite Precipitation Products in Streamflow Simulations in a Data-Sparse Mountainous Watershed in Myanmar. Remote Sens. 2017, 9, 302. [Google Scholar] [CrossRef]
- Chen, C.; Chen, Q.; Duan, Z.; Zhang, J.; Mo, K.; Li, Z.; Tang, G. Multiscale comparative evaluation of the GPM IMERG v5 and TRMM 3B42 v7 precipitation products from 2015 to 2017 over a climate transition area of China. Remote Sens. 2018, 10, 944. [Google Scholar] [CrossRef]
- Wang, S.; Liu, J.; Wang, J.; Qiao, X.; Zhang, J. Evaluation of GPM IMERG V05B and TRMM 3B42V7 Precipitation Products over High Mountainous Tributaries in Lhasa with Dense Rain Gauges. Remote Sens. 2019, 11, 2080. [Google Scholar] [CrossRef]
- Wu, Y.; Zhang, Z.; Huang, Y.; Jin, Q.; Chen, X.; Chang, J. Evaluation of the GPM IMERG v5 and TRMM 3B42 v7 Precipitation Products in the Yangtze River Basin, China. Water 2019, 11, 1459. [Google Scholar] [CrossRef]
- Tang, G.; Long, D.; Hong, Y.; Gao, J.; Wan, W. Documentation of multifactorial relationships between precipitation and topography of the Tibetan Plateau using spaceborne precipitation radars. Remote Sens. Environ. 2018, 208, 82–96. [Google Scholar] [CrossRef]
- Jiang, L.; Bauer-Gottwein, P. How do GPM IMERG precipitation estimates perform as hydrological model forcing? Evaluation for 300 catchments across Mainland China. J. Hydrol. 2019, 572, 486–500. [Google Scholar] [CrossRef]
- Zhang, Z.; Tian, J.; Huang, Y.; Chen, X.; Chen, S. Hydrologic Evaluation of TRMM and GPM IMERG Satellite-Based Precipitation in a Humid Basin of China. Remote Sens. 2019, 431. [Google Scholar] [CrossRef]
- Mayor, Y.G.; Tereshchenko, I.; Fonseca-Hernández, M.; Pantoja, D.A.; Montes, J.M. Evaluation of error in IMERG precipitation estimates under different topographic conditions and temporal scales over Mexico. Remote Sens. 2017, 9, 503. [Google Scholar] [CrossRef]
- Sungmin, O.; Foelsche, U.; Kirchengast, G.; Fuchsberger, J.; Tan, J.; Petersen, W.A. Evaluation of GPM IMERG Early, Late, and Final rainfall estimates using WegenerNet gauge data in southeastern Austria. Hydrol. Earth Syst. Sci. 2017, 21, 6559–6572. [Google Scholar] [CrossRef]
- Huang, W.R.; Chang, Y.H.; Liu, P.Y. Assessment of IMERG precipitation over Taiwan at multiple timescales. Atmos. Res. 2018, 214, 239–249. [Google Scholar] [CrossRef]
- Boluwade, A.; Stadnyk, T.; Fortin, V.; Roy, G. Assimilation of precipitation Estimates from the Integrated Multisatellite Retrievals for GPM (IMERG, early Run) in the Canadian Precipitation Analysis (CaPA). J. Hydrol. Reg. Stud. 2017, 14, 10–22. [Google Scholar] [CrossRef]
- Nashwan, M.S.; Shahid, S. Assessment of Satellite-Based Precipitation Measurement Products over the Hot Desert Climate of Egypt. Remote Sens. 2019, 555. [Google Scholar] [CrossRef]
- Anjum, M.N.; Ahmad, I.; Ding, Y.; Shangguan, D.; Zaman, M.; Ijaz, M.W.; Sarwar, K.; Han, H.; Yang, M. Assessment of IMERG-V06 Precipitation Product over Di ff erent Hydro-Climatic Regimes in the Tianshan. Remote Sens. 2019, 11, 2314. [Google Scholar] [CrossRef]
- Lu, M.A. Evaluation of the integrated multi-satellite retrievals for global precipitation measurement over the Tibetan Plateau. J. Mt. Sci. 2019, 16, 1500–1514. [Google Scholar]
- Turini, N.; Thies, B.; Bendix, J. Estimating High Spatio-Temporal Resolution Rainfall from MSG1 and GPM IMERG Based on Machine Learning: Case Study of Iran. Remote Sens. 2019, 11, 2307. [Google Scholar] [CrossRef]
- Darand, M.; Amanollahi, J.; Zandkarimi, S. Evaluation of the performance of TRMM Multi-satellite Precipitation Analysis (TMPA) estimation over Iran. Atmos. Res. 2017, 190, 121–127. [Google Scholar] [CrossRef]
- Ghorbani, M.; Deposits, M.; Resources, N. The Economic Geology of Iran; Springer: Dordrecht, the Netherlands, 2013; ISBN 9789400756243. [Google Scholar]
- Balling, R.C.; Keikhosravi Kiany, M.S.; Sen Roy, S.; Khoshhal, J. Trends in Extreme Precipitation Indices in Iran: 1951–2007. Adv. Meteorol. 2016, 2016. [Google Scholar] [CrossRef]
- Alizadeh-Choobari, O.; Najafi, M.S. Extreme weather events in Iran under a changing climate. Clim. Dyn. 2018, 50, 249–260. [Google Scholar] [CrossRef]
- Huffman, G.J.; Bolvin, D.T.; Nelkin, E.J. Integrated Multi-satellitE Retrievals for GPM (IMERG) Technical Documentation. IMERG Tech. Doc. 2017, 1–60. [Google Scholar] [CrossRef]
- Hashemi, H.; Nordin, M.; Lakshmi, V.; Huffman, G.J.; Knight, R. Bias correction of long-term satellite monthly precipitation product (TRMM 3B43) over the conterminous United States. J. Hydrometeorol. 2017, 18, 2491–2509. [Google Scholar] [CrossRef]
- Hosseini, S.H. Disastrous floods after prolonged droughts have challenged Iran. FUF Bladet 2019, 2019, 30–33. [Google Scholar]
- Hashemi, H.; Berndtsson, R.; Persson, M. Floodwater harvesting for artificial recharge and spate irrigation in arid area. J. Water Manag. Res. 2013, 69, 93–100. [Google Scholar]
- Tan, M.L.; Santo, H. Comparison of GPM IMERG, TMPA 3B42 and PERSIANN-CDR satellite precipitation products over Malaysia. Atmos. Res. 2018, 202, 63–76. [Google Scholar] [CrossRef]


© 2019 by the authors. Licensee MDPI, Basel, Switzerland. This article is an open access article distributed under the terms and conditions of the Creative Commons Attribution (CC BY) license (http://creativecommons.org/licenses/by/4.0/).