Article

Exploring Spatial and Temporal Connection Patterns among the Districts in Chongqing Based on Highway Passenger Flow

State Cultivation Base of Eco-Agriculture for Southwest Mountainous Land, School of Geography Science, Southwest University, Chongqing 400715, China
*
Author to whom correspondence should be addressed.
Remote Sens. 2020, 12(1), 27; https://doi.org/10.3390/rs12010027
Submission received: 21 November 2019 / Revised: 12 December 2019 / Accepted: 17 December 2019 / Published: 19 December 2019

Abstract

:
Investigating regional connections and their influencing factors from the perspective of “flow” space is one of the foundations of promoting regional development. In this article, the data we used includes actual highway passenger flow data, National Polar-orbiting Partnership/Visible Infrared Imaging Radiometer Suite (NPP/VIIRS) nighttime light remote sensing data, and socioeconomic data. We analyzed the spatial distribution pattern, connection intensity and spatial autocorrelation of highway passenger flow in Chongqing during the working day, weekend and May Day and revealed the influencing factors by means of a geographic detector. Three key conclusions resulted from this research. First, highway passenger flow in Chongqing districts exhibits spatial agglomeration that is clearly higher in western Chongqing than in eastern Chongqing and forms an obviously dual-core “star” structure, with the main urban area and Wanzhou serving as the core. Second, a factor detector notes that the nighttime light area index (0.9251, 0.9512, 0.9541) has the strongest explanatory power for the spatial differentiation of passenger traffic in Chongqing districts, which is the key factor. Third, interaction detection shows that the interaction between the two factors displays an enhancement effect at different times. The nighttime light area index shows the strongest explanatory power under the synergy of tourist attractions, which are 0.9850, 0.9903 and 0.9908. But the per capita GDP and highway mileage have the most obvious enhancement effect after interaction (0.9544, 0.9661, 0.9652). Therefore, in future planning and development, we should pay attention to cooperation and exchanges between districts and use the nighttime light area index as an important reference factor to provide a scientific basis for the construction of public transport and economic construction in Chongqing.

Graphical Abstract

1. Introduction

Under the impetus of modern transportation and information technology, the barrier effect of geographical distance has gradually weakened, and a number of urban-related studies from the perspective of “flow” has been conducted [1,2,3]. Traffic flow is the link between cities. The intensity of traffic flow between cities reflects the closeness of the relationship between cities.
However, the actual traffic flow data between cities is often difficult to obtain. Therefore, identification of alternative parameters to represent traffic flow between cities has become the research direction of scholars at home and abroad [4,5]. In many studies, traffic flow is usually replaced by actual shift information. Early studies based on traffic flow focused more on the perspective of air passenger flow [6] followed by research studies based on rail passenger flow and air passenger flow [7,8,9]. Data on passenger air and railway flow are easy to obtain and have great advantages in large-scale network research, but there are considerable limitations on urban connection research in smaller areas. To better study urban linkages at a smaller scale, highway passenger flow has become widely used as an alternative to air and rail flow [10,11]. The related research enriches the empirical cases of different traffic flows for urban network systems of different scales to some extent and analyzes the basic characteristics of the spatial structure, network association and hierarchical structure of regional connections. However, it is difficult to accurately reflect the characteristics of spatial linkages between cities using shift information instead of actual passenger flow information. Therefore, it is particularly important to use the actual passenger flow to analyze the spatial connection characteristics between cities. The spatial pattern of urban connections reflects the distribution patterns of urban connections, macroscopic differentiation, microscopic changes, and interactions. As one of the important manifestations of the strength of regional connections, passenger flow has interactivity in time and space, which can well reflect the spatial pattern of urban connections. The spatial pattern is the spatial distribution related to the geographical location, and the spatial statistical analysis investigates the spatial dependence, spatial correlation or spatial autocorrelation between the data related to the geographical location and is an analytical method for establishing statistical relationships between data through spatial locations. As a spatial statistical method, spatial autocorrelation analysis [12] reveals the regional structure of spatial variables by analyzing the spatial autocorrelation degree of a certain feature value between a spatial unit and its surrounding units. Although spatial statistical analysis methods have been widely used in many fields, such as resource environments [13,14], the social economy [15], and industrial structures [16], research on spatial patterns of urban connections combined with spatial statistical analysis methods requires further development.
Formulation of policies and measures for coordinated urban development requires study of not only the spatial pattern of passenger traffic linkages between cities but also the factors that influence the spatial pattern of passenger traffic. Traditional research has analyzed the relationship between the spatial pattern of urban connections and factors such as population size, economy, and urban administrative level [17,18,19]. As a source of objective and high-precision data, nighttime light remote sensing data has received widespread attention from scholars [20,21,22,23]. This form of light sensing is sensitive to the faint light generated at night, and nighttime lighting is closely related to human activities. Therefore, remote sensing data of night light can be included in the study of the spatial pattern of urban passenger flow. However, traditional impact factor research is mostly based on correlation analysis, principal component analysis and regression analysis. Among these analyses, correlation analysis mostly explores the influence of single influence factors on the dependent variables in a time series [24], and the mechanism behind the spatial distribution characteristics is less studied; principal component analysis and regression analysis can comprehensively judge the influence of factors on the dependent variables, but they ignore the relationship between the impact factor and the spatial distribution of the dependent variable, cannot determine the influence of the interaction between the factors on the spatial differentiation characteristics of the dependent variable [25], and lack quantitative exploration. As a new method based on geospatial space to detect spatial differentiation and to reveal the driving force behind spatial differentiation, geographical detectors [26] can detect not only the intensity of interpretation of a certain influence factor on the spatial differentiation of the dependent variable but also the intensity of interpretation of the independent variables after the interaction of the factors on the spatial differentiation of the dependent variable. Therefore, these detectors have been widely used in many fields [27,28,29,30].
This study aims to analyze the spatial pattern of regional linkages from the perspective of highway passenger flow and explore its impact factors. This study differs from existing research by using actual road passenger flow instead of shift information. In addition, the objective data of NPP/VIIRS night light is included in the influencing factors, and geographic detectors are used to detect the explanatory power of influencing factors on the spatial differentiation of road passenger flow.
This study is structured as follows. Section 2 introduces the study area, study data and methods used in this study, which include spatial autocorrelation and geographical detectors. Section 3 presents the research results. Section 4 discusses the spatial pattern and the influencing factors of road traffic. Section 5 summarizes the study and provides possibilities for future research.

2. Materials and Methods
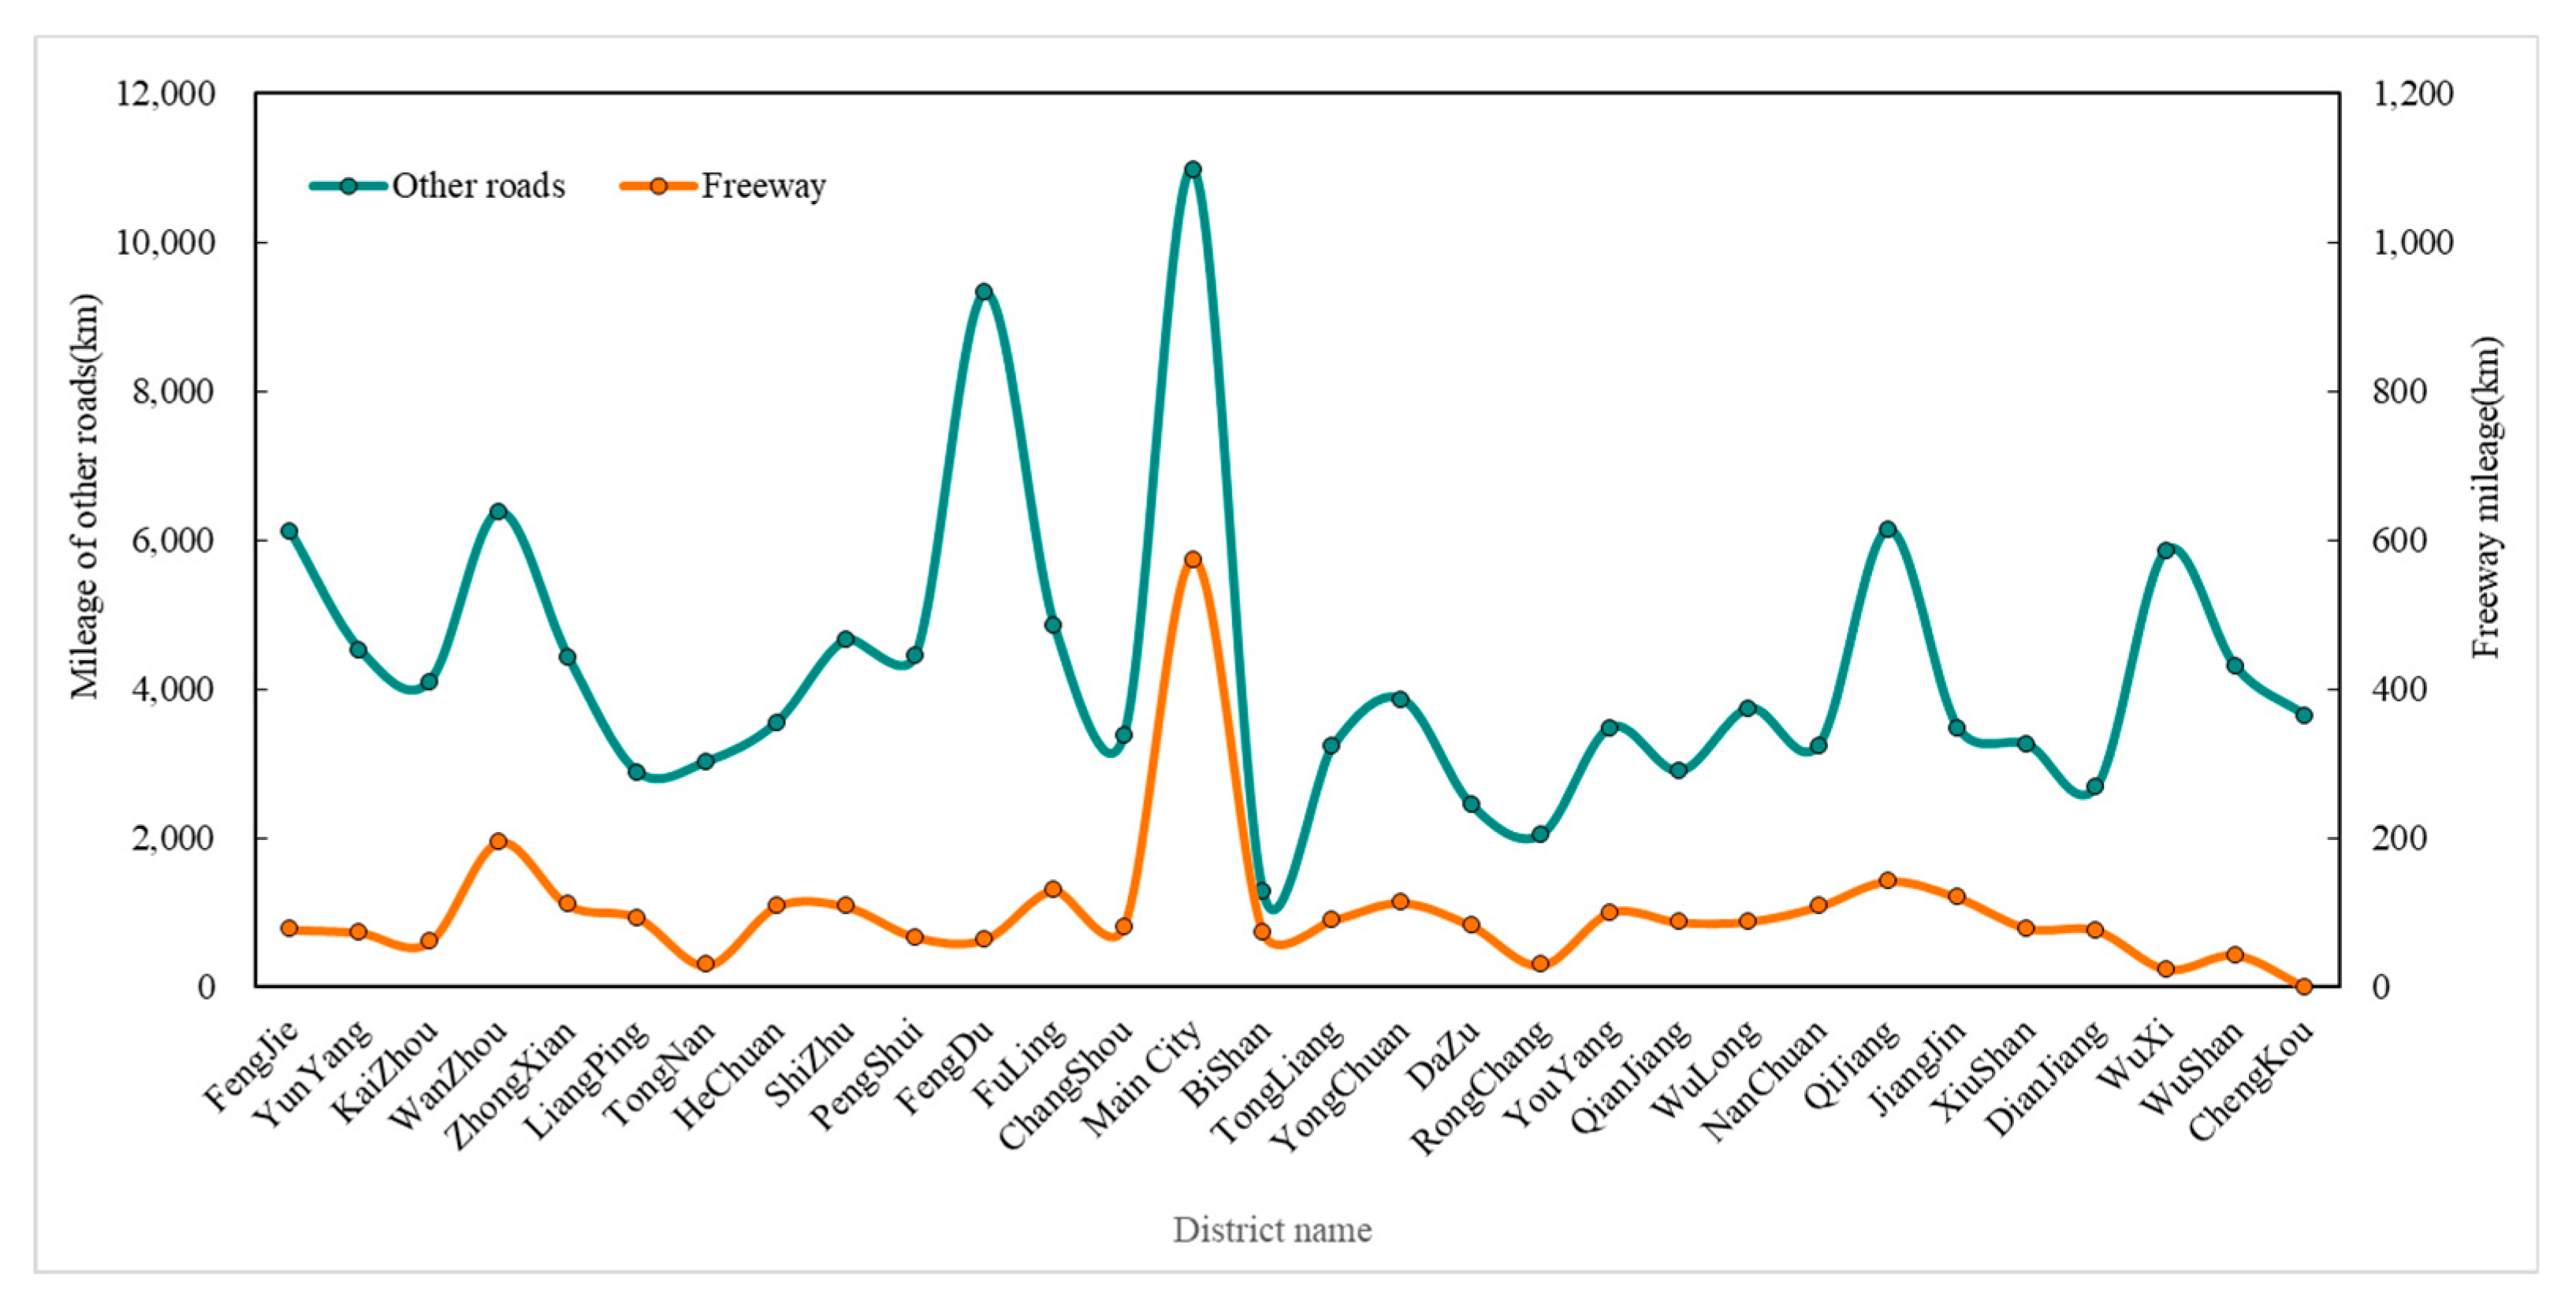
2.1. Study Area

Chongqing is located in the southwest of China and the upper reaches of the Yangtze River (Figure 1). Chongqing is adjacent to Hubei Province and Hunan Province in the east, Sichuan Province in the west, Guizhou Province in the south, and Shaanxi Province in the north and has a total area of 82,400 square kilometers. The terrain of Chongqing, which is known as the “mountain city”, is characterized by “west high and east low” with an elevation difference of approximately 2.72 km. The eastern region of Chongqing is dominated by slopes, and the central and western areas are dominated by hills and mountains. Chongqing is one of the four municipalities directly under the Central Government of China and is also the largest economic center city in the southwestern region and the upper reaches of the Yangtze River, including 26 districts, 8 counties and 4 autonomous counties. To improve the radiation and driving effects of Chongqing′s cities to the countryside, the government proposed a development strategy of “one circle and two wings” in 2006. “One circle” refers to the one-hour economic circle consisting of Chongqing main urban, Yongchuan, Jiangjin, Hechuan, Nanchuan, Fuling, Changshou, Tongnan, Tongliang, Dazu, Rongchang, Bishan and Qijiang. The “two wings” are the southeast wing of Chongqing and the northeast wing of Chongqing. The southeastern wing is composed of Qianjiang, Wulong, Xiushan, Youyang, Shizhu and Pengshui. The northeast wing is composed of Wanzhou, Kaizhou, Liangping, Chengkou, Wuxi, Wushan, Yunyang, Fengjie, Zhongxian, Dianjiang and Fengdu. With the development strategy, urban functional divisions have also been proposed. In 2013, the relevant departments of Chongqing comprehensively considered various factors, and subdivided the one-hour economic circle into the urban functional core zone, the urban functional expansion zone and the urban development new zone. The northeastern wing and the southeastern wing of Chongqing corresponded to the northeastern ecological conservation development zone and southeast ecological protection development zone. By the end of 2017, the resident population of Chongqing was approximately 31,117,000 people, and the regional GDP was approximately 203,319,000 thousand yuan. The overall economic status cannot reflect the characteristics of each district in Chongqing. Therefore, analyzing the development status of each district plays an important role in promoting the balanced development of Chongqing. Because the regional population movement plays an important role in promoting economic development, the spatial connection pattern and influencing factors of districts in Chongqing can be studied from the perspective of passenger flow, which can provide decision-making support for Chongqing′s economic development and policy implementation.

2.2. Data Sources

The data involved in this study mainly include passenger traffic data, the National Polar-orbiting Partnership/Visible Infrared Imaging Radiometer Suite (NPP/VIIRS) nighttime light remote sensing data, and socioeconomic data of districts in Chongqing, data source and type as shown in Table 1. Passenger flow data is available for March 2019 and 30 April 2019 to 5 May 2019. Nighttime light remote sensing data currently used are mainly from the Defense Meteorological Satellite Program/Operational Linescan System (DMSP/OLS), NPP/VIIRS and Luojia 1-01. Although the spatial resolution of NPP/VIIRS is not as high as that of Luojia 1-01, its data is more widely used and its development is more mature. Therefore, we finally selected the nighttime light data of NPP/VIIRS as the data source. Nighttime light data uses the Day/Night Band (DNB) band monthly data synthesized by NOAA National Centers for Environmental Information (NCEI). Since this paper mainly studies the influence of various factors on passenger flow, considering the small differences in radiation brightness among districts in short term, and the lack of data in March and the data in May are not announced, the nighttime light data of April 2019 is uniformly adopted.
Referring to the research results of many scholars [31,32,33,34], this paper selects residents population (X1), urbanization rate (X2), highway mileage (X3), tourist attractions (X4), per capita GDP (X5), nighttime light intensity index (X6) and nighttime light area index (X7) as independent variables and the highway passenger flow of districts during the working day, weekend and May Day as dependent variables for analysis. Since the 2018 Chongqing statistical yearbook records the indices of per capita GDP, the indices only reflect the growth of per capita GDP on the basis of the previous year, and does not accurately reflect the per capita GDP of the region. To obtain per capita GDP, this paper uses the GDP provided by daily rankings network (http://www.ttpaihang.com/) divided by the resident population in the statistical yearbook to obtain per capita GDP. The description and unit of the variable are shown in Table 2. Because the main urban area is mainly serviced by public transportation, such as buses and light rail, it is considered as an entire study; Dazu and Qijiang include Shuangqiao and Wansheng, respectively.

2.3. Data Processing

2.3.1. Passenger Flow Data

In China, May Day is a large festival, and people have more vacation time than weekends. Most people choose to leave their place of residence to travel or visit relatives and friends. During this period, changes in passenger flow is significant. To explore the situation of highway passenger flow for different time types, this paper divided research time into working days, weekends, and May Day. Monday to Friday is defined as working day. Saturday and Sunday were defined as weekend. Considering the arrival of May Day, some passengers will choose to travel in advance, so we defined the May Day as 30 April 2019 to 5 May 2019. Information on bus tickets in and out of districts was obtained for every day during working days, weekends and May Day. For car trips that are not rolling, the average total passenger capacity of each vehicle was set to 50 by comparing and calculating the multi-day ticket, so the difference between the average total passenger capacity and the remaining ticket is the passenger flow of the trip. For the rolling trips, the first step was to obtain the specific total passenger capacity of each trip, and then the difference between the specific total passenger capacity and the remaining ticket was used as the passenger flow of the trip. To make the data comparable, the average of the passenger traffic at different time periods was taken as the passenger flow for the time period. The following formula is used to obtain the passenger flow of each district in each time period.
P F j = D = 1 n ( I j + O j ) 2 D
where P F is the road passenger flow; j is the code of the district; I j is the traffic entering the districts j every day; O j is the traffic leaving the districts j every day; and D represents the number of days.

2.3.2. Nighttime Light Remote Sensing Data

First, Albers equal-area conic projection was performed on an NPP/VIIRS nighttime light remote sensing image, and the nighttime light remote sensing image of Chongqing was obtained with a spatial resolution of 0.7500 km. Since the NPP/VIIRS lighting data has not eliminated the effects of background values and combustion products, the radiance values have negative and maximum values. If used directly, it will have an impact on the research results, so these noises need to be processed. For selection of the minimum radiance value, we combined data with Google Earth, and selected several places where almost no night light as sample zones, such as forests, lakes, and high-altitude areas in the ecological reserve, then take the minimum value of them as the minimum value of the study area. Finally, the radiation value of pixels smaller than 2.5700 W⋅cm−2⋅sr−1 was assigned to zero [35]. In addition, for the extremely high value present in the image, that is, the abnormal maximum radiance value exceeding the most prosperous area in the study area, we selected the maximum radiance value of the surrounding 8 pixels as the radiance value of the pixel [36]. A comparison of before and after processing is shown in Figure 2.
Nighttime light remote sensing data mainly includes two important properties, namely, nighttime light intensity and nighttime light area. The larger the nighttime light area is, the brighter the radiance of the pixels are, and the more clearly the economic, population, transportation and other conditions are reflected, which are closely related to human activities. In this study, the nighttime light intensity index and the nighttime light area index were calculated using NPP/VIIRS nighttime light remote sensing data.
Nighttime light intensity index ( B ) is defined as the sum of the radiance values in the region.
B j = D N j
where B represents the nighttime light intensity index; j is the district code; and D N j is radiation value in the district j .
Nighttime light area index ( C ) is defined as the ratio of radiation area to the total area in the region.
C = C p C A × 100 %
where C p is the radiation area in the district; and C A is the total area in the district.

2.4. Spatial Autocorrelation

2.4.1. Global Spatial Autocorrelation

Global spatial autocorrelation [37] is used to describe the overall distribution of a phenomenon in space and to determine whether the distribution of the phenomenon is aggregated, random, or discrete. This study uses the global Moran’s I to represent the global spatial autocorrelation. This coefficient is defined as follows:
I = n i = 1 n j = 1 n w i , j i = 1 n j = 1 n w i , j ( x i X ¯ ) ( x j X ¯ ) i = 1 n ( x i X ¯ ) 2
where n is the number of spatial objects; w i , j is the weight between the spatial object i and the spatial object j ; X ¯ is the mean of the spatial objects throughout the study area; and x i and x j are the values of spatial object i and spatial object j . The values of I range from −1 to 1. To determine whether the value of I is statistically significant, it is usually statistically tested using P and Z values.

2.4.2. Local Spatial Autocorrelation

Compared with global spatial autocorrelation, local spatial autocorrelation [38] can further reflect the difference between spatial objects and surrounding spatial objects and indicate whether there is aggregation between spatial objects. The local Moran’s I is defined as follows:
I i = ( x i X ¯ ) S 2 j w i j ( x j X ¯ )
where
S 2 = i ( x i X ¯ ) 2 n
The meaning of each parameter is the same as those of the corresponding parameter in the global space autocorrelation.
Local autocorrelation mainly represents the aggregation of neighboring districts through the four quadrants of high–high (H–H), low–high (L–H), low–low (L–L), and high–low (H–L). H–H and L–L exhibit a positive correlation in space; L–H and H–L exhibit a spatially negative correlation.

2.5. Geographic Detector

A geographic detector [26] is a statistical method for detecting the spatial differentiation of geographical objects and reveals the driving forces behind them. It is widely used in various fields. It includes factor detectors, interaction detectors, risk detectors, and ecological detectors. In this study, a factor detector and interaction detector are used to detect the impact of individual influence factors and the interaction of two influence factors on the spatial differentiation of passenger traffic in the district.

2.5.1. Factor Detector

The factor detector is used to detect the degree to which an independent variable interprets the dependent variable in spatial differentiation. The q value is usually used to represent the degree of interpretation, which is defined as follows:
q = 1 S S W S S T
where
S S W = h = 1 L N h σ h 2
S S T = N σ 2
Therefore, the final definition of q is as follows:
q = 1 h = 1 L N h σ h 2 N σ 2
h = 1, …, L indicates that the variable is divided into L levels; N and N h are the number of districts and the number of districts corresponding to the h level; σ 2 and σ h 2 respectively represent the variance of the passenger flow of all districts and the variance of the passenger flow of the districts corresponding to an influence factor at the h level; SSW is the sum of the variances of the passenger traffic of different districts; SST is the total variance of passenger traffic in all districts; and the q value range is [0,1]. The larger the q value is, the stronger the explanatory power of the independent variable X to the passenger flow Y is.

2.5.2. Interaction Detector

The interaction detector is used to detect whether the two independent variables work together to increase or decrease the intensity of interpretation of the dependent variable. It is assumed that the interpretation strengths of the independent variables X a and X b of the affected districts’ passenger flow are q ( X a ) and q ( X b ) , respectively ( a b ). After the interaction of the two independent variables, the explanatory power of the spatial differentiation intensity of passenger flow is q ( X a   X b ) . Comparing q ( X a   X b ) with q ( X a ) and q ( X b ) yields the following five types (Table 3).

3. Results

3.1. Spatiotemporal Distribution of Highway Passenger Flow

Since space-time characteristics are among the most important features of passenger flow data [39], this part is used to analyze the temporal and spatial distribution characteristics of road traffic. Due to the passenger flow in the main city of Chongqing being significantly higher than that in other districts, to make the results more clear, the main city is excluded from the result shown in Figure 3 (the corresponding passenger flow of the main city is 36,181 people, 45,462 people and 61,293 people for the working day, weekend and May Day, respectively). From Figure 3, we can see that with the increase of vacation time, the passenger flow of districts increases accordingly. In addition to the main city of Chongqing, Yongchuan has the most passenger flow in all three time periods. This finding may be observed because Yongchuan is located in the upper reaches of the Yangtze River in the west of Chongqing and adjacent to Sichuan Province. These geographical conditions cause it to not only have a good ecological environment but also have airports, port areas and a number of railways and highways. Convenient transportation and a suitable ecological environment make it more attractive.
Since the traffic volume of districts is closely related to the geographical location, researching the traffic volume of the districts should not only reveal the changing trends occurring in different time periods but also aid understanding of the spatial distribution pattern. In this instance, the natural discontinuity method is used to divide the passenger flow into five categories. To make the classification results comparable, based on the classification result of the working day, the passenger flow of the weekend and May Day is classified according to the same criteria. The classification results are shown in Figure 4, which indicates that the passenger flow during the working day, weekend and May Day shows a trend of decrease from west to east. Under the same classification conditions, the high-value areas of passenger flow are mainly distributed in the western districts of Chongqing, and the low-value areas are mainly distributed in the northeast districts and southeast districts. From the working day to the weekend to May Day, the number of districts entering high-value areas increases. With the increasing holiday time, the passenger flow of the “one-hour economic circle” districts have increased significantly, but the passenger flow in Bishan became relatively small. Wushan as the “Northeast Gateway of Chongqing” has increased passenger volume during May Day. One of the reasons is that Wushan is located in an important position in the Three Gorges Reservoir Area and has rich natural tourism resources and famous tourist attractions. Although it is far from the main city, during holidays is also very attractive to tourists. From the maximum passenger flow, it can be seen that the passenger flow in the main urban area has increased significantly, which has a strong relationship with social and economic status in Chongqing.

3.2. Spatial Autocorrelation in Different Time Periods

To study the spatial agglomeration of highway passenger flow, the global Moran index is chosen as the basis for judgment. During the working day, weekend and May Day, the global Moran index (Table 4) is 0.1880, 0.1540, and 0.1360, respectively, and all pass the significance test. This result shows that there is a weak positive correlation in the passenger flow. It can be seen from the spatial distribution of the passenger flow (Figure 4) that the high-value area and the low-value area are not completely aggregated. The high-value area is not only distributed in the western part of Chongqing but also distributed in Wanzhou, which is located in the northeast of Chongqing. This spatial distribution causes the entire study area to exhibit a weak autocorrelation. Although the autocorrelation coefficient is low, the passenger traffic at different time periods is still agglomerated as a whole. Returning to Figure 5, which is also classified using the natural discontinuity method, we can see that the traffic connection network on the weekday, weekend and May Day is generally “sparse in the east and dense in the west”. The densely populated areas in western Chongqing have close contact with passengers flow and present a “star” structure centered on the main city of Chongqing, indicating that the main city is in a dominant position in the passenger traffic network; there is also a smaller “star” structure in Wanzhou and surrounding districts, indicating that the northeastern region of Chongqing, with Wanzhou district as the core, maintains strong agglomeration in the passenger flow network; although Qianjiang has links with the west of Chongqing and the northeast of Chongqing, the intensity of the connection is mainly concentrated in the west of Chongqing, and the obvious “star” structure is not well represented.
The global spatial autocorrelation can only reflect the correlation of passenger flow in the entire research area. To understand the correlation between the districts in the study area and the surrounding districts, local spatial autocorrelation is needed for further exploration. It can be seen from the results of local autocorrelation (Figure 6) that during the study period, Wanzhou exhibits H–L, and the state never changed. This phenomenon indicates that there is significant spatial difference between its passenger flow and that of surrounding districts and the passenger flow of Wanzhou is higher than that of surrounding districts, which is consistent with its situation as the economic center of northeastern Chongqing. Jiangjin and Hechuan are both H–H, which indicates that there is little difference in passenger flow between them and the surrounding districts, and both of them and the surrounding districts have higher passenger flow. This finding is inseparable from the fact that these locations are adjacent to the main city of Chongqing and belong to the “one-hour economic circle”. Different from the working day, Tongliang is included in the H–H during the weekend, and Qijiang is excluded from the H–H during May Day, but it is included in the L–H; Changshou is excluded from the L–H during the weekend; during the weekend and May Day, the scope of L–L is expanded and included in Xiushan and Fengdu. In addition, the remaining districts did not show obvious characteristics. It is worth mentioning that the main city with the most passenger traffic has not shown obvious characteristics. This phenomenon indicates that it is between the H–H and the H–L, that is to say, the passenger flow of the main city of Chongqing is roughly equivalent to the passenger flow of the surrounding districts.
According to the actual distribution, H–H is mainly distributed in western Chongqing. L–L is mainly distributed in the northeast of Chongqing and the southeast of Chongqing. The distribution is related to the urban functional partition. Bishan is characterized by L–H during the study period, most likely because it is close to the main city and has convenient transportation, which causes more people to choose to drive or take railway transportation. This situation leads to a decrease in passenger flow on the road, making the passenger flow in the surrounding districts higher than that in Bishan. During the period of study, Wanzhou is shown as H–L, perhaps because it is located in the hinterland of the Three Gorges Reservoir Area and is the central city and material distribution center of the Yangtze River in Chengdu and Chongqing, so the population flow is larger than that in the surrounding areas. Xiushan is characterized by L–L on weekend and May Day. Perhaps it is located at the junction of Chongqing, Guizhou and Hunan provinces. During non-working days, the connection between Xiushan and neighboring provinces weakens the connection with Chongqing districts.

3.3. Factors Affecting Passenger Flow in Districts

In this section, each variable is divided into five categories using natural discontinuity, which will be assigned values from 1 to 5. Assuming that the resident population of a certain district belongs to level 1, it indicates that the resident population of the district is lower than that of other districts. The spatial distribution of independent variables is shown in Figure 7.

3.3.1. Factor Detector

The factor detector is used to detect the explanatory power of the seven independent variables for explaining the passenger flow. The detection result is shown in Figure 8.
The result of the factor detector shows that the nighttime light area index (0.9251) is the most important influence factor for the passenger flow on working days followed by the nighttime light intensity index (0.9083), urbanization rate (0.9063), residents population (0.8773) and tourist attractions (0.8264). The explanatory power of highway mileage (0.2375) and per capita GDP (0.4704) is weak. Although the order of explanatory power on the weekend is the same as the working day, the q statistical values of some influencing factors are different. Compared with the passenger flow on the working day, the highway mileage (0.2369) has weakened the explanatory power of the weekend′s passenger flow, while the resident population (0.9036), urbanization rate (0.9283), tourist attractions (0.8619), per capita GDP (0.4771), nighttime light intensity index (0.9291) and nighttime light area index (0.9512) have increased explanatory power. Differing from the two time periods above, the explanatory power of these influence factors not only changed numerically but also changed in the order of explanatory power during May Day. The explanatory power of urbanization rate rose from the third to the second. In particular, the explanatory power of highway mileage is smaller than that of the other two periods, the explanatory power of per capita GDP is greater than that of the working day but smaller than that of the weekend. The explanatory power of the remaining influencing factors is greater than that of the other two periods. In short, it can be seen from the results of the factor detector that the nighttime light area index is the dominant factor of passenger flow, and the highway mileage is the weakest for explaining the road traffic during the working day, weekend and May Day.

3.3.2. Interaction Detector

The spatial distribution and variation of passenger flow are usually not determined by a single factor but by multiple factors interacting together. The interaction detector is used to detect the intensity of the interpretation of the passenger flow after the interaction of the two variables. The results are shown in Table 5, Table 6 and Table 7.
The interaction detector demonstrates that the interaction between the various impact factors of passenger flow is mainly manifested by double factor enhancement and nonlinear enhancement, and there is no independence or attenuation. Highway mileage and per capita GDP show nonlinear enhancement, and the rest show double factor enhancement. Among these interaction results, the interaction of tourist attractions and the nighttime light area index has the strongest explanatory power for passenger flow, followed by the nighttime light area index and highway mileage and the nighttime light area index and per capita GDP on the working day and weekend. During May Day, the explanatory power of the interaction between nighttime light area index and tourist attractions remained at the first place, but second place became the explanatory power after the interaction of tourist attractions and per capita GDP. It is not difficult to understand that in districts with many tourist attractions and high GDP per capita, the passenger flow on holidays will increase. This shows that the spatial differentiation of highway passenger flow is more dominantly explained by the interaction between nighttime light area index, highway mileage, tourist attractions and per capita GDP.

4. Discussion

4.1. Spatiotemporal Patterns of Highway Passenger Flow

Through the analysis of the temporal and spatial distribution and spatial connection network, this study found that the overall performance of Chongqing highway passenger flow is “west high and east low”. However, from the point of contact between districts with high passenger traffic, we found that the spatial pattern is slightly different from the traditional “one-hour economic circle and two wings” (Figure 9). The road passenger flow network (Figure 5) shows that the western region of Chongqing takes the main city of Chongqing as the core, and northeastern Chongqing takes Wanzhou as the core to form a dual-core “star” structure, but the spatial agglomeration in the southeastern region of Chongqing is gradually weakening. This result is similar to the result of Gao′s contact network in Chongqing by using highway passenger flow and cargo flow [40,41]. To further explore the spatial agglomeration of passenger flow in southeastern Chongqing, it was found by analyzing the passenger flow network of districts (Figure 5) in combination with influencing factors that, as with the two wings of Chongqing, during the study period, the passenger flow within northeastern Chongqing was stronger than that of southeastern Chongqing. The reason behind this may be that, compared with the ecological conservation development zone in northeastern Chongqing, southeastern Chongqing is an ecological protection development zone with tourism as the main factor, and the urbanization rate is low, which may reduce regional agglomeration. Therefore, the contact of passenger flow in the region is weaker than that in the northeastern region. In addition, the southeast of Chongqing is the only area with an ethnic minority, being inhabited by the Miao and Tujia ethnic groups in Chongqing, and the resident population is relatively small. People of ethnic minorities are relatively closed and have less communication with people in other regions. This will also have a certain impact on the weakening of passenger traffic in the southeast of Chongqing. It is worth mentioning that the airports, railways and highways owned by the southeast of Chongqing have become a powerful booster for tourism development in the region. However, within the region, the road mileage between the districts is relatively small, the road grade is relatively low, and their comfort and safety are not satisfactory. These properties may help to explain the weak contact within the southeast of Chongqing.

4.2. Factors Affecting Road Traffic

The change in spatial pattern is the concrete manifestation of the driving factors behind it. When detecting the influence of each impact factor on the spatial differentiation characteristics of highway passenger traffic, it is found that the nighttime light area index (0.9251, 0.9512, 0.9541) has the strongest explanatory power for the spatial differentiation of highway passenger flow among the factor detection results, which may be because the nighttime light data can be easily obtained as an objective data source, is well-recognized for weak light sources generated by human activities and can indirectly reflect the range of human activities and the degree of urbanization. However, the per capita GDP (0.4704, 0.4771, 0.4751) and highway mileage (0.2375, 0.2369, 0.2347) have weak explanatory power for the spatial differentiation of passenger traffic. The per capita GDP has weak explanatory power on passenger flow, which may be due to its strong subjectivity as a macroeconomic factor and its weak sensitivity to the change of passenger flow in a short time. Thus, it is difficult to accurately describe the distribution of passenger traffic. In addition, the per capita GDP can reflect the quality of life in the region. With the improvement of the quality of life of residents, other alternative modes of transportation, such as private cars, aviation, railways and so on, have emerged to reduce their impact on road passenger flow. Because the mileages of freeway and other road types are both included in highway mileage, the two types of roads are divided to explore the reason why the highway mileage has the weakest explanatory power on passenger flow. Road mileages of different types in Chongqing (Figure 10) show that the mileage of other roads in districts is significantly more than the mileage of freeway. The factor detector is used to explore the explanatory power of freeway and other roads to passenger flow. The result of factor detector shows that the explanatory power of other roads is 0.3840, 0.4048 and 0.3997, respectively. But the explanatory power of freeway is 0.8234, 0.8616 and 0.8730, respectively. This indicates that freeway mileage may better explain the spatial differentiation of passenger traffic compared to other roads mileage [34]. Chongqing has complex terrain and large differences in altitude, which makes population, economy, and policy mostly concentrated in relatively flat areas [42]. And the construction of the freeway is inseparable from these conditions. These conditions, in turn, will increase the flow of passengers in districts.
To deeply explore the influence of the impact factor on the spatial differentiation of highway passenger flow after interaction, the nonlinear enhancement type of overflow value is used to judge the strength of the factor′s explanatory power for the passenger flow after the interaction. The expression for the overflow value denoted as E is:
E = q ( X a   X b ) ( q ( X a ) + q ( X b ) )
The overflow values are sorted in descending order, and the first three values are displayed (Table 8, Table 9 and Table 10). It can be seen that, during the study period, X 3   X 5 , that is, the overflow value after the interaction between highway mileage and per capita GDP is the largest and positive value, followed by X 6   X 7 , that is, nighttime light intensity index and nighttime light area index. The difference is that, on the working day, the overflow value of X 2   X 6 , that is, the urbanization rate and the nighttime light intensity index, is in third, and on the weekend and May Day, X 2   X 7 , that is, the urbanization rate and the nighttime light area index, is in third. It is worth noting that, in the result of the factor detector (Figure 8), the q value of highway mileage, which is represented by q( X 3 ), is 0.2375, 0.2369, and 0.2347, respectively, and the q value of per capita GDP which is represented by q( X 5 ), is 0.4704, 0.4771, and 0.4751, respectively. However, after the interaction, q( X 3 X 5 ) is 0.9544, 0.9661, and 0.9652, respectively. That is to say, the explanatory power of the spatial differentiation characteristics of highway passenger flow is greatly enhanced. The reason behind this may be that the per capita GDP reflects the economic growth situation of the region, and the highway mileage reflects road construction and the level of urban development in the region. The interpretation of passenger flow by a single factor is one-sided, and the synergistic effect of the two can explain the spatial distribution characteristics of passenger traffic in Chongqing more comprehensively, which is another advantage of the geographic detector.

5. Conclusions

Based on highway passenger flow data, NPP/VIIRS nighttime light remote sensing data and economic data, this paper combines the spatial autocorrelation method to analyze the spatial connection and distribution pattern of highway passenger traffic in districts of Chongqing during the working day, weekend and May Day. At the same time, the factor detectors and interaction detectors in the geographic detector are used to detect the explanatory power of the spatial differentiation characteristics of highway passenger traffic under the single factor and multiple factors. The empirical conclusions are as follows.
According to the spatial distribution pattern and spatial autocorrelation, the passenger traffic volume in Chongqing is generally “west high and east low” and has spatial agglomeration. It forms an obviously dual-core “star” structure with the main city of Chongqing and Wanzhou as the core.
The factor detection results show that, although the q statistical values of the influence factors are different at different times, the nighttime light area index is always the strongest variable explaining the spatial differentiation characteristics of highway passenger traffic in Chongqing, while the explanatory power of the highway mileage was the weakest.
The interaction results indicate that the influence factors selected in this study show an enhancement effect under the interaction. Under the synergy of tourist attractions, the nighttime light area index has the greatest explanatory power for the spatial differentiation of highway passenger flow, and the explanatory power of the interaction between highway mileage and per capita GDP is considerably higher than that of a single factor.
When analyzing the traffic volume of all districts in Chongqing, this study takes the specific number of passengers on the road as the research object and introduces the remote sensing data of the NPP/VIIRS nighttime light, which enriches the ability to research passenger flow. However, there are many kinds of connections between districts. For the study of passenger flow, it is inevitable that road traffic alone is insufficient to provide a full picture. Therefore, railway and air passenger flows will be taken into account in future studies, and the spatial pattern of passenger traffic in Chongqing and its influencing factors will be comprehensively analyzed. Moreover, the data in this study is limited to a short time, and we will continue to collect long-term sequence data for further research in the future.

Author Contributions

J.S. proposed the methods. Y.H. implemented the experiments and drafted the manuscript. K.S., H.Z., T.Z. and J.S. reviewed and edited the manuscript. J.S. provided overall guidance to the project and obtained funding to support this research. All authors have read and agreed to the published version of the manuscript.

Funding

This research was supported by the Fundamental Research Funds for the Central Universities (No. XDJK2019B008, No. XDJK2018B011), and Chongqing Youth Innovative Talent Training Program (No. CY190223). We would like to thank Hong Qian, Chunling Fu, Beixi Weng, and Xiaoling Chen from Chongqing Songshuqiao middle school for collecting the data. We would like to thank the editors and anonymous referees for their constructive comments.

Conflicts of Interest

The authors declare no conflict of interest. The funders had no role in the design of the study; in the collection, analyses, or interpretation of data; in the writing of the manuscript, or in the decision to publish the results.

References

  1. Xu, J.; Li, A.Y.; Li, D.; Liu, Y.; Du, Y.Y.; Pei, T.; Ma, T.; Zhou, C.H. Difference of urban development in China from the perspective of passenger transport around Spring Festival. Appl. Geogr. 2017, 87, 85–96. [Google Scholar] [CrossRef]
  2. Wang, Q.X.; Zhao, M. Research on the city network of Guangdong, Hongkong and Macao from the perspective of information flow: Analysis based on baidu index. J. Reg. City Plan. 2018, 29, 281–293. [Google Scholar] [CrossRef] [Green Version]
  3. Wang, L.; Yang, W.Y.; Yuan, Y.Y.; Liu, C.L. Interurban consumption flows of urban agglomeration in the middle reaches of the Yangtze River: A network approach. Sustainability 2019, 11, 268. [Google Scholar] [CrossRef] [Green Version]
  4. Li, J.W.; Ye, Q.Q.; Deng, X.K.; Liu, Y.L.; Liu, Y.F. Spatial-Temporal analysis on Spring Festival travel rush in China based on multisource big data. Sustainability 2016, 8, 1184. [Google Scholar] [CrossRef] [Green Version]
  5. Derudder, B.; Witlox, F. Mapping world city networks through airline flows: Context, relevance, and problems. J. Transp. Geogr. 2008, 16, 305–312. [Google Scholar] [CrossRef]
  6. Cattan, N. Attractivity and internationalization of major European cities: The example of air traffic. Urban Stud. 1995, 32, 303–312. [Google Scholar] [CrossRef]
  7. Zhang, W.Y.; Derudder, B.; Wang, J.H.; Witlox, F. Approximating actual flows in physical infrastructure networks: The case of the Yangtze River Delta high-speed railway network. Bull. Geogr. Socio Econ. Ser. 2016, 31, 145–160. [Google Scholar] [CrossRef] [Green Version]
  8. Yang, H.R.; Dobruszkes, F.; Wang, J.E.; Dijst, M.; Witte, P. Comparing China’s urban systems in high-speed railway and airline networks. J. Transp. Geogr. 2018, 68, 233–244. [Google Scholar] [CrossRef]
  9. Yang, H.R.; Dijst, M.; Witte, P.; van Ginkel, H.; Wang, J.E. Comparing passenger flow and time schedule data to analyse high-speed railways and urban networks in China. Urban Stud. 2019, 56, 1267–1287. [Google Scholar] [CrossRef] [Green Version]
  10. Ke, W.Q.; Chen, W.; Yu, Z.Y. Uncovering spatial structures of regional city networks from expressway traffic flow data: A case study from Jiangsu Province, China. Sustainability 2017, 9, 1541. [Google Scholar] [CrossRef] [Green Version]
  11. Chen, W.; Liu, W.D.; Ke, W.Q.; Wang, N.Y. Understanding spatial structures and organizational patterns of city networks in China: A highway passenger flow perspective. J. Geogr. Sci. 2018, 28, 477–494. [Google Scholar] [CrossRef] [Green Version]
  12. Tobler, W.R. Computer movie simulating urban growth in Detroit region. Econ. Geogr. 1970, 46, 234–240. [Google Scholar] [CrossRef]
  13. Portier, J.; Gauthier, S.; Robitaille, A.; Bergeron, Y. Accounting for spatial autocorrelation improves the estimation of climate, physical environment and vegetation’s effects on boreal forest’s burn rates. Landsc. Ecol. 2018, 33, 19–34. [Google Scholar] [CrossRef] [Green Version]
  14. Ma, L.; Long, H.L.; Chen, K.Q.; Tu, S.S.; Zhang, Y.N.; Liao, L.W. Green growth efficiency of Chinese cities and its spatio-temporal pattern. Resour. Conserv. Recycl. 2019, 146, 441–451. [Google Scholar] [CrossRef]
  15. Romao, J.; Nijkamp, P. Impacts of innovation, productivity and specialization on tourism competitiveness-A spatial econometric analysis on European regions. Curr. Issues Tour. 2019, 22, 1150–1169. [Google Scholar] [CrossRef]
  16. Zhou, Y.; Kong, Y.; Sha, J.; Wang, H.K. The role of industrial structure upgrades in eco-efficiency evolution: Spatial correlation and spillover effects. Sci. Total Environ. 2019, 687, 1327–1336. [Google Scholar] [CrossRef]
  17. Dong, M.H.; Zou, B.; Pu, Q.; Wan, N.; Yang, L.B.; Luo, Y.Q. Spatial pattern evolution and casual analysis of county level economy in Changsha-Zhuzhou-Xiangtan urban agglomeration, China. Chin. Geogr. Sci. 2014, 24, 620–630. [Google Scholar] [CrossRef]
  18. Yu, Y.; Han, Q.W.; Tang, W.W.; Yuan, Y.B.; Tong, Y. Exploration of the industrial spatial linkages in urban agglomerations: A case of urban agglomeration in the middle reaches of the Yangtze River, China. Sustainability 2018, 10, 1469. [Google Scholar] [CrossRef] [Green Version]
  19. Fan, Y.; Guo, R.Z.; He, Z.Y.; Li, M.M.; He, B.; Yang, H.; Wen, N. Spatio-Temporal pattern of the urban system network in the Huaihe River Basin based on entropy theory. Entropy 2019, 21, 20. [Google Scholar] [CrossRef] [Green Version]
  20. Welch, R. Monitoring urban population and energy utilization patterns from satellite data. Remote Sens. Environ. 1980, 9, 1–9. [Google Scholar] [CrossRef]
  21. Ma, T.; Yin, Z.; Li, B.L.; Zhou, C.H.; Haynie, S. Quantitative estimation of the velocity of urbanization in China using nighttime luminosity data. Remote Sens. 2016, 8, 94. [Google Scholar] [CrossRef] [Green Version]
  22. Ma, T.; Xu, T.; Huang, L.; Zhou, A. A human settlement composite index (HSCI) derived from nighttime luminosity associated with imperviousness and vegetation indexes. Remote Sens. 2018, 10, 455. [Google Scholar] [CrossRef] [Green Version]
  23. Fu, H.Y.; Shao, Z.F.; Fu, P.; Cheng, Q.M. The dynamic analysis between urban nighttime economy and urbanization using the DMSP/OLS nighttime light data in China from 1992 to 2012. Remote Sens. 2017, 9, 416. [Google Scholar] [CrossRef] [Green Version]
  24. Peng, J.; Peng, F.L.; Yabuki, N.; Fukuda, T. Factors in the development of urban underground space surrounding metro stations: A case study of Osaka, Japan. Tunn. Undergr. Space Technol. 2019, 91, 103009. [Google Scholar] [CrossRef]
  25. He, J.H.; Li, C.; Yu, Y.; Liu, Y.L.; Huang, J.L. Measuring urban spatial interaction in Wuhan urban agglomeration, central China: A spatially explicit approach. Sustain. Cities Soc. 2017, 32, 569–583. [Google Scholar] [CrossRef]
  26. Wang, J.F.; Xu, C.D. Geodetector: Principle and prospective. Acta Geogr. Sin. 2017, 72, 116–134. (In Chinese) [Google Scholar] [CrossRef]
  27. Wang, J.F.; Li, X.H.; Christakos, G.; Liao, Y.L.; Zhang, T.; Gu, X.; Zheng, X.Y. Geographical detectors-based health risk assessment and its application in the neural tube defects study of the Heshun region, China. Int. J. Geogr. Inf. Sci. 2010, 24, 107–127. [Google Scholar] [CrossRef]
  28. Ye, H.; Sun, C.G.; Wang, K.; Zhang, G.Q.; Lin, T.; Yan, H. The role of urban function on road soil respiration responses. Ecol. Indic. 2018, 85, 271–275. [Google Scholar] [CrossRef]
  29. Cao, W.; Yuan, X. Region-county characteristic of spatial-temporal evolution and influencing factor on land use-related CO2 emissions in Chongqing of China, 1997–2015. J. Clean. Prod. 2019, 231, 619–632. [Google Scholar] [CrossRef]
  30. Qu, Y.B.; Jiang, G.H.; Tian, Y.Y.; Shang, R.; Wei, S.W.; Li, Y.L. Urban-Rural construction land Transition (URCLT) in Shandong Province of China: Features measurement and mechanism exploration. Habitat Int. 2019, 86, 101–115. [Google Scholar] [CrossRef]
  31. Limtanakool, N.; Schwanen, T.; Dijst, M. Ranking functional urban regions: A comparison of interaction and node attribute data. Cities 2007, 24, 26–42. [Google Scholar] [CrossRef]
  32. Dobruszkes, F.; Lennert, M.; Van Hamme, G. An analysis of the determinants of air traffic volume for European metropolitan areas. J. Transp. Geogr. 2011, 19, 755–762. [Google Scholar] [CrossRef]
  33. Guo, Y.D.; Gao, J.H.; Ma, H.B. Spatial correlation analysis of Suomi-NPP nighttime light data and GDP data. J. Tsinghua Univ. Sci. Technol. 2016, 56, 1122–1130. (In Chinese) [Google Scholar] [CrossRef]
  34. Gao, X. Study on the Connective Network of Districts and Counties in Chongqing Basing on Traffic Flows. Ph.D. Thesis, Northeast Normal University, Changchun, China, 2014. (In Chinese). [Google Scholar]
  35. Ma, T.; Zhou, C.H.; Pei, T.; Haynie, S.; Fan, J.F. Responses of Suomi- NPP VIIRS- derived nighttime lights to socioeconomic activity in China’s cities. Remote Sens. Lett. 2014, 5, 165–174. [Google Scholar] [CrossRef]
  36. Shi, K.F.; Yu, B.L.; Huang, Y.X.; Hu, Y.J.; Yin, B.; Chen, Z.Q.; Chen, L.J.; Wu, J.P. Evaluating the ability of NPP-VIIRS nighttime light data to estimate the gross domestic product and the electric power consumption of China at multiple scales: A comparison with DMSP-OLS data. Remote Sens. 2014, 6, 1705–1724. [Google Scholar] [CrossRef] [Green Version]
  37. Moran, P.A.P. Notes on continuous stochastic phenomena. Biometrika 1950, 37, 17–23. [Google Scholar] [CrossRef]
  38. Anselin, L. Local indicators of spatial association-LISA. Geogr. Anal. 1995, 27, 93–115. [Google Scholar] [CrossRef]
  39. Tang, J.J.; Liu, F.; Zou, Y.J.; Zhang, W.B.; Wang, Y.H. An improved fuzzy neural network for traffic speed prediction considering periodic characteristic. IEEE Trans. Intell. Transp. Syst. 2017, 18, 2340–2350. [Google Scholar] [CrossRef]
  40. Gao, X.; Dong, Q.; Liu, C.X.; Wang, Y. Study on districts passenger-cargo association network of Chongqing basing on gravity model. Resour. Dev. Mark. 2015, 31, 1314–1317. (In Chinese) [Google Scholar] [CrossRef]
  41. Gao, X.; Xiu, C.L.; Wei, Y.; Liang, Z.M. Study on the network of districts and counties in Chongqing based on the date of the highway cargo flows. Hum. Geogr. 2016, 31, 73–80. (In Chinese) [Google Scholar] [CrossRef]
  42. Guo, Y.Y.; Li, L. Influencing factors of regional economic inequality in inland provinces of western China: A case study of Chongqing. Geogr. Res. 2017, 36, 926–944. (In Chinese) [Google Scholar] [CrossRef]
Figure 1. Study area: Chongqing.
Remotesensing 12 00027 g001
Figure 2. Nighttime light distribution of Chongqing.
Remotesensing 12 00027 g002
Figure 3. Time distribution of passenger flow at different times.
Remotesensing 12 00027 g003
Figure 4. Spatial distribution of passenger flow at different times.
Remotesensing 12 00027 g004
Figure 5. Connection network of highway passengers in Chongqing districts.
Remotesensing 12 00027 g005
Figure 6. Local autocorrelation of passenger flow in Chongqing.
Remotesensing 12 00027 g006
Figure 7. Spatial distribution of impact factors in Chongqing.
Remotesensing 12 00027 g007aRemotesensing 12 00027 g007b
Figure 8. Results of the factor detector.
Remotesensing 12 00027 g008
Figure 9. One-hour economic circle and ‘two wings’ of Chongqing.
Remotesensing 12 00027 g009
Figure 10. Road mileages of different types in Chongqing.
Remotesensing 12 00027 g010
Table 1. Data source and type.
DataSourceType
Socioeconomic dataStatistical yearbook of Chongqing 2018Text
Administrative division dataGeospatial data cloud (http://www.gscloud.cn/)Shp
NPP/VIIRS nighttime light dataNational Oceanic Atmospheric Administration (https://www.noaa.gov/)Raster
Passenger flow dataChongqing Passenger Travel (https://www.96096kp.com/)Text
Data of tourist attractionsChina Tourism Network (http://www.cntour.cn/)Text
Table 2. Variable details.
VariableDescriptionUnit
Residents populationthe population living in Chongqing in 2017person
Urbanization ratethe ratio of urban population to resident population in 2017%
Highway mileagemileage of other roads and freeway in 2017 is includedkilometer(km)
Tourist attractionsnumber of attractions in the China Travel Network in 2019pcs
Per capita GDPGDP divided by resident population in 2017ten thousand yuan per person
Nighttime light intensity indexthe total radiance value of each district in April 2019W⋅cm2⋅sr1
Nighttime light area indexthe ratio of the radiation area to the total area of districts in April 2019%
Table 3. Interaction type between two covariates.
Judgment BasisInteraction
q ( X a   X b ) < M i n ( q ( X a ) , q ( X b ) ) Nonlinear attenuation
M i n ( q ( X a ) , q ( X b ) ) < q ( X a   X b ) < M a x ( q ( X a ) , q ( X b ) ) Single factor nonlinearity attenuation
q ( X a   X b ) < M a x ( q ( X a ) , q ( X b ) ) Double factor enhancement
q ( X a   X b ) = q ( X i ) + q ( X b ) Independence
q ( X a   X b ) >   q ( X a ) + q ( X b ) Nonlinear enhancement
Table 4. Moran′s Index.
TimesGlobal Moran′s IndexLocal Moran′s Index
Working day0.18800.1240
Weekend0.15400.1210
May Day0.13600.1010
Table 5. Interaction results of the working day.
X1X2X3X4X5X6X7
X1
X20.9320
X30.94720.9233
X40.95700.95280.8951
X50.94910.95450.95440.9647
X60.93020.93340.92610.96510.9652
X70.95400.95640.97830.98500.97130.9455
Table 6. Interaction results of the weekend.
X1X2X3X4X5X6X7
X1
X20.9462
X30.95610.9401
X40.97010.96550.9129
X50.96480.96620.96610.9777
X60.94820.94790.94210.97400.9714
X70.96510.96570.98210.99030.97800.9612
Table 7. Interaction results of May Day.
X1X2X3X4X5X6X7
X1
X20.9472
X30.96220.9448
X40.97120.96910.9139
X50.97020.96620.96520.9808
X60.94960.94780.94190.97630.9730
X70.96370.96360.98050.99080.97800.9609
Table 8. Top three overflow values of the working day.
Interaction Factors q ( X a   X b ) q ( X a ) + q ( X b ) E
X 3   X 5 0.95440.70790.2465
X 6   X 7 0.94551.8334−0.8879
X 2   X 6 0.93341.8146−0.8812
Table 9. Top three overflow values of the weekend.
Interaction Factors q ( X a   X b ) q ( X a ) + q ( X b ) E
X 3   X 5 0.96610.71400.2521
X 6   X 7 0.96121.8803−0.9191
X 2   X 7 0.96571.8795−0.9138
Table 10. Top three overflow values of May Day.
Interaction Factors q ( X a   X b ) q ( X a ) + q ( X b ) E
X 3   X 5 0.96520.70980.2554
X 6   X 7 0.96091.8844−0.9235
X 2   X 7 0.96361.8867−0.9231

