Inter-Seasonal Time Series Imagery Enhances Classification Accuracy of Grazing Resource and Land Degradation Maps in a Savanna Ecosystem


Abstract
1. Introduction
2. Materials and Methods
2.1. Research Questions and Aims
- How does varying the number of images and the seasons of image acquisition affect the accuracy of classifications of plant species using satellite-derived multi-spectral imagery and SCA?
- How do SVM and RF differ in their accuracy of classification in response to varying the number of images and the seasons of acquisition?
- How does coverage of focal species and control classes vary in relation to the seasonal grazing areas of a semi-arid savanna?
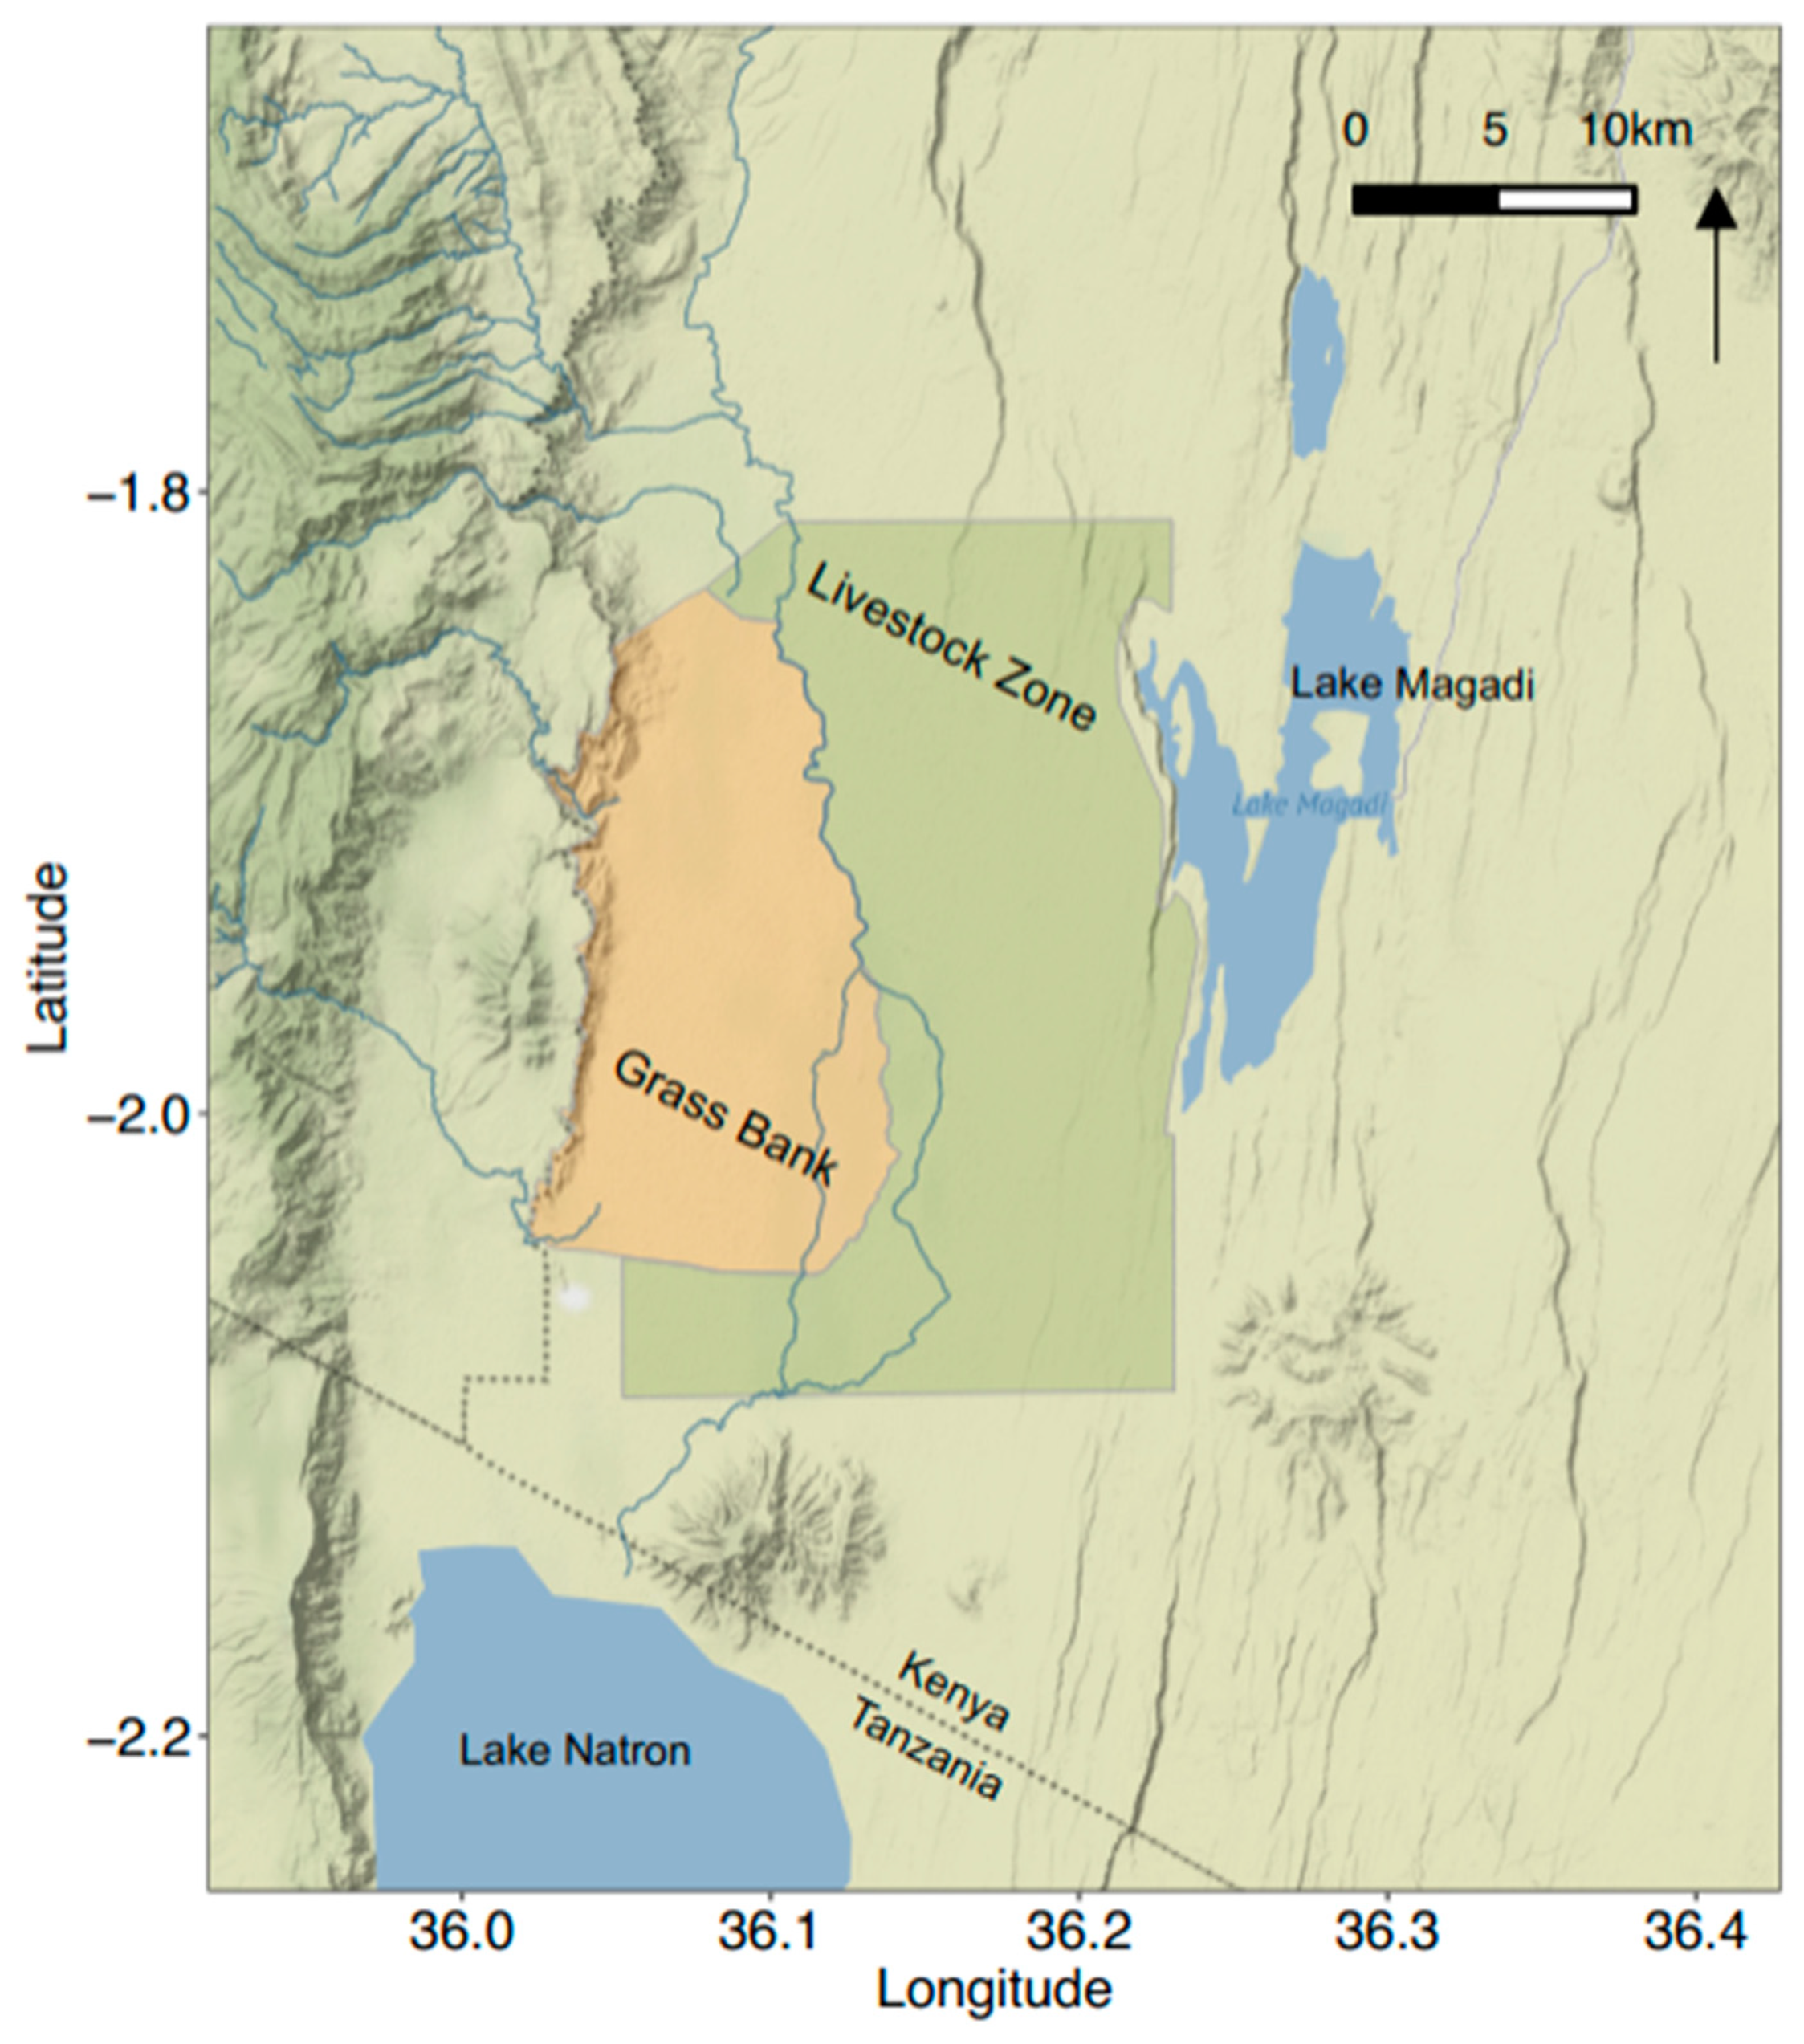
2.2. Study Area
2.3. Field Data Collection
2.4. Image Processing and Band Selection
2.5. Classification
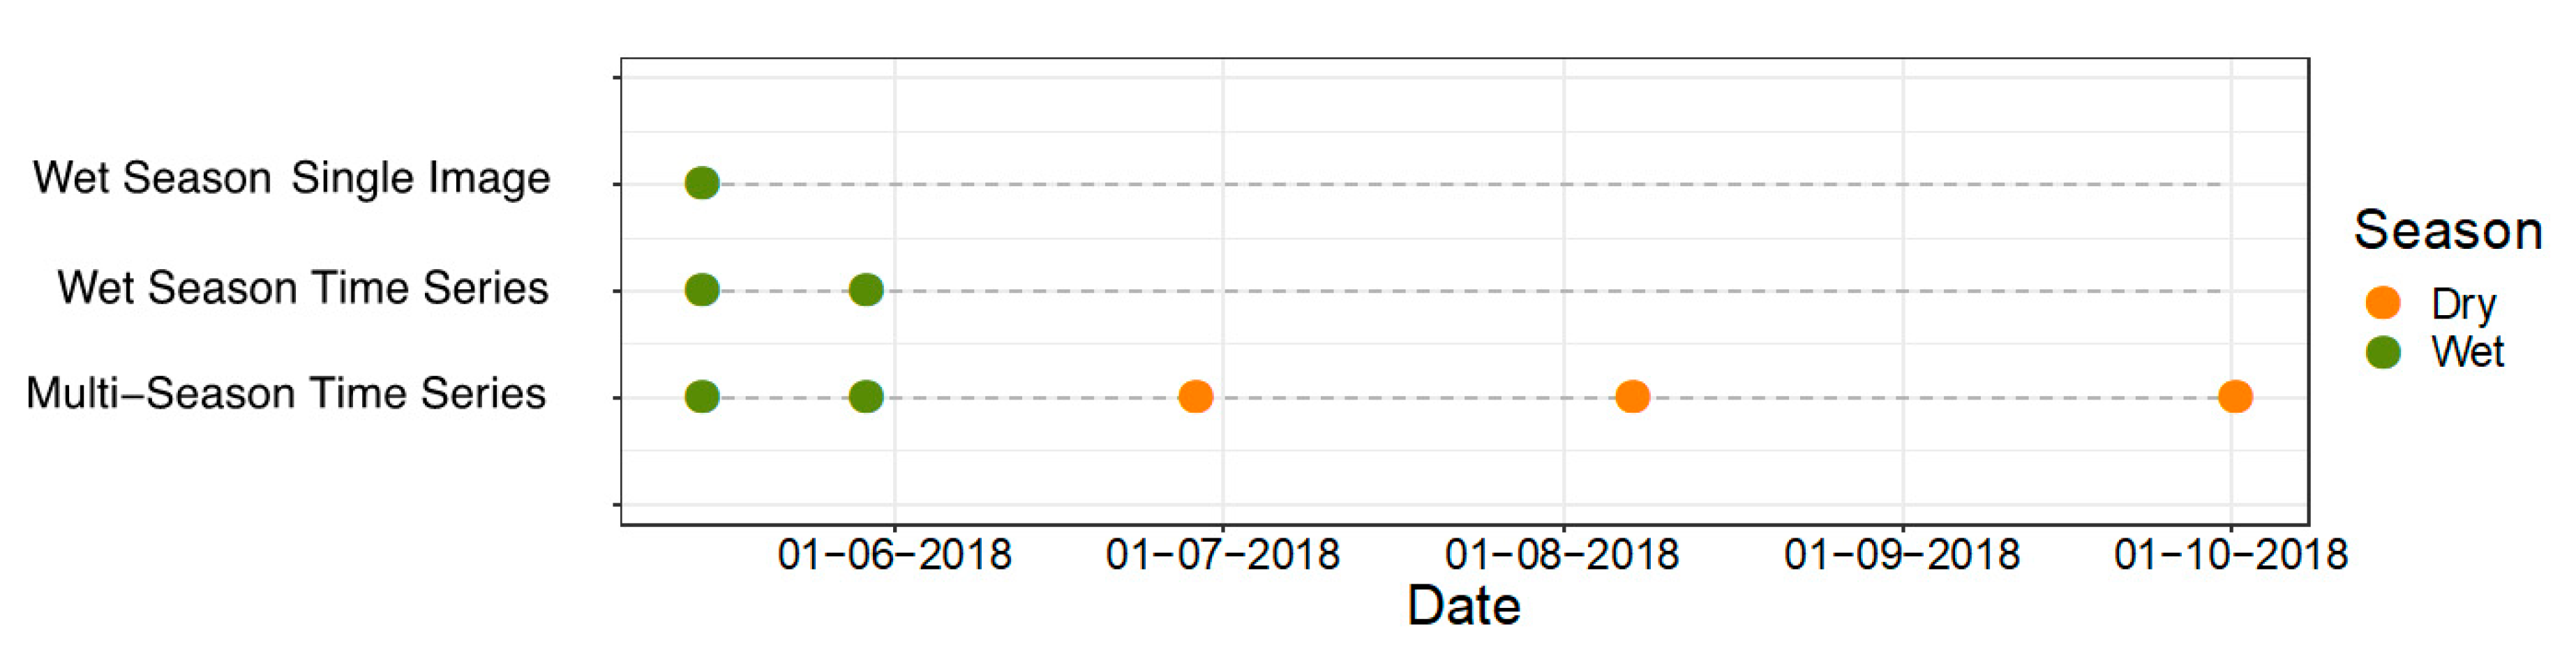
- Wet Season Single Image—one image wet season
- Wet Season Time Series—two images wet season
- Multi-Season Time Series—two images wet season, three images dry season
3. Results
3.1. Reference Data
3.2. Image Selection
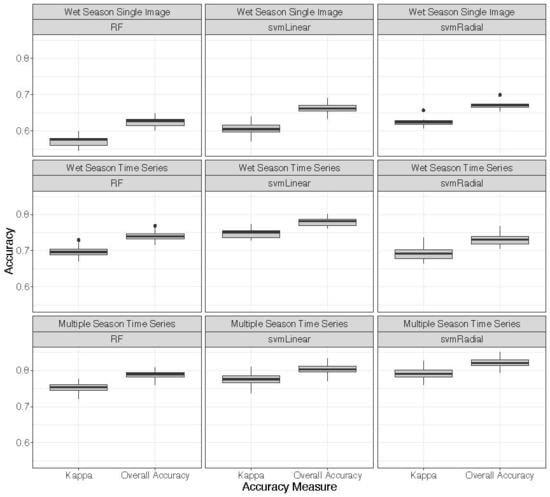
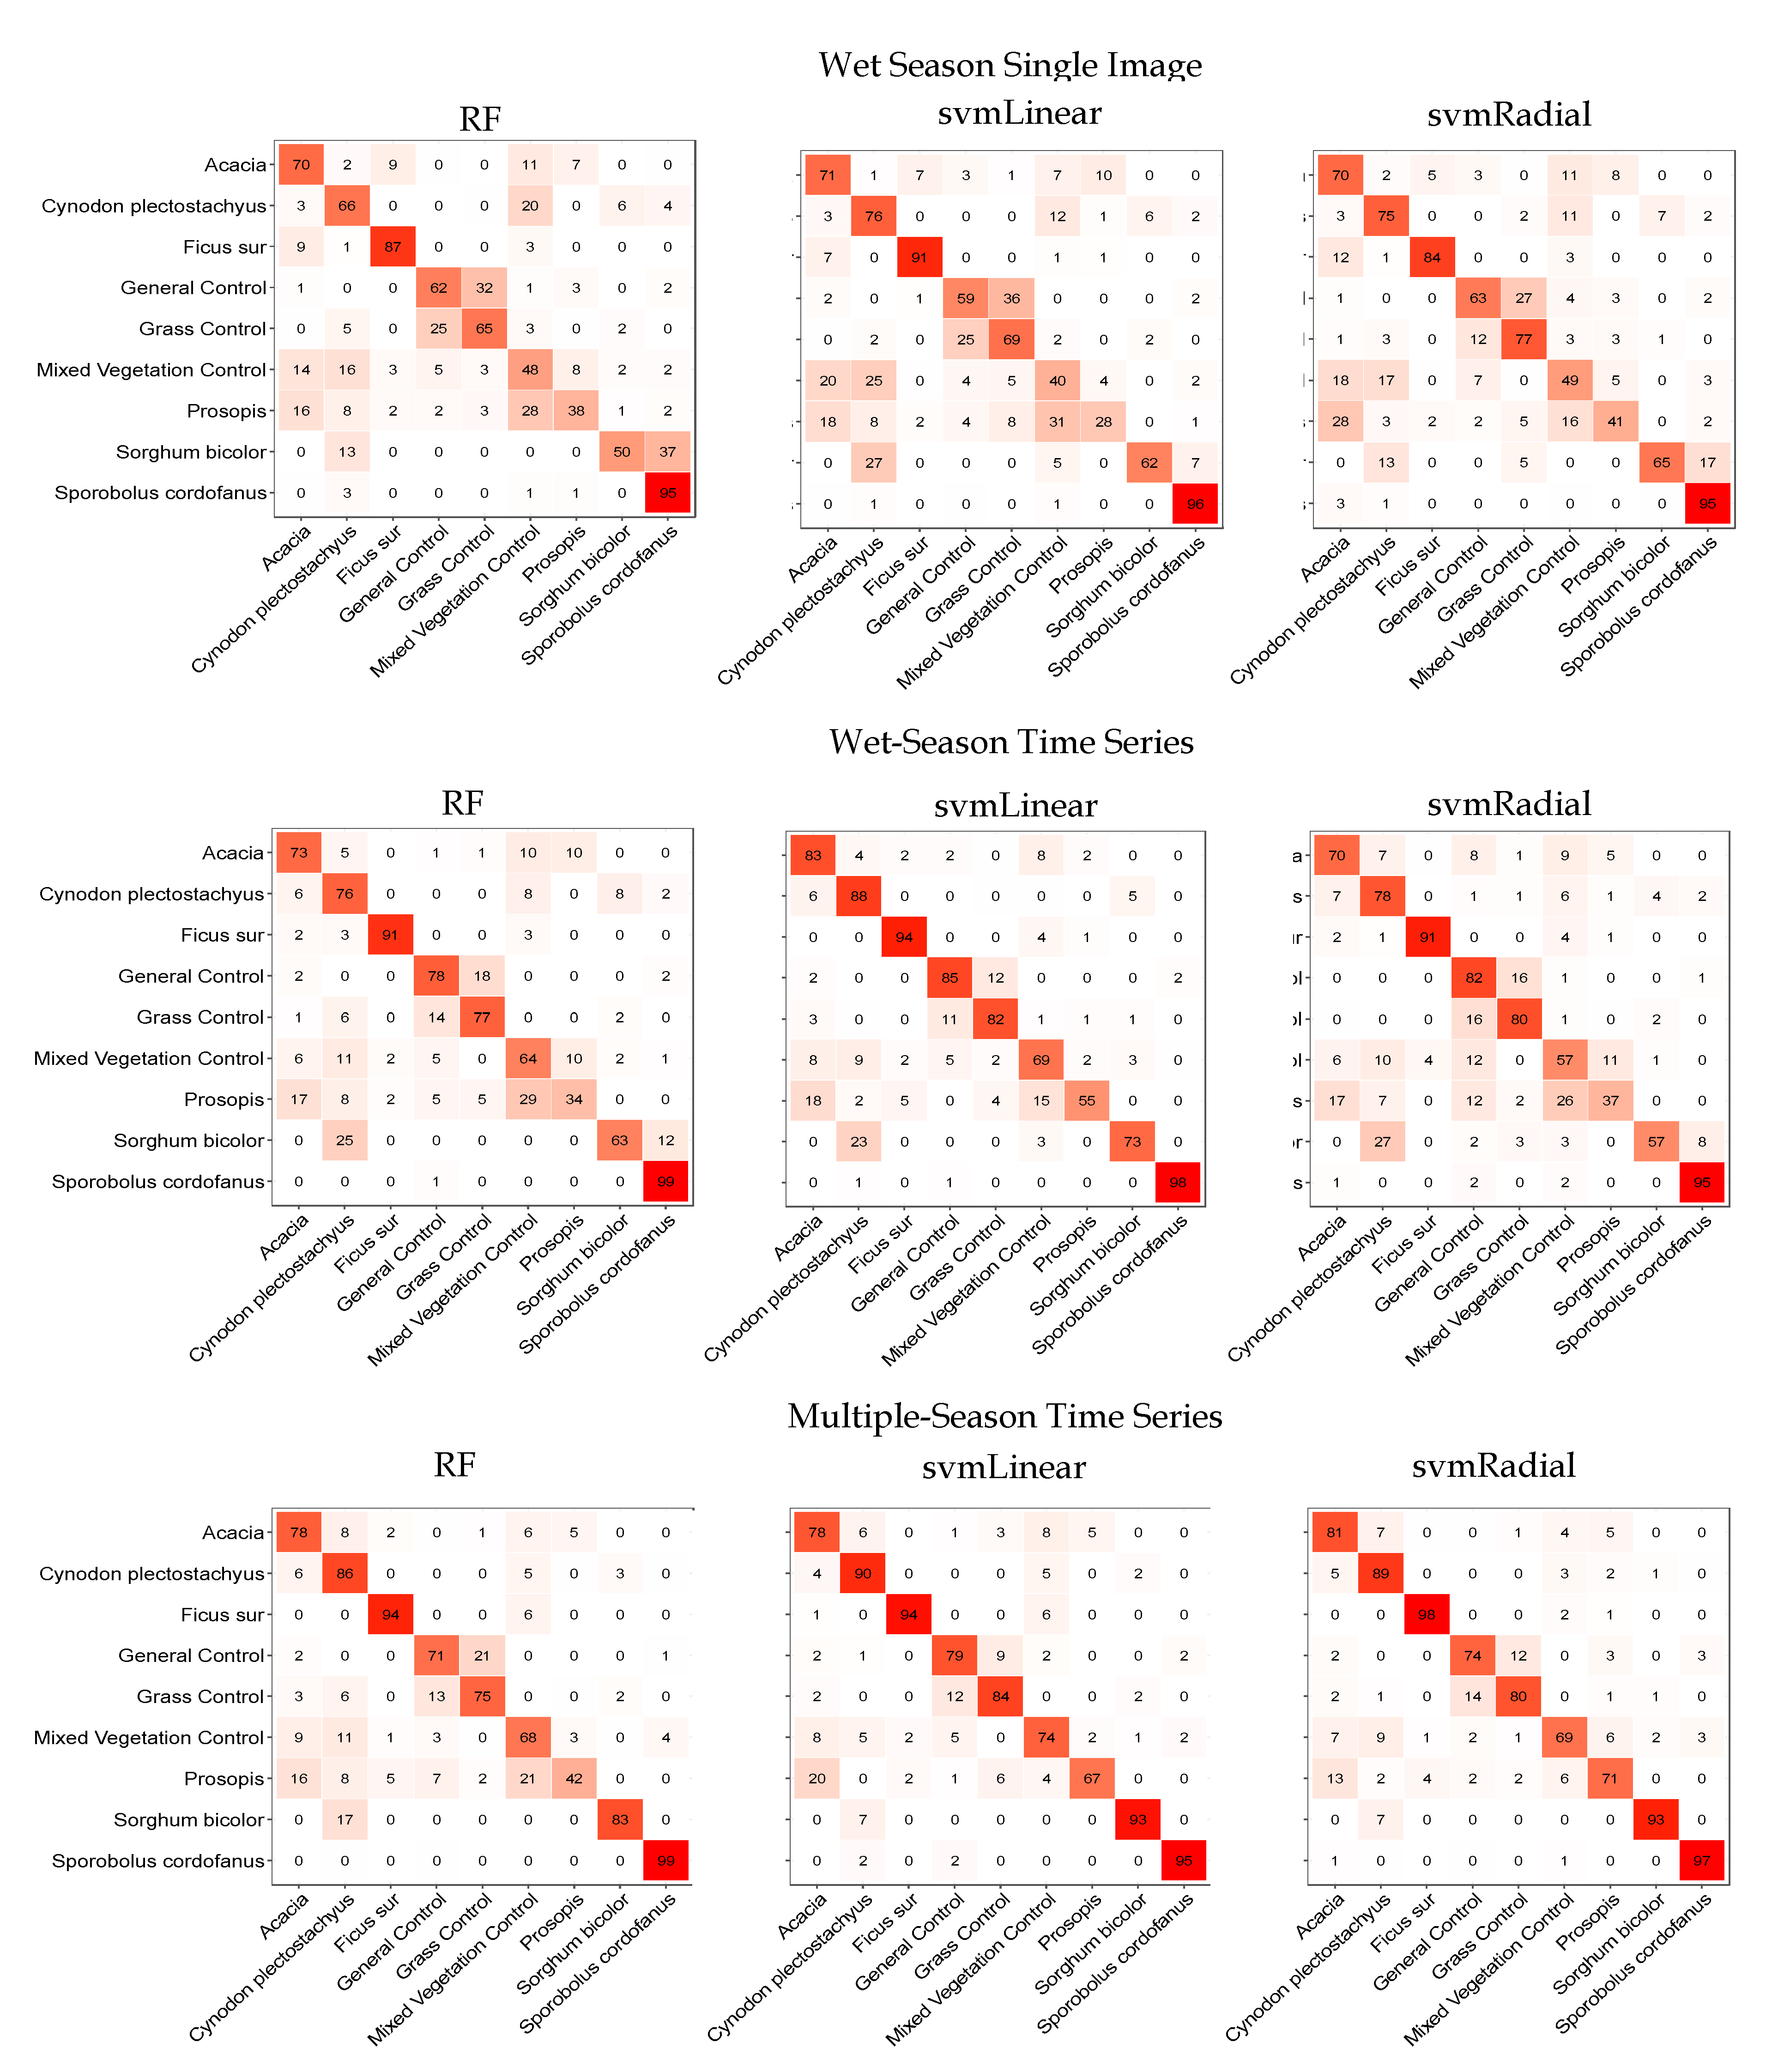
3.3. Classifications
4. Discussion
4.1. Classifications
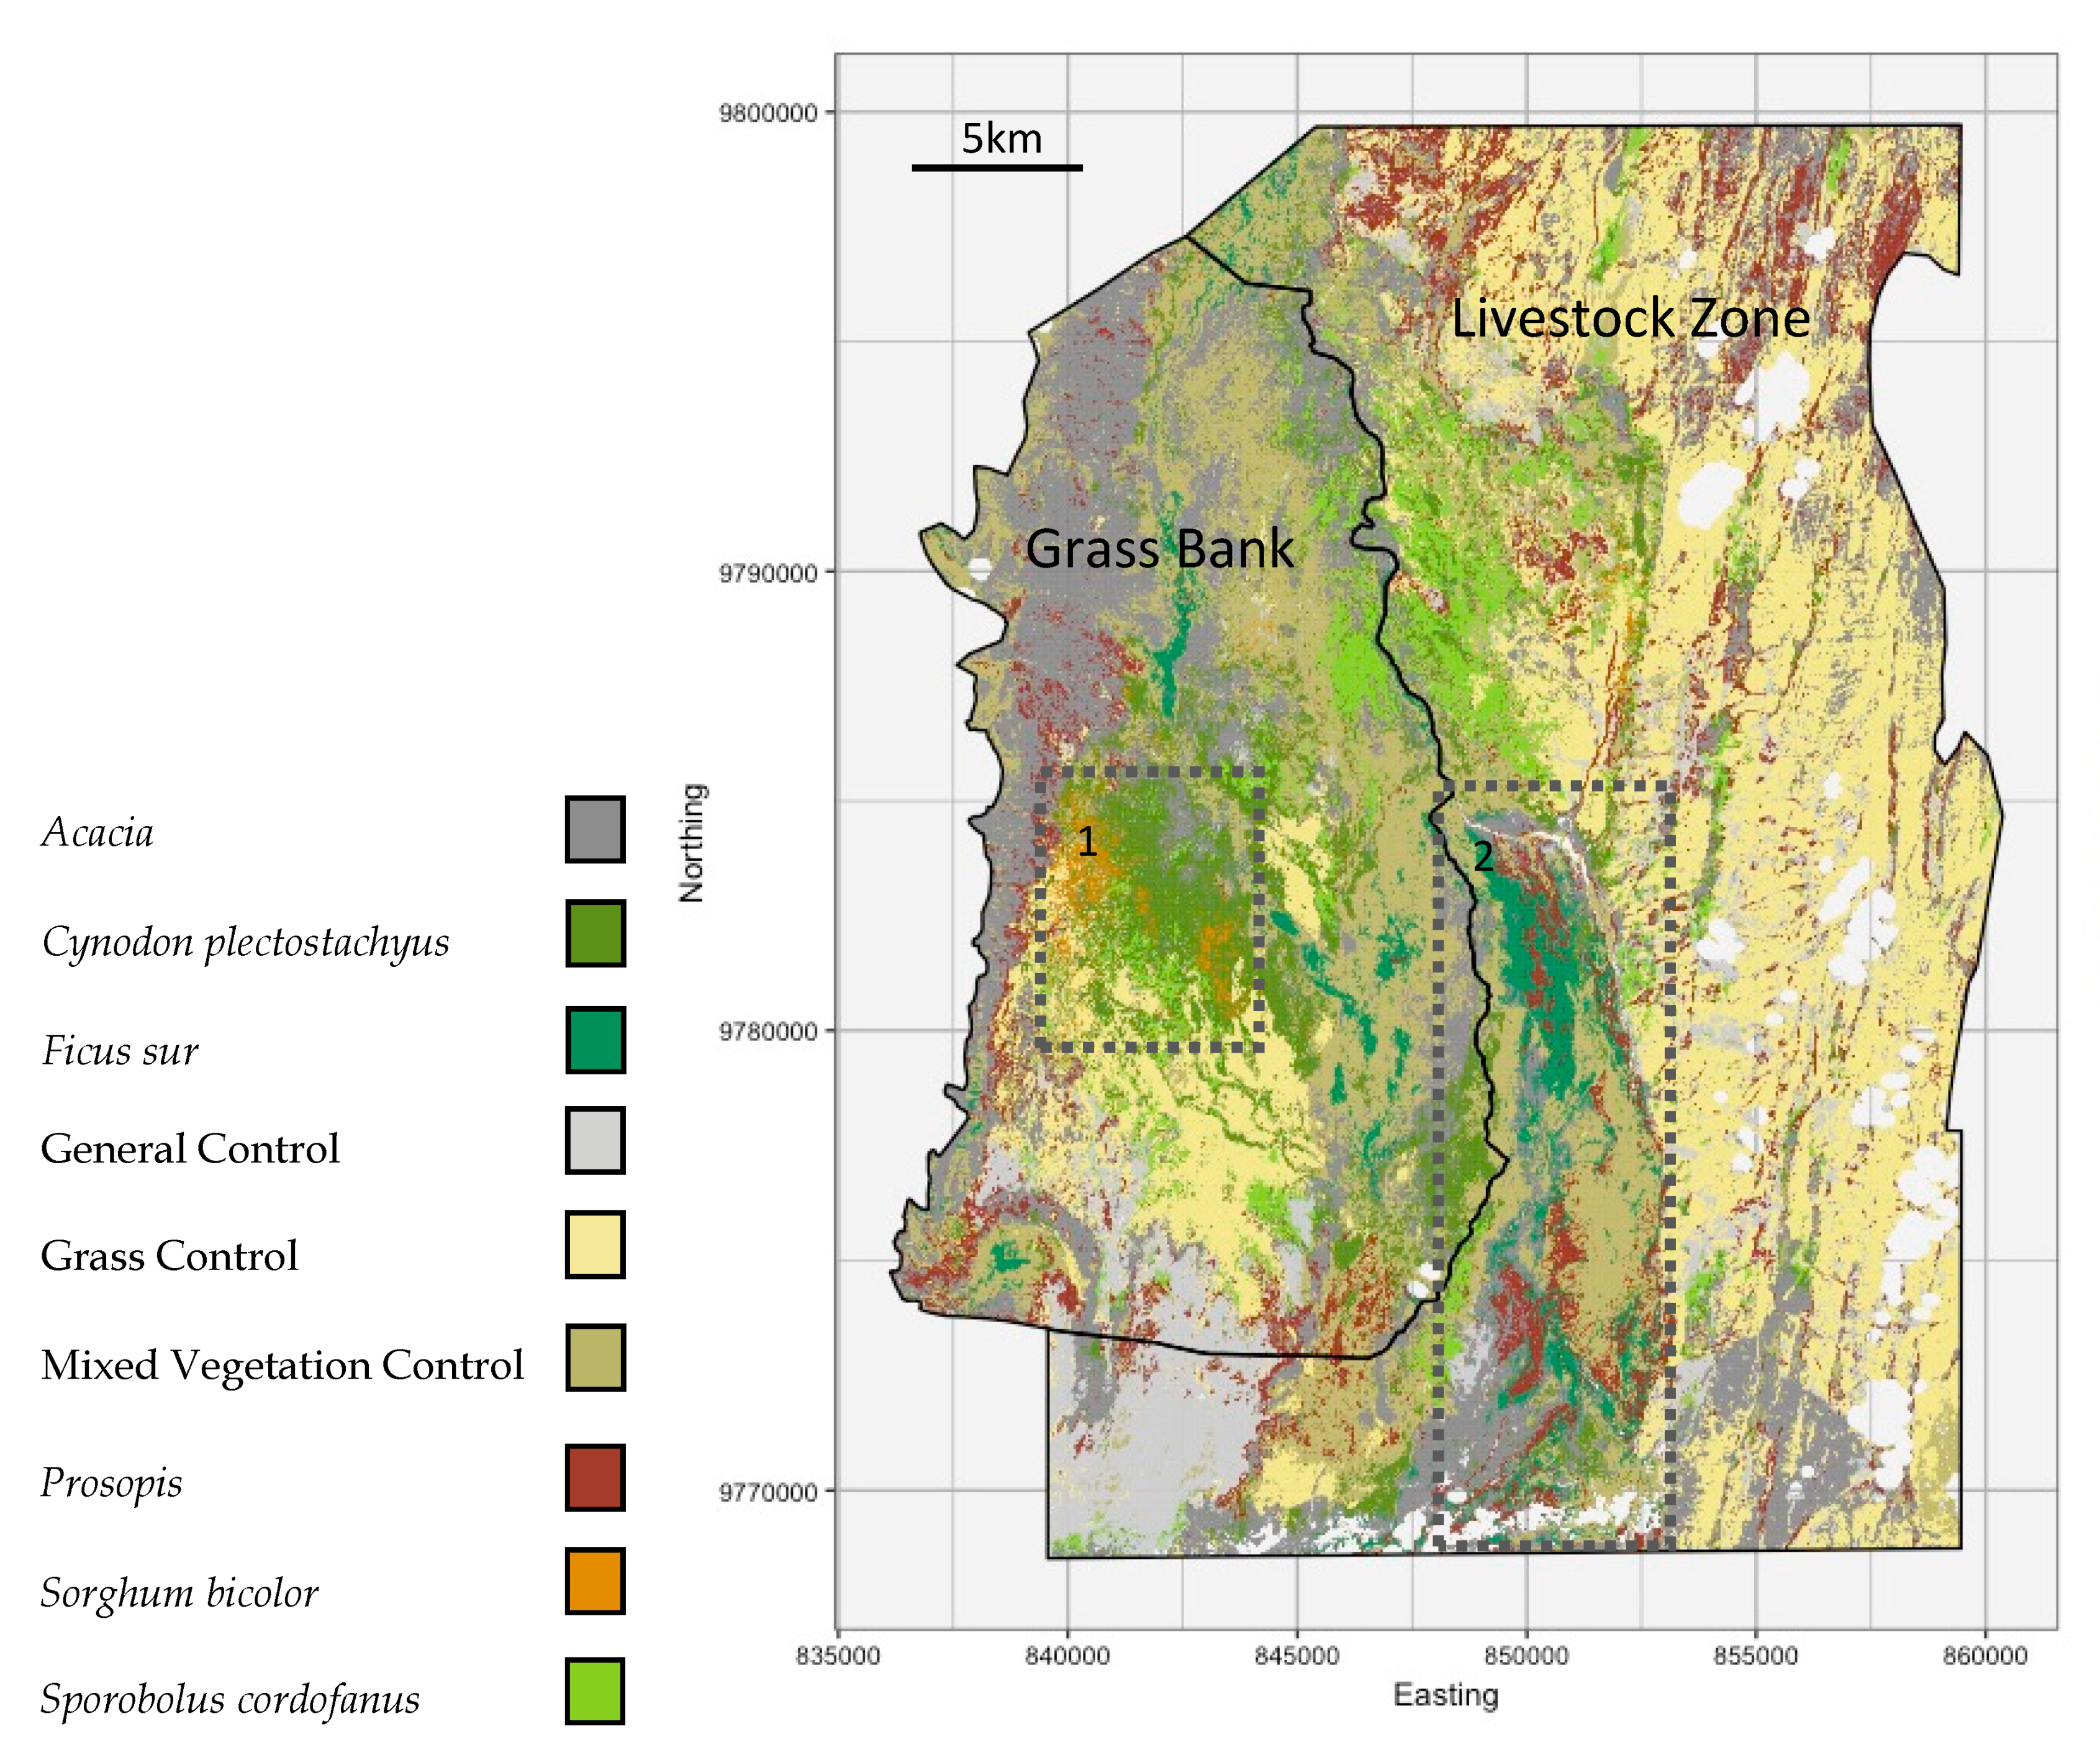
4.2. Classification Maps and Grazing
4.3. Limitations
5. Conclusions
Supplementary Materials
Author Contributions
Funding
Acknowledgments
Conflicts of Interest
References
- Scholes, R.J.; Walker, B.H. An African Savanna: Synthesis of the Nylsvley Study; Cambridge University Press: Cambridge, UK, 2004. [Google Scholar]
- Cassidy, L.; Fynn, R.; Sethebe, B. Effects of restriction of wild herbivore movement on woody and herbaceous vegetation in the Okavango Delta Botswana. Afr. J. Ecol. 2013, 51, 513–527. [Google Scholar] [CrossRef]
- McCleery, R.; Monadjem, A.; Baiser, B.; Fletcher, R., Jr.; Vickers, K.; Kruger, L. Animal diversity declines with broad-scale homogenization of canopy cover in African savannas. Biol. Conserv. 2018, 226, 54–62. [Google Scholar] [CrossRef]
- Western, D. The environment and ecology of pastoralists in arid savannas. Dev. Chang. 1982, 13, 183–211. [Google Scholar] [CrossRef]
- Owen-Smith, N. Functional heterogeneity in resources within landscapes and herbivore population dynamics. Landsc. Ecol. 2004, 19, 761–771. [Google Scholar] [CrossRef]
- Owen-Smith, R.N. Adaptive Herbivore Ecology: From Resources to Populations in Variable Environments; Cambridge University Press: Cambridge, UK, 2002. [Google Scholar]
- Illius, A.W.; O’connor, T.G. Resource heterogeneity and ungulate population dynamics. Oikos 2000, 89, 283–294. [Google Scholar] [CrossRef]
- Hunter, F.; Tyrrell, P.D.; Breahony, P.; Nyange, M.; Russell, S. Maintaining Functional Heterogeneity at the LivestockWildlife Interface: The Role of Floral Species Composition. J. Rangel. Ecol. Manag. submitted.
- Fuhlendorf, S.D.; Fynn, R.W.; McGranahan, D.A.; Twidwell, D. Heterogeneity as the basis for rangeland management. In Rangelan Systems; Springer: Cham, Germany, 2017; pp. 169–196. [Google Scholar] [CrossRef]
- Higgins, S.I.; Shackleton, C.M.; Robinson, E.R. Changes in woody community structure and composition under constrasting landuse systems in a semi-arid savanna, South Africa. J. Biogeogr. 1999, 26, 619–627. [Google Scholar] [CrossRef]
- Groom, R.J.; Western, D. Impact of land subdivision and sedentarization on wildlife in Kenya’s southern rangelands. Rangel. Ecol. Manag. 2013, 66, 1–9. [Google Scholar] [CrossRef]
- Western, D.; Groom, R.; Worden, J. The impact of subdivision and sedentarization of pastoral lands on wildlife in an African savanna ecosystem. Biol. Conserv. 2009, 142, 2538–2546. [Google Scholar] [CrossRef]
- Schmidt, K.S.; Skidmore, A.K. Spectral discrimination of vegetation types in a coastal wetland. Remote Sens. Environ. 2003, 85, 92–108. [Google Scholar] [CrossRef]
- Sianga, K.; Fynn, R. The vegetation and wildlife habitats of the Savuti-Mababe-Linyanti ecosystem, northern Botswana. Koedoe 2017, 59, 1–16. [Google Scholar] [CrossRef]
- Lillesand, T.; Kiefer, R.W.; Chipman, J. Remote Sensing and Image Interpretation; John Wiley & Sons: Hoboken, NJ, USA, 2014. [Google Scholar]
- Maxwell, A.E.; Warner, T.A.; Fang, F. Implementation of machine-learning classification remote sensing: An applied review. Int. J. Remote Sens. 2018, 39, 2784–2817. [Google Scholar] [CrossRef]
- Belgiu, M.; Drăguţ, L. Random forest in remote sensing: A review of applications and future directions. ISPRS J. Photogramm. Remote Sens. 2016, 114, 24–31. [Google Scholar] [CrossRef]
- Mansour, K.; Mutanga, O.; Adam, E.; Abdel-Rahman, E.M. Multispectral remote sensing for mapping grassland degradation using the key indicators of grass species and edaphic factors. Geocarto Int. 2016, 31, 477–491. [Google Scholar] [CrossRef]
- Xie, Y.; Sha, Z.; Yu, M. Remote sensing imagery in vegetation mapping: A review. J. Plant Ecol. 2008, 1, 9–23. [Google Scholar] [CrossRef]
- Rapinel, S.; Mony, C.; Lecoq, L.; Clément, B.; Thomas, A.; Hubert-Moy, L. Evaluation of Sentinel-2 time-series for mapping floodplain grassland plant communities. Remote Sens. Environ. 2017, 223, 115–129. [Google Scholar] [CrossRef]
- Bishop, C.M. Pattern Recognition and Machine Learning; Springer: Berlin/Heidelberg, Germany, 2006. [Google Scholar] [CrossRef]
- Montgomery, D.C.; Peck, E.A.; Vining, G.G. Introduction to Linear Regression Analysis (Vol. 821); John Wiley & Sons: Hoboken, NJ, USA, 2012. [Google Scholar] [CrossRef]
- Adam, E.; Mutanga, O.; Odindi, J.; Abdel-Rahman, E.M. Land-use/cover classification in a heterogeneous coastal landscape using RapidEye imagery: Evaluating the performance of random forest and support vector machines classifiers. Int. J. Remote Sens. 2014, 35, 3440–3458. [Google Scholar] [CrossRef]
- Fethers, J. Remote Sensing of Eelgrass using Object Based Image Analysis and Sentinel-2 Imagery. Master’s Thesis, University of Allborg, Aalborg, Denmark, 2017. [Google Scholar]
- Liu, P.; Choo, K.K.R.; Wang, L.; Huang, F. SVM or deep learning? A comparative study on remote sensing image classification. Soft Comput. 2017, 21, 7053–7065. [Google Scholar] [CrossRef]
- Mashamba, T. Mapping Grass Nutrient Phosphorus (P) and Sodium (NA) across Different Grass Communities Using Sentinel-2 Data. Master’s Thesis, University of the Witwatersrand, Johannesburg, South Africa, 2017. [Google Scholar]
- Raczko, E.; Zagajewski, B. Comparison of support vector machine, random forest and neural network classifiers for tree species classification on airborne hyperspectral APEX images. Eur. J. Remote Sens. 2017, 50, 144–154. [Google Scholar] [CrossRef]
- Skidmore, A.K.; Forbes, G.W.; Carpenter, D.J. Technical note non-parametric test of overlap in multispectral classification. Remote Sens. 1988, 9, 777–785. [Google Scholar] [CrossRef]
- Castro-Esau, K.L.; Sánchez-Azofeifa, G.A.; Rivard, B.; Wright, S.J.; Quesada, M. Variability in leaf optical properties of Mesoamerican trees and the potential for species classification. Am. J. Bot. 2006, 93, 517–530. [Google Scholar] [CrossRef]
- Feilhauer, H.; Thonfeld, F.; Faude, U.; He, K.S.; Rocchini, D.; Schmidtlein, S. Assessing floristic composition with multispectral sensors—A comparison based on monotemporal and multiseasonal field spectra. Int. J. Appl. Earth Obs. Geoinf. 2013, 21, 218–229. [Google Scholar] [CrossRef]
- Fassnacht, F.E.; Latifi, H.; Stereńczak, K.; Modzelewska, A.; Lefsky, M.; Waser, L.T.; Straub, C.; Ghosh, A. Review of studies on tree species classification from remotely sensed data. Remote Sens. Environ. 2016, 186, 64–87. [Google Scholar] [CrossRef]
- Shoko, C.; Mutanga, O. Examining the strength of the newly-launched Sentinel 2 MSI sensor in detecting and discriminating subtle differences between C3 and C4 grass species. ISPRS J. Photogramm. Remote Sens. 2017, 129, 32–40. [Google Scholar] [CrossRef]
- Miyoshi, G.T.; Imai, N.N.; De Moraes, M.V.A.; Tommaselli, A.M.G.; Näsi, R. Time series of images to improve tree species classification. Int. Arch. Photogramm. Remote Sens. Spat. Inf. Sci. 2017, 42. [Google Scholar] [CrossRef]
- Schuster, C.; Schmidt, T.; Conrad, C.; Kleinschmit, B.; Förster, M. Grassland habitat mapping by intra-annual time series analysis–Comparison of RapidEye and TerraSAR-X satellite data. Int. J. Appl. Earth Obs. Geoinf. 2015, 34, 25–34. [Google Scholar] [CrossRef]
- Mitchard, E.T.; Flintrop, C.M. Woody encroachment and forest degradation in sub-Saharan Africa’s woodlands and savannas 1982–2006. Philos. Trans. R. Soc. B Biol. Sci. 2013, 368, 20120406. [Google Scholar] [CrossRef]
- Drusch, M.; Del Bello, U.; Carlier, S.; Colin, O.; Fernandez, V.; Gascon, F.; Hoersch, B.; Isola, C.; Laberinti, P.; Martimort, P.; et al. Sentinel-2: ESA’s optical high-resolution mission for GMES operational services. Remote Sens. Environ. 2012, 120, 25–36. [Google Scholar] [CrossRef]
- Ntiati, P. Group Ranch Subdivision Study in Loitokitok Division of Kajiado District, Kenya; Lucid Working Paper Series No. 7, Lucid; LUCID Project; International Livestock Research Institute: Nairobi, Kenya, 2002. [Google Scholar]
- Mwangi, M.N.; Desanker, P.V. Changing climate, disrupted livelihoods: The case of vulnerability of nomadic Maasai pastoralism to recurrent droughts in Kajiado District, Kenya. In Proceedings of the American Geophysical Union, Fall Meeting 2007, San Francisco, CA, USA, 10–14 December 2007. abstract id. GC12A-02. [Google Scholar]
- Agnew, A.D.Q.; Mwendia, C.M.; Oloo, G.O.; Roderick, S.; Stevenson, P. Landscape monitoring of semi-arid rangelands in the Kenyan Rift Valley. Afr. J. Ecol. 2000, 38, 277–285. [Google Scholar] [CrossRef]
- Russell, S.; Tyrrell, P.; Western, D. Seasonal interactions of pastoralists and wildlife in relation to pasture in an African savanna ecosystem. J. Arid Environ. 2018, 154, 70–81. [Google Scholar] [CrossRef]
- Schuette, P.; Creel, S.; Christianson, D. Coexistence of African lions, livestock, and people in a landscape with variable human land use and seasonal movements. Biol. Conserv. 2013, 157, 148–154. [Google Scholar] [CrossRef]
- Western, G. Conflict or Coexistence. Ph.D. Thesis, University of Oxford, Oxford, UK, 2018. [Google Scholar]
- Tyrrell, P.; Russell, S.; Western, D. Seasonal movements of wildlife and livestock in a heterogenous pastoral landscape: Implications for coexistence and community based conservation. Glob. Ecol. Conserv. 2017, 12, 59–72. [Google Scholar] [CrossRef]
- Dharani, N. Field Guide to Common Trees & Shrubs of East Africa; Penguin Random House: Cape Town, South Africa, 2011. [Google Scholar]
- Dumont, B.; Rossignol, N.; Loucougaray, G.; Carrère, P.; Chadoeuf, J.; Fleurance, G.; Bonis, A.; Farruggia, A.; Gaucherand, S.; Ginane, C.; et al. When does grazing generate stable vegetation patterns in temperate pastures? Agric. Ecosyst. Environ. 2012, 153, 50–56. [Google Scholar] [CrossRef]
- Dubow, A.Z. Mapping and Managing the Spread of Prosopis Juliflora in Garissa County, Kenya. Master’s Thesis, Kenyatta University, Nairobi, Kenya, 2011. [Google Scholar]
- Main-Knorn, M.; Pflug, B.; Louis, J.; Debaecker, V.; Müller-Wilm, U.; Gascon, F. Sen2Cor for Sentinel-2. In Image and Signal Processing for Remote Sensing; International Society for Optics and Photonics: Dresden, Germany, 2017; Volume 10427, p. 1042704. [Google Scholar] [CrossRef]
- Zhu, Z.; Woodcock, C.E. Object-based cloud and cloud shadow detection in Landsat imagery. Remote Sens. Environ. 2012, 118, 83–94. [Google Scholar] [CrossRef]
- Frantz, D.; Haß, E.; Uhl, A.; Stoffels, J.; Hill, J. Improvement of the Fmask algorithm for Sentinel-2 images: Separating clouds from bright surfaces based on parallax effects. Remote Sens. Environ. 2018, 215, 471–481. [Google Scholar] [CrossRef]
- R Core Team. R: A Language and Environment for Statistical Computing; R Foundation for Statistical Computing: Vienna, Austria, 2018; Available online: https://www.R-project.org/ (accessed on 1 June 2019).
- Hijmans, J. Raster: Geographic Data Analysis and Modeling. R Package Version 2.8–19. 2019. Available online: https://CRAN.R-project.org/package=raster (accessed on 1 June 2019).
- Kuhn, M.; Wing, J.; Weston, S.; Williams, A.; Keefer, C.; Engelhardt, A.; Cooper, T.; Mayer, Z.; Kenkel, B.; Benesty, M.; et al. Caret: Classification and Regression Training; R Package Version 6.0–84. 2019. Available online: https://cran.r-project.org/web/packages/caret/caret.pdf (accessed on 1 June 2019).
- Liaw, A.; Wiener, M. Classification and Regression by randomForest. R News 2002, 2, 18–22. [Google Scholar]
- Shi, D.; Yang, X. An assessment of algorithmic parameters affecting image classification accuracy by random forests. Photogramm. Eng. Remote Sens. 2016, 82, 407–417. [Google Scholar] [CrossRef]
- Cortes, C.; Vapnik, V. Support-vector networks. Mach. Learn. 1995, 20, 273–297. [Google Scholar] [CrossRef]
- Melgani, F.; Bruzzone, L. Classification of hyperspectral remote sensing images with support vector machines. IEEE Trans. Geosci. Remote Sens. 2004, 42, 1778–1790. [Google Scholar] [CrossRef]
- Huang, C.; Davis, L.S.; Townshend, J.R.G. An assessment of support vector machines for land cover classification. Int. J. Remote Sens. 2002, 23, 725–749. [Google Scholar] [CrossRef]
- Kuhn, M. Building predictive models in R using the caret package. J. Stat. Softw. 2008, 28, 1–26. [Google Scholar] [CrossRef]
- Congalton, R.G.; Green, K. Assessing the Accuracy of Remotely Sensed Data: Principles and Practices; CRC Press: New York, NY, USA, 2008. [Google Scholar]
- Stehman, S.V. A critical evaluation of the normalized error matrix in map accuracy assessment. Photogrammetric. Eng. Remote Sens. 2004, 70, 743–751. [Google Scholar] [CrossRef]
- Gomez, C.; White, J.C.; Wulder, M.A. Optical remotely sensed time series data for land cover classification: A review. ISPRS J. Photogramm. Remote Sens. 2016, 116, 55–72. [Google Scholar] [CrossRef]
- Burai, P.; Deák, B.; Valkó, O.; Tomor, T. Classification of herbaceous vegetation using airborne hyperspectral imagery. Remote Sens. 2015, 7, 2046–2066. [Google Scholar] [CrossRef]
- Neumann, C.; Weiss, G.; Schmidtlein, S.; Itzerott, S.; Lausch, A.; Doktor, D.; Brell, M. Gradient-based assessment of habitat quality for spectral ecosystem monitoring. Remote Sens. 2015, 7, 2871–2898. [Google Scholar] [CrossRef]
- Oldeland, J.; Dorigo, W.; Lieckfeld, L.; Lucieer, A.; Jürgens, N. Combining vegetation indices, constrained ordination and fuzzy classification for mapping semi-natural vegetation units from hyperspectral imagery. Remote Sens. Environ. 2010, 114, 1155–1166. [Google Scholar] [CrossRef]
- Lopatin, J.; Fassnacht, F.E.; Kattenborn, T.; Schmidtlein, S. Mapping plant species in mixed grassland communities using close range imaging spectroscopy. Remote Sens. Environ. 2017, 201, 12–23. [Google Scholar] [CrossRef]
- Meerdink, S.K. Remote Sensing of Plant Species Using Airborne Hyperspectral Visible-Shortwave Infrared and Thermal Infrared Imagery. Ph.D. Thesis, UC Santa Barbara, Santa Barbara, CA, USA, 2018. [Google Scholar]
- Ng, W.T.; Rima, P.; Einzmann, K.; Immitzer, M.; Atzberger, C.; Eckert, S. Assessing the Potential of Sentinel-2 and Pléiades Data for the Detection of Prosopis and Vachellia spp. in Kenya. Remote Sens. 2017, 9, 74. [Google Scholar] [CrossRef]
- Fynn, R.W.; Augustine, D.J.; Peel, M.J.; de Garine-Wichatitsky, M. Strategic management of livestock to improve biodiversity conservation in African savannahs: A conceptual basis for wildlife—Livestock coexistence. J. Appl. Ecol. 2016, 53, 388–397. [Google Scholar] [CrossRef]
- Western, D.; Mose, V.N.; Worden, J.; Maitumo, D. Predicting extreme droughts in savannah Africa: A comparison of proxy and direct measures in detecting biomass fluctuations, trends and their causes. PLoS ONE 2015, 10, e0136516. [Google Scholar] [CrossRef]
- Huete, A.; Didan, K.; Miura, T.; Rodriguez, E.P.; Gao, X.; Ferreira, L.G. Overview of the radiometric and biophysical performance of the MODIS vegetation indices. Remote Sens. Environ. 2002, 83, 195–213. [Google Scholar] [CrossRef]
- Baldeck, C.A.; Colgan, M.S.; Féret, J.B.; Levick, S.R.; Martin, R.E.; Asner, G.P. Landscape-scale variation in plant community composition of an African savanna from airborne species mapping. Ecol. Appl. 2014, 24, 84–93. [Google Scholar] [CrossRef] [PubMed]
- Puliti, S.; Saarela, S.; Gobakken, T.; Ståhl, G.; Næsset, E. Combining UAV and Sentinel-2 auxiliary data for forest growing stock volume estimation through hierarchical model-based inference. Remote Sens. Environ. 2018, 204, 485–497. [Google Scholar] [CrossRef]
- Mose, V.N.; Western, D.; Tyrrell, P. Application of open source tools for biodiversity conservation and natural resource management in East Africa. Ecol. Inform. 2018, 47, 35–44. [Google Scholar] [CrossRef]


| Species | Characteristics |
|---|---|
| Acacia spp. | A genus of trees adapted to arid and semi-arid environments. Known to have proliferated in the area over the last 50 years. Increased density of Acacia trees is an indicator of land degradation, resulting in reduced grazing quality. |
| Cynodon plectostachyus | A perennial grass identified by local pastoralists in group discussions as one of the top 10 most important grazing species in both wet and dry seasons due to its fast growth, high nutritional content and high biomass [8]. This species occurs at high density, but stands may also contain some other species at a low abundance. |
| Ficus sur | These fig trees are large and occur in clusters with dense tree crowns that can be identified remotely with recent Google Earth imagery (GEI). Fig trees are thought to be declining in the area and provide foraging resources and habitat to several primate species, including the endangered black and white colobus monkey (Colobus guereza). |
| Prosopis (juliflora, pallida and hybrids) | An invasive shrub and a major threat to communal rangelands in East Africa through its capacity to out-compete native species [46]. Remains green long into the dry season due to an unusually deep taproot. |
| Sorghum bicolor | Critically important high biomass perennial grazing resource that buffers herbivore populations through droughts. Occurs in discrete and dense patches. |
| Sporobolus cordofanus | Identified by local pastoralists in group discussions as one of the top 10 most important grazing species during the wet season. The species is annual and the most abundant grass in the region, dominating many grass plains [8]. |
| Band | Central Wavelength (nm) | Band Width (nm) | Spatial Resolution (m) |
|---|---|---|---|
| Band 2—Blue | 492.4 | 66 | 10 |
| Band 3—Green | 559.8 | 36 | 10 |
| Band 4—Red | 664.6 | 31 | 10 |
| Band 5—Red edge | 704.1 | 15 | 20 |
| Band 6—Red edge | 740.5 | 15 | 20 |
| Band 7—Red edge | 782.8 | 20 | 20 |
| Band 8A Narrow NIR | 864.7 | 21 | 20 |
| Band 11 SWIR | 1613.7 | 91 | 20 |
| Band 12 SWIR | 2202.4 | 175 | 20 |
| Class | No. Samples |
|---|---|
| Acacia | 78 |
| Cynodon plectostachyus | 71 |
| Ficus sur | 55 |
| General Control | 64 |
| Grass Control | 150 |
| Mixed Vegetation Control | 93 |
| Prosopis | 45 |
| Sorghum bicolor | 20 |
| Sporobolus cordofanus | 99 |
| Model | Image Set | Hyperparameter Values |
|---|---|---|
| RF | Wet season single image | Number of trees = 500, mtry = 5 |
| svmLinear | Wet season single image | Cost = 15 |
| svmRadial | Wet season single image | Cost = 25, Sigma = 0.1 |
| RF | Wet season time series | Number of trees = 500, mtry = 4 |
| svmLinear | Wet season time series | Cost = 7 |
| svmRadial | Wet season time series | Cost = 25, Sigma = 0.1 |
| RF | Multiple-season time series | Number of trees = 500, mtry = 3 |
| svmLinear | Multiple-season time series | Cost = 2 |
| svmRadial | Multiple-season time series | Cost = 25, Sigma = 0.1 |
© 2020 by the authors. Licensee MDPI, Basel, Switzerland. This article is an open access article distributed under the terms and conditions of the Creative Commons Attribution (CC BY) license (http://creativecommons.org/licenses/by/4.0/).
Share and Cite
Hunter, F.D.L.; Mitchard, E.T.A.; Tyrrell, P.; Russell, S. Inter-Seasonal Time Series Imagery Enhances Classification Accuracy of Grazing Resource and Land Degradation Maps in a Savanna Ecosystem. Remote Sens. 2020, 12, 198. https://doi.org/10.3390/rs12010198
Hunter FDL, Mitchard ETA, Tyrrell P, Russell S. Inter-Seasonal Time Series Imagery Enhances Classification Accuracy of Grazing Resource and Land Degradation Maps in a Savanna Ecosystem. Remote Sensing. 2020; 12(1):198. https://doi.org/10.3390/rs12010198
Chicago/Turabian StyleHunter, Frederick D.L., Edward T.A. Mitchard, Peter Tyrrell, and Samantha Russell. 2020. "Inter-Seasonal Time Series Imagery Enhances Classification Accuracy of Grazing Resource and Land Degradation Maps in a Savanna Ecosystem" Remote Sensing 12, no. 1: 198. https://doi.org/10.3390/rs12010198
APA StyleHunter, F. D. L., Mitchard, E. T. A., Tyrrell, P., & Russell, S. (2020). Inter-Seasonal Time Series Imagery Enhances Classification Accuracy of Grazing Resource and Land Degradation Maps in a Savanna Ecosystem. Remote Sensing, 12(1), 198. https://doi.org/10.3390/rs12010198