Article

Assessing the Changes in the Moisture/Dryness of Water Cavity Surfaces in Imlili Sebkha in Southwestern Morocco by Using Machine Learning Classification in Google Earth Engine

by
Sofia Hakdaoui
1,
Anas Emran
1,
Biswajeet Pradhan
2,3,*,
Abdeljebbar Qninba
4,
Taoufik El Balla
5,
Alfred Homère Ngandam Mfondoum
6,7,
Chang-Wook Lee
8 and
Abdullah M. Alamri
9
1
Earth Observation Department, Geo-Biodiversity and Natural Patrimony Laboratory, Geophysics, Natural Patrimony and Green Chemistry Research Center, Scientific Institute, Mohamed V University, Rabat. Av. Ibn Batouta B.P 703, Rabat 10106, Morocco
2
The Centre for Advanced Modelling and Geospatial Information Systems (CAMGIS), Faculty of Engineering and Information Technology, University of Technology Sydney, Ultimo 2007, New South Wales, Australia
3
Department of Energy and Mineral Resources Engineering, Sejong University, Choongmu-gwan, 209, Neungdong-ro, Gwangin-gu, Seoul 05006, Korea
4
Le Groupe de Recherche pour la Protection des Oiseaux au Maroc (GREPOM/BirdLife) Residence Oum Hani IV, Salé 11160, Morocco
5
Association “Nature Initiative”, Avenue Mohamed Fadel Semlali, BP 79, Ad-Dakhla 11060, Morocco
6
StatsN’Maps, Private Consulting Firm, Dallas, TX 75287, USA
7
Laboratory of Natural Resources Management, Department of Geography, University of Yaoundé I, Yaoundé, PoBox 755, Cameroon
8
Division of Science Education, Kangwon National University, 1 Kangwondaehak-gil, Chuncheon-si 24341, Korea
9
Department of Geology & Geophysics, College of Science, King Saud Univ., P.O. Box 2455, Riyadh 11451, Saudi Arabia
*
Author to whom correspondence should be addressed.
Remote Sens. 2020, 12(1), 131; https://doi.org/10.3390/rs12010131
Submission received: 28 October 2019 / Revised: 13 December 2019 / Accepted: 25 December 2019 / Published: 1 January 2020
(This article belongs to the Special Issue Remote Sensing for Climate Change Studies)

Abstract

:
Imlili Sebkha is a stable and flat depression in southern Morocco that is more than 10 km long and almost 3 km wide. This region is mainly sandy, but its northern part holds permanent water pockets that contain fauna and flora despite their hypersaline water. Google Earth Engine (GEE) has revolutionized land monitoring analysis by allowing the use of satellite imagery and other datasets via cloud computing technology and server-side JavaScript programming. This work highlights the potential application of GEE in processing large amounts of satellite Earth Observation (EO) Big Data for the free, long-term, and wide spatio-temporal wet/dry permanent salt water cavities and moisture monitoring of Imlili Sebkha. Optical and radar images were used to understand the functions of Imlili Sebkha in discovering underground hydrological networks. The main objective of this work was to investigate and evaluate the complementarity of optical Landsat, Sentinel-2 data, and Sentinel-1 radar data in such a desert environment. Results show that radar images are not only well suited in studying desertic areas but also in mapping the water cavities in desert wetland zones. The sensitivity of these images to the variations in the slope of the topographic surface facilitated the geological and geomorphological analyses of desert zones and helped reveal the hydrological functions of Imlili Sebkha in discovering buried underground networks.

Graphical Abstract

1. Introduction

Sebkhas are wet depressions in desert environments that are generally regarded as floodplains of significant environmental interest and have been closely linked to many environmental issues, such as climate change, water quality, wildlife habitat, and biodiversity. Recent studies by the Scientific Institute of Rabat and the Nature Initiative Association of Dakhla have focused on Imlili Sebkha in southern Morocco, whose geomorphological structures have retained the impacts of previous climate conditions in the Sahara [1,2,3,4,5,6]. Sebkhas are supratidal sandflats that are formed along arid coastlines. These landforms have evaporate–carbonate deposits with siliciclastics and form subaerial, prograding, and shoaling-upward sequences with an average thickness of 1 m or less [7]. Previous studies have shown that the palaeoclimatic regimes over Saharan Morocco have alternated between dry and wet periods throughout the Pleistocene [8] and that the reserves of Saharan fossil aquifers are filled during humid periods [9]. The water supply of these pockets is not random and is guaranteed by the small resurgences that appear at the lower part of the area, thereby preserving the moisture on the groundwater surface of the sebkha’s soil, especially at the western and northern edges of the area [10]. While the median part of this sebkha holds over tens (161) of pockets of permanent water with diameters ranging from 1 m to 10 m, these pockets have a depth of approximately 4.6 decimetres and a water salinity of 24 g/L to 350 g/L (Figure 1a). However, these water pockets host many animals and fish (Figure 1b) as reported during a scientific field trip in April 2017. In fact, neither the general landscape nor the climatic data of the region suggest the existence of permanent salt water cavities that are capable of housing fish. Although its high salinity has caused birds to flee, Imlili Sebkha has created a favorable habitat for a Cichlid fish species associated with Tilapia guineensis, a species previously unknown in Morocco and whose northern limit was previously limited to the Senegal River.
Rainwater is another source of water for these excavations. Although rare in these latitudes, rainwater is transported to the sebkha via temporary watercourses, the most important of which is located in the wet area. Imlili Sebkha is also known as Ramsar, a remnant of an old aquatic network in the Sahara. All these reasons make the Imlili Sebkha an interesting area of study for scientists. Table 1 shows the area and depth of these cavities.
Google Earth Engine (GEE) (https://earthengine.google.com/) is a powerful web platform for the large-scale, cloud-based processing and analysis of geospatial data. This engine contains archived satellite images taken all over the world and trillions of scientific measurements that date back by almost 40 years. This platform also offers an Application Programming Interface (API) service and other tools that scientists and researchers can use to analyze spatial big data by detecting and monitoring land cover changes and map trends and by quantifying the differences on the Earth’s surface [11]. GEE is a petabyte archive of Earth Observations (EO) data that provides and relates data by using an efficient processing software coded in JavaScript or Python and describes these data in API format. Through its high-performance cloud computing tools, users can perform complex geospatial analyses and visualizations on GEE. The GEE and its API tools allow users to obtain, analyze, visualize, and process EO information for any specified area without the need to import spatial data and export the analysis results to the desktop environment of the user. The use of cloud platforms allows users to process large volumes of data efficiently. These data include satellite images, which are largely consumed in computationally intensive tasks, such as classification, spectral analysis, and feature extraction, and when using advanced algorithms, such as machine learning. GEE is a free, open-access, cloud-based geospatial analysis tool that can be used for education and nonprofit purposes [12] and can provide an online accessible interface to any user with a Google account. Along with its JavaScript API, the GEE has relevant datasets and algorithms for regional and global mapping and an extensive collection of image data (including almost all Landsat and Copernicus archives) that can be directly accessed by developers to interactively check and create algorithms and display their results almost instantaneously. Archived data in GEE include signal data (e.g., topographic, climatic, optic, and radar data) and thematic data (e.g., land cover data). For optical data, Landsat offers the largest open-access archive of EO data. This study used archived Landsat-5 Thematic Mapper™ data from 1984 to 2012, Landsat-8 Operational Land Imager (OLI) data from 2013, Synthetic Aperture Radar (SAR) Sentinel-1 data from 2014, and optical Multispectral Instrument (MSI) Sentinel-2 data from 2015. Monitoring the location of water cavities from multisource spatial data in Imlili Sebkha posed three challenges. The first challenge was in the method for image collection, which should guarantee a maximum image coverage with a limited cloud coverage. The second challenge was setting up a cloud platform for preprocessing image data and storing images. The third challenge was designing methods for mapping the changes in the moisture/dry surface data of Imlili Sebkha while ensuring consistency in the results. We took advantage of the computational power of GEE and supported the image collection process to overcome the first two challenges mentioned above. As for the third challenge, we adopted an index-based method for collecting optical and radar data. Given that we exploited two properties of water cavities in our work, namely, the presence of water in cavities and the presence of salts, we calculated two spectral indices from the optical images, namely, the all bands water index (ABWI) and the salinity index (SI). From the Sentinel-1 SAR Ground Range Detected (GRD) data, we determined a microwave-normalized difference polarization index (MNDPI) from all vertical–horizontal (VH) and vertical–vertical (VV) polarization images captured by this sensor from 2014. Previous studies have shown that index-based methods are efficient for applications that use GEE with different image sources, such as Landsat [11,12,13,14,15,16,17,18,19], The Advanced Land Observing Satellite and the Phased Array type L-band Synthetic Apertune Radar ALOS/Palsar [13], and Sentinel-1,2 [20].
SAR is an active remote sensing technique that can penetrate the cloud cover, operate day or night, and allow an effective classification of surface water [21]. Radar images are well suited for studying and monitoring desertic areas [22]. The sensitivity of these images to the slope variations of the topographic surface can facilitate geological and geomorphological analyses [23]. Previous studies have used single-polarized SAR satellites and classified the surface properties of Sebkhas according to their particle size distribution and predominant rock composition [24]. However, Sebkha objects have been classified only according to the intensity of backscattered energy, which is known as the radar cross-section (σ°) of the calibrated dual polarized SAR data, thereby leading to inaccurate estimations of roughness and grain size [25,26,27]. The amount of backscattered SAR waves is affected by two parameters, namely, the surface roughness (mean square height) and dielectric constant of the surface (ε0), which show a linear relationship [28,29]. The degree of roughness of the surface is controlled by the general topography, slope, and particle size of the surface object, whereas the value of the dielectric constant is based on the volumetric moisture content (θv) and conductivity (homogeneity) of the surface object [24,30,31]. As a result, the dual-polarized SAR data provided a dual backscatter value for each pixel in a scene (VV and VH). By using these dual polarimetric SAR data, additional information, such as the polarization index or reflectivity dependence of polarization, can be determined for each pixel in the scene by calculating both the intensity of the backscattered waves and the change in their phase (φ) and intensity [32]. The radar polarization signature of a target allowed stronger deductions of the physical scattering mechanism than single polarization measurements by identifying and characterizing the dominant scattering mechanism [33,34,35]. Therefore, the solution for the geometric shape and dielectric constant of an object became less ambiguous [35]. Such radar polarimetry can be used for object discrimination and characterisation in Sebkhas [23].
In this work, the GEE platform was used to (1) monitor the salt states of permanent water cavities in Imlili Sebkha, (2) monitor the wet/dry conditions of these cavities, (3) assess the capability of cloud computing to process several types of data, including the spectral or polarimetric indices on multisensors and multitemporal imagery, and (4) analyze the function of the Sebkha aquifer system by examining a buried underground network and map the location of saltwater cavities with a significantly higher accuracy compared with what can be achieved by using the free data available on the GEE platform. The primary objective of this paper was to monitor the evolution of water cavities in Imlili Sebkha over a certain period. Specifically, this paper used the features of GEE to monitor Imlili Sebkha by extracting its wetness, salt, and humidity indices and contribute to the development of a GEE-based methodology. Moreover, the radar/optic combination was used to extract hydrogeological and geomorphological information, and the random forest classification possibilities were used to improve the mapping accuracy in this desert region.

2. Materials and Methods

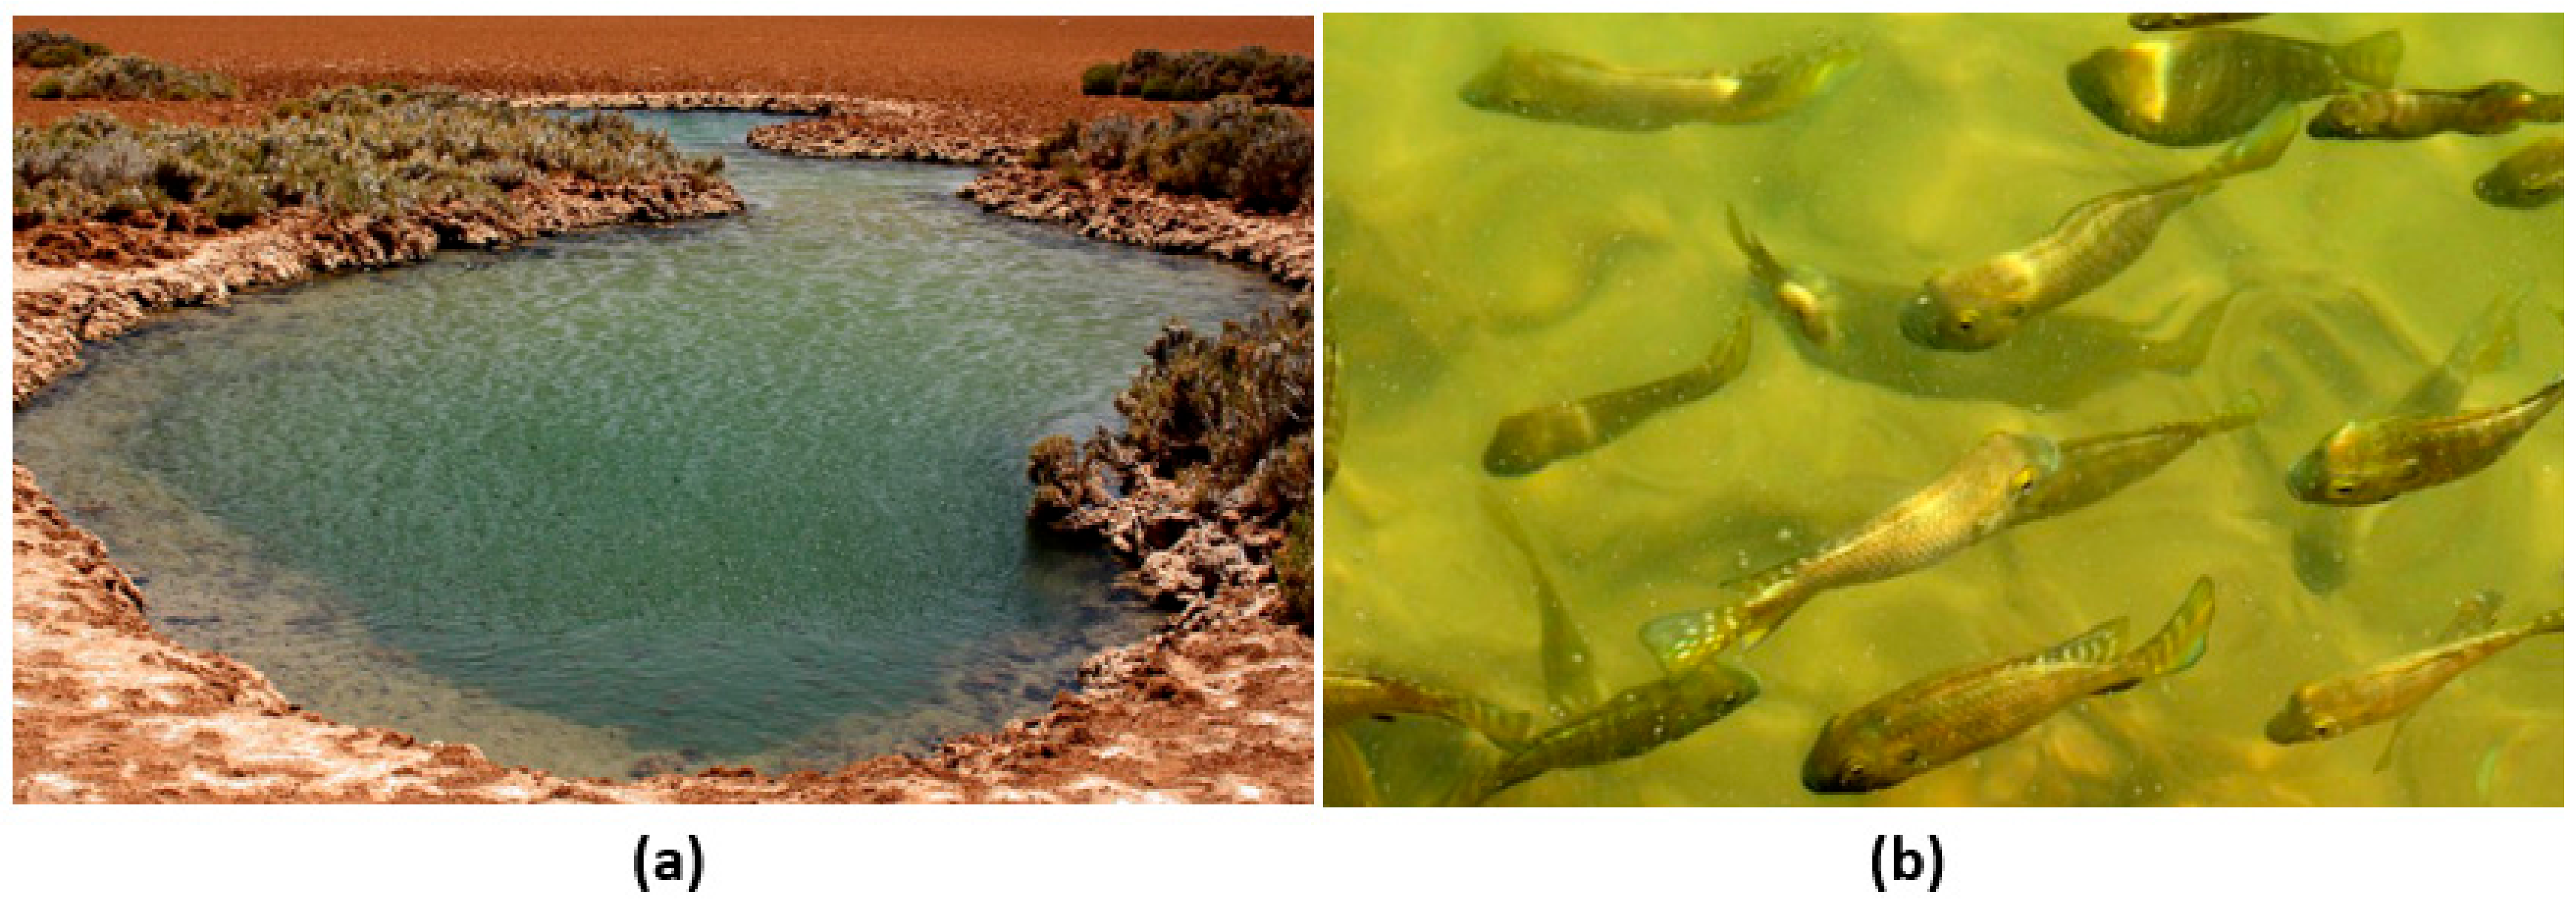
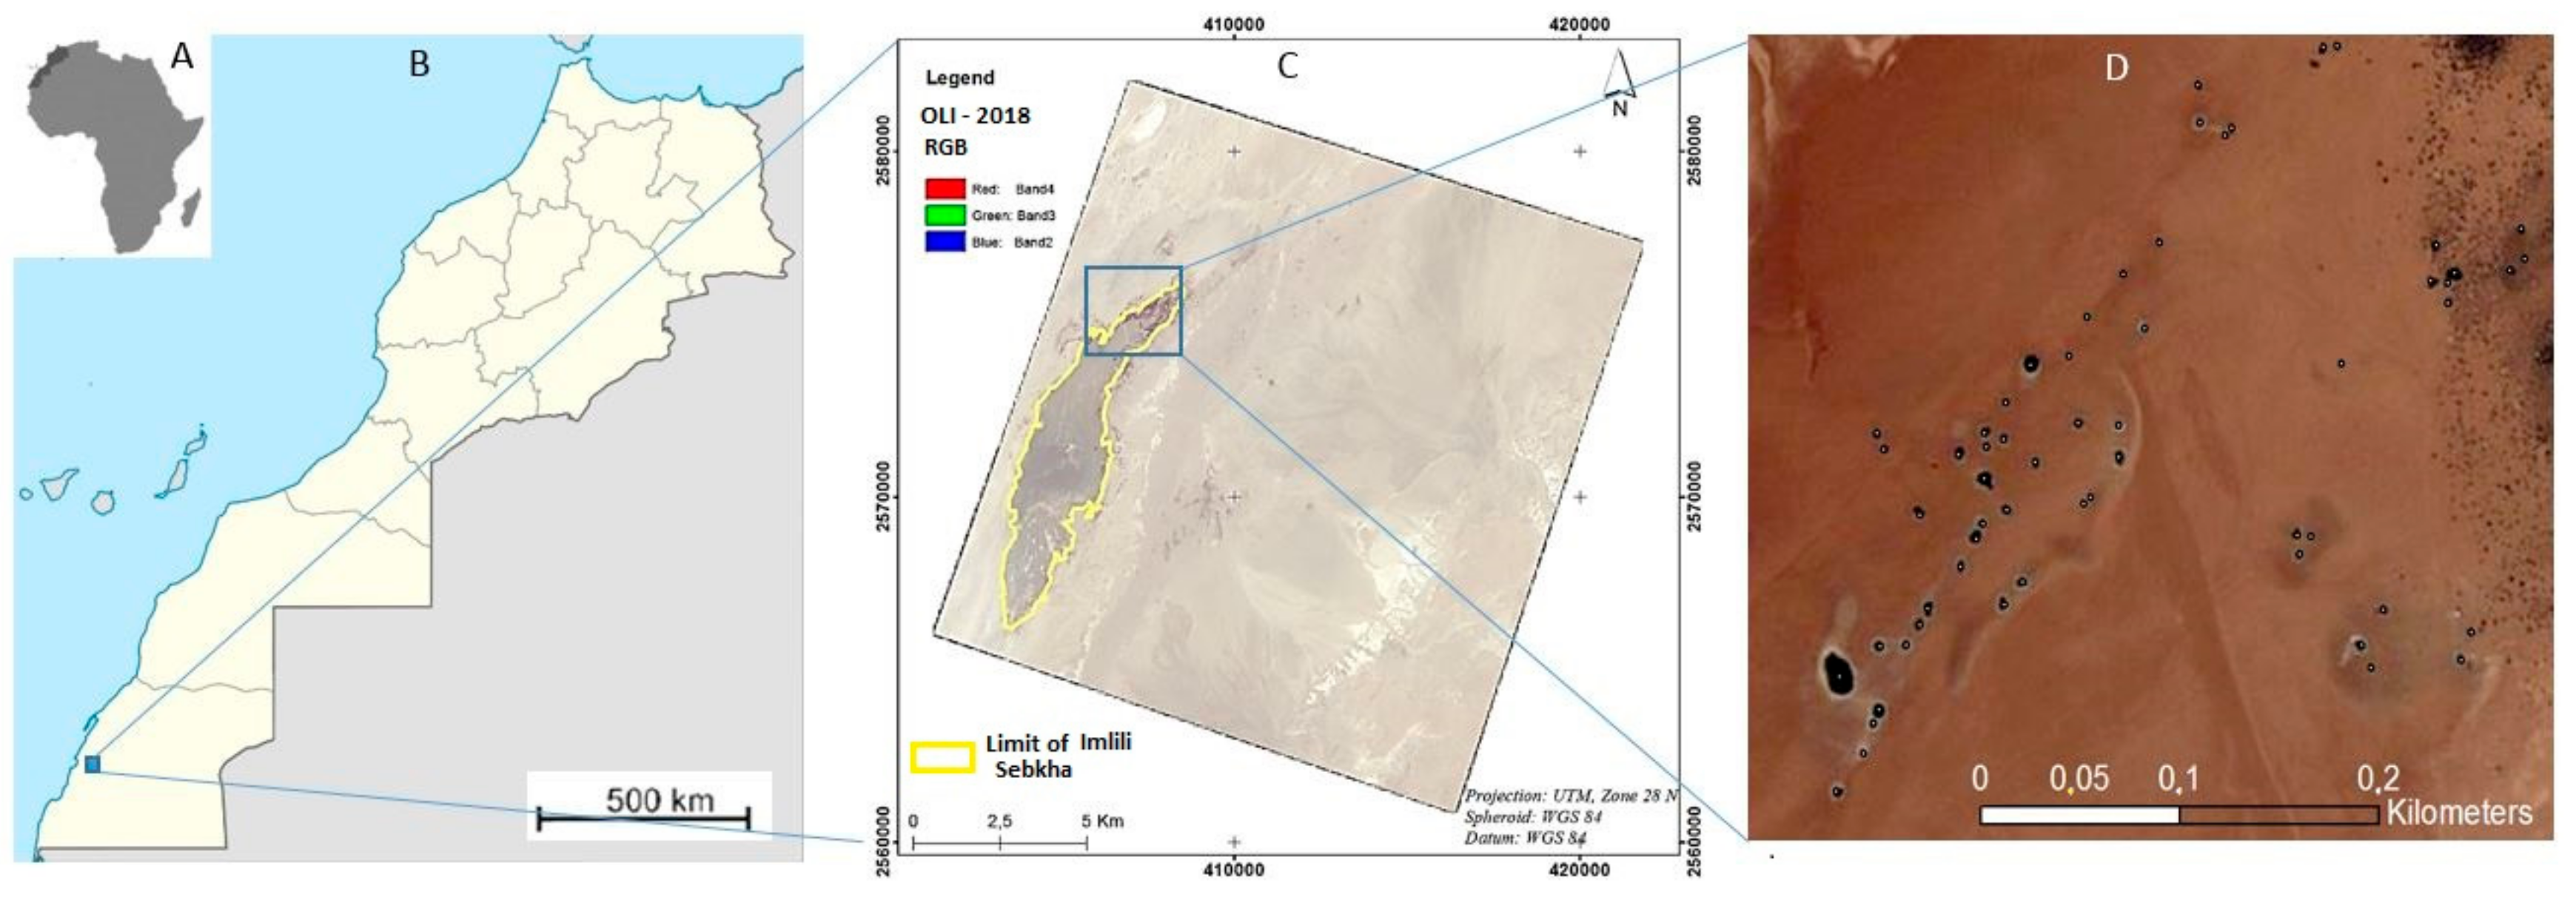
2.1. Study Area and General Physiology

Imlili Sebkha is located in southern Morocco (2381703000–2381104500 N, 1585604100–1585303700 W) 40 km south of El Argoub and 15 km east of the Atlantic Ocean (Figure 2). The vast area is comprised of more than a hundred pockets of permanent waterholes and salt. The high salinity of this area has caused birds to flee from the region yet provides a favorable habitat for a Cichlid fish species associated with T. guineensis, a species previously unknown in Morocco whose northern limit was limited to the Senegal River (West Africa) before its recent discovery on a tributary of Oued Chebeika and Banc d’Arguin in Mauritania. The temperature in the area varies from 5° in winter to 48° in summer with short and irregular rainfall. Imlili Sebkha is also exposed to winds and sandstorms, has an annual rainfall ranging from 50 mm to 60 mm, and has a sufficient supply of fog and dew to maintain a semidesert type of vegetation in the beds of small Oueds and Sebkhas [36].

2.2. Earth Observation Data

Table 2 presents the spatial and reference datasets used in this study. These data include several multisource images that were used to derive the spectral indices and the physicochemical properties of water cavities (e.g., salinity, pH, water depth, resistivity, and presence or absence of fish) that were used to validate the results of the proposed method. A total of 520 optical and 211 satellite radar imagery were accessed and analyzed within GEE.
A 30-m spatial resolution digital elevation model (DEM) was obtained from the Advanced Spaceborne Thermal Emission and Reflection Radiometer (ASTER) database and prepared in Geographic Information System (GIS). This model requires several measures, such as gap filling, spatial sorting, and subset analysis of the extracted region (Figure 3a). The radar Sentinel-1 C-band Level-1 ground range-detected (GRD) images were collected at a 10-m spatial resolution (Figure 3b). The Thematic Mapper (TM)/Landsat-5 (Figure 3c) and Sentinel-2 MSI are shown in Figure 3d. The Landsat-5 TM images were acquired on 2 June 1984, 6 August 1994, and 21 April 2004, whereas the Sentinel-2 MSI images were acquired on 16 April 2017 and 10 April 2019. The spatial resolution of the Landsat images was 30 m, whereas that of the Sentinel-2 images was 10 m. The materials were provided in ground range and georeferenced in the UTM, Universal Transverse Mercator coordinate system (WGS84 zone 28N projection), which was the same projection of the DEM Aster, TM Landsat-5, MSI Sentinel-2, and SAR (GRD) Sentinel-1 images.

2.3. Surface Soil Data Measured in the Field

The data were collected from 14 April 2017 to 16 April 2017 during an on-site expedition where a complete field study of the above sites was conducted. During this expedition, the data were gathered in situ to cover a wide range of prospective Sebkha populations. The scientists carried out a hydrobiological and ornithological mission in Imlili Sebkha, and their observations highlighted the importance of this site as a stopover for tens of thousands of birds that are attracted by the concentration of plants and permanent water pockets developed in a desert environment. Some migrants fall prey to the Guinea tilapia and other marine species living in the salt pockets in this area.
The scientific team used Global Position System (GPS) to geotag the water cavities as points and to determine their properties (e.g., salinity, pH, surface, water depth, and resistivity). Several digital photographs and ancillary observations (e.g., presence or absence of fish) were also collected to prepare the training samples. The recorded GPS points were then imported into Quantum GIS (QGIS), a free software, where polygons that denote the classified delineated water cavities were generated.

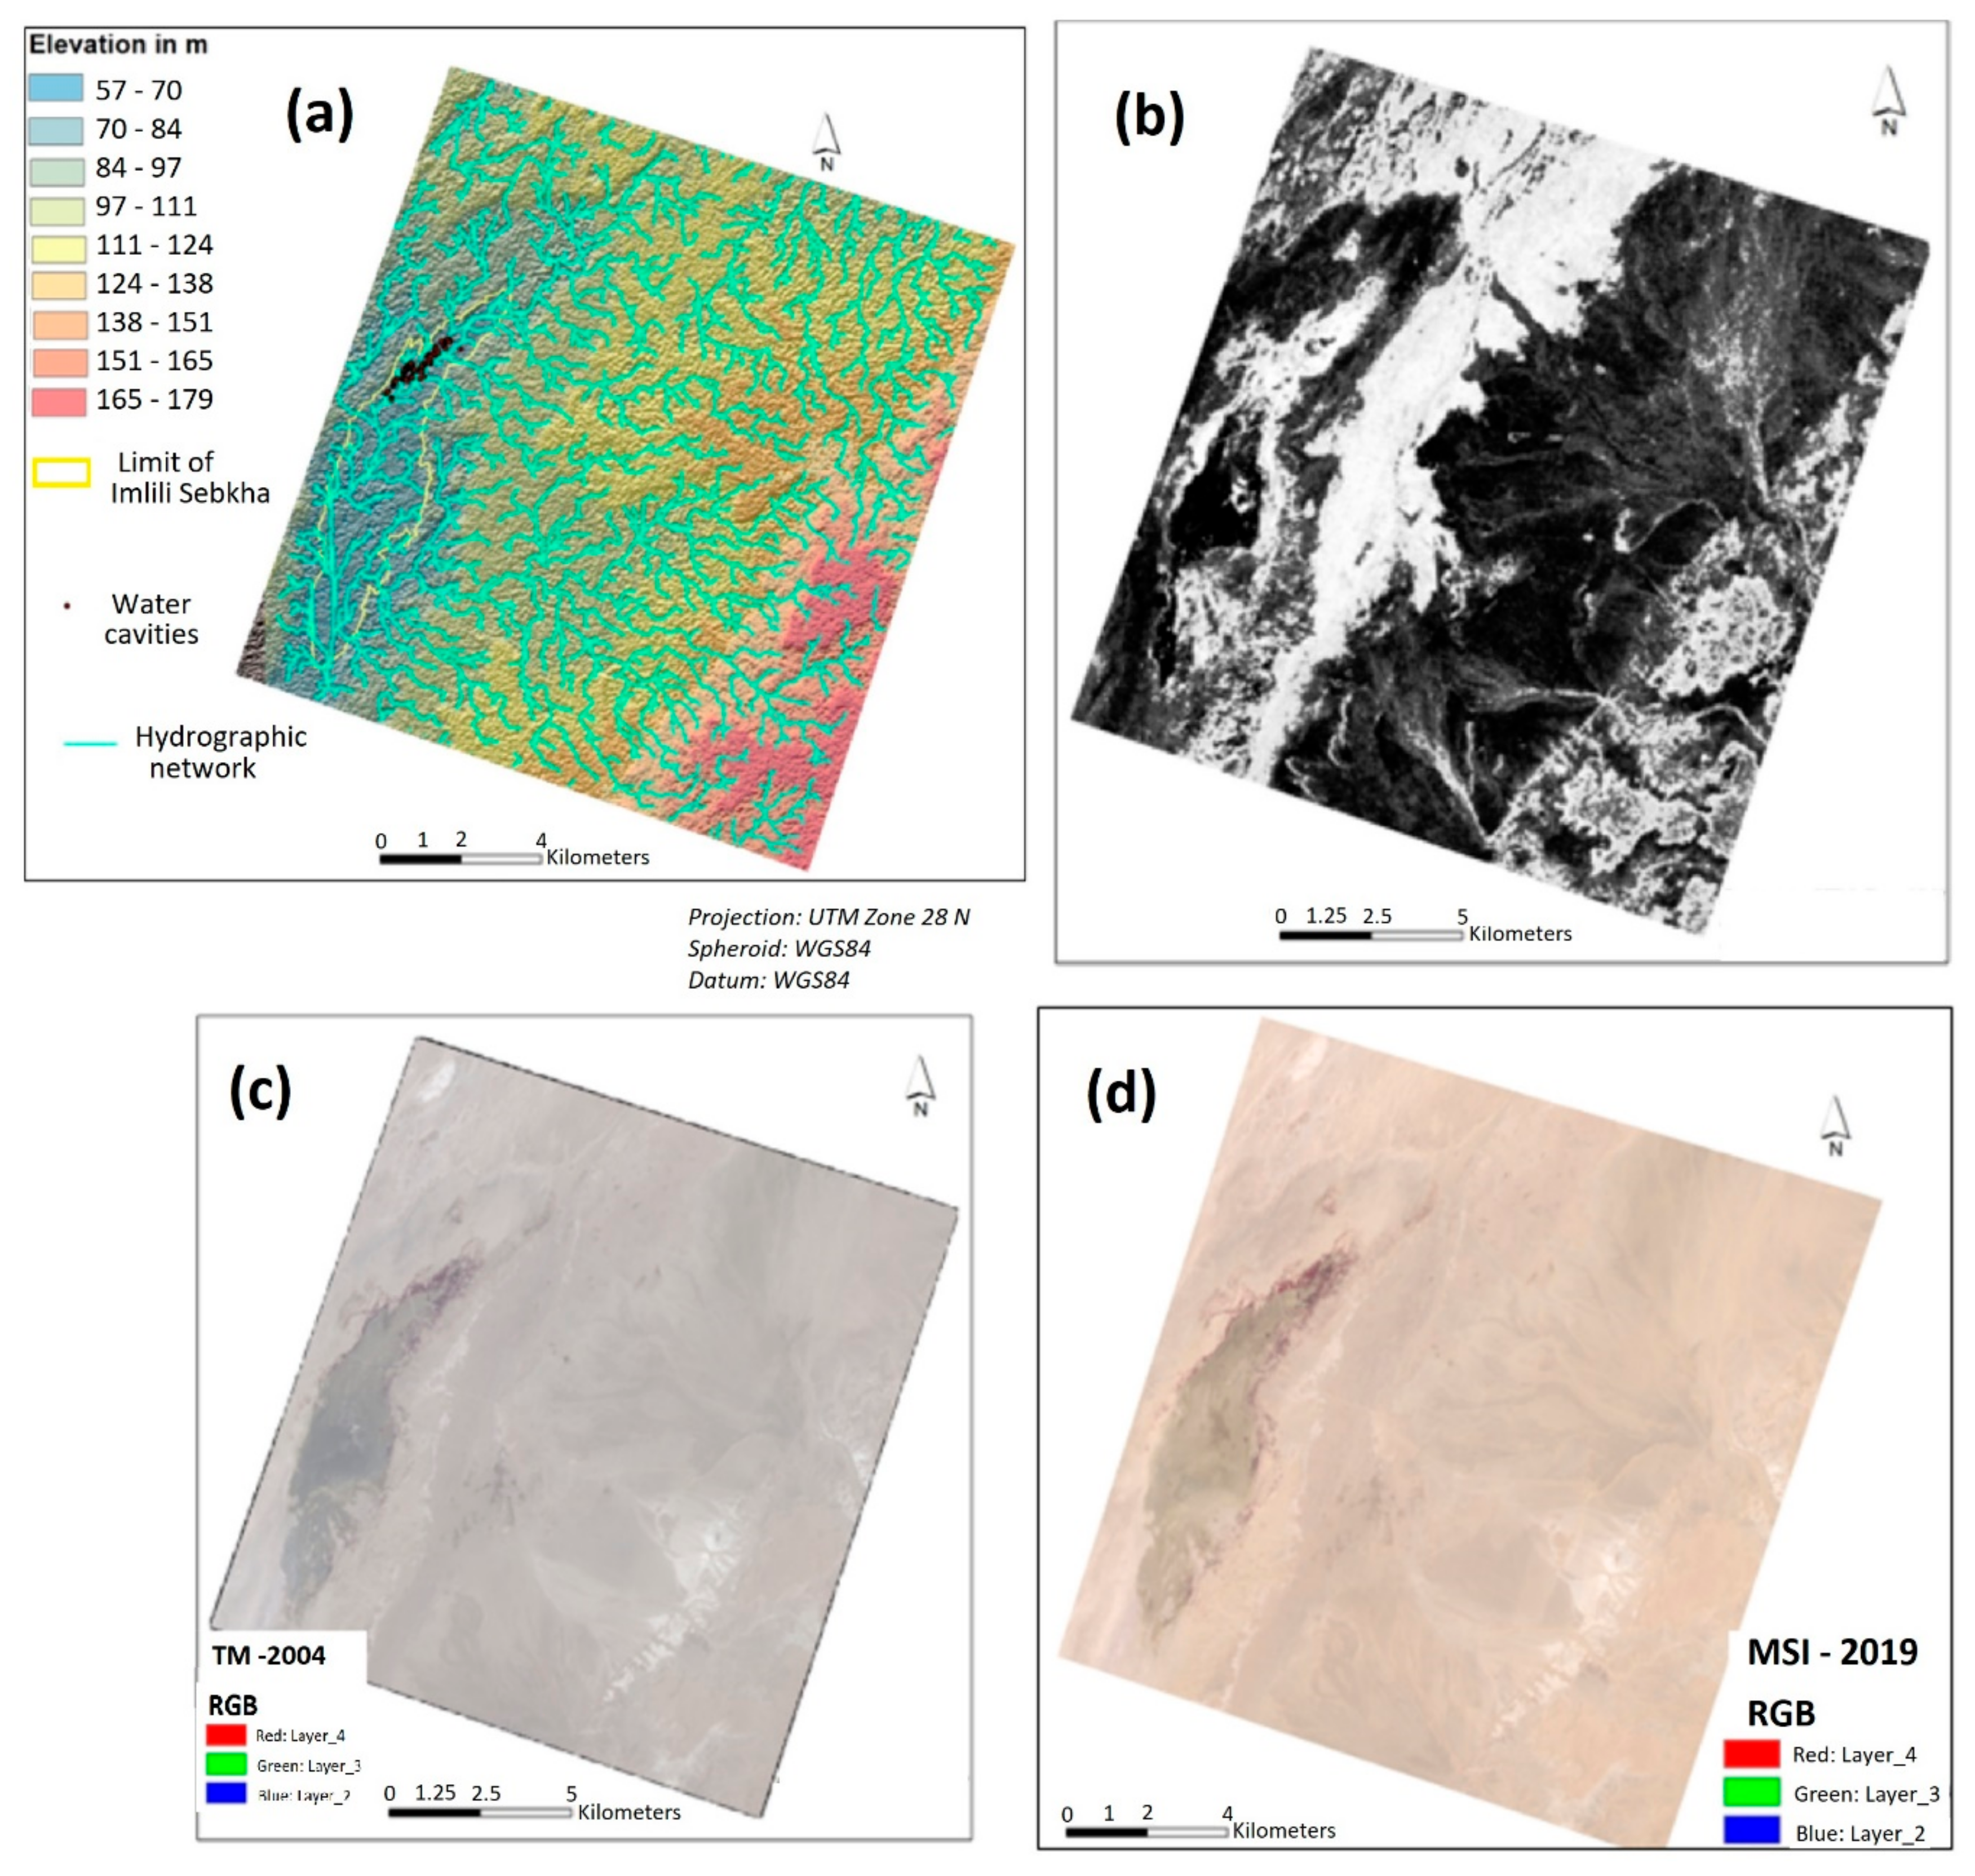
2.4. DEM, Geomorphology, Hydrology, and Geology of Imlili Sebkha

Similar to all sebkhas, Imlili Sebkha represents a dried depression in the desert. Given the composition of the water table in saltwater, sebkhas are erratically flooded by precipitation events during which they become short-lived endorheic salted lakes. Imlili Sebkha is a shallow depression that is less than 10 m deep, approximately 12 km long, and 2.5 km wide in the general direction of North-Northeast—South-Southwest (NNE–SSW). This sebkha is surrounded by sand dunes, and plants form a narrow band (20 m to 30 m long) mostly on its western and northern boundaries. Geomorphologists generally define the sandy area in the northern part of a sebkha as a flat-bottomed depression where salty soils restrict vegetation growth. Sebkhas in desert countries or arid regions represent a depression that is temporarily occupied by a generally salty lake that contains evaporite deposits. In Imlili Sebkha, the water comes not only from runoff but also from groundwater (Figure 3a). The sandy soil in the northern part of this sebkha is brick red with a fine whitish layer leading to salt crystallization. The western and northern borders of the depression are wet and show plant formation in a continuous band shape that is 20 m to 30 m wide. The northern part of this sebkha has several permanent water pockets, the bottom of which has a sandy texture and edges have sand and salt concretions [6,7,8,9,10,11,12,13,14,15,16,17,18,19,20,21,22,23,24,25,26,27,28,29,30,31,32,33,34,35,36,37,38,39,40,41,42,43,44,45,46,47,48,49]. The water in these pockets is supplied by small resurgences, and the sheet outcrops and moistens the soil of the sebkha, especially at its western and northern borders [50]. Rainwater, which is rare at these latitudes, is transported to the sebkha via streams, and the most important ones arrive on the north side. However, except for the permanent pockets in the north, the rest of the sebkha has never been in water during the on-site visits [50]. Imlili Sebkha has two features that cannot be seen in other Moroccan wetlands. Firstly, this sebkha has retained its hydrological function (a huge sebkha with permanent saltwater pockets where fish can live) up to the present, an unexplored zone from a hydrological and hydrobiological studies point of view [6]. Secondly, despite not having any connections to the sea, the water in this Sabha is very salty and may even be ‘hypersalty’. If the sea salinity rate is as high as 35 g/kg, then the salinity of the water in Imlili Sebkha varies between 50 g/kg and 70 g/kg, which is almost twice higher than that of seawater, due to the fact that “the substratum is very salty and drained the saline water from the underground network” [1]. Imlili Sebkha is a continental depression that lost its tabular structure under the marine influence. This sebhkha is part of the Meso–Cenozoic basin of Tarfaya–Laayoune–Dakhla and comprises a set of small basins that are elongated parallel to the coast and were formed during the Mesozoic period in the marine direction of the stable craton West Africa; meanwhile, the southeastern part of this sebkha is included in the domain of Oulad Dlim, which in turn belongs to the Réguibate Ridge located in the extreme south of Morocco [36]. Towards its coastal margin, the region shows a Miocene formation with lateral variations in facies and thickness and generally consists of sandy marl, lumachelles, and quartzites. The Meso–Cenozoic structural evolution of this region is mainly manifested in its brittle tectonics, which are responsible for the replaying of major at North directional: N 40° to N 50° faults and smaller N 70° directional faults, respectively that have influenced the regional tectonic evolution further north of the Tarfaya–Laayoune–Dakhla basin. The geological characteristics of the Imlili Sebkha benefit the concentrations of industrial rocks and minerals, such as lumachellic limestones, marls, clays, gypsum, and siliceous sands [50].

2.5. Spatial Datasets, PreProcessing, and Feature Extraction

2.5.1. Optical Imagery

The images were selected depending on their availability during the dry period between April and September for 10 years starting from 1984. The spectral parameter inputs were extracted from a sequence of 90, 45, and 145 Landsat-5/TM images from 1984, 1994, and 2004, respectively, 107 Landsat-8/OLI images from 2014, and 133 Sentinel-2 images from 2017 and 2019 (Table 2). A customised JavaScript cloud masking and compositing script algorithm was implemented in GEE to suppress different types of clouds and noises and to generate a multispectral composite cloud-free image. The ‘raw’ scenes in GEE contain scaled radiance imagery with digital numbers (DNs). Using the coefficients, the conversion of DNs to at-sensor radiance was done using a linear transformation [37,38]. We used the top of atmosphere (TOA) or at-sensor reflectance conversion algorithm, a linear transformation that covers for solar elevation and seasonally variable Earth–Sun range. The bands were used to extract water, soil salinity, and wet/dry areas within the spectral bands of solar reflectance. The raw images of TM/Landsat-5 and OLI/Landsat-8 were stored in DN form (QCAL), which must be transformed to explicit surface reflectance before processing by using the GEE algorithm. All images were subjected to radiometric calibration and atmospheric correction. Radiometric calibration turned the original QCAL into the radiance of TOA. For a specific wavelength λ, the TOA radiance Lλ and reflectivity ρλ were computed by using Equations (1) and (2), respectively, for each band based on the metadata of the images [37].
L λ = L M A X   L M I N × Q C A L   Q C A L M I N / Q C A L M A X Q C A L M I N + L M I N
ρ λ   = ( π L λ d 2 ) / E S U N λ cos θ
where λ is the band number, LMAX is the spectral radiance scaled to QCALMAX, LMIN is the spectral radiance scaled to QCALMIN, QCALMAX is the maximum quantized calibrated pixel value (corresponding to LMAX) in DN (255 for TM and 65.535 for OLI), QCALMIN is the minimum quantized calibrated pixel value (corresponding to LMIN) in DN (1 for both TM and OLI), and QCAL is the quantized calibrated pixel value in DN [18]. All these parameters can be found in the metadata file (MTL) included in the TM/OLI images. In addition, d2 denotes the inverse squared relative Earth–Sun distance, ESUNλ denotes the mean exoatmospheric solar irradiance, and θ represents the solar zenith angle in degrees.
The permanent water cavities in Imlili Sebkha are characterized by high-salinity water. Therefore, to extract the features of these cavities, we developed a 2D feature space (water index, salinity index). In most situations, water exhibits a higher visible band reflectance compared with infrared bands [19,20]. The surfaces of nonwater objects usually do not have this spectral similarity, especially in desert areas [39,40,41,42,43]. Therefore, we used the water index developed by Xiong to optimize the separability of water and nonwater pixels [45]. This spectral index is called the normalized ABWI, which can be obtained from TM images (Equation (3)), OLI images (Equation (4)), and MSI (Equation (5)).
A B W I T M = ρ 1 + ρ 2 + ρ 3 ρ 4 + ρ 5 + ρ 7 ρ 1 + ρ 2 + ρ 3 + ρ 4 + ρ 5 + ρ 7
where ρ1, ρ2, ρ3, ρ4, ρ5, and ρ7 represent the blue, green, red, Near-Infrared (NIR), short wave infrared (SWIR1), and SWIR2 band reflectances, respectively.
A B W I O L I = ρ 1 + ρ 2 + ρ 3 + ρ 4 ρ 5 + ρ 6 + ρ 7 ρ 1 + ρ 2 + ρ 3 + ρ 4 + ρ 5 + ρ 6 + ρ 7
where ρ1, ρ2, ρ3, ρ4, ρ5, ρ6, and ρ7 represent the coastal aerosol, blue, green, red, NIR, SWIR1, and SWIR2 band reflectances, respectively.
A B W I M S I = ρ 2 + ρ 3 + ρ 4 ρ 8 + ρ 11 + ρ 12 ρ 2 + ρ 3 + ρ 4 + ρ 8 + ρ 11 + ρ 12
where ρ2, ρ3, ρ4, ρ8, ρ11, and ρ12 represent the blue, green, red, NIR, SWIR1, and SWIR2 band reflectances, respectively.
Various spectral salinity indices have been developed for detecting and mapping salt objects [45,46,47,48,49,50,51]. For instance, the normalized difference salinity index (NDSI), which was developed from SWIR1 for Landsat data (1.55–1.75) and SWIR2 (2.08–2.35), has been widely used in the literature given its ability to reflect the salinization level of the soil [45,51]. However, this index becomes ineffective when the soil is covered with vegetation [48]. Several studies have shown that the normalized difference vegetation index (NDVI) gradually decreases along with an increasing surface soil salinity [50]. Nevertheless, this phenomenon was not observed in the study area because the most important characteristic of vegetation resided in the presence of a mixed belt (Phragmites australis, Juncus rigidus, and Arthrocnemum macrostachyum) [52], which is approximately 30 m wide and is continuous along the wet edges of the west and north sides of the northern part of the prospected wetland. The salinity index can be obtained from TM images (according to Equation (6)), OLI images (Equation (7)), and MSI (Equation (8)).
N D S I T M = ρ 5 ρ 7 ρ 5 + ρ 7
N D S I O L I = ρ 6 ρ 7 ρ 6 + ρ 7
N D S I M S I = ρ 11 ρ 12 ρ 11 + ρ 12
The maximum and minimum values of these indices were calculated before they were transformed into nondimensional sequences as follows:
I n d e x N D = I n d e x I n d e x m i n I n d e x m a x + I n d e x m i n
where Indexmin is the minimum index value, Indexmax is the maximum index value, and IndexND is the normalized index value.
For the extraction of permanent water cavities, we developed an index on the basis of the properties of these cavities, namely, their water capacity, high salinity, and the humidity of the bordering space.
We also drew a scatter plot (Figure 4a) to analyze the spectral space generated by the indices ABWI and NDSI. After evaluating the statistical regression results, we found that ABWI and NDSI had a positive linear correlation: 10. The equation for the regression is
N D S I =   79.97 + 1.67 × A B W I
The correlation coefficient is 0.66 (Figure 4a), which indicates that soil salinity and ABWI increased along with soil wetness. The soil wet/soil salt process was clearly reflected in the (ABWI, SI) feature space.
The saltwater cavity index (SWCI) was computed as follows by using optical radiometric data:
S W C I =   N D S I N D 2 + A B W I N D 2 ,
where NDSIND is the nondimensional salt index obtained from Equation (9), ABWIND is the nondimensional water index obtained from Equation (9), and SWCI is the saltwater cavity presence index.

2.5.2. SAR Imagery

Radar input variables were produced at a spatial resolution of 10 m (Table 2) from a series of 211 Sentinel-1 SAR C-band Level-1 GRD images. The radar images available in GEE were in upward and downward orbits and were acquired in interferometric-wide (IW) mode with average incidence angles ranging from 30 to 40. The data were subsequently preprocessed by using the Sentinel-1 toolbox, which can perform radiometric calibration, radiometric terrain flattening, speckle filtering, and range Doppler terrain correction [37].
The fastest and most useful index that can be extracted from intensity SAR data is the MNDPI, which is measured from two VH and VV bands that were taken for one image by Sentinel-1 satellites between 10 April and 10 August in 2015 and 2019. This index was transformed and smoothed by using a 7 × 7 pixel refined Lee speckle reduction filter and Equation (12).
M N D P I = V H V V V H + V V ,
where VH and VV are the vertical–horizontal and vertical–vertical polarization bands obtained from the Sentinel-1 sensor. The outputs of this index ranged from −1 to 1. Given that the VV in the study area was generally greater than VH, the MNDPI ranged from −0.95 to 0.
The MNDPI was chosen for two reasons. Firstly, the permittivity of dry matter highly contrasted that of water, and MNDPI has been proven to be useful in discriminating various levels of soil moisture [53,54]. Secondly, MNDPI simulated the difference index of microwave polarization introduced in [55,56,57,58], thereby highlighting its responsiveness to moisture soil states [58]. This index also had considerable capacity for enhancing SAR-based land cover and sensitivity to some specific parameters that characterize vegetation biomass, snow depth, or equivalent snow water [59].
To extract permanent water cavities with high precision, we developed a new index based on the spectral of radiometric passive properties of the optical sensor and polarization of radiometric active properties of SAR sensor.
For further study, the spectral space was formed by two indices. The first index was the spectral from Sentinel-2 MSI, which was a radiometric passive optical sensor (SWCI), whereas the other index was the polarimetric from Sentinel-1, which was a radiometric active dual-polarization C-band SAR GRD sensor (MNDPI). Figure 4 presents the scatter plot chart. SWCI and MNDPI show a significant positive linear relationship after the following quantitative regression on Equation (13):
S W C I =   1.79 + 0.64 × M N D P I
The correlation coefficient was 0.87 (Figure 4b), which suggested that when saltwater was present in the permanent cavities, the surface moisture gradually increased along with MNDPI. The relationship between surface moisture and the presence of saltwater in the cavity hole was clearly reflected in the (MNDPI, SWCI) feature space.
We combined the radiometric SAR polarization index (MNDPI) with radiometric optical index (SWCI) to form the new SAR/Optic SWCI (SOSWCI), which we used to extract the holes filled with saltwater with high precision Equation (14).
S O S W C I =   M N D P I N D 2 + S W C I N D 2 ,

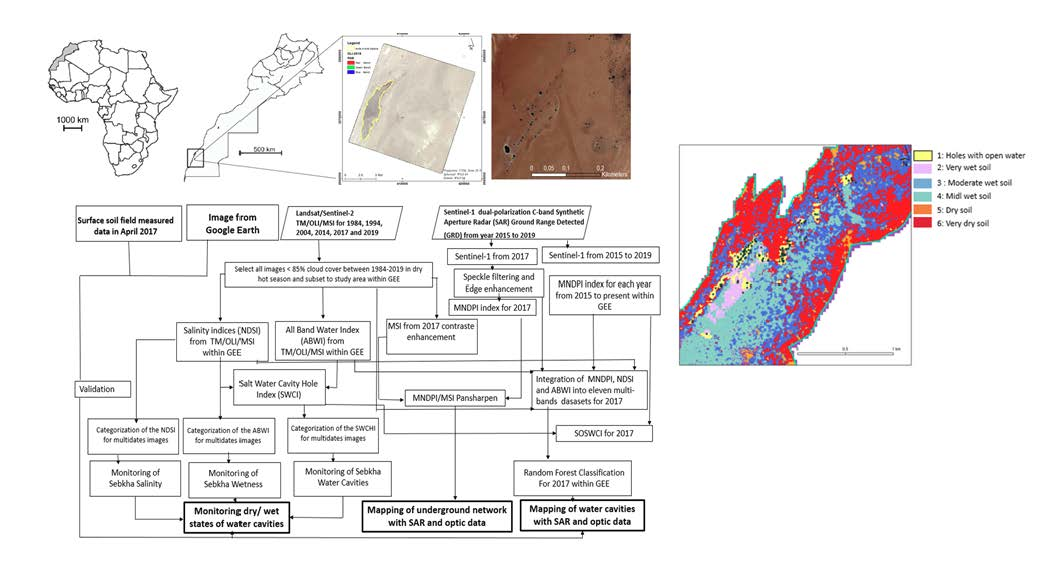
2.6. Radar/Optical Data Fusion

Merge processes play a crucial role in remote sensing due to their capability to improve visual quality and translation. These processes are also known as image spatial enhancement processes where panchromatic images with high spatial and low spectral resolutions are merged with multispectral images with low spatial and high spectral resolutions to produce multispectral images with high spatial and spectral resolutions [59,60,61,62]. Apart from optical imaging, radar has also been commonly used in woodland, urban, and agricultural settings. Several forestry studies show that the C-band is very resistant to leaves and small branches and has a higher VH than VV and Horizontal Transmit—Horizontal Receive Polarisation: HH. However, radar has been rarely applied in arid and desert settings [63,64,65]. Optical sensors define the chemical composition of a surface object, while microwave scattering is influenced by structural elements and object surface roughness. SAR polarization is a determinant factor in water detection [66,67,68]. Previous studies [69,70,71] have shown that HH-polarized images are more adequate for water detection compared with VV- or cross-polarized VH images [25] because HH polarization yields the highest discrimination in backscatter values between dry and wet soils and between smooth and rough soils. Given that the available image in this study had an intensity VV and VH polarization, we used the MNDPI index, which has proven useful in discriminating different levels of soil moisture [53,54]. MNDPI was selected instead of VV or VH for the merge process with Sentinel-2 MSI multispectral. Three popular merging algorithms, namely, principal component analysis (PCA) [72,73], intensity hue saturation [74,75], and wavelet transform [76,77], were used to downscale the OLI multispectral band. The best result was obtained from the PCA merging algorithm. PCA is a statistical procedure that converts a multivariate set of correlated various parameters into a set of uncorrelated linear combinations of the original variables [73]. For the Sentinel-2 MSI image from 2017, the first principal component (PC) band 1 was substituted by a high-resolution band (i.e., the MNDPI band), which was scaled to match PC band 1 to avoid distorting the spectral data. A reverse transformation was applied afterwards. By using the bi-cubic convolution method, the multispectral data were automatically resampled to the size of high-resolution pixels. After merging, the resulting image contained the characteristic of a high-spatial resolution image (i.e., the MNDPI channel) and the high-spectral resolution of Sentinel-2 MSI.

2.7. Random Forest Classification within GEE

Random forests (RF) are nonparametric classification trained algorithms that can be described as an improved version of bagging (a commonly used ensemble classifier) combined with a voting process [78,79]. RFs have excellent computational efficiency due to their bootstrap aggregation, which creates (majority vote) and averages a large collection of decorrelated decision trees to produce a prediction or classified output. RFs also demonstrate a promising classification accuracy for multisource data in the field of remote sensing [79,80], given that multisource data are too complex to be classified by using a parametric decision rule [81]. Several studies have also highlighted the advantages of RF in land cover classification. Specifically, this algorithm allows users to choose the number of trees, the number of variables that each tree uses for splits, the best variable to split, and the splitting and stopping rules [82,83,84]. RFs are tuned by changing the number of variables being used by each tree and by predicting a validation set. In our cross-validation scheme, the model was trained on 90% of the dataset and validated by using 10% of the dataset. GEE provides many machine-learning algorithms, including RF.
Figure 5 presents an overview of the key methodological measures used in the analysis. Firstly, we preprocessed satellite reflectance datasets in GEE to extract and monitor the water (ABWI) and salinity (NDSI) indices from 1984 to 2019 for every 10 years. Secondly, we defined a new index for water cavities signal detection by studying the correlation between the salinity and water indices. This new index measured the cavity presence signal filled with saltwater, which we called SWCI, and monitored the presence or absence of saltwater in the studied cavities from 1984 to present. Thirdly, we extracted a soil moisture index (MNDPI) in GEE from dual-polarization C-band SAR Sentinel-1 to monitor surface wetness from 2015 to present. This polarimetric index showed a high correlation with the optical SWCI, thereby allowing us to define another index called SOSWCI that combined the dielectric properties with the spectral properties. SOSWCI was applied only for the optical and radar images obtained in April 2017, which corresponded to the date of collecting the in-situ data used for the validation. These images were also used to merge passive and active radiometric data into one image, which we used to explore the hydrologic operation mode of Imlili Sebkha. The last image was used in the nonparametric classification process with RF as a decision rule.

3. Results

This section presents the results obtained from the optical radiometric passive data. We start by monitoring the soil salinity in Imlili Sebkha and studying the changes in NDSI from 1984 to present. We then monitored the surface wetness of the sebkha by studying the changes in ABWI. We eventually monitored the wet/dry state of the sebkha saltwater cavities by using a newly defined index, Salt Water Cavity Hole Index (SWCHI), and by referring to the optical data. We then presented the results obtained from the radiometric active SAR data. In this active domain, we used MNDPI to monitor the changes in the surface moisture state, and we combined this index with another index extracted from the optical domain to obtain SOSWCI, which mixed passive radiometry with active radiometry. SOSWCI will not be used for the monitoring but rather for increasing the precision of the wet/dry state of the sebkha saltwater cavities in 2017, during which the field data were collected. A work based on the fusion of radar and optics was also performed to map the underground network and to understand the hydrologic operation mode of the Sebkha.

3.1. Imlili Sebkha Change Mapping Obtained from Optical Data

3.1.1. Monitoring of Sebkha Surface Soil Salinization

We obtained the soil salinization data of Imlili Sebkha for years 1984 to 2019 from the Landsat-5 TM images for years 1984, 1994, and 2004 (Figure 6a–c, respectively) and the Landsat-8 OLI image for 2014 (Figure 6d) and then derived soil salinization information from Sentinel-2 MSI (Figure 6e). We also studied the spatial and temporal variations in the soil salinization between 1984 and 2019.
The correlation between the sample points of saltwater cavities (corresponding to the field-measured salt content collected from 14 April 2017 to 16 April 2017 during a field survey of the sites) and the NDSI attributes of the Sentinel-2 MSI image was analyzed. The Spatial Distribution R2 correlation between the field-measured salinity of these cavities and the extracted remote sensing index NDSI for MSI was 0.86 (Figure 6f).
The soil salinization index of Imlili Sebkha was divided into nonsalinization, mild salinization, moderate salinization, and extreme salinization according to the saline soil grading level (Table 3) from 1984 to 2019 (Figure 7a–e). Figure 7 shows a steady increase in the area with extremely salinized soil between 1984 and 2019, whereas Figure 7f shows that cavities with severe salinization were almost absent from 1984 to 1994 (Figure 7a,b,f). The number of cavities with severe salinization also increased from 1994 to 2014 (Figure 7b–d) and stabilized between 2014 and 2019 (Figure 7f).

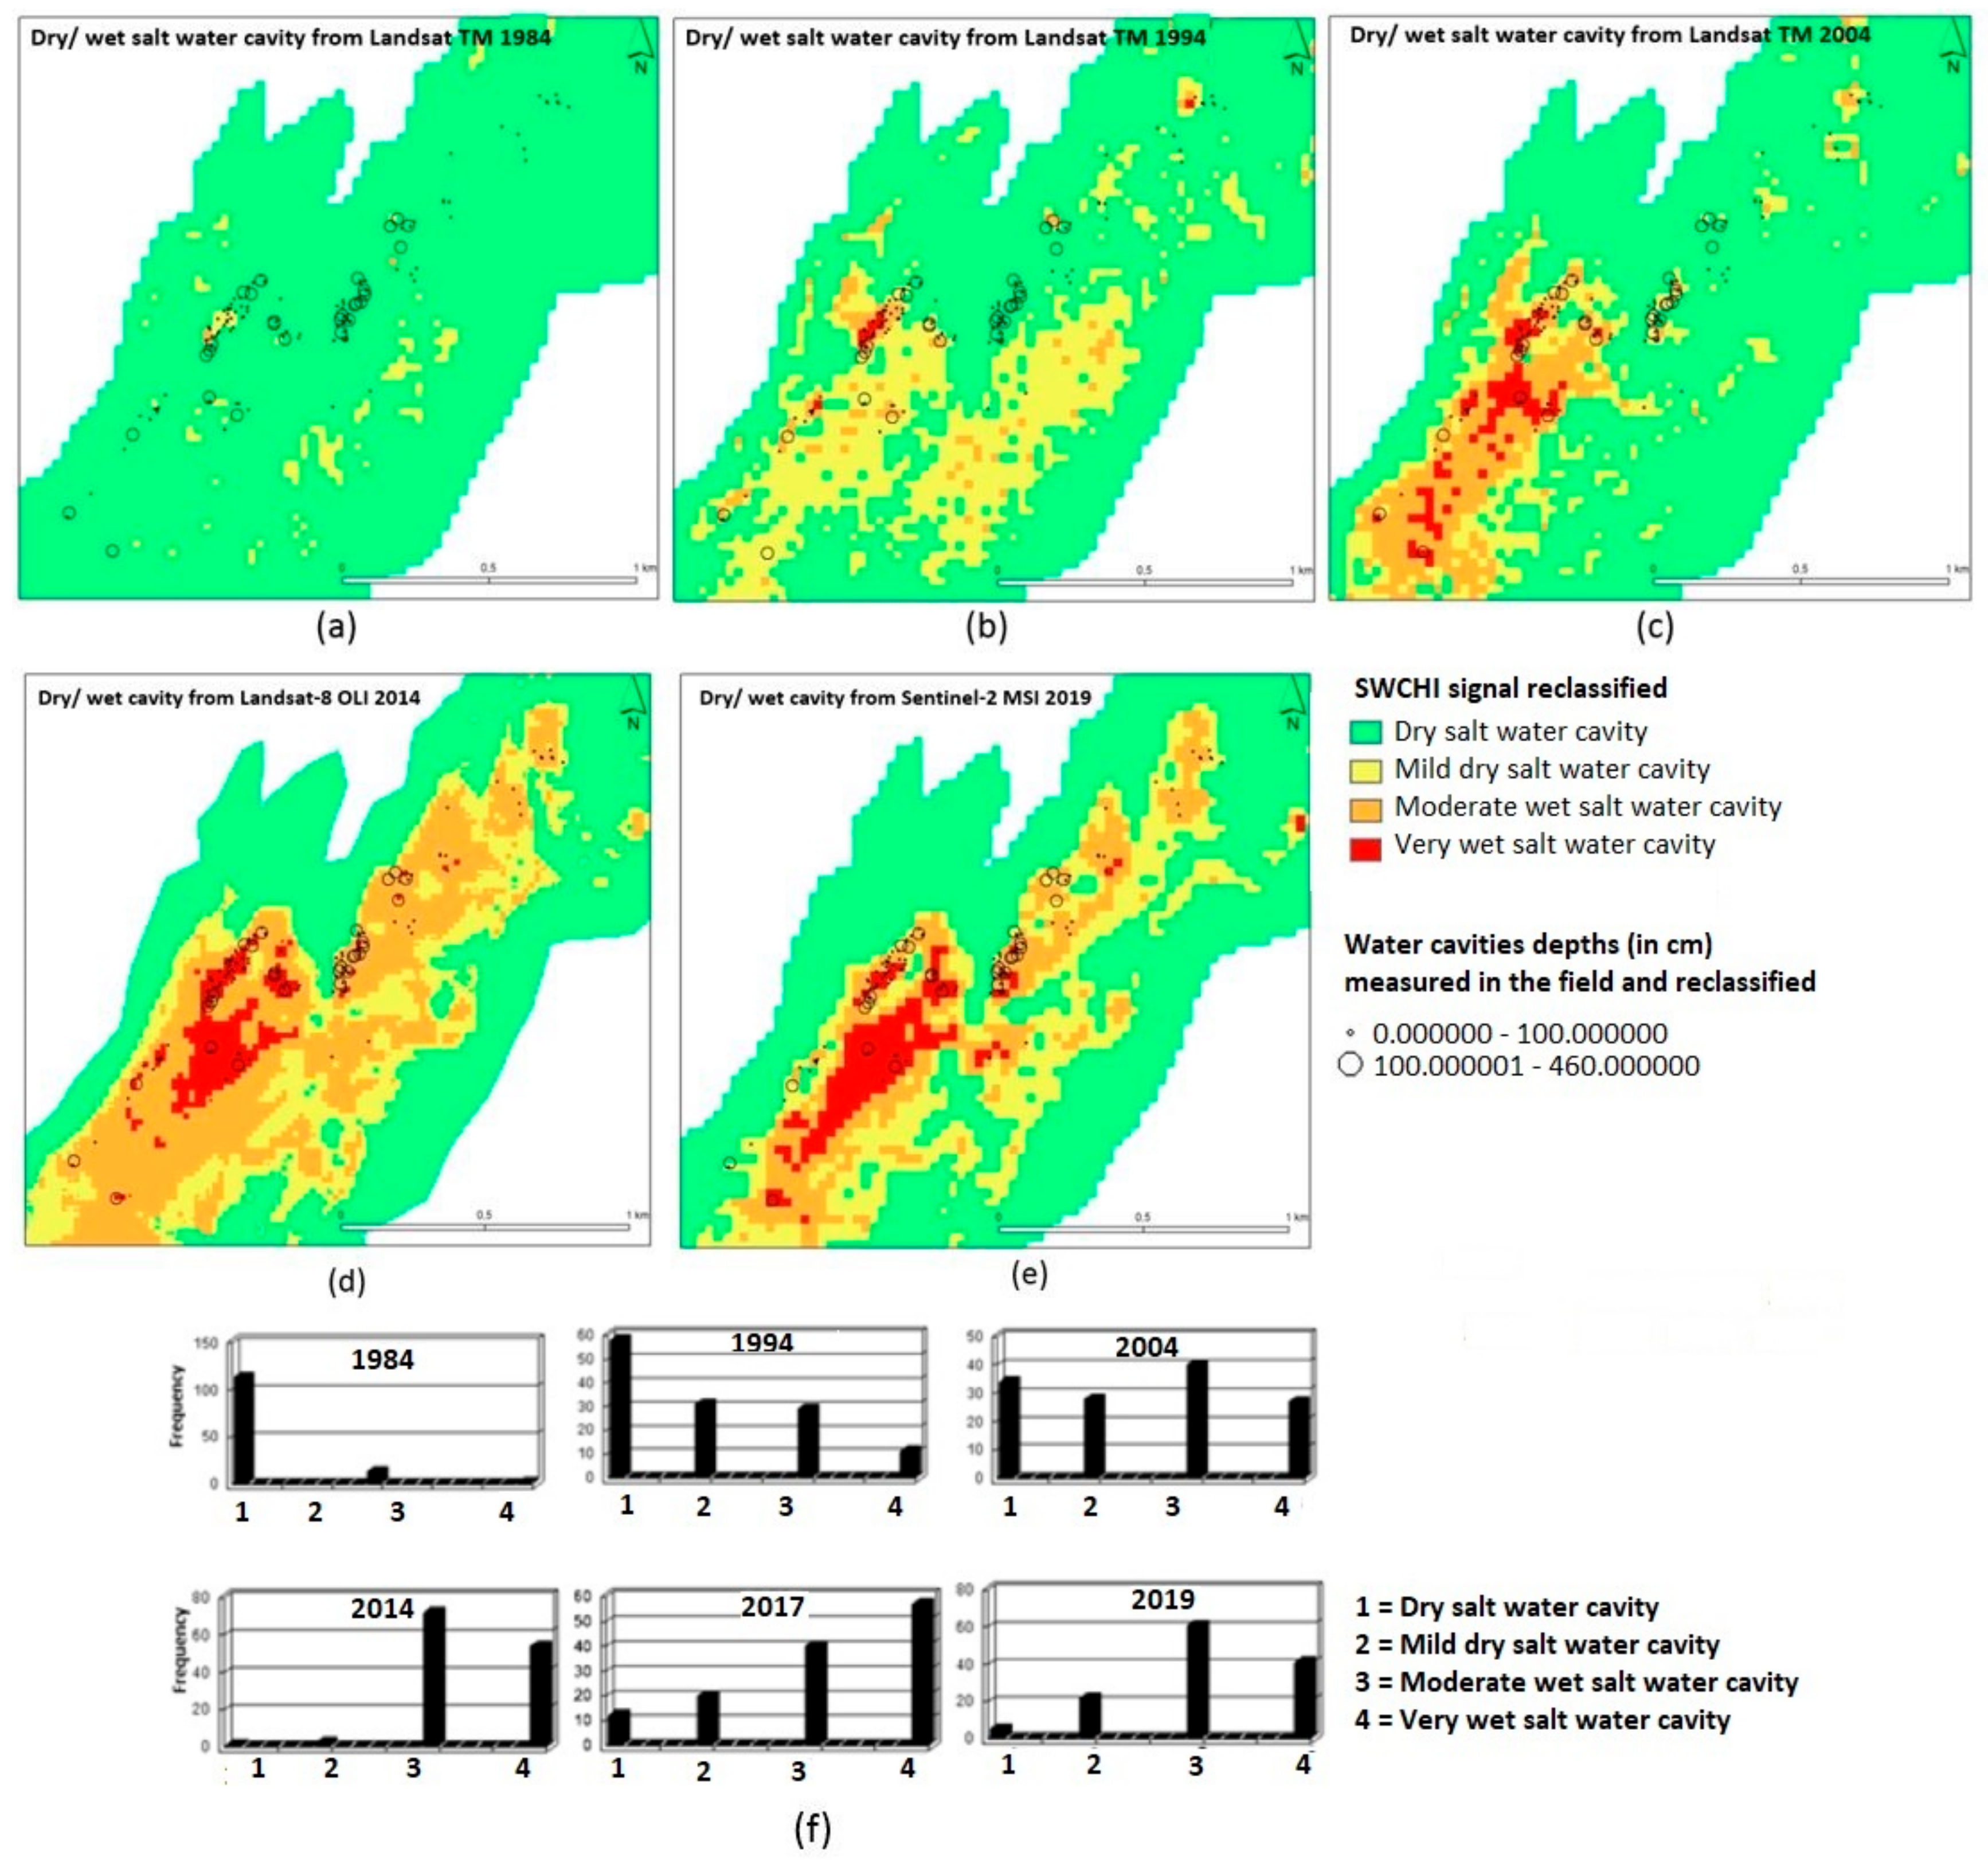
3.1.2. Monitoring Wet/Dry Cavity States Using SWCI

We collected data on the wet/dry states of permanent saltwater holes in Imlili Sebkha from 1984 to 2019 by calculating SWCHI from the Landsat-5 TM images taken on 1984, 1994 and 2004 (Figure 8a–c) and the Landsat-8 OLI image taken on 2014 (Figure 8d). We also determined the presence or absence of saltwater signals from Sentinel-2 MSI (Figure 8e). Figure 8a shows that all holes in the sebkha were dry in 1984 except for some moderately wet holes. The same trend can also be clearly seen in Figure 8f. Figure 8 classifies the soils of Imlili Sebkha into four grades according to their state of wetness and salinity (i.e., dry, mild, moderately wet, and very wet salt water cavities) from 1984 to 2019 (Figure 8a–e). Figure 8 shows that the area of very wet saltwater cavities steadily increased from 1984 to 2019, whereas Figure 8f shows an abrupt change in these cavities from dry to very wet after 1994, which was followed by an increase in the moderately wet and very wet states from 2004 to 2019 (Figure 8c–e). This finding indicates that the very wet state of holes steadily increased from 1984 to 2014 (Figure 8f). However, in 2019, the number of holes filled with saltwater slightly decreased (Figure 8f).

3.2. Imlili Sebkha Change Mapping Obtained from SAR Data

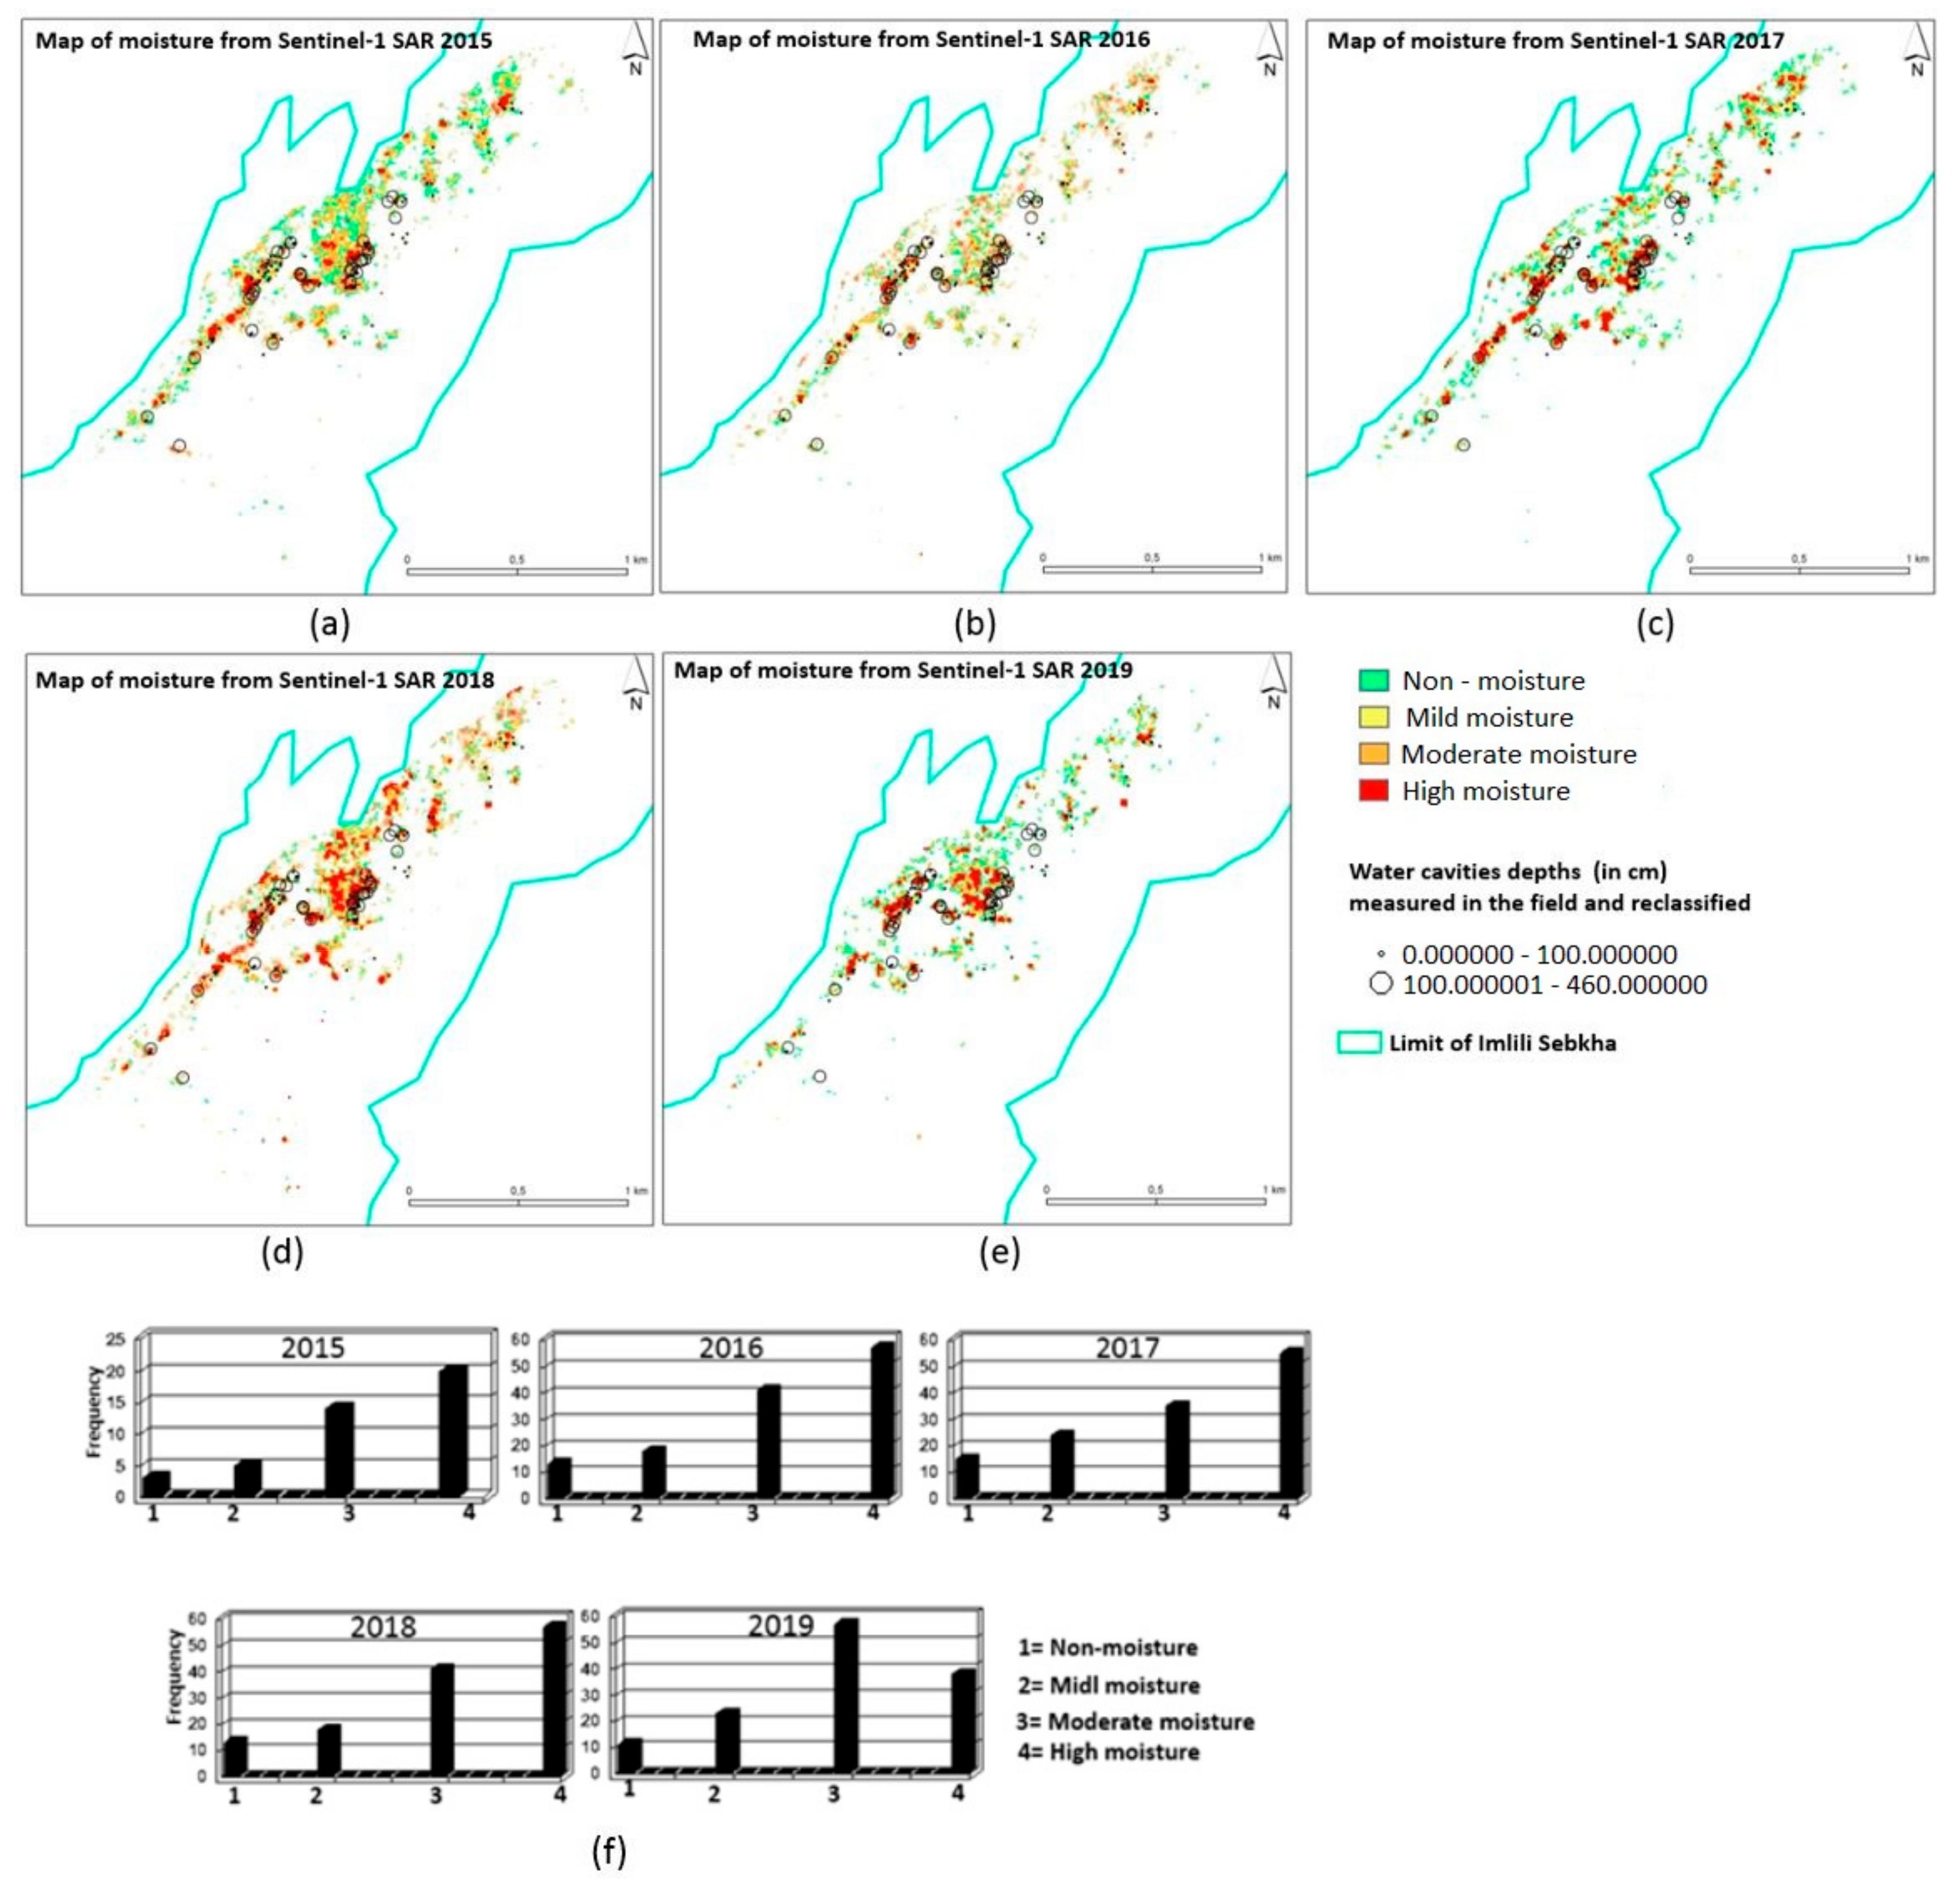
Monitoring of Saltwater Cavity Moisture State Using MNDPI

The soil moisture information from Imlili Sebkha was evaluated by calculating the MNDPI index from the Sentinel-1 SAR C-band Level-1 GRD image for 2015 to 2019. The spatial and temporal soil moisture patterns from the MNDPI signal were analysed. The moisture map was generated by reclassifying the MNDPI signal into four classes (Figure 9a–e), and the moisture statistics of the saltwater cavities were extracted (Figure 9f). The results obtained from the radar images were highly precise because the radar signal was highly sensitive to the ground geomorphology. Near the water cavities, the radar managed to detect a micro relief as denoted by the red dots in Figure 9a–e. Moreover, the MNDPI index showed high sensitivity to humidity as indicated by its maximum signal at the water cavities. These two factors improved the radar detection efficiency of water cavities, thereby making our results more accurate than those obtained by optical sensors. We also observed a similar moisture behaviour from 2015 to 2018, but in 2019 we observed a significant decrease in the wettest wells (Figure 9f).

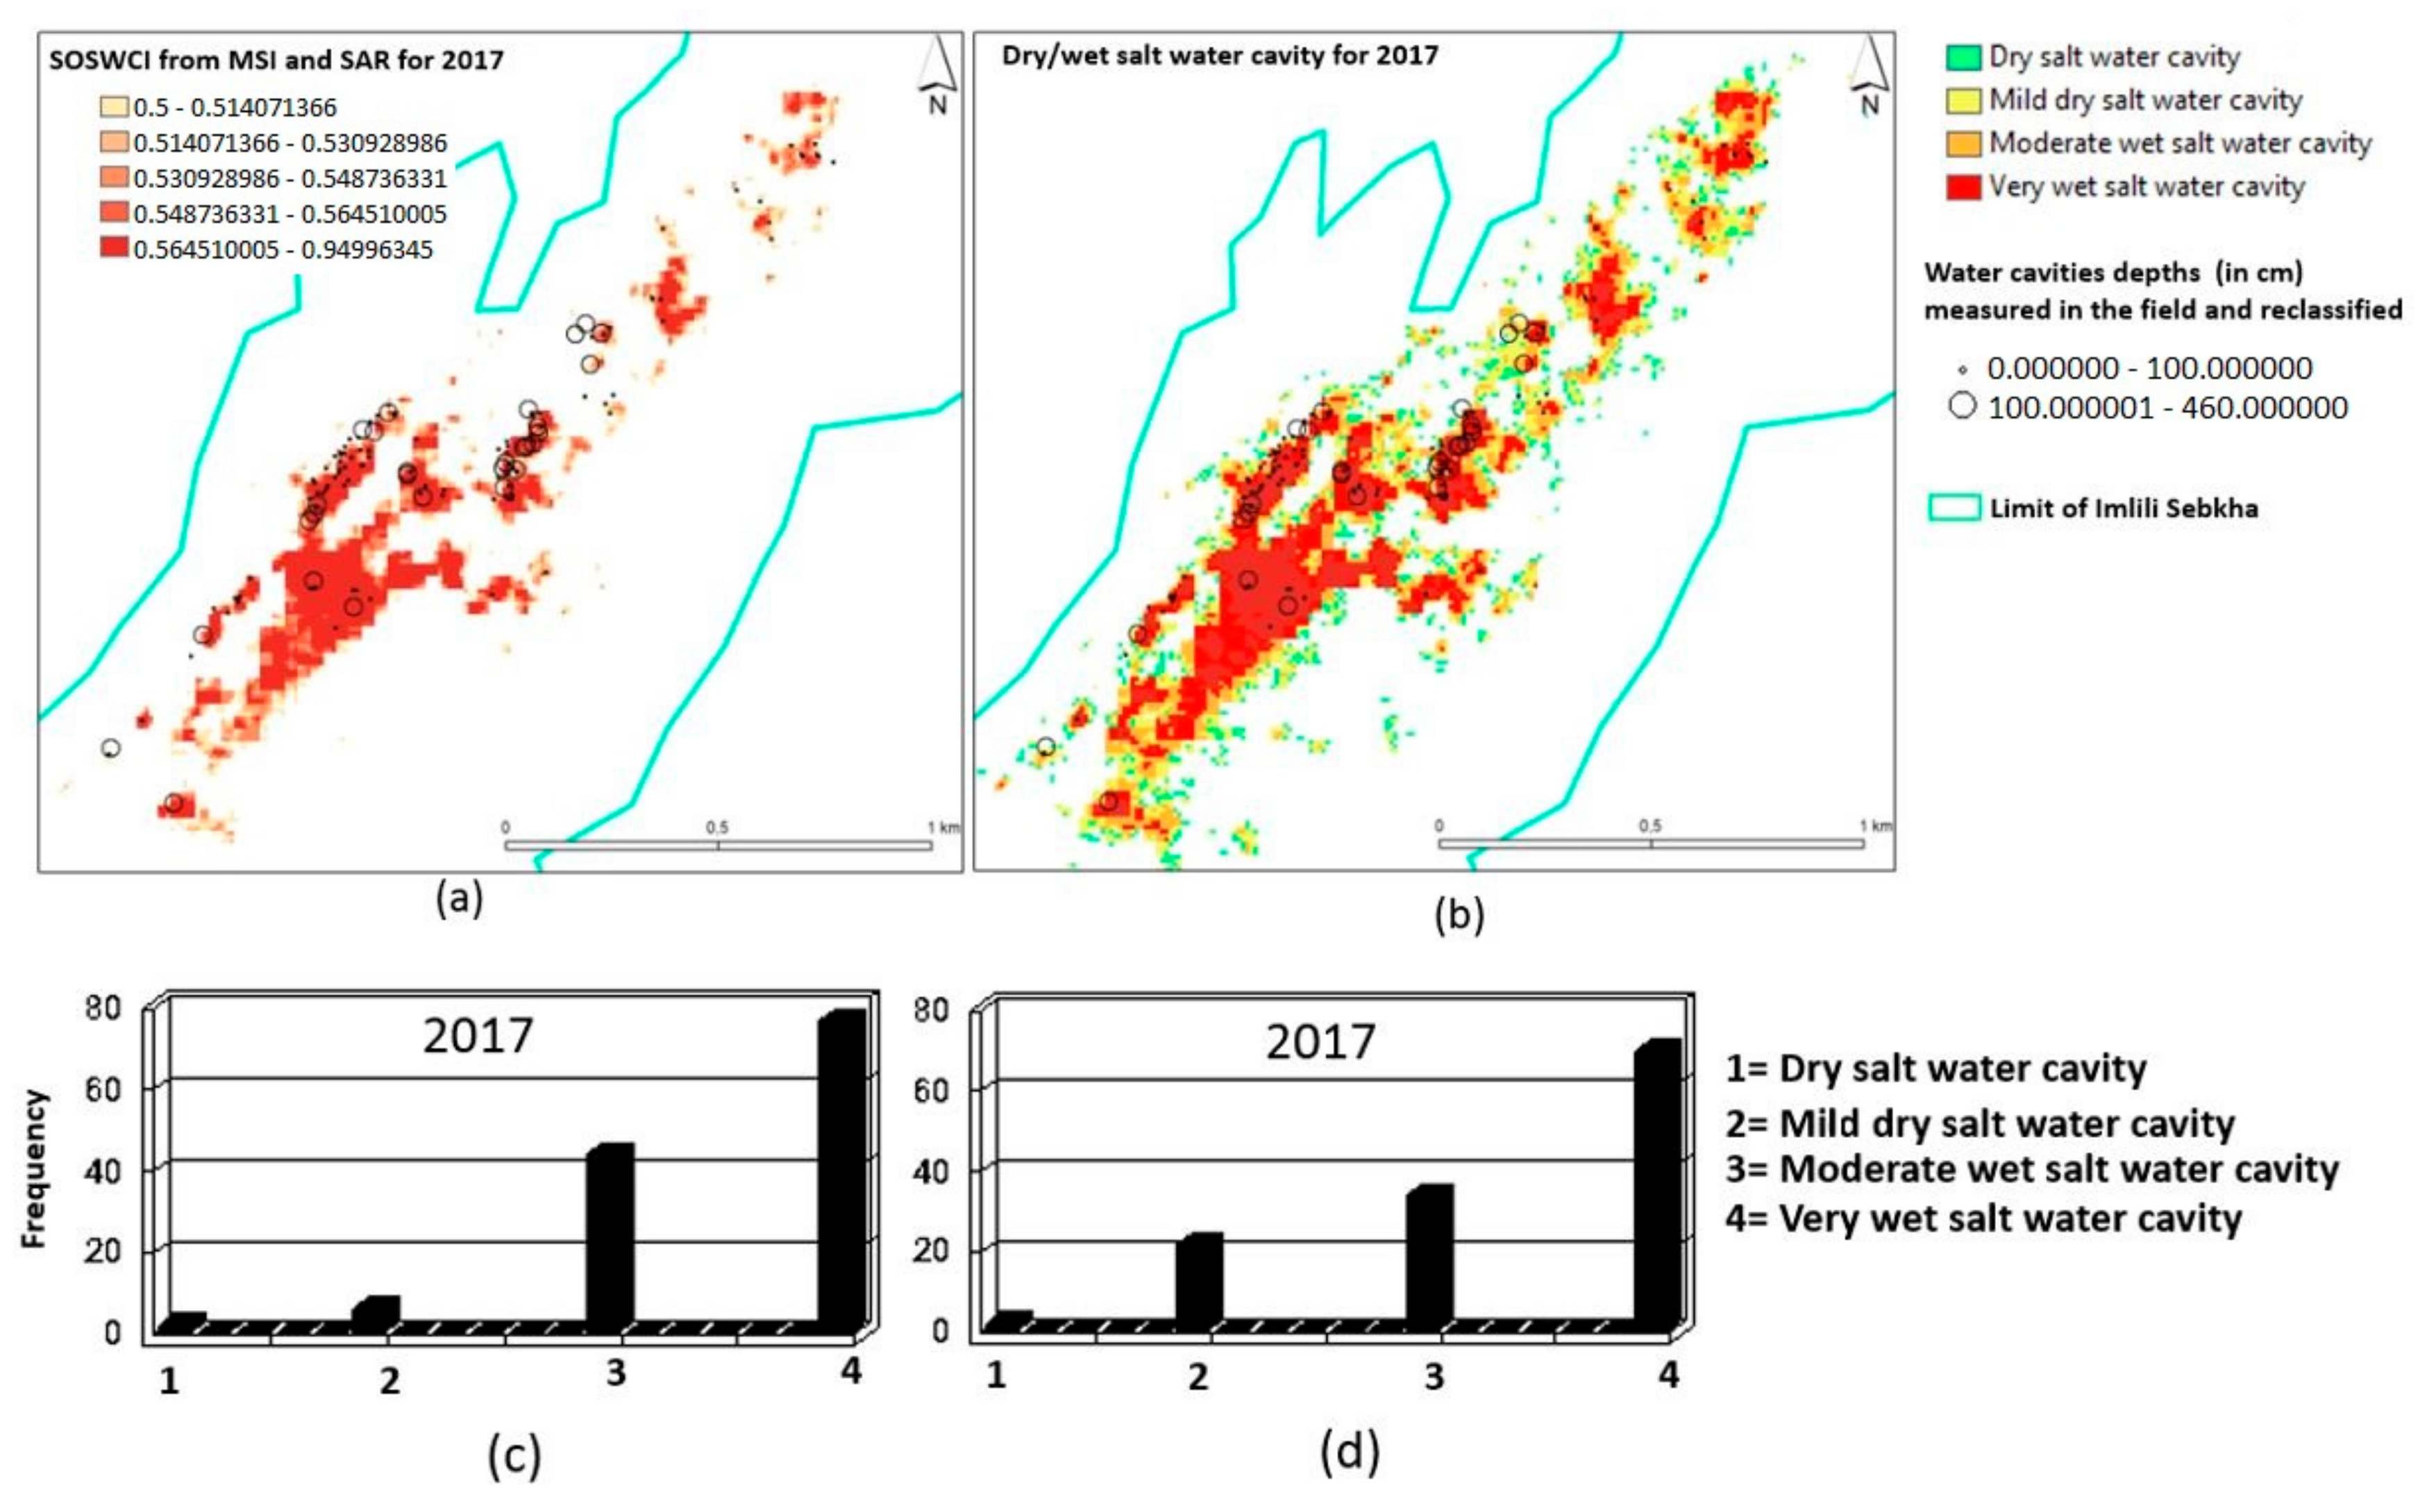
3.3. SAR/Optic Collaboration for Mapping Saltwater Cavities for 2017

3.3.1. Mapping of Wet/Dry Cavity States Using SOSWCI

To accurately detect wet or dry cavities, we developed SOSWCI, which combines the spectral indices of wetness (ABWI) and salinity (NDSI) extracted from optical images with the moisture index (MNDPI) extracted from the radiometric SAR polarization intensity of radar images. Given that both the radar and optic images must be taken on the same date, we selected 2017, during which the data were collected in the field. Compared with the results obtained from the radar moisture index alone (Figure 9f), the result obtained from the index that combined radar and optics was closer to the results obtained from the field (Figure 10c,d).

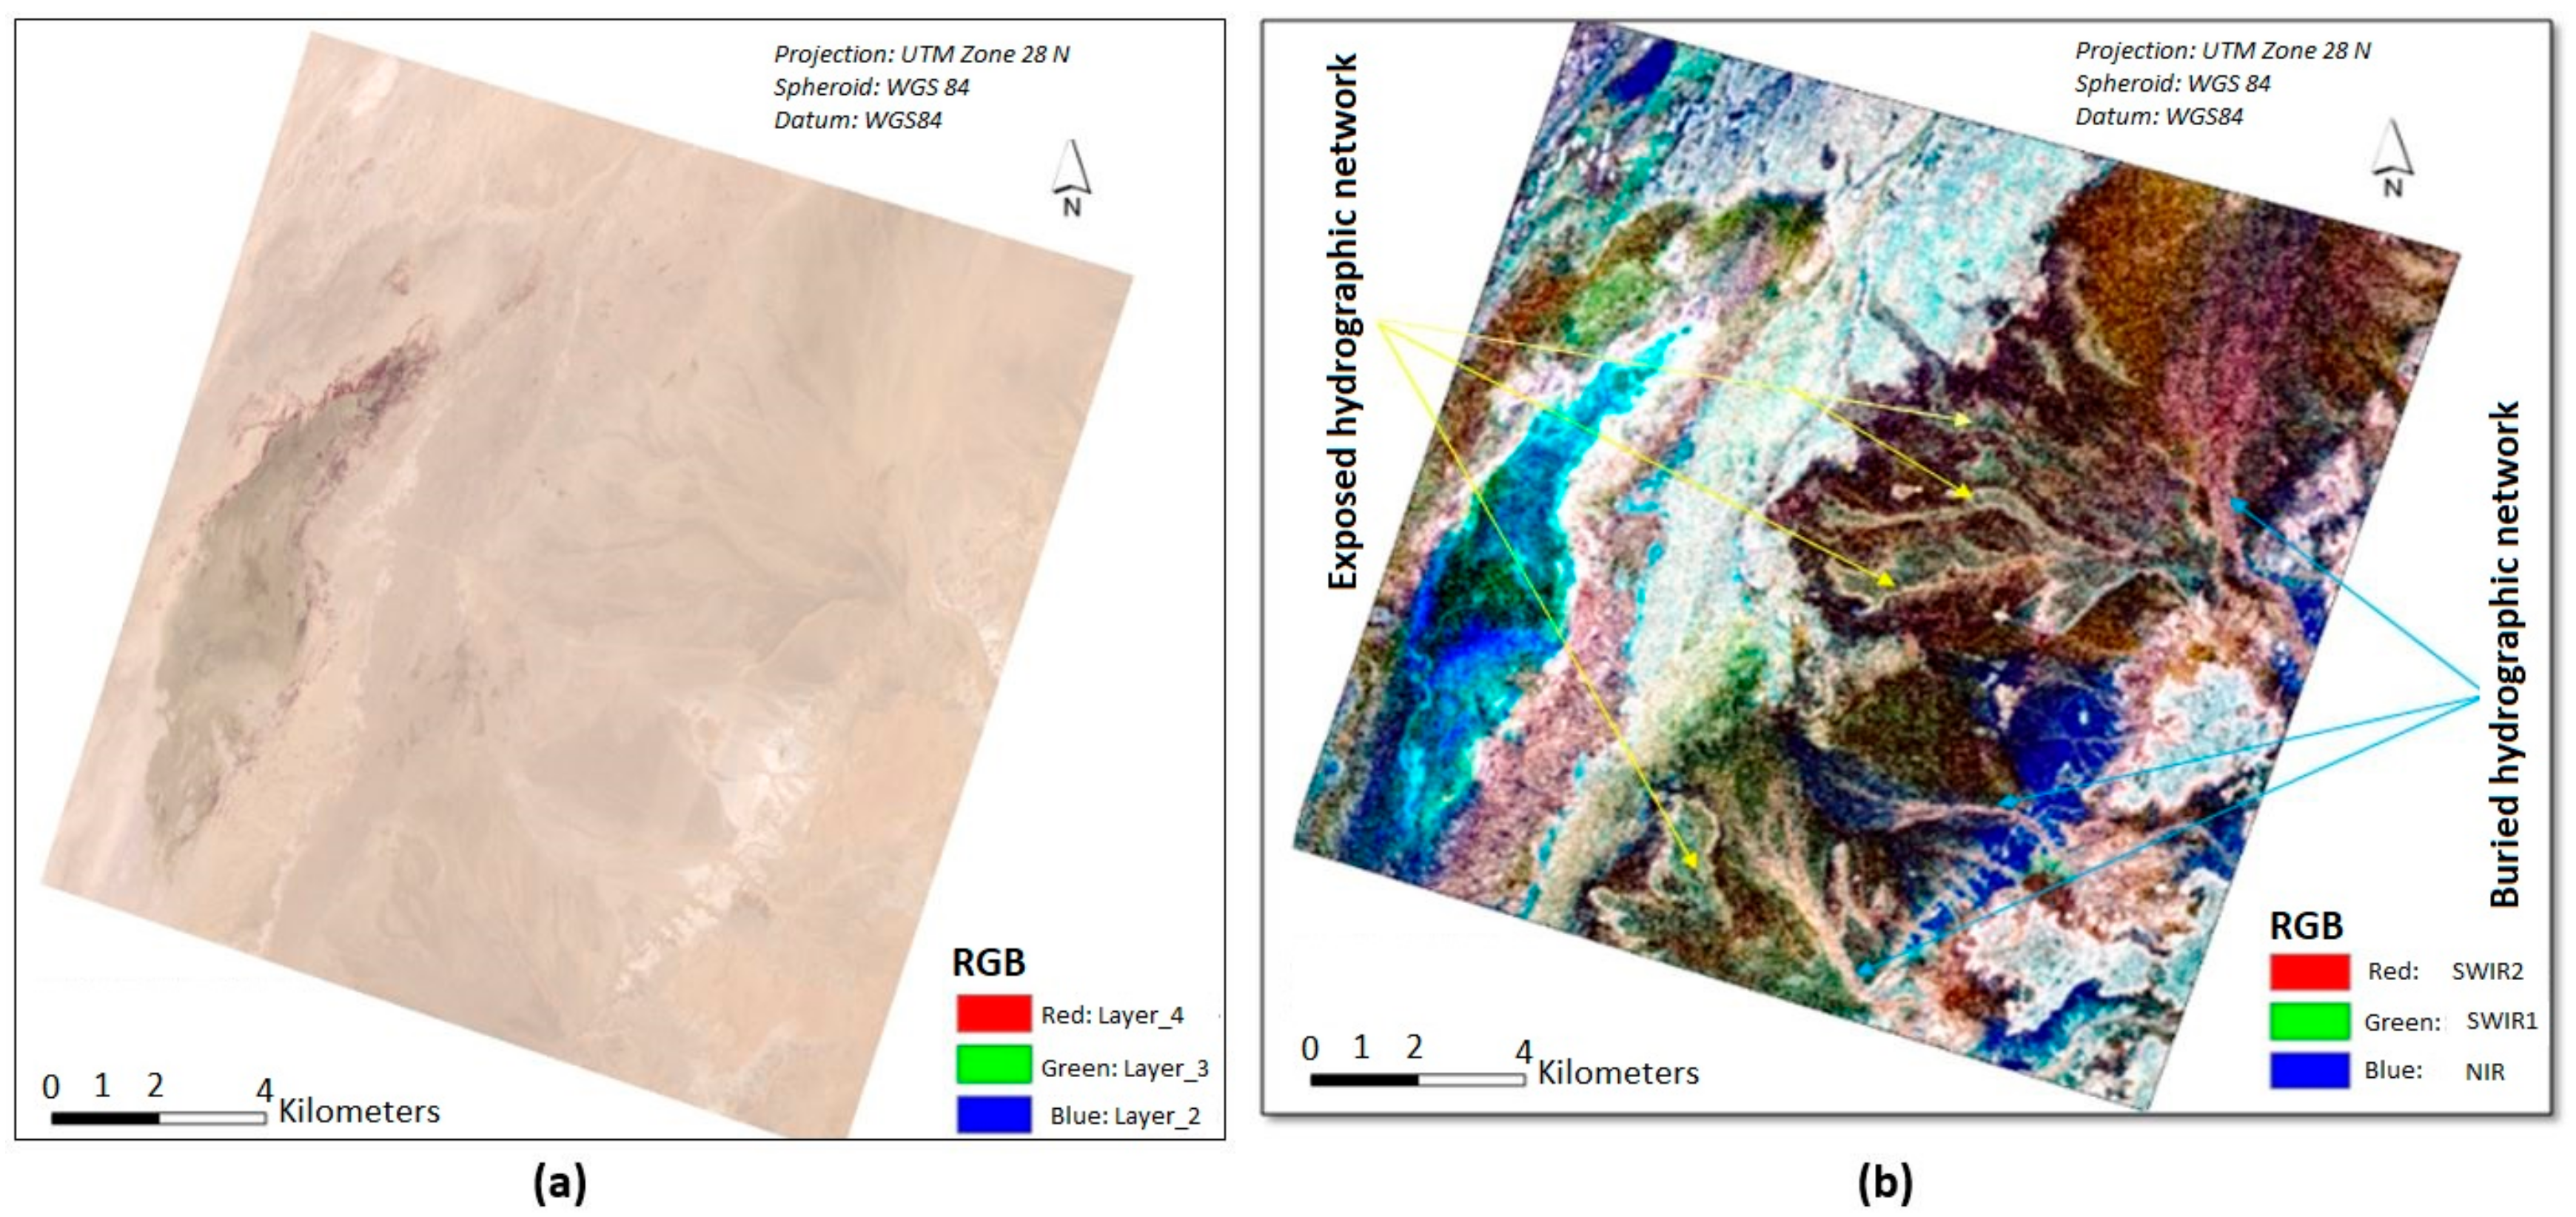
3.3.2. Mapping of Underground Network by Merging the Radar and Optic Data

The SAR radar is an active form of remote sensing that illuminates the target and serves as an all-time sensor that does not depend on sunlight. Unlike the reflected aspect of the electromagnetic spectrum, microwave radiation is vulnerable to three factors, namely, surface tilt, roughness, and target material dielectric constant [78,79,80,81]. Figure 11 presents an overview of the Sentinel-2 MSI image (Figure 11a) and Sentinel-1 SAR merged with Sentinel-2 MSI data (Figure 11b). The difference between the image produced by reflectance data and the backscatter merged with reflectance is that the topography of the bedrock was slightly buried, and the radar managed to highlight the hydrographic network under the sand, which the optical sensor alone cannot see because of its superficial interaction [85,86,87,88]. This difference can be attributed to the surface penetration backscattering from subsurface features. The hydrological and hydrogeological mechanisms of Imlili Sebkha can be attributed to its aquifers, which are amongst the most important deep aquifers in the entire Sahara.

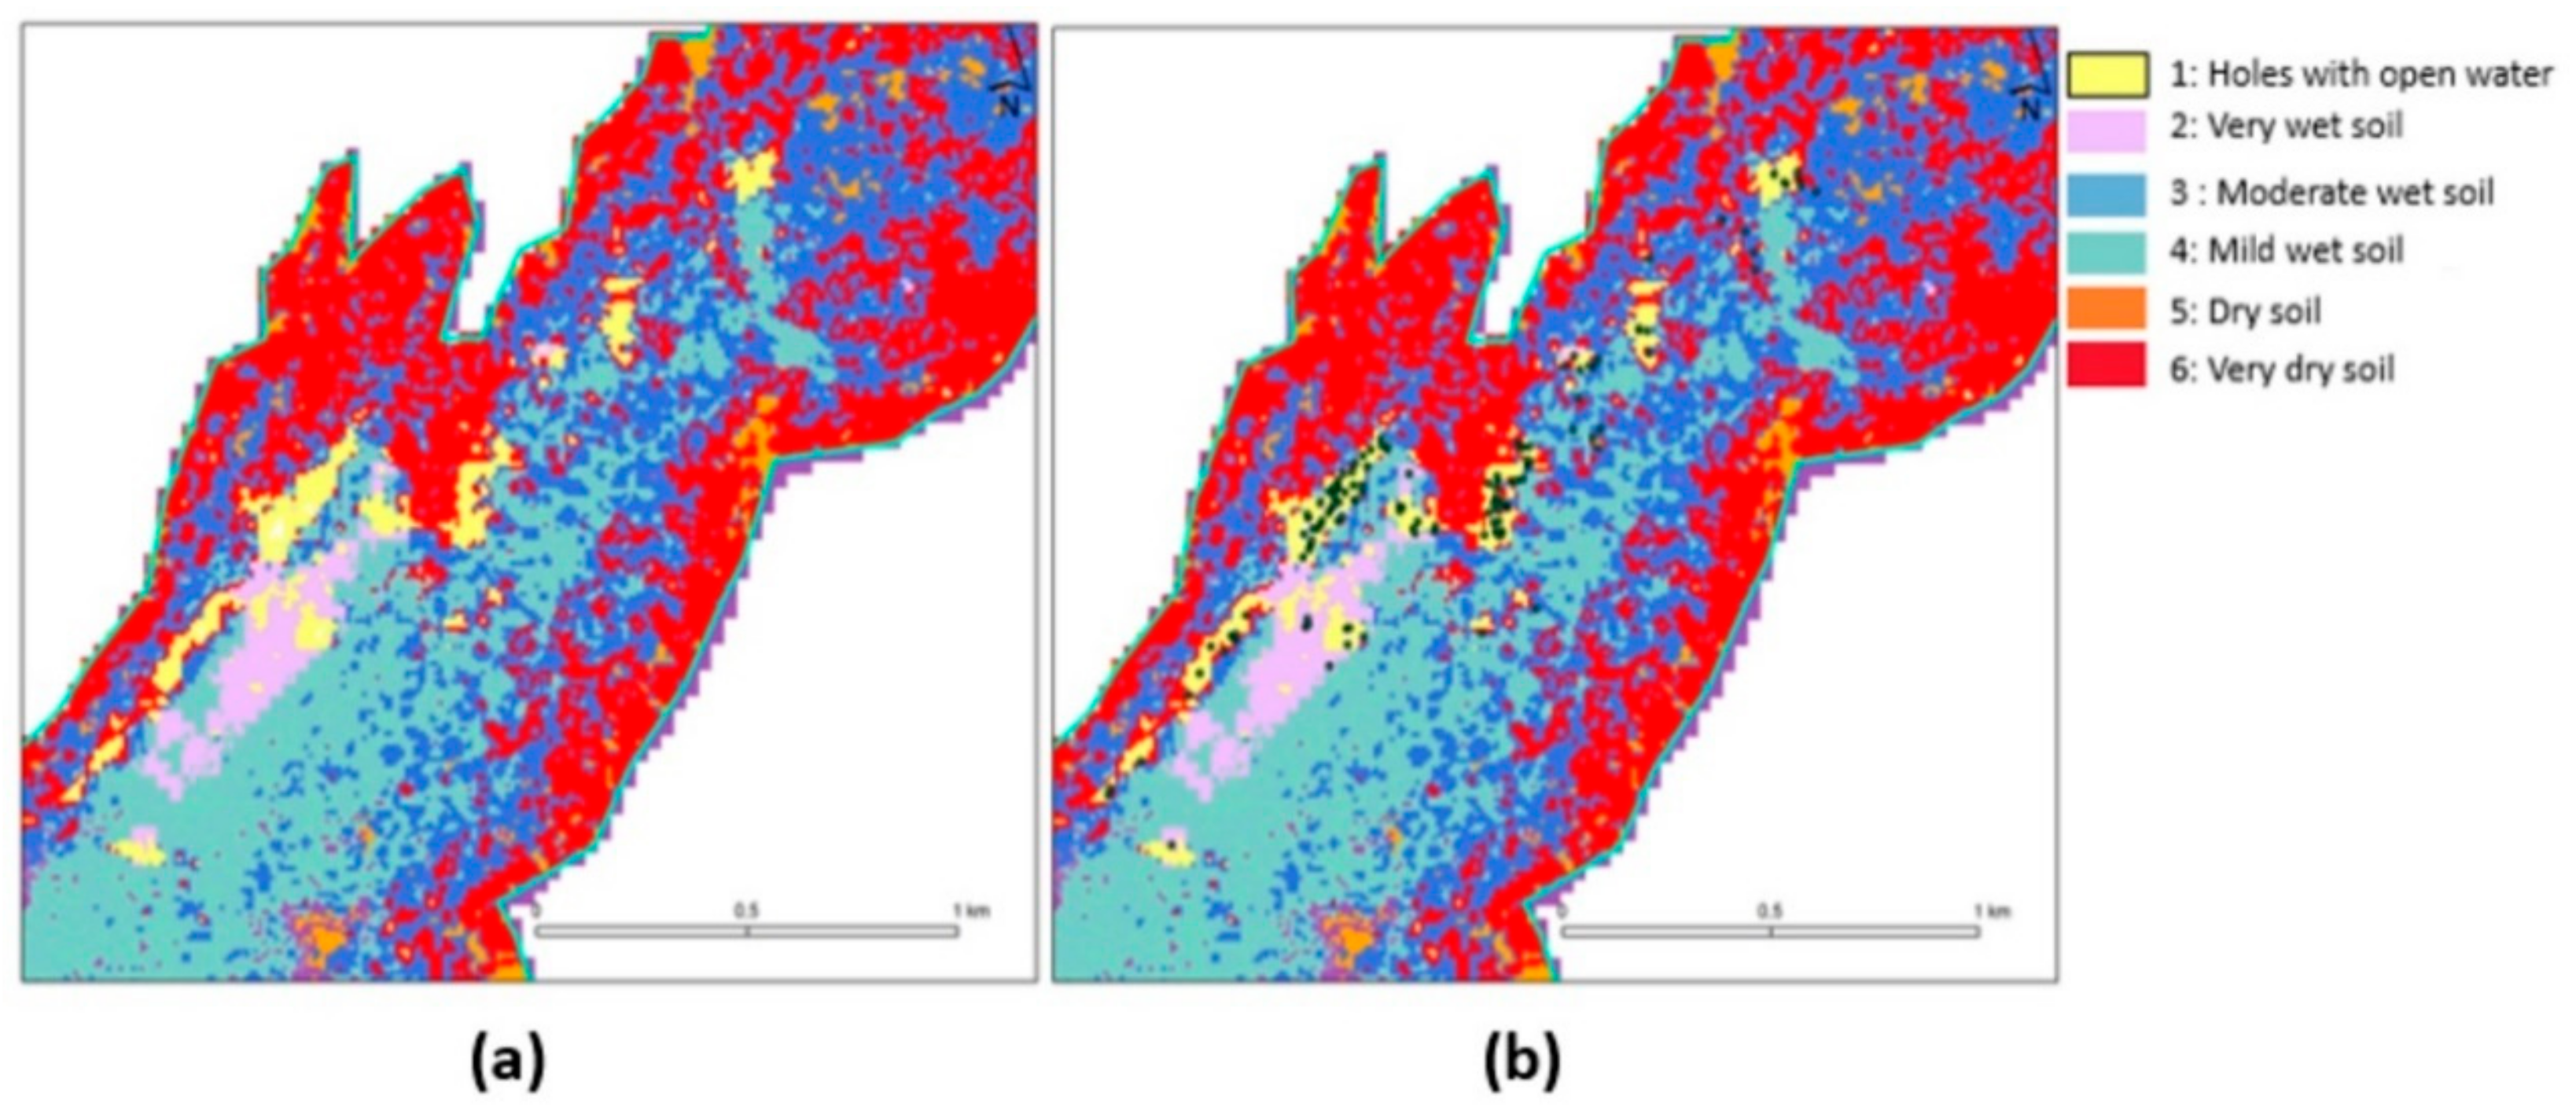
3.3.3. Application of Random Forest Classification to a Multibands Integrated Dataset

To fulfil our research goal, we created an optimized 11 multiband dataset comprising 6 reflectance bands, 2 polarimetric SAR bands (VV and HV), and the 3 extracted indices (MNDPI, NDSI, and ABWI). In view of the initial classification tests and the significant amount of evidence that highlights the importance of RF (Figure 12a,b), we used an RF classification model that is available on the GEE platform. The first step in the RF process was to draw a bootstrap sample of size N from the training data. After an RF tree grows to the bootstrapped information for each sample, the following steps were repeated for each tree node: (1) The m variables were randomly selected from the p variables, and the best split-point variable was chosen among them. (2) The node was separated into two daughter nodes. (3) For the classification, each random forest tree vote was used. Finally, the prediction showed the majority vote of the ensemble.
Table 4 provides the accuracy estimates for the full model. The columns show the map categories depicting the RF model predictions (pixels classified by class), the rows show the field-validated reference data (reference pixel for each class) and ni+ and n+j represent the totals of the preceding rows and columns, respectively. In addition, Oer denotes the omission error, Cer denotes the commission error, Ui denotes the user’s accuracy, Pi denotes the producer’s accuracy, and OA denotes the overall accuracy. For most open water, wet soils, and dry land areas (including salt caverns, very wet soils, and very dry soils), the matrix showed a relatively high consumer and producer accuracy.
The average categorization accuracy obtained by using this data subset was 93.20% (Table 4), which is a very appropriate value. The percentages of correct classifications of pixels as holes with open water, very wet soil, moderately wet soil, mildly wet soil, dry soil, and very dry soil were 96.2%, 92.5%, 91.2%, 95%, 92.5%, and 95%, respectively. The agreement coefficient value for this classification was 94.5%, the quantity disagreement was 2.1, the allocation disagreement was 2.77, and the disagreement was 4.2. These values suggest that the RF classification and the collected ground truth data show good agreement.

4. Discussion

Sebkha Imlili is an original freshwater structure in the Sahara that has witnessed historical tropical events in the extreme south of Morocco. This sebkha represents a wet and dynamic section of an old river that was isolated and dried up due to the desertification of the region over the last thousand years [89]. The northern part of Sebkha Imlili has 160 permanent water pockets. Although the water in this zone is salty and hypersaline, the pockets include marine flora and fauna and both stagnant and flowing freshwater [51]. Before presenting our results, we first analyzed our monitoring results for the salt and wet/dry conditions of permanent water pockets, determined the source of these permanent water pockets, and discussed the radar optic merging process.

4.1. Monitoring of the Soil Salinity and Wet/Dry States of Permanent Water Cavities

4.1.1. Monitoring of the Soil Salinity of Imlili Sebkha

The intensity of soil salinity increased the reflection [90], and the rise in salinity affected the entire spectrum of reflectance and the SWIR domain [50,91,92]. SWIR remote sensor satellite sensors can easily capture the highly reflective characteristics of highly saline soils and play fundamental roles in the remote monitoring of a large area of soil salinization [50]. Figure 6a–c shows that salinity largely varies from one pocket to another even when these pockets are located close to each other and even if only a small number of wells have severe salinity. The level of salinity became uniform and severe in the years that follow (Figure 6d,e). These results are in agreement with those obtained by Qninba and Emran [89,90].

4.1.2. Monitoring of the Wet/Dry States of Permanent Water Cavities

The monitoring results for the wet/dry states of saltwater cavities can be validated by using meteorological data for the years 1984 to 2004. Given that images for the years 2015 to 2019 were available on GEE, we used these images to validate our results for optical and radar data performance.
According to the evolution of precipitation over the last four decades (1971–2019), the Sahara Desert experienced a long dry episode from 1971 to 1993 and a period of recovery afterwards. Meanwhile, in the late 1990s to 2010, the precipitation over the Sahara Desert showed an obvious recovery with an increasing trend of 15.2% per decade (above the 95% level of significance). The temporal variability of precipitation in this desert is comparable to the global anomaly of precipitation, which means that the climate in the Sahara was influenced by anthropogenic forces that are responsible for the global change in precipitation levels [3]. An unusually extreme precipitation was also observed in the Sahara Desert in the mid-1990s, and we examined such abrupt change accordingly. Figure 13a,b shows that after this abrupt change, the Sahara Desert experienced an increase in precipitation. Significant abrupt changes in precipitation were also recorded in the summers of 1992 and 1993 [92], and these changes were followed by frequent precipitation events as shown in Figure 14. These meteorological data agree well with the results obtained from the monitoring of the wet/dry states of saltwater cavities (Figure 8f).
Figure 15 shows the wet/dry states of the water cavities from 2014 to 2018 as seen from GEE. The water cavity denoted by the yellow circle was dry in 2014, mildly dry 2015, moderately wet in 2016, very wet in 2017, and moderately wet in 2018. Meanwhile, the water cavity denoted by the red circle was very wet in 2014, slightly wet in 2015, dry in 2016, medium dry in 2017, and dry in 2018.

4.2. Origin of Permanent Saltwater Cavities

The radar images used in this work helped us understand the functions of Imlili Sebkha in discovering underground hydrological networks by combining multispectral and polarimetric radar images. These images are not only well suited to studying desert areas but also allow a better monitoring of desert flood zones. The sensitivity of these images to variations in the slope of the topographic surface and surface roughness can facilitate geological and geomorphological analyses. In this study, a dual polarization of SAR satellites was combined with multispectral data to characterize the sebkha surface terrain features, including their grain size distribution and prevailing rock composition. Meanwhile, the discrimination of objects according to this dual polarization provides relatively accurate information regarding roughness, particle size, and humidity from the surface [87,88]. Therefore, in studying soil and terrain roughness, grain size, volumetric moisture content, and homogeneity, the dual imaging polarimetric radar can be combined with multispectral data and used for discriminating different soil types and soil moisture states in Imlili Sebkha [87,88]. The permanence of water in water pockets can be ascribed to a combination of the geological, hydrogeological, and temporal variabilities in the precipitation over the Sahara Desert. The precipitation phenomena allowed continuous feeding of the underlying superficial water table especially during rainy episodes (the sebkha) [89,90]. This water circulates in the permeable layer/impermeable layer interface, ensuring the quasi-permanent filling of the pockets. The sebkha represents the outlet and lowest point of a large underground and superficial hydrographic network. The hypersalinity of permanent water cavities can be ascribed to the saltiness of the substratum and the draining of saline water from the underground network [92]. Given its large area, the study area receives a large volume of rainwater, but the rate of infiltration in the subsoil plays against the surface runoff, thereby preventing floods from reaching the sebkha. In this case, the slightly inclined soil of the sebkha enhances the visibility of runoff along channels, which is hardly visible in topography and optical imagery. The origin of saltwater cavities can be ascribed to the presence of faults under the surface of the sebkha, whereas their high salinity can be ascribed to the leaching phenomena.
In this research, we tested the ability of full polarimetric radar, such as Radarsat-2 or Alos Palsar-2, in detecting and monitoring the terrain features of interest of Imlili Sebkha. We believe that this approach will be enhanced by polarization diversity of the full polarimetric data, their polarimetric imaging capability, high-resolution mode, and ability to look to either side of the satellite track. This approach can also provide useful information that can facilitate a detailed and accurate mapping of soil moisture states, the spatial dynamics and status of permanent water pockets in its central part of the sebkha, the vegetation characteristics at the edges, and the processes that actively shape this environment.

5. Conclusions

The integration of information technology in the fields of data accessibility, cloud computing, and machine learning offers many possibilities for geospatial applications at the temporal and spatial levels. Our study focused on the mapping and monitoring of the wet/dry conditions of a very vulnerable Saharan wetland ecosystem. The findings highlight the functions of water cavities in the sebkha and the ecological values of this area, which have been largely unexplored in the literature.
The use of a cloud-based geospatial workflow allowed us to efficiently and quickly map and monitor the saltwater cavities in Imlili Sebkha. The results not only show the value of long-term global monitoring for the effective and sustainable protection of these fragile ecosystems but also help us understand the function of these Saharan wetlands. The geospatial workflow also allowed us to detect the temporal fluctuations in the wet/dry conditions of these water cavities, which is crucial in understanding how these areas operate and in devising ways to protect these areas from land use and climate change.
The evolution of technology and the emergence of new trends in geospatial science over the past few years have improved the efficiency of using geospatial data to map, monitor, and search terrestrial systems, especially the fragile ones such as the Saharan wetlands. However, these new trends have also brought about several challenges, including (1) the availability of multisensor, multiresolution, and multitemporal satellite data streams in open access; (2) the development of geospatial big data in the form of a data cube; (3) the availability of computing in cloud platforms and, (4) the increasing use of machine learning algorithms and artificial intelligence. Not only do satellite EO data increase in number and become easier to access, but the infrastructure platform has also become too sophisticated for processing algorithms that have been built in a collaborative manner. Nevertheless, these advancements have facilitated the integration of massive geospatial datasets and made them available to a larger number of users worldwide. The simultaneous arrival and increasing availability of cloud computing technologies and services add value to the large volumes of open-access satellite data flows. Indeed, performing a chronological analysis of satellite images by using local computer resources is difficult especially on a given area, such as the one we present in our study. With the emergence of geospatial big data, networks, and free services such as GEE, users need a reliable Internet connection to access, control, and analyze huge amounts of data. The increasing use of machine learning algorithms, such as RF, also allows an accurate, fast mapping of permanent water cavities due to their great adaptability to relatively complex merged radar and optic data. Meanwhile, standard scientific approaches to OE image analysis that focus on simple data models, such as maximum likelihood or minimum distance classification, have limited ability in managing complex datasets, such as geospatial big data.

Author Contributions

Conceptualization, S.H. and A.E.; methodology, S.H. and A.E.; software, S.H.; validation, A.E. and B.P.; formal analysis, A.E.; investigation, B.P.; resources, Q.A. and A.E.; data curation, B.P. and A.H.N.M.; writing—original draft preparation, S.H.; writing—review and editing, B.P., C.-W.L., A.M.A., and A.H.N.M.; visualization, S.H.; supervision, B.P.; project administration, Q.A., A.E. and T.E.B.; funding acquisition, Q.A., T.E.B., A.E., B.P., C.-W.L., and A.M.A. All authors have read and agreed to the published version of the manuscript.

Funding

This research is supported by the Centre for Advanced Modelling and Geospatial Information Systems (CAMGIS) in the University of Technology Sydney (UTS) under Grants 321740.2232335 and 321740.2232357, Grant 321740.2232424, and Grant 321740.2232452. This research is also supported by Researchers Supporting Project number RSP-2019/14, King Saud University, Riyadh, Saudi Arabia.

Acknowledgments

The authors would like to thank Google Earth Engine and staff of the GREPOM-BirdLife, the Council of the Oued Eddahab-Lagouira Region, the Council of the Oued Eddahab Province, the Council of the Rural Municipality of Imlili, and the Research Center Geophysics Natural Patrimony and Green Chemistry (GEOPAC) of the Institute of Science Rabat et l’Association Nature Initiative of Dakhla for their support. This research was also supported by a grant from the National Research Foundation of Korea, provided by the Korea government (No. 2017R1A2B4003258, 2018).

Conflicts of Interest

The authors declare no conflict of interest.

References

  1. Qninba, A.; Ibn Tattou, M.; Radi, M.; El Idrissi Essougrati, A.; Bensouiba, H.; Ben Moussa, S. Sebkhet Imlily, une zone humide originale dans le Sud Marocain. Bull. Inst. Sci. 2009, 31, 51–55. [Google Scholar]
  2. Lévêque, C. Relict tropical fish fauna in Central Sahara. Ichthyol. Explor. Freshw. 1990, 1, 39–48. [Google Scholar]
  3. Trape, S. Impact of climate change on the relict tropical fish fauna of Central Sahara: Threat for the survival of Adrar mountains fishes, Mauritania. PLoS ONE 2009, 4, e4400. [Google Scholar] [CrossRef] [PubMed]
  4. Trape, S. A new cichlid fish in the Sahara: The Ounianga Serir lakes (Chad), a biodiversity hotspot in the desert. C. R. Biol. 2016, 339, 529–536. [Google Scholar] [CrossRef] [PubMed]
  5. Qninba, A.; El Agbani, M.A.; Radi, M.; Pariselle, A. Sur la présence de Tilapia guineensis (Teleostei, Cichlidae) dans les gueltas d’un affluent de l’Oued Chbeyka, l’oued Aabar (Province de Tan Tan, Sud-Ouest du Maroc). Bull. Inst. Sci. 2012, 34, 125–126. [Google Scholar]
  6. Bennas, N.; Himmi, O.; Benamar, L.; L’Mohdi, O. Première données sur les coléoptères et les hémiptères aquatiques de la Sebkha d’Imlili (Région Dakhla-Oued ed Dahab, Sud-Ouest du Maroc). Boletín Sociedad Entomológica Aragonesa (SEA) 2016, 59, 117–126. [Google Scholar]
  7. Gorelick, N.; Hancher, M.; Dixon, M.; Ilyushchenko, S.; Thau, D.; Moore, R. Google Earth Engine: Planetary-scale geospatial analysis for everyone. Remote Sens. Environ. 2017, 202, 18–27. [Google Scholar] [CrossRef]
  8. Foucault, A. La révolution paléoclimatologique. Géochronique 1994, 50, 13–14. [Google Scholar]
  9. Abotalib, Z.; Sultan, M.; Elkadiri, R. Groundwater processes in Saharan Africa: Implications for landscape evolution in arid environments. Earth-Sci. Rev. 2016, 156, 108–136. [Google Scholar] [CrossRef] [Green Version]
  10. Yan, Z.; Petit-Maire, N. The last 140 ka in the Afro-Asian arid/semi-arid transitional zone. Palaeogeogr. Palaeoclimatol. Palaeoecol. 1994, 110, 217–233. [Google Scholar] [CrossRef]
  11. Bleeker, P. Atlas Ichthyologique des Indes Orientales Néêrlandaises; Frédéric Muller: Amsterdam, The Netherlands, 1865; pp. 49–101. [Google Scholar]
  12. Google Earth Engine. A Planetary-Scale Plat-Form for Environmental Data & Analysis. 2012. Available online: https://earthengine.google.org (accessed on 8 August 2019).
  13. Patel, N.N.; Angiuli, E.; Gamba, P.; Gaughan, A.; Lisini, G.; Stevens, F.R.; Tatem, A.J.; Trianni, G. Multitemporal settlement and population mapping from Landsat using Google Earth Engine. Int. J. Appl. Earth Obs. Geoinf. 2015, 35, 199–208. [Google Scholar] [CrossRef] [Green Version]
  14. Margono, B.; Bwangoy, J.-R.; Potapov, P.V.; Hansen, M.C. Mapping wetlands in Indonesia using Landsat and PALSAR data-sets and derived topographical indices. Geo-Spat. Inf. Sci. 2014, 17, 60–71. [Google Scholar] [CrossRef]
  15. Pradhan, B.; Alazhari Moneir, A.A.; Ratiranjan, J. Sand dune risk assessment in Sabha region, Libya using Landsat 8, MODIS, and Google Earth Engine images. Geomat. Nat. Hazards Risk 2018, 9, 1280–1305. [Google Scholar] [CrossRef] [Green Version]
  16. Teluguntla, P.; Thenkabail, P.S.; Oliphant, A.; Xiong, J.; Gumma, M.K.; Congalton, R.G.; Yadav, K.; Huete, A. A 30-m landsat-derived cropland extent product of Australia and China using random forest machine learning algorithm on Google Earth Engine cloud computing platform. ISPRS J. Photogramm. Remote Sens. 2018, 144, 325–340. [Google Scholar] [CrossRef]
  17. Johansen, K.; Phinn, S.; Taylor, M. Mapping woody vegetation clearing in Queensland, Australia from Landsat imagery using the Google Earth Engine. Remote Sens. Appl. Soc. Environ. 2015, 1, 36–49. [Google Scholar] [CrossRef]
  18. Huang, H.; Chen, Y.; Clinton, N.; Wang, J.; Wang, X.; Liua, C.; Gong, P.; Yang, J.; Bai, Y.; Zheng, Y.; et al. Mapping major land cover dynamics in Beijing using all Landsat images in Google Earth Engine. Remote Sens. Environ. 2017, 202, 166–176. [Google Scholar] [CrossRef]
  19. Liu, X.; Hu, G.; Chen, Y.; Li, X.; Xu, X.; Li, S.; Pei, F.; Wang, S. High-resolution multi-temporal mapping of global urban land using Landsat images based on the Google Earth Engine Platform. Remote Sens. Environ. 2018, 209, 227–239. [Google Scholar] [CrossRef]
  20. Wang, X.; Xiao, X.; Zou, Z.; Chen, B.; Ma, J.; Dong, J.; Doughty, R.B.; Zhong, Q.; Qin, Y.; Shengqi Dai, S.; et al. Tracking annual changes of coastal tidal flats in China during 1986–2016 through analyses of Landsat images with Google Earth Engine. Remote Sens. Environ. 2018, in press. [Google Scholar] [CrossRef]
  21. Mahdianpari, M.; Salehi, B.; Mohammadimanesh, F.; Homayouni, S.; Gill, E. The First Wetland Inventory Map of Newfoundland at a Spatial Resolution of 10 m Using Sentinel-1 and Sentinel-2 Data on the Google Earth Engine Cloud Computing Platform. Remote Sens. 2019, 11, 43. [Google Scholar] [CrossRef] [Green Version]
  22. Lee, J.-S.; Pottier, E. Polarimetric Radar Imaging: From Basics to Applications; CRC Press: Boca Raton, FL, USA, 2009; 422p. [Google Scholar]
  23. Dobson, M.C.; Pierce, L.E.; Ulaby, F.T. The role of frequency and polarization in terrain classification using SAR data. IEEE Trans. Geosci. Remote Sens. 1997, 35, 1621–1623. [Google Scholar]
  24. Touzi, R.; Boerner, W.; Lee, J.S.; Luneberg, E. A review of polarimetry in the context of synthetic aperture radar: Concepts and information extraction. Can. J. Remote Sens. 2004, 30, 380–407. [Google Scholar] [CrossRef]
  25. Baghdadi, N.; Gaultier, S.; King, C. Retrieving surface roughness and soil moisture from synthetic aperture radar (SAR) data using neural networks. Can. J. Remote Sens. 2002, 28, 701–711. [Google Scholar] [CrossRef]
  26. Gaber, A.; Koch, M.; El-Baz, F. Textural and compositional characterization of Wadi Feiran Deposits, Sinai Peninsula, Egypt, using Radarsat-1, PALSAR, SRTM and ETM+ data. J. Remote Sens. 2010, 2, 52–75. [Google Scholar] [CrossRef] [Green Version]
  27. Saraf, A.K. IRS-IC-LISS-III and PAN data fusion: An approach to improve remote sensing based mapping techniques. Int. J. Remote Sens. 2010, 20, 1929–1934. [Google Scholar] [CrossRef]
  28. Koch, M.; El-Baz, F. Spectral and textural classification of active wadi systems in arid lands by Landsat TM and Radarsat data. In Proceedings of the CDROM-Proceedings of the ASPRS Annual Conference, Washington, DC, USA, 19–26 April 2000; p. 10. [Google Scholar]
  29. Laur, H.; Bally, P.; Meadows, P.; Sanchez, J.; Schaettler, B.; Lopinto, E.; Esteban, D. ERS SAR Calibration Derivation of the Backscattering Coefficient σ0 in ESA ERS SARPRI Products. Document ES-TN-RS-PM-HL09. 2002. Available online: http://earth.esa.int/ESC2/.ESA (accessed on 1 October 2019).
  30. Melsheimer, C.; Tanck, G.; Gade, M.; Aplers, W. Imaging of tidal flats by multifrequency/multi-polarization synthetic aperture radar. In Operational Remote Sensing for Sustainable Development; Nieuwenhuis, G.J.A., Vaughan, R.A., Molenaar, M., Eds.; Balkema: Rotterdam, The Netherlands, 1999; pp. 189–192. [Google Scholar]
  31. Baghdadi, N.; Holah, N.; Zribi, M. Soil moisture estimation using multi-incidence and multi-polarization ASAR data. Int. J. Remote Sens. 2006, 27, 1907–1920. [Google Scholar] [CrossRef]
  32. Moran, M.S.; Peters-Lidard, C.D.; Watts, J.M.; McElroy, S. Estimating soil moisture at the watershed scale with satellite-based radar and land surface models. Can. J. Remote Sens. 2004, 30, 805–826. [Google Scholar] [CrossRef] [Green Version]
  33. Touzi, R.; Hélie, R.; Filfil, R. On the use of polarimetric SAR information for extraction of wetland indicators. In Proceedings of the IGARSS’05, Seoul, Korea, 25–29 July 2005. [Google Scholar]
  34. Touzi, R.; Charbonneau, F. Characterization of target symmetric scattering using polarimetric SARs. IEEE Trans. Geosci. Remote Sens. 2002, 40, 2507–2516. [Google Scholar] [CrossRef]
  35. Touzi, R.; Raney, R.K.; Charbonneau, F. On the use of permanent symmetric scatterers for ship characterization. IEEE Trans. Geosci. Remote Sens. 2004, 42, 2039–2045. [Google Scholar] [CrossRef]
  36. Cloude, S.; Papathanassiou, K. Polarimetric SAR Interferometry. IEEE Trans. Geosci. Remote Sens. 1998, 36, 1551–1565. [Google Scholar] [CrossRef]
  37. Rjimati, E.C.; Michard, A.; Saddiqi, O. Anti-Atlas occidental et Provinces sahariennes. In Nouveaux Guides Géologiques et Miniers du Maroc, Volume 6. Notes et Mémoires du Service géologique du Maroc; Michard, A., Saddiqi, O., Chalouan, A., Mouttaqi, A., Eds.; Ministère de l’Energie et des Mines: Rabat, Morocco, 2011; Volume 561, pp. 9–95. [Google Scholar]
  38. Chander, G.; Markham, B.L.; Helderc, D.L. Summary of current radiometric calibration coefficients for Landsat MSS, TM, ETM+, and EO-1 ALI sensors. Remote Sens. Environ. 2009, 113, 893–903. [Google Scholar] [CrossRef]
  39. Bannari, A.; Kadhem, G.; El-Battay, A.; Hameid, N.A.; Rouai, M. Assessment of Land Erosion and Sediment Accumulation Caused by Runoff after a Flash-Flooding Storm Using Topographic Profiles and Spectral Indices. Adv. Remote Sens. 2016, 5, 315–354. [Google Scholar] [CrossRef] [Green Version]
  40. Feyisa, G.L.; Meilby, H.; Fensholt, R.; Proud, S.R. Automated Water Extraction Index: A new technique for surface water mapping using Landsat imagery. Remote Sens. Environ. 2014, 140, 23–35. [Google Scholar] [CrossRef]
  41. Fisher, A.; Flood, N.; Danaher, T. Comparing Landsat water index methods for automated water classification in eastern Australia. Remote Sens. Environ. 2016, 175, 167–182. [Google Scholar] [CrossRef]
  42. McFeeters, S.K. The use of the Normalized Difference Water Index (NDWI) in the delineation of open water features. Int. J. Remote Sens. 1996, 17, 1425–1432. [Google Scholar] [CrossRef]
  43. Hakdaoui, S.; Emran, A.; Pradhan, B.; Chang-Wook Lee, C.W.; Nguemhe Fils, S.C. A Collaborative Change Detection Approach on Multi-Sensor Spatial Imagery for Desert Wetland Monitoring after a Flash Flood in Southern Morocco. Remote Sens. 2019, 11, 1042. [Google Scholar] [CrossRef] [Green Version]
  44. Hakdaoui, S.; Emran, A. Extraction of water information based on SAR RADAR and Optical image processing: Case of flood disaster in Southern Morocco. In Geospatial Technology, Application in Water Resources Management, Series: Advances in Science, Technology & Innovation; Springer: Cham, Switzerland, In press.
  45. Xiong, L.; Deng, R.; Li, J.; Liu, X.; Qin, Y.; Liang, Y.; Liu, Y. Subpixel Surface Water Extraction (SSWE) Using Landsat 8 OLI Data. Water 2018, 10, 653. [Google Scholar] [CrossRef] [Green Version]
  46. Douaoui, A.E.K.; Nicolasb, H.; Walter, C. Detecting Salinity Hazards within a Semiarid Context by Means of Combining Soil and Remote-Sensing Data. Geoderma 2006, 134, 217–230. [Google Scholar] [CrossRef]
  47. Penga, J.; Biswasc, A.; Jianga, Q.; Zhaoa, R.; Hua, J.; Hua, B.; Hia, Z. Estimating soil salinity from remote sensing and terrain data in southern Xinjiang Province, China. Geoderma 2019, 337, 1309–1319. [Google Scholar] [CrossRef]
  48. Chen, S.; Xu, B.; Jin, Y.; Huang, Y.; Zhang, W.; Guo, J.; Shen, G.; Yang, X. Remote Sensing Monitoring and Spatial-temporal Characteristics Analysis of Soil Salinization in Agricultural Area of Northern Xinjiang. Acta Geogr. Sin. 2015, 35, 1607–1615. [Google Scholar]
  49. Dwivedi, R.S.; Rso, B.R.M. The selection of the best possible Landsat TM band combination for delineating salt-affected soils. Int. J. Remote Sens. 1992, 13, 2051–2058. [Google Scholar] [CrossRef]
  50. Masoud, A.; Koike, K. Arid land salinization detected by remotely-sensed land cover changes: A case study in the Siwa region, NW Egypt. J. Arid Environ. 2006, 66, 151–167. [Google Scholar] [CrossRef]
  51. Bouaziz, M.; Matschullat, J.; Gloaguen, R. Improved remote sensing detection of soil salinity from a semi-arid climate in northeast Brazil. Comptes Rendus Geosci. 2011, 343, 795–803. [Google Scholar] [CrossRef]
  52. Dong, F.; Tang, Y.; Xing, X.; Liu, Z.; Xing, L. Formation and Evolution of Soil Salinization in Shouguang City Based on PMS and OLI/TM Sensors. Water 2019, 11, 345. [Google Scholar] [CrossRef] [Green Version]
  53. Lapadu-Hargues, P. Les massifs de la Margeride et du Mont Lozère et leurs bordures. Bull. Sery. Carte Géol. France 1947, 46, 379–532. [Google Scholar]
  54. Becker, F.; Choudhury, B.J. Relative sensitivity of normalized difference vegetation Index (NDVI) and microwave polarization difference Index (MPDI) for vegetation and desertification monitoring. Remote Sens. Environ. 1988, 24, 297–311. [Google Scholar] [CrossRef]
  55. Paloscia, S.; Pampaloni, P.; Santi, E. Radiometric Microwave Indices for Remote Sensing of Land Surfaces. Remote Sens. 2018, 10, 1859. [Google Scholar] [CrossRef] [Green Version]
  56. Chauhan, S.; Srivastava, H.S. Comparative evaluation of the sensitivity of multi-polarised sar and optical data for various land cover. Int. J. Adv. Remote Sens. 2016, 4, 1–14. [Google Scholar]
  57. Owe, M.; De Jeu, R.; Walker, J. A Methodology for Surface Soil Moisture and Vegetation Optical Depth Retrieval Using the Microwave Polarization Difference Index. IEEE Trans. Geosci. Remote Sens. 2001, 39, 1643–1654. [Google Scholar] [CrossRef] [Green Version]
  58. Jackson, T.J. Soil moisture estimation using special satellite microwave/imager satellite data over a grassland region. Water Resour. Res. 1997, 33, 1475–1484. [Google Scholar] [CrossRef]
  59. Al-Jassar, H.K.; Rao, K.S. Monitoring of soil moisture over the Kuwait desert using remote sensing techniques. IJRS 2010, 31, 4373–4385. [Google Scholar] [CrossRef]
  60. European Space Agency. SENTINEL-1 Observation Scenario. Available online: https://sentinel.esa.int/web/sentinel/missions/sentinel-1/observation-scenario (accessed on 19 August 2019).
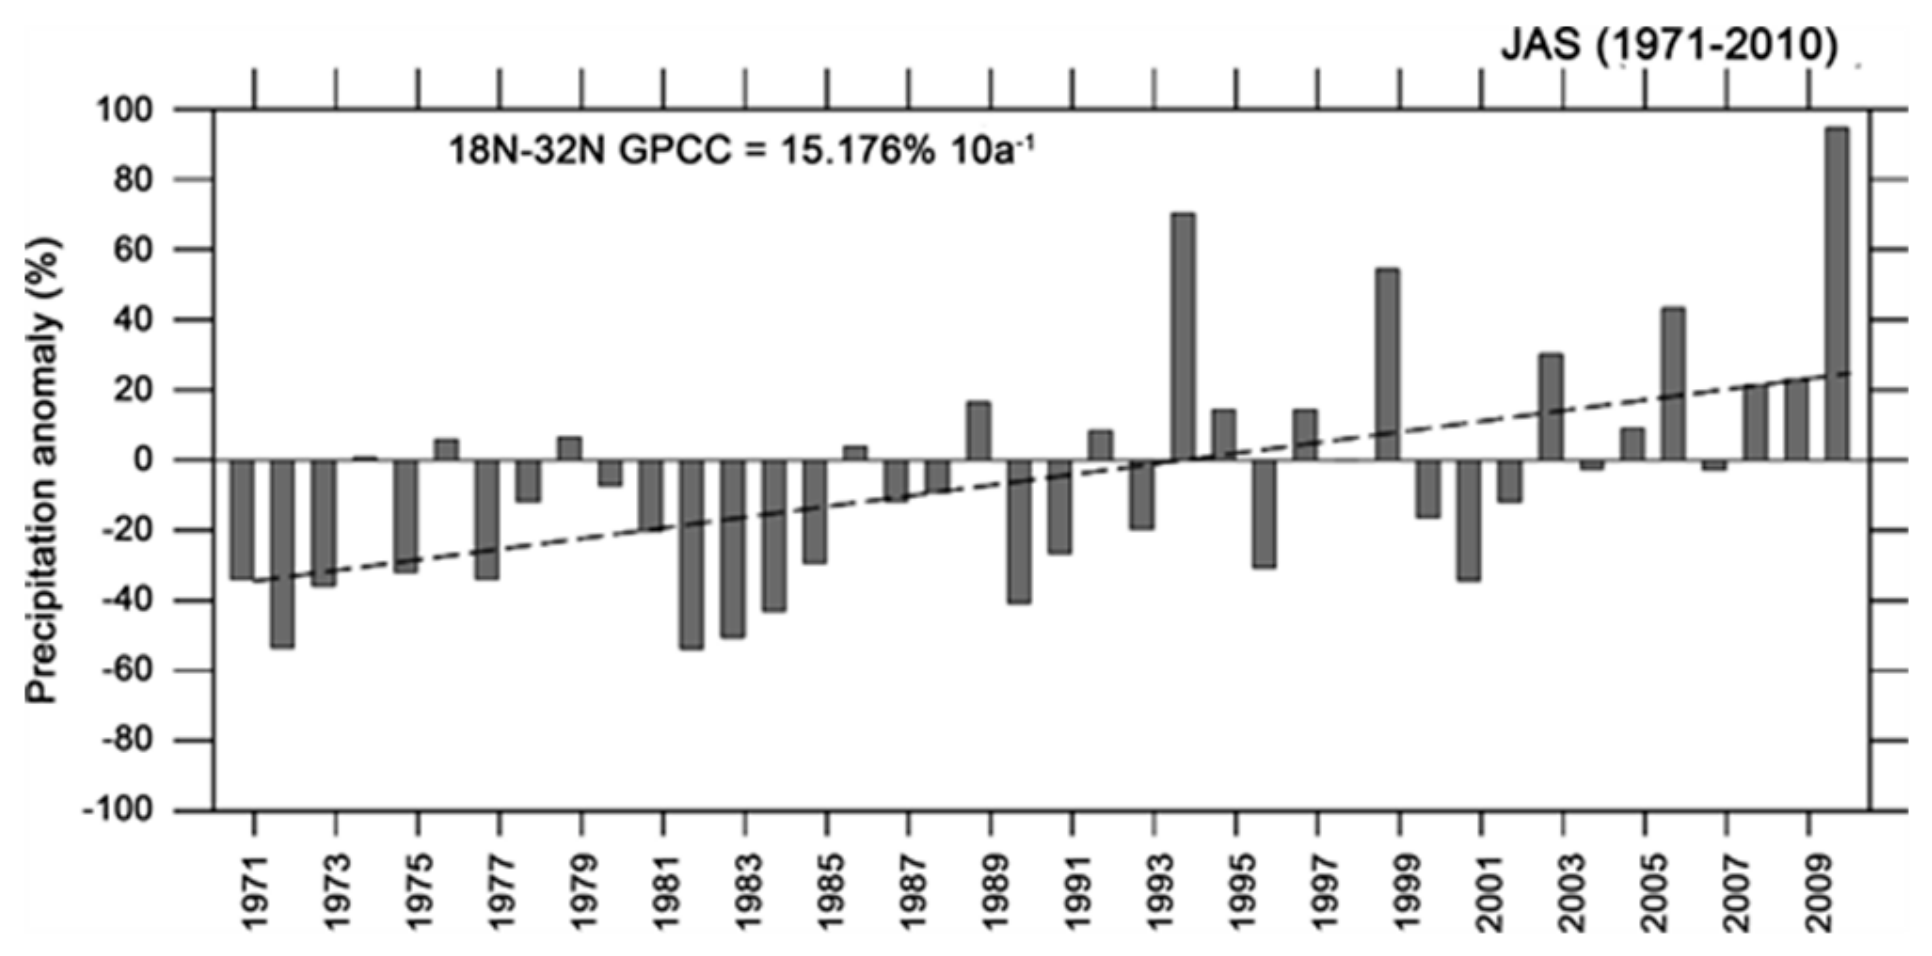
  61. Sindikubwabo, C.; Li, R.; Wang, C. Abrupt Change in Sahara Precipitation and the Associated Circulation Patterns. Atmos. Clim. Sci. 2018, 8, 262–273. [Google Scholar] [CrossRef] [Green Version]
  62. Zhang, G.; Vivekanandan, J.; Brandes, E. A method for estimating rain rate and drop size distribution from polarimetric radar measurements. IEEE Trans. Geosci. Remote Sens. 2001, 39, 830–841. [Google Scholar] [CrossRef] [Green Version]
  63. Evans, D.L.; Farr, T.G.; van Zyl, J.J.; Zebker, H.A. Radar polarimetry: Analysis tools and applications. IEEE Trans. Geosci. Remote Sens. 1998, 26, 774–789. [Google Scholar] [CrossRef]
  64. Abdikan, S. Exploring image fusion of ALOS/PALSAR data and LANDSAT data to differentiate forest area. Geocarto Int. 2018, 33, 21–37. [Google Scholar] [CrossRef]
  65. Barbouchi, M.; Riadh, A.; Chokmani, K.; Ben Aissa, N.; Lhissou, R.; El Harti, A. Soil Salinity Characterization Using Polarimetric InSAR Coherence: Case Studies in Tunisia and Morocco. IEEE J. Sel. Top. Appl. Earth Obs. Remote Sens. 2014, 8, 3823–3832. [Google Scholar] [CrossRef]
  66. El-Zeiny, A.M.; Effat, H.A. Environmental monitoring of spatiotemporal change in land use/land cover and its impact on land surface temperature in El-Fayoum governorate, Egypt. Remote Sens. Appl. Soc. Environ. 2017, 8, 266–277. [Google Scholar] [CrossRef]
  67. Dobson, M.C.; Ulaby, F.T. Mapping soil moisture distribution with imaging radar. In Principles & Applications of Imaging Radar, Manual of Remote Sensing, 3rd ed.; Henderson, F.M., Lewis, A.J., Eds.; John Wiley & Sons, Inc.: New York, NY, USA, 1998; ISBN 0-47129-406-3. [Google Scholar]
  68. Altese, E.; Bolognani, O.; Mancini, M.; Troch, P. Retrieving soil moisture over bare soil from ERS 1 synthetic aperture radar data: Sensitivity analysis based on a theoretical surface scattering model and field data. Water Resour. Res. 1996, 32, 653–661. [Google Scholar] [CrossRef]
  69. Doubková, M.; Van Dijk, A.I.; Sabel, D.; Wagner, W.; Blöschl, G. Evaluation of the predicted error of the soil moisture retrieval from C-band SAR by comparison against modelled soil moisture estimates over Australia. Remote Sens. Environ. 2012, 120, 188–196. [Google Scholar] [CrossRef] [Green Version]
  70. Haas, J. Soil Moisture Modelling Using TWI and Satellite Imagery in the Stockholm Region. Master’s Thesis, School of Architecture and the Built Environment, Royal Institute of Technology (KTH), Stockholm, Sweden, 2010. [Google Scholar]
  71. Hammam, A.A.; Mohamed, E.S. Mapping soil salinity in the East Nile Delta using several methodological approaches of salinity assessment. Egypt. J. Remote Sens. Space Sci. 2018. [Google Scholar] [CrossRef]
  72. Zoka, M.; Psomiadis, E.; Dercas, N. The Complementary Use of Optical and SAR Data in Monitoring Flood Events and Their Effects. Multidiscip. Digit. Publ. Inst. Proc. 2018, 2, 644. [Google Scholar] [CrossRef] [Green Version]
  73. Kumar, V.; Agrawal, P.; Agrawal, S. ALOS PALSAR and Hyperion Data Fusion for Land Use Land Cover Feature Extraction. J. Indian Soc. Remote Sens. 2017, 45, 407–416. [Google Scholar] [CrossRef]
  74. Liu, M.; Dai, Y.; Zhang, J.; Zhang, X.; Meng, J.; Xie, Q. PCA-based sea-ice image fusion of optical data by HIS transform and SAR data by wavelet transform. Acta Oceanol. Sin. 2015, 34, 59–67. [Google Scholar] [CrossRef]
  75. Chavez, W.J.; Sides, S.C.; Anderson, J.A. Comparison of three different methods to merge multiresolution and multispectral data: TM & Spot Pan. Photogramm. Eng. Remote Sens. 1991, 57, 295–303. [Google Scholar]
  76. Siddiqui, Y. The modified IHS method for fusing satellite imagery. In Proceedings of the ASPRS 2003 Annual Conference Proceedings, Anchorage, AK, USA, 5–9 May 2003. [Google Scholar]
  77. Zhou, J.; Civco, D.L.; Silander, J.A. A wavelet transform method to merge Landsat TM and SPOT panchromatic data. Int. J. Remote Sens. 1998, 19, 743–757. [Google Scholar] [CrossRef]
  78. Guan, H.; Yu, J.; Li, J.; Luo, L. Random forests-based feature selection for land-use classification using lidar data and orthoimagery. In Proceedings of the International Archives of the Photogrammetry, Remote Sensing and Spatial Information Sciences, Volume XXXIX-B7, 2012 XXII ISPRS Congress, Melbourne, Australia, 25 August–1 September 2012. [Google Scholar]
  79. Breiman, L. Bagging predictors. Mach. Learn. 1996, 24, 123–140. [Google Scholar] [CrossRef] [Green Version]
  80. Gislason, P.O.; Benediktsson, J.A.; Sveinsson, J.R. Random Forests for land cover classification. Pattern Recognit. Lett. 2006, 27, 294–300. [Google Scholar] [CrossRef]
  81. Tian, S.; Zhang, X.; Tian, J.; Sun, Q.R. Random forest classification of wetland landcovers from multi-sensor data in the arid region of Xinjiang, China. Remote Sens. 2016, 8, 954. [Google Scholar] [CrossRef] [Green Version]
  82. Belgiu, M.; Dragut, L. Random forest in remote sensing: A review of applications and future directions. ISPRS J. Photogramm. Remote Sens. 2016, 114, 24–31. [Google Scholar] [CrossRef]
  83. Corcoran, J.; Knight, J.; Gallant, A. Influence of multi-source and multi-temporal remotely sensed and ancillary data on the accuracy of random forest classification of wetlands in Northern Minnesota. Remote Sens. 2013, 5, 3212–3238. [Google Scholar] [CrossRef] [Green Version]
  84. Van Beijma, S.; Comber, A.; Lamb, A. Random forest classification of salt marsh vegetation habitats using quad-polarimetric airborne SAR, elevation and optical RS data. Remote Sens. Environ. 2014, 149, 118–129. [Google Scholar] [CrossRef]
  85. Daniels, J.; Blumberg, D.G.; Linetsky, M.; Vulfson, L.D.; Kotlyar, A.L.; Freiliker, V.; Ronen, G. Microwave remote sensing of physically buried objects; implications for environmental research. Remote Sens. Environ. 2003, 86, 243–256. [Google Scholar] [CrossRef]
  86. Blumberga, D.J.; Netaa, T.; Margalitb, N.; Lazarc, M.; Freilikher, V. Mapping exposed and buried drainage systems using remote sensing in the Negev Desert, Israel. Geomorphology 2004, 61, 239–250. [Google Scholar] [CrossRef]
  87. Blumberg, D.G. Remote sensing of desert dune forms by polarimetric synthetic aperture radar (SAR). Remote Sens. Environ. 1998, 65, 204–216. [Google Scholar] [CrossRef]
  88. Elachi, C. Spaceborne Radar Remote Sensing: Applications and Techniques; The Institute of Electrical and Electronics Engineers: New York, NY, USA, 1987. [Google Scholar]
  89. Qninba, A.; El Agbani, M.A. Maroc Sebkhat Imlili. FDR pour le Site n° 2323, Sebkhat Imlili, Maroc. 2018. Available online: https://rsis.ramsar.org/ris/2323 (accessed on 1 October 2019).
  90. Emran, A. Le fonctionnement de la Sebkha d’Imlily dévoilé par les images Radar Palsar. Un reliquat de passé dans le Sahara marocain témoin de changement climatique dans des conditions géologiques improbables. In Conférence Régionale « Initiation et Développement de Cartographie Géospatiale Via le Web Pour la Mutualisation et le Partage de L’information Géospatiale»; EMI: Rabat, Morocco, 2016. [Google Scholar]
  91. Abbas, A.; Khan, S.; Hussain, N.; Hanjra, M.A.; Akbar, S. Characterizing soil salinity in irrigated agriculture using a remote sensing approach. Phys. Chem. Earth 2013, 55–57, 43–52. [Google Scholar] [CrossRef]
  92. Bannari, A.; Guedon, A.M.; El-Harti, A.; Cherkaoui, F.Z.; El-Ghmari, A. Characterization of slightly and moderately saline and sodic soils in irrigated agricultural land using simulated data of advanced land imaging (EO-1) sensor. Commun. Soil Sci. Plant Anal. 2008, 39, 2795–2811. [Google Scholar] [CrossRef]
Figure 1. A permanent water cavity in Imlili Sebkha (a) holding a fauna of the Tilapia species (b).
Remotesensing 12 00131 g001
Figure 2. Location of Imlili Sebkha and its saltwater cavities. (A) Morocco, (B,C) location of sebkha, (D) prospected part of sebkha containing several water holes as viewed from Google Earth (16 January 2018).
Remotesensing 12 00131 g002
Figure 3. (a) Digital Elevation Model (DEM) with a hydrologic network and water cavities, (b) Sentinel-1 C-band (central frequency of 5.404 GHz) Level-1 GRD, (c) Landsat Thematic Mapper TM-2004, and (d) Sentinel-2 MultiSpectral Instrument (MSI) 2019 used in the study.
Remotesensing 12 00131 g003
Figure 4. (a) the All Band Water Index and the Normalised Difference Salinity Index (ABWI, NDSI) feature space and the regression line, and (b) the Microwave-Normalized Difference Polarization Index and Salt Water Cavity Index (MNDPI, SWCI) feature space and the regression line.
Remotesensing 12 00131 g004
Figure 5. Schematic overview of the methodological approach.
Remotesensing 12 00131 g005
Figure 6. Monitoring of NDSI from 1984 to 2019 (ae) spatial distribution and soil salinization measured in the field, and (f) correlation between NDSI from Sentinel-2 MSI 2017 and the salt content field measurements.
Remotesensing 12 00131 g006
Figure 7. (ae) Soil salinization spatial class distribution from 1984 to 2019 versus the soil salt measured in the field and reclassified into two classes, and (f) salinization states of the saltwater cavities extracted from the classified NDSI.
Remotesensing 12 00131 g007
Figure 8. (ae) SWCI signal reclassified into four classes from dry to very wet saltwater cavities from 1984 to 2019 versus the depth of the saltwater cavities measured in the field and reclassified into two classes, and (f) wet/dry state statistics of the saltwater cavities extracted from the classified SWCI.
Remotesensing 12 00131 g008
Figure 9. (ae) Moisture map obtained from the reclassification of the MNDPI signal into four classes from non-moisture to high moisture of the water holes from 2015 to 2019 versus the depth of the saltwater cavities measured in the field and reclassified into two classes, and (f) moisture state statistics of the saltwater cavities extracted from MNDPI.
Remotesensing 12 00131 g009
Figure 10. (a) The Sar/Optic Saltwater Cavity Index (SOSWCI) signal reclassified into five classes from 2017 versus the depth of saltwater cavities measured in the field and reclassified into two classes; (b) dry/wet states of saltwater cavities for 2017, wet/dry states statistics of saltwater cavities; (c) data extracted from the classified SOSWCI for 2017; (d) data measured in the field for the same year and reclassified into four classes.
Remotesensing 12 00131 g010
Figure 11. (a) RGB color composite of Sentinel-2 MSI, (b) the Sentinel-1 SAR merged with the Sentinel-2 MSI image showing the buried hydrographic network (blue) highlighted by the radar data and the superficial hydrographic network (yellow) highlighted by the optic data.
Remotesensing 12 00131 g011
Figure 12. (a) Random forest classification applied to the 11 multibands dataset of 2017, and (b) the same image superposed to the position of the water cavities.
Remotesensing 12 00131 g012
Figure 13. (a) Precipitation graph from 1985 to 2019 generated by using the ClimateEngine platform, and (b) mean annual precipitation graph obtained from [92].
Remotesensing 12 00131 g013
Figure 14. Temporal variation of the interannual summer precipitation anomaly (%) between 1971 and 2010 [92].
Remotesensing 12 00131 g014
Figure 15. Monitoring of four salt cavities denoted by the yellow, green, blue, and red circles from 2014 to 2018.
Remotesensing 12 00131 g015
Table 1. Area (m2) and depth (cm) of the permanent water cavities of Imlili Sebkha.
Minimum Surface0.015Minimum Depth20.115
Maximum Surface472.617Maximum Depth460
Mean Surface18.769Mean Depth80
Standard Deviation43.477Standard Deviation73.57
Table 2. Datasets used in this study and the spectral and polarimetric indices extracted from these data.
Data SourceCharacteristicsExtracted Indices
Optical Imagery280 individual 30-m TM/Landsat-5 images acquired from the study area in 1984, 1994 and 2004—Water index used in this study (ABWI)
—Normalised Difference Salinity Index (NDSI)—Salt Water Cavity Index (SWCI)
—Sar/Optic Saltwater Cavity Index (SOSWCI)
83 individual 10-m MSI/Sentinel-2A images acquired from the study area in 2017
50 individual 10-m MSI/Sentinel-2A images acquired from the study area in 2019
Radar Imagery211 individual Sentinel-1 SAR ground-range-detected images collected at a 10 m spatial resolution from 2015 to present—Microwave-Normalised Difference Polarisation Index (MNDPI)
—SAR/Optic Salt Cavity Index (SOSWCI)
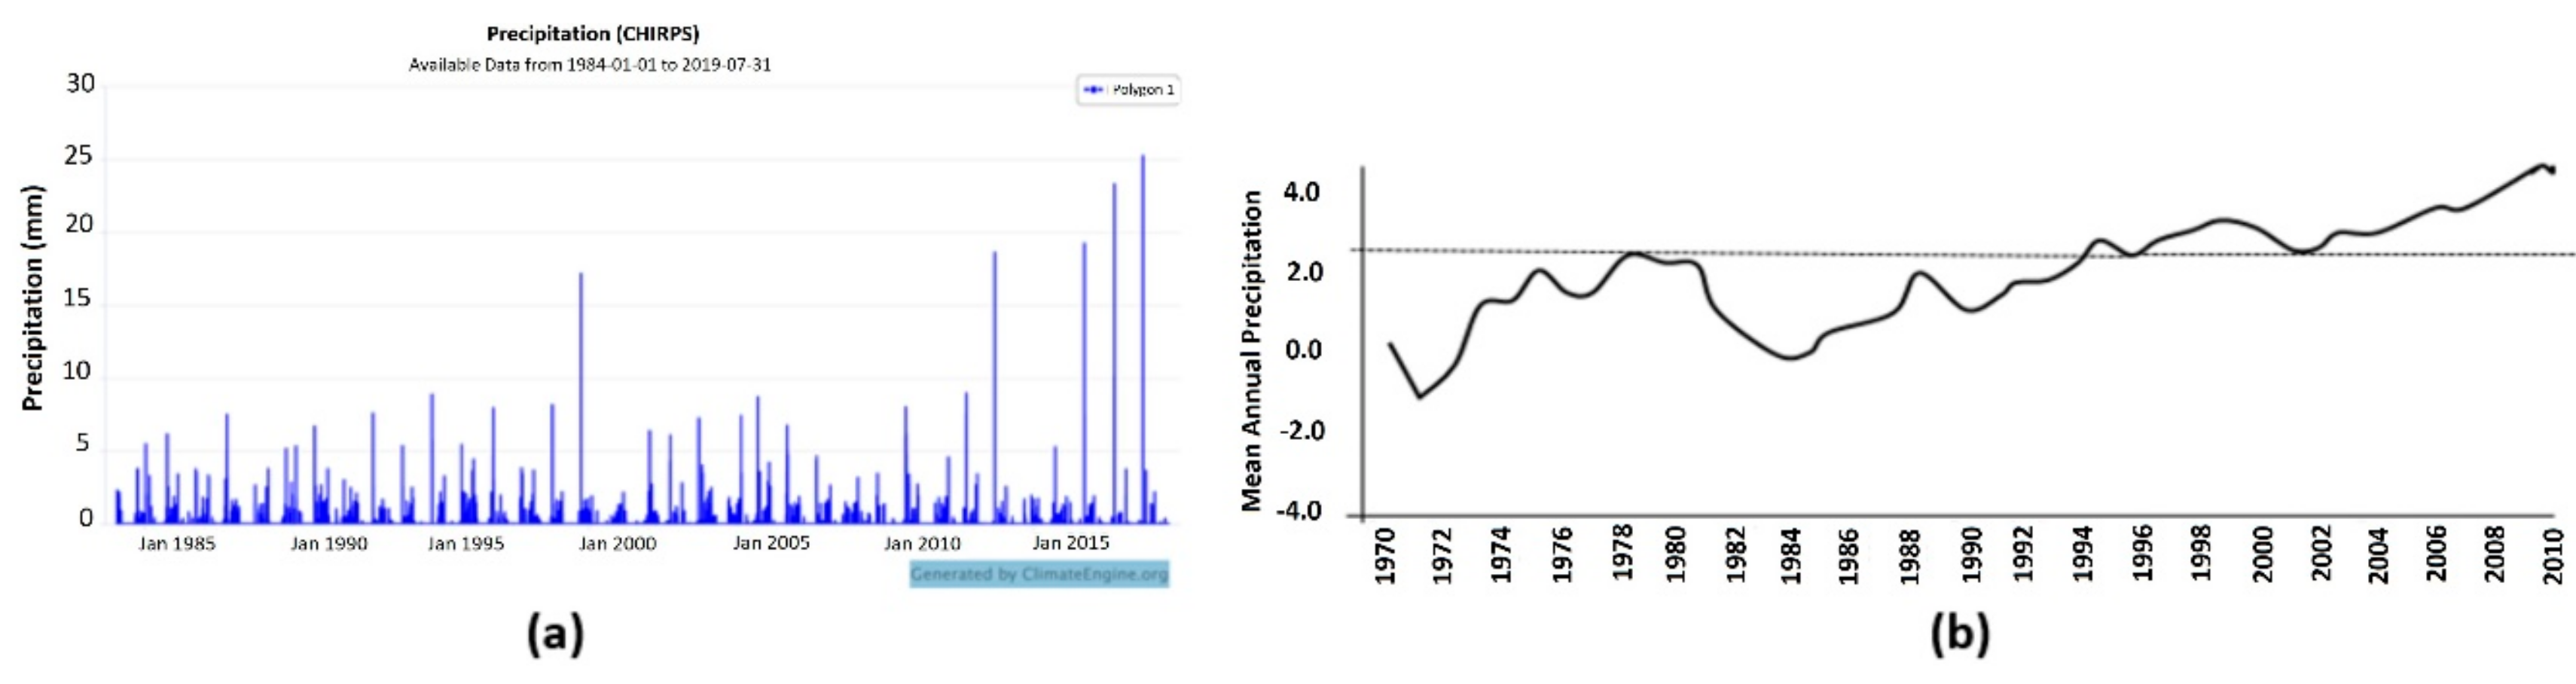
Reference Data
CHIRPS Precipitation Data
Vector-point-based data that represent the position of water cavities
Spatial: 0.05° Date range: 1985–2019
Water cavities characteristics in the attribute table
Precipitation graph generated by ClimateEngine.org
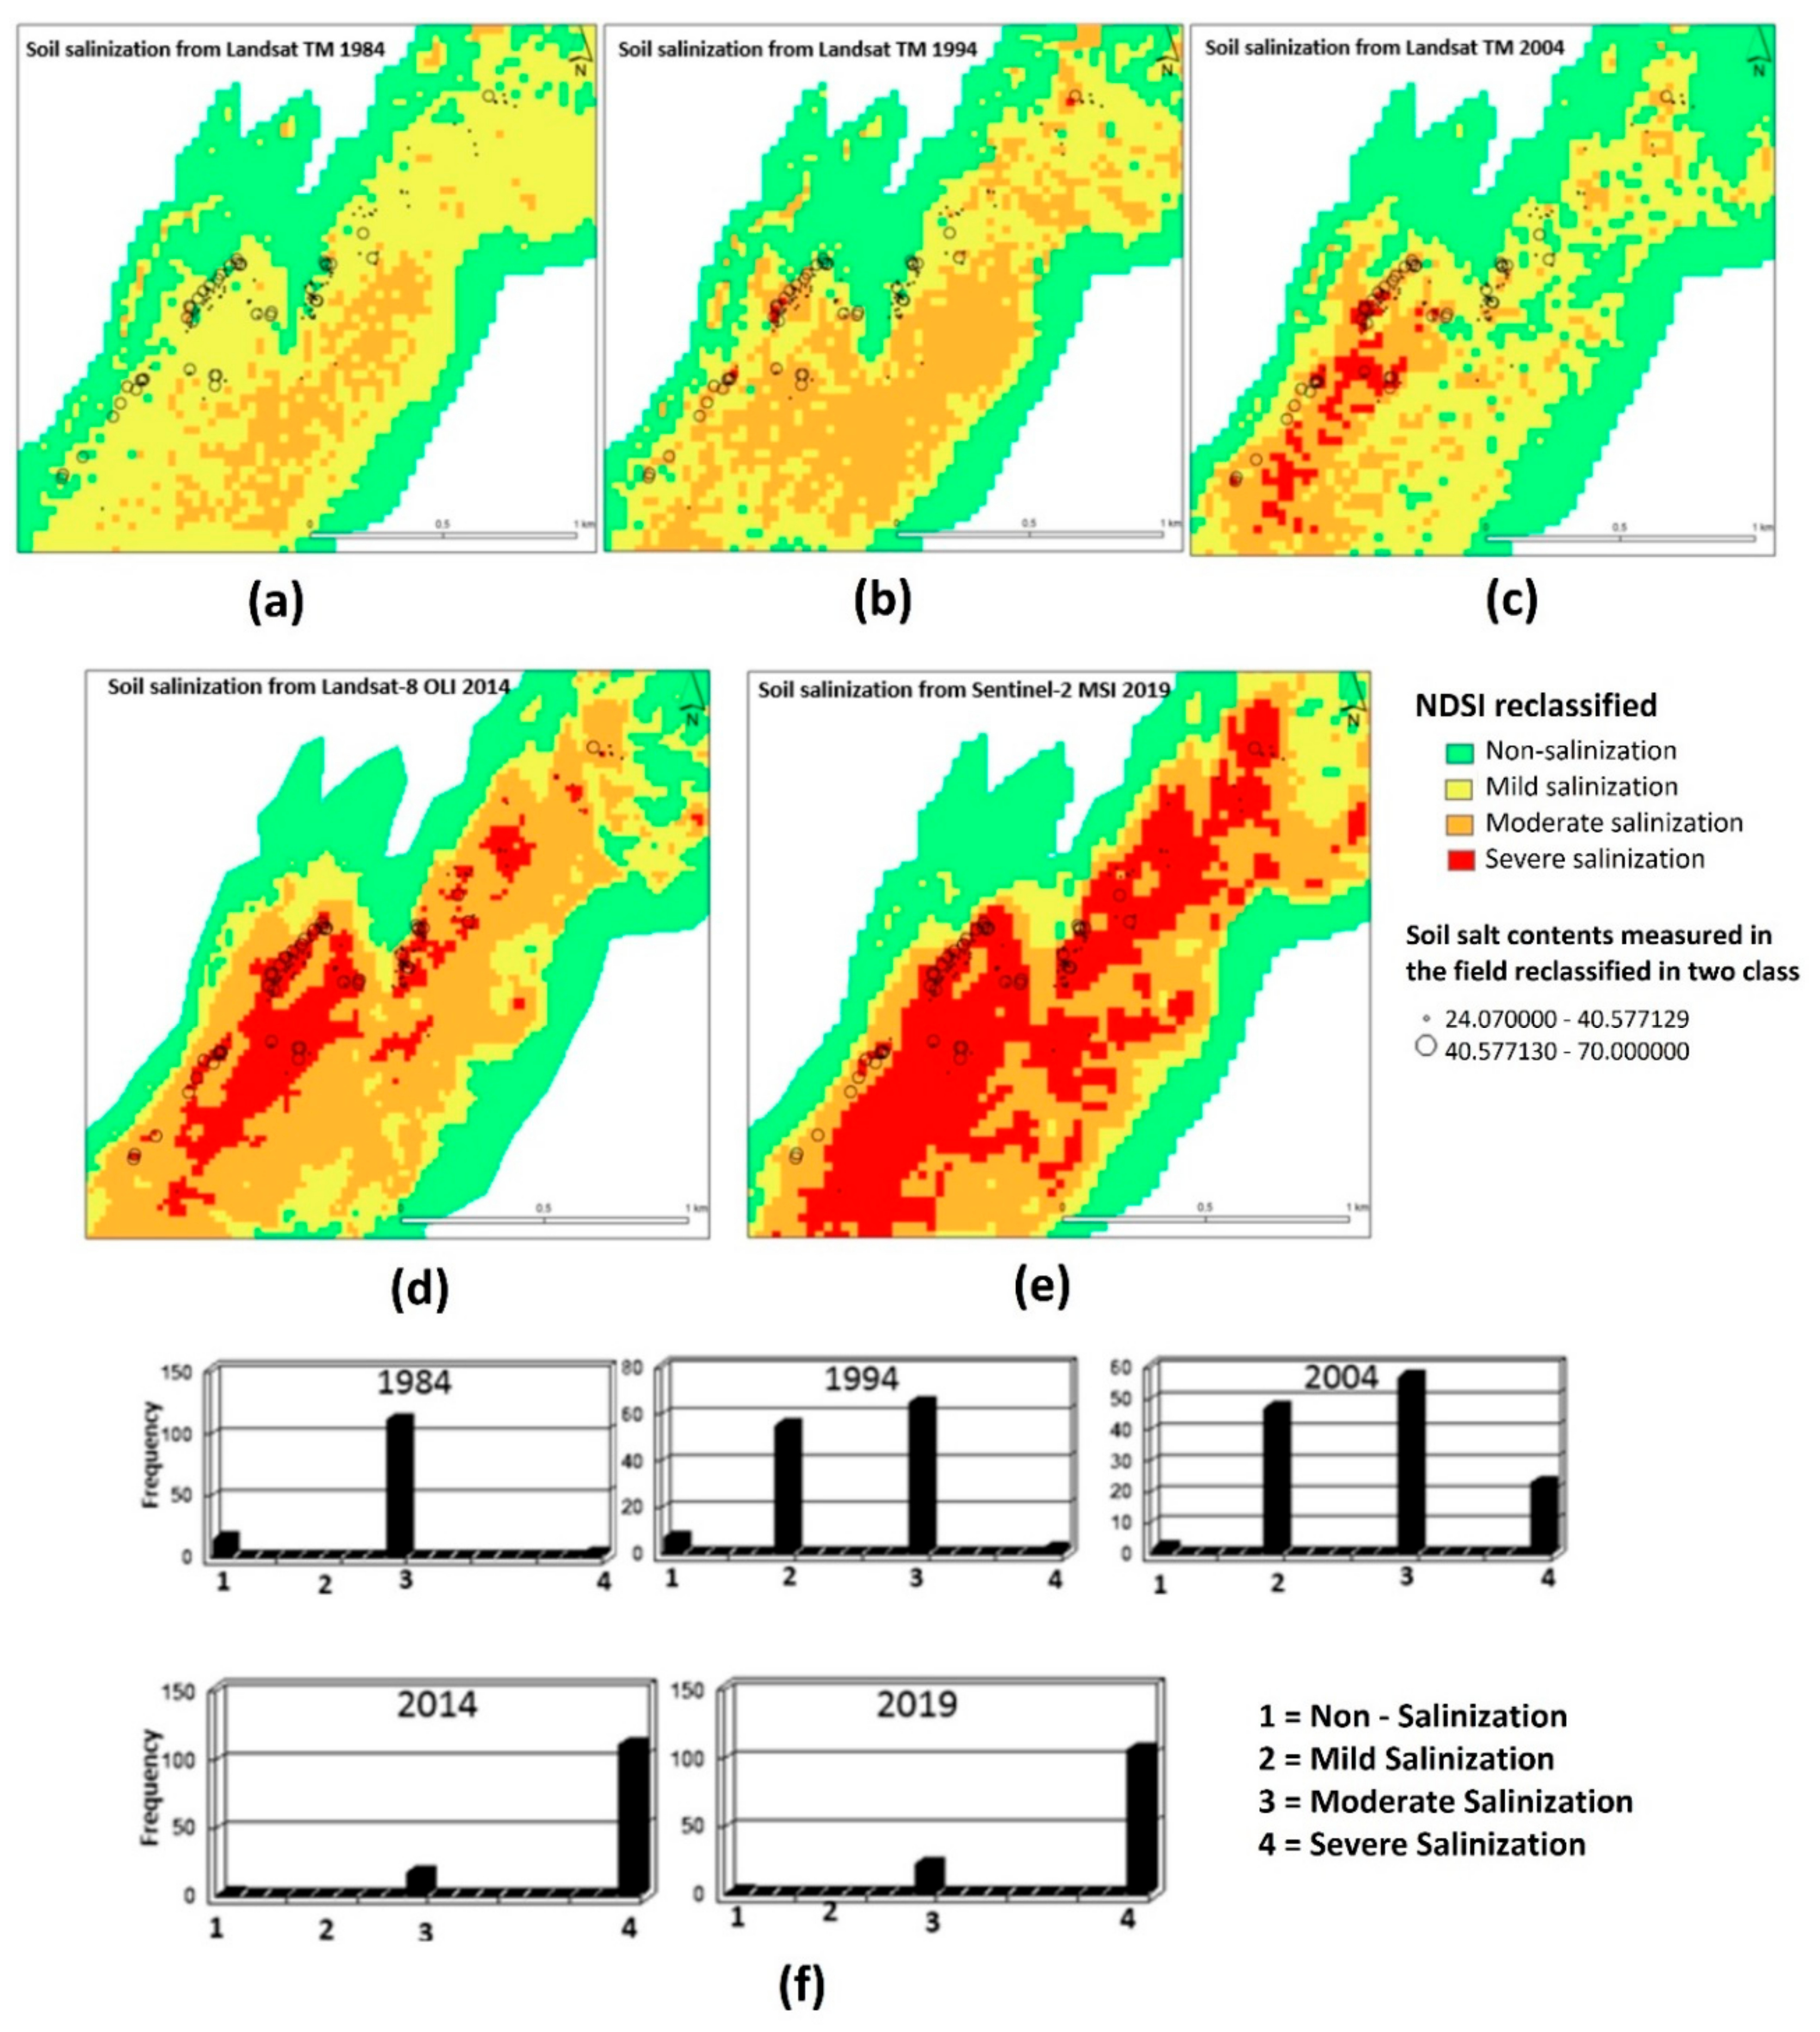
Table 3. Salinization classification from the literature.
NDSINon-SalinisationMild SalinisationModerate SalinisationSevere Salinisation
Landsat≤0.20.2–0.40.4–0.8≥0.8
Table 4. Pixel counts of the error matrix with overall accuracy (OA).
ClassAccuracy Assessment %
Reference (Ground Thruth)123456 n + j O e r U i P i OA
17722012848.391.796.293.2
20741020773.99692.5
32173110786.493.691.2
401276108089295
51112742818.691.492.5
601111757959595
n + j 808080808097479
C e r 3.757.58.7557.55

