Article

Real-Time GNSS-Derived PWV for Typhoon Characterizations: A Case Study for Super Typhoon Mangkhut in Hong Kong

1
Jiangsu Key Laboratory of Resources and Environmental Information Engineering, China University of Mining and Technology, Xuzhou 221116, China
2
School of Environment Science and Spatial Informatics, China University of Mining and Technology, Xuzhou 221116, China
3
Satellite Positioning for Atmosphere, Climate and Environment (SPACE) Research Centre, RMIT University, Melbourne VIC 3001, Australia
4
College of Geomatics, Xi’an University of Science and Technology, Xi’an 710054, China
5
Academy of Opto-Electronics, Chinese Academy of Sciences, Beijing 100094, China
*
Author to whom correspondence should be addressed.
Remote Sens. 2020, 12(1), 104; https://doi.org/10.3390/rs12010104
Submission received: 30 October 2019 / Revised: 20 December 2019 / Accepted: 22 December 2019 / Published: 27 December 2019
(This article belongs to the Section Atmospheric Remote Sensing)

Abstract

:
Typhoons can be serious natural disasters for the sustainability and development of society. The development of a typhoon usually involves a pre-existing weather disturbance, warm tropical oceans, and a large amount of moisture. This implies that a large variation in the atmospheric water vapor over the path of a typhoon can be used to study the characteristics of the typhoon. This is the reason that the variation in precipitable water vapor (PWV) is often used to capture the signature of a typhoon in meteorology. This study investigates the usability of real-time PWV retrieved from global navigation satellite systems (GNSS) for typhoons’ characterizations, and especially, the following aspects were investigated: (1) The correlation between PWV and atmospheric parameters including pressure, temperature, precipitation, and wind speed; (2) water vapor transportation during a typhoon period; and (3) the correlation between the movement of a typhoon and the transportation of water vapor. The case study selected for this research was Super Typhoon Mangkhut that occurred in mid-September 2018 in Hong Kong. The PWV time series were obtained from a conversion of GNSS-derived zenith total delays (ZTDs) using observations at 10 stations selected from the Hong Kong GNSS continuously operating reference stations (CORS) network, which are also located along the path of the typhoon. The Bernese GNSS Software (ver. 5.2) was used to obtain the ZTDs; and the root mean square (RMS) of the differences between the GNSS-ZTDs and International GNSS Service post-processed ZTDs time series was less than 8 mm. The RMS of the differences between the GNSS-PWVs (i.e., the ZTDs converted PWVs) and radiosonde-derived PWVs (RS-PWVs) time series was less than 2 mm. The changes in PWV reflect the variation in wind speed during the typhoon period to a certain degree, and their correlation coefficient was 0.76, meaning a significant positive correlation. In addition, a new approach was proposed to estimate the direction and speed of a typhoon’s movement using the time difference of PWV arrival at different sites. The direction and speed estimated agreed well with the ones published by the China Meteorological Administration. These results suggest that GNSS-derived PWV has a great potential for the monitoring and even prediction of typhoon events, especially for near real-time warnings.

Graphical Abstract

1. Introduction

Tropical cyclones (TCs) are frequent and extreme weather events and have often caused significant damages in property and severely threatened the safety of human life [1]. Many coastal countries have been affected by TCs and have experienced serious economic losses. This is why many national central and local meteorological departments have paid great attention to typhoon forecasting [2]. A TC often carries a large amount of water vapor as it arrives in an area, thus the measurements of the spatio-temporal variations in water vapor may be used to predict the movement, intensity, and precipitation of the TC [3,4].
Traditional water vapor detection technologies including radiosonde (RS), microwave radiometer, solar photometer, and satellite remote sensing, have some technology-specific disadvantages [5,6,7,8], e.g., low spatial and temporal resolutions, and uneven accuracy. These disadvantages often lead to difficulties in monitoring rapid variations of water vapor, especially when extreme weather events occur. The global navigation satellite systems (GNSS) meteorology (GNSS-meteorology) as a relatively new means of measuring atmospheric water vapor, was first proposed by Bevis et al. [9]. The GNSS-meteorology technology has experienced significant development in the past two decades with the development of GNSS technology. Nowadays, with the establishment of various scales of regional GNSS continuously operating reference station (CORS) networks all over the world, GNSS data from such networks have been used to retrieve atmospheric water vapor for the region of interest. Most importantly, real-time high accuracy GNSS-derived precipitable water vapor (GNSS-PWV) can be achieved through the recent advances in International GNSS Service (IGS) real-time products. This makes it possible to predict short-term extreme weather events. For example, several scholars suggested that water vapor retrieved from GNSS could achieve a 1–3 mm accuracy [10,11,12,13], thus GNSS has been widely used in meteorological researches. Many previous studies for extreme weather events were mainly related to the spatio-temporal distribution and variability of water vapor, and even in the field of precipitation forecasting [14,15,16,17]. Recently, Sangiorgio et at. [18] applied advanced deep learning predictors to forecasting the occurrence of extreme rainfalls and the accuracy of the deep neural networks model was improved effectively when the tropospheric zenith total delay (ZTD) was added to the traditional meteorological data. Whilst the transportation of water vapor may reflect the developments of a typhoon as well as precipitation events, the variations in precipitable water vapor (PWV) usually show some different characteristics before and after the time a typhoon occurs [19,20,21,22]. Although numerous studies have shown that the variations in PWV can reflect information of a typhoon’s landing [19,20,21], hardly any mathematical models established for the correlation between PWV and a typhoon’s movement can be found.
This study’s aim was to use PWV time series converted from the ZTD time series estimated from GNSS measurements in the real-time processing mode (this ZTD is named GNSS-ZTD and its converted PWV is named GNSS-PWV hereafter) and relevant atmospheric parameters to investigate the relationship between PWV and the movement of a typhoon for providing of useful information for short-term, or even real-time TCs forecasting. A case study for Super Typhoon Mangkhut recently occurred in Hong Kong was presented. The data over 10 GNSS stations selected from the Hong Kong CORS network during the period the typhoon occurred were used for the test, and the Bernese software v5.2 [23] was used to estimate the ZTD time series. The characteristics of the variations in PWV and atmospheric parameters including temperature, pressure, precipitation, and wind speed during the typhoon period were analyzed. Finally, a method using time difference of PWV arrival to estimate the movement speed of a typhoon is proposed and validated.

2. Materials and Method

2.1. Determination of GNSS-PWV

When a satellite signal propagates from the satellite to a GNSS receiver, the signal is delayed due to the influence of the atmosphere (including both troposphere and ionosphere) along the signal path. In GNSS applications, simultaneous signals from all satellites in view are collected at a ground station/receiver. In GNSS data processing algorithms, for reducing the number of unknown parameters to be solved in the observation equations, all these simultaneous atmospheric delays at an observing epoch, which are usually slant, are reduced to the one that is in the station’s zenith direction using a mapping function of projection. As a result, only the ZTD at each epoch needs to be estimated for the atmospheric parameter over the station [24,25,26]. The ZTD can be divided into zenith hydrostatic delay (ZHD) and zenith wet delay (ZWD). The former can be obtained at a high accuracy from a standard empirical model [27]. However, the latter cannot be obtained in the same way due to the fact that it is mainly caused by water vapor, which varies in both spatial and temporal domains, i.e., it is difficult to predict the ZWD accurately, thus it is usually estimated from GNSS observations.
Several standard empirical models can be used to calculate or predict the ZHD value such as the Hopfield model, Saastamoinen model, Black model, and Davis model, and the Saastamoinen model is commonly used in the fields of GNSS meteorology [28,29,30,31,32]. The Saastamoinen model is expressed as:
ZHD   =   2.2767 P s f ( φ 0 , H 0 )
where Ps is the surface pressure (unit: hPa); φ0 and H0 are the geographic latitude and geodetic height of the station (unit: km), respectively; f(φ0, H0) is the acceleration of gravity in the direction of the vertical atmospheric column over the station, and can be expressed as:
f ( φ 0 , H 0 )   =   1 0.00266 cos 2 φ 0 0.00028 h 0 .
Since the ZTD can be estimated from GNSS data processing, i.e., the GNSS-ZTD, then the ZWD can be obtained by subtracting the ZHD of Equation (1) from the GNSS-ZTD.
Then, the ZWD can be converted into PWV by the following formula:
PWV   =   ZWD Π
where Π is the PWV conversion factor, and is expressed as:
Π = 10 6 ρ w R w ( K 2 + K 3 / T m )
where ρw is the density of liquid water (unit: kg/m3); Rw is the specific gas constant for water vapor; Tm is the weighted-mean temperature of the atmosphere (unit: K); K2′ and K3 are two atmospheric refractivity constants.
The numerical expression of Tm in Equation (4) is:
T m = H + e T d h H + e T 2 d h
where e is the water vapor pressure; T is the absolute temperature; dh is the increment along the vertical integral path.
Equation (5) is only a theoretical form since precise e and T profiles can hardly be acquired. In practice, an approximate form that uses a numerical approach, in which the e and T values at various heights obtained from RS data are used. However, due to the low temporal resolution of RS data, this result is still not desirable for GNSS meteorological applications. To address this, a regional Tm regression model is often used, e.g., the Bevis empirical model [9] which was established based on RS data from the 27° ~ 65° north latitude areas with the accuracy of 4.74 K in early 1990s. However, this model may not perform well for the other regions, e.g., in the Hong Kong region. Thus, we developed a local regression model based on RS data of two years (2016 and 2017) from the Hong Kong Kings Park station (NO: 45004), similar to the Bevis model. The regression model is:
Tm = 0.6195Ts + 103.3452
where Ts is in the unit of Kelvin; Tm is the weighted-mean temperature over the site.
This model was tested using RS data of one year in 2017. Results showed the accuracy of the model was 2.29 K. Substituting Equation (6) into Equation (4), can obtain the PWV conversion factor, then Equation (3) can be used to obtain the PWV value over the station.

2.2. Data Source and Date Processing

To analyze the characteristics of the variations in PWV, rainfall, temperature, and pressure, and also the correlation between some of them, a variety of data sources was used. In addition, the accuracy of GNSS-ZTD and GNSS-PWV time series were assessed by comparing them against IGS post-processing ZTD (IGS-ZTD) and RS-derived PWV (RS-PWV), respectively.
The datasets and products used in this study include:
(1) Ground-based GNSS, temperature, and pressure observations with the sampling intervals of 30 s, 1 min, and 1 min, respectively, from 10 selected GNSS stations (the mean inter-distance between GNSS stations is about 11 km) with meteorological observing equipment in the Hong Kong Satellite Positioning Reference Station Network (https://www.geodetic.gov.hk/smo/gsi/programs/gb/index. htm);
(2) Ultra-rapid products (IGU) including satellite orbits and clocks from the IGS (ftp://cddis.gsfc. nasa.gov/) for GNSS data processing;
(3) RS (NO:45004) data with a 12 h time resolution from the University of Wyoming’s department of atmospheric sciences (http://weather.uwyo.edu/upperair/sounding.html) for the validation of GNSS-PWV;
(4) Ground wind speed data with a 30 min time resolution from the atmospheric administration’s science and technology division server website (https://www.ncei.noaa.gov /data/global-hourly/ access/);
(5) Precipitation with a 1 h time resolution from the Hong Kong Observatory (http:// gb.weather.gov.hk/wxinfo/rainfall/rf_record_e.shtml);
(6) Post-processed ZTDs with a 5 min time resolution provided from IGS (ftp:// cddis.gsfc.nasa.gov/pub/gps/products/troposphere/zpd) for the validation of GNSS-ZTD;
(7) Daily mean wind speed, pressure, temperature, and precipitation from five automatic weather stations (hereinafter referred to as weather stations) including the Hong Kong International Airport (HKIA), Cheung Chau (CGCU), King’s Park (KSPK), Ta Kwu Ling (TKLG), and Wetland Park (WDPK) stations in the Hong Kong Observatory (https://www.weather.gov.hk/cis/stn_e.htm), which were used to describe the general, synoptic situation over Hong Kong and not used in further analysis.
The times for the above datasets were all in September 2018. Specifically, the above (1–6) datasets were in the period of 7–25 September 2018, and the (7) dataset covered the whole month. Figure 1 shows the geographic distribution of all the 18 stations at which the abovementioned various types of data were collected, including one anemometer, 10 CORS stations, one precipitation station, one RS station, and five weather stations.
For the estimation of ZTD time series from GPS measurements, the Bernese software V5.2 and the double-difference approach were adopted; the elevation cut-off angle for the selection of GNSS data was 5°; the global mapping function (GMF) model was used for the mapping function for the calculation of the ZHD. The time system in this study all refers to the Hong Kong local time, 8 h ahead of the UTC time.

2.3. Accuracy of ZTD

The GNSS-ZTD time series solved using IGU satellite products is the so-called real-time ZTD (RT-ZTD), and their accuracies were assessed by comparing them against those IGS-ZTD. The IGS-ZTD is the post-processed product resulting from the IGS final orbit, with the time resolution of 5 min and accuracy of 5 mm [33] and was used as the reference. The difference between the two sets of ZTDs indicates the accuracy of the RT-ZTD. The Hong Kong Siu Lang Shui (HKSL) and Hong Kong Wong Shek (HKWS) stations are in the list of IGS continuous observation and tracking stations, so the two stations were selected for tests. First of all, it is necessary to ensure that the accuracy of the RT-ZTD meets the requirements of PWV for meteorological applications. Figure 2 shows the test results of the RT-ZTD and IGS-ZTD time series and their differences over the HKSL and HKWS stations during the period of 7–25 September 2018.
It can be seen that the RT-ZTD time series at both stations agree well with the IGS-ZTD without obvious deviation. For an evaluation of the overall difference between these two time series, statistics including bias and standard deviation (STD) and root mean square (RMS) were calculated according to the following definitions.
b i a s = i = 1 n d d i n
RMS = i = 1 n d d i 2 n
STD = i = 1 n ( d d i d d ¯ ) 2 n
where ddi is the difference between the ith RT-ZTD and IGS-ZTD in the time series; n is the number of sample data in the statistic; d d ¯ is the mean of all ddi.
The statistic results of the time series shown in Figure 2 are listed in Table 1. The bias values of the two stations mean that the RT-ZTD time series is systematically 3 mm larger than the IGS-ZTD, and the RMS values indicate that the accuracies of the RT-ZTD are better than 8 mm. This accuracy meets the threshold value of 15 mm required for the accuracy of the ZTD input into a numerical weather prediction model used in meteorological applications [34,35].

2.4. Accuracy of PWV

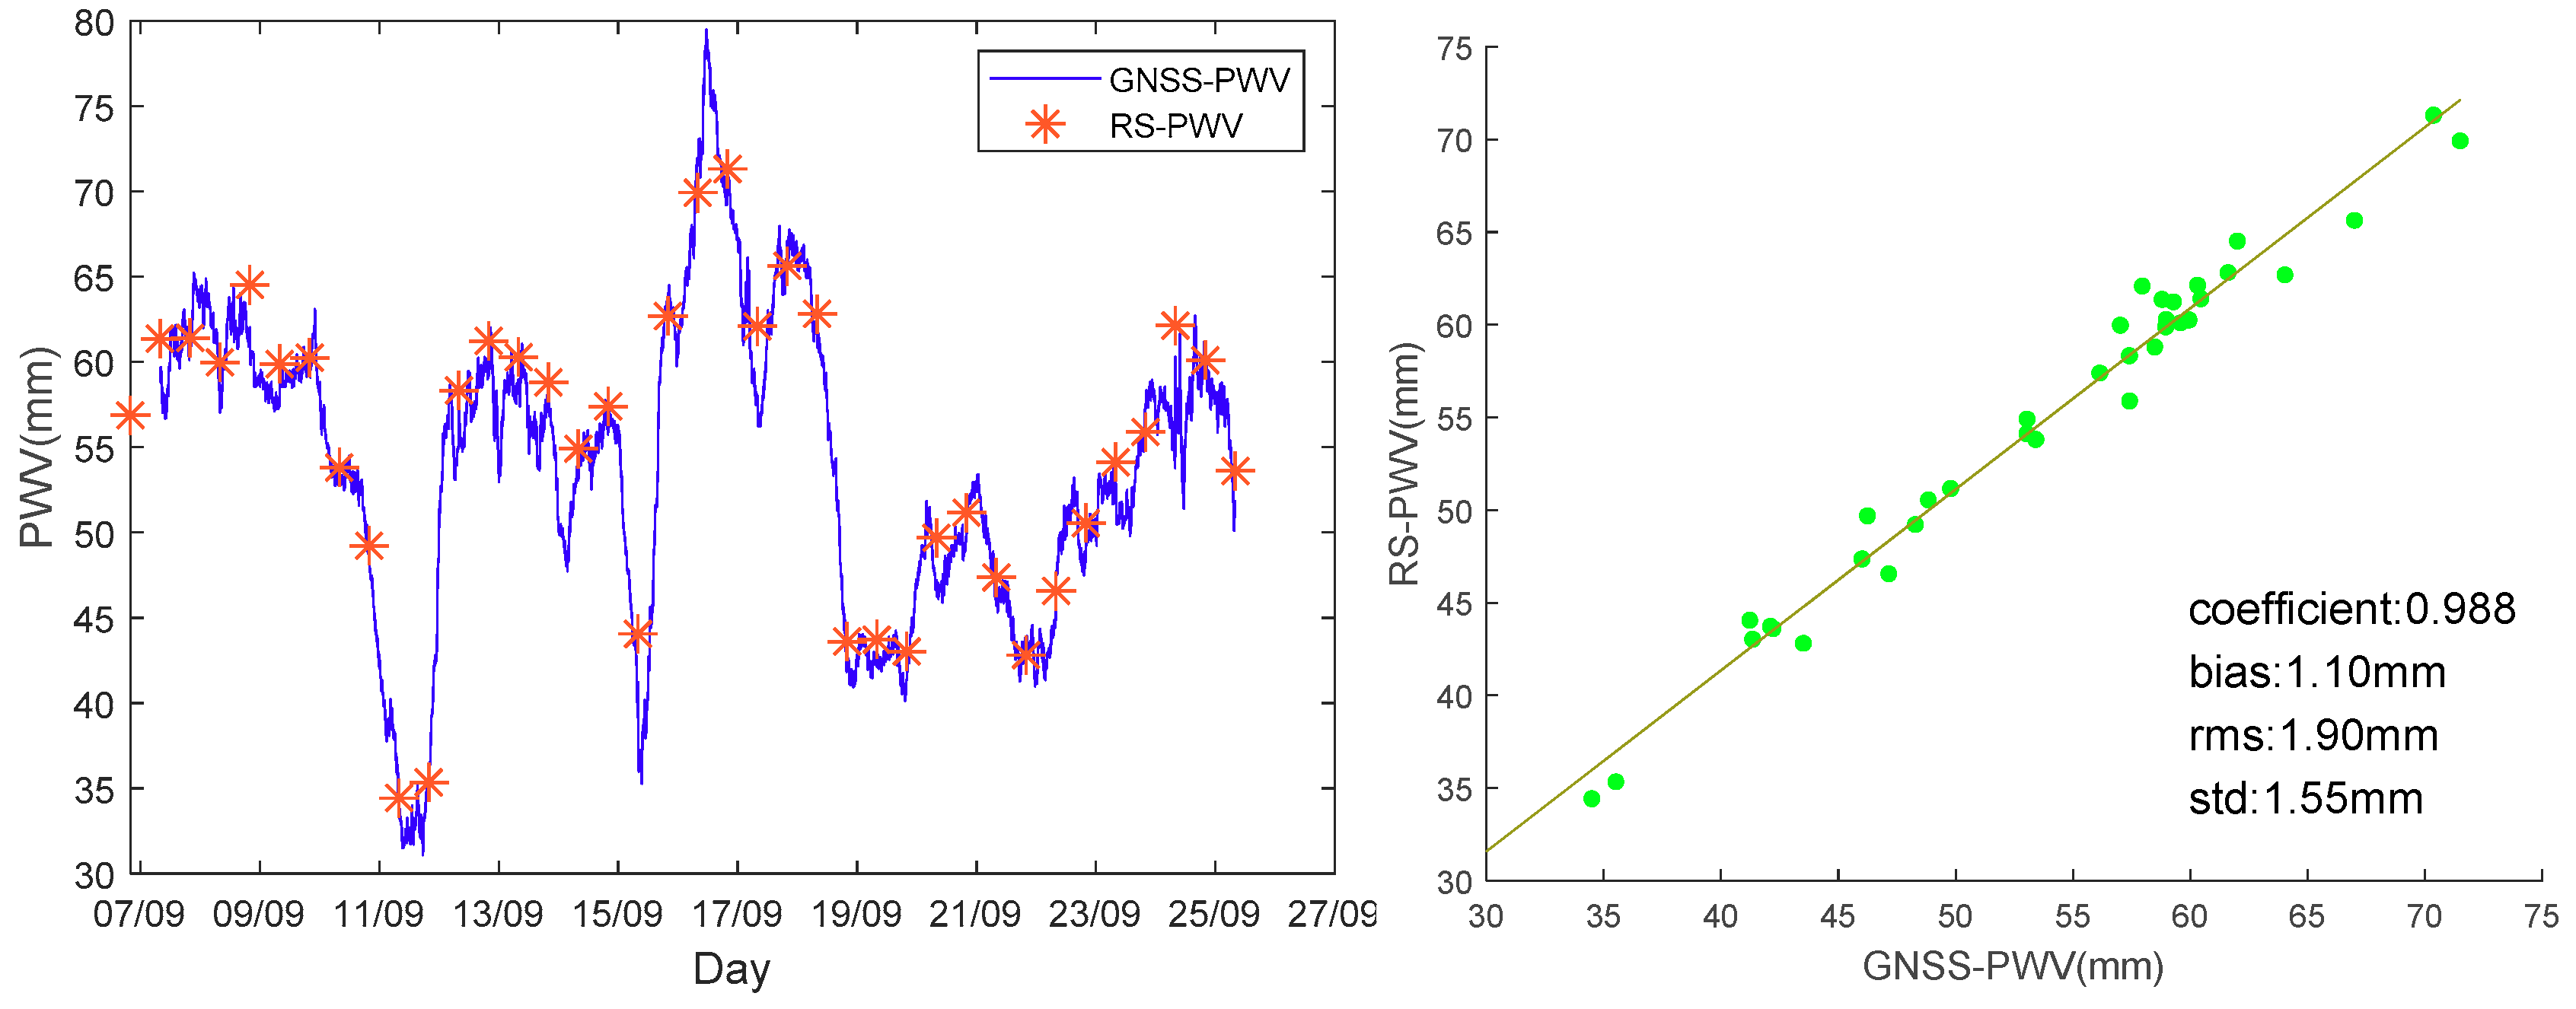
For the assessment of the GNSS-PWV values converted from the RT-ZTD time series, the Hong Kong Stonecutters Island (HKSC) station was selected for the test because it is the station that is closest to the RS station (the distance and height difference between them are about 3 km and 43 m, respectively) in the Hong Kong region, thus they can be considered co-located. PWV derived from RS data (i.e., RS-PWVs) was used as the reference for the GNSS-PWV since they are more precise than GNSS-PWVs [36,37]. These data are updated twice a day at 08:00 (UTC 00:00) and 20:00 (UTC 12:00). Figure 3 shows the GNSS-PWV time series and discrete RS-PWV values (see the left subfigure), and some statistics of the differences between the two results (see the right subfigure) during the period of 7–25 September 2018. It should be noted that the green points shown in the right subfigure indicate that only those GNSS-PWVs whose epochs were the same as that of the RS-PWVs were used to obtain the statistics.
As can be seen from Figure 3, both the GNSS-PWV and RS-PWV agree well. The bias, STD, and RMS of the differences between the two sets of data were 1.10 mm, 1.55, and 1.90 mm, respectively, and their correlation coefficient was 0.988. This GNSS-PWV result meets the accuracy required by relevant meteorological applications such as weather forecasts [38,39].

3. Results

3.1. Overview of Typhoon Mangkhut

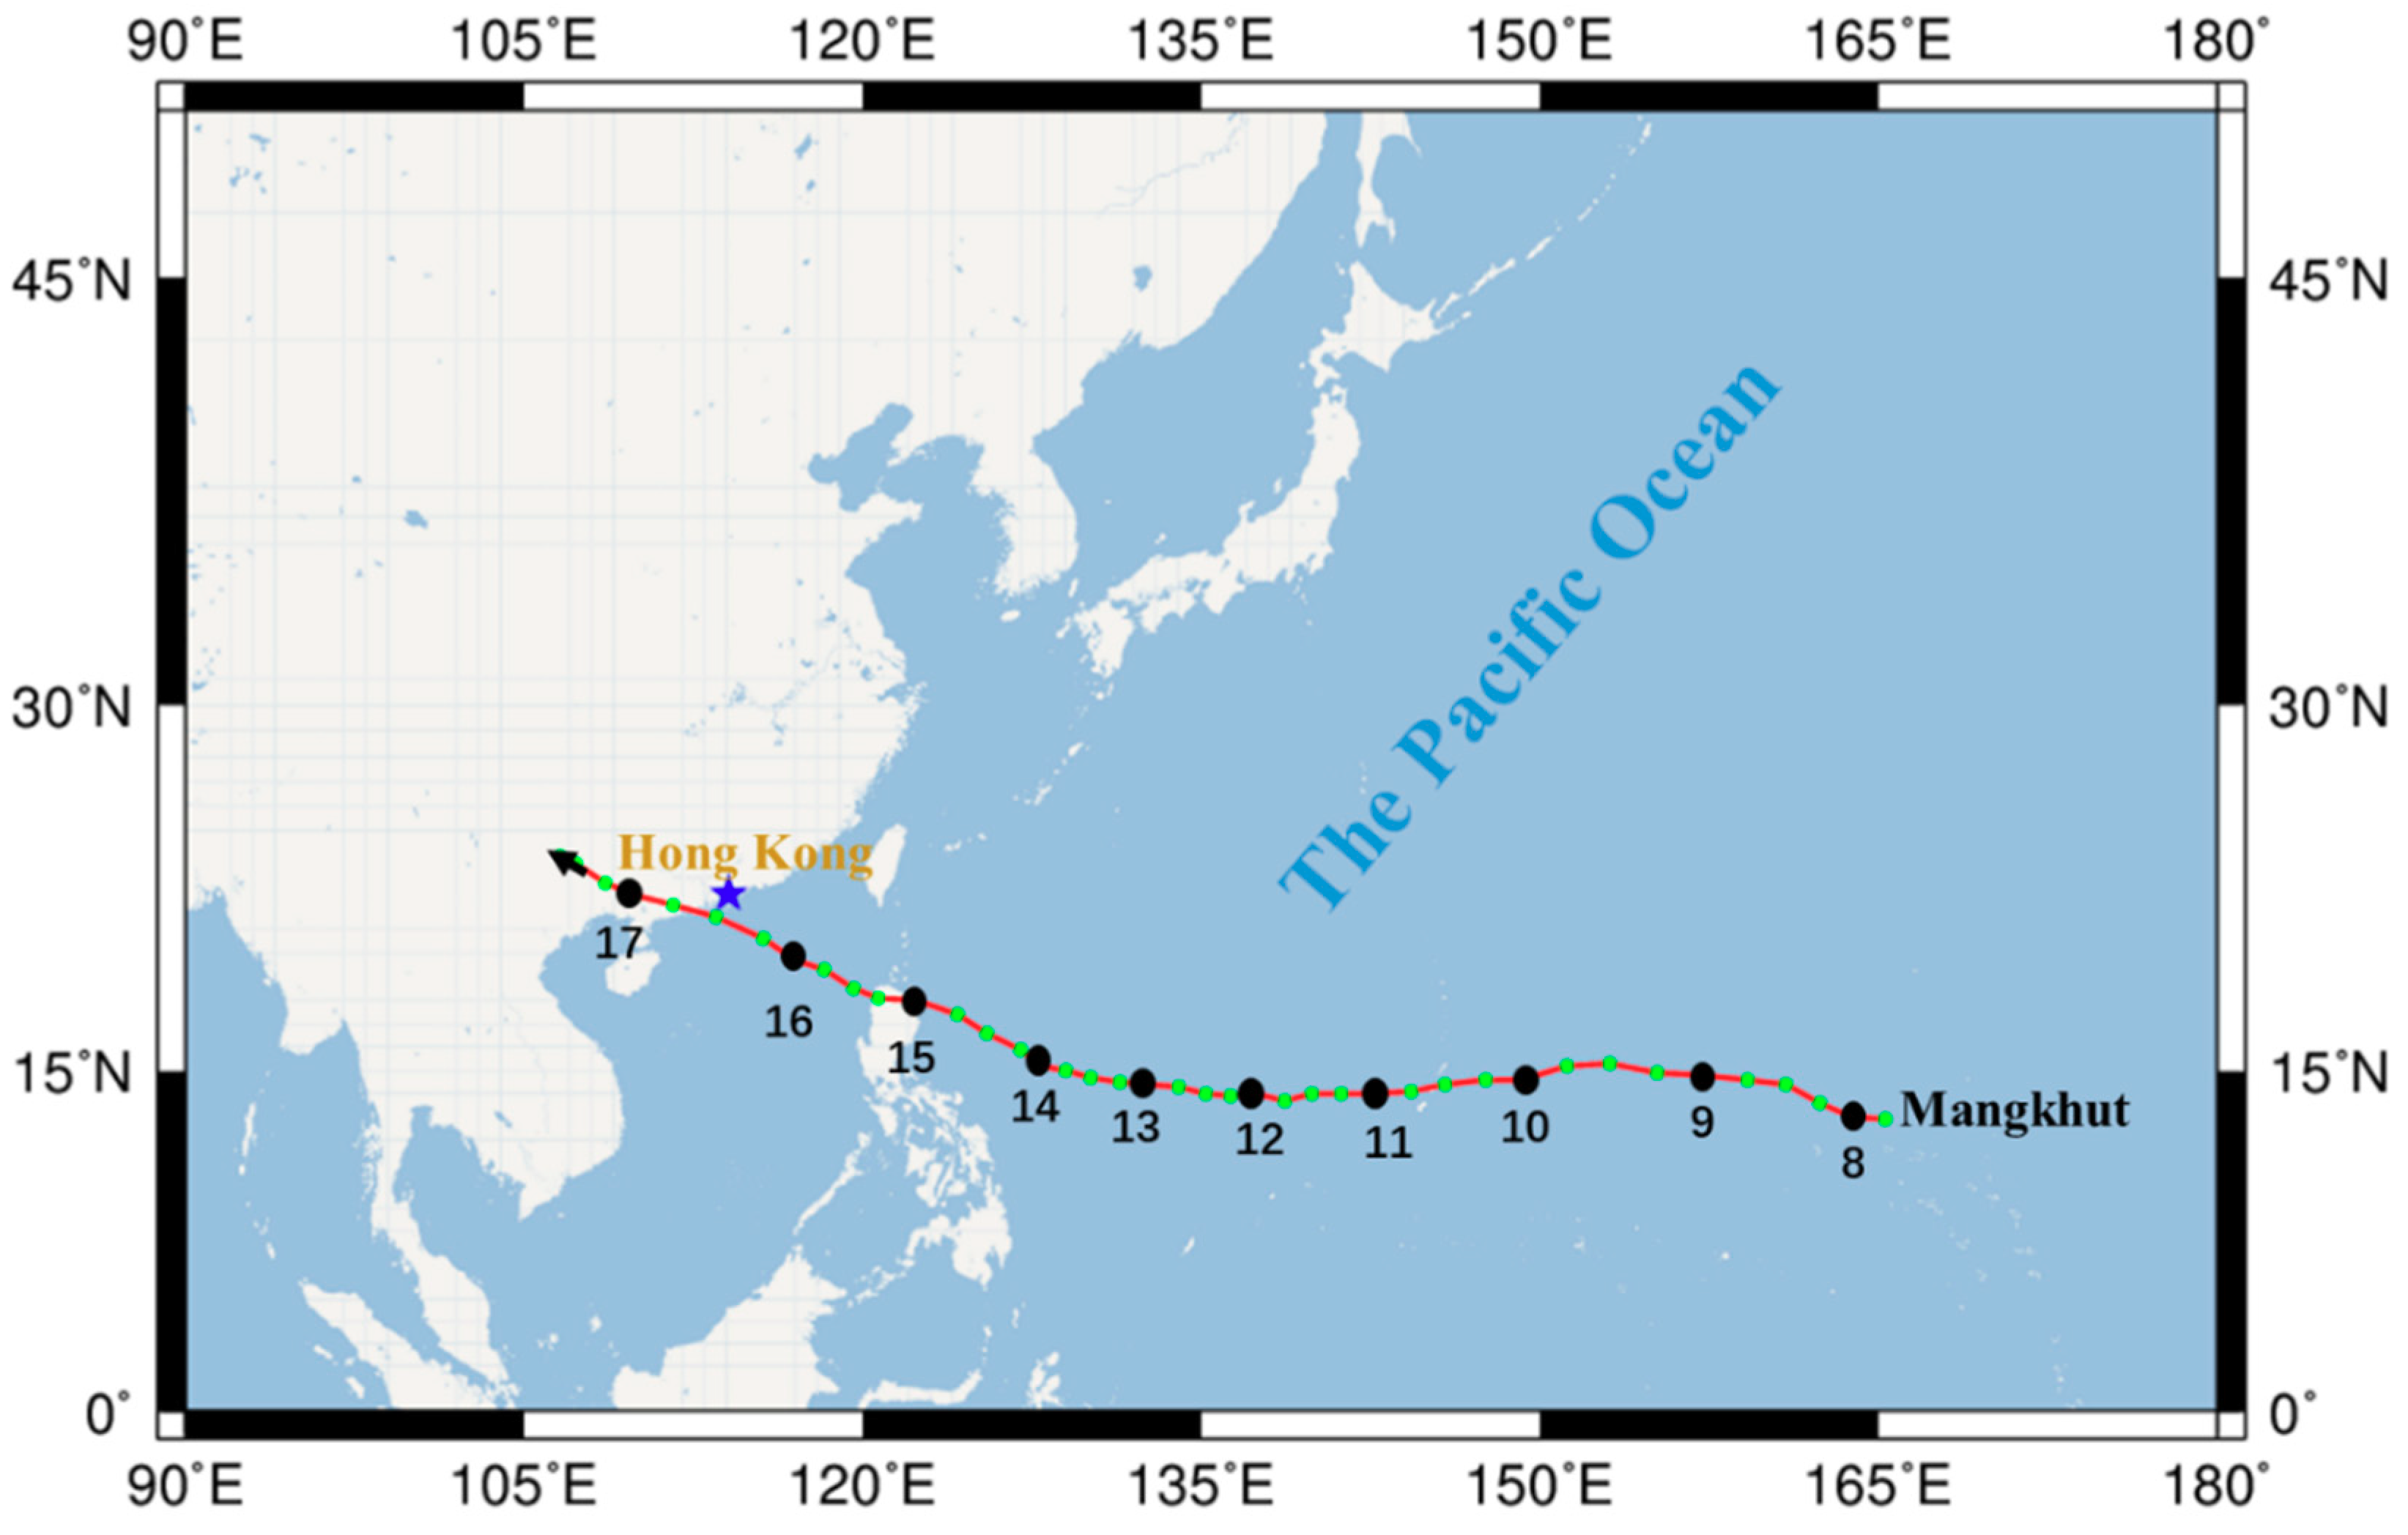
Mangkhut (tropical depression) originally formed over the western North Pacific east of Guam, 2330 km from Hong Kong at 20:00 on 7 September 2018 and moved westwards quickly, and it gradually intensified in the next few days. The trajectory of this typhoon can be seen in Figure 4.
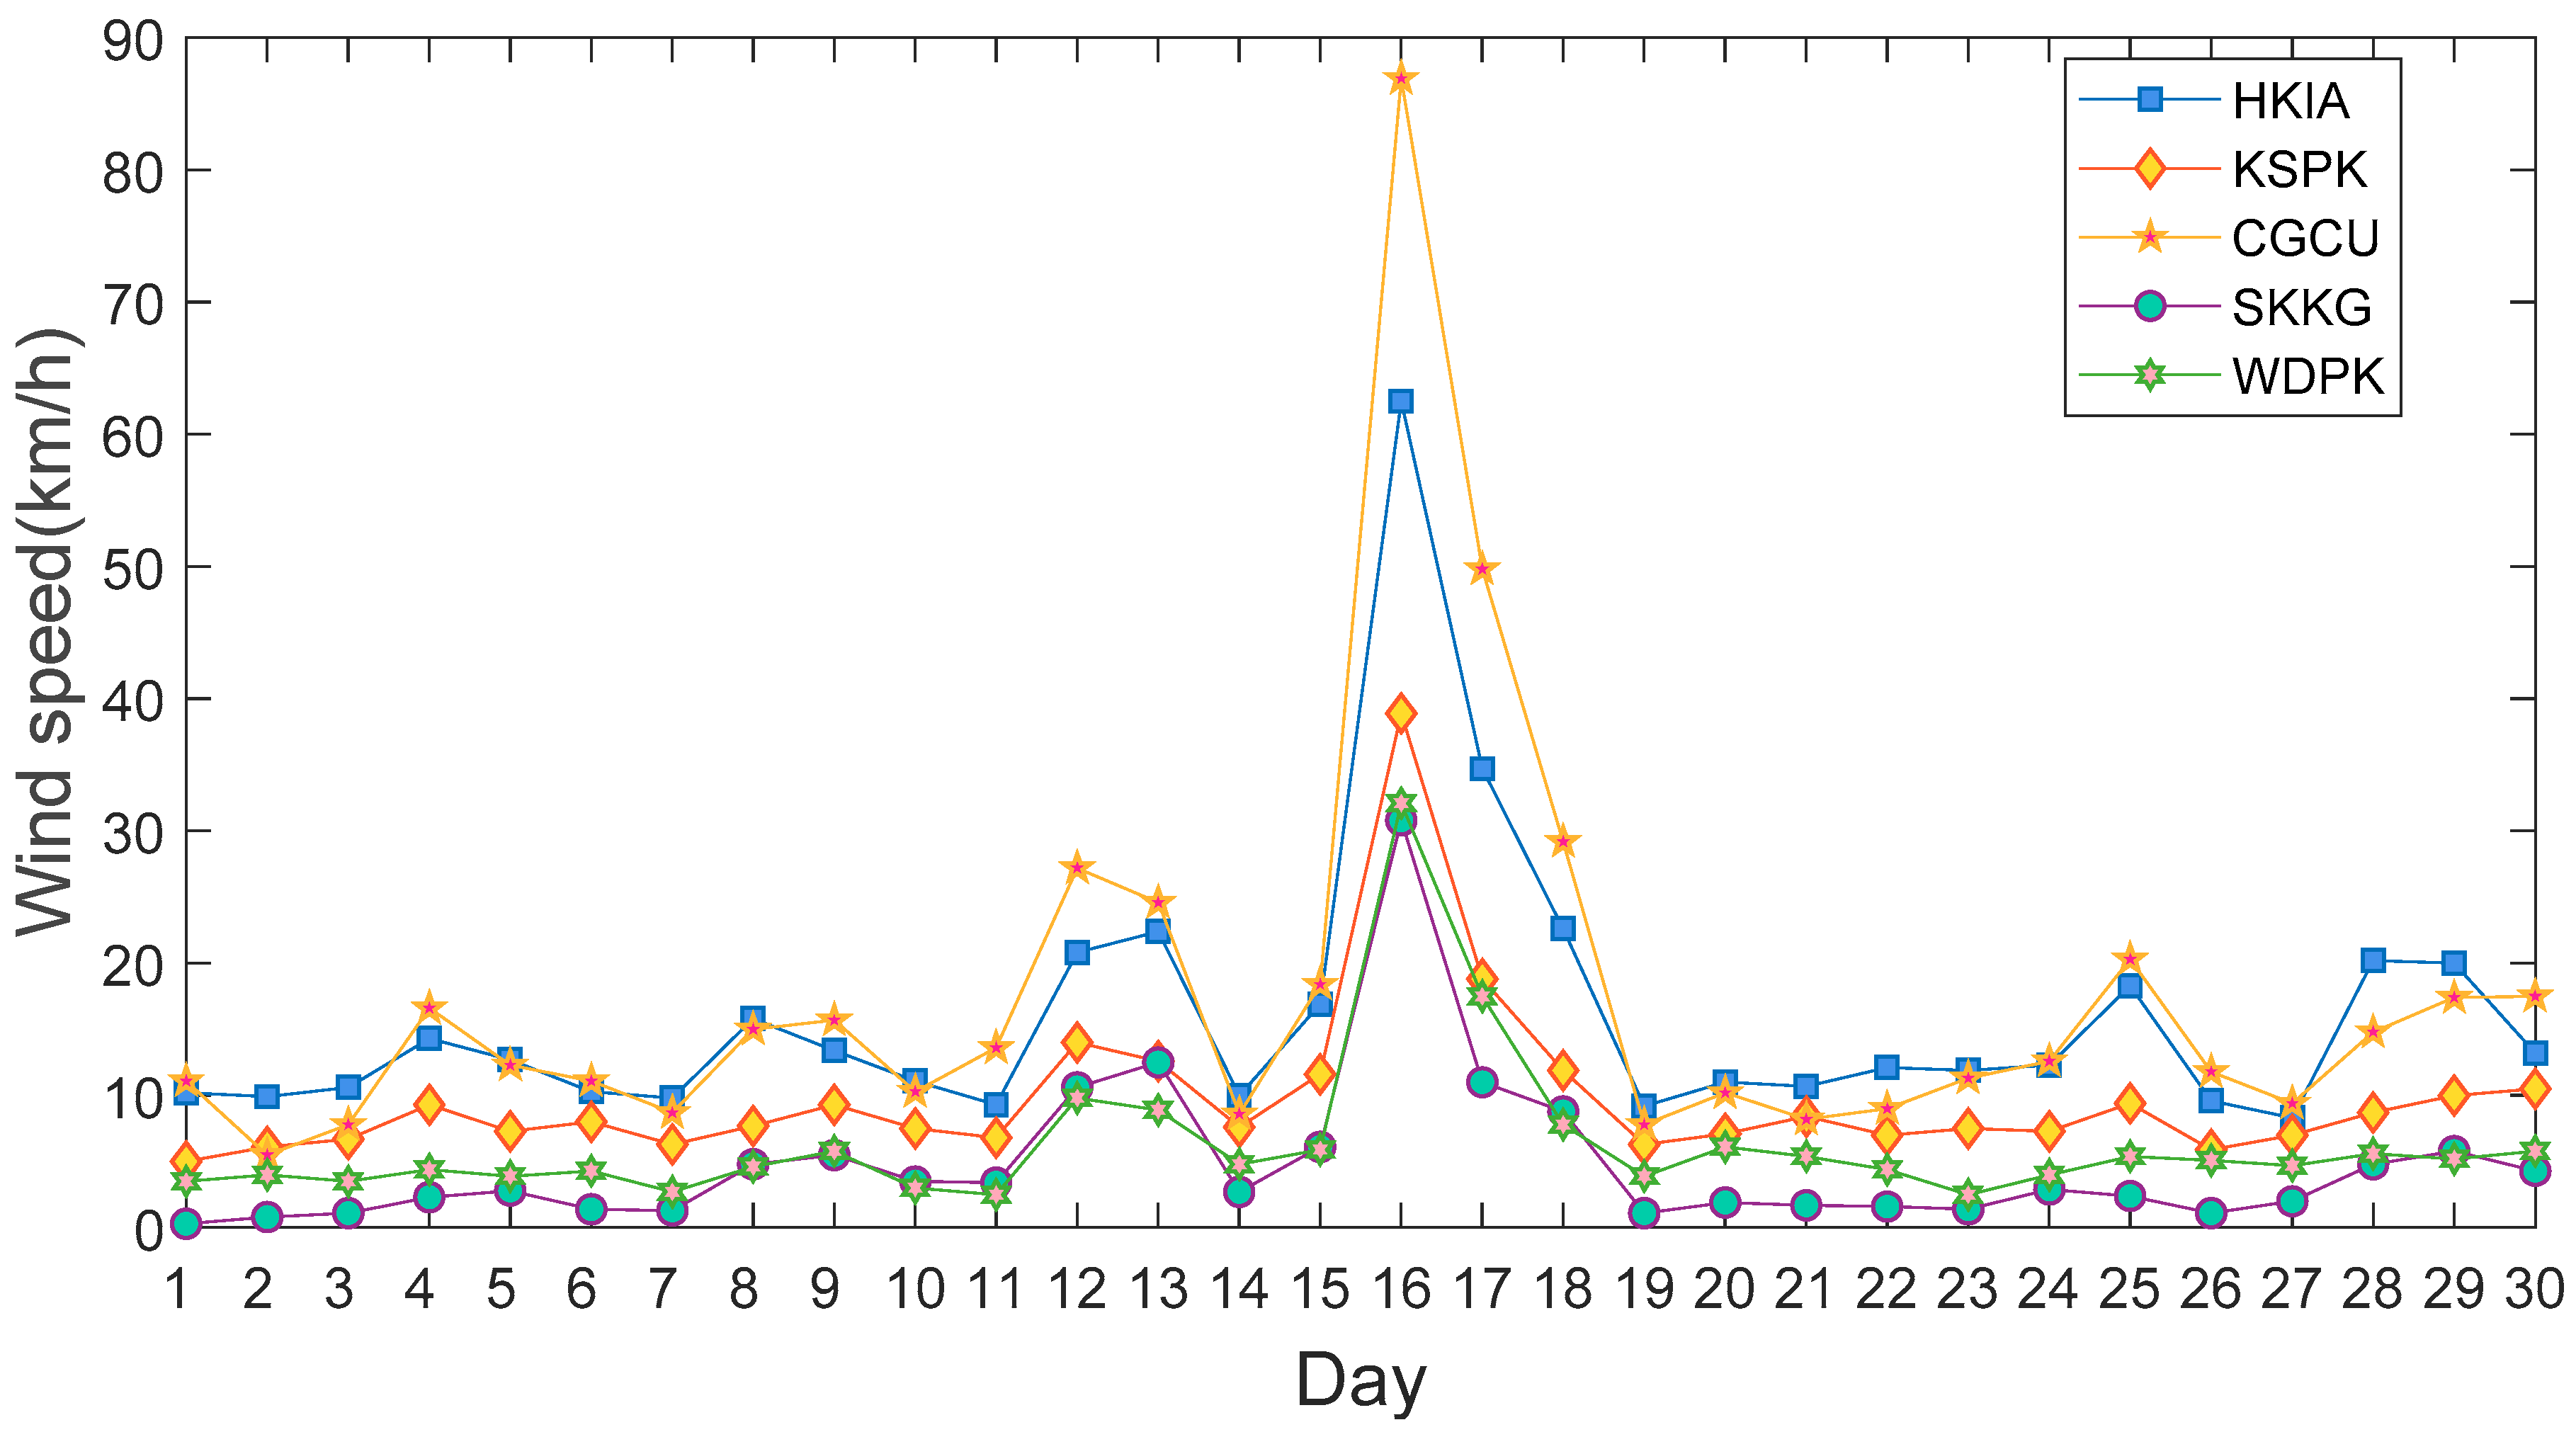
The daily mean wind speeds measured at each of the weather stations in September are shown in Figure 5. According to a record from the Hong Kong Observatory, the maximum hourly mean wind speed recorded at Waglan Island and Cheung Chau were 161 km/h and 157 km/h, respectively. Before Mangkhut entered Hong Kong on the 14th, daily mean wind speeds were in the range of 10–20 km/h, which was at a low level. After the 14th, wind force continuously strengthened and during the period of the 15–16, the increases in wind speed were in the range of 25–60 km/h. On the 16th, the daily mean wind speed from the measurements of a weather station reached 90 km/h, much higher than that of all other days in September. Then, it began to drop sharply and returned to the normal level on the 18th.
Figure 6 shows the daily mean barometric pressure observed at each of the five Hong Kong weather stations in September. It can be seen that the variation in the daily mean pressure in the first 14 days was insignificant; however, from the 14th when the typhoon approached Hong Kong, it began to drop rapidly and lasted two days until it reached the territory on the 16th and reached 988.8 hPa, the lowest of this month; then, as the typhoon left the region, the daily mean pressure started to increase sharply and lasted about two days until it returned to the normal level.
Figure 7 shows the time series of the daily mean temperature at each weather station in September. From the first 14 days, i.e., before the typhoon arrived, the daily mean temperature values were most in the range of 25–30 °C. As the typhoon gradually approached the territory, the temperature was on the rise and after the 15th it reached the highest of the month. The daily mean temperature values observed from multiple weather stations were in the range of 30–32 °C, and at the Hong Kong Observatory, temperature surged to 35.1 °C at a moment that was the highest of the month and also the second-highest ever recorded in September. Due to a large area of rainfall on the 16th, the temperature then dropped sharply to the range of 25–27 °C and reached the lowest (23.6 °C) of this month at the Hong Kong Observatory; with the departure of the typhoon, the temperature rose slowly until it resumed to the normal range of 26–28 °C on the 18th.
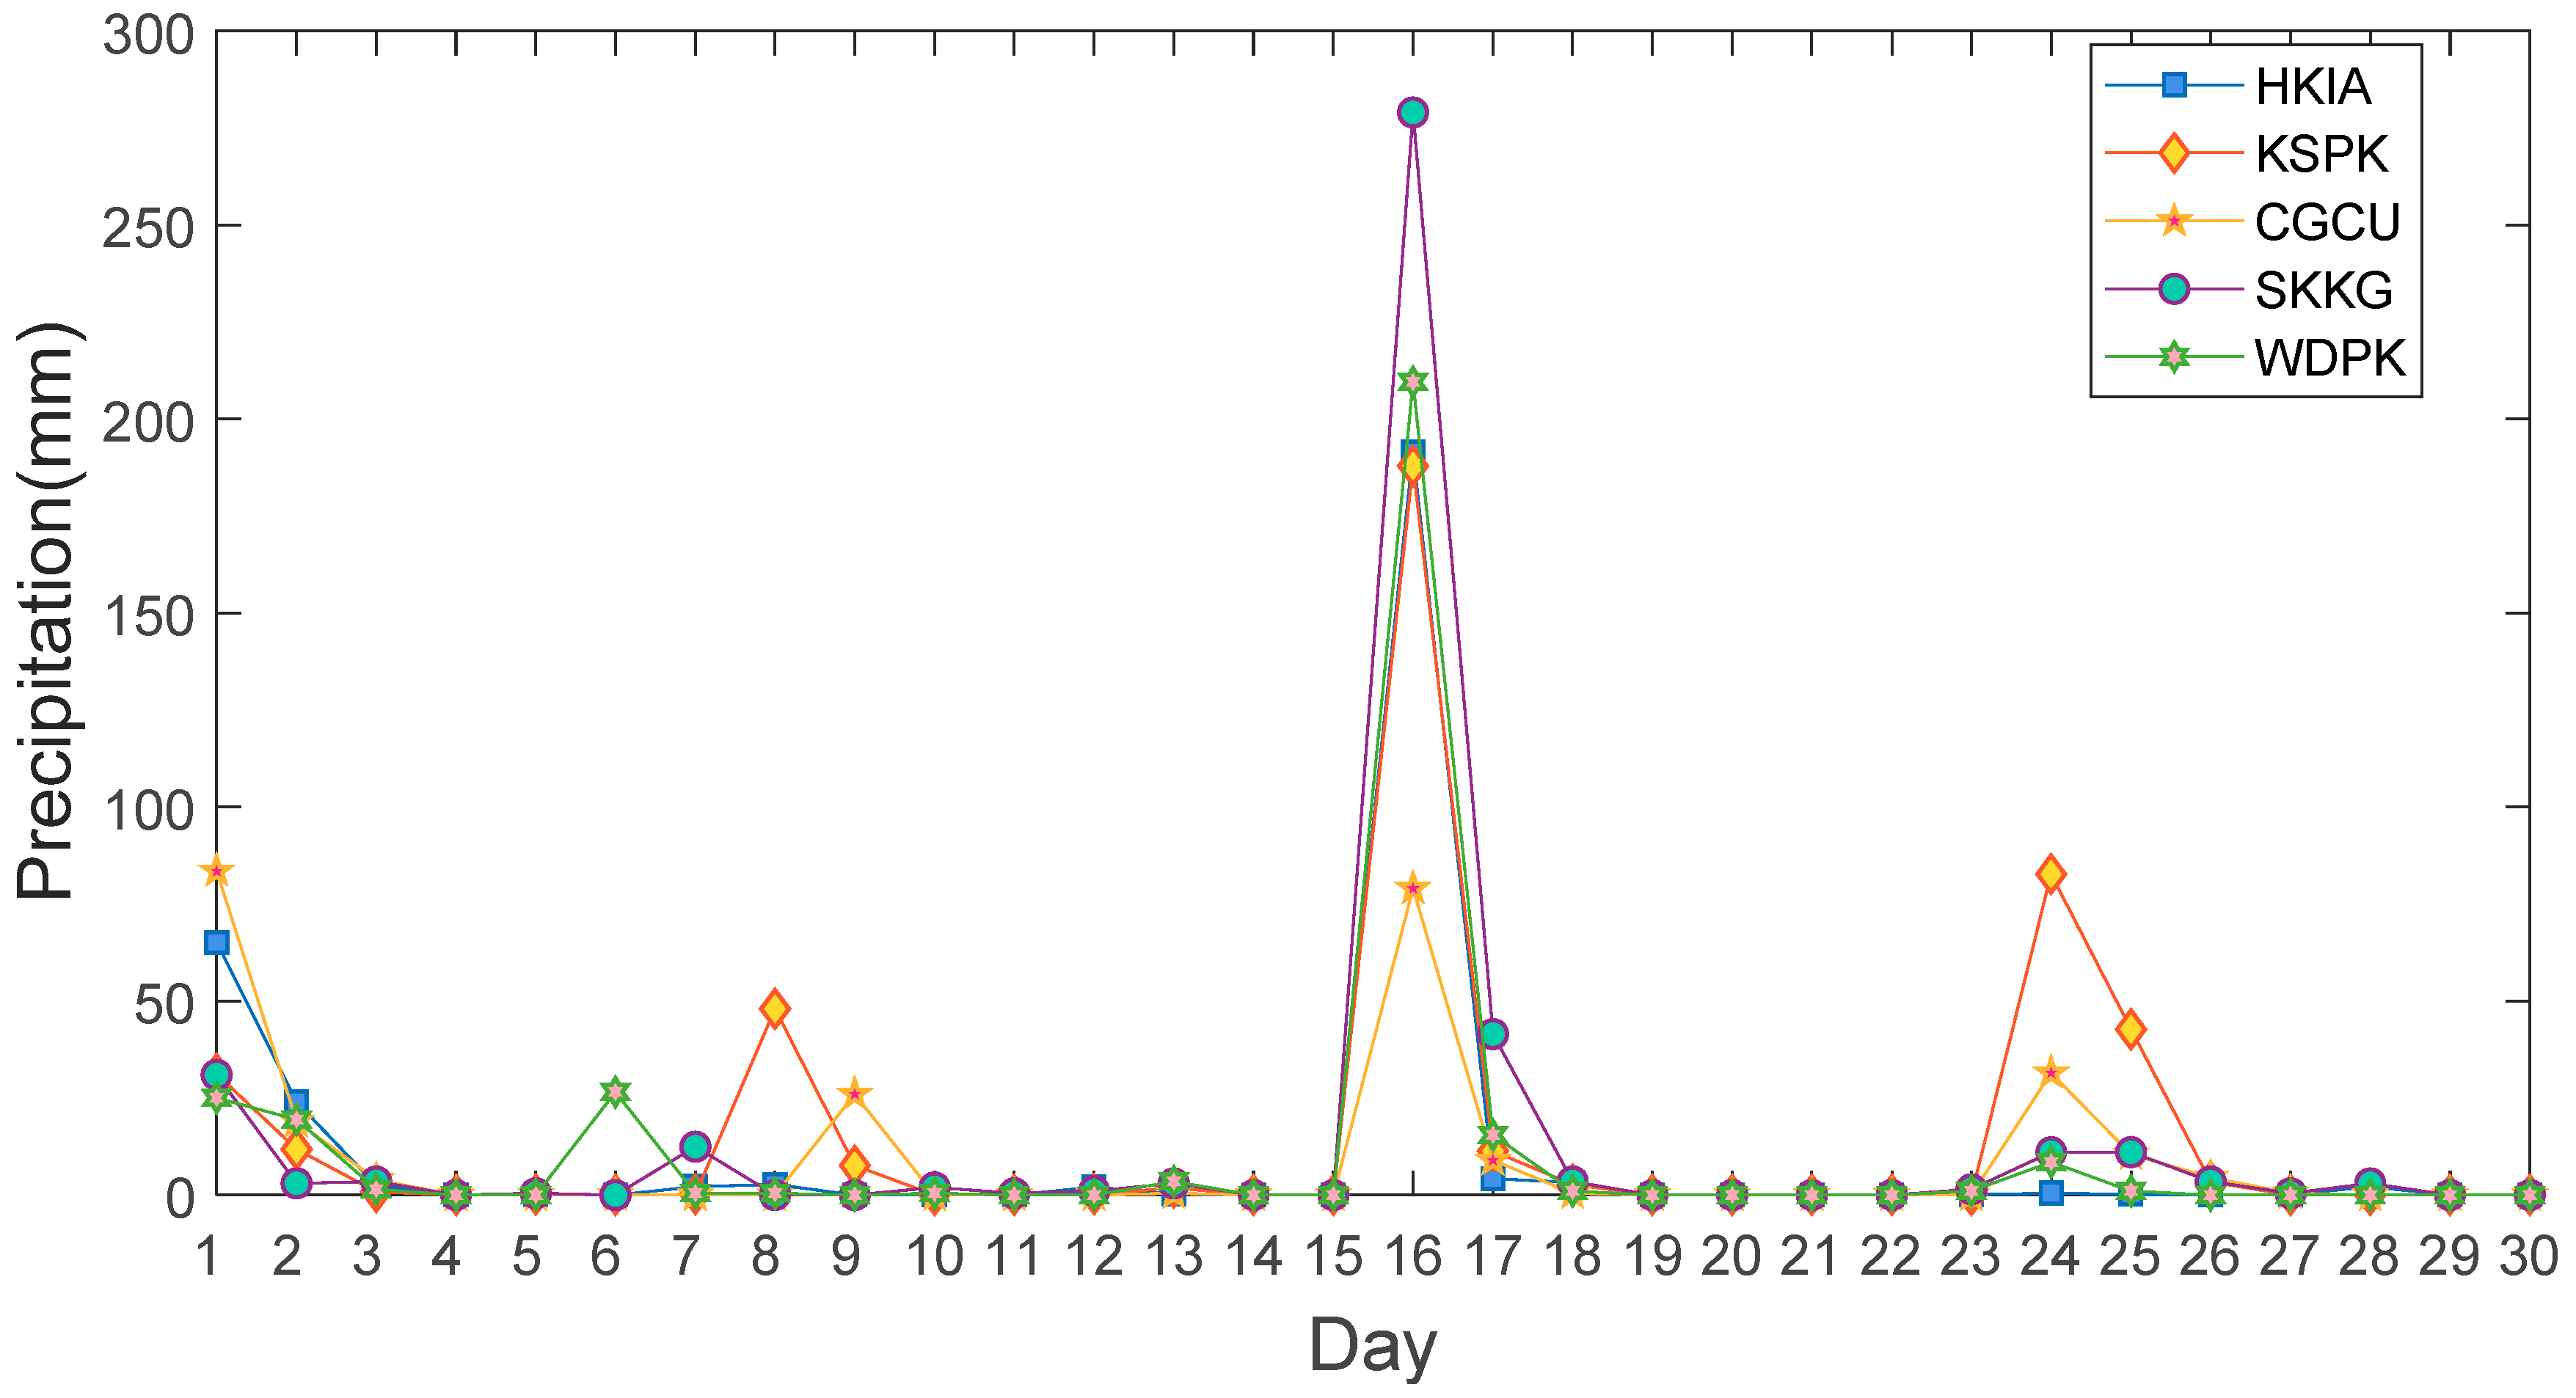
As far as rainfall is concerned, extensive rainfall induced by Mangkhut raised the water level in the Hong Kong region. The values of rainfall recorded by all weather stations equipped with rain gauges were most higher than 150 mm, and even higher than 200 mm in some areas. The Hong Kong Observatory’s rain dispensers recorded 167.5 mm on the same day, nearly half the total of the month. As Mangkhut departed from Hong Kong on the 17th, the weather recovered to normal. However, due to the effects of the rain outside the Mangkhut typhoon region, there were still short-time storms. Then, the ridge of the typhoon extended to the west, and on the morning of the 18th, the weather turned sunny after some light rain, and maintained fine and hot. Figure 8 shows the time series of the daily mean precipitation at each weather station in September.

3.2. Relationship between Variations in PWV and Atmospheric Parameters

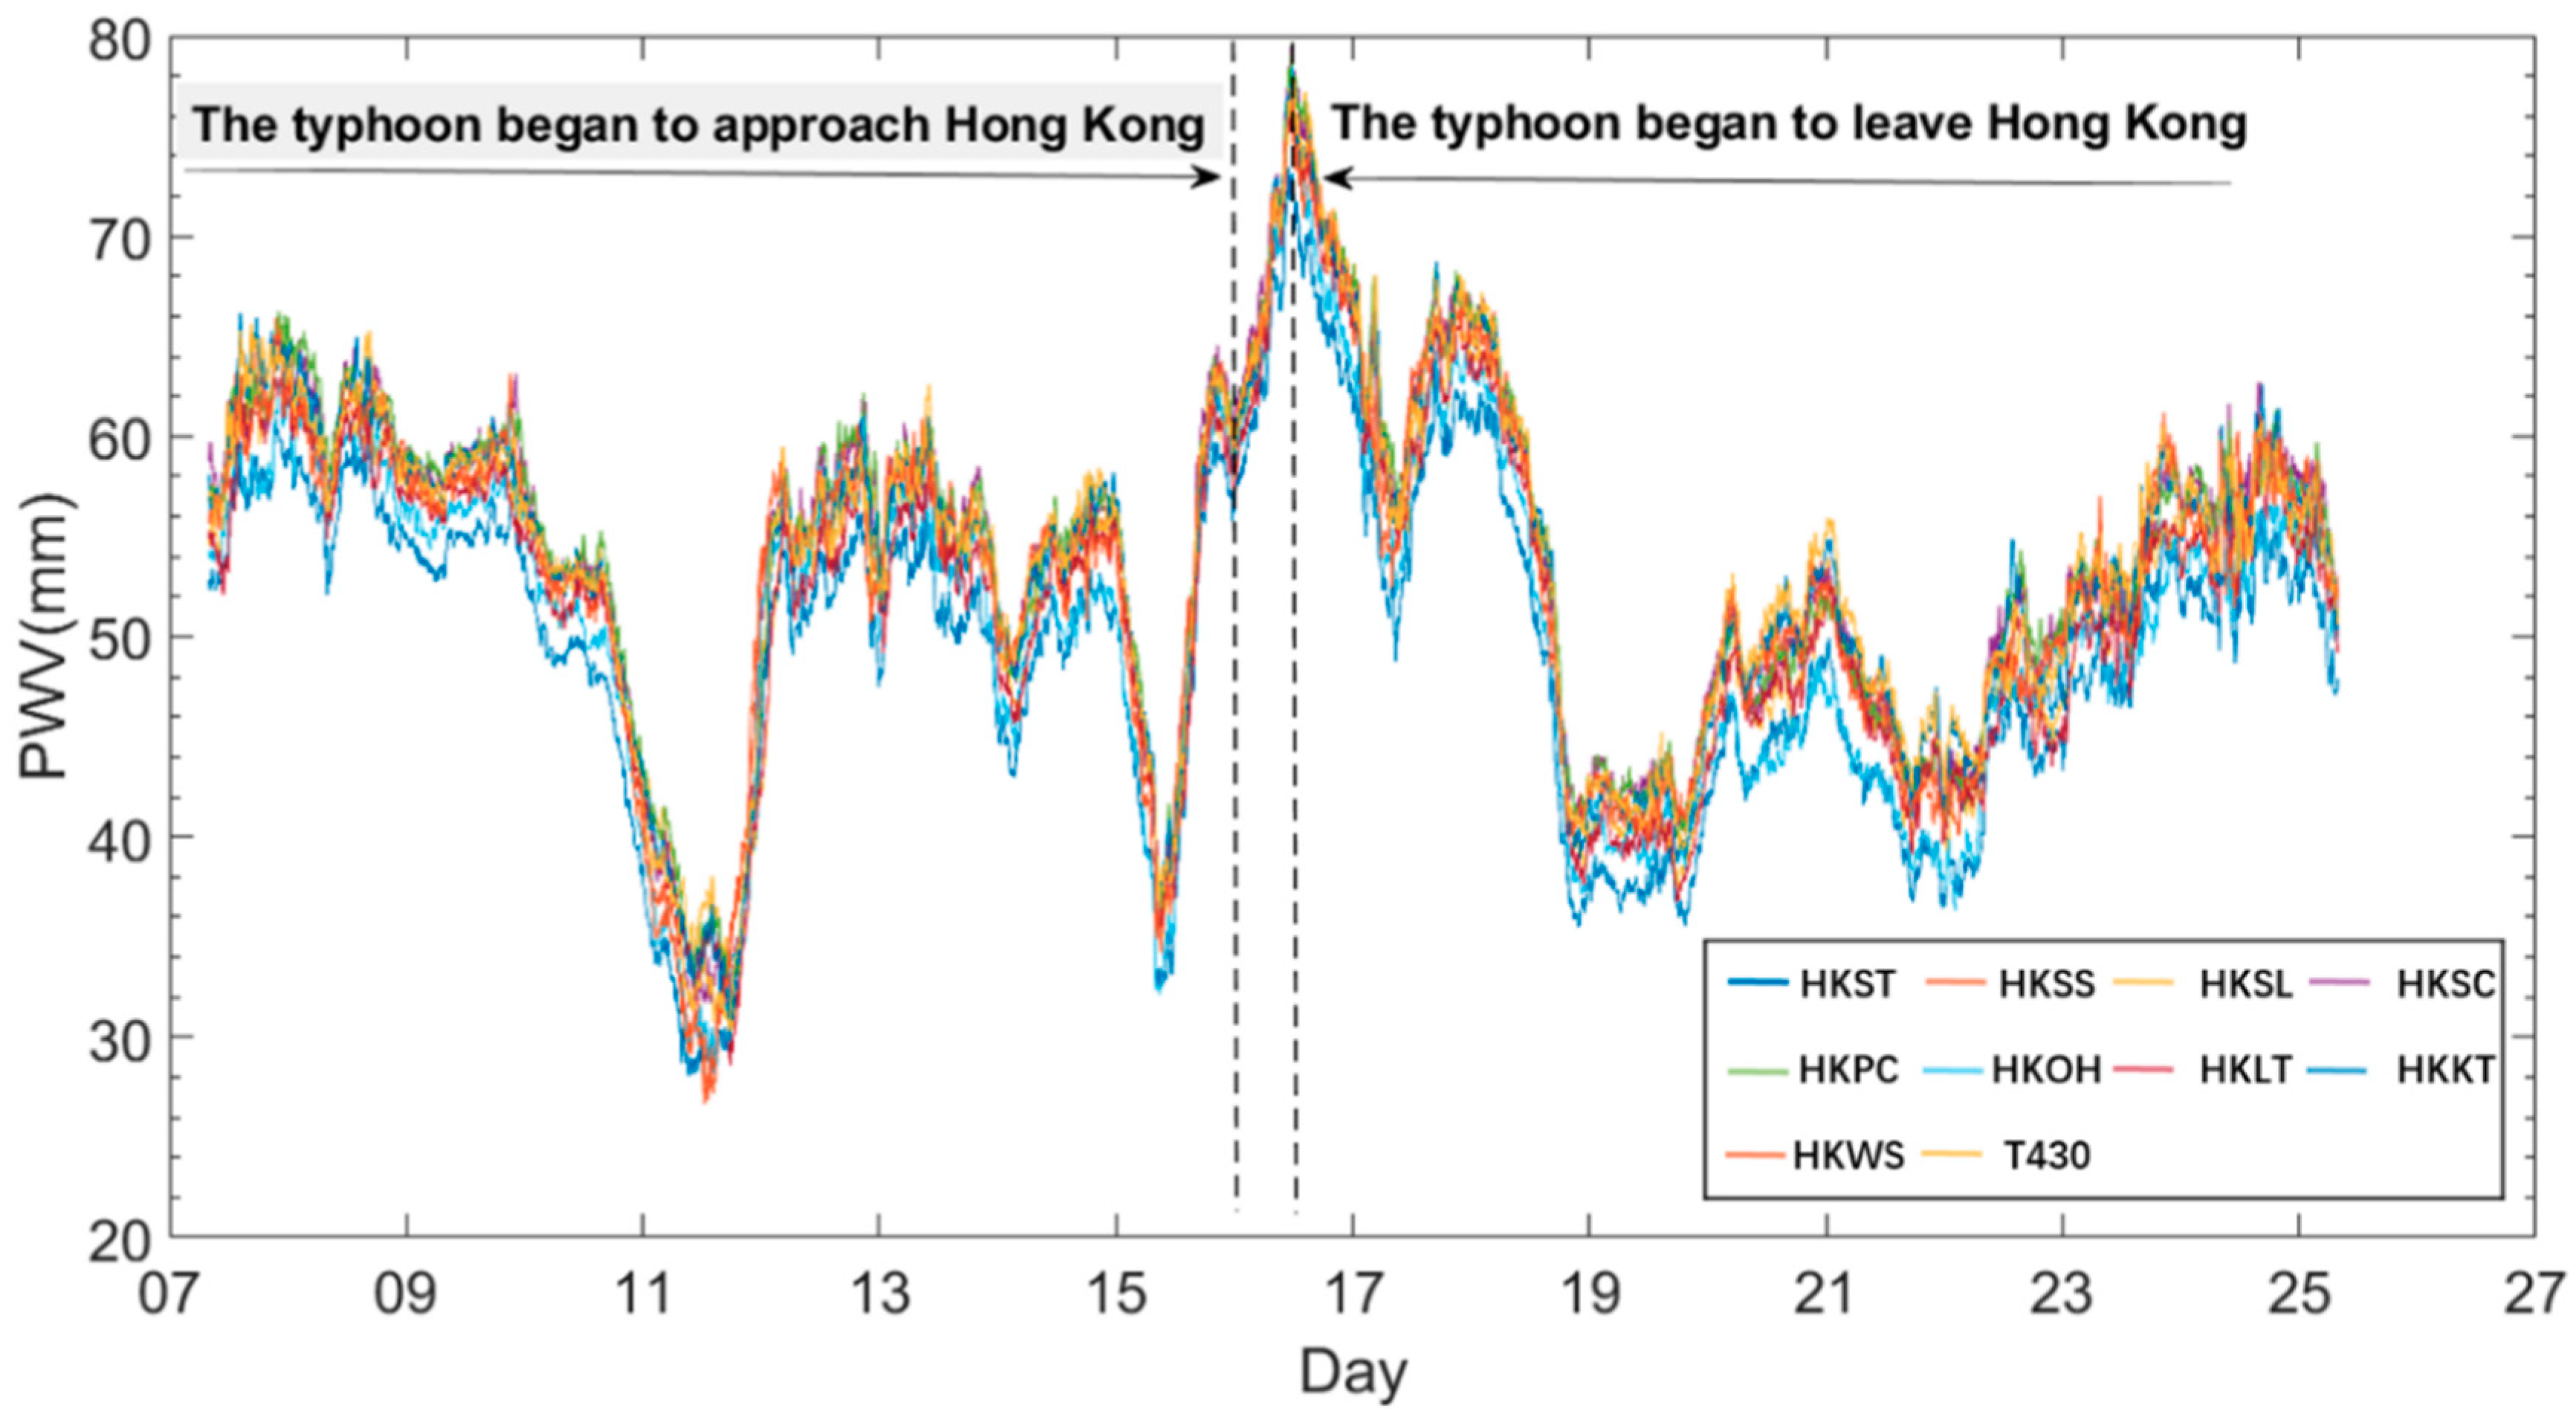
A typhoon generally comes with strong wind and a large amount of water vapor, which causes the change in the regional atmospheric environment. To understand the relationship between the spatial-temporal variation in PWV and the movement of a typhoon, the variations in major atmospheric elements e.g., temperature, pressure, precipitation, wind speed, and water vapor, were all investigated in this section. Firstly, the trends of the variations in the time series of GNSS-PWV and the other atmospheric parameter values during the period the typhoon occurred (i.e., 15th–18th) were compared. Figure 9 is the 3-min PWV time series over each of the 10 selected GNSS stations during the period of 7–25 September. We can find that all these time series experienced two increasing processes and the increasing processes lasted for many hours before the typhoon began to leave the region. Moreover, the time the PWV reached the maximum was the moment the typhoon was closest to the region.
The variation in water vapor is mainly governed by two factors: One is the thermodynamic process associated with evaporation and condensation [40]; and the other is the regional dynamics associated with the global atmospheric movement [41]. The thermodynamic process of water mainly involves liquefaction and gasification related with atmospheric elements in interior areas, such as temperature and pressure. Figure 10 shows the time series of 3-min GNSS-PWV (blue), 1-min temperature (green), and 1-min pressure (red) over the HKSL station during the four-day period of 15–18 September.
It can be seen from Figure 10 that PWV experienced two increasing processes before the typhoon left from Hong Kong: The first increasing process happened on the 15th from 35.0 mm (at about 09:30) to 61.8 mm (at about 19:30), then it tended to be stable with a slight decrease for a few hours. The second increasing process was on the 16th from 57.9 mm (at about 00:30) to 77.8 mm (at about 12:00), which was much higher than their daily mean value. In the first process, the information from the Hong Kong Observatory showed there were none precipitation events occurred. Moreover, the temperature varied from the starting point of the first PWV increasing process, which was at sunrise (at about 09:30), with the increase in surface temperature and accumulation of heat. Then, liquid water on the ground usually turned into gaseous water and entered into the atmosphere, which led to a decrease in pressure as the density of water vapor was less than air. Until the temperature rose to 35.9 °C at about 14:00 on the day (15th), the temperature started to drop, PWV started to increase, while the pressure started to decrease, and this trend lasted for a few hours. Since the variations in water vapor and pressure generally lag behind the variation in temperature, it takes a certain period of time for liquid water to convert into gaseous water by absorbing heat. With the approach of the typhoon (see Figure 4 and Figure 9), the distance between the HKSL station and the typhoon center decreased due to the movement of the typhoon, and the HKSL station approached the interior of the typhoon from the periphery of the typhoon. The increasing PWV and decreasing pressure in Figure 10 indicated that the closer to the interior area of the typhoon, the higher the PWV and the lower the pressure, compared with their counterparts in the periphery of the typhoon. These results were consistent with many typhoon cases [3,42,43].
In addition, the typhoon brought a huge amount of water vapor, leading to a heavy precipitation event in the region. Figure 11 shows the time series of 3-min PWVs over the HKLT station and hourly precipitation at the precipitation station (co-located with the HKLT station, see Figure 1) depicted in the histogram during the four-day period of 15–18 September.
Several studies have shown that precipitation occurred either when PWV reaches its peak or in the initial period after a sharp decrease [39,44,45]. However, typhoons provide abundant moisture, which is likely to cause precipitation events and accelerate the formation of saturated states of water in the region covered by typhoons. Once the region cannot hold more water vapor, the internal water vapor cannot be released in time for a short period of time. In this case, liquid water will be formed. In addition, when regional PWV reaches the maximum, the large amount of PWV is mostly in the center of the typhoon, and as a result, the precipitation reaches the maximum. Due to the more abundant water vapor near the center of the typhoon, compared with the outside area, more saturated water vapor will be converted into rain in the typhoon center.
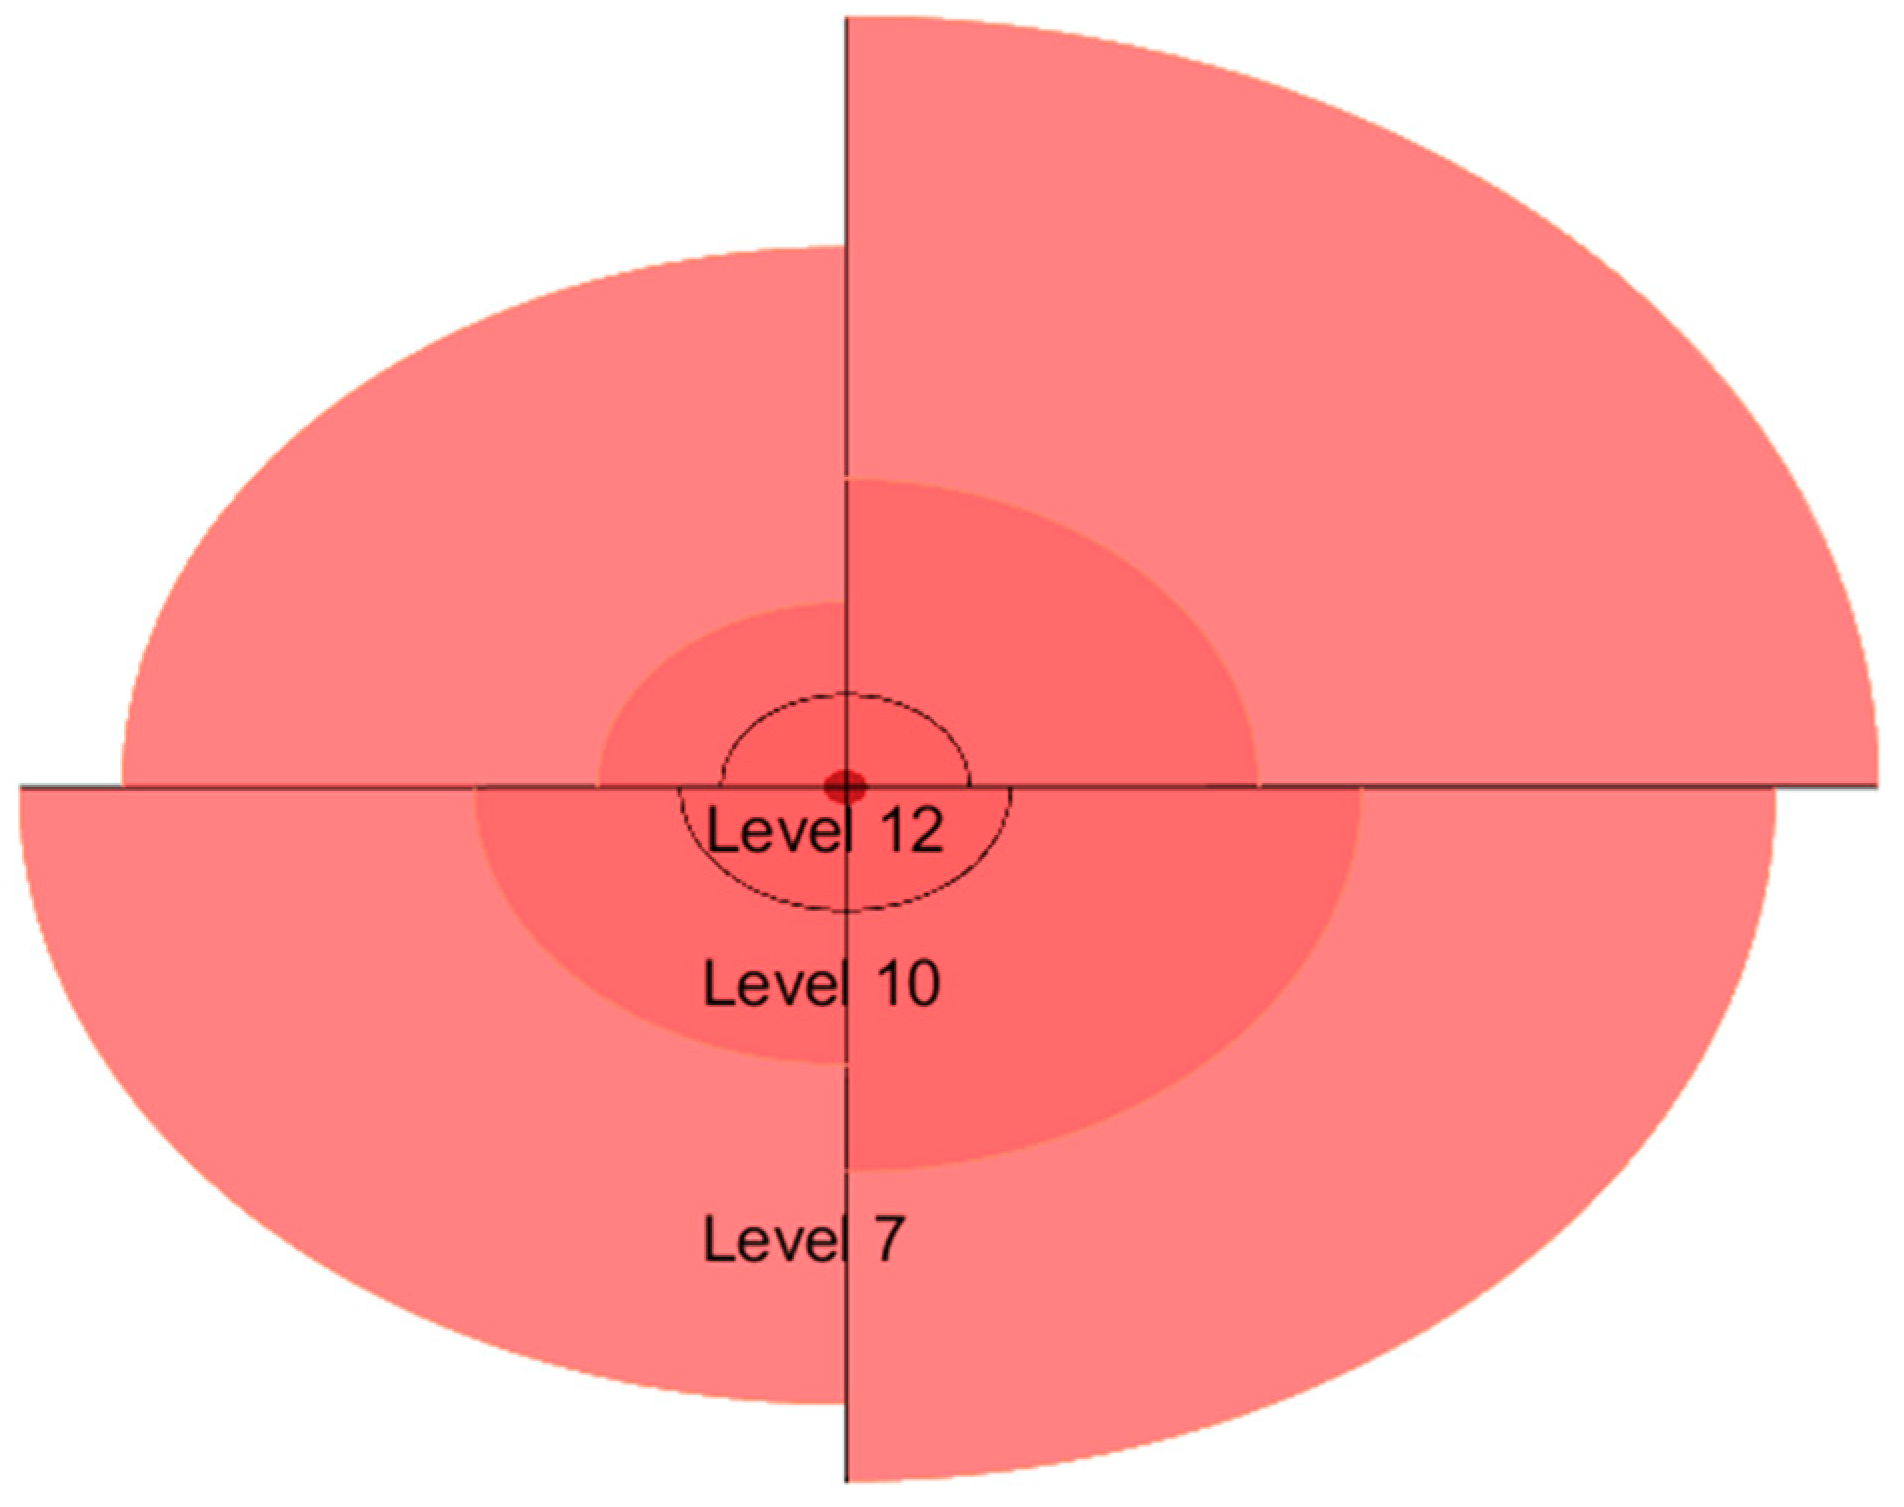
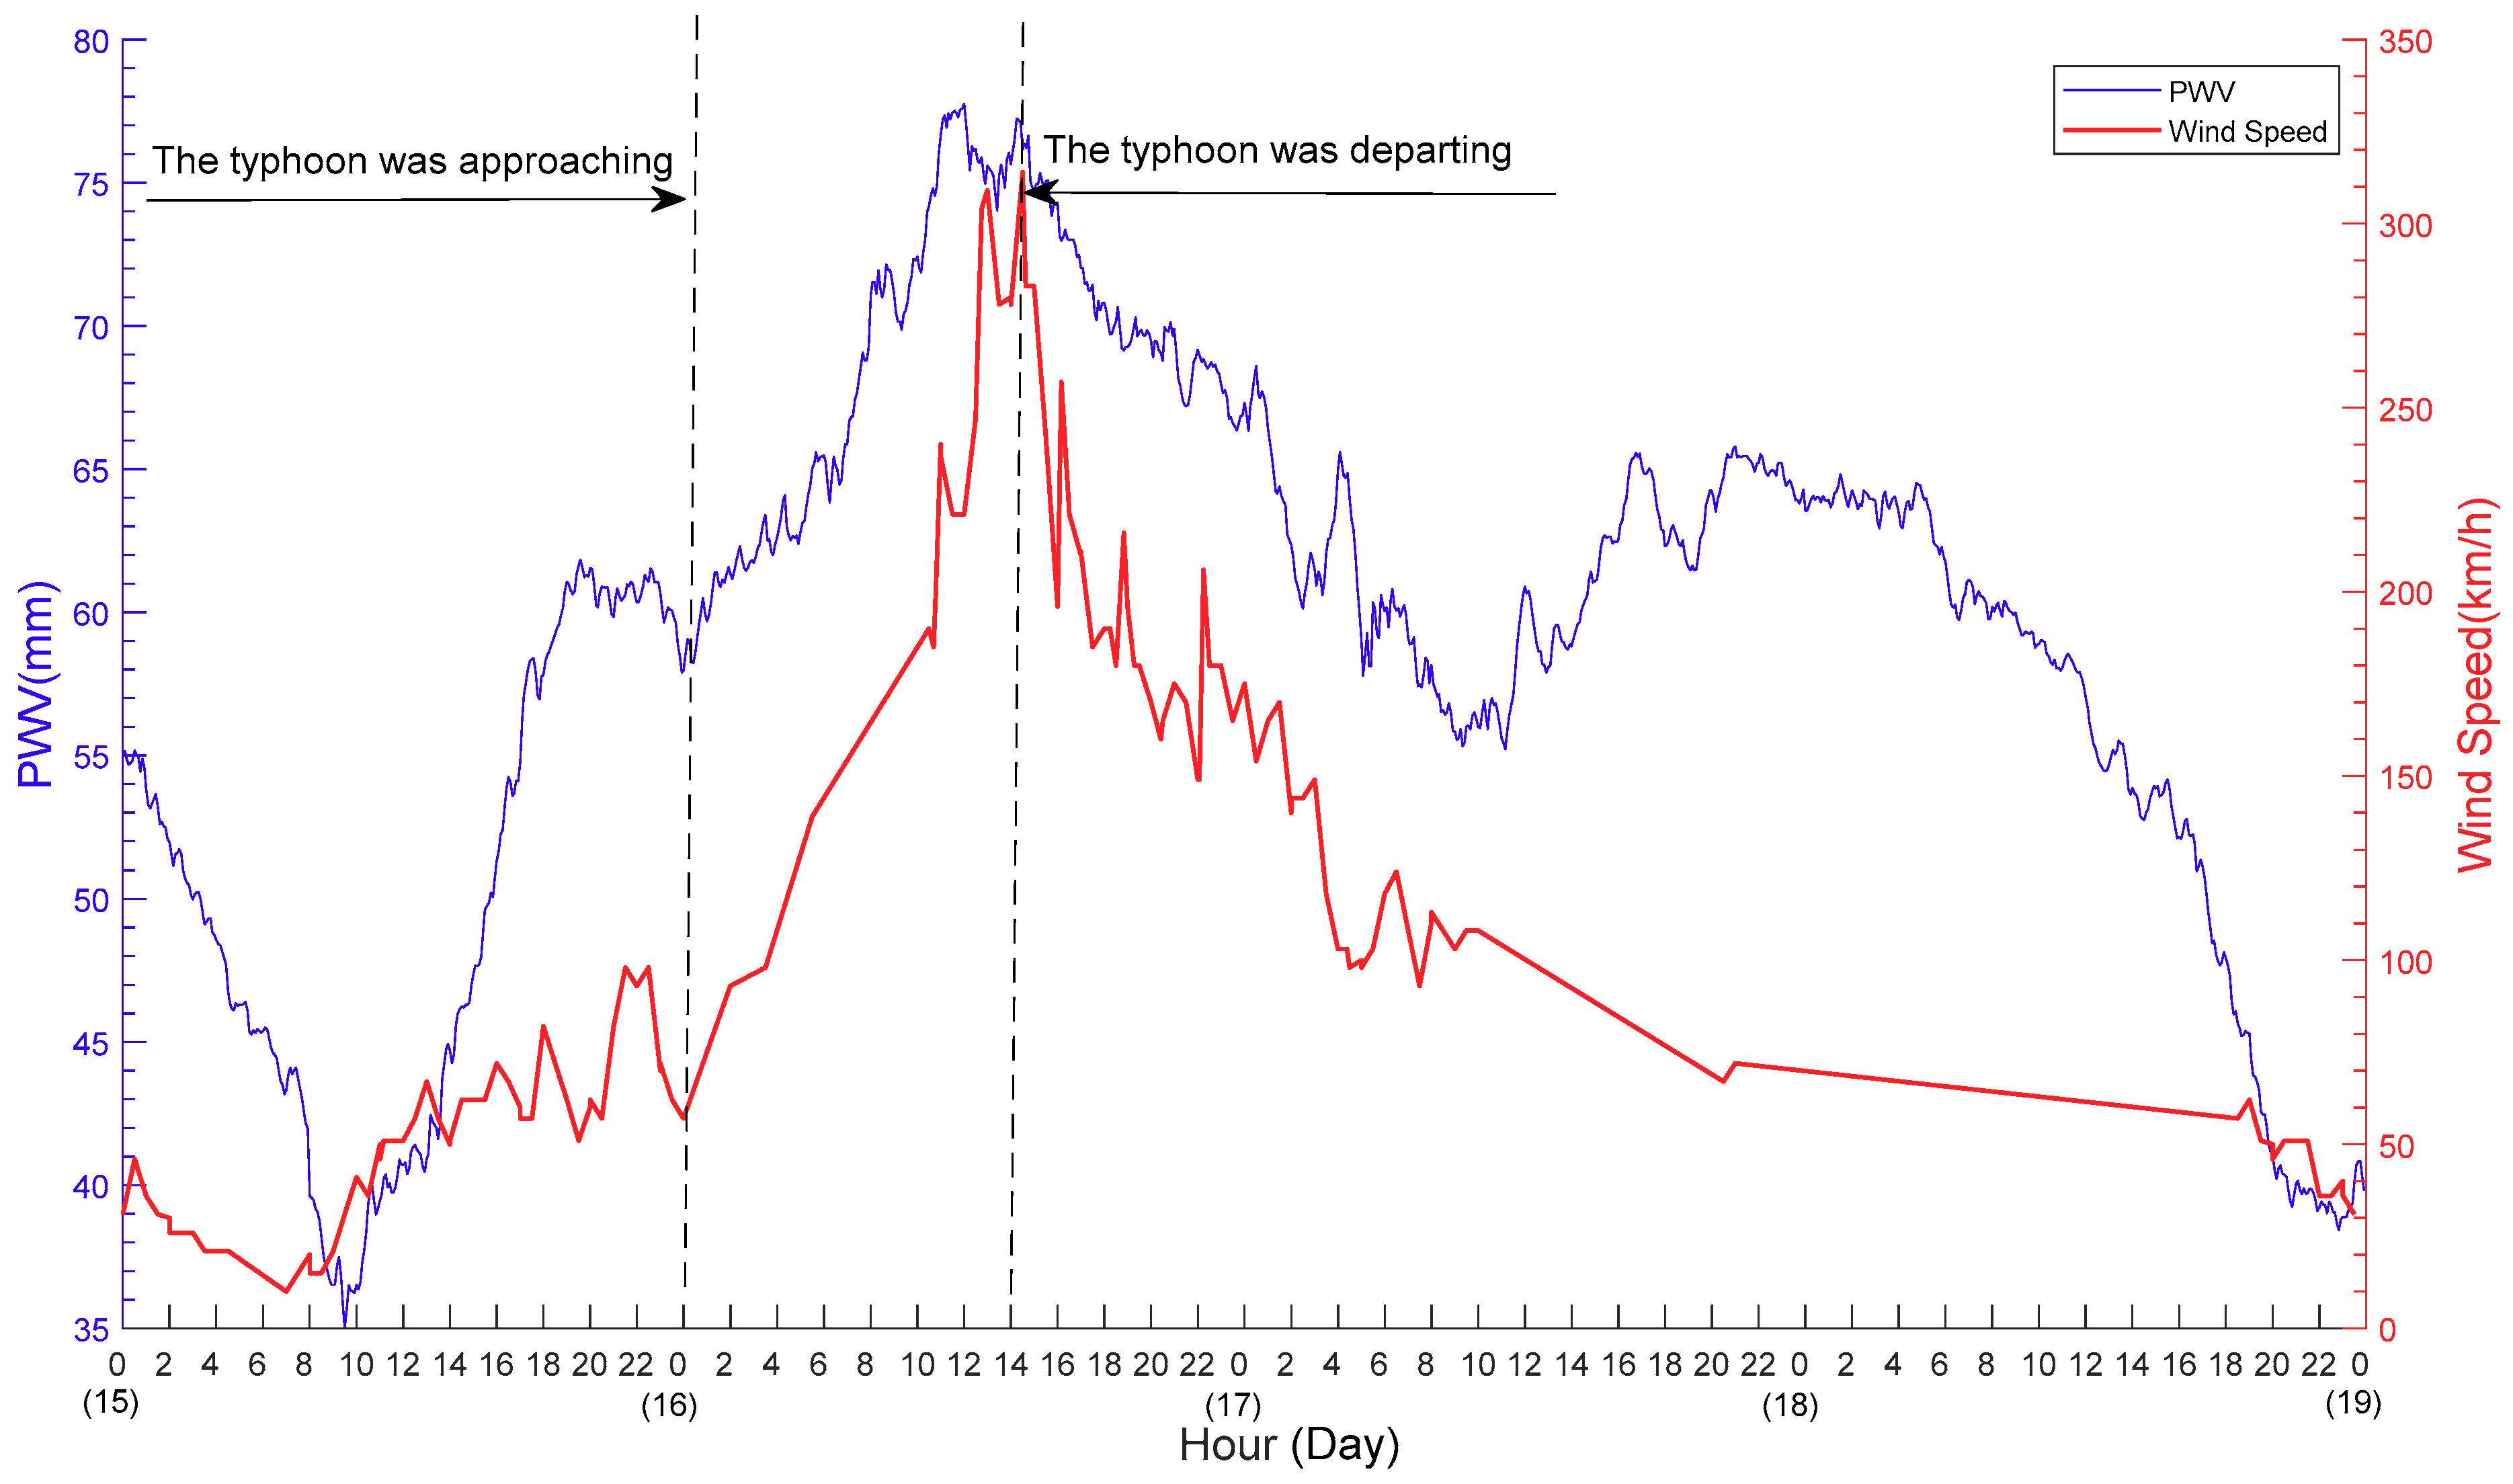
Furthermore, among atmospheric parameters, the one that is most affected by a typhoon is wind speed. This is the reason for the use of wind speed of a typhoon to determine the grade and radii of the typhoon’s wind circle. Figure 12 shows the wind radii of a typical typhoon, where the higher the level of the wind circle, the larger the wind speed; and the smaller the radius of the wind circle, the nearer to the center of the wind circle. Many typhoon detection and forecasting models are based on wind velocity field [46,47,48], and the relationship between wind speed and water vapor during the period of a typhoon will be discussed later. Figure 13 is the time series of PWV over the HKSL station and wind speed observed at the anemometer observatory (see Figure 1, the distance between both stations is about 6 km) during the four-day period of 15–18 September.
Figure 13 indicates that on the first day (the 15th, roughly) with the approach of the typhoon, wind speed increased continuously with small fluctuations (and the corresponding typhoon level increased as well); on the second day, wind speed rapidly increased from 57 km/h (at about 00:00) to 309 km/h (at about 14:00), which was consistent with the peak time of the PWV time series. The correlation coefficient between the two time series calculated was 0.76, meaning a significant positive correlation in comparison with the value of 0.11 in typhoon-free weather conditions. The coefficient value implies that during the period a typhoon occurs the variation in water vapor is mainly dominated by atmospheric dynamic process as the typhoon carries not only energy, but also water vapor, i.e., the variation patterns of PWV and wind speed were similar.
It should be noted that the source of PWV shown in Figure 4 and Figure 9 was mainly from the Mangkhut typhoon passing through the Pacific Ocean, and another source was from surface waters around the Hong Kong island. This is because when the typhoon passed over the sea, liquid water tended to evaporate into gaseous water, leading to the accumulation of water vapor in the air over the region, i.e., moisture increased. At the moment, temperature dropped at about 00:00 on the 16th (at which the typhoon was approaching) shown in Figure 10, gaseous water met cold air and easily formed liquid water, then a large amount of rainfall occurred (see Figure 11). At about 12:00–14:00 on the 16th, the typhoon gradually departed from Hong Kong, and PWV started to drop again whilst pressure started to rise. During the period Mangkhut hit Hong Kong, the trends of the variations in both PWV and wind speed were most consistent. This implies that large variations in PWV instead of wind speed might somewhat reflect the intensity or severance of a typhoon.
The time series results shown in Figure 9 indicate the PWV temporal variation over all 10 GNSS stations. For an investigation of the spatial variation of PWV during the period the typhoon approached Hong Kong, the PWVs at all the 10 GNSS stations and the Kriging interpolation method were used to obtain PWVs for the whole region. The accuracy of these results was also assessed using the cross-validation method and the RMS error of the GNSS-PWV during the four-day period of 15–18 was about 1.5 mm. To analyze the variations in water vapor after the typhoon arrived, the PWV value over a site at zero o’clock on the 16th (i.e., the time PWV began to rise and the typhoon arrived, see Figure 13) was taken as the reference of the site for calculating the increment of PWV (IPWV) for the site during the typhoon period. Figure 14a shows the snapshots of the PWV map in the Hong Kong region at zero o’clock on the 16th and Figure 14b–e shows the snapshots of the IPWV two-dimensional maps every 2 h from 02:00 to 08:00 on the day.
From Figure 13 we can see that before the typhoon arrived, both wind speed and PWV were at a relatively low level. Figure 14a shows that at the reference moment the PWV values over different stations are different. These differences were mainly caused by the differences in local temperature, pressure, and topographic conditions. It is worth mentioning that there was a significant local minimum of PWV over the Hong Kong Shatin (HKST) station shown in Figure 14a because this station is located in the mountainous area, thus the height difference between this station and all the other nine GNSS stations reaches nearly 200 m. Generally, PWV decreases with the increase in elevation [49].
Figure 14b–e reveals that after the typhoon began to approach Hong Kong, regional PWV continuously brought and injected large amounts of water vapor into the area. In the first two to four hours (Figure 14b,c, respectively), it was obvious that the IPWV values in the southeast were higher than that in the northwest, indicating that the typhoon began to transport water vapor from the southeast. Then, IPWV over the northwest area was gradually more than the southeast in shown in Figure 14d,e, i.e., the moving trend of PWV is northwest. Comparing the moving trends of the typhoon and the PWV, we can find that the moving of PWV and the migration of the typhoon were similar, which was consistent with the typhoon cases presented in [50,51]. In addition, Figure 14b–e shows a small circle around the HKST station, which means a local minimum of IPWV. One of the reasons for this is likely that when the typhoon passed the mountainous area near the station, the typhoon was weakest due to the blocking effects of the terrain [52,53], which caused the movement of water vapor from higher ground to nearby lower ground.

3.3. Using GNSS-PWV to Determine Movement of Typhoon

As previously discussed, during the period of the Mangkhut typhoon, a significant variation in regional PWV occurred. This implies that a typhoon may be detected through the monitoring of spatial-temporal variations in PWV. Also, the two-dimensional PWV variation during the typhoon period shown in Figure 14 indicates that the movement direction of water vapor is similar to that of the typhoon and these results are consistent with many relevant researches [54,55]. Mangkhut brought a large amount of water vapor and the time both water vapor and wind speed started to increase is the same as the time the typhoon arrived (see Figure 13). In addition, the times the water vapor brought by the typhoon reached different stations are most likely different. Thus, the time difference of PWV arrival at two sites obtained from the times a sudden increase occurs in the PWV time series over the two sites indicates the sequence of the typhoon arrival at the two sites. Such time differences from many pairs of sites formed from all GNSS stations covered by a typhoon can be used to determine the movement of the typhoon during the period of the times.
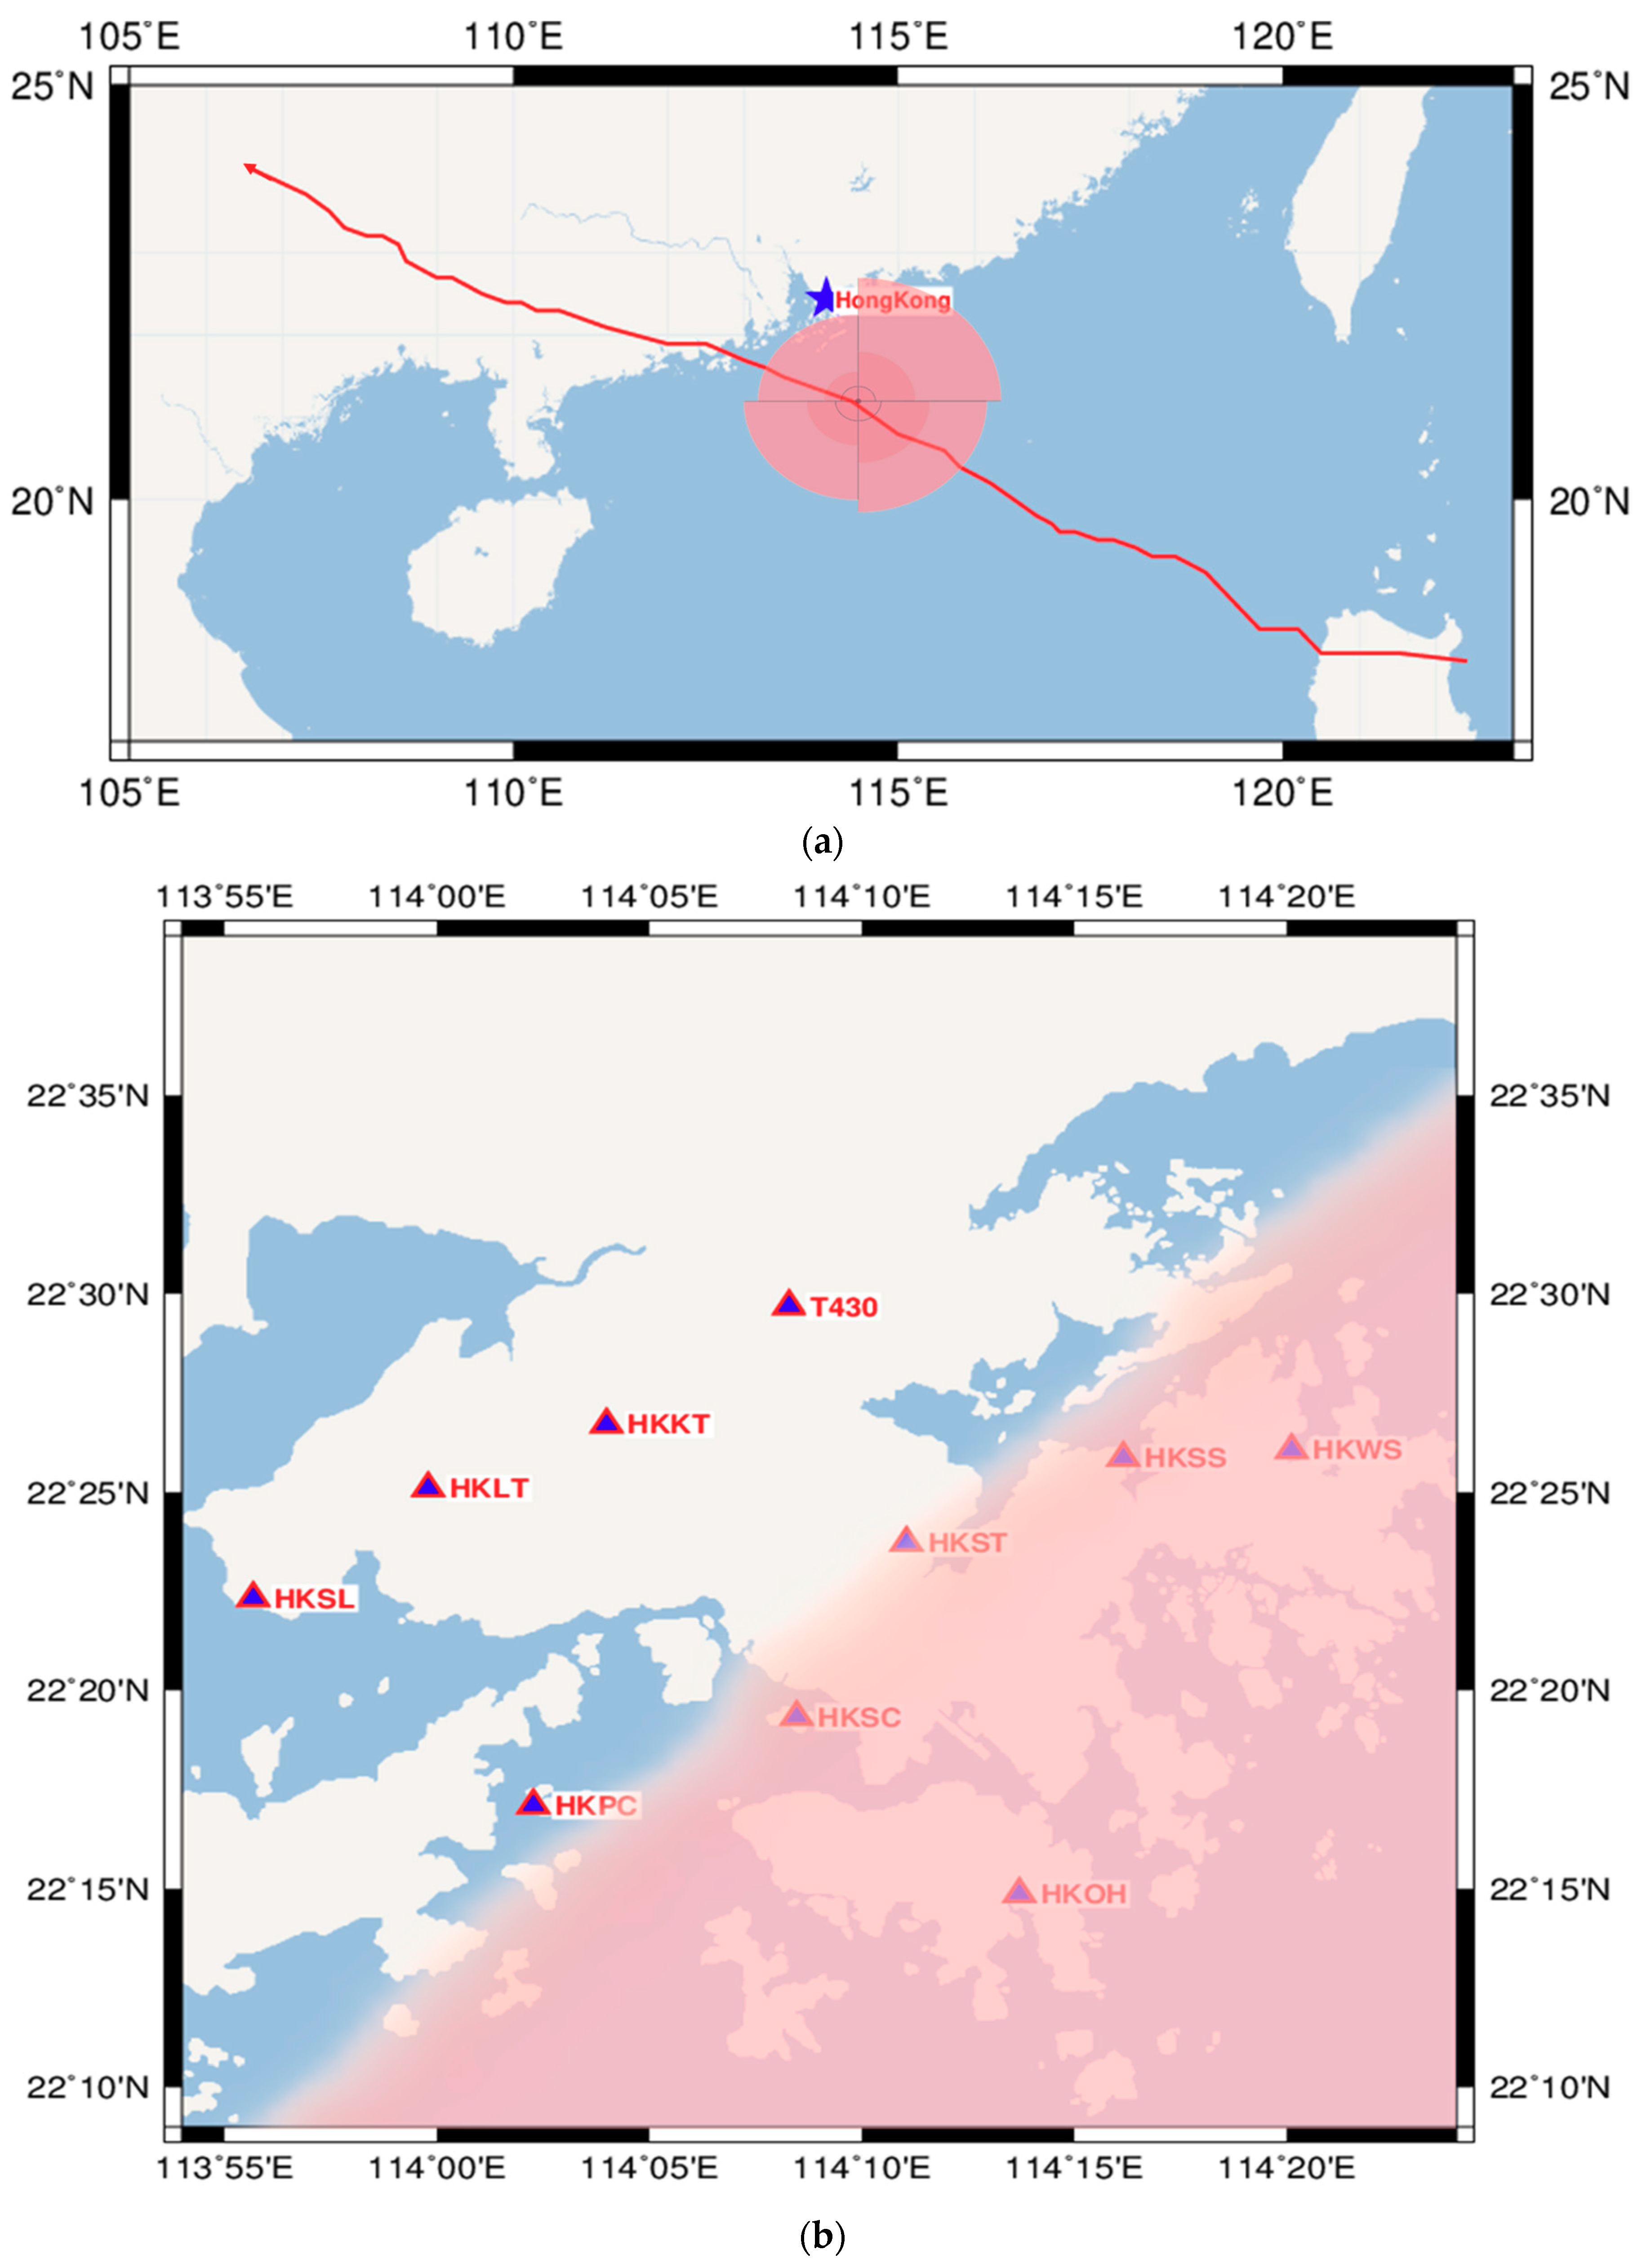
For a better understanding of the abovementioned method for the determination of the movement of the Mangkhut typhoon, it is necessary to know the changes in the area where PWVs were affected by the typhoon’s movement. Figure 15a,b illustrates the typhoon path, roughly, during the period of 15–17 Sept and the Hong Kong area covered by the typhoon at the moment the typhoon passed one GNSS station, respectively, i.e., the station was considered on the edge of the wind circle closest to the typhoon. When the typhoon was approaching, the station was at level 7 wind circle (defined in the range 13.9—17.1 m/s) because the anemometer station’s wind speed at the same moment was about 15.8 m/s (57 km/h) shown in Figure 13. Generally, the radii of level 7 wind circles of a super typhoon can be as large as hundreds of kilometers or even up to thousands of kilometers. Meanwhile in our case study, the distance between adjacent GNSS stations is only several kilometers, thus the edge circle of the typhoon can be considered a straight line when the typhoon circle passed through the site, as showed in Figure 15b.
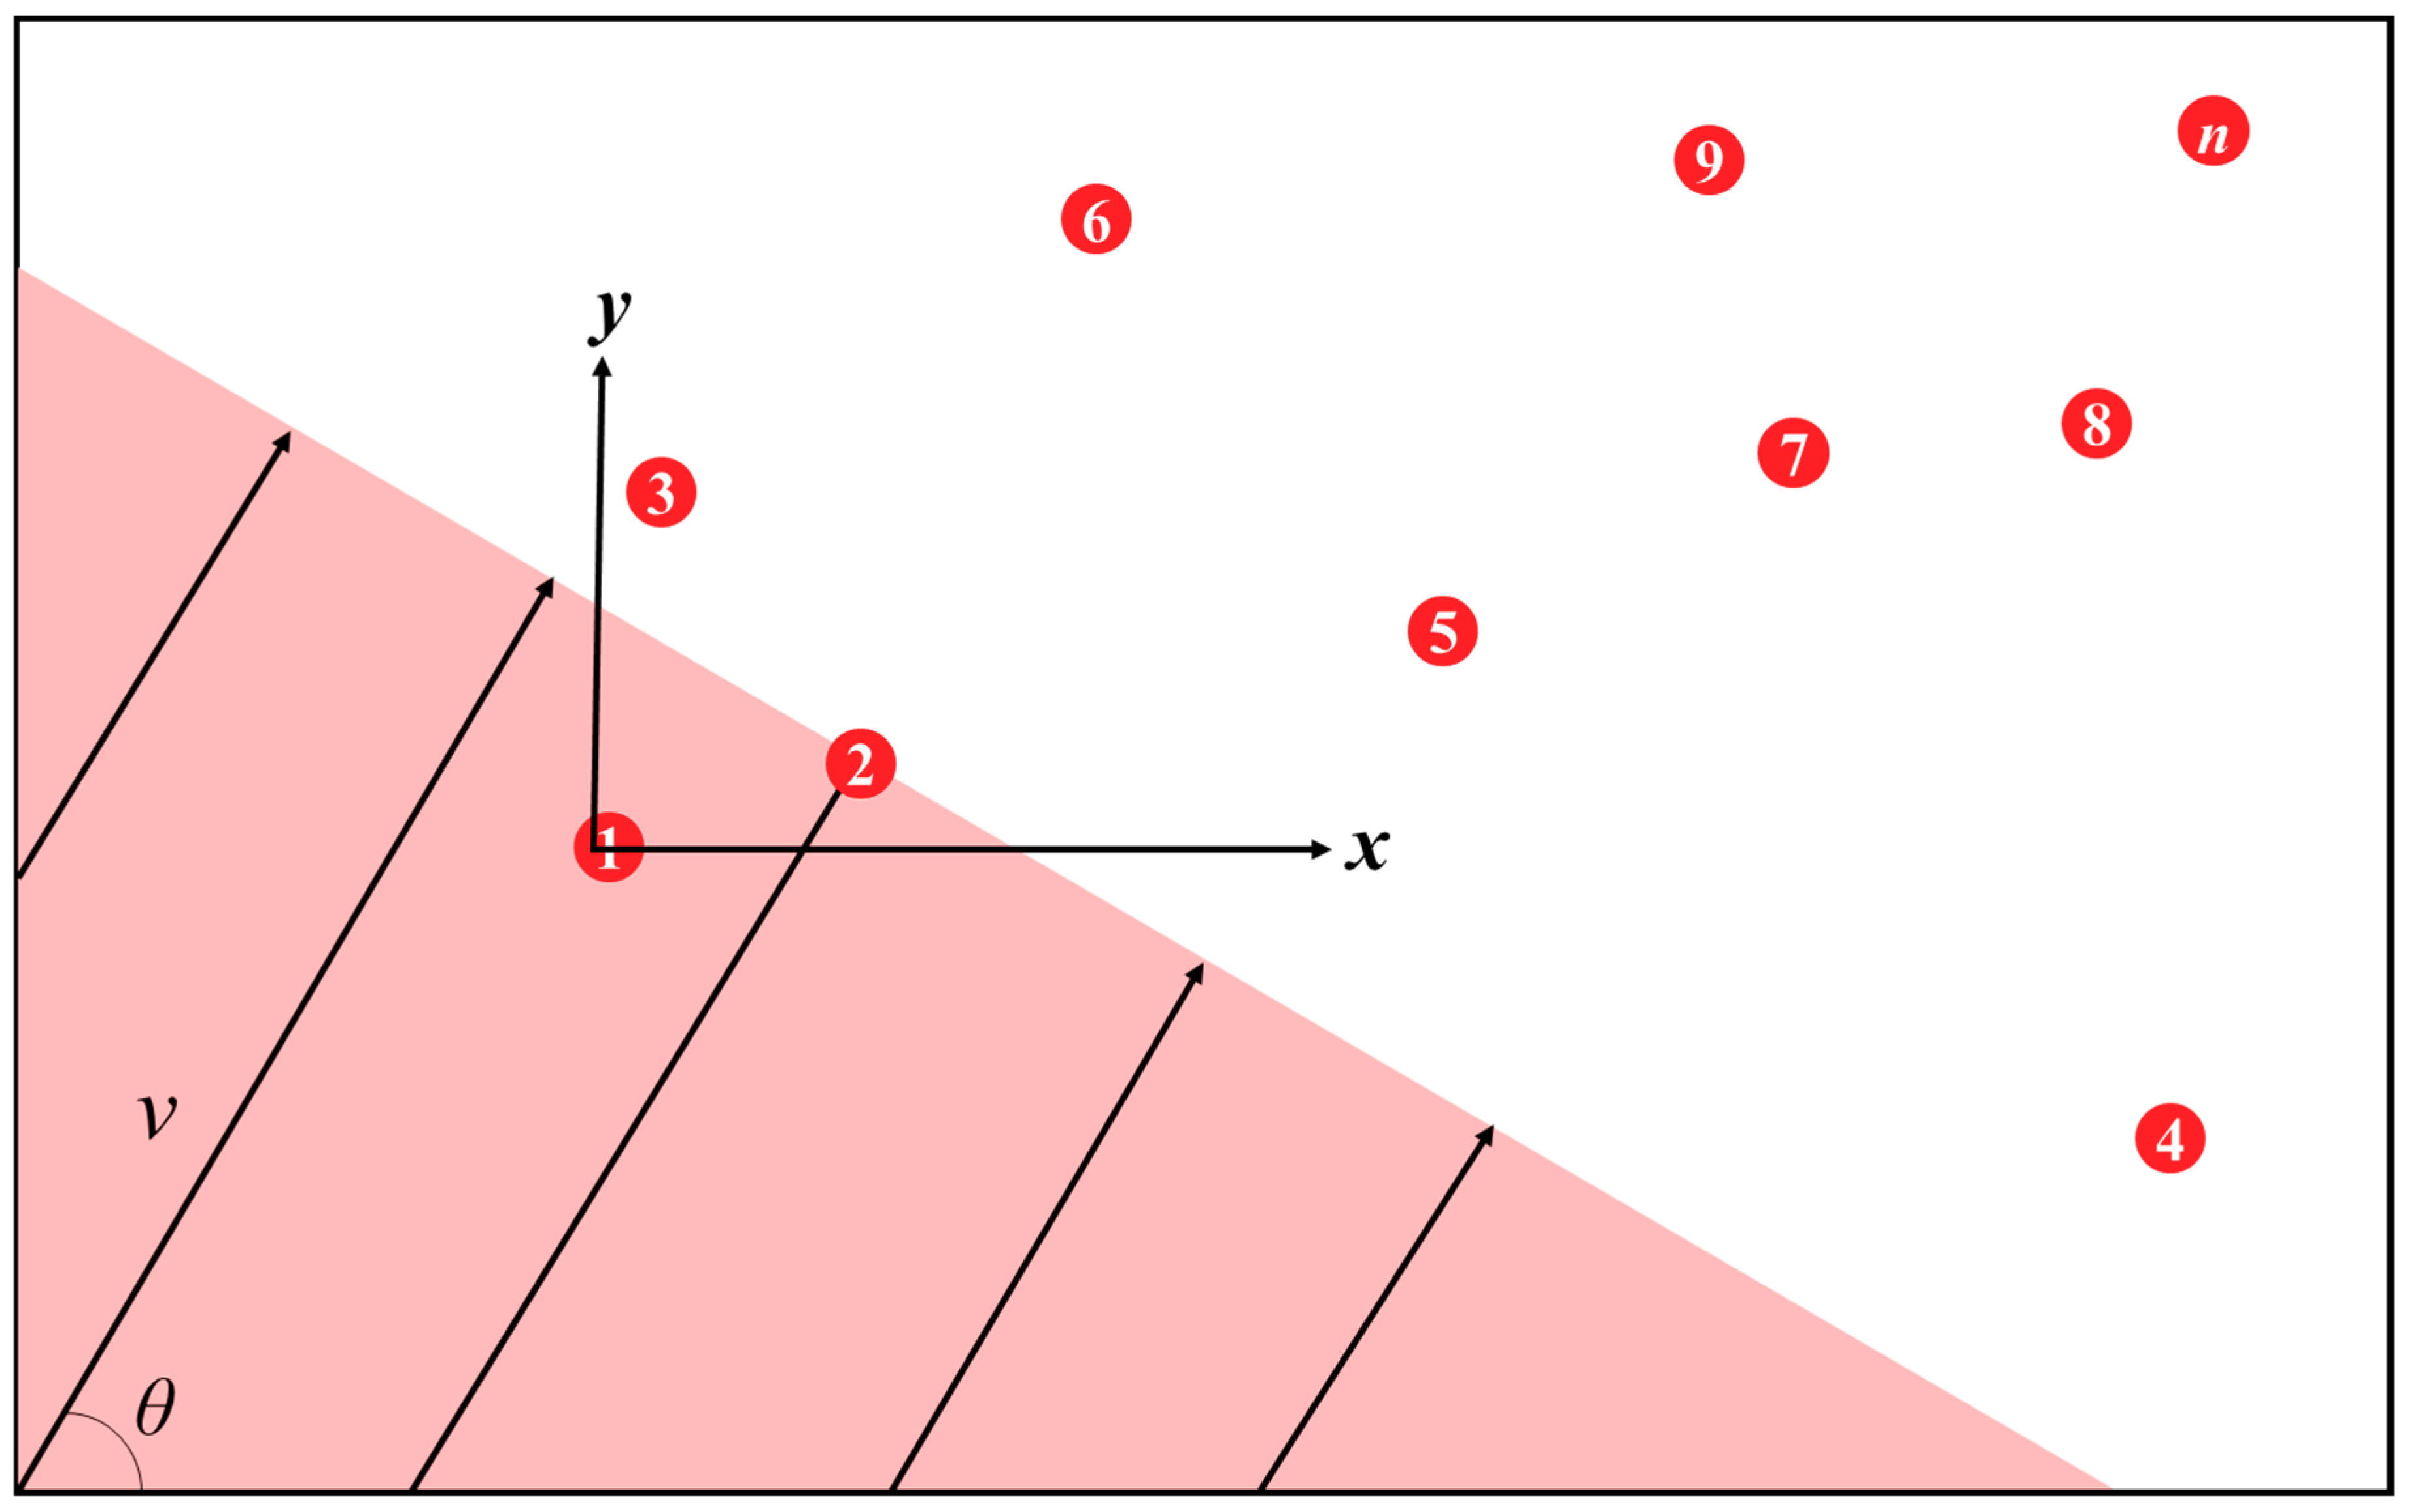
For an introduction to the algorithm of the aforementioned time difference of PWV arrival, Figure 16 is a simple version for the estimation of the movement of the typhoon shown in Figure 15b. For convenience, the rectangular coordinate system shown in Figure 16 is defined as below: The origin is set at the GNSS station that a large amount of water vapor first reaches, see No.1; the Y-axis and X-axis are in the north and east directions. respectively. The black lines with arrows fully covered by the red area denote the assumed moving direction of the typhoon and the red circles denote the location of the n GNSS stations.
From the previous discussions, due to the characteristics of the simultaneity between the movement of PWV (which varies with time) over a region and the movement of a typhoon that covers the region, the times of PWV arrival at the positions of those GNSS stations in the region can be used to depict the movement of the typhoon. For the modelling of the typhoon movement, let the time difference of PWV arrival between the ith (i > 1) GNSS station and the first station (the origin) be ti, and let the margin line be the one that is perpendicular to the movement direction of the typhoon shown in Figure 16, then based on the geometry of the two sites, the function for the edge line of the wind circle can be expressed as:
y v t i sin ( θ ) = cot ( θ ) [ x v t i cos ( θ ) ] + b
where θ and v are the angle of the direction and speed of the typhoon movement, respectively; x and y are the coordinates of a point on the typhoon edge; b is the y-axis intercept and can be obtained from the geometric relationship shown in Figure 16:
b = v t i sin ( θ )
Substituting Equation (11) into Equation (10) leads to:
t i = x i cos ( θ ) + y i sin ( θ ) v
where θ and v are the two unknown parameters and ti is the observation at the ith station.
Let a function Fi(θ, v) = [xicos(θ) + yisin(θ)]/v, and the residual term ri be:
r i ( θ , v ) = t i F i ( θ , v ) .
According to the Gauss–Newton method [56], Equation (12) can be linearized using the first-order Taylor expansion:
t i F i ( θ 0 k , v 0 k ) + F i ( θ , v ) θ | θ = θ 0 k , v = v 0 k ( θ θ 0 k ) + F i ( θ , v ) v | θ = θ 0 k , v = v 0 k ( v v 0 k )
where θk0 and vk0 are the values of the kth iteration of θ and v, respectively.
The matrix form of Equation (13) can be expressed as:
r ( θ , v ) = A ( θ , v ) β
where A(θ, v) is the Jacobian matrix of F(θ, v).
For the kth iteration, Ak and βk are:
{ A k = [ y 2 cos ( θ 0 k ) x 2 sin ( θ 0 k ) v 0 k x 2 cos ( θ 0 k ) + y 2 sin ( θ 0 k ) ( v 0 k ) 2 y 3 cos ( θ 0 k ) x 3 sin ( θ 0 k ) v 0 k x 3 cos ( θ 0 k ) + y 3 sin ( θ 0 k ) ( v 0 k ) 2 y n cos ( θ 0 k ) x n sin ( θ 0 k ) v 0 k x n cos ( θ 0 k ) + y n sin ( θ 0 k ) ( v 0 k ) 2 ] β k = [ θ θ 0 k v v 0 k ] .
Equation (15) is in fact the general linear form of the observation model, thus it can be solved using the least squares method (if redundant observations are available):
q = [ A ( θ , x ) T A ( θ , x ) ] 1 A ( θ , x ) T r ( θ , x ) .
Let qk be the estimate result from the kth iteration, then update the approximate values for the unknown parameters (θ0k and v0k) for the (k + 1)th iteration by:
[ θ 0 k + 1 v 0 k + 1 ] = [ θ 0 k v 0 k ] + q k .
Substitute the new approximate values into Equation (14) and repeating the above process until the result converges, i.e., the estimated q values are under pre-defined thresholds or the residual rk+1rk value is neglectable.
The above approach was tested using data that were from the times of PWV arrival over the aforementioned 10 GNSS stations when the typhoon was approaching Hong Kong (Figure 9 and Figure 13), and the estimation results were: v = 29 km/h, θ = 113°. They agreed well with the results of 31 km/h and the direction angel of 135°, respectively, obtained by the China Meteorological Administration (http://typhoon.nmc.cn/web.html). This suggests that the approach can be employed to estimate the movement direction and speed of a typhoon.

4. Discussion

To study the characteristics of typhoons, GNSS-PWV, which has high temporal resolution, was used to analyze the correlation between PWV and four meteorological elements including temperature, pressure, precipitation, and wind speed during the Mangkhut typhoon that occurred in Hong Kong. Moreover, several studies have proved that a sudden increase in PWV can be a signal of a typhoon’s landing [19,20,21,22]. This agreed with our experimental results (Figure 13). In addition, Figure 14 showed the movement direction of regional PWV depending on the migration of a typhoon and this characteristic can be found in the cases [50,51] in which GNSS-PWV was used to study typhoons. These suggest that the movement of PWV in the region of interest may be used to estimate the movement of a typhoon. The moving speed and direction angle of a typhoon can be obtained from the time differences of PWV arrival at GNSS stations in the region. This method was tested in this study and the results agreed well with the typhoon path provided from satellite remote sensing products from the China Meteorological Administration.
There are other models that also use the GNSS technique to detect typhoons, e.g., the very recent GNSS-derived tropospheric gradient model was used to indicate the derecho storm‘s direction [57]. However, this method is largely limited by the number and distribution of GNSS satellites and can hardly provide a numeric value for the movement speed of a typhoon. Another method that uses normalized GNSS-PWV to estimate the movement speed of a typhoon requires sufficient number of GNSS stations and cannot estimate the movement direction of a typhoon [50]. Compared with these two models, the model proposed in this study only requires a moderate number of GNSS stations and can estimate both velocity and direction of a typhoon’s movement. Although, this model may be more suitable for severe typhoons since the radii of the wind circles of a severe typhoon are much larger than the distance between adjacent GNSS stations, thus the edge line of the typhoon can be assumed to be a straight line (Figure 16).
Nowadays, commonly used meteorological models for typhoon detection are mainly based on traditional techniques such as remote sensing, radar, and unmanned aerial vehicles [58,59,60,61]. Compared to these techniques, the GNSS technique has the advantages of being low-cost, weatherproof, and having high spatial-temporal resolution. With the development of more and more regional GNSS networks and the advances of GNSS data processing methods, more and more GNSS data are available and GNSS-derived tropospheric parameters are more and more accurate. It is promising that the GNSS technique will be applied in meteorology in an advanced level, including in the prediction of extreme weather events.

5. Conclusions

In this study, the characteristics of the variations in PWV time series retrieved from GNSS measurements were investigated for the detection of typhoon extreme weather events since GNSS data have the advantages of low cost and high spatio-temporal resolution in comparison with the sparsely distributed RS data. The Super Typhoon Mangkhut that occurred in Hong Kong in September 2018 was selected as a case study. The GNSS-ZTD time series over 10 stations selected from the Hong Kong regional GNSS CORS network in the three periods—before, during, and after the typhoon period—were assessed by comparing them against these from the IGS precise products. The ZTD-converted PWV over the HKSC GNSS station were compared against RS-derived PWV from a co-located RS station. Results showed that the time series of GNSS-ZTDs and PWV are applicable to meteorological research in terms of their accuracy. Moreover, the relationships between the temporal variations in PWV and in several other atmospheric parameters during the typhoon period were also analyzed. Results showed that the correlation between wind speed and PWV was strong with the value of 76%, and the patterns of the variations in wind speed and water vapor with time were consistent. In addition, during the landing process of the typhoon, the spatial-temporal variations in the regional PWV in this experiment reflected the movement of water vapor, which in turn well represented the typhoon motion. This result also implied that the abnormal increases in the regional PWV were mainly caused by the typhoon. Based on the time differences of PWV arrival at different sites, a model for estimating the moving direction and speed of a typhoon is proposed in this study and its test results agreed well with the ones published by China Meteorological Administration. This result can be a reference for meteorological organizations and used as supplementary information for the traditional typhoon detection measures such as satellite remote sensing and radar.
In fact, typhoons are complex dynamic weather events and initially formed in ocean regions. Using only the meteorological and GNSS data from those stations that are located in land areas has limitations for studying the detailed characteristics of typhoons. In the follow-up, meteorological parameters near the sea will be investigated. In addition, in the model for the estimation of the moving speed and direction of a typhoon, the attenuation of the movement speed after landfall will be taken into account as well, rather than being taken as a constant for reducing the number of unknown parameters. Moreover, in this study, only two-dimensional distribution of water vapor was investigated, and the GNSS stations selected are all located on the same side of the path of the typhoon. If sufficient data are available, the variation of water vapor in the vertical dimension is worth considering using the tomographic technique.

Author Contributions

Q.H. designed the experiments and algorithms, and carried out most of the data processing and analyses; X.L. processed part of GNSS data; S.W., K.Z., Q.Z., X.W., Z.S., L.L., and M.W. contributed to the logic and structure of scientific presentation, the interpretation of the results, and the review of the manuscript. All authors have read and agreed to the published version of the manuscript.

Funding

This research and the APC were both funded by the National Natural Science Foundations of China, grant number: 41730109.

Acknowledgments

The authors greatly acknowledge the financial support from the National Natural Science Foundations of China (No. 41730109). We would like to acknowledge the support of the Jiangsu dual creative talents and Jiangsu dual creative teams program projects of Jiangsu Province, China, awarded in 2017. The authors appreciate the International GNSS Service, Hong Kong Survey and Mapping Office lands Department, University of Wyoming’s department of atmospheric sciences, atmospheric administration’s science and technology division server department and Hong Kong Observatory for the provision of relevant data and products.

Conflicts of Interest

The authors declare no conflict of interest.

References

  1. Jiang, X.; Mori, N.; Tatano, H.; Yang, L.; Shibutani, Y. Estimation of property loss and business interruption loss caused by storm surge inundation due to climate change: A case of Typhoon Vera revisit. Nat. Hazards 2016, 84, 35–49. [Google Scholar] [CrossRef]
  2. Lin, M.Y.; Sun, W.Y.; Chiou, M.D.; Chen, C.Y.; Cheng, H.Y.; Chen, C.H. Development and evaluation of a storm surge warning system in Taiwan. Ocean Dyn. 2018, 68, 1025–1049. [Google Scholar] [CrossRef]
  3. Lu, J.; Feng, T.; Li, J.; Cai, Z.; Xu, X.; Li, L.; Li, J. Impact of assimilating himawari-8-derived layered precipitable water with varying cumulus and microphysics parameterization schemes on the simulation of typhoon hato. J. Geophys. Res. Atmos. 2019, 124, 3050–3071. [Google Scholar] [CrossRef]
  4. Kudo, T.; Kawamura, R.; Hirata, H.; Ichiyanagi, K.; Tanoue, M.; Yoshimura, K. Large-scale vapor transport of remotely evaporated seawater by a Rossby wave response to typhoon forcing during the Baiu/Meiyu season as revealed by the JRA-55 reanalysis. J. Geophys. Res. Atmos. 2014, 119, 8825–8838. [Google Scholar] [CrossRef]
  5. Chen, B.; Liu, Z. Analysis of precipitable water vapor (PWV) data derived from multiple techniques: GPS, WVR, radiosonde and NHM in Hong Kong. In China Satellite Navigation Conference (CSNC) 2014 Proceedings; Springer: Berlin/Heidelberg, Germany, 2014; Volume 1, pp. 159–175. [Google Scholar]
  6. Pérez-Ramírez, D.; Navas-Guzmán, F.; Lyamani, H.; Fernández-Gálvez, J.; Olmo, F.J.; Alados-Arboledas, L. Retrievals of precipitable water vapor using star photometry: Assessment with Raman lidar and link to sun photometry. J. Geophys. Res. Atmos. 2012, 117. [Google Scholar] [CrossRef] [Green Version]
  7. Schmid, B.; Hegg, D.A.; Wang, J.; Bates, D.; Redemann, J.; Russell, P.B.; Flagan, R.C. Column closure studies of lower tropospheric aerosol and water vapor during ACE-Asia using airborne Sun photometer and airborne in situ and ship-based lidar measurements. J. Geophys. Res. Atmos. 2003, 108. [Google Scholar] [CrossRef] [Green Version]
  8. Boone, C.D.; Walker, K.A.; Bernath, P.F. Speed-dependent Voigt profile for water vapor in infrared remote sensing applications. J. Quant. Spectrosc. Radiat. Transf. 2007, 105, 525–532. [Google Scholar] [CrossRef]
  9. Bevis, M.; Businger, S.; Herring, T.A.; Rocken, C.; Anthes, R.A.; Ware, R.H. GPS meteorology: Remote sensing of atmospheric water vapor using the Global Positioning System. J. Geophys. Res. Atmos. 1992, 97, 15787–15801. [Google Scholar] [CrossRef]
  10. Zhang, H.; Yuan, Y.; Li, W.; Zhang, B. A real-time precipitable water vapor monitoring system using the national GNSS network of China: Method and preliminary results. IEEE J. Sel. Top. Appl. Earth Observ. Remote Sens. 2019, 12, 1587–1598. [Google Scholar] [CrossRef]
  11. Wang, J.; Wu, Z.; Semmling, M.; Zus, F.; Gerland, S.; Ramatschi, M.; Schuh, H. Retrieving precipitable water vapor from Shipborne Multi-GNSS Observations. Geophys. Res. Lett. 2019, 46, 5000–5008. [Google Scholar] [CrossRef] [Green Version]
  12. Shoji, Y.; Sato, K.; Yabuki, M.; Tsuda, T. Comparison of shipborne GNSS-derived precipitable water vapor with radiosonde in the western North Pacific and in the seas adjacent to Japan. Earth Planets Space 2017, 69, 153. [Google Scholar] [CrossRef]
  13. Zhao, Q.; Yao, Y.; Yao, W.; Zhang, S. GNSS-derived PWV and comparison with radiosonde and ECMWF ERA-Interim data over mainland China. J. Atmos. Sol. Terr. Phys. 2019, 182, 85–92. [Google Scholar] [CrossRef]
  14. Manandhar, S.; Lee, Y.H.; Meng, Y.S.; Yuan, F.; Ong, J.T. GPS-Derived PWV for rainfall Nowcasting in tropical region. IEEE Trans. Geosci. Remote Sens. 2018, 56, 4835–4844. [Google Scholar] [CrossRef]
  15. Yao, Y.; Shan, L.; Zhao, Q. Establishing a method of short-term rainfall forecasting based on GNSS-derived PWV and its application. Sci. Rep. 2017, 7, 12465. [Google Scholar] [CrossRef]
  16. Chacón, A.; Cuevas, O.; Pozo, D.; Marín, J.; Oyanadel, A.; Dougnac, C.; Sarazin, M. Measuring and forecasting of PWV above La Silla, APEX and Paranal Observatories. Revista Mexicana de Astronomía y Astrofísica 2011, 41, 20–23. [Google Scholar]
  17. Zhang, K.; Manning, T.; Wu, S.; Rohm, W.; Silcock, D.; Choy, S. Capturing the signature of severe weather events in Australia using GPS measurements. J. Sel. Top. Appl. Earth Observ. Remote Sens. 2015, 8, 1839–1847. [Google Scholar] [CrossRef]
  18. Sangiorgio, M.; Barindelli, S.; Biondi, R.; Solazzo, E.; Realini, E.; Venuti, G.; Guariso, G. Improved extreme rainfall events forecasting using neural networks and water vapor measures. In Proceedings of the International Conference on Time Series and Forecasting (ITISE), Granada, Spain, 25–27 September 2019; Volume 2, pp. 820–826. [Google Scholar]
  19. Liu, J.C.; Zhong, W.; Liu, S.; Lu, H.C. Allocation difference analyses of water substances during typhoon landing processes. J. Trop. Meteorol. 2018, 24, 300–313. [Google Scholar]
  20. Xu, H.; Zhai, G.; Li, X. Convective-stratiform rainfall separation of typhoon Fitow (2013): A 3D WRF modeling study. Terr. Atmos. Ocean. Sci. 2018, 29, 315–329. [Google Scholar] [CrossRef] [Green Version]
  21. Qi-Hua, L.; Han-Cheng, L.; Wei, Z.; Wei-Chao, W.; Xing-Liang, G.; Meng, Y. Meso-scale transport characteristics and budget diagnoses of water vapor in binary typhoons. Acta Phys. Sin. 2018, 67. [Google Scholar] [CrossRef]
  22. Zhao, Q.; Yao, Y.; Yao, W. GPS-based PWV for precipitation forecasting and its application to a typhoon event. J. Atmos. Sol. Terr. Phys. 2018, 167, 124–133. [Google Scholar] [CrossRef]
  23. Dach, R.; Lutz, S.; Walser, P.; Fridez, P. Bernese GNSS Software, Version 5.2; Astronomical Institute, University of Bern: Bern, Switzerland, 2015; p. 884. [Google Scholar]
  24. Troller, M.; Geiger, A.; Brockmann, E.; Kahle, H.G. Determination of the spatial and temporal variation of tropospheric water vapour using CGPS networks. Geophys. J. Int. 2006, 167, 509–520. [Google Scholar] [CrossRef] [Green Version]
  25. Thayer, G.D. An improved equation for the radio refractive index of air. Radio Sci. 1974, 9, 803–807. [Google Scholar] [CrossRef]
  26. Böhm, J.; Niell, A.; Tregoning, P.; Schuh, H. Global Mapping Function (GMF): A new empirical mapping function based on numerical weather model data. Geophys. Res. Lett. 2006, 33. [Google Scholar] [CrossRef] [Green Version]
  27. Solheim, F.S.; Vivekanandan, J.; Ware, R.H.; Rocken, C. Propagation delays induced in GPS signals by dry air, water vapor, hydrometeors, and other particulates. J. Geophys. Res. Atmos. 1999, 104, 9663–9670. [Google Scholar] [CrossRef]
  28. Hopfield, H.S. Two-quartic tropospheric refractivity profile for correcting satellite data. J. Geophys. Res. 1969, 74, 4487–4499. [Google Scholar] [CrossRef]
  29. Saastamoinen, J. Contributions to the theory of atmospheric refraction. Bulletin Géodésique 1973, 107, 13–34. [Google Scholar] [CrossRef]
  30. Black, H.D.; Eisner, A. Correcting satellite Doppler data for tropospheric effects. J. Geophys. Res. Atmos. 1984, 89, 2616–2626. [Google Scholar] [CrossRef]
  31. Rocken, C.; Hove, T.V.; Johnson, J.; Solheim, F.; Ware, R.; Bevis, M.; Businger, S. GPS/STORM—GPS sensing of atmospheric water vapor for meteorology. J. Atmos. Ocean. Technol. 1995, 12, 468–478. [Google Scholar] [CrossRef]
  32. Davis, J.L.; Herring, T.A.; Shapiro, I.I.; Rogers, A.E.E.; Elgered, G. Geodesy by radio interferometry: Effects of atmospheric modeling errors on estimates of baseline length. Radio Sci. 1985, 20, 1593–1607. [Google Scholar] [CrossRef]
  33. Byun, S.H.; Bar-Sever, Y.E. A new type of troposphere zenith path delay product of the international GNSS service. J. Geod. 2009, 83, 1–7. [Google Scholar] [CrossRef] [Green Version]
  34. Yuan, Y.; Zhang, K.; Rohm, W.; Choy, S.; Norman, R.; Wang, C.S. Real-time retrieval of precipitable water vapor from GPS precise point positioning. J. Geophys. Res. Atmos. 2014, 119, 10044–10057. [Google Scholar] [CrossRef]
  35. De Haan, S. National/Regional Operational Procedures of GPS Water Vapour Networks and Agreed International Procedures; Rep. WMO/TD-No. 1340; KNMI: De Bilt, The Netherlands, 2006; p. 20. [Google Scholar]
  36. Park, C.G.; Baek, J.H.; Cho, J.H. Analysis on characteristics of radiosonde bias using GPS precipitable water vapor. J. Astron. Space Sci. 2010, 27, 213–220. [Google Scholar] [CrossRef] [Green Version]
  37. Liu, Z.; Wong, M.S.; Nichol, J.; Chan, P.W. A multi-sensor study of water vapour from radiosonde, MODIS and AERONET: A case study of Hong Kong. Int. J. Climatol. 2013, 33, 109–120. [Google Scholar] [CrossRef] [Green Version]
  38. Ortiz de Galisteo, J.P.; Bennouna, Y.; Toledano, C.; Cachorro, V.; Romero, P.; Andrés, M.I.; Torres, B. Analysis of the annual cycle of the precipitable water vapour over Spain from 10-year homogenized series of GPS data. Q. J. R. Meteorol. Soc. 2014, 140, 397–406. [Google Scholar] [CrossRef]
  39. Benevides, P.; Catalao, J.; Miranda, P.M.A. On the inclusion of GPS precipitable water vapour in the nowcasting of rainfall. Nat. Hazards Earth Syst. Sci. 2015, 15, 2605–2616. [Google Scholar] [CrossRef] [Green Version]
  40. Rybin, E.N.; Valyukhov, V.P.; Kuptsov, V.D. Thermodynamics of supersaturated vapor nucleation on molecular condensation nuclei. Tech. Phys. 2012, 57, 1062–1067. [Google Scholar] [CrossRef]
  41. Jiao, J.; Su, D.; Wang, Y. Dynamics of water vapor content around isolated sprinklers: Description and validation of model. Water 2017, 9, 307. [Google Scholar] [CrossRef] [Green Version]
  42. He, Y.C.; Li, Q.S.; Chan, P.W.; Wu, J.R.; Fu, J.Y. Toward modeling the spatial pressure field of tropical cyclones: Insights from Typhoon Hato (1713). J. Wind Eng. Ind. Aerodyn. 2019, 184, 378–390. [Google Scholar] [CrossRef]
  43. Li, J.; Wang, G.; Lin, W.; He, Q.; Feng, Y.; Mao, J. Cloud-scale simulation study of Typhoon Hagupit (2008) Part I: Microphysical processes of the inner core and three-dimensional structure of the latent heat budget. Atmos. Res. 2013, 120, 170–180. [Google Scholar] [CrossRef]
  44. Barindelli, S.; Realini, E.; Venuti, G.; Fermi, A.; Gatti, A. Detection of water vapor time variations associated with heavy rain in northern Italy by geodetic and low-cost GNSS receivers. Earth Planets Space 2018, 70, 28. [Google Scholar] [CrossRef] [Green Version]
  45. Sapucci, L.F.; Machado, L.A.; de Souza, E.M.; Campos, T.B. Global P ositioning S ystem precipitable water vapour (GPS-PWV) jumps before intense rain events: A potential application to nowcasting. Meteorol. Appl. 2019, 26, 49–63. [Google Scholar] [CrossRef] [Green Version]
  46. Shen, H.; He, Y.; Hsu, S.A. Estimating downwind turbulence intensity using wind and wave measurements during hurricanes. Appl. Ocean Res. 2019, 88, 71–75. [Google Scholar] [CrossRef]
  47. Huang, W.F.; Sun, J.P. Prediction of typhoon design wind speed with cholesky decomposition method. Struct. Des. Tall Spec. Build. 2018, 27, e1480. [Google Scholar] [CrossRef]
  48. Huang, W.F.; Xu, Y.L.; Li, C.W.; Liu, H.J. Prediction of design typhoon wind speeds and profiles using refined typhoon wind field model. Adv. Steel Constr. 2011, 7, 387–402. [Google Scholar]
  49. Onn, F.; Zebker, H.A. Correction for interferometric synthetic aperture radar atmospheric phase artifacts using time series of zenith wet delay observations from a GPS network. J. Geophys. Res. 2006, 111, B9. [Google Scholar] [CrossRef]
  50. Won, J.; Kim, D. Analysis of temporal and spatial variation of precipitable water vapor according to path of Typhoon EWINIAR using GPS permanent stations. J. Position. Navig. Timing 2015, 4, 87–95. [Google Scholar] [CrossRef] [Green Version]
  51. Tang, X.; Hancock, C.; Xiang, Z.; Kong, Y.; Ligt, H.; Shi, H.; Quaye-Ballard, J. Precipitable water vapour retrieval from GPS precise point positioning and NCEP CFSv2 dataset during typhoon events. Sensors. 2018, 18, 3831. [Google Scholar] [CrossRef] [Green Version]
  52. Wei-Jen Chang, S. The orographic effects induced by an island mountain range on propagating tropical cyclones. Mon. Weather Rev. 1982, 110, 1255–1270. [Google Scholar] [CrossRef] [Green Version]
  53. Wei, C.C. Forecasting surface wind speeds over offshore islands near Taiwan during tropical cyclones: Comparisons of data-driven algorithms and parametric wind representations. J. Geophys. Res. Atmos. 2015, 120, 1826–1847. [Google Scholar] [CrossRef]
  54. Yoshikane, T.; Kimura, F. Climatic features of the water vapor transport around east Asia and rainfall over Japan in June and September. Geophys. Res. Lett. 2005, 32. [Google Scholar] [CrossRef]
  55. Song, D.S.; Yun, H.S. Analysis of GPS precipitable water vapor variation during the influence of a Typhoon EWINIAR. J. Korean Soc. Civ. Eng. 2006, 26, 1033–1041. [Google Scholar]
  56. Campbell, S.L.; Kunkel, P.; Bobinyec, K. A minimal norm corrected underdetermined Gauß–Newton procedure. Appl. Numer. Math. 2012, 62, 592–605. [Google Scholar] [CrossRef]
  57. Nykiel, G.; Figurski, M.; Baldysz, Z. Analysis of GNSS sensed precipitable water vapour and tropospheric gradients during the derecho event in Poland of 11th August 2017. J. Atmos. Sol. Terr. Phys. 2019, 193, 105082. [Google Scholar] [CrossRef]
  58. Hsiao, L.F.; Yang, M.J.; Lee, C.S.; Kuo, H.C.; Shih, D.S.; Tsai, C.C.; Hong, J.S. Ensemble forecasting of typhoon rainfall and floods over a mountainous watershed in Taiwan. J. Hydrol. 2013, 506, 55–68. [Google Scholar] [CrossRef] [Green Version]
  59. Wang, M.; Xue, M.; Zhao, K.; Dong, J. Assimilation of T-TREC-retrieved winds from single-Doppler radar with an ensemble Kalman filter for the forecast of Typhoon Jangmi (2008). Mon. Weather Rev. 2014, 142, 1892–1907. [Google Scholar] [CrossRef] [Green Version]
  60. Lin, P.H.; Lee, C.S. The eyewall-penetration reconnaissance observation of typhoon longwang (2005) with unmanned aerial vehicle, aerosonde. J. Atmos. Ocean. Technol. 2008, 25, 15–25. [Google Scholar] [CrossRef]
  61. Yang, Y.J.; Chang, M.H.; Hsieh, C.Y.; Chang, H.I.; Jan, S.; Wei, C.L. The role of enhanced velocity shears in rapid ocean cooling during Super Typhoon Nepartak 2016. Nat. Commun. 2019, 10, 1627. [Google Scholar] [CrossRef]
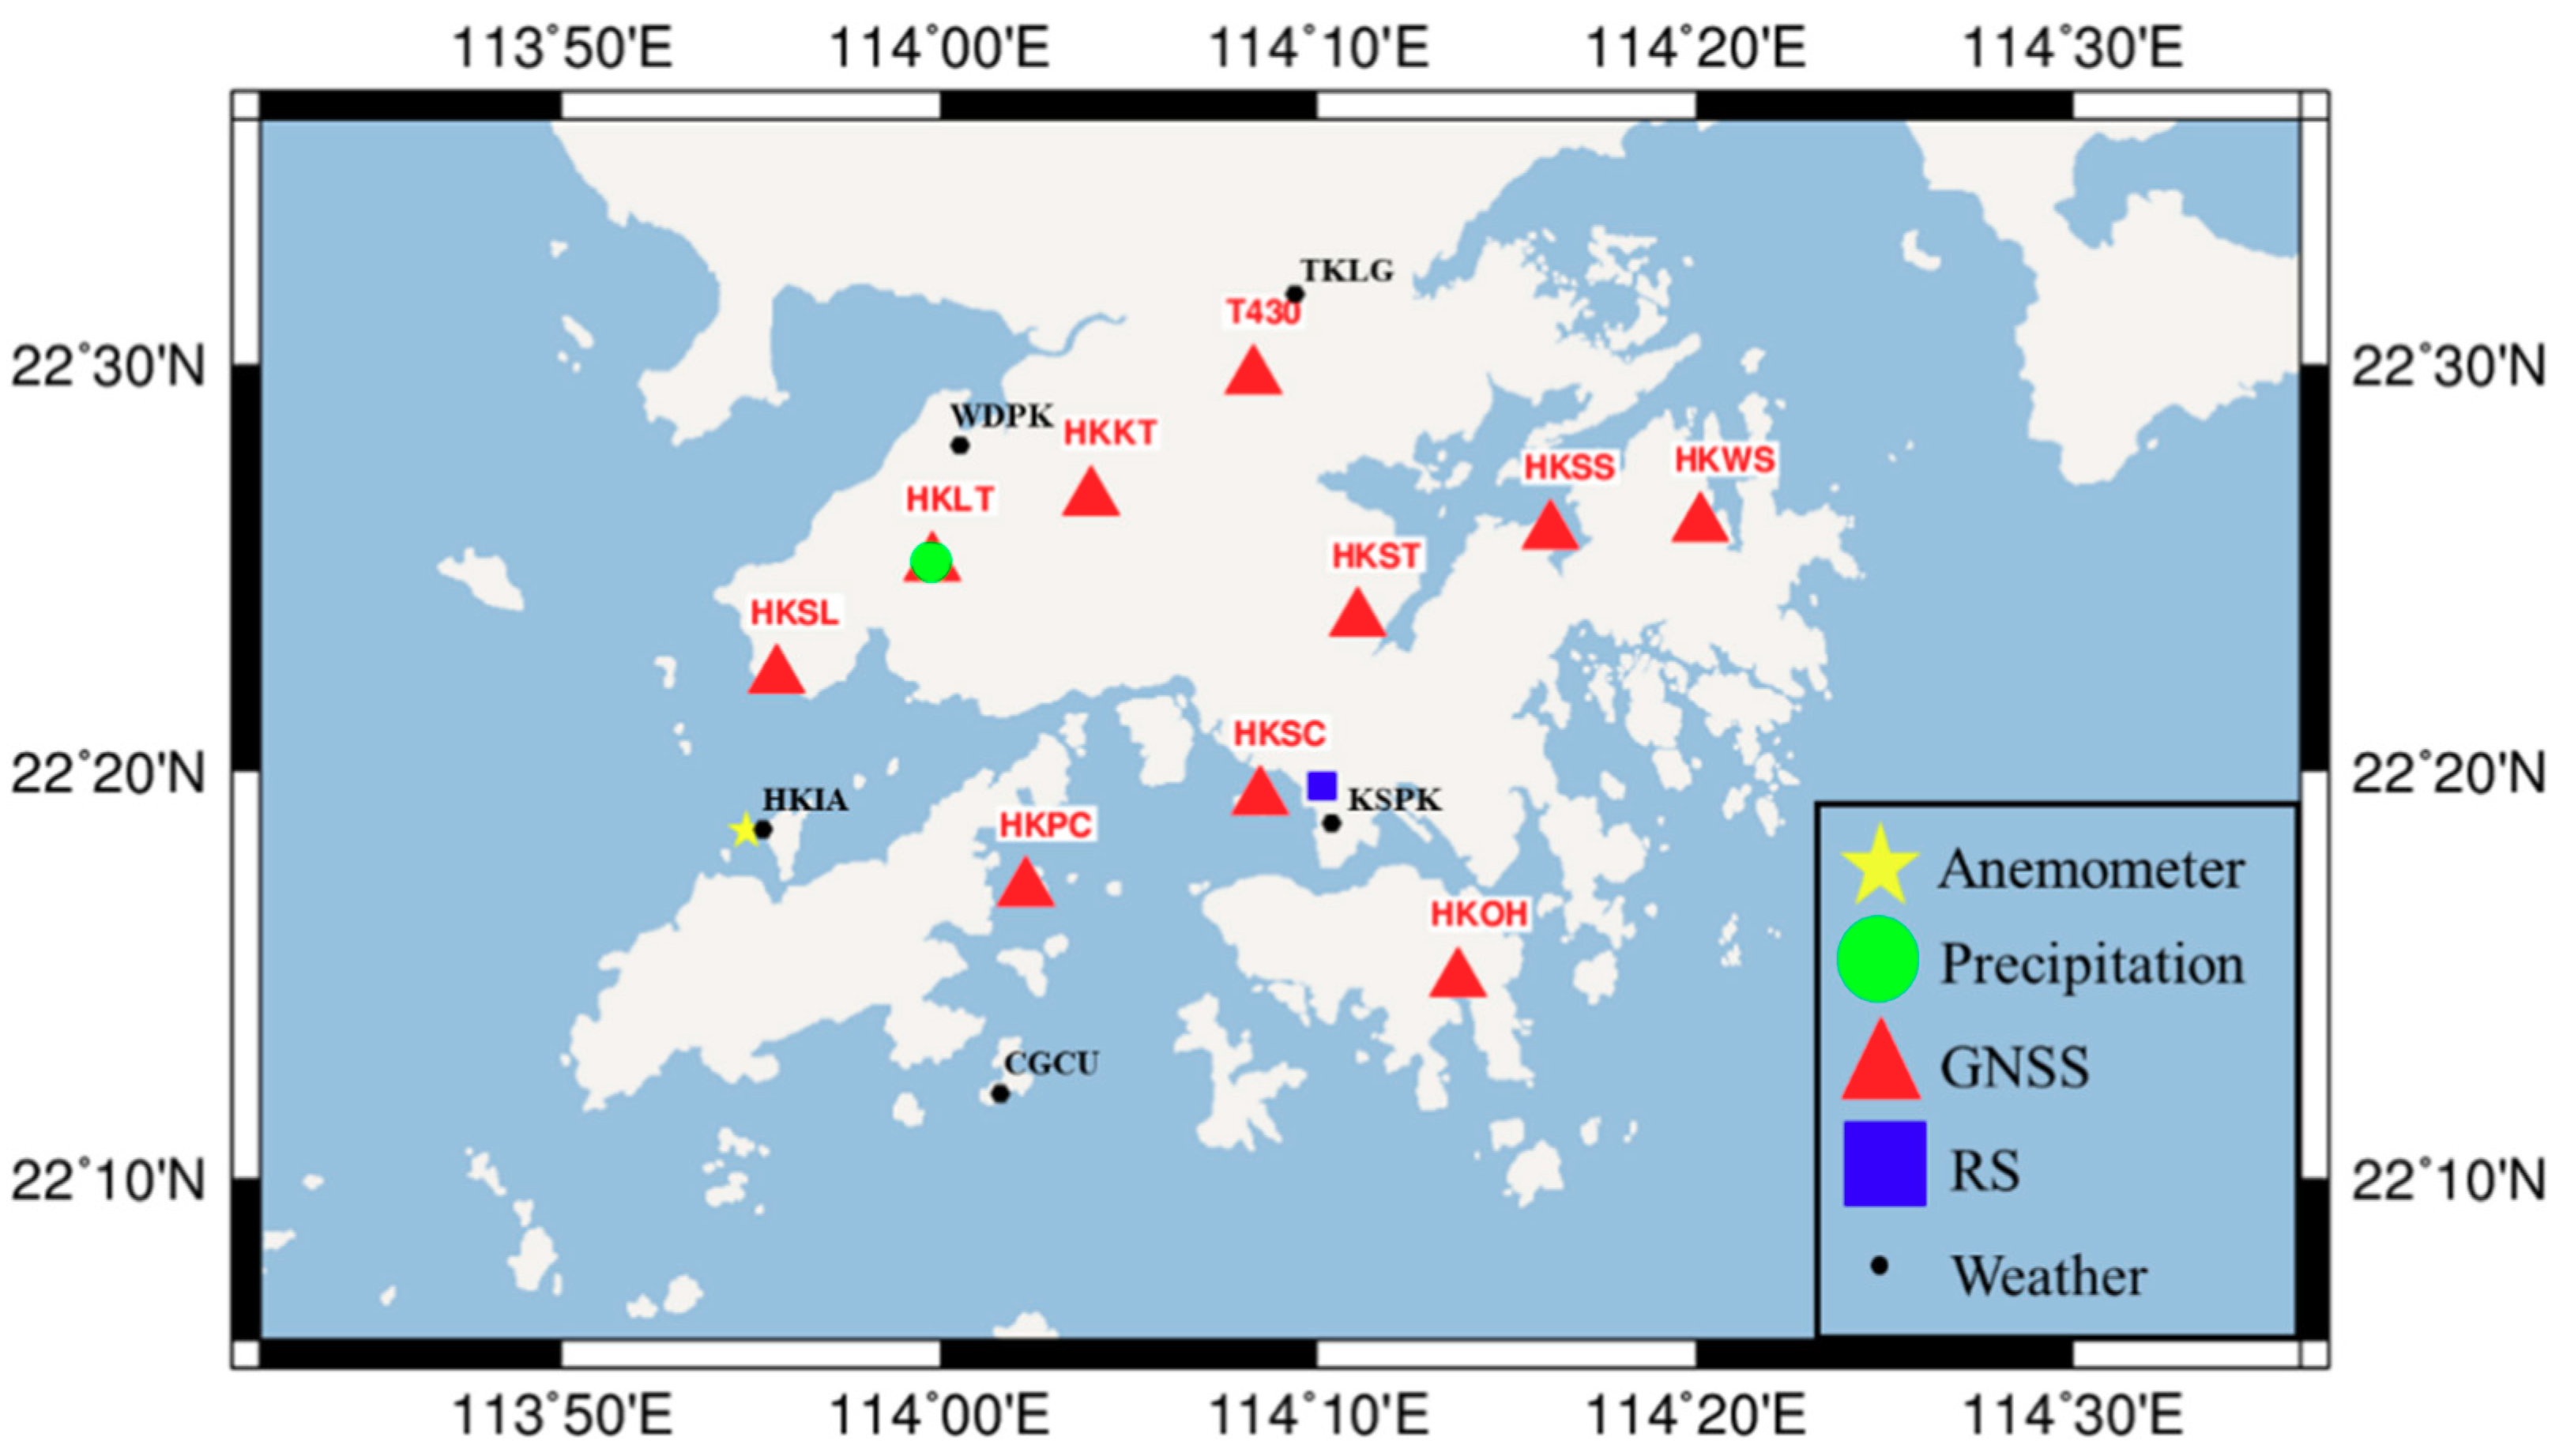
Figure 1. Location of the Hong Kong continuously operating reference stations (CORS) equipped with meteorological observing equipment (red triangles), radiosonde (RS) station (blue square), precipitation station (green circle), anemometer station (yellow star), and automatic weather stations (black dots).
Remotesensing 12 00104 g001
Figure 2. Comparison of real-time zenith total delay (RT-ZTD) and international GNSS (global navigation satellite systems) service (IGS)-ZTD over two stations HKSL (left) and HKWS (right) during the period of 7–25 September 2018.
Remotesensing 12 00104 g002
Figure 3. Comparison between the GNSS-precipitable water vapor (PWV) time series over the HKSC station and the discrete RS-PWV (left), and statistics of the differences between the two results shown in the left subfigure (right) during the period of 7–25 September.
Remotesensing 12 00104 g003
Figure 4. Trajectory of typhoon Mangkhut (every 6 h) during the period of 7–17 Sept.
Remotesensing 12 00104 g004
Figure 5. Daily mean wind speed over each weather station in September.
Remotesensing 12 00104 g005
Figure 6. Daily mean pressure over each weather station in September.
Remotesensing 12 00104 g006
Figure 7. Daily mean temperature over each weather station in September.
Remotesensing 12 00104 g007
Figure 8. Daily mean precipitation over each weather station in September.
Remotesensing 12 00104 g008
Figure 9. Time series of 3-min GNSS-PWV over each of the 10 selected GNSS stations during the period of 7–25 September.
Remotesensing 12 00104 g009
Figure 10. Time series of 3-min GNSS-PWV, 1-min temperature, and 1-min pressure over the HKSL station during stations the four-day period of 15–18 Sept.
Remotesensing 12 00104 g010
Figure 11. Times series of 3-min PWV (blue line) and hourly precipitation (purple histogram) over the HKLT station during the four-day period of 15–18 September.
Remotesensing 12 00104 g011
Figure 12. A typical typhoon’s wind circle radii; the higher the level value, the larger the wind speed and the closer to the center of the typhoon.
Remotesensing 12 00104 g012
Figure 13. Time series of PWV (blue) over the HKSL station and wind speed (red) over the anemometer station during the four-day period of 15–18 September (both stations are close).
Remotesensing 12 00104 g013
Figure 14. (a) Snapshots of Hong Kong regional PWV at 00:00 on the 16th; (be) Snapshots of increment of PWV (IPWV) maps in the region every 2 h from 02:00 to 08:00 on the day, where the red arrow denotes the moving direction of the typhoon (MDT) roughly.
Remotesensing 12 00104 g014
Figure 15. (a) Radii of the wind circles in different directions and movement path of Mangkhut typhoon. (b) Edge of the typhoon when it passed the Hong Kong area.
Remotesensing 12 00104 g015
Figure 16. Illustration for the algorithm of the time difference of PWV arrival for determining the movement of a typhoon when the typhoon is approaching GNSS stations in the rectangle coordinate system defined in this study.
Remotesensing 12 00104 g016
Table 1. Bias, standard deviation (STD), and root mean square (RMS) of the differences between the RT-ZTD and IGS-ZTD time series shown in Figure 2.
StationBias (mm)STD (mm)RMS (mm)
HKSL2.57.17.6
HKWS2.96.87.4