Article

Contrasting Post-Fire Dynamics between Africa and South America based on MODIS Observations

1
College of Geography and Environmental Sciences, Zhejiang Normal University, Jinhua 321004, China
2
Key Lab of Ecosystem Network Observation and Modeling, Institute of Geographical Sciences and Natural Resource Research, Beijing 100101, China
3
School of Earth & Atmospheric Sciences, Georgia Institute of Technology, Atlanta, GA 30332, USA
4
State Key Laboratory of Vegetation and Environmental Change, Institute of Botany, Chinese Academy of Sciences, Xiangshan, Beijing 100093, China
5
Faculty of Agriculture, Shizuoka University, Shizuoka 422-8529, Japan
*
Author to whom correspondence should be addressed.
Remote Sens. 2019, 11(9), 1074; https://doi.org/10.3390/rs11091074
Submission received: 1 April 2019 / Revised: 25 April 2019 / Accepted: 5 May 2019 / Published: 7 May 2019
(This article belongs to the Section Remote Sensing in Agriculture and Vegetation)

Abstract

:
Fire is an important driver of land cover change throughout the world, affecting processes such as deforestation, forest recovery and vegetation transition. Little attention has been given to the role of fire in shaping the temporal and spatial land cover changes among continents. This study has integrated two MODIS products (MCD64A1: Burned area and MCD12Q1: Land cover) over Africa and South America from 2001–2013 to explore the vegetation dynamics after fires. The results indicated that while Africa suffered from repeated fires, more than 50% of the total burned area in South America experienced only one fire. The vegetation dynamics of the high-density vegetated regions in the 10 years after a fire showed that the forest losses in the first year after a fire in Africa were slightly larger than that in South America (Africa: 17.2% vs. South America: 14.5% in the Northern Hemisphere). The continental comparison suggested that early successional forests in Africa recovered relatively fast (northern part: 10.2 years; southern part: 12.8 years) than in South America, which recovered (18.4 years) slowly in Northern Hemisphere or ever with no recovery in the Southern Hemisphere. No clear information of the recoveries of other vegetation types (i.e., shrub, grass and crop) in Africa or South America could be identified from the satellite data. In addition, we also analyzed the changes of high-density vegetation in non-burned regions in both continents. These findings highlighted the impact of the fire regime on the vegetation changes in Africa, which appear resilient to fire, but there were complex systems in South America related to fires.

Graphical Abstract

1. Introduction

Fire is an important process on Earth and one of the most prevalent disturbances in terrestrial ecosystems on a global scale [1], having a wide variety of ecological effects, such as vegetation distribution [2], vegetation structure [3], and thus carbon cycle [4]. Fire is regularly considered as a useful way to dispose of vegetation debris for the purpose of other vegetation types, which is called “land cover change” (defined as land clearing and conversion to other land cover types). The responses to fire of the current land cover and the trends of land cover changes in the tropics [3,5], especially for savanna–forest transitions, have been fully documented on a small scale [6,7] based on field investigations [8] or modelling [9]. However, the recovery dynamics of land cover changes related to fire remain highly uncertain, particularly at the continental scale [10,11]. Therefore, further investigations of how the vegetation dynamics change after fire are important to predict future land cover changes [12] as well as to estimate carbon emissions from tropical ecosystems [13].
Africa and South America, spanning both the Northern and Southern Hemispheres, are responsible for 75.5% of the global burned area [14] and 66.1% of fire-related carbon emissions [15]. Africa contains the majority of the world’s tropical grassy ecosystems (namely, grass and savannas), accounting for approximately 33.5% of terrestrial Africa [16]. Previous studies revealed that fire is one of the most important factors that drive the dynamics and transitions of tropical grassy biomes [2,17]. In contrast, South America has the world’s largest rainforest [18], which is among the most productive ecosystems on Earth [19]. Nevertheless, tropical forests have become increasingly vulnerable to high-severity fires [11]. Generally, C4 grasses are shade intolerant and fire tolerant, but forests in the tropics/subtropics contain shade-tolerant and fire-intolerant species [20,21]. Thus, the differential responses of grasses and trees to fire regimes can mediate the transition between biomes [17,20]. Most continent-scale studies have focused on tree basal area [22], tree cover [23,24], biome distribution [17], and carbon emissions from deforestation [25]. The vast majority of continent-scale studies have not included how the impacts of fire regimes drive vegetation transitions [21]. Continental differences in the ecosystem changes after fires allow us to provide robust information to support the management and application of fire in Africa and South America.
Remote sensing-based databases provide useful information from space to explore the large-scale responses of terrestrial ecosystems to fire disturbances [26]. At the regional or continental scale, the relative coarse-resolution satellite imageries (i.e. MODIS) are more suitable to investigate post-fire vegetation dynamics [26]. For example, a land cover map from Global Land Cover 2000 (GLC2000) and a 5-year burned area from MCD45 product were used to quantify the effect of land-cover conversion from natural vegetation to agriculture on Africa’s burnt area [27]. Landsat-based maps of gross forest cover loss and MODIS burned area product have been used to explore the relationship between burned area and forest cover loss in Amazon [5]. Land cover from Landsat satellite imagery and burned area from MODIS active fire dataset were mapped for three years (2000-2005-2010) in South America, which were used to explore the extent of fire-induced forest degradation [11]. More than a decade of satellite data (MODIS 16-d gridded NDVI product) were used to model how the ecosystems in South Africa recovered following fire and how recovery rates varied with climate [28]. Multiple MODIS products that integrated two national-level fire perimeter datasets were used to investigate the recovery of vegetation greenness in the early post-fire period in North America [26]. Therefore, the remote sensing information is valuable [29] to identify vegetation type, land cover change, fire frequency/severity, and other non-burned factors (i.e. human management) and quantify the post-fire vegetation recovery trajectories.
Our research on post-fire dynamics was conducted across Africa and South America from 2001–2013, and this study aimed at clarifying the dynamics across many plant functional groups based on multiple MODIS products. Here, we used satellite-derived datasets to study the continental differences in vegetation shifts after fires in Africa and South America. The goals of this paper are to (1) explore the continental differences in post-fire ecosystem recovery and (2) determine the differential post-fire recovery dynamics between forests and grasslands.

2. Materials and Methods

Our study area consists of Africa and South America (Figure 1). We used two satellite-derived datasets from 2001–2013 to characterize the vegetation dynamics related to fire: MODIS burned area and MODIS land cover.

2.1. MODIS Fire Products

The monthly burned area (BA) data (MCD64A1 collection 6) [30] at a 500 m spatial resolution was used in this study (ftp://ba1.geog.umd.edu). The C6 MCD64A1 is the latest product of the MODIS Burned Area suite of products. This product combines the daily MODIS surface reflectance imagery with 1 km MODIS active fire data based on a hybrid approach [30]. A burn-sensitive vegetation index is calculated from MODIS time series using the short-wave infrared channels, and then dynamic thresholds are applied to guide the statistical characterization of burn-related and non-burn-related change. Finally, spatial and temporal active fire information are used to create regional probability density functions to classify each pixel as burned or unburned [31]. The BA product specifies the individual day of burning for every burned area pixel and a temporal uncertainty range for its burn date. The monthly burn date maps from 2001 to 2013 were used for further data processing. The C6 MCD64A1 algorithm uses the most recently available C5.1 MCD12Q1 land cover product that was made for each year from 2001 to 2013 [30,32]. For each year, when a fire occurred in one pixel in any month, this pixel was marked as burned and added to the annual BA dataset. The monthly MCD64A1 products for Africa and South America were then aggregated to generate gridded annual BA maps.

2.2. MODIS Land Cover Products

To identify land cover changes, we used the MCD12Q1 land cover type product version 5.1 at a 500 m spatial resolution [33]. This annual product from 2001 to 2013 was downloaded from USGS (https://e4ftl01.cr.usgs.gov/MOTA/). We defined five aggregated vegetation classes within each continental region using the plant functional type (PFT) classification scheme in the collection 5.1 MCD12Q1 land cover type product [33]. All forest types (classes 1–4) were grouped in one class (forest). Shrubs (class 5) and grasses (class 6) remained two separate classes. Cereal crops (class 7) and broad-leaf crops (class 8) were also grouped as crops. The remaining vegetation types, including urban and built-up (class 9), snow and ice (class 10) and barren or sparse vegetation (class 11), were combined into an “other” aggregated vegetation class. Five classes (forest, shrub, grass, crop and other) were ultimately used.

2.3. The Fire-induced Ecosystem Changes

The fire-induced ecosystem dynamics were estimated as followed:
(1) The original 500 m resolution MODIS land cover maps are aggregated to 0.5° grid cell according to the number of each PFT in one grid cell: In each 0.5° grid cell (approximately 50 km × 50 km at the equator) consisting of roughly 100 × 100 land cover pixels, the number of each PFT (forest, shrub, grass, and crop) was counted. Then the number of each PFT in each 0.5° grid cell was divided by the total number of land cover pixels. The aggregation to a resolution of 0.5° from 500 m is to obtain sufficient measurement data to compute regionally representative PFT type fractions and analyze their changes. As a result, the annual land cover products from 2001–2013 were aggregated to a spatial resolution of 0.5° and then averaged for 13 years (Figure 1). The distributions of the most common vegetation types (forest, grass, shrub and crop) in Africa and South America from 2001–2013 were calculated by averaging the number of individual land cover types in the 0.5° grid cells (Figure 1), and these averages were used to characterize the patterns of vegetation distribution on both continents.
(2) The high-density vegetation regions were identified. The specific regions (defined as an individual vegetation type occupying more than 80% of the 0.5° × 0.5° grid cell) are shown in Figure 1. To reduce the bias in the low-density vegetation area (Figure S1), we selected the regions with high-density vegetation by using the percentage proportions of PFT cover in large grid cell. There are four forest regions, three shrub regions, two grass regions and two crop regions in Africa and South America. We analyzed the vegetation dynamics after fires in these regions.
(3) In each grid cell, all PFTs impacted by fire were exacted annually based on MODIS BA maps and land cover maps. In each specific region (red rectangles in Figure 1), the PFTs that covered more than 80% of each 0.5° grid cell were masked and overlaid with the annual BA from 2001–2013. Therefore, the high-density PFTs that were impacted by fire could be extracted annually. We tracked the vegetation changes that occurred as a result of fire in the masked PFT grid cells. For example, the annual fire-impacted forest region of the NHAF_Forest (Figure 1) was overlaid with the land cover map in the same year. We aggregated data in the gird cells in consecutive years (from 1 to 12 years) after fires. If fires occurred more than twice in one pixel, land cover changes between two fire year were extracted and the time in any fire year was reset to 0. For example, some pixels in a forest grid cell (0.5° × 0.5°) had burning in 2001 and 2008. The post-fire age was 0 in 2001 (the MODIS data began in 2001), continued to year 6, then was reset back to 0 (due to the fire in 2008) and increased again until the end of the record (2013). As a result, we obtained the vegetation transition after fires at a spatial resolution of 0.5°. In contrast, a map that masked grid cells with a proportion of unburned area (more than 80% of the total area in each 0.5° grid cell) from 2001–2013 was used to analyze the changes in land cover without fires from 2001 to 2013.
(4) The percentage proportions of vegetation transitions in the years after fires (from 1 to 12 years) were summarized. The vegetation type percentage proportions were calculated by dividing the number of pixels dominated by a specific vegetation type by the total number of vegetation types in the same year. For example, in a grid cell dominated by forests before fire, we calculated the percentage proportions of the different vegetation types (forest, shrub, grass, crop and other) after a fire. The conversions of forest to shrub, forest to grass, forest to crop and forest to other types could then be estimated in the years after a fire (from 1 to 12 years). Therefore, we tracked the land cover transitions for the four vegetation types.
(5) The recovery times of each PFT were calculated based on the percentage proportions of vegetation transitions. To calculate the recovery times for the fractions of vegetation changes after fires, we used the following equation,
y = 1 A e t τ
where y is the fraction of vegetation remaining after the fire, t is the amount of time since the fire (years), τ is the recovery time (years), A is the fractional vegetation loss in the first year after a fire.

3. Results

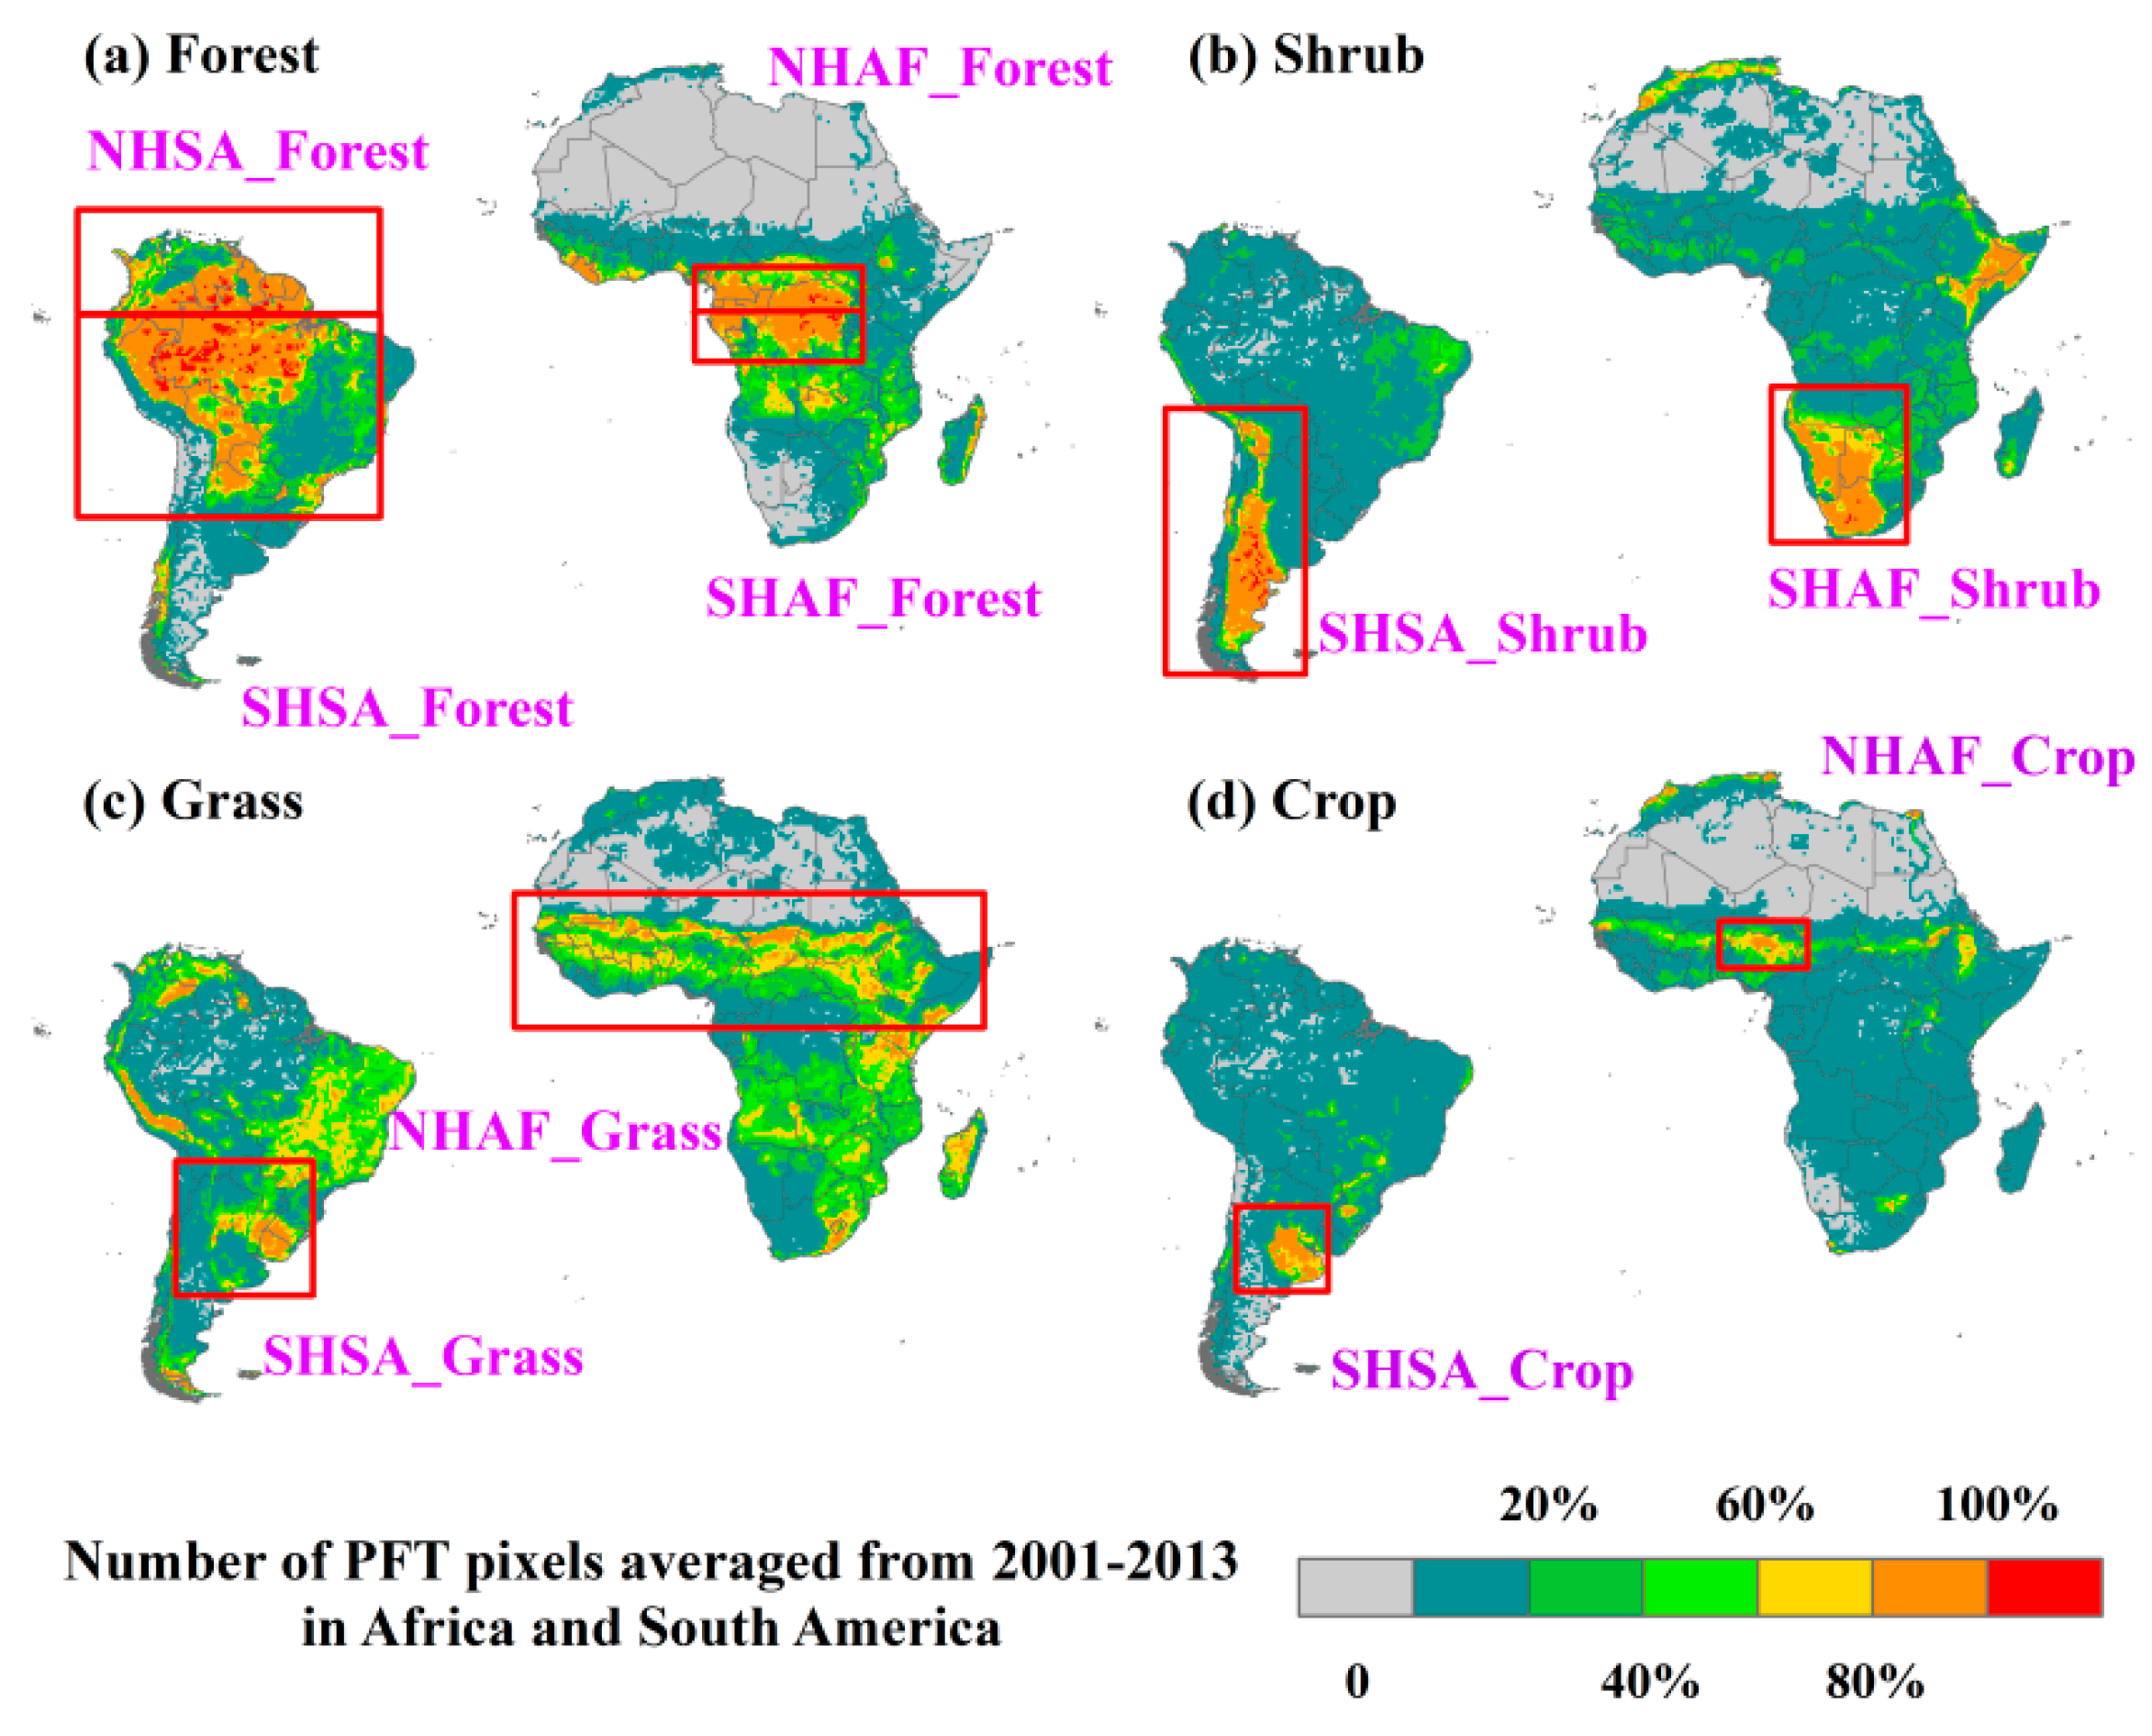
3.1. The Fire Regimes in Africa and South America

The vegetation fractions over the past 13 years differed between the two continents (Figure 2a,b). Approximately 24% of the total land in Africa was covered by grass, followed by shrub (17%), forest (16%) and crop (7%), while forest dominated in South America, accounting for 47% of the total land, followed by grass (25%), shrub (16%) and crop (7%). The partitioning of the annual BA by land cover type from 2001–2013 is shown in Figure 3. In general, the annual BAs from 2001 through 2013 in Africa and South America averaged 299.4 Mha and 39.7 Mha, respectively. The trend of the annual BA in Africa was not obvious and showed no large variations, while many fires occurred in South America in 2007 and 2010 (Figure 2c,d). In terms of area burned, grass (grass and savanna) fires were overwhelmingly dominant in both Africa and South America (1.4 × 10⁶ km2 and 1.9 × 10⁵ km2, respectively), followed by forest fires (7.2 × 10⁵ km2 in Africa and 1.2 × 10⁵ km2 in South America) and shrub fires (6.0 × 10⁵ km2 in Africa and 5.4 × 10⁴ km2 in South America). Crop burning comprised a relatively small proportion of the area burned on both continents.
The total BAs in Africa and South America over 13 years, which was merged from the annual BA from 2001 to 2013, were approximately 8.5 × 10⁶ km2 and 2.3 × 10⁶ km2, respectively. The frequencies of fires from 2001–2013 differed between the two continents (Table 1), which indicated that Africa had more fires than South America. Single fires occurred in 50.8% of the total fire area in South America, while only 23.9% of the total fire area in Africa had a single fire. High-frequency fire activities (>3 years) over the past 13 years were common in Africa (50.7%) but less common in South America (16.8%). This finding indicates that Africa experienced more repeated fires than South America from 2001–2013.

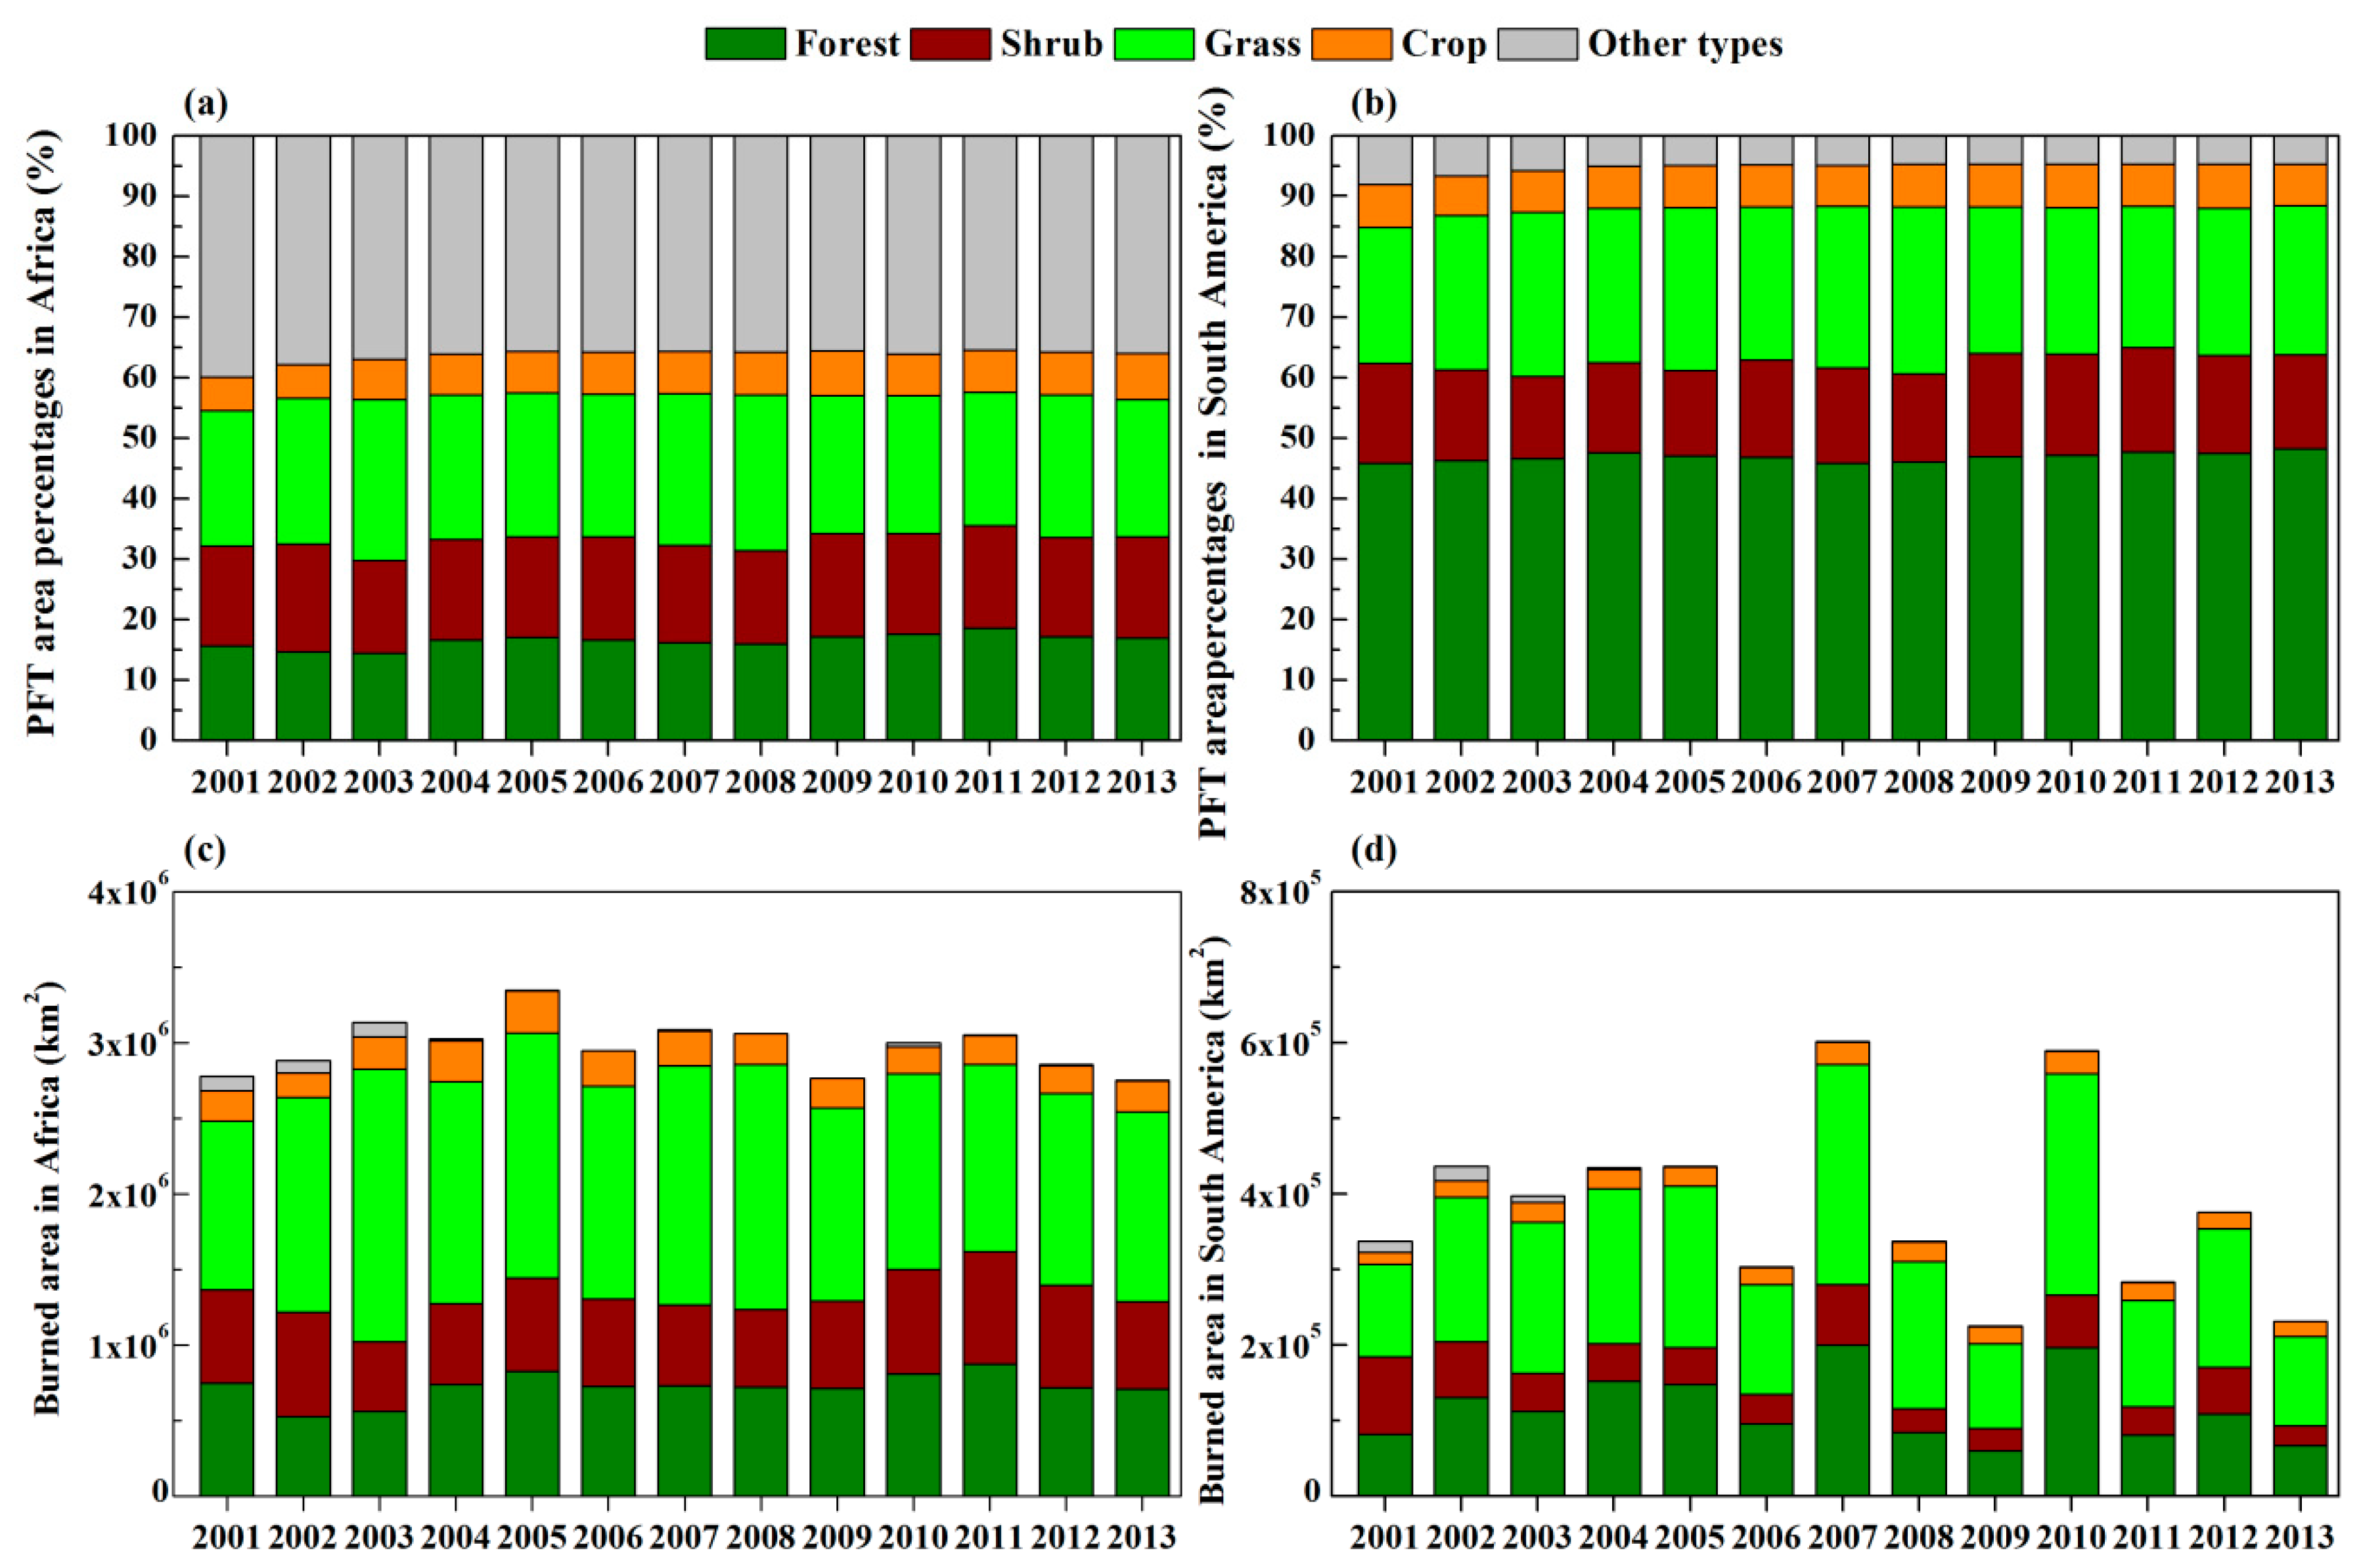
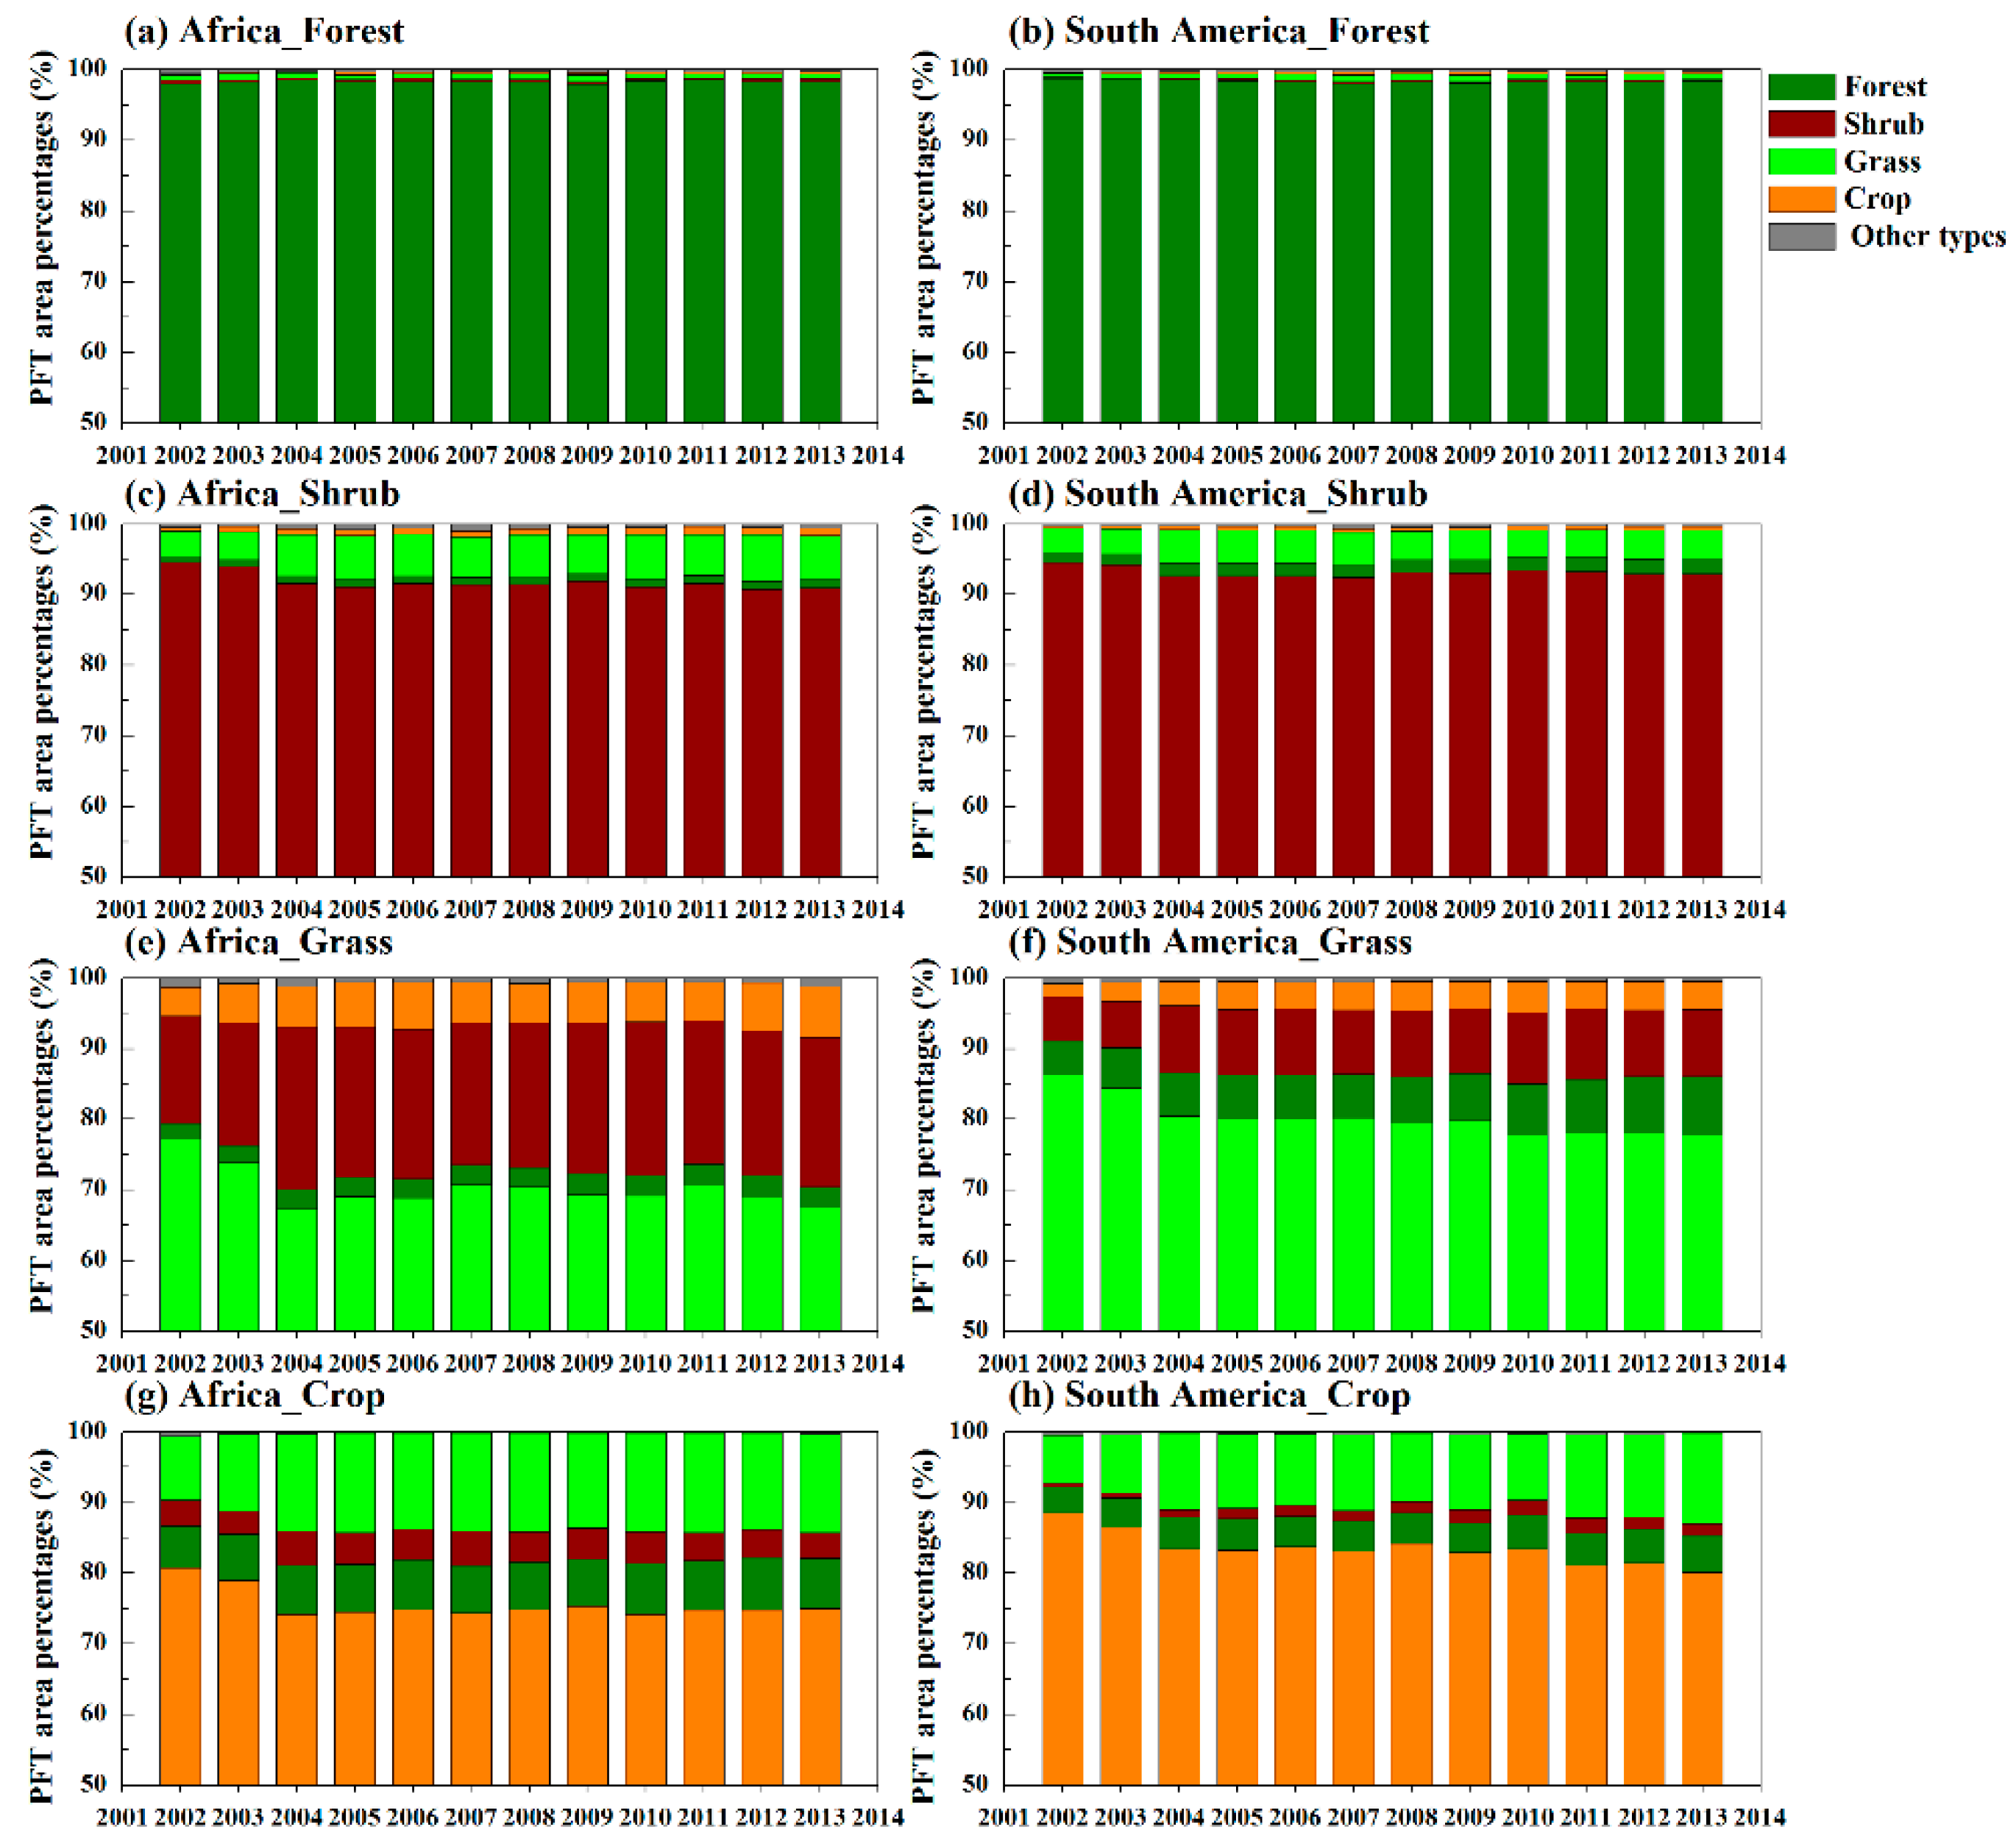
3.2. Ecosystem Changes Induced by Wildfires

First, we calculated the vegetation dynamics in the years after fires for the total BAs in Africa and South America (Figure S1). The whole continental comparison indicated that the vegetation transition patterns after fires for each vegetation type were similar between the two continents, except for shrubs (Figure S1). These results consisted of the vegetation changes in low-density ecosystems (Figure 1), which might result in bias. Therefore, in this study, the high-density ecosystems (defined as an individual vegetation type occupying more than 80% of a 0.5° × 0.5° grid cell) that were impacted by wildfires were considered (Figure 1). Furthermore, the study period was from 2001 to 2013, but the BAs in specific regions in the 11 and 12 years after the fires were small (Figure S2). As a result, the vegetation dynamics of specific regions in the 11 and 12 years after fires were removed in Figure 3. The different fire regimes between the two continents indicated that the slopes of the number of pixels in specific regions from 1 to 12 years after fires in South America were lower than those in Africa. The number of years in which fires were detected at the same location was higher in South America than Africa (Table 1).
The vegetation dynamics in the years after fires for specific regions are shown in Figure 3. The majority of the forest losses that were induced by fire were converted to grass, followed by shrub and crop (Figure 3a–d). A total of 17.2% and 14.5% of the forests in NHAF and NHSA were burned in the first year after a fire, respectively (Figure 3a,b). Of all the forest loss grid cells in NHAF, 5.6% was converted to shrub, 9.6% was converted to grass, and 1.6% was converted to crop. Of all of the forest loss grid cells in NHSA, 3.3% were converted to shrub, 7.2% were converted to grass, and 3.4% were converted to crop. In the 10 years after fires, the BAs in forests slowly recovered, which indicated that 92.8% and 92.6% of the forests existed in NHAF and NHSA in the last year (Figure 3a,b). The rates of forest recovery (the value in the last year related to that in the first year) were slightly different between NHAF (10%) and NHSA (7.1%). In detail, the forests in NHAF started to recover in the first year after a fire, and the recovery of forests in this region was rapid in the following 10 years. However, in the first 5 years, the rate of early successional forest recovery in NHSA was constant and then increased rapidly in the remaining period. The recovery times of early successional forests in NHAF and NHSA were 10.2 and 18.4 years, respectively (Figure 3). The forests in SHAF and SHSA decreased by approximately 15%, and these areas were mainly converted to grass, shrub and crop. The forest recovery trends were dramatically different between SHAF and SHSA (Figure 3c,d). The changes in vegetation types induced by fire were similar in the forests in NHAF and SHAF. In contrast, the fraction of remaining forests in SHSA decreased to 78% in the first 4 years and then remained stable. The recovery time for forests in SHAF was 12.8 years, but no recovery signal could be found in SHSA_Forests.
Of all shrub loss grid cells, a small part (7.8% when averaged over the whole 10 years) was burned and mainly converted to grass in SHAF (Figure 3e). Meanwhile, almost none of the shrubs in SHSA were burned (Figure 3f). Approximately 10% of the grasses in NHAF and SHSA were cleared in the first year after fires (Figure 3g,h). Burned grass was mainly converted into shrubs or crops. The fraction of grass in SHSA that was converted to other vegetation types increased to 14.4% in the last stage of 10 years. Of the total crop grid cells influenced by fires, the crops were mainly converted to grass. In both NHAF and SHSA, the fraction of crops that transitioned to grass was relatively stable in the following 10 years (Figure 3).

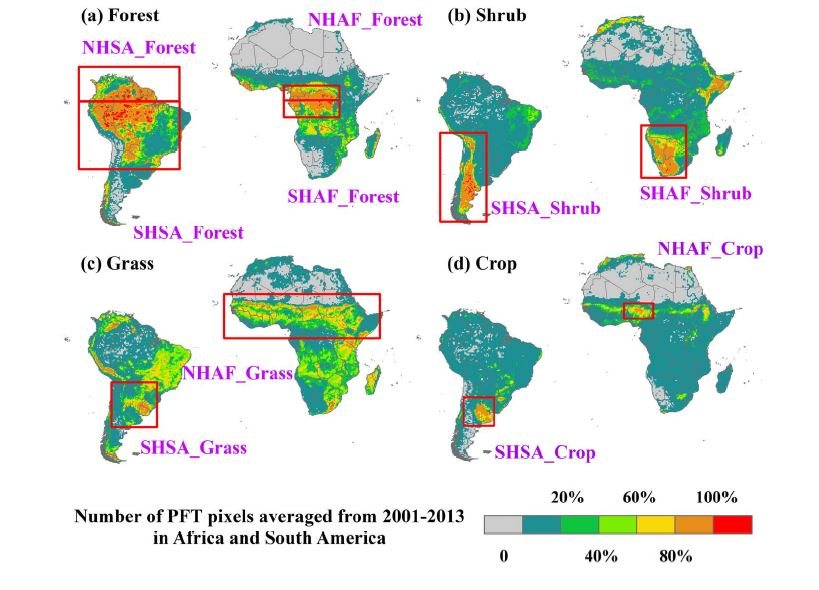
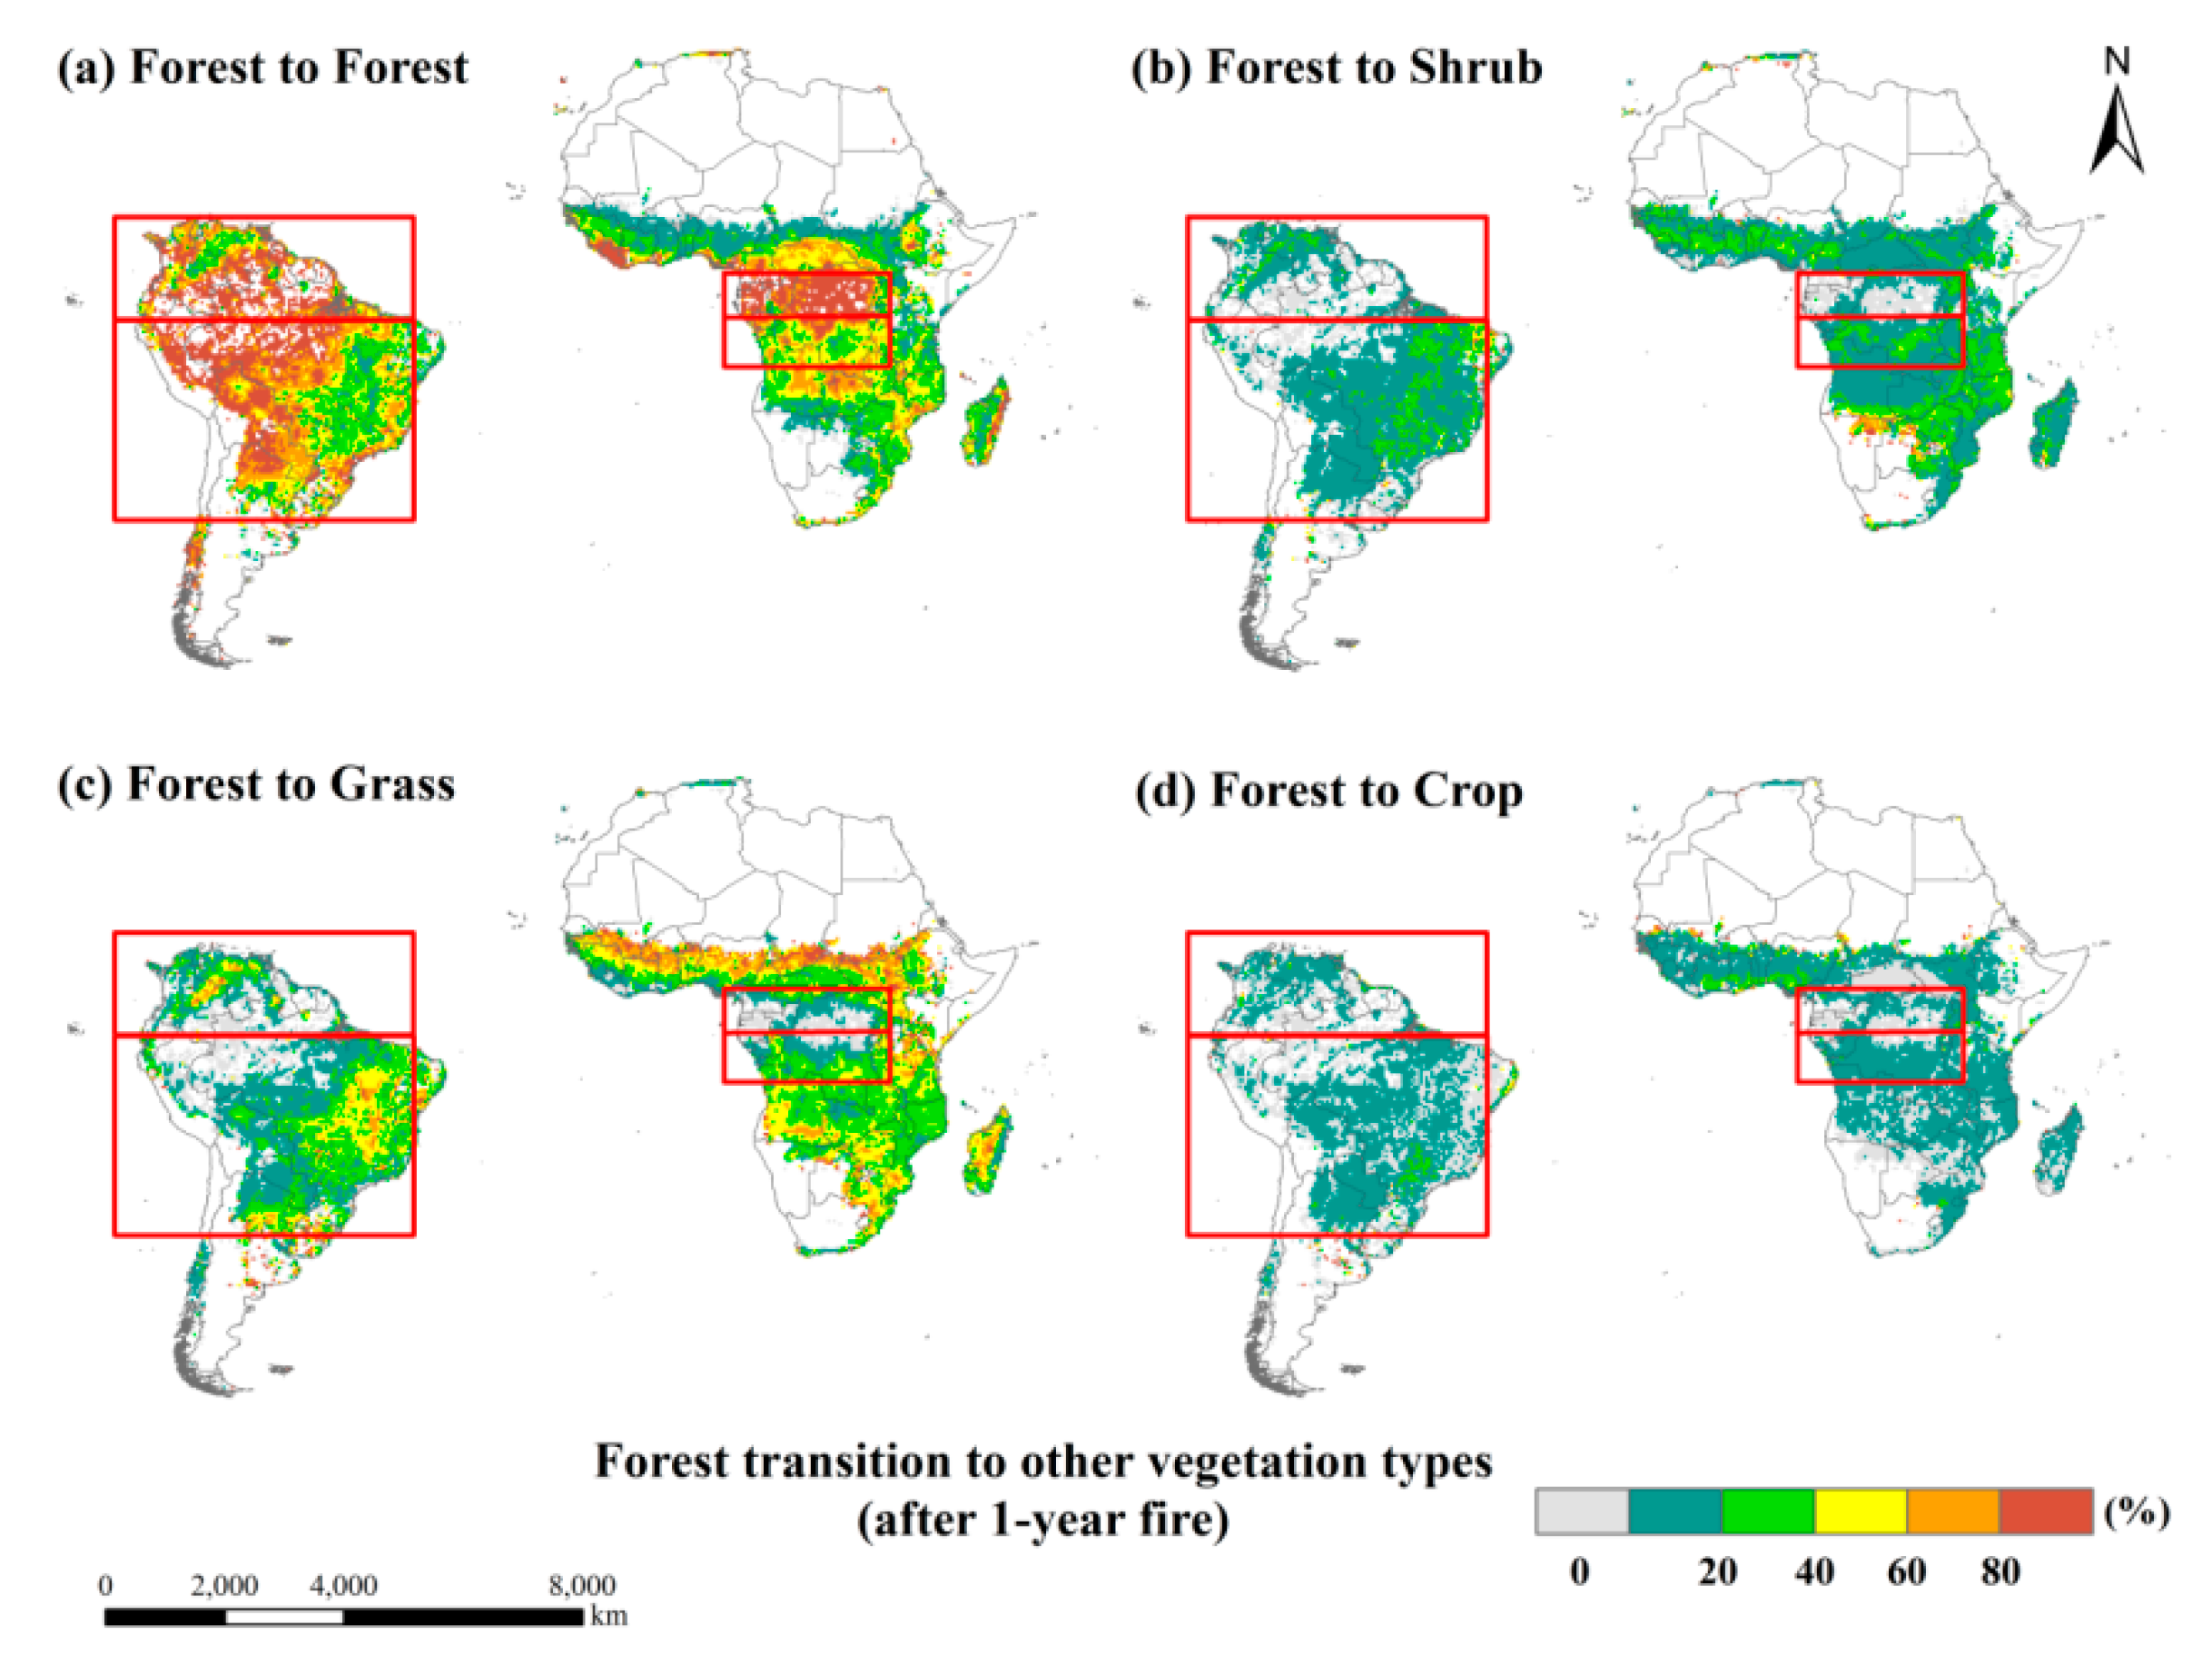
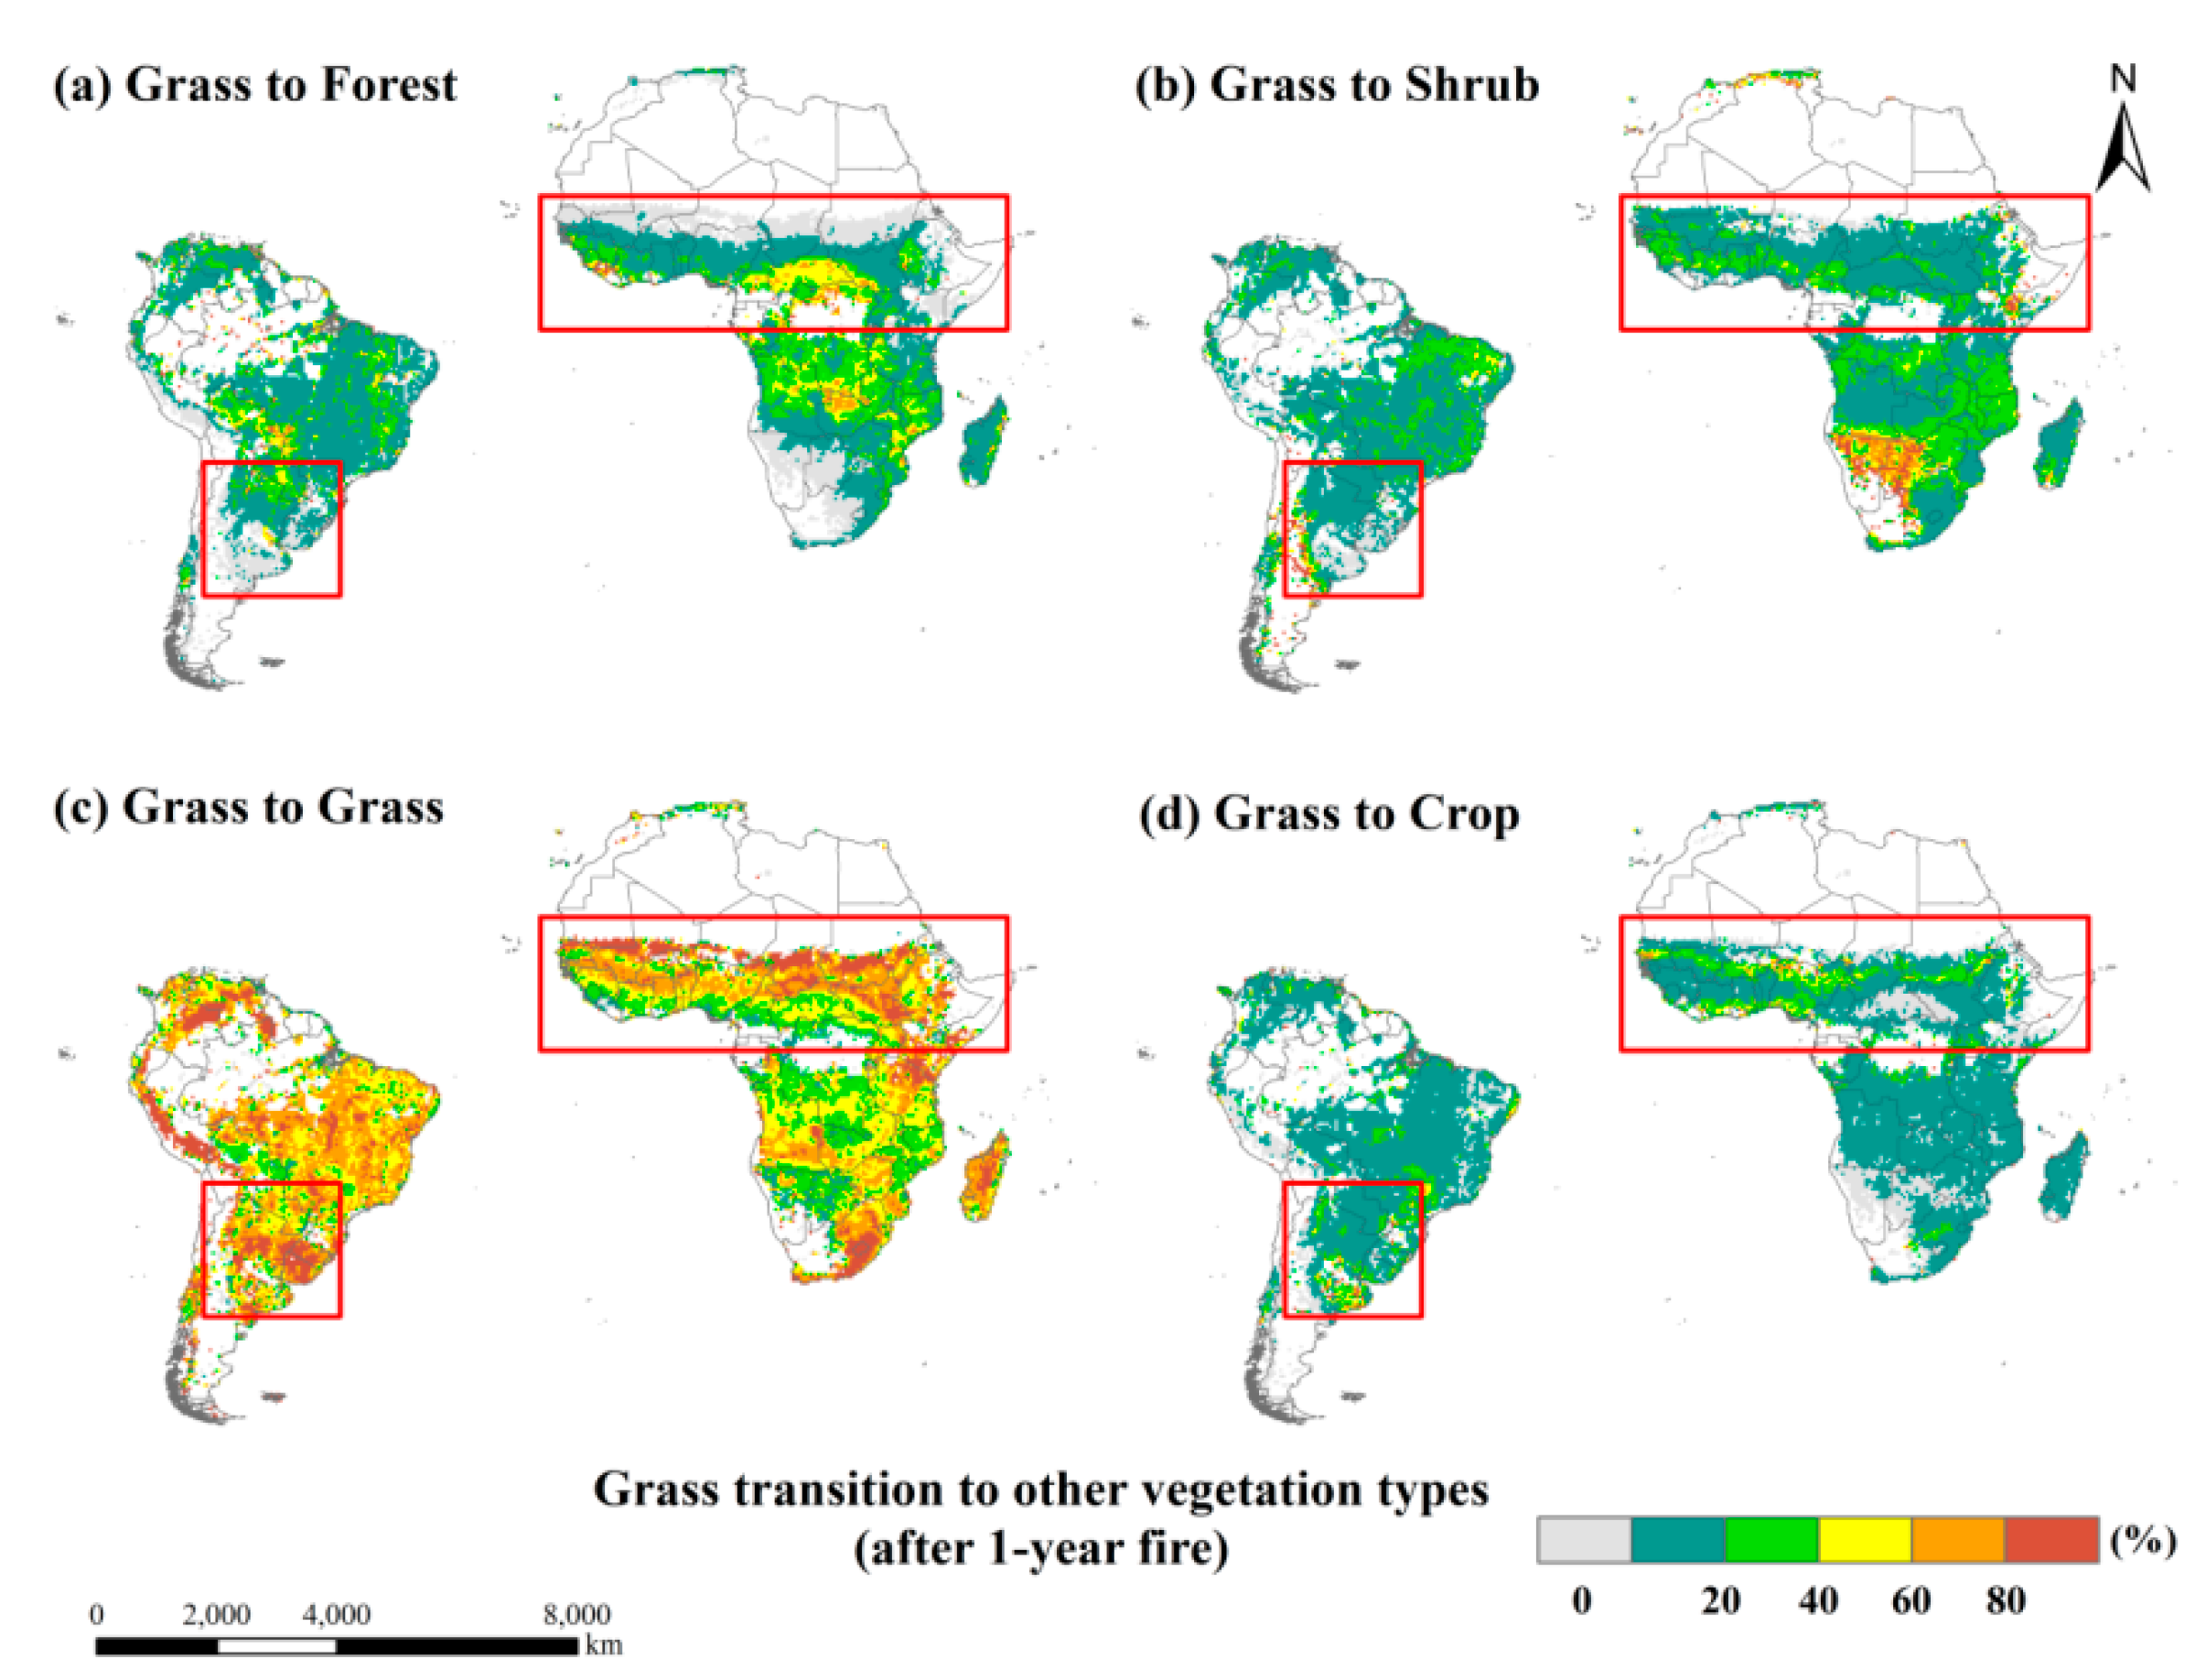
3.3. The Spatial Distribution of Land Cover in the First Year after Fires

The spatial distribution of land cover change in the first year after a fire is shown in Figure 4 and Figure 5 and is expressed as the direct effect of fire on the vegetation type transitions. In the first year after a fire, the percentage proportion of forests that remained in one grid cell (0.5° × 0.5°) was above 80% for most parts of Africa and South America (Figure 4). In the middle of South America, only 20–60% of the forests remained, and the other parts were mainly converted to grass. Moreover, less than 40% of the remaining forests in the first year after a fire were located around South America, which has few forest grid cells (Figure 4). The percentage proportion of grass that remained in one grid cell was above 40% for most areas of both continents (Figure 5). In the high-density grass regions in specific regions (Figure 1), some areas of grass loss were converted to shrubs and crops, but few of these areas were converted to forests (Figure 5). For most parts of the high-density vegetated regions for each shrub and crop type, 80% of each vegetation type remained in the first year after a fire (Figures S3 and S4).

3.4. Vegetation Changes in Non-Burned Regions of Both Continents

Besides the impacts of fire, other factors, i.e., the anthropogenic factors, also led to land cover changes. The land cover changes induced by non-burned factors indicated that the forest and grass losses in Africa and South America were less than those in the fire-induced regions (Figure 6a,b,e,f), while the extents of shrub and crop losses were similar in both continents (Figure 6c,d,g,h). The patterns of forest conversion induced by fire and non-burned factors differed between the continents (Figure 3, Figure 6 and Figure S1). The proportions of unburned forest and shrub proportion in Africa and South America exhibited no obvious changes over the 13 years.

4. Discussion

4.1. The Continental Differences in Land Cover Changes Induced by Fires

Our main result is that the recovery of forests in Africa was relatively fast in the 10 years after a fire, but the forests in South America recovered rather slowly, especially in the Southern Hemisphere while no recovery could have ever been found (Figure 3a–d). The results indicated that the recovery time of early successional forests in Africa was relatively fast (NHAF: 10.2 years; SHAF: 12.8 years) in the years after a fire, but early successional forests in South America recovered slowly (18.4 years). Second, the satellite information alone cannot provide enough evidence of the recoveries of other vegetation types (i.e., shrub, grass and crop) in both continents (Figure 3e–j).
The continental differences in recovery rates of forests are attributed to several factors influencing the speed of vegetation restoration, including soil fertility [34,35] and species composition [35,36]. South America has been reported to be a low fertility environment, while in Africa, the soil is highly fertile [3,17]. From Table S1, our findings confirm this tendency that the soil quality of Africa was better than that in South America. Higher soil fertility might accelerate the post-fire recovery of vegetation in Africa [28]. Different fire regimes can cause the succession process to follow different recovery trajectories. Paleoecological evidence has indicated that tropical forests in Africa recovered faster from past disturbance events than those in South America [35]. One possible reason might be that the adaptive strategy of African ecosystems is apt for the selection of stress-tolerant species [35,36]. In addition, the fast recovery rates of vegetation in Africa may result from more extensive fire histories [35], which showed a more resilient system.
The total vegetation loss in the first year after a fire in Africa was larger than that in South America has been clarified in this study (Figure 3), suggesting a more sensitive response in Africa. This difference can largely be explained by the climate [23,24] and thus the fire regimes. From Table S1, we found that the annual mean precipitation in NHAF_forest and SHAF_forest was 1800.0 and 1571.2 mm, while the annual mean precipitation in NHSA_forest (Figure 1) was 2409.0 mm. In general, the annual mean precipitation in Africa was lower than that in South America [3], which indicated a drier system in Africa. The statistical analysis of the MODIS BA implied that the total BA in Africa from 2001–2013 was 7.8 times larger than that in South America (Figure 2c,d), clearly indicating the difference of fire regimes in the two continents. Moreover, Africa suffered from repeated fires, while more than half of the BA in South America was impacted by single fires during the analysis period (Table 1). The higher frequency of fires resulted in a larger loss of vegetation in Africa than South America.
Furthermore, Africa’s ecosystems are water limited [37] and disturbance driven [2], with a high representation of grass-dominated ecosystems (i.e., savannas). These conditions are favorite to large amounts of biomass burning [15]. In contrast, South America has the largest rainforests in the world [5,38,39]. In most of Africa, the standard deviation of vegetation changes from 2001–2013 was larger than that in South America (Figure S5). The pattern of ecosystem distribution was dominated by wildfires in Africa, indicating that landscape fires were key on this continent [2]. Without the frequent occurrence of fires, Africa savannas might have been covered by forest [2]. However, the nonlinear recovery rate of forests (Figure 3) and inconsistent changes in the land cover maps and total fire-induced areas (Figure S5) in South America indicated that ecosystem changes over the past decade were more complex on this continent. A recent evaluation highlighted the complexity of explaining the spatial patterns of biomass variations [40].

4.2. Forest and Grass Loss after Fires on Both Continents

Forests and grasses, the dominant functional groups on both continents, exhibited stronger responses than the other ecosystem types (Figure 3, Figure 4 and Figure 5). However, the percentage proportions of forest losses induced by fires ranged from 14.5 to 17.2%, higher than that of grass losses (approximately 10% on both continents). In forests highly vulnerable to fire, the occurrence of fires is usually associated with forest clearing, but grasses (i.e., savanna vegetation) are more resilient to fire than forests [41]. Tropical forests and grasses are characterized mainly by fire-intolerant species and fire-tolerant species, respectively [20,41]. A study of the savanna/forest transition related to fire in Africa found that in savannahs, the occurrence of fires is not associated with land cover change; however, burning is strongly associated with land-cover changes in dense forests [41]. Therefore, our study suggested that tropical forests have become increasingly vulnerable to fire.
Fire is often used for land clearing and to transform forests into other ecosystem types, a type of land-use change similar to deforestation [39,42]. Tropical forests are large reservoirs of terrestrial carbon and sequester 40–60% of the carbon in the world [43,44]. In particular, South America contains the largest area of tropical rainforests in the world and has the richest biodiversity [45]. In our study, forest conversions in Northern Hemisphere Africa and South America responded similarly to fire. Deforestation for grasslands accounted for large amounts of the forest losses in the first year after fire: 55.9% (north) and 42.4% (south) in Africa and 49.3% (north) and 60.6% (south) in South America (Figure 3). Moreover, approximately 15.5% of the areas with forest losses induced by fire were converted to agriculture. A 25-year study indicated that Amazon rain forest regrowth follows pasturelands after the shifting of cultivation patterns [46]. A systematic, spatially explicit remote sensing time series indicated that deforestation in South America was mainly driven by changes in pastureland [47]. A close relationship between deforestation and burning events exists in tropical regions [5,39], but these events cannot be considered equivalent [12].

4.3. Uncertainty

Uncertainties in this study mainly come from the MODIS products. First, the MCD64A1 BA maps are derived from a hybrid algorithm that uses both the reflectance changes and the thermal anomalies associated with biomass burning [31,32]. The MCD64A1 product uses short-wave infrared (SWIR) bands, which was considered very sensitive to BA [31,48]. Among the newly available global burned area products, C6 MCD64A1 detected the most total burned area [49]. However, some studies still reported that MCD64A1 underestimated the burned areas, especially for croplands [14,50]. Intercomparison of global burned area products can be helpful to quantify the uncertainties of fire-induced vegetation recovery and warrant future investigations. Second, the pixels in vegetated regions are not all pure when derived for MODIS land cover map at 500 m resolution. When land cover in a pixel is not uniform in the field of view of the sensors, it is considered as a mixed pixel [51]. So, the mixed pixels are composed of several land-cover/land-use types. One study reported that trees in croplands, which covered as much area as the Amazon forests, were sometimes neglected when aggregated at the global scale [52]. As a result, when not all vegetation in the entire pixel was impacted by a fire, the remaining vegetation type (i.e. trees) may dominate in the next year after the fire.

5. Conclusions

The integration of annual BAs and land cover maps derived from MODIS observations provides an approach to detect the conversion and recovery of vegetation dynamics after fires on two continents (Africa and South America). The continental differences in fire regimes were clarified in terms of the fire frequency, which indicated that Africa and South America suffered more repeated fires and more single fires, respectively. The post-fire vegetation changes on both continents were tracked in specific regions with high-density vegetation cover. The comparison indicated that the forest losses in the first year after fires were slightly larger in Africa than in South America. Meanwhile, the recovery of forests in Africa was more rapid than that in South America. Furthermore, we analyzed the changes of high-density vegetation in non-burned regions and compared the results with the post-fire vegetation dynamics in burned regions in Africa and South America. The combination of the different MODIS observations could assist with determining the regional patterns of land cover changes induced by fires, which help us better understanding the contrasting post-fire dynamics between Africa and South America.
The integration of available satellite information provides opportunities to track vegetation recovery from space, which help the managers and governments to make informed decisions. The potential applications range from evaluating post-fire processes to assessing the land cover changes, both of which are important for landscape management and ecosystem restoration. First, the decision makers should implement intervention measures to suit local conditions due to the large difference in post-fire dynamics between both continents. Second, the restoration plan should consider vegetation [53], species [54], soil conditions, and other ecosystem variables in the ecosystem restoration. Third, since the forest recovery time induced by fire is more than 10 years, the implementation of specific restoration programs should be over a period of a decade.

Supplementary Materials

The following are available online at https://www.mdpi.com/2072-4292/11/9/1074/s1, Text A1: Date sources for climate and soil quality; Figure S1: Land cover transitions (%) following fire for the total burned areas in Africa (AF) and South America (SA) in the 10 years after a fire: forest (a, e), shrub (b, f), grass (c, g) and crop (d, h).; Figure S2: The total burned areas of specific regions in the 12 years after a fire. Forests in Africa (a, c) and South America (b, d); Shrubs in Africa (e) and South America (f); Grasses in Africa (g) and South America (h); Crops in Africa (i) and South America (j). See Figure 1 for detailed information; Figure S3: The spatial distribution of vegetation changes in shrub regions in the first year after a fire. The red rectangles represent the high-density shrubs (more than 80% of the total area in the 0.5° grid cell) in Africa and South America; Figure S4: The spatial distribution of vegetation changes in crop regions in the first year after a fire. The red rectangles represent the high-density crops (more than 80% of the total area in the 0.5° grid cell) in Africa and South America; Figure S5: The standard deviations of the vegetation changes (a-d) and the effects from fire (e-h) during 2001-2013; Table S1: The Climatic and soil condition in NHAF_Forest, SHAF_Forest and NHSA_Forest.

Author Contributions

Conceptualization, L.Z. and Y.W.; methodology, L.Z., Y.W. and Y.C.; formal analysis, L.Z., Y.W., Y.C. and Q.W.; investigation, L.Z., S.W. and Y.C.; data curation, L.Z., Y.W. and Y.C. writing—original draft preparation, L.Z., Y.W. and Y.C.; writing—review and editing, L.Z., Y.C., S.W. and Q.W.; supervision, Y.W. and S.W.; funding acquisition, L.Z., S.W. and Y.C.

Funding

This research was funded by the National Key Research and Development Program of China from MOST (Grant No. 2016YFB0501501 and 2017YFB0504000), the National Natural Science Foundation of China (Grant No. 41871084, 31400393 and 41503070) and the Zhejiang Provincial Natural Science Foundation of China (Grant No. LY19C030004).

Acknowledgments

We acknowledge the use of the MODIS data from the University of Maryland (ftp://ba1.geog.umd.edu) and USGS (https://e4ftl01.cr.usgs.gov/MOTA/).

Conflicts of Interest

The authors declare no conflict of interest.

References

  1. Bowman, D.M.; Balch, J.K.; Artaxo, P.; Bond, W.J.; Carlson, J.M.; Cochrane, M.A.; D’Antonio, C.M.; DeFries, R.S.; Doyle, J.C.; Harrison, S.P. Fire in the Earth system. Science 2009, 324, 481–484. [Google Scholar] [CrossRef]
  2. Bond, W.J.; Woodward, F.I.; Midgley, G.F. The global distribution of ecosystems in a world without fire. New Phytol. 2005, 165, 525–538. [Google Scholar] [CrossRef]
  3. Veenendaal, E.M.; Torello-Raventos, M.; Miranda, H.S.; Sato, N.M.; Oliveras, I.; van Langevelde, F.; Asner, G.P.; Lloyd, J. On the relationship between fire regime and vegetation structure in the tropics. New Phytol. 2018, 218, 153–166. [Google Scholar] [CrossRef] [PubMed]
  4. Landry, J.; Matthews, H.D.; Ramankutty, N. A global assessment of the carbon cycle and temperature responses to major changes in future fire regime. Clim. Chang. 2015, 133, 179–192. [Google Scholar] [CrossRef]
  5. Fanin, T.; van der Werf, G. Relationships between burned area, forest cover loss, and land cover change in the Brazilian Amazon based on satellite data. Biogeosciences 2015, 12, 6033–6043. [Google Scholar] [CrossRef]
  6. de Dantas, V.L.; Batalha, M.A.; Pausas, J.G. Fire drives functional thresholds on the savanna–forest transition. Ecology 2013, 94, 2454–2463. [Google Scholar] [CrossRef] [Green Version]
  7. February, E.C.; Higgins, S.I.; Bond, W.J.; Swemmer, L. Influence of competition and rainfall manipulation on the growth responses of savanna trees and grasses. Ecology 2013, 94, 1155–1164. [Google Scholar] [CrossRef] [PubMed]
  8. de Dantas, V.L.; Hirota, M.; Oliveira, R.S.; Pausas, J.G. Disturbance maintains alternative biome states. Ecol. Lett. 2016, 19, 12–19. [Google Scholar] [CrossRef] [PubMed]
  9. Syphard, A.D.; Franklin, J.; Keeley, J.E. Simulating the effects of frequent fire on southern California coastal shrublands. Ecol. Appl. 2006, 16, 1744–1756. [Google Scholar] [CrossRef]
  10. Keeley, J.E. Fire intensity, fire severity and burn severity: A brief review and suggested usage. Int. J. Wildland Fire 2009, 18, 116–126. [Google Scholar] [CrossRef]
  11. Miettinen, J.; Shimabukuro, Y.E.; Beuchle, R.; Grecchi, R.C.; Gomez, M.V.; Simonetti, D.; Achard, F. On the extent of fire-induced forest degradation in Mato Grosso, Brazilian Amazon, in 2000, 2005 and 2010. Int. J. Wildland Fire 2016, 25, 129–136. [Google Scholar] [CrossRef]
  12. Lima, A.; Silva, T.S.F.; de Feitas, R.M.; Adami, M.; Formaggio, A.R.; Shimabukuro, Y.E. Land use and land cover changes determine the spatial relationship between fire and deforestation in the Brazilian Amazon. Appl. Geogr. 2012, 34, 239–246. [Google Scholar] [CrossRef]
  13. Randerson, J.; Chen, Y.; Werf, G.; Rogers, B.; Morton, D. Global burned area and biomass burning emissions from small fires. J. Geophys. Res. Biogeosci. 2012, 117. [Google Scholar] [CrossRef] [Green Version]
  14. Giglio, L.; Randerson, J.T.; van der Werf, G.R. Analysis of daily, monthly, and annual burned area using the fourth-generation global fire emissions database (GFED4). J. Geophys. Res. Biogeosci. 2013, 118, 317–328. [Google Scholar] [CrossRef] [Green Version]
  15. van der Werf, G.R.; Randerson, J.T.; Giglio, L.; Collatz, G.; Mu, M.; Kasibhatla, P.S.; Morton, D.C.; DeFries, R.; Jin, Y.V.; van Leeuwen, T.T. Global fire emissions and the contribution of deforestation, savanna, forest, agricultural, and peat fires (1997–2009). Atmos. Chem. Phys. 2010, 10, 11707–11735. [Google Scholar] [CrossRef] [Green Version]
  16. Parr, C.L.; Lehmann, C.E.; Bond, W.J.; Hoffmann, W.A.; Andersen, A.N. Tropical grassy biomes: Misunderstood, neglected, and under threat. Trends Ecol. Evol. 2014, 29, 205–213. [Google Scholar] [CrossRef] [PubMed]
  17. Lehmann, C.E.; Archibald, S.A.; Hoffmann, W.A.; Bond, W.J. Deciphering the distribution of the savanna biome. New Phytol. 2011, 191, 197–209. [Google Scholar] [CrossRef] [Green Version]
  18. Doughty, C.E.; Metcalfe, D.; Girardin, C.; Amézquita, F.F.; Cabrera, D.G.; Huasco, W.H.; Silva-Espejo, J.; Araujo-Murakami, A.; da Costa, M.; Rocha, W. Drought impact on forest carbon dynamics and fluxes in Amazonia. Nature 2015, 519, 78–82. [Google Scholar] [CrossRef] [PubMed] [Green Version]
  19. Gillman, L.N.; Wright, S.D.; Cusens, J.; McBride, P.D.; Malhi, Y.; Whittaker, R.J. Latitude, productivity and species richness. Glob. Ecol. Biogeogr. 2015, 24, 107–117. [Google Scholar] [CrossRef]
  20. Ratnam, J.; Bond, W.; Fensham, R.; Hoffmann, W.; Archibald, S.; Lehmann, C.; Anderson, M.; Higgins, S.; Mahesh, S. When is a’forest’a savanna, and why does it matter? Glob. Ecol. Biogeogr. 2011, 20, 653–660. [Google Scholar] [CrossRef]
  21. D’Onofrio, D.; von Hardenberg, J.; Baudena, M. Not only trees: Grasses determine African tropical biome distributions via water limitation and fire. Glob. Ecol. Biogeogr. 2018, 27, 714–725. [Google Scholar] [CrossRef]
  22. Lehmann, C.E.; Anderson, T.M.; Sankaran, M.; Higgins, S.I.; Archibald, S.; Hoffmann, W.A.; Hanan, N.P.; Williams, R.J.; Fensham, R.J.; Felfili, J. Savanna vegetation-fire-climate relationships differ among continents. Science 2014, 343, 548–552. [Google Scholar] [CrossRef]
  23. Staver, A.C.; Archibald, S.; Levin, S. Tree cover in sub-Saharan Africa: Rainfall and fire constrain forest and savanna as alternative stable states. Ecology 2011, 92, 1063–1072. [Google Scholar] [CrossRef]
  24. Staver, A.C.; Archibald, S.; Levin, S.A. The global extent and determinants of savanna and forest as alternative biome states. Science 2011, 334, 230–232. [Google Scholar] [CrossRef]
  25. Baccini, A.; Goetz, S.; Walker, W.; Laporte, N.; Sun, M.; Sulla-Menashe, D.; Hackler, J.; Beck, P.; Dubayah, R.; Friedl, M. Estimated carbon dioxide emissions from tropical deforestation improved by carbon-density maps. Nat. Clim. Chang. 2012, 2, 182–185. [Google Scholar] [CrossRef]
  26. Yang, J.; Pan, S.; Dangal, S.; Zhang, B.; Wang, S.; Tian, H. Continental-scale quantification of post-fire vegetation greenness recovery in temperate and boreal North America. Remote Sens. Environ. 2017, 199, 277–290. [Google Scholar] [CrossRef]
  27. Grégoire, J.M.; Eva, H.D.; Belward, A.S.; Palumbo, I.; Simonetti, D.; Brink, A. Effect of land-cover change on Africa’s burnt area. Int. J. Wildland Fire 2013, 22, 107–120. [Google Scholar] [CrossRef]
  28. Wilson, A.M.; Latimer, A.M.; Silander, J.A. Climatic controls on ecosystem resilience: Postfire regeneration in the Cape Floristic Region of South Africa. Proc. Natl. Acad. Sci. USA 2015, 112, 9058–9063. [Google Scholar] [CrossRef] [Green Version]
  29. Zhou, L.; Wang, S.Q.; Chi, Y.G.; Wang, J.B. Drought Impacts on Vegetation Indices and Productivity of Terrestrial Ecosystems in Southwestern China During 2001–2012. Chin. Geogr. Sci. 2018, 28, 60–72. [Google Scholar] [CrossRef]
  30. Giglio, L.; Schroeder, W.; Justice, C.O. The collection 6 MODIS active fire detection algorithm and fire products. Remote Sens. Environ. 2016, 178, 31–41. [Google Scholar] [CrossRef] [Green Version]
  31. Giglio, L.; Loboda, T.; Roy, D.P.; Quayle, B.; Justice, C.O. An active-fire based burned area mapping algorithm for the MODIS sensor. Remote Sens. Environ. 2009, 113, 408–420. [Google Scholar] [CrossRef]
  32. Giglio, L.; Boschetti, L.; Roy, D.P.; Humber, M.L.; Justice, C.O. The Collection 6 MODIS burned area mapping algorithm and product. Remote Sens. Environ. 2018, 217, 72–85. [Google Scholar] [CrossRef] [PubMed]
  33. Friedl, M.A.; Sulla-Menashe, D.; Tan, B.; Schneider, A.; Ramankutty, N.; Sibley, A.; Huang, X. MODIS Collection 5 global land cover: Algorithm refinements and characterization of new datasets. Remote Sens. Environ. 2010, 114, 168–182. [Google Scholar] [CrossRef]
  34. Saldarriaga, J.G.; West, D.C.; Tharp, M.; Uhl, C. Long-term chronosequence of forest succession in the upper Rio Negro of Colombia and Venezuela. J. Ecol. 1988, 76, 938–958. [Google Scholar] [CrossRef]
  35. Cole, L.E.; Bhagwat, S.A.; Willis, K.J. Recovery and resilience of tropical forests after disturbance. Nat. Commun. 2014, 5, 3906. [Google Scholar] [CrossRef] [PubMed]
  36. Chazdon, R.L.; Letcher, S.G.; van Breugel, M.; Martínez-Ramos, M.; Bongers, F.; Finegan, B. Rates of change in tree communities of secondary Neotropical forests following major disturbances. Philos Trans. R. Soc. B Biol. Sci. 2006, 362, 273–289. [Google Scholar] [CrossRef] [PubMed]
  37. Nemani, R.R.; Keeling, C.D.; Hashimoto, H.; Jolly, W.M.; Piper, S.C.; Tucker, C.J.; Myneni, R.B.; Running, S.W. Climate-driven increases in global terrestrial net primary production from 1982 to 1999. Science 2003, 300, 1560–1563. [Google Scholar] [CrossRef] [PubMed]
  38. Morton, D.C.; DeFries, R.S.; Shimabukuro, Y.E.; Anderson, L.O.; Arai, E.; del Bon Espirito-Santo, F.; Freitas, R.; Morisette, J. Cropland expansion changes deforestation dynamics in the southern Brazilian Amazon. Proc. Natl. Acad. Sci. USA 2006, 103, 14637–14641. [Google Scholar] [CrossRef] [Green Version]
  39. Morton, D.; Defries, R.; Randerson, J.; Giglio, L.; Schroeder, W.; van der Werf, G. Agricultural intensification increases deforestation fire activity in Amazonia. Glob. Chang. Biol. 2008, 14, 2262–2275. [Google Scholar] [CrossRef] [Green Version]
  40. Quesada, C.; Phillips, O.; Schwarz, M.; Czimczik, C.; Baker, T.; Patiño, S.; Fyllas, N.; Hodnett, M.; Herrera, R.; Almeida, S. Basin-wide variations in Amazon forest structure and function are mediated by both soils and climate. Biogeosciences 2012, 9, 2203–2246. [Google Scholar] [CrossRef] [Green Version]
  41. Bucini, G.; Lambin, E.F. Fire impacts on vegetation in Central Africa: A remote-sensing-based statistical analysis. Appl. Geogr. 2002, 22, 27–48. [Google Scholar] [CrossRef]
  42. Marle, M.J.; Field, R.D.; Werf, G.R.; Estrada de Wagt, I.A.; Houghton, R.A.; Rizzo, L.V.; Artaxo, P.; Tsigaridis, K. Fire and deforestation dynamics in Amazonia (1973–2014). Glob. Biogeochem. Cycles 2017, 31, 24–38. [Google Scholar] [CrossRef] [PubMed] [Green Version]
  43. Pan, Y.; Birdsey, R.A.; Fang, J.; Houghton, R.; Kauppi, P.E.; Kurz, W.A.; Phillips, O.L.; Shvidenko, A.; Lewis, S.L.; Canadell, J.G. A large and persistent carbon sink in the world’s forests. Science 2011, 333, 988–993. [Google Scholar] [CrossRef] [PubMed]
  44. Zarin, D.J.; Harris, N.L.; Baccini, A.; Aksenov, D.; Hansen, M.C.; Azevedo-Ramos, C.; Azevedo, T.; Margono, B.A.; Alencar, A.C.; Gabris, C. Can carbon emissions from tropical deforestation drop by 50% in 5 years? Glob. Chang. Biol. 2016, 22, 1336–1347. [Google Scholar] [CrossRef] [PubMed]
  45. Malhi, Y.; Roberts, J.T.; Betts, R.A.; Killeen, T.J.; Li, W.; Nobre, C.A. Climate change, deforestation, and the fate of the Amazon. Science 2008, 319, 169–172. [Google Scholar] [CrossRef]
  46. Mesquita, R.D.C.G.; Massoca, P.E.D.S.; Jakovac, C.C.; Bentos, T.V.; Williamson, G.B. Amazon rain forest succession: Stochasticity or land-use legacy? Bioscience 2015, 65, 849–861. [Google Scholar] [CrossRef]
  47. de Sy, V.; Herold, M.; Achard, F.; Beuchle, R.; Clevers, J.; Lindquist, E.; Verchot, L. Land use patterns and related carbon losses following deforestation in South America. Environ. Res. Lett. 2015, 10, 124004. [Google Scholar] [Green Version]
  48. Bastarrika, A.; Chuvieco, E.; Martín, M.P. Mapping burned areas from Landsat TM/ETM+ data with a two-phase algorithm: Balancing omission and commission errors. Remote Sens. Environ. 2011, 115, 1003–1012. [Google Scholar] [CrossRef]
  49. Humber, M.L.; Boschetti, L.; Giglio, L.; Justice, C.O. Spatial and temporal intercomparison of four global burned area products. Int. J. Digit. Earth 2019, 12, 460–484. [Google Scholar] [CrossRef]
  50. Zhu, C.; Kobayashi, H.; Kanaya, Y.; Saito, M. Size-dependent validation of MODIS MCD64A1 burned area over six vegetation types in boreal Eurasia: Large underestimation in croplands. Sci. Rep. 2017, 7, 4181. [Google Scholar] [CrossRef]
  51. Friedl, M.A.; McIver, D.K.; Hodges, J.C.; Zhang, X.; Muchoney, D.; Strahler, A.H.; Woodcock, C.E.; Gopal, S.; Schneider, A.; Cooper, A. Global land cover mapping from modis: Algorithms and early results. Remote Sens. Environ. 2002, 83, 287–302. [Google Scholar] [CrossRef]
  52. Zomer, R.J.; Trabucco, A.; Coe, R.; Place, F. Trees on Farm: Analysis of Global Extent and Geographical Patterns of Agroforestry; ICRAF Working Paper; World Agroforestry Centre: Nairobi, Kenya, 2009. [Google Scholar]
  53. Chi, Y.; Zhou, L.; Yang, Q.; Li, S.; Zheng, S. Increased snowfall weakens complementarity of summer water use by different plant functional groups. Ecol. Evol. 2019, 9, 4264–4274. [Google Scholar] [CrossRef] [PubMed]
  54. Chi, Y.; Zhou, L.; Li, S.; Zheng, S.; Yang, Q.; Yang, X.; Xu, M. Rainfall-dependent influence of snowfall on species loss. Environ. Res. Lett. 2018, 13, 094002. [Google Scholar] [CrossRef]
Figure 1. The mean annual land cover map and the high-density vegetated regions (defined as an individual vegetation type occupying more than 80% of the 0.5° × 0.5° grid cell) for (a) forest, (b) shrub, (c) grass, and (d) crop in Africa and South America. Specific regions (red rectangles) were defined as follows: Forest in the Northern Hemisphere in Africa (NHAF_Forest), Forest in the Southern Hemisphere in Africa (SHAF_Forest), Forest in the Northern Hemisphere in South America (NHSA_Forest), and Forest in the Southern Hemisphere in South America (SHSA_Forest). Shrub in the Southern Hemisphere in Africa (SHAF_Shrub) and Shrub in the Southern Hemisphere in South America (SHSA_Shrub). Grass in the Northern Hemisphere in Africa (NHAF_Grass) and Grass in the Southern Hemisphere in South America (SHSA_Grass). Crop in the Northern Hemisphere in Africa (NHAF_Crop) and Crop in the Southern Hemisphere in South America (SHSA_Crop). The division between SHAF_Forest and NHAF_Forest is at the equator; the division between SHSA_Forest and NHSA_Forest is at the equator.
Remotesensing 11 01074 g001
Figure 2. The area percentages of each vegetation type in Africa (a) and South America (b); the burned area stratified by land cover in Africa (c) and South America (d) from 2001-2013.
Remotesensing 11 01074 g002
Figure 3. Land cover transitions (%) following fires in specific regions: Forest in Africa (a,c) and South America (b,d); shrub in Africa (e) and South America (f); grass in Africa (g) and South America (h); crop in Africa (i) and South America (j). See Figure 1 for detailed information. The fitting equations for the forest fractions: NHAF_Forest: y = 1-0.183*exp(−t/10.2), R2 = 0.981; SHAF_Forest: y = 1-0.169*exp(−t/12.8), R2 = 0.979; NHSA_Forest: y = 1-0.174*exp(−t/18.4), R2 = 0.667.
Remotesensing 11 01074 g003
Figure 4. The spatial distributions of the vegetation changes in forest regions in the first year after a fire. (a) Forest to Forest; (b) Forest to Shrub; (c) Forest to Grass; (d) Forest to Crop. The red rectangles represent the high-density forests (more than 80% of total area in 0.5° grid cell) in Africa and South America.
Remotesensing 11 01074 g004
Figure 5. The spatial distribution of vegetation changes in grass regions in the first year after a fire. (a) Grass to Forest; (b) Grass to Shrub; (c) Grass to Grass; (d) Grass to Crop. The red rectangles represent the high-density grass (more than 80% of total area in 0.5° grid cell) in Africa and South America.
Remotesensing 11 01074 g005
Figure 6. Land cover transitions (%) (forest: (a,b); shrub: (c,d); grass: (e,f); crop: (g,h)) for high-density regions (individual vegetation type covered more than 80%) from 2001-2013 in Africa or South America in which pixels were not burned over the entire 13 years.
Remotesensing 11 01074 g006
Table 1. The number of annual fire occurrences from 2001–2013 on a pixel by pixel basis for Africa and South America.
Number of Fire Occurrences (years) Africa (%)South America (%)
123.9 50.8
214.5 20.9
310.9 11.5
48.7 6.9
57.3 4.2
66.4 2.5
75.9 1.4
85.5 0.8
95.0 0.5
104.3 0.3
113.3 0.1
122.4 0.0
131.7 0.0
Total100.0100.0

