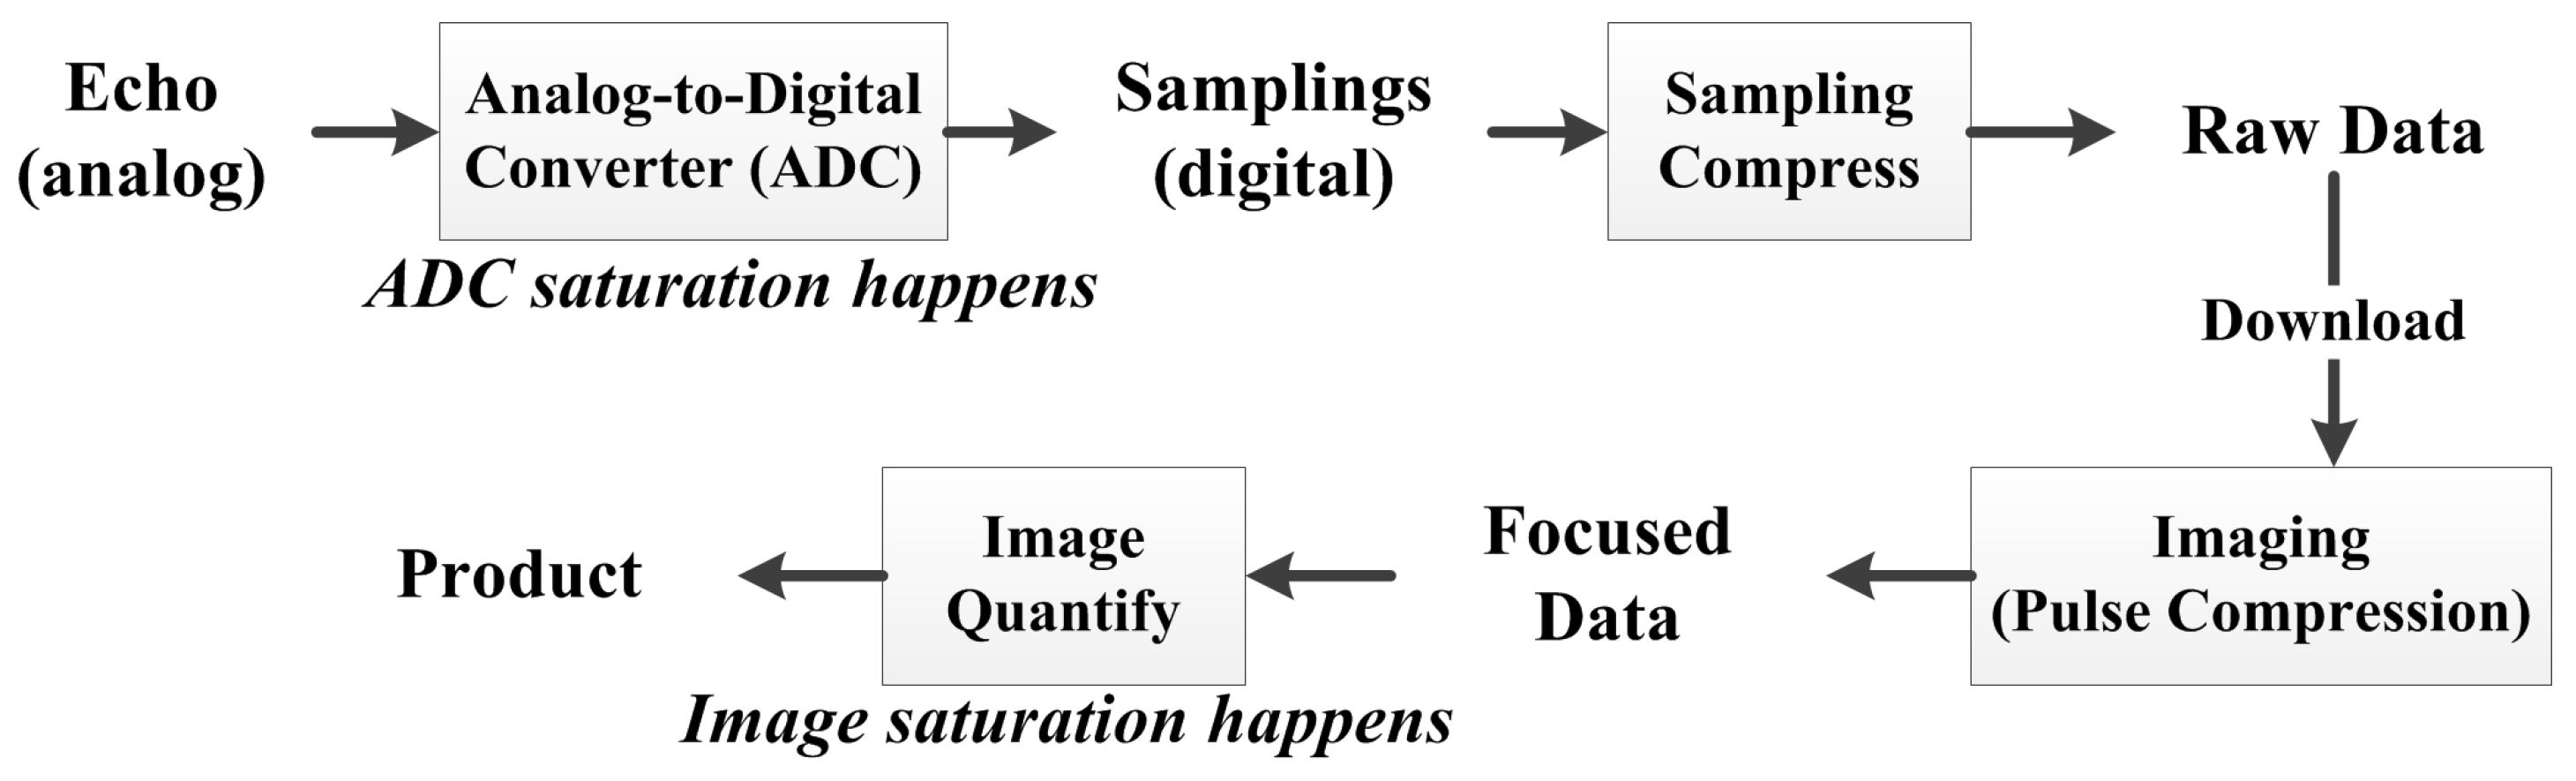
Abstract
Digital storage and transmission are common processes in modern synthetic aperture radar systems; thus, analog-to-digital converters are indispensable. Such processes can lead to two types of error: quantization (or granular) error and saturation (or clipping) error, which cause sampling noise, and radiometric and harmonic distortions in final images. Traditionally, reasonable choices of the gain and the number of quantization bits by the analog-to-digital converter based on the echo distribution can effectively reduce these errors. However, establishing the gain control repository of a synthetic aperture radar mission is a long process. In addition, if the dynamic range of the backscattering coefficient is extremely large or if unexpected strong targets appear in a scene, then harmonics occur in the echo, which turns the variable gain amplifier into chaos based on statistic and, inevitably, results in saturation in the raw data. Once raw data saturation occurs, the SAR system can conventionally adjust only the analog-to-digital converter in the next observation, thus reducing timeliness. Power loss compensation based on a statistical model and saturation (clipping) factor on a large-scale could compensate for the energy loss in images; however, detail interference, such as harmonic distortion, cannot be effectively suppressed, which will lead to false targets in the focused data. To address this particular problem, a novel anti-saturation method for large dynamic range scenes is proposed in this paper. The log-normal distribution is used in this article to describe dynamic range scenes with strong isolated targets, which mainly cause receiver saturation. Using the statistical distribution of complex scenes as a priori information, a maximum a posteriori estimation algorithm is proposed to simultaneously compensate for the saturated values in the raw data and retain the non-saturated values. Thus, the details of the weak background are well preserved, and the isolated strong targets with sparsity are reconstructed perfectly. With Monte Carlo simulation, the proposed method can improve the radiometric accuracy by 5 to 10 dB and effectively suppress the energy of false targets. Based on TerraSAR-X, ALOS-2, and Radarsat-1 synthetic aperture radar data, the effectiveness and robustness of the proposed method are also verified by simulations.
1. Introduction
Synthetic aperture radar (SAR) is of great importance in earth observation and geophysics research due to its all-weather and all-time observation ability. Due to the limitations of the sampling efficiency associated with the analog-to-digital converter (ADC) and storage on the satellite platform, the radar echo is amplified to an appropriate level by an intermediate amplifier and then sampled with small quantization bits. After that, block adaptive quantization (BAQ) or a similar technology compresses the samples again at a lower bitrate for storage, transmission, and imaging []. In the data flow, there are four steps that can lead to nonlinear distortions: (a) The saturation of an analogue amplifier for the received echo, (b) ADC for the down-converted echo, (c) lossy compression for digital data, and (d) image quantization for focused data. Currently, due to the development of power electronic devices, nonlinear distortion seldom occurs in analogue amplifiers, the saturation of which can be regarded as ADC saturation [,]. Meanwhile, image quantization distortion can be effectively reduced by using a 16-bit formation. Thus, ADC distortion and lossy compression are the main sources of nonlinear distortion; some studies have discussed adaptive compression methods for the latter [,,], but few include a correction for ADC distortion. During ADC, the values set to the nearest integer points from the analog signal lead to quantization (granular) noise, and setting the amplitudes over the max or min values of quantization to the thresholds causes saturation (clipping). These two types of error above cause radiometric distortion, sampling noise, and harmonic distortion, which seriously impact the focused SAR data. Radiometric distortion affects quantitative remote sensing, and sampling noise and harmonic distortion increase false alarms and cover up weak targets.
Traditionally, automatic gain controllers (AGCs) or manual gain controllers (MGCs) have been used to minimize ADC error according to the statistics for an echo that is subject to white noise with a zero-mean Gaussian distribution [,]. With specific quantization bits, the amplification factor can be calculated via computer simulations according to the variance of the raw data []. To minimize the ADC error, the setting of the intermediate amplifier is very critical. Establishing the gain control repository according to backscatter mapping, which could take several months or years [], is very important in the early operation of a SAR satellite mission. Once raw data saturation occurs, the SAR system can only adjust the variable gain amplifier (VGA) in the next observation. Thus, during the commissioning phase, saturation in ADC is relatively common in urban areas and degrades image quality [], which reduces the timeliness of the data. Currently, the control of VGA is complex, and saturation issues seldom appear in stable systems. However, in some complex scenes (such as coastal areas), the dynamic range of the radar backscattering coefficient may reach 50 dB or more, and the variance of the sampling rapidly changes in the range and azimuth directions, which may result in an ineffective gain controller. Even if AGCs or MGCs are used, a large ADC error can still occur and distort an image [,].
Moreover, to achieve high sensitivity, AGCs and MGCs ignore the saturation problems caused by a few strong scatterers. The power of targets is affected by energy loss in saturation, and this issue can be corrected based on the saturation level of the raw data (but only for large-scale scenes) [,,]. However, the harmonic distortion caused by isolated strong targets remains (we will discuss this topic in Section 2.3), and the remaining harmonic distortion can lead to parasitic sidelobes and false targets in large dynamic range images that cannot be suppressed by frequency-domain filtering or energy compensation [,].
1-bit compressive sensing was proposed to reconstruct the saturation signal for sparsely expressed measured signals in previous studies []. The proposed mathematical model was then modified for radar ADC saturation in [] and 1-bit quantized SAR []. However, the applicability of the method is limited, and it can only be used in simple background scenes. Additionally, a priori condition does not have a physical model for support.
In this paper, we consider using a log-normal distribution to describe a large dynamic range scene [,] and determine the maximum a posteriori (MAP) signal of the raw data. According to the physical model, the optimization algorithm in [] is updated for use in more general cases. By using this algorithm, the saturated raw data can be reconstructed with a priori information, and the unsaturated raw data is maintained. Simulations with TerraSAR-X, ALOS-2, and Radarsat-1 data show that the proposed method can improve the relative radiometric accuracy by 5 to 10 dB and effectively suppress harmonic distortion.
The error source of ADC distortion is analyzed in Section 2. In Section 3, the a priori model is built based on a traditional backscattering distribution. The optimization equation is constructed, and the performance of the proposed method is discussed. Simulations and experiments are shown in Section 4. A discussion and conclusions are provided in Section 5 and Section 6, respectively.
2. Analog-To-Digital Converter Saturation Distortion
The analog-to-digital converter acts on the echo sample, which leads to ADC saturation. Then, the samples (or raw data) that suffered from ADC saturation are sent to the ground, and processed by 2-D pulse compression to obtain focused data. To compress data, the focused data will be quantified again in the product, which leads to image saturation. The specific data flow of the SAR system is shown in Figure 1.
Figure 1.
Data flow of the synthetic aperture radar (SAR) system.
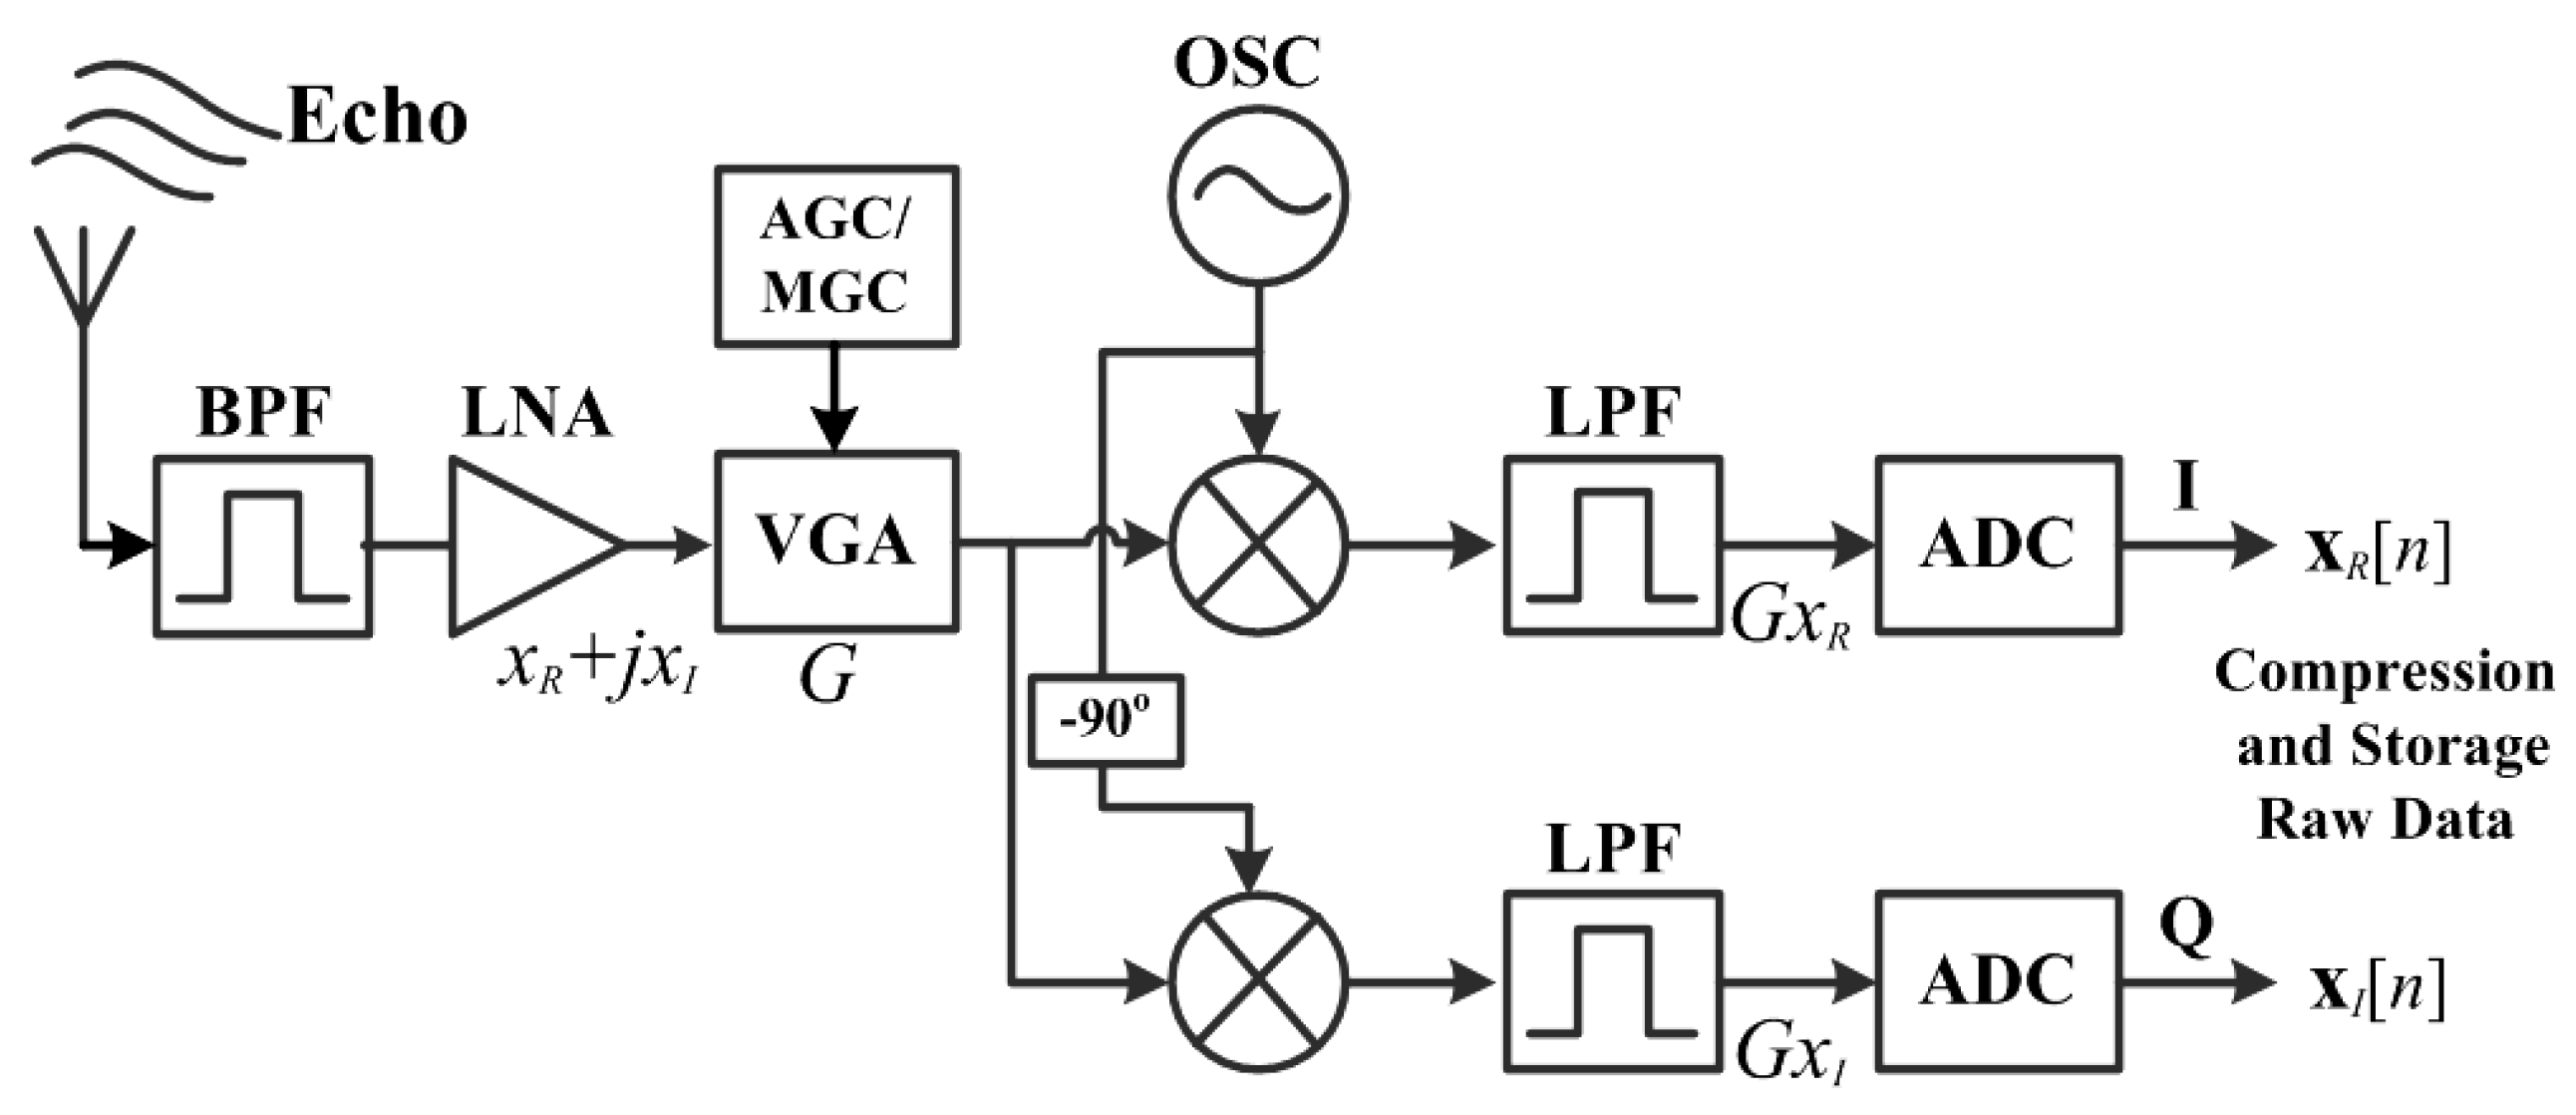
It is obvious that ADC saturation and image saturation are different, as they occur during different stages of SAR data flow and have different processing intents.
2.1. ADC Error for Raw Data
Figure 2 shows a simple diagram of a radar receiver. The VGA is controlled by the AGC/MGC and amplifies the echo to an appropriate level . The real and imaginary parts of the amplified echo and are sampled separately through I/Q channels as and . Then, these parts are compressed by BAQ (or another technology) and stored.
Figure 2.
Simple diagram of a radar receiver. BPF stands for Berkeley Packet Filter. LNA stands for Low-Noise Amplifier. AGC stands for Automatic Gain Controller. MGC stands for Manual Gain Controller. VGA stands for Variable Gain Amplifier. OSC stands for Open Source Commerce. LPF stands for Low-Pass Filter.
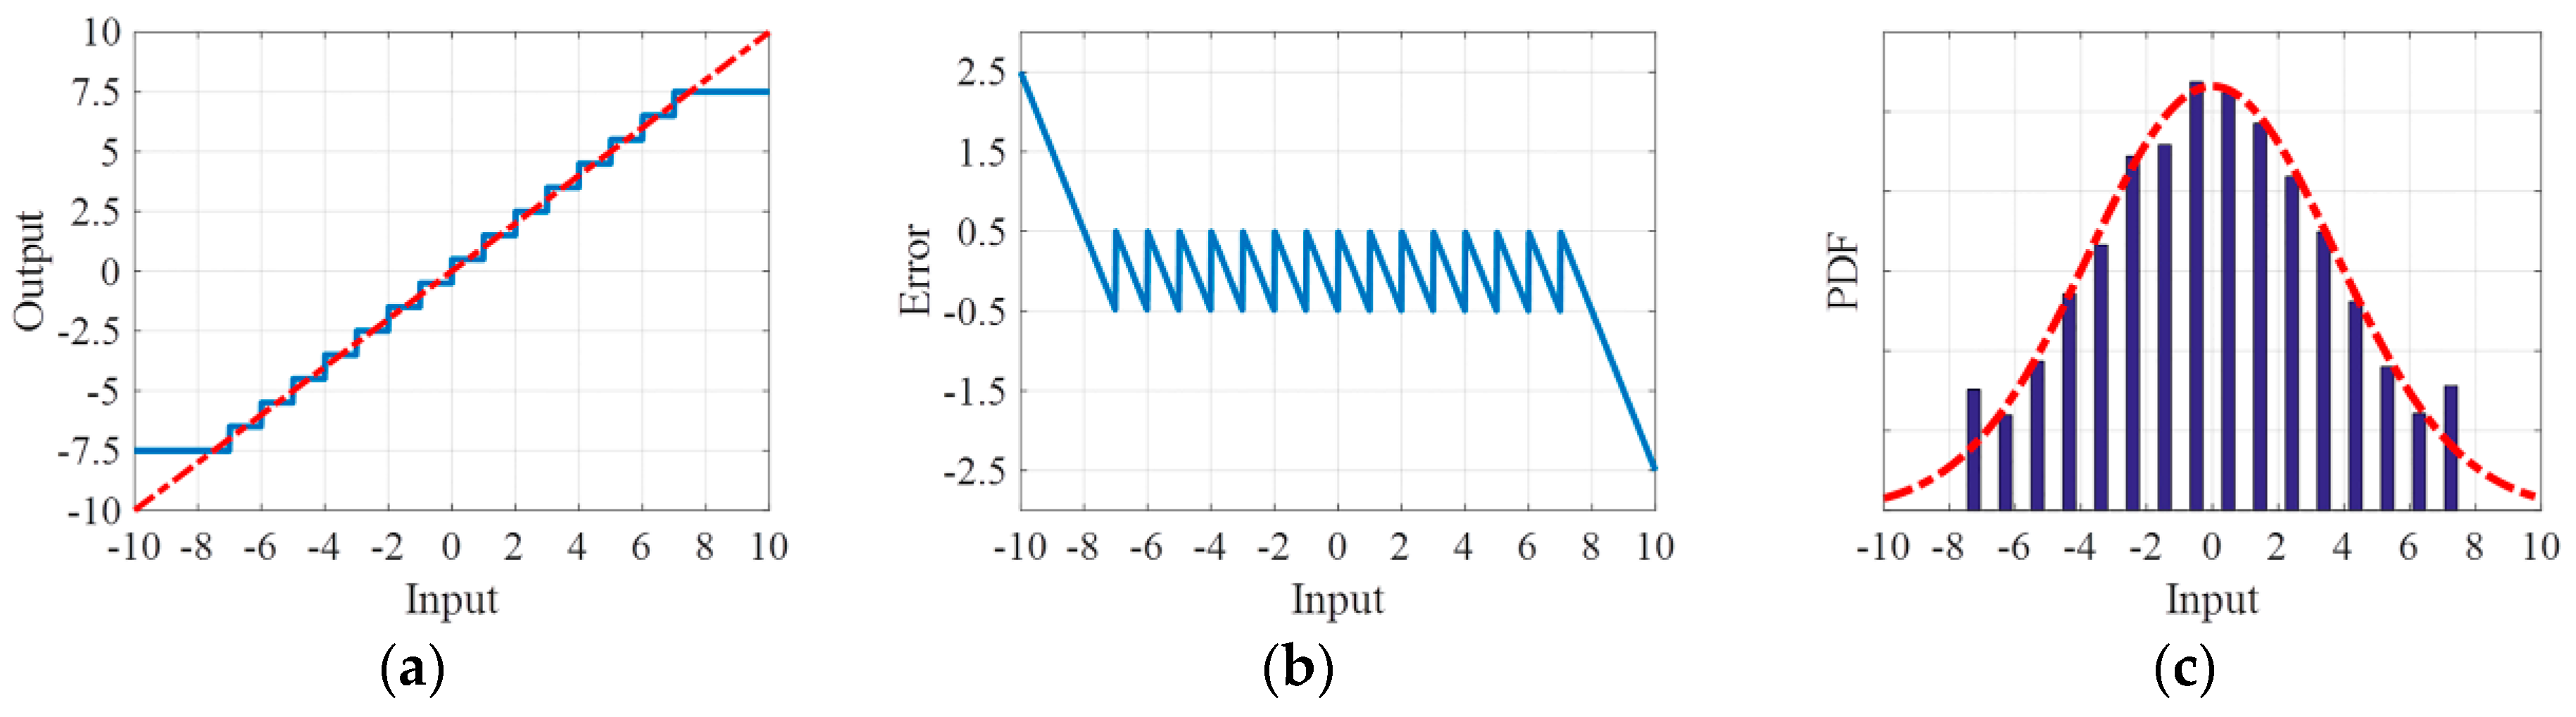
For an echo, the ADC quantizes the real and imaginary signals to specific levels. As shown in Figure 3, the samples above the maximum quantization value are set to the threshold, and the others are set to the most recent quantized values. Thus, the continuous probability distribution changes to a discrete distribution, which leads to ADC errors. Specifically, the saturated error is related to the values exceeding the threshold, and the quantization error takes values between –0.5 and 0.5, conforming to a uniform distribution.
Figure 3.
ADC at 4-bits of quantization. (a) The dotted line indicates the input analog signal, and the solid line indicates the output digital signal. Values exceeding ±7.5 are set to the threshold, the continuous values are discretized. (b) The quantization error from the values within the threshold range is between ±0.5, and the saturation error is always larger than the quantization error. (c) The continuous Gaussian probability distribution (dotted line) becomes discrete (histogram).
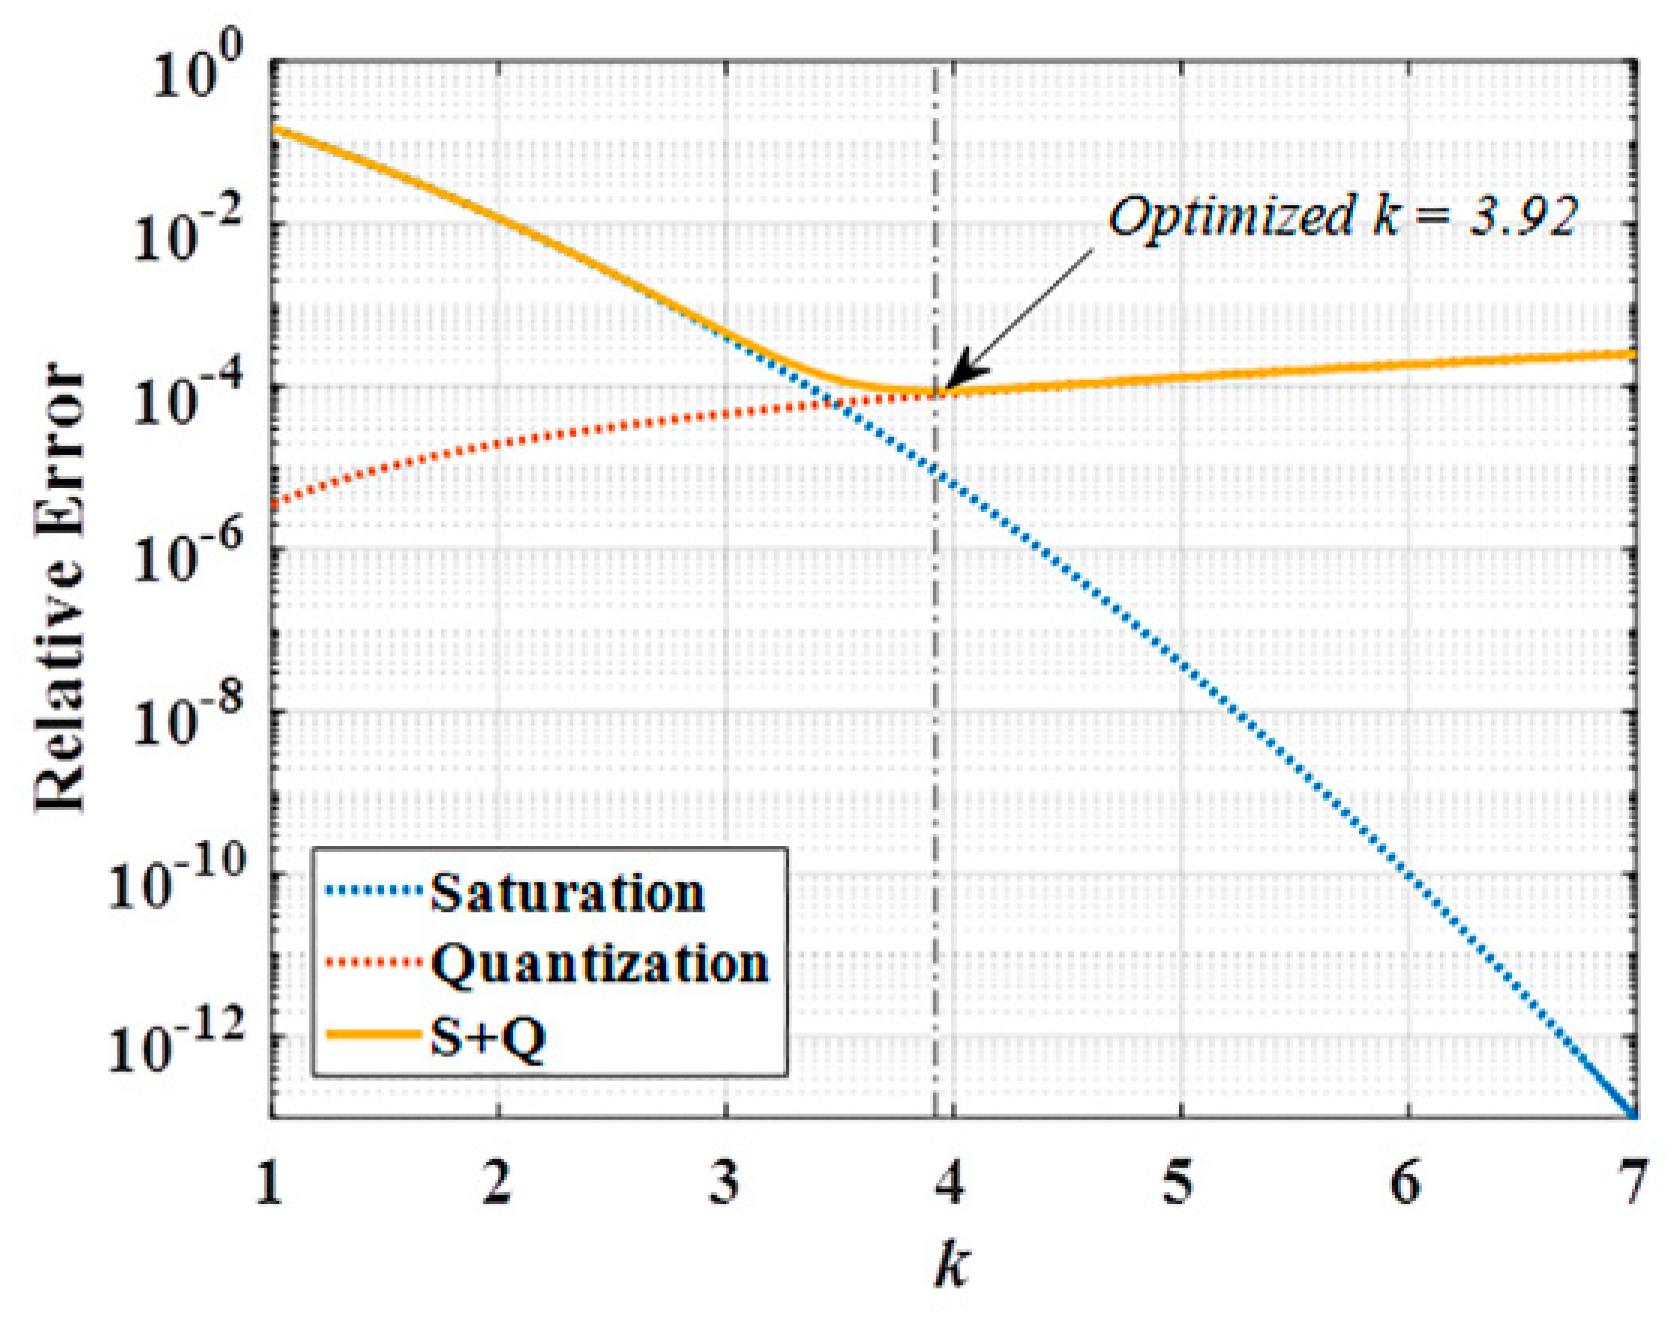
The echo is amplified times by the VGA, and the ADC performs -bit quantization. The signal obeys a zero-mean Gaussian distribution.
Here, is or , and is the standard deviation.
The saturated threshold of the signal is , which is expressed as a multiple of the signal standard deviation . The quantization noise ranges from , which can also be expressed as . The relative errors of quantization and saturation are
where is the confidence level of the standard normal distribution in . For specific quantization bits , there is an optimal choice of that minimizes . For a typical SAR system, is typically selected as 8 []. It is obvious that quantization error changes much more gradually than the saturation level at various values in Figure 4. Hence, the ADC error of strong targets mainly comes from saturation noise, because the threshold set by the variance of the weak background is much smaller than the optimized value of the strong scatterers.
Figure 4.
The relative noise of quantization and saturation at 8-bits. The ADC error is dominated by saturation or quantization noise when variable is lower or higher than the optimum value, respectively.
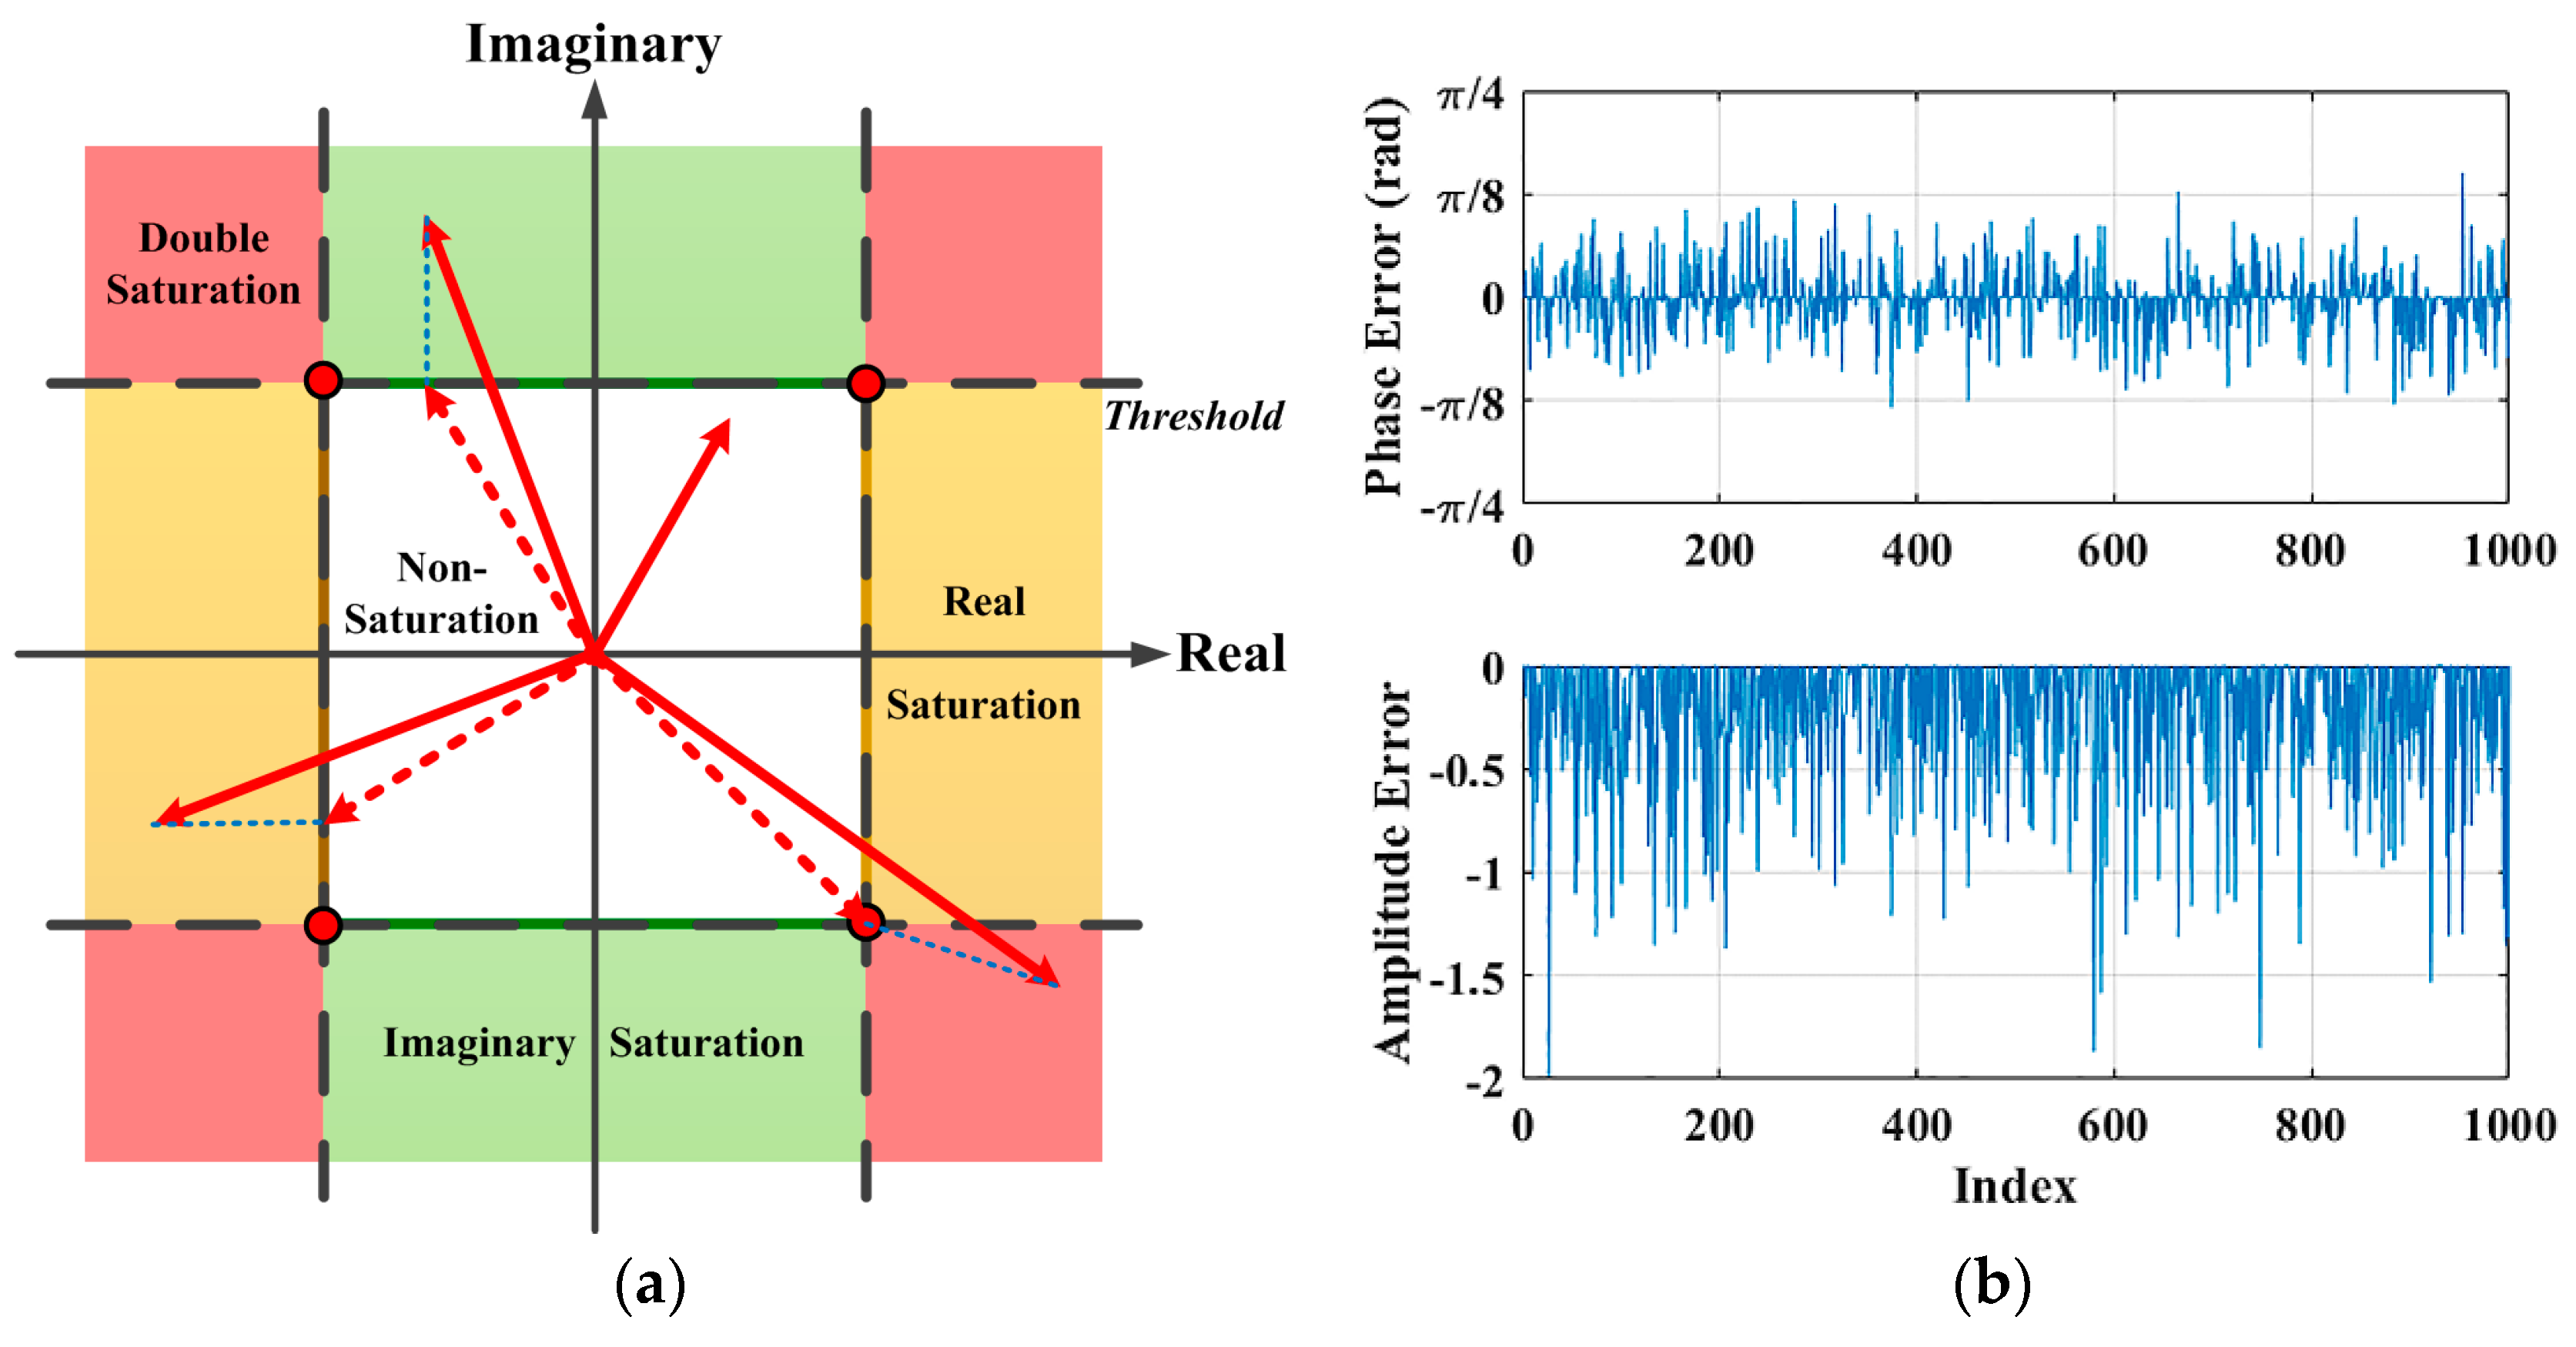
2.2. Effects of Saturation on Imaging
Because of ADC saturation in I/Q channels (real and imaginary parts), there are phase and amplitude errors in the raw data samples, as shown in Figure 5.
Figure 5.
Phase and amplitude errors of raw data samples. (a) The solid red lines are input vectors, and the dotted red lines are outputs with ADC saturation. If the samples fall in the white area, there is no saturation at all. In the yellow area or green area, there is only real or imaginary saturation, and the output values are set on the four edges of the white square nearby. If the samples fall within the red area, saturation occurs in both the real and imaginary parts, and the output values are all set at the four red corners. (b) The phase errors and amplitude errors of a zero-mean complex Gaussian echo with a clipping factor of 30% and normalized mean power.
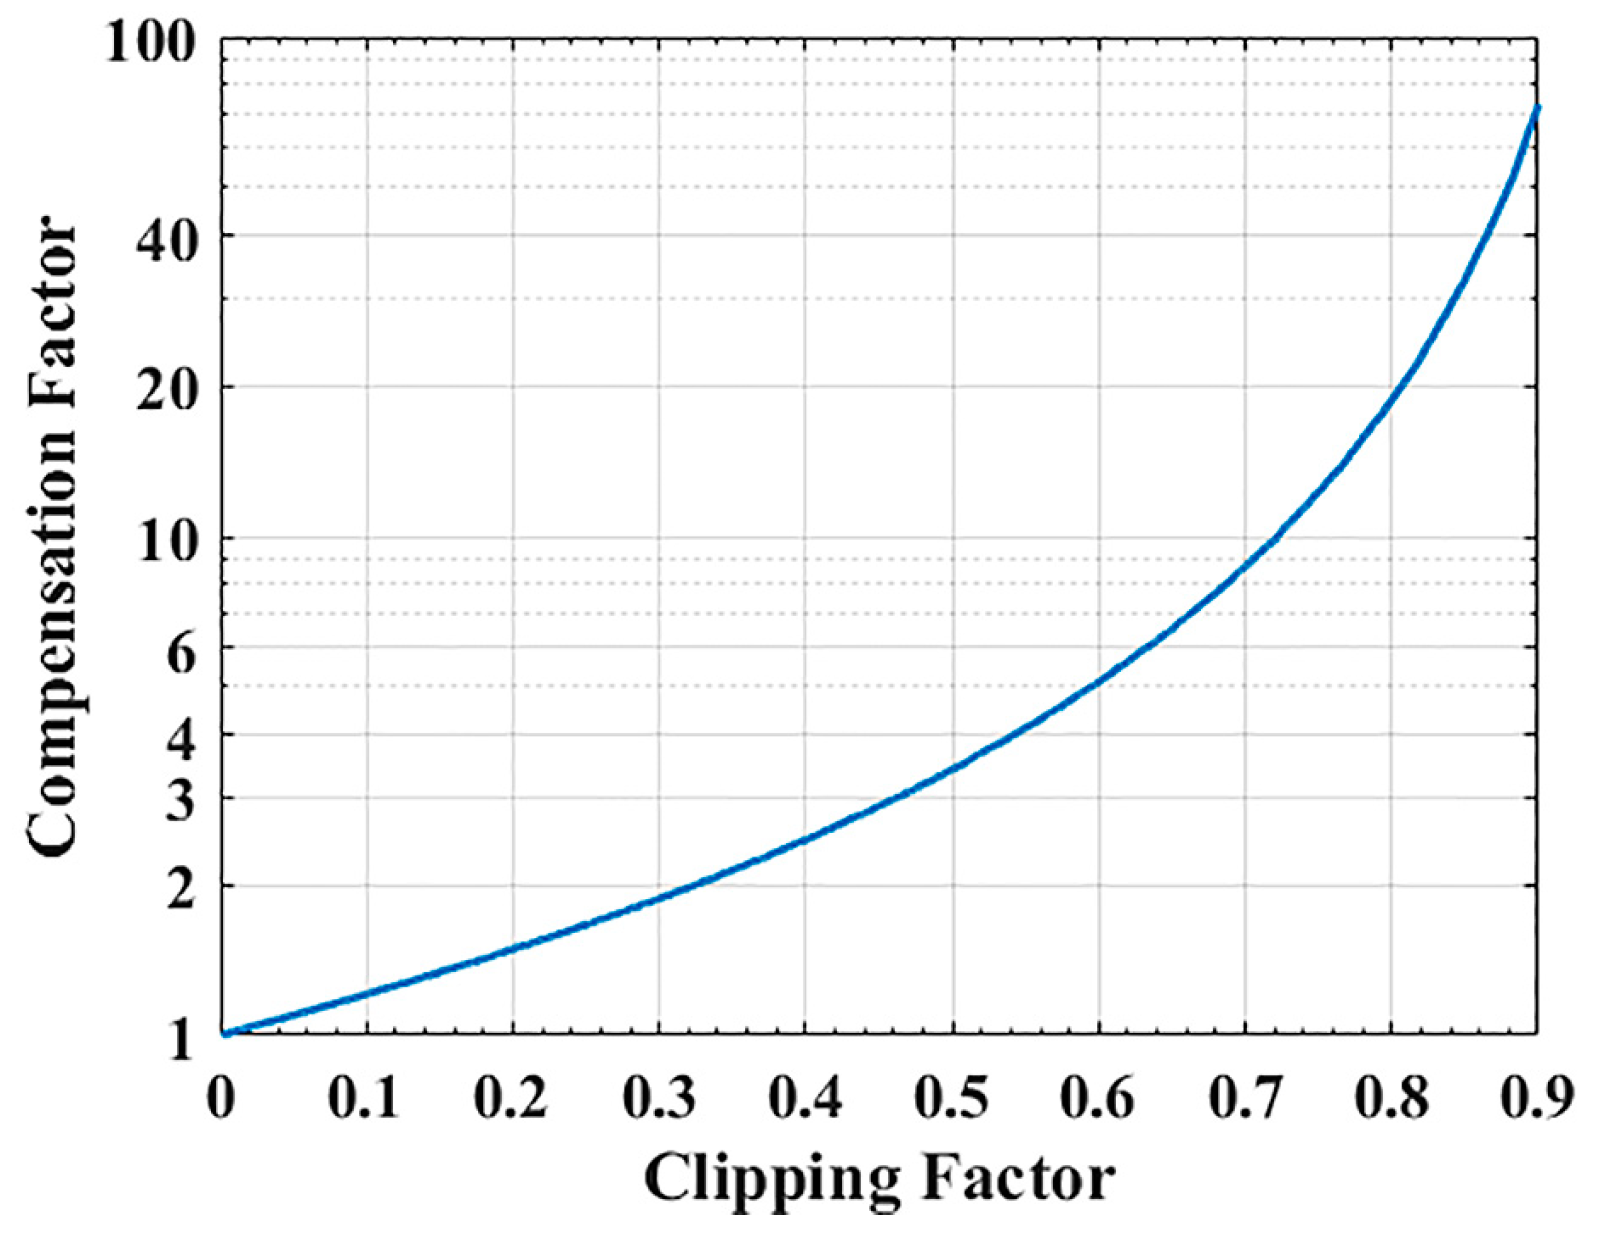
As shown above, the irregular phase errors of the samples do not exceed and have little effect on the focused results of the main lobes via coherent integration [,]. It is demonstrated that the effect of pulse phase errors on range compression with the chirp scaling algorithm is negligible []. Thus, the phase errors caused by saturation have no impact on the resolution or position of real targets, even if the system uses 1-bit quantization (i.e., only sign information remains) [].
The amplitude errors of raw data lead to power loss for the main lobes in the pulse compressed result [,]. However, the relative energy intensity between different targets in the same data block is maintained well. Based on numerical simulations, at large-scales, the power loss of focused data caused by saturated raw data can be estimated and compensated according to the clipping factor of raw data [,,] (as shown in Figure 6), and the radiometric accuracy can be improved.
Figure 6.
Compensation factor for the power loss of focused data, which is caused by the saturation of raw data. The clipping factor is calculated in saturated raw data, the real and imaginary parts of which follow a zero-mean Gaussian distribution.
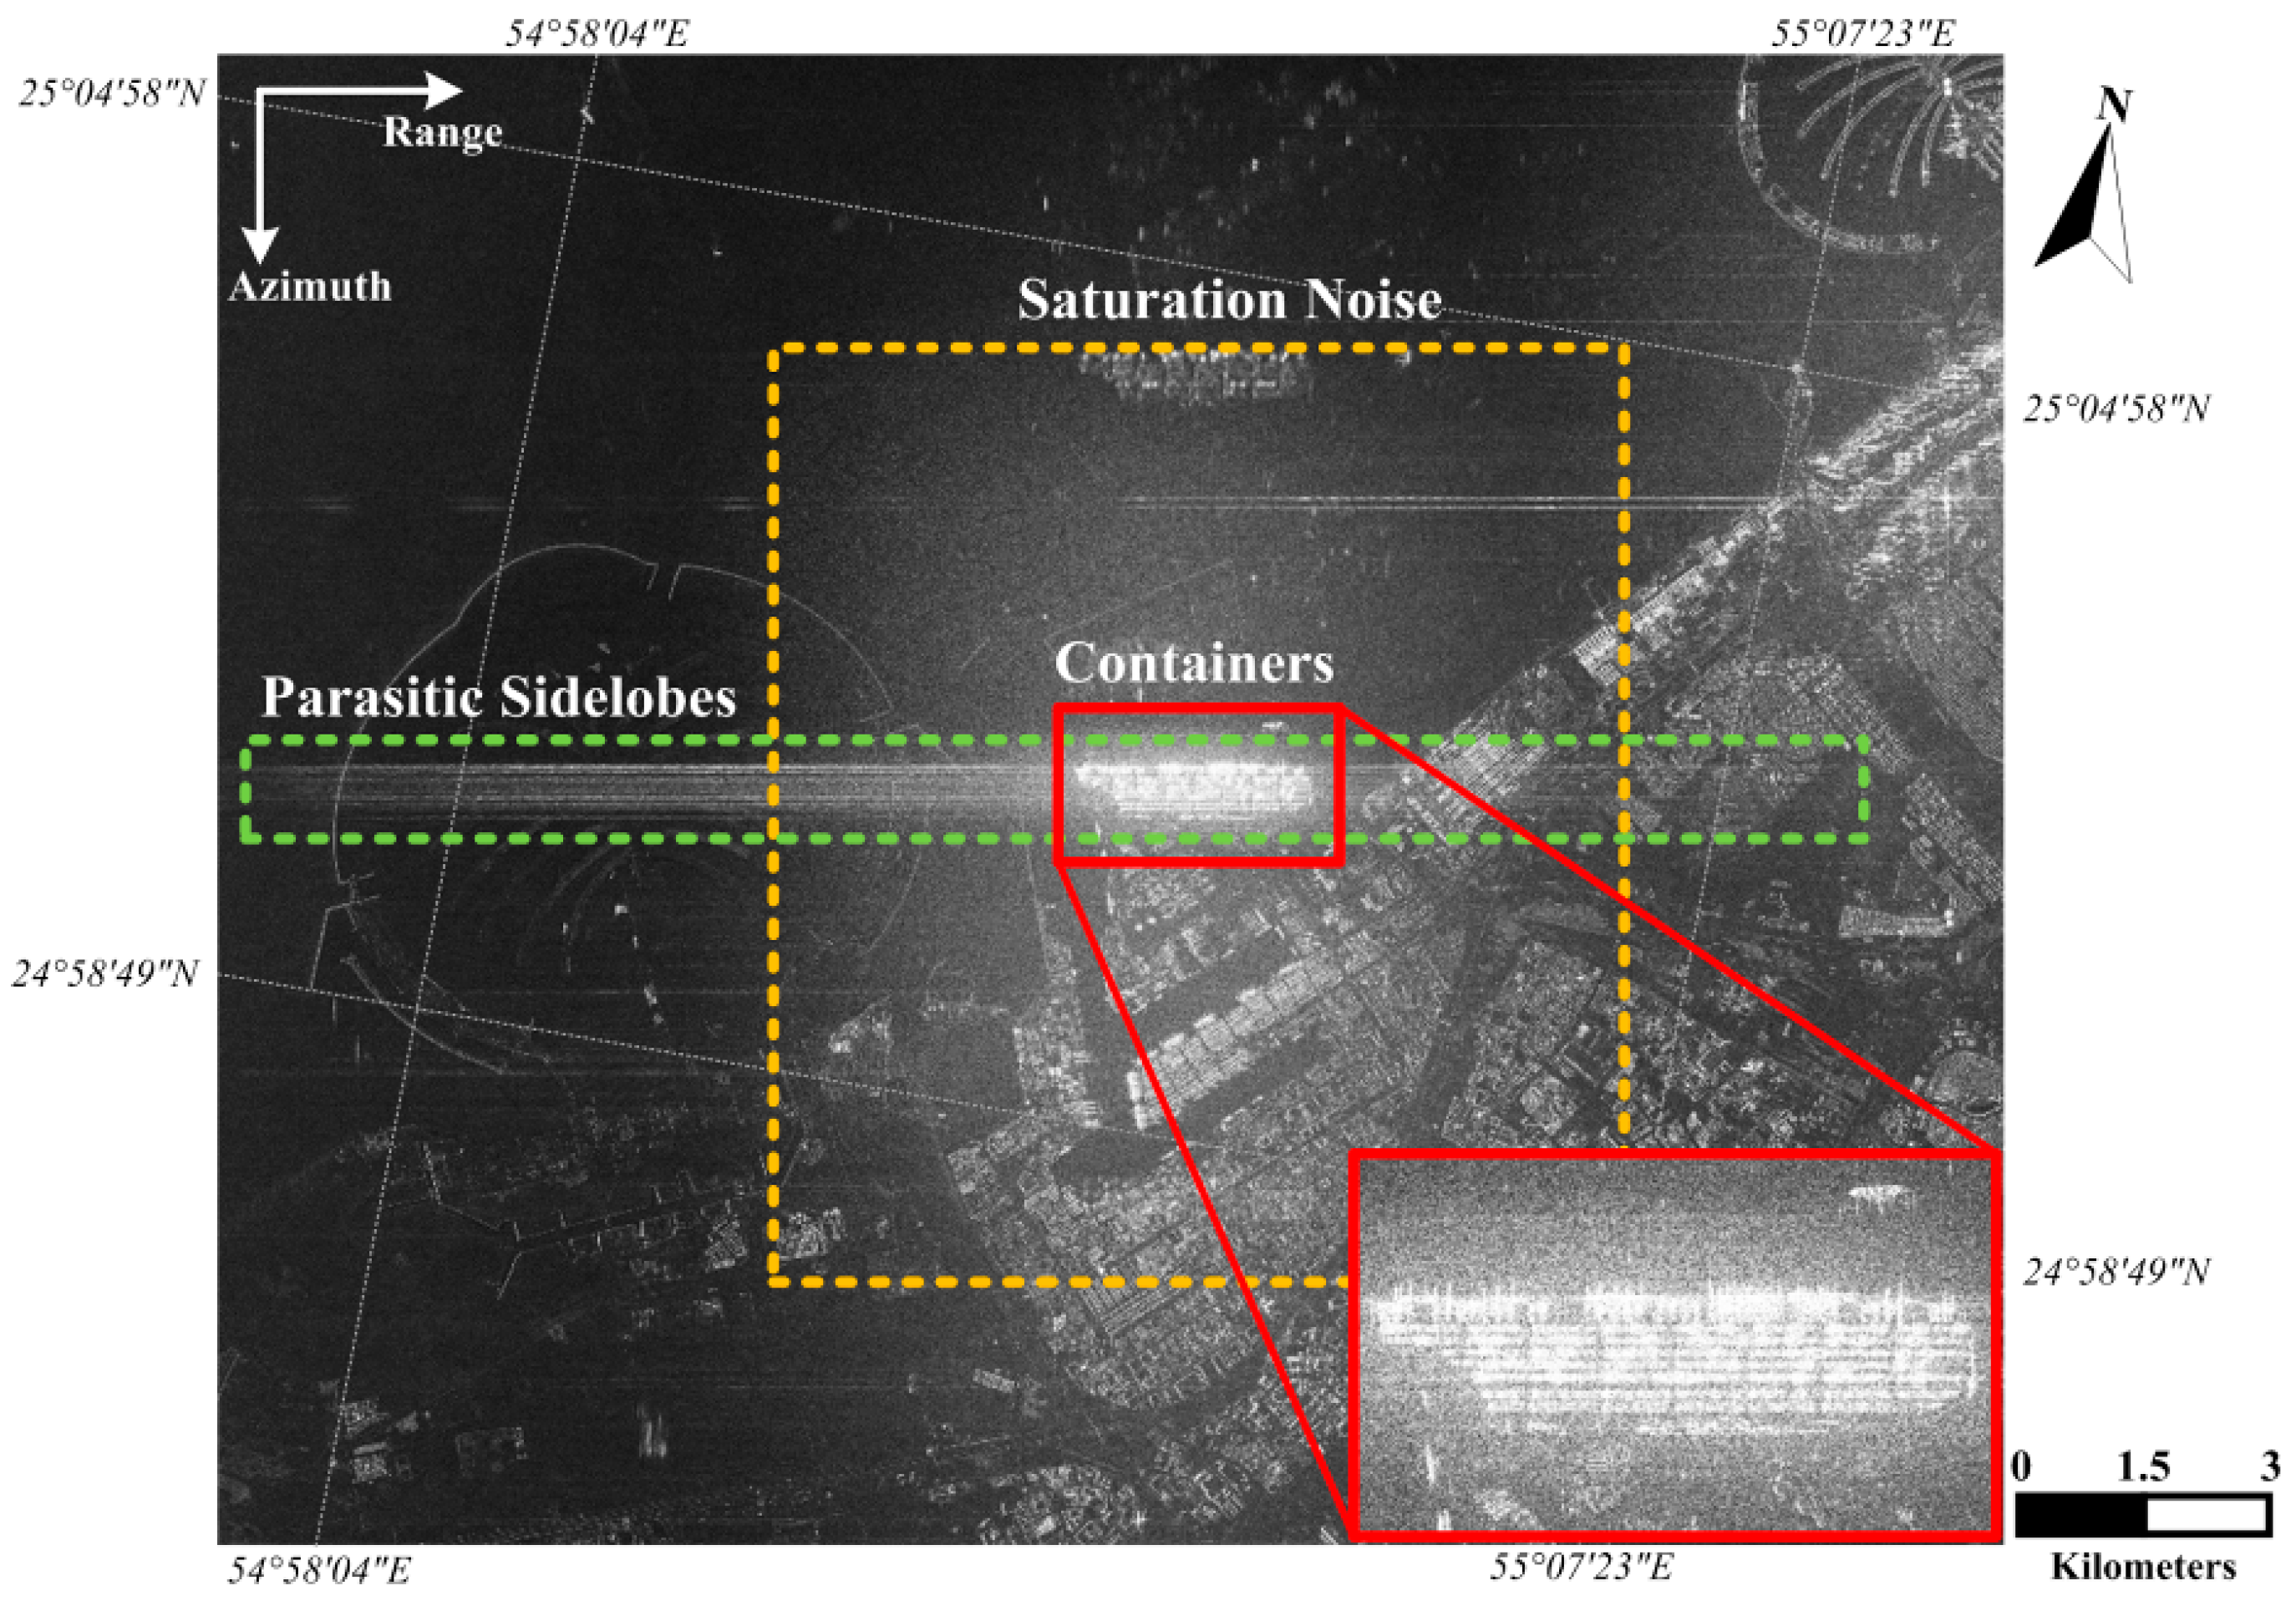
Therefore, the errors of sampling can be mitigated by coherent integration of pulse compression and compensation of power loss during imaging process, which slightly impact the images of the targets themselves. However, saturation noise remains in the product, which reduces the radiometric resolution and may cause false objects. Thus, even low bits are used in the ADC or BAQ, and we can still obtain effective images (although they are contaminated by ADC saturation).
2.3. Harmonic Distortion Due to Saturation
If there are a few extremely strong targets in a scene, in addition to saturation noise, the raw data of the isolated strong targets can lead to harmonic distortion, which causes false targets and parasitic sidelobes in focused data (as shown in Figure 7) [].
Figure 7.
The saturation of extremely strong targets in a Radarsat-2 image of Dubai. There is a container terminal at the center of the image. The placement direction of the containers (in the red rectangle) is perpendicular to the azimuth direction. Thus, the scattering intensity in this area is significantly higher than that in the remainder of the image.
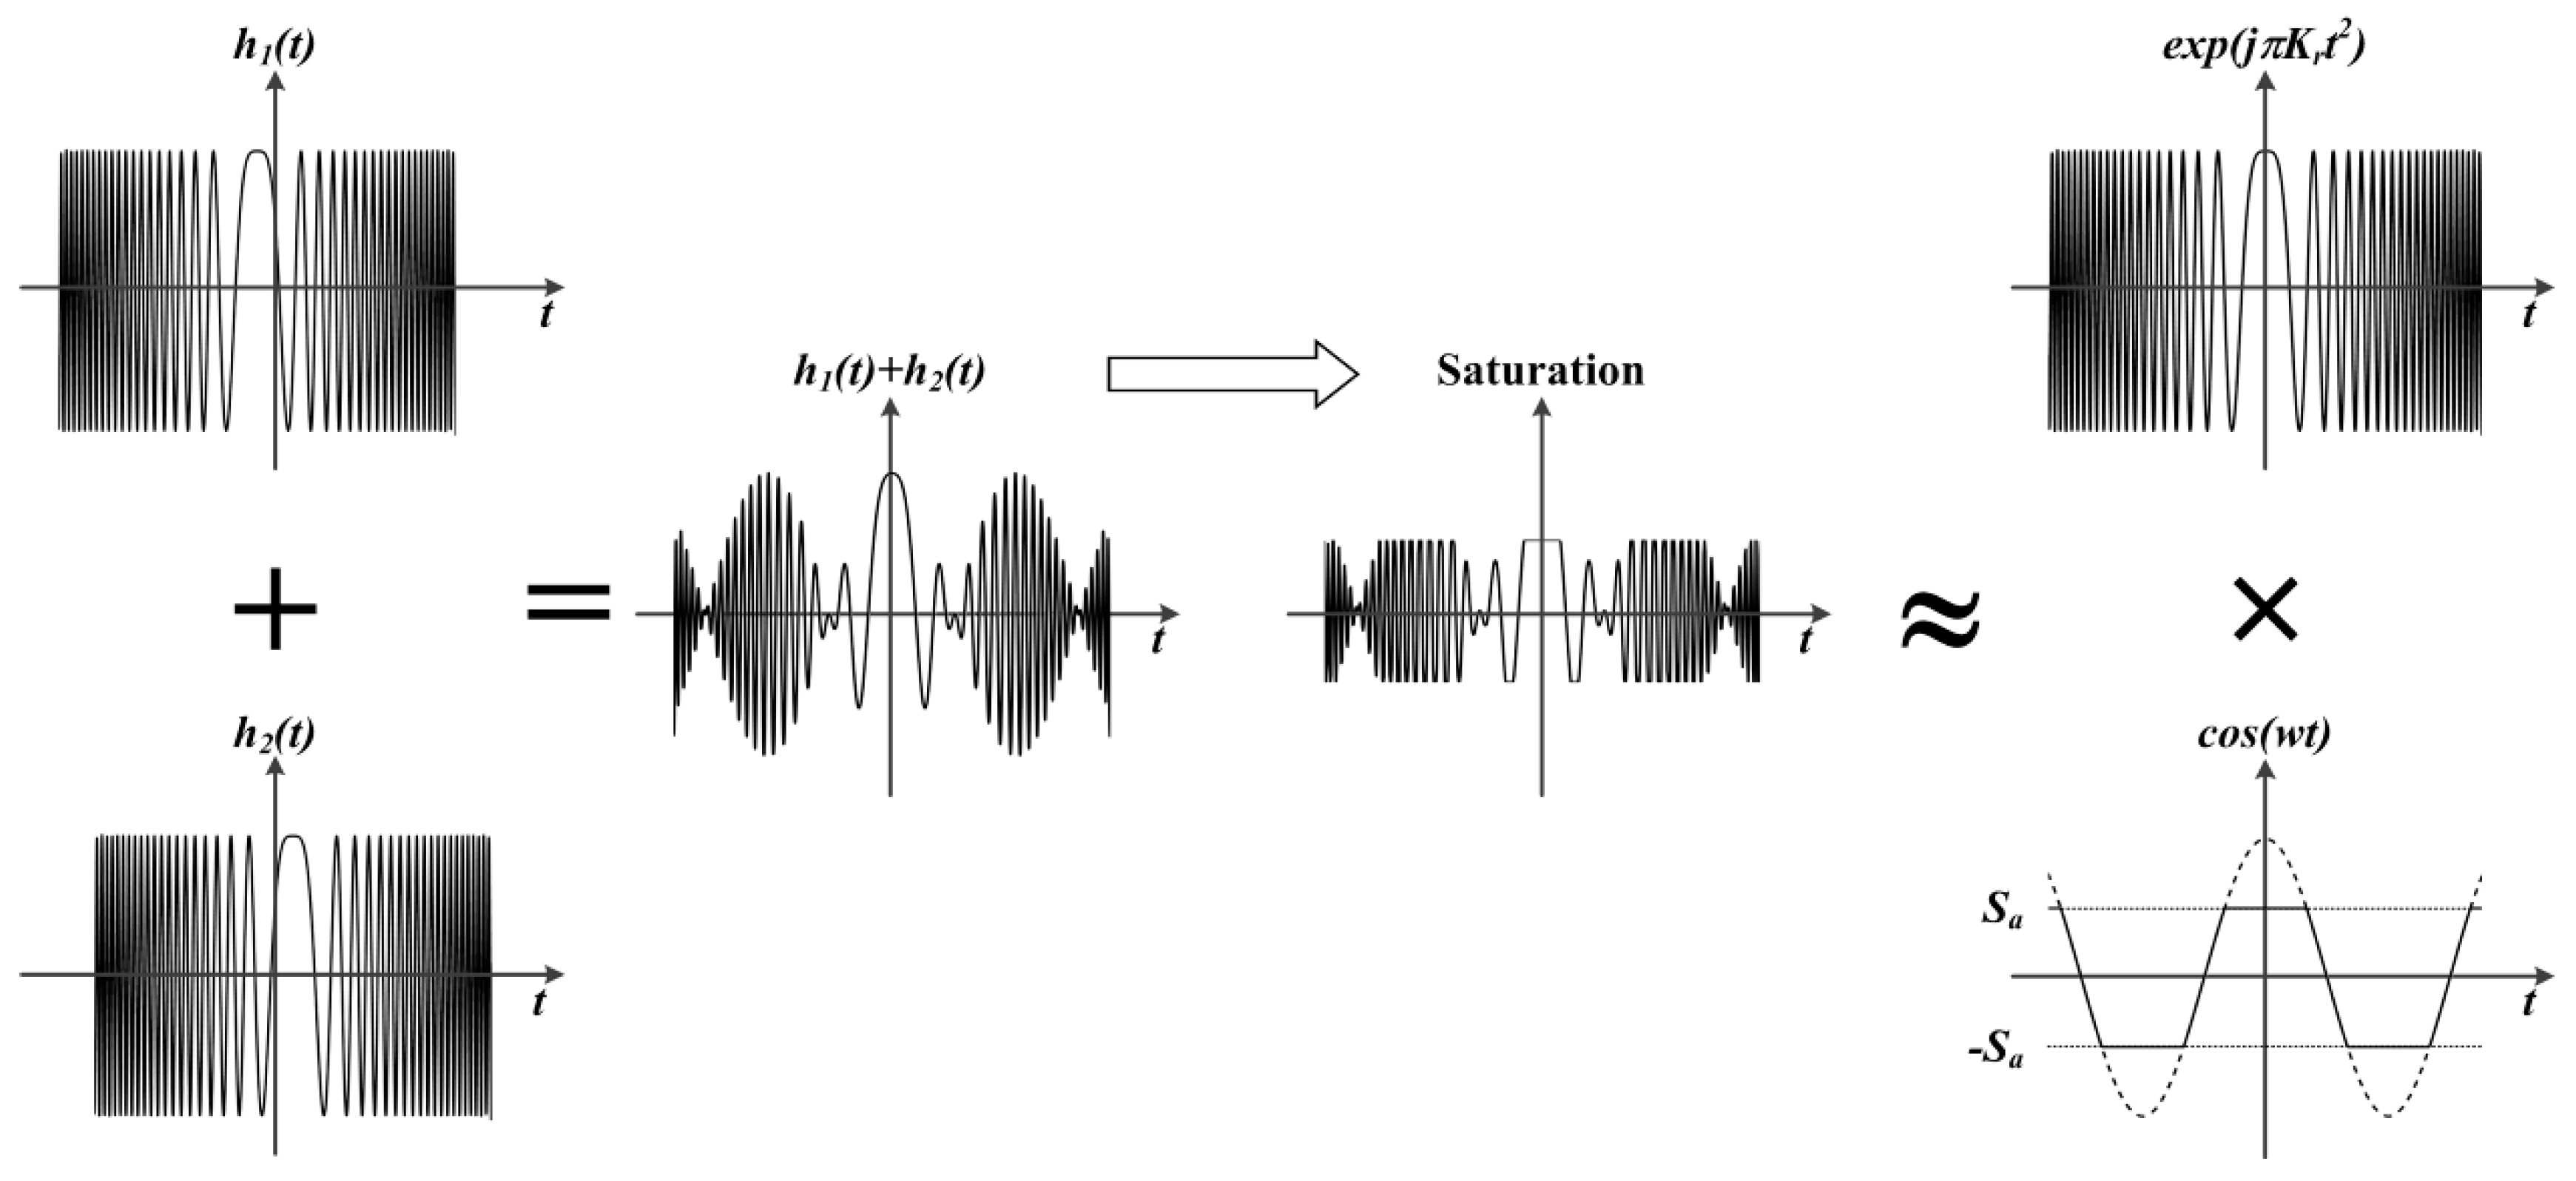
Suppose that there are two close point targets with slant ranges and , respectively, and the echo data associated with these targets is
where is the fast time and is the slow time, is the pulse width, is the chirp rate, is the wavelength, and are the complex scattering coefficients of the two targets, and and are antenna pattern weights.
At a specific time , if the two targets have the same scattering intensity and are close to each other in the range direction, namely, and , then the echo within a pulse width can be simplified to
where
The raw data can be considered a chirp signal with a low-frequency cosine envelope (as shown in Figure 8). With dechirp processing, the pulse compressed result is
where is the Fourier transform. From Equation (7), it can be seen that the pulse compressed result depends on the low-frequency component of the echo.
Figure 8.
The decomposition of the raw data between two points. Saturation mainly affects the periodic envelope.
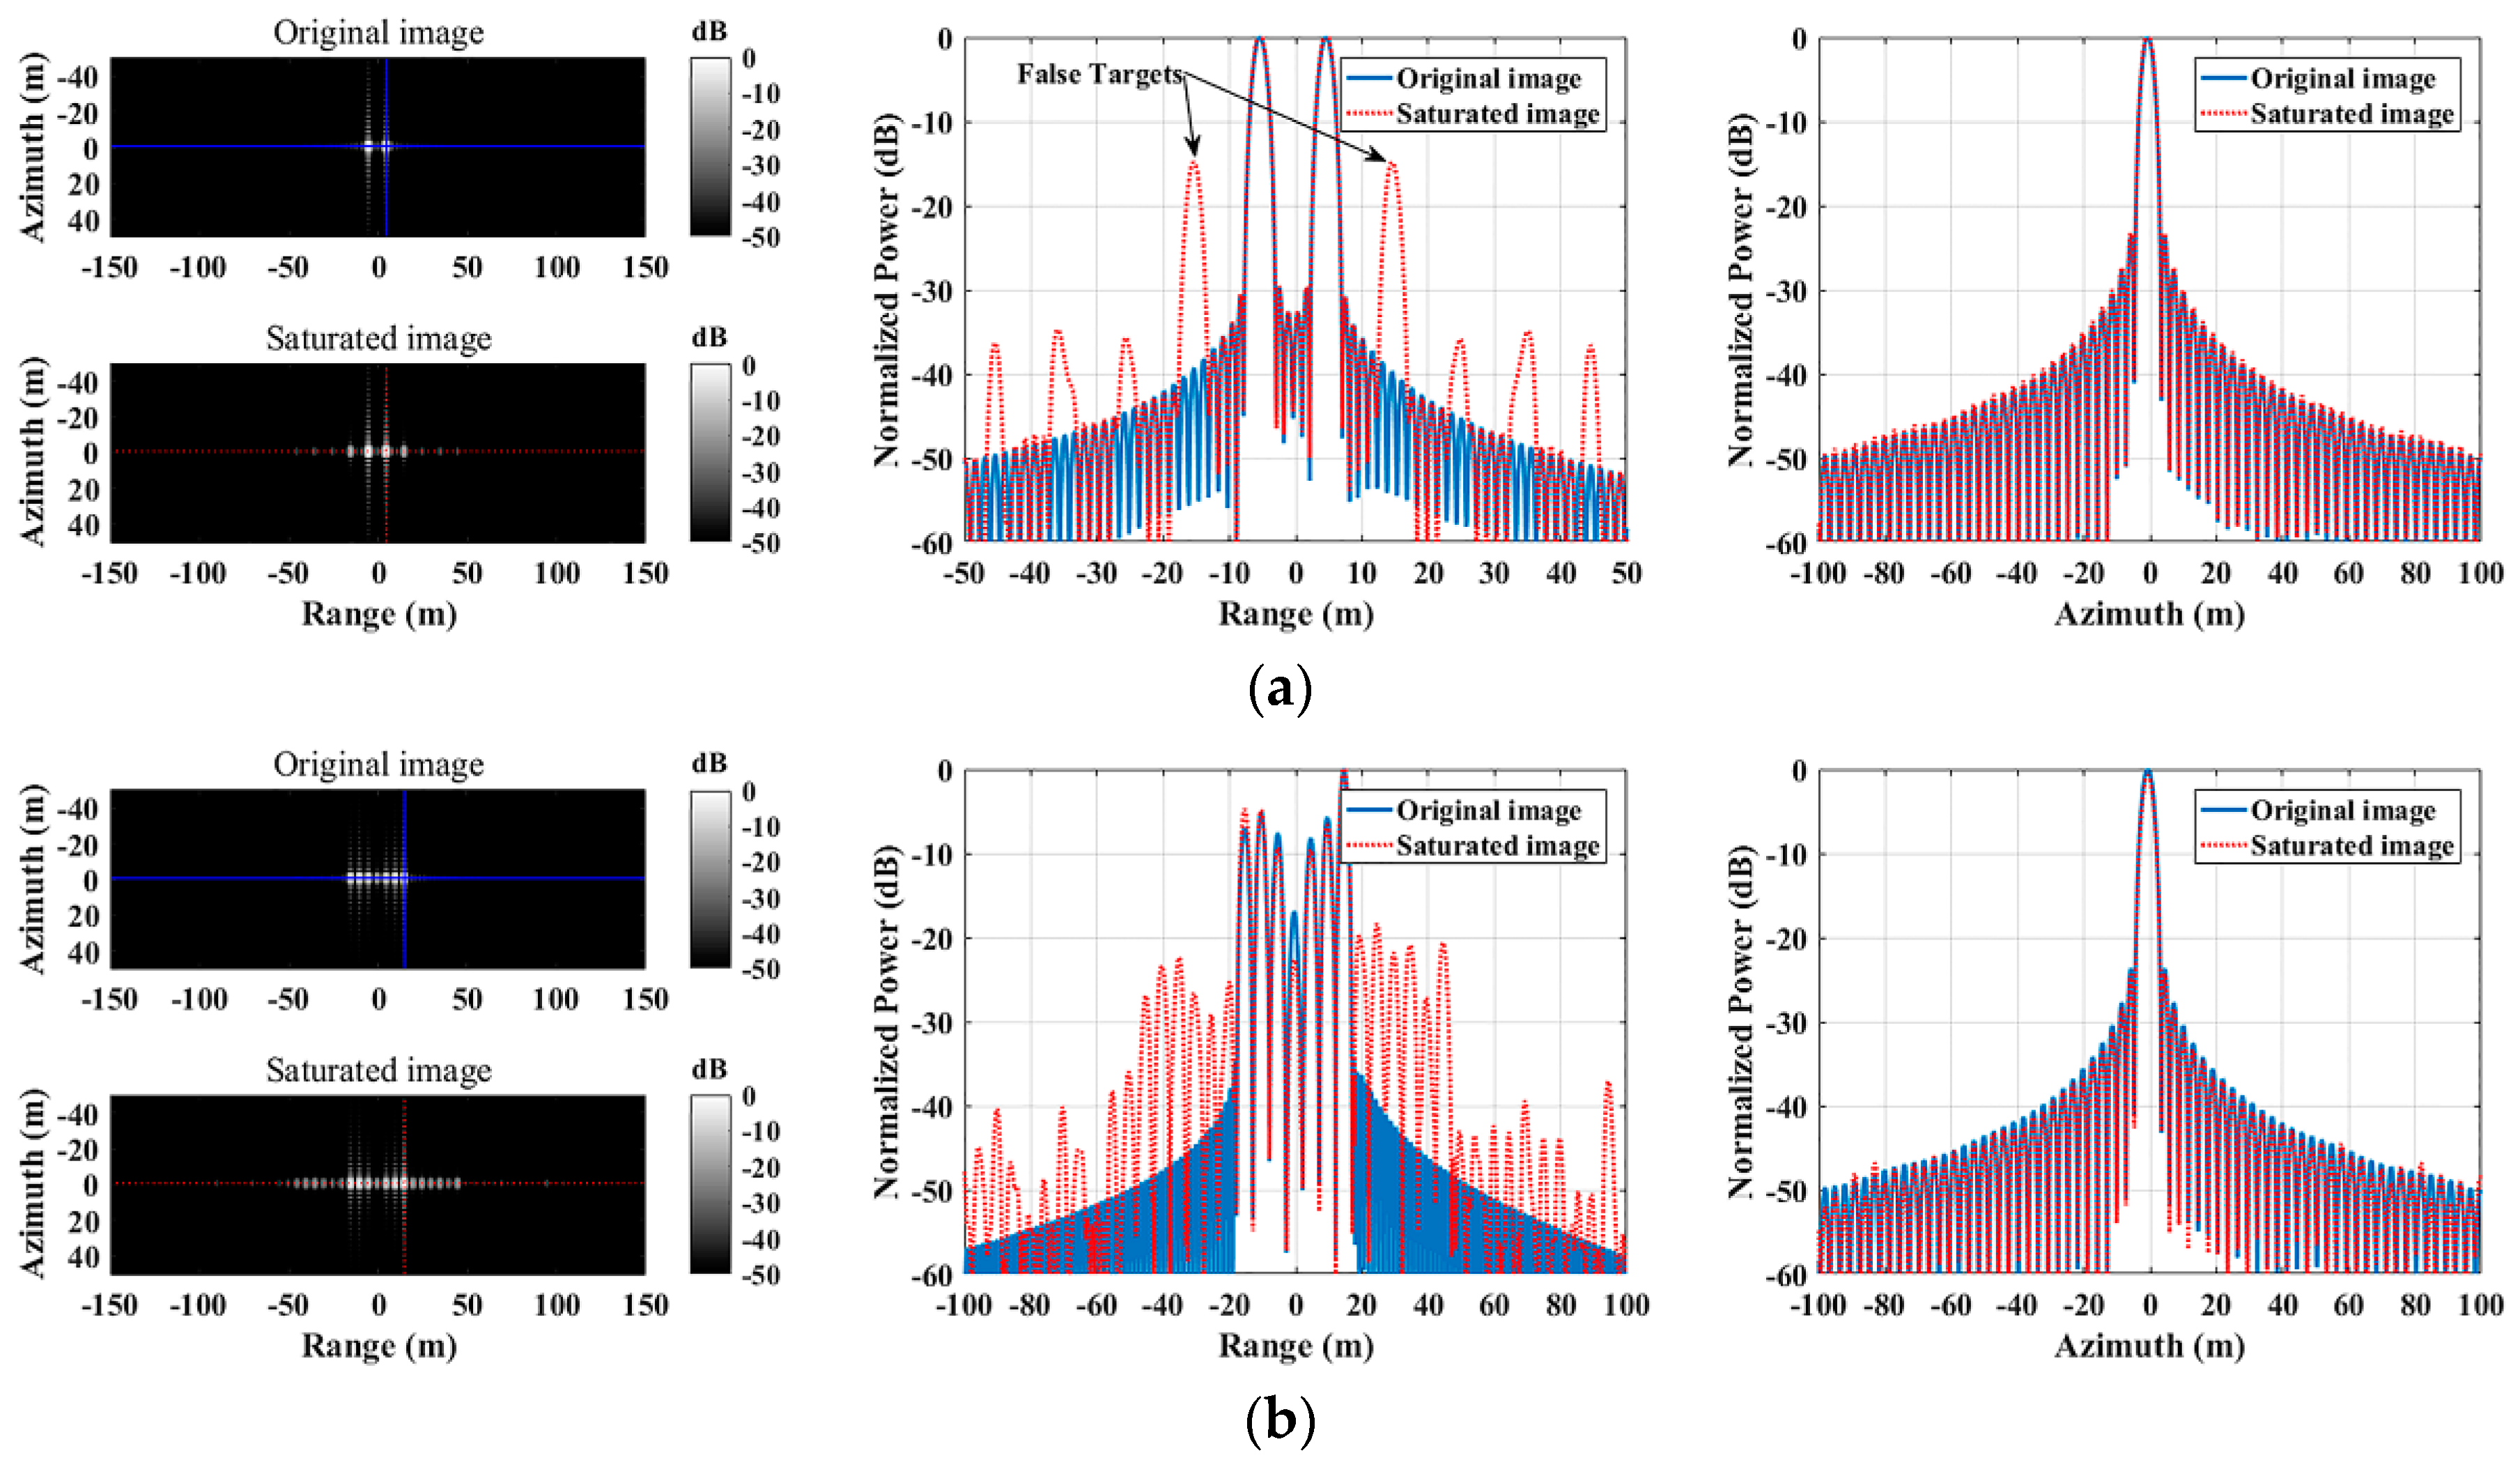
With a saturation threshold , the envelope has harmonic distortion which leads to several additional frequency components []. The pulse compression result in Equation (7) is rewritten as
The first part with phase information in Equation (8) has not changed with saturation, which keeps the normal focusing along both the range and the azimuth, and the additional frequency components in the second part result in a series of false targets after pulse compression (as shown in Figure 9a). For several strong isolated targets, the harmonic envelope is complicated due to saturation, which leads to parasitic sidelobes in the given range (as shown in Figure 9b). The same phenomenon also occurs along the azimuth, which can be explained similarly.
Figure 9.
Normalized imaging results for saturated raw data. The traditional sidelobes are suppressed by the Hamming window. (a) Two point targets cause false images. The main lobes of the real targets exhibit no significant degradation. (b) A series of isolated points result in a parasitic sidelobe.
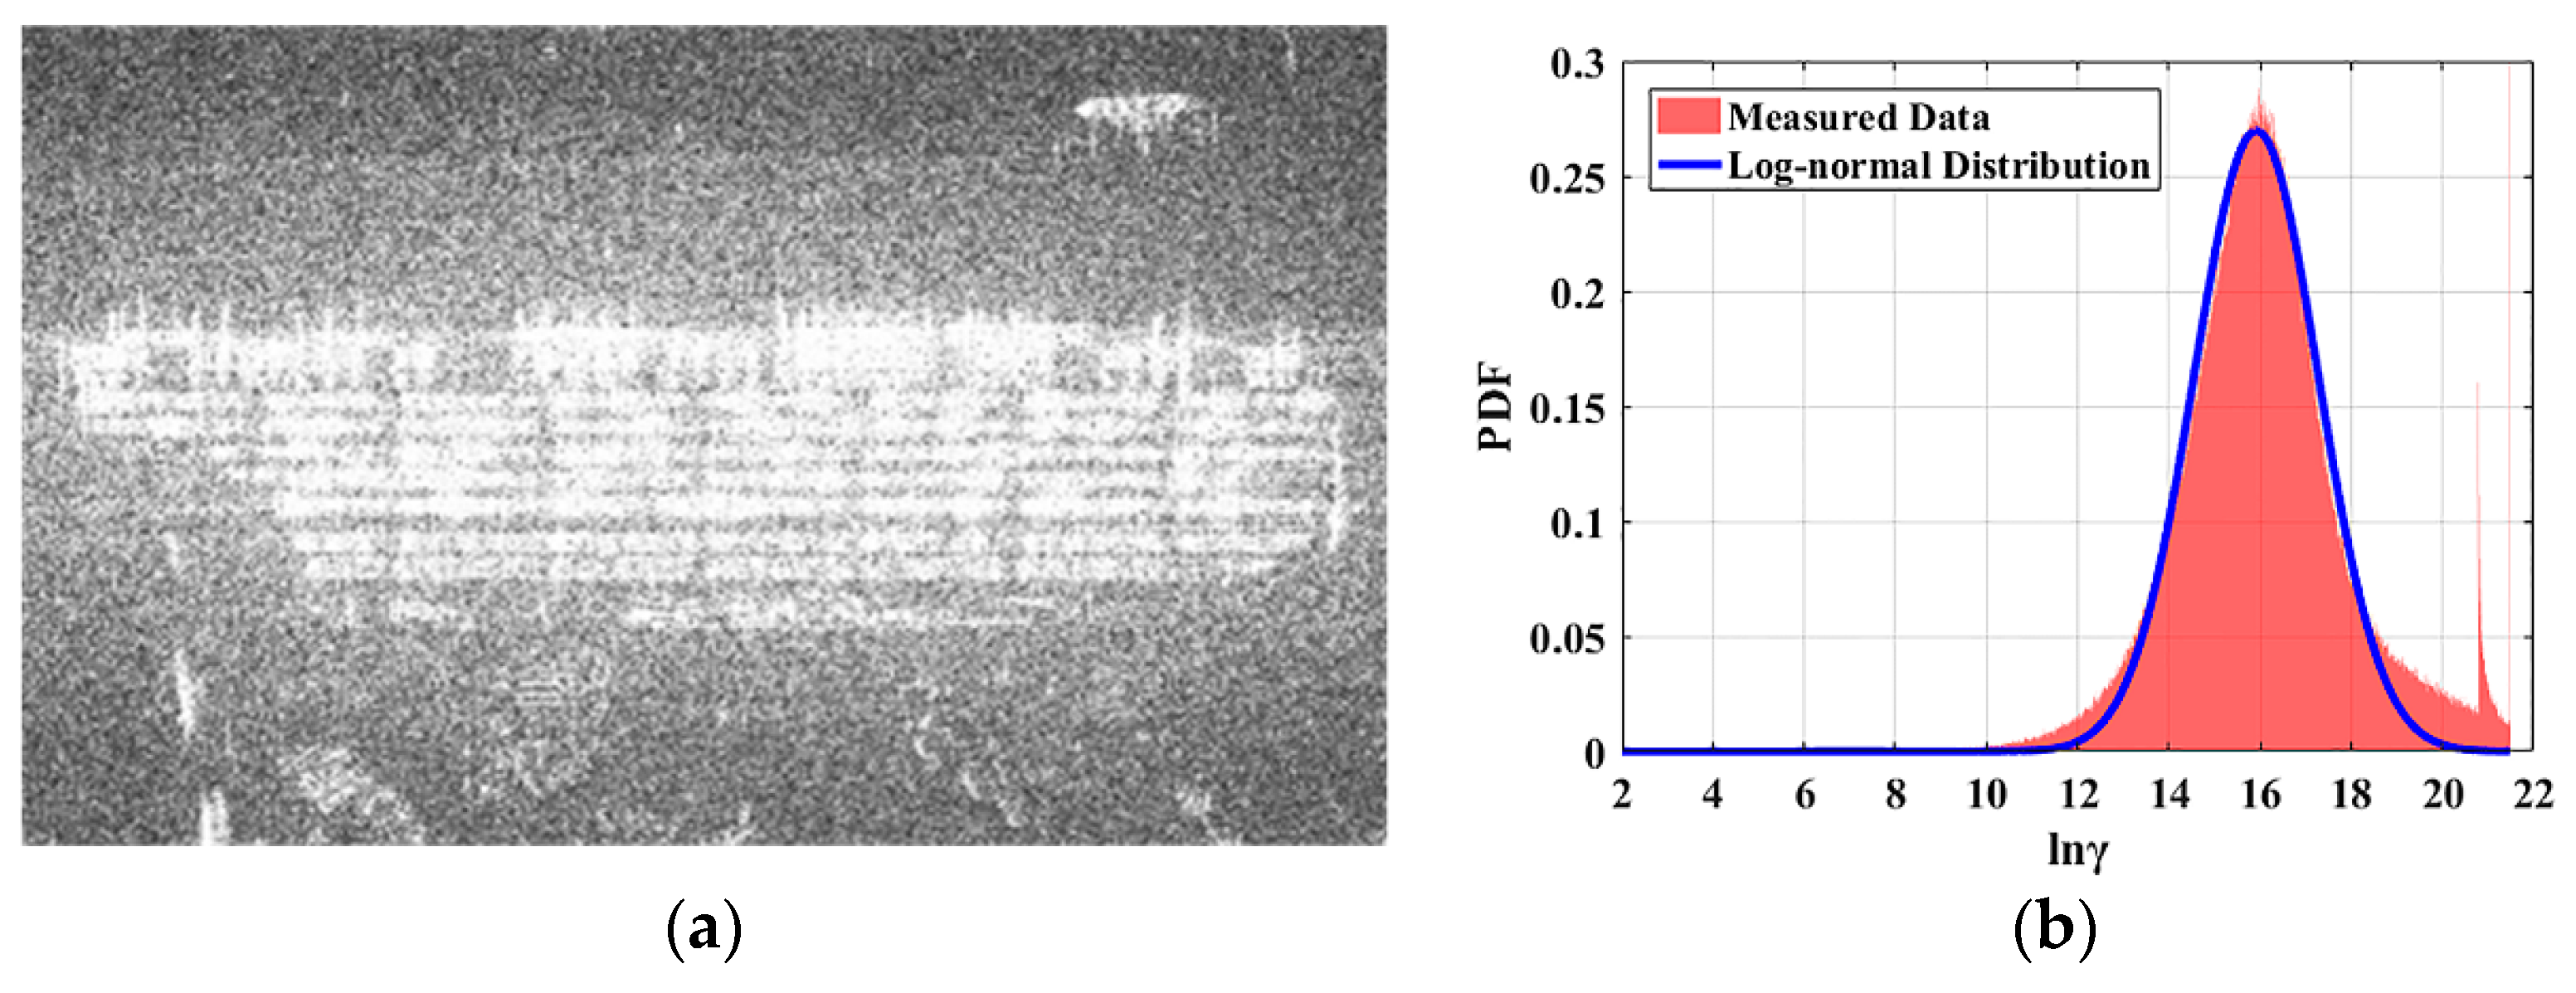
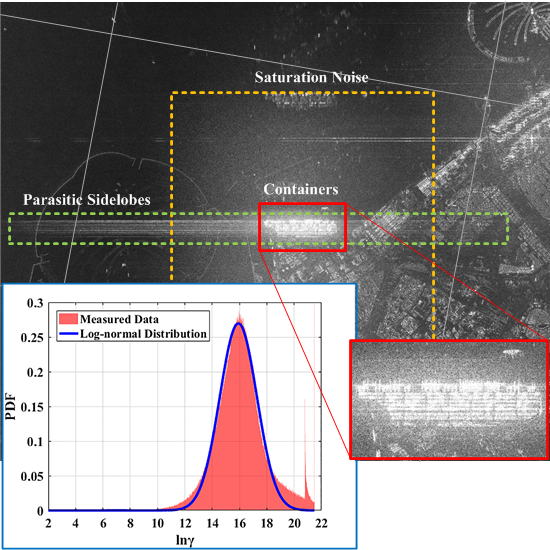
3. Reconstruction Method Based on a Log-Normal Distribution
3.1. Maximum A Posteriori (MAP) Log-Normal Distribution
The log-normal distribution is used in radar detection and has been widely accepted []. As discussed above, the ADC error for scenes with isolated strong targets is mainly caused by saturation, which leads to false objects and parasitic sidelobes in a given range. For special scenes consisting of large isolated dynamic range objects (such as buildings) [], the probability density function of backscattering coefficient is
where and are the mean value and variance of , respectively. As shown in Figure 10, the container slice of Figure 7 is fitted to a log-normal distribution.
Figure 10.
Statistical result for containers. (a) The saturated area with isolated large dynamic range objects. (b) Fitting result for the energy associated with the containers. The two spikes at and are caused by the quantization threshold of the 16-bit complex image.
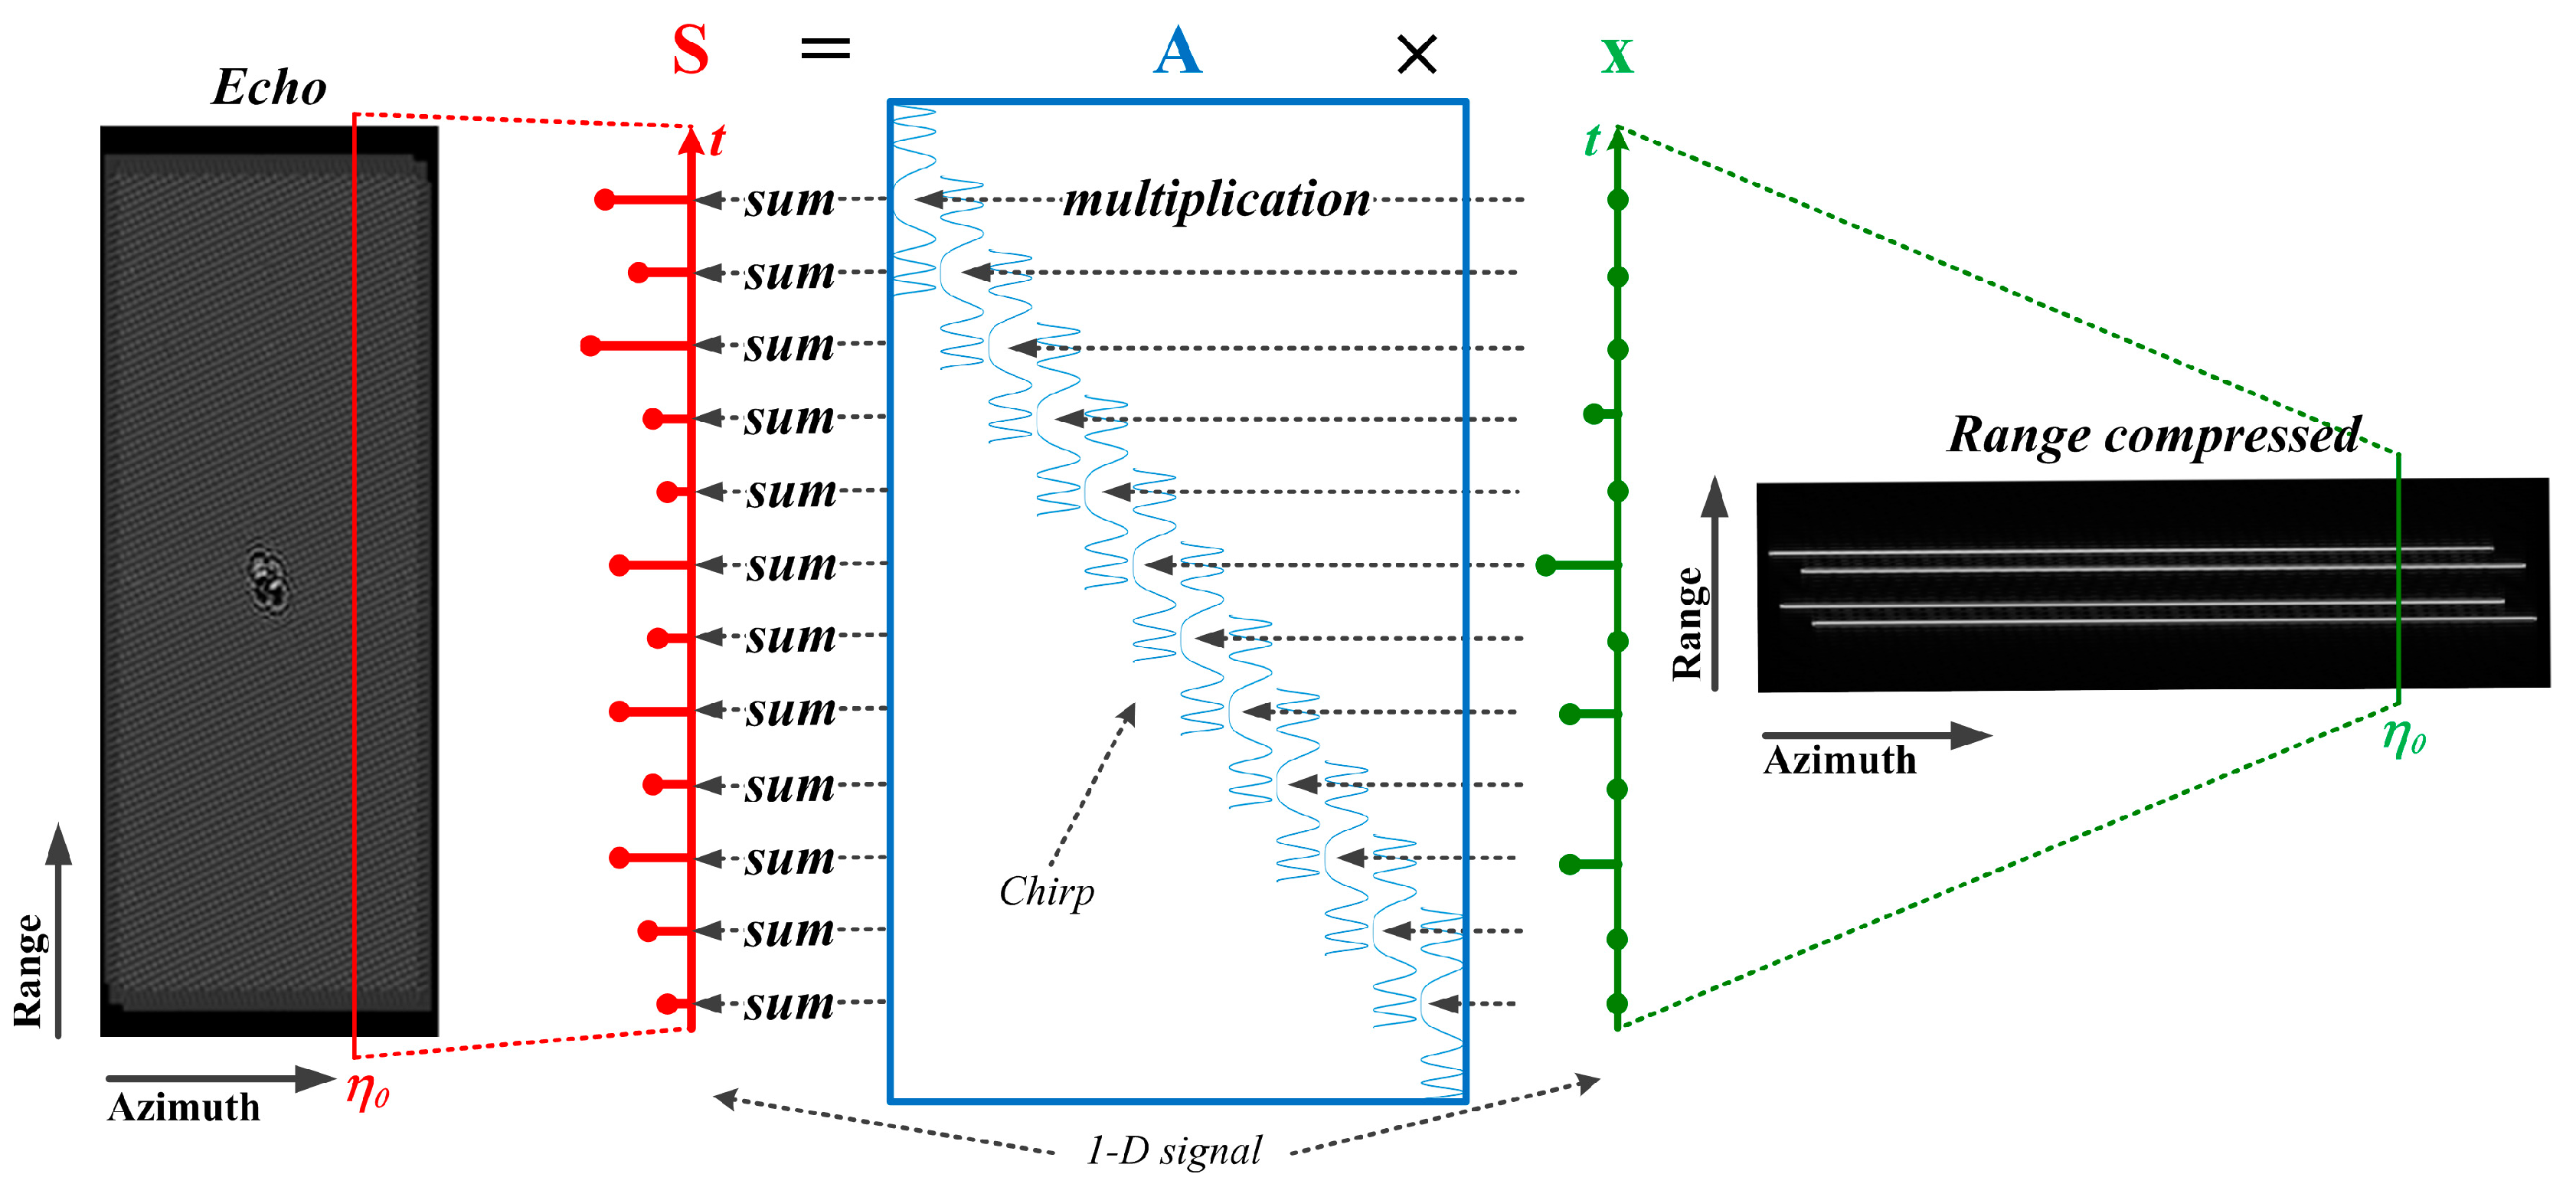
The amplitude of the scatterers obeys the following relation.
For scatterers in a given range , the echo is
where is the pulse width. Based on a discretized representation,
where the vector expresses the scatterers along the range, the amplitudes of which obey , is the echo caused by , matrix is the relationship between and , which can be seen as a cyclic convolution matrix with a chirp signal, and is complex Gaussian white noise with variance []. The relationship between echo and the scatterers along range is shown in Figure 11.
Figure 11.
The relationship between and . There are four point targets at the center of the scene, the echo of which spreads over a wide area, and the range compressed result is four lines. After range migration correction and azimuth compression, we can obtain the focused data.
The MAP version of (12) is as follows.
The estimated result is then
where
There is no explicit solution for Equation (14); however, using an iterative method, we could update , and in Equation (15) and obtain an approximate solution.
3.2. Reconstruction Method for Saturation
Because saturation independently occurs in the real and imaginary parts of the raw data, Equation (12) could be converted to real values []
where and keep the real and imaginary parts of the variables. We still used , , and to express the real values in (16).
According to the values, the raw data can be divided into three types: non-saturated , positive saturated , and negative saturated . The corresponding indexes are , , and .
The matrix in which is row vector could even be divided as shown in Equation (18), and Figure 12 shows the schematic diagram.
Figure 12.
The separation of matrix according to the saturation of signal . All green rows were recombined into matrix , and the red and yellow ones were recombined into matrices and respectively.
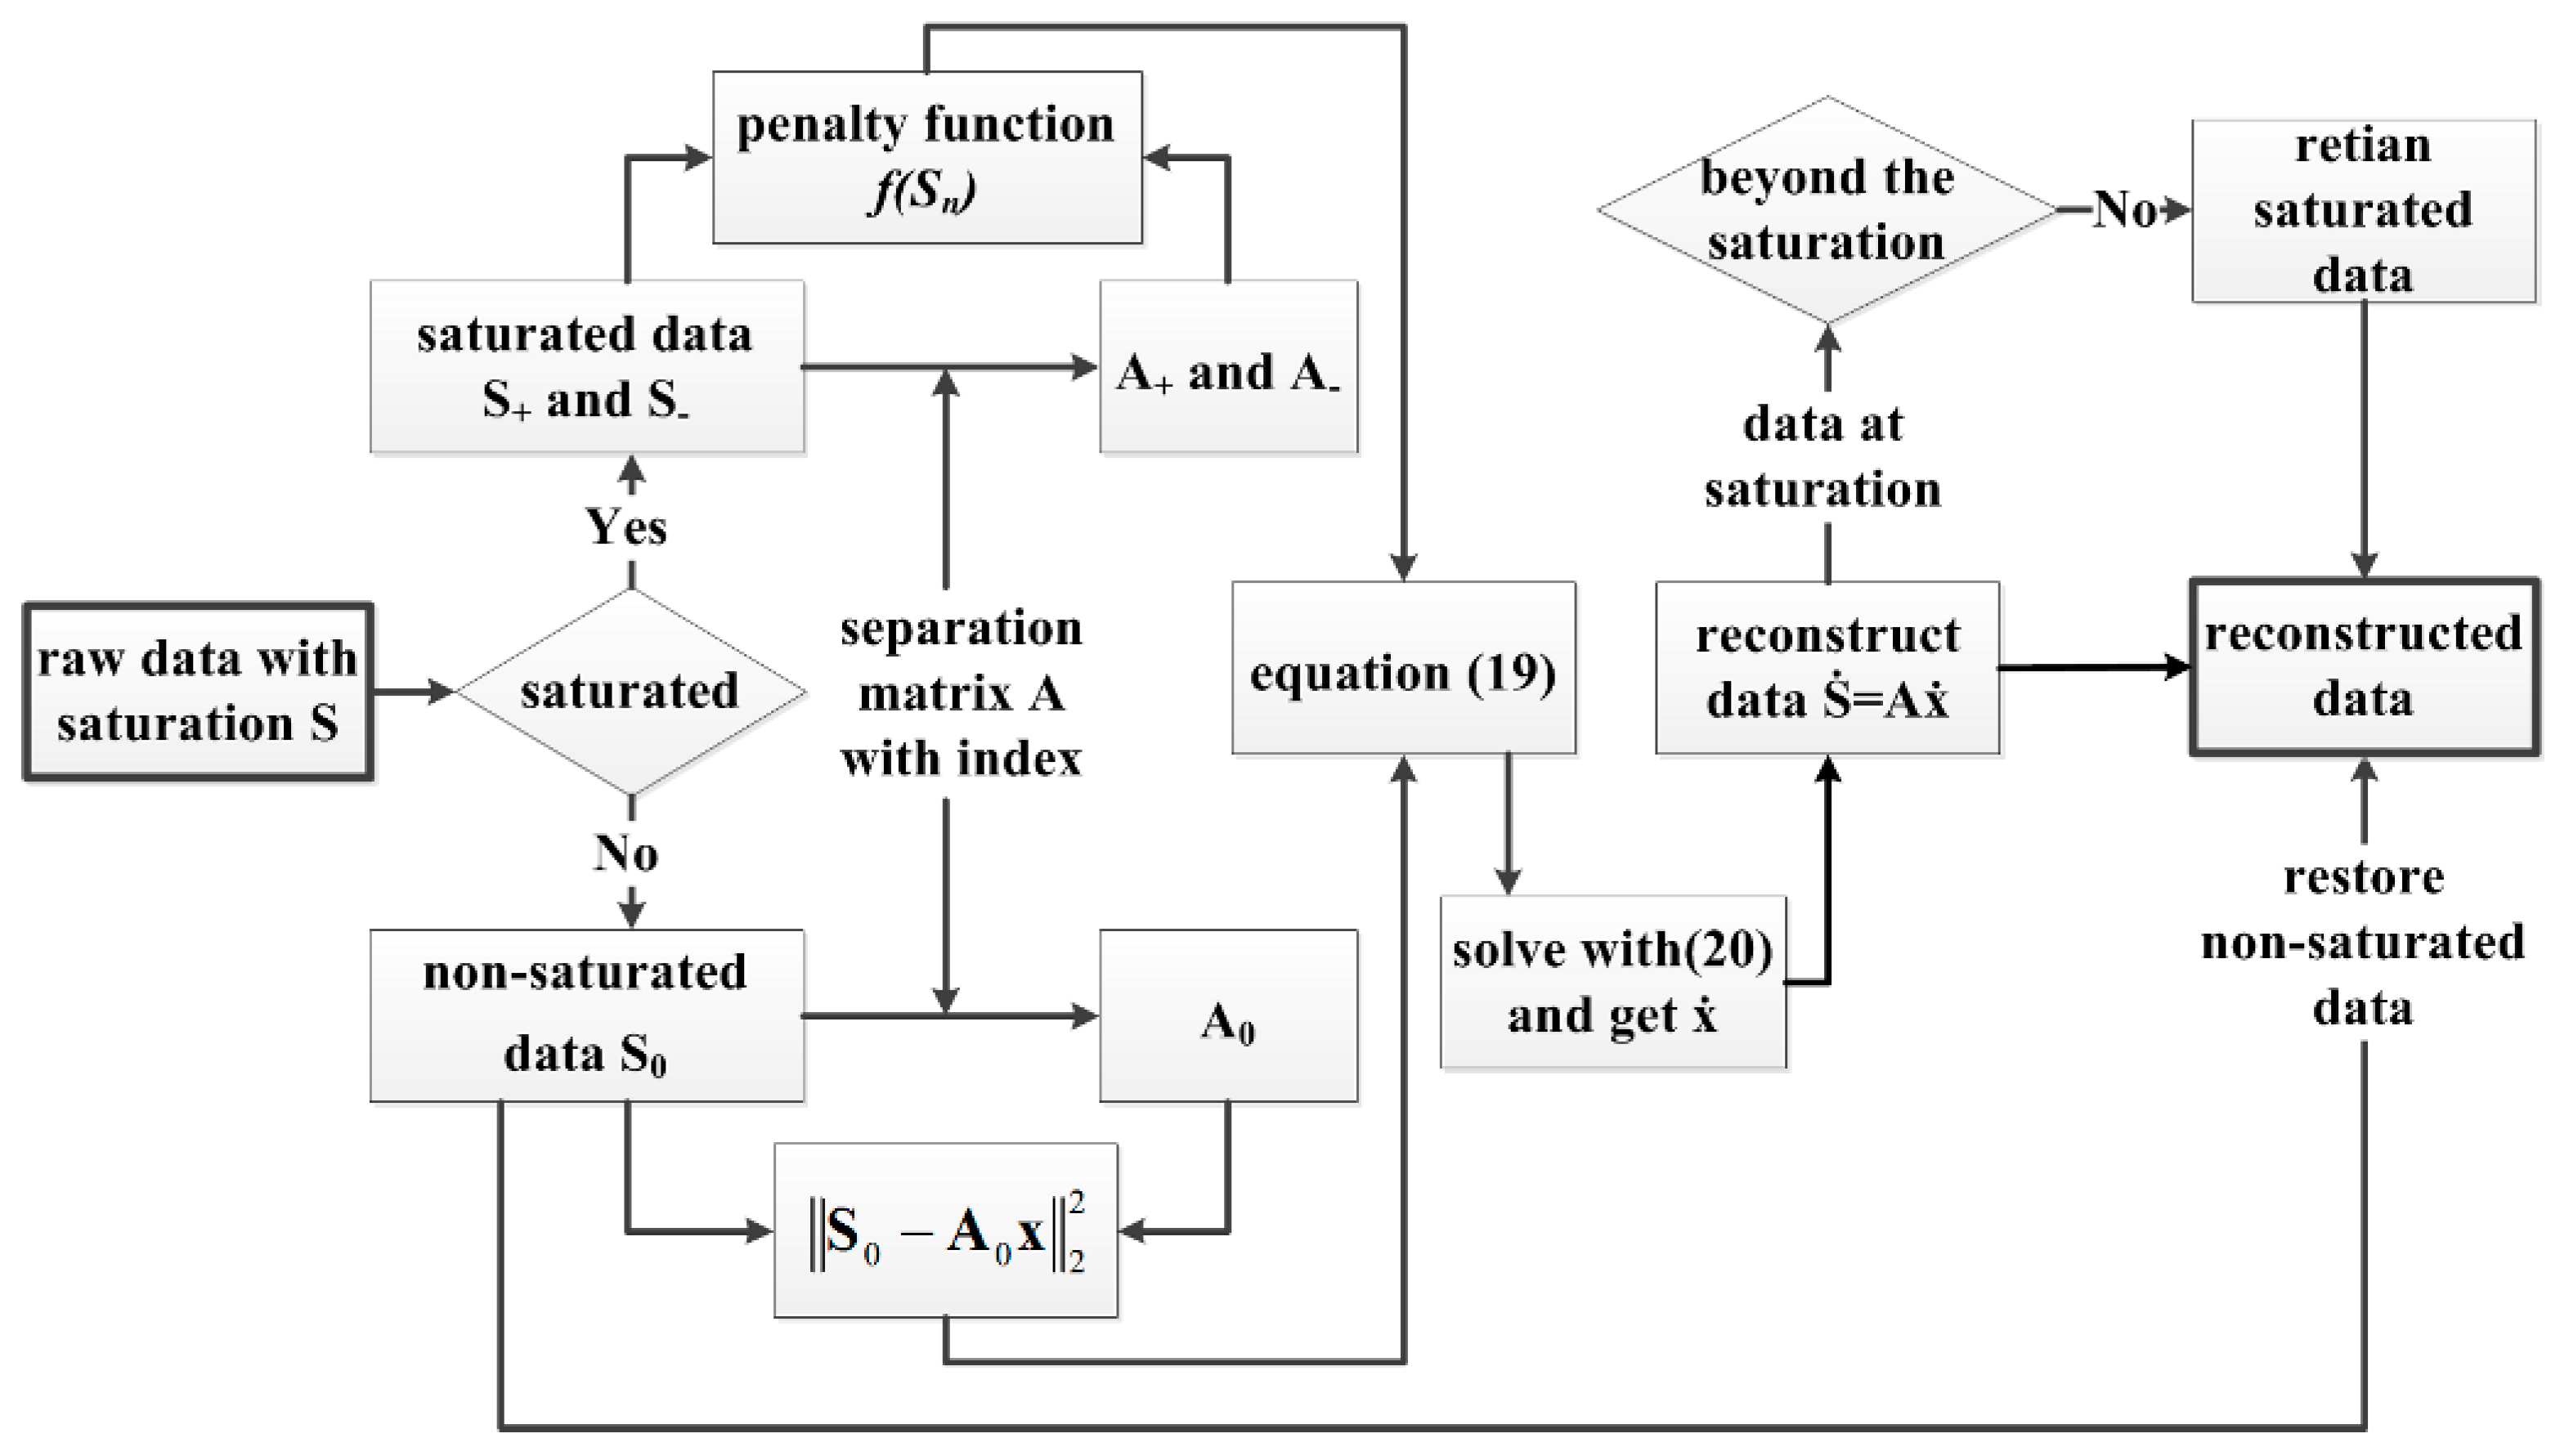
To achieve anti-saturation, the penalty function of the elements in is constructed as follows [].
This equation can be given in matrix form as []
where
and .
Thus, the MAP (13) estimate was revised as
where is the regularization parameter. The estimated result is as follows.
To maintain the unsaturated part of the raw data and reconstruct the saturated values, the reconstruction of the raw data was given by (21).
The workflow of the proposed method is shown in Figure 13. With the reconstructed raw data, traditional imaging algorithms can be used in the follow-up processing.
Figure 13.
Workflow of the proposed method.
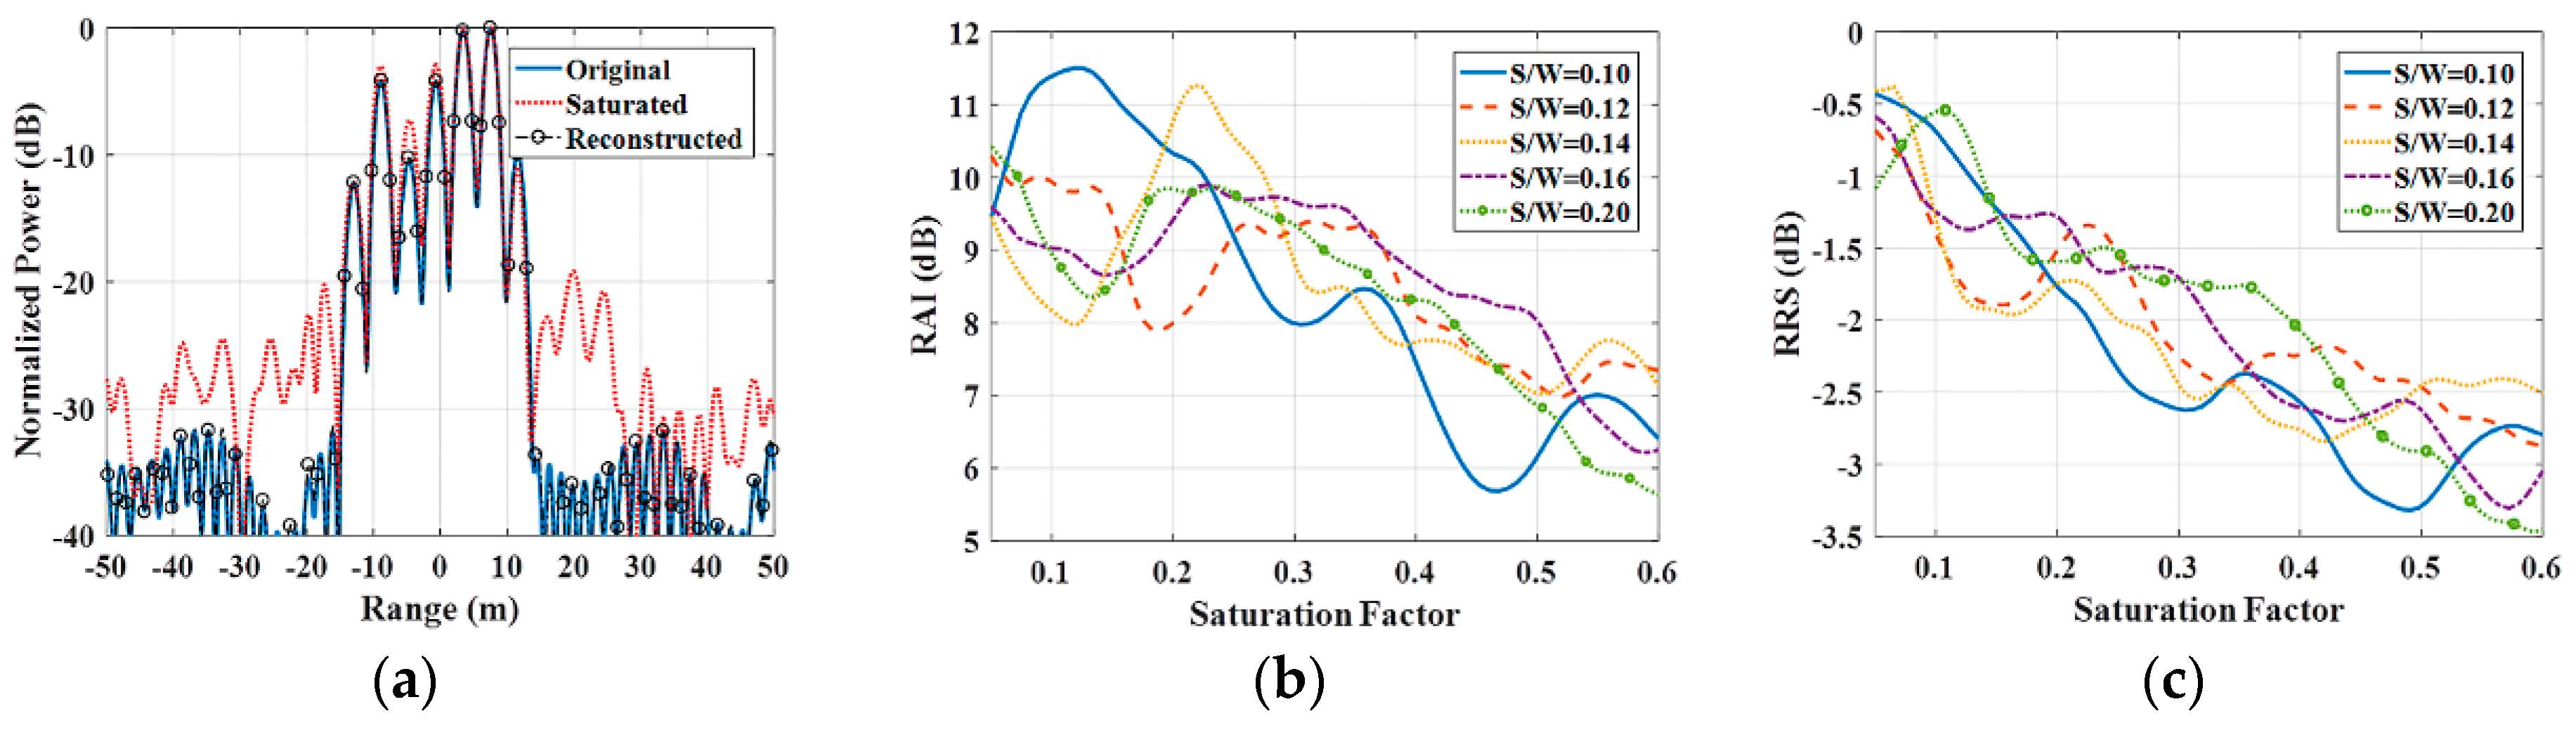
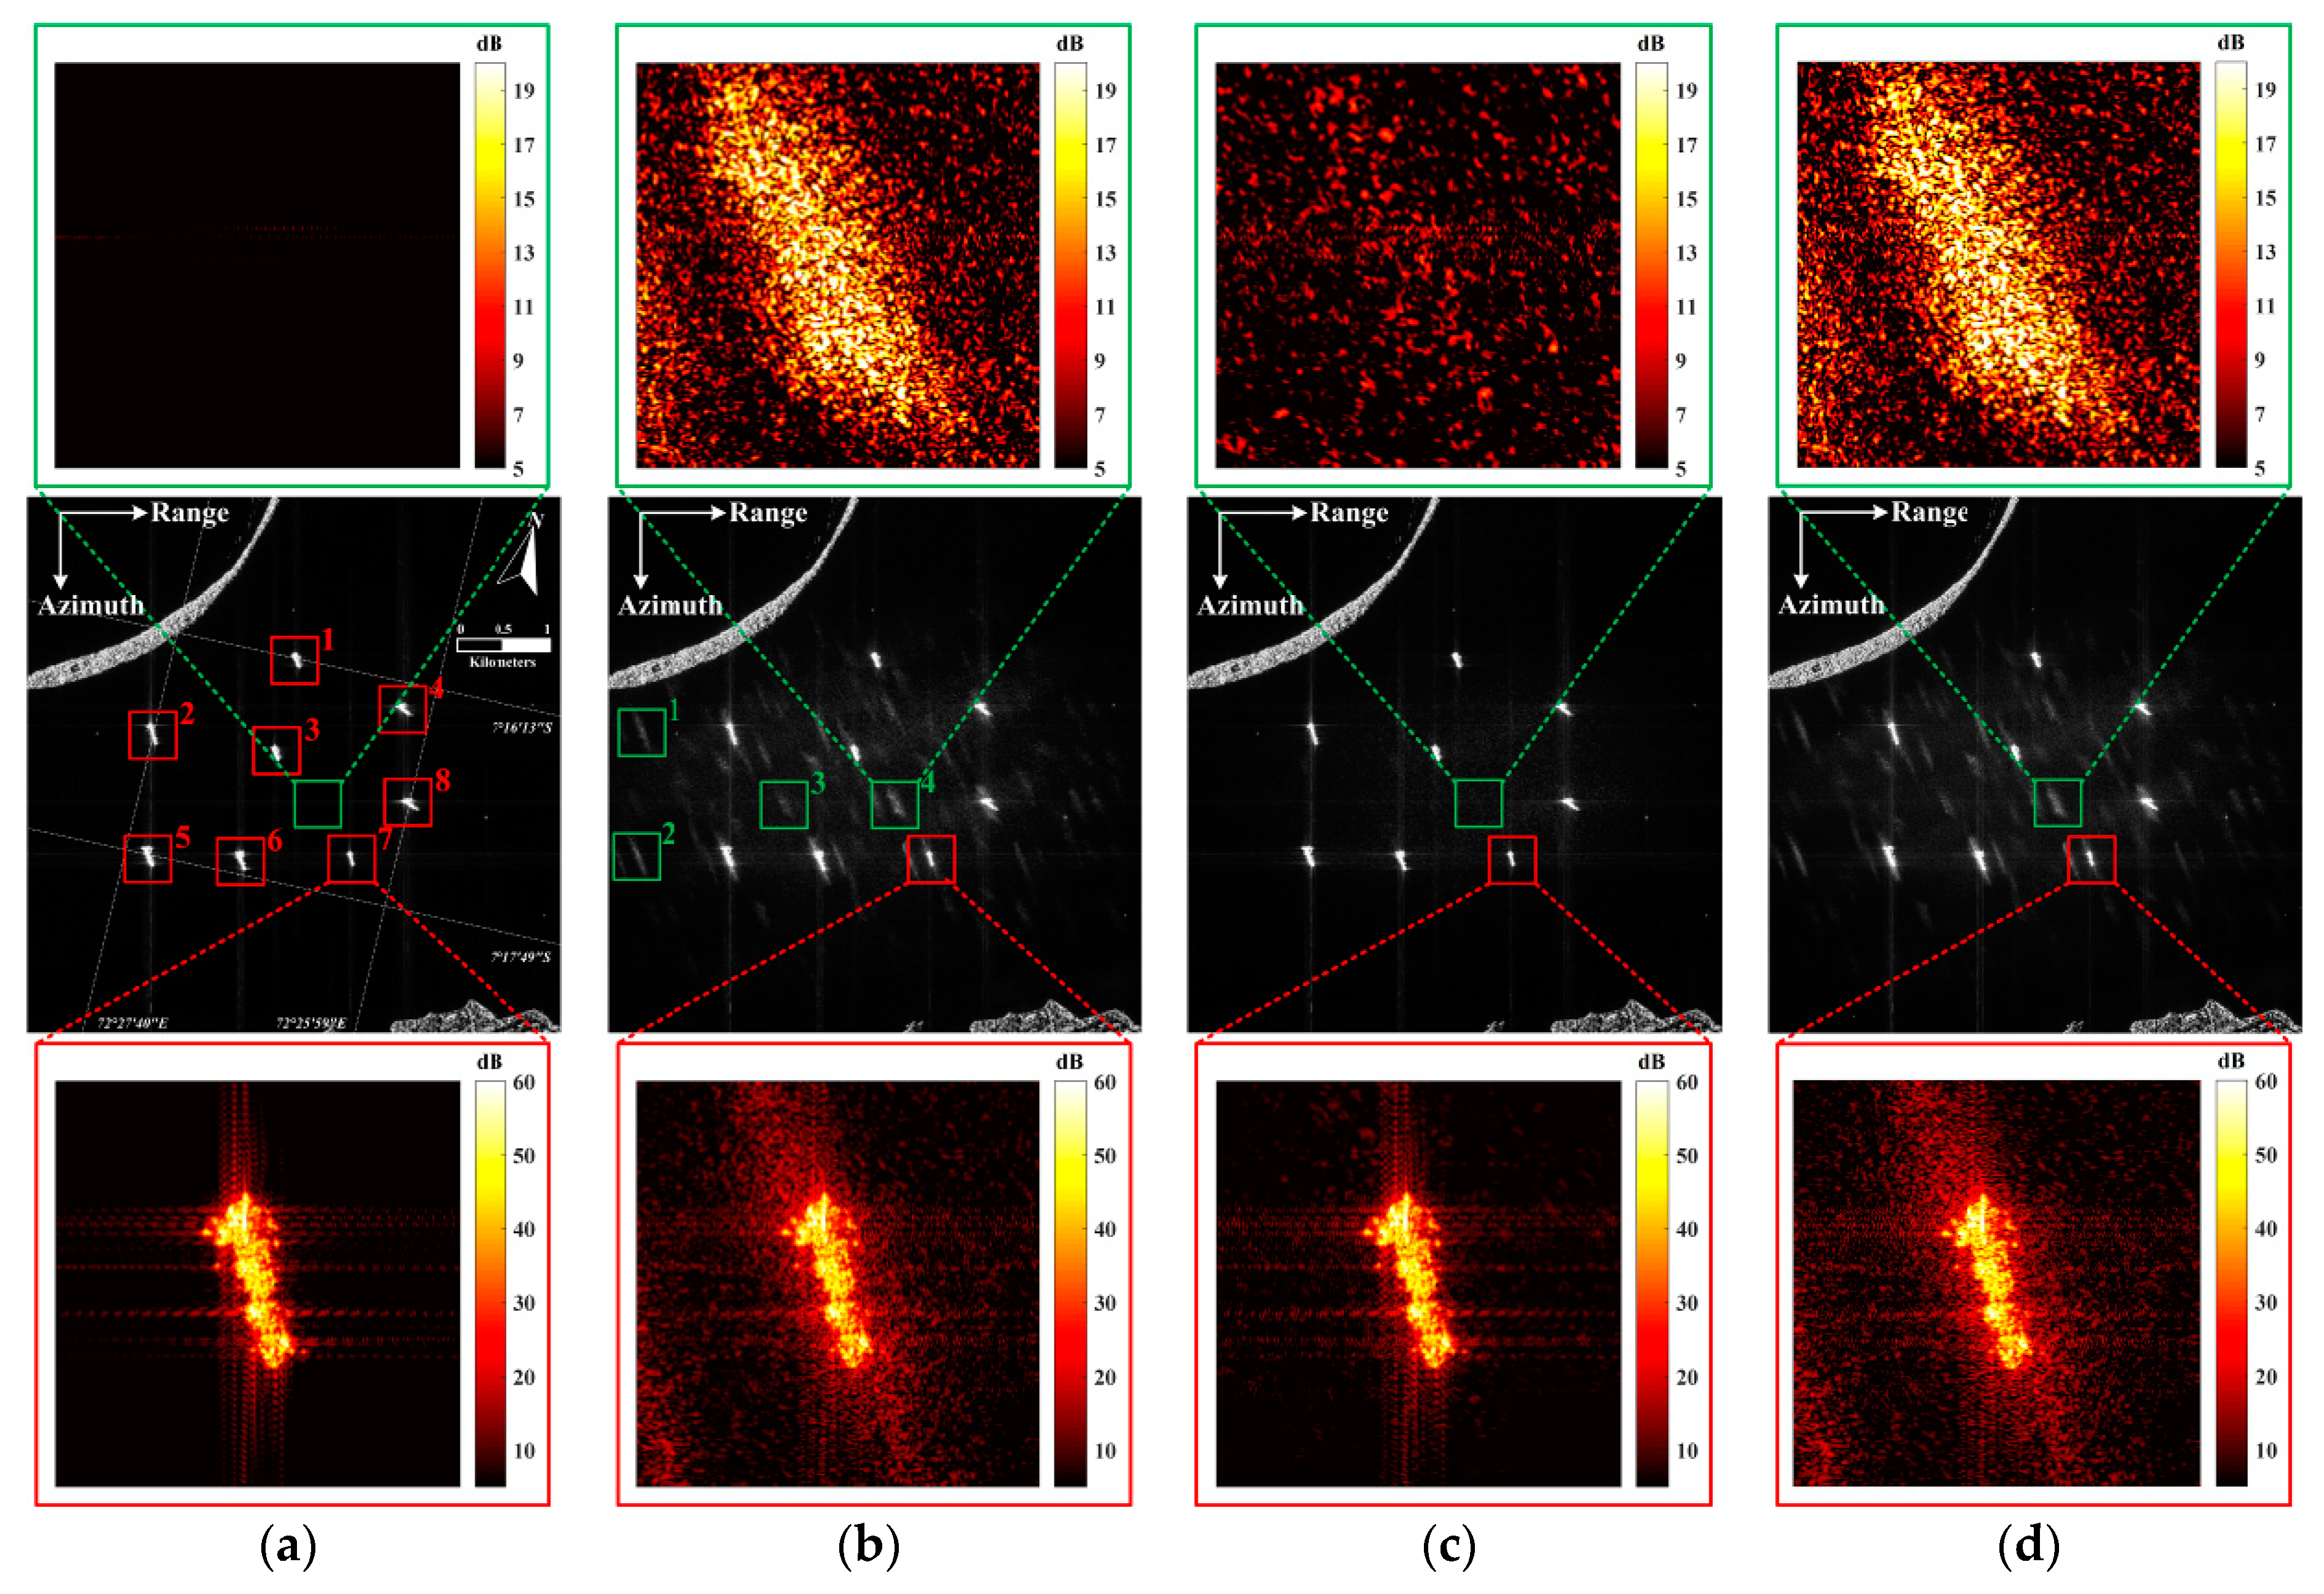
3.3. Accuracy Assessment
We used radiometric accuracy improvement (RAI) to evaluate the reconstruction performance. The RAI value could be calculated as follows.
The relative value of reduced saturation (RRS) was used to evaluate the suppression effect of the false targets and saturated noise within a weak background. Specifically, the RRS was calculated as
where is the complex value of the saturated image, is the complex value of the reconstructed image, and is the complex value of the original image. The larger the RAI and RRS values, the better the reconstruction and the suppression performances.
Because of the nonlinear processing in the proposed method, we used Monte-Carlo simulation to estimate the performance. In this simulation, several strong targets were placed at the center of distributed weak targets, and the ratio of the intensity of strong targets to that of the background was 30 dB. As shown in Figure 14a, with a 30% saturation factor, the reconstructed results had fewer parasitic sidelobes and higher radiometric accuracy than the original image. With different saturation factors and S/W values (i.e., the ratio of the strong target quantity to the weak target quantity), as shown in Figure 14b, the proposed method could improve the RAI by 5 to 10 dB.
Figure 14.
Performance of the proposed method. The ratio of the intensity of strong targets to that of the background is approximately 30 dB. (a) Pulse compression results with a Hamming window and a 30% saturation factor for the raw data. (b) RAIs for different saturation factors and S/W ratios. (c) RRSs for different saturation factors and S/W ratios. RAI stands for Radiometric Accuracy Improvement. S/W stands for the ratio of the Strong target quantity to the Weak target quantity. RRS stands for Relative value of Reduced Saturation.
4. Experiments and Analyses
4.1. One-Dimensional Pulse Compression
The parameters of the one-dimensional experiment are shown in Table 1, and the pulse compression result was weighted with a Hamming window to exclude traditional sidelobes.
Table 1.
One-dimensional simulation parameters.
There are two strong point targets and one weak target at the center of the scene. As shown in Figure 15, with a 50% saturation factor, the raw data was severely distorted, and the false target caused by the saturated targets covered the real weak target. Using the proposed method, the reconstructed raw data perfectly fitted the unsaturated raw data, and the weak target reappeared at the correct position.

Figure 15.
Simulation of 1D pulse compression with a 50% saturation factor. (a) The real part of the raw data. (b) The amplitude of the raw data. (c) The phase of the raw data. (d) Pulse compression results with a Hamming window.
4.2. Simulation Based on the Real SAR Data
The real SAR data were used here to verify the effectiveness and performance of the proposed method. Because this method is robust under different circumstances, the data from varieties of SAR platforms (with different carrier frequencies and resolutions) should be covered in simulations. However, most users seldom have access to the SAR raw data. Therefore, both the raw data and the focused data were used in the simulations. The only difference between the raw data and the focused data is that the former were directly implemented with saturation error, while the latter should be converted into raw data through radar echo simulation first and then undergo saturation.
During the implementation of saturation, the real part and imaginary part of the echo were separated at first. Any data of these two parts beyond the saturated threshold were set to the threshold value and then recombined into the saturated raw data. Then, the reconstructed raw data could be obtained with the proposed method. Finally, the reconstructed data were processed with the traditional chirp scaling imaging algorithm.
In comparative experiments, power loss compensation (PLC) factors refer to the theoretical curve in Figure 6 for traditional power loss compensation processing.
4.2.1. Simulations Based on the Real Focused Data
With the parameters listed in Table 2, we simulated the original image (in Figure 16a) with backscattering coefficients from TerraSAR-X data with 1 m resolution. The image contained isolated strong targets (marked with red boxes) and was free from saturation issues. Figure 16, Table 3 and Table 4 give the comparison results.
Table 2.
Echo simulation parameters of TerraSAR-X.
Figure 16.
Simulation based on real focused data. The original image is from the SLiding spotlight (SL) mode of TerraSAR-X (resolution 1 × 1 m), and the resolution of the simulated image is 3 × 3 m. (a) The non-saturated simulation image. (b) Saturated simulation image, in which there is a series of false targets, with a 9.7% saturated factor. (c) Reconstructed result using the proposed method. (d) Reconstructed result using power loss compensation (PLC factor 1.25).
Table 3.
RAIs of the real targets in red boxes.
Table 4.
RRSs of the false targets in green boxes.
With the parameters listed in Table 5, another simulation result with ALOS-2 focused data is shown in Figure 17. And Table 6 and Table 7 give the comparison results.
Table 5.
Echo simulation parameters of ALOS-2.
Figure 17.
Simulation based on real focused data. The original image is from the Ultra-Fine (UF) mode of ALOS-2 (resolution 3 × 3 m), and the resolution of the simulated image is 6 × 6 m. (a) Non-saturated simulation image. (b) Saturated simulation image, in which there is a series of false targets, with a 22% saturated factor. (c) Reconstructed result with proposed method. (d) Reconstructed result using the power loss compensation (PLC factor 1.56).
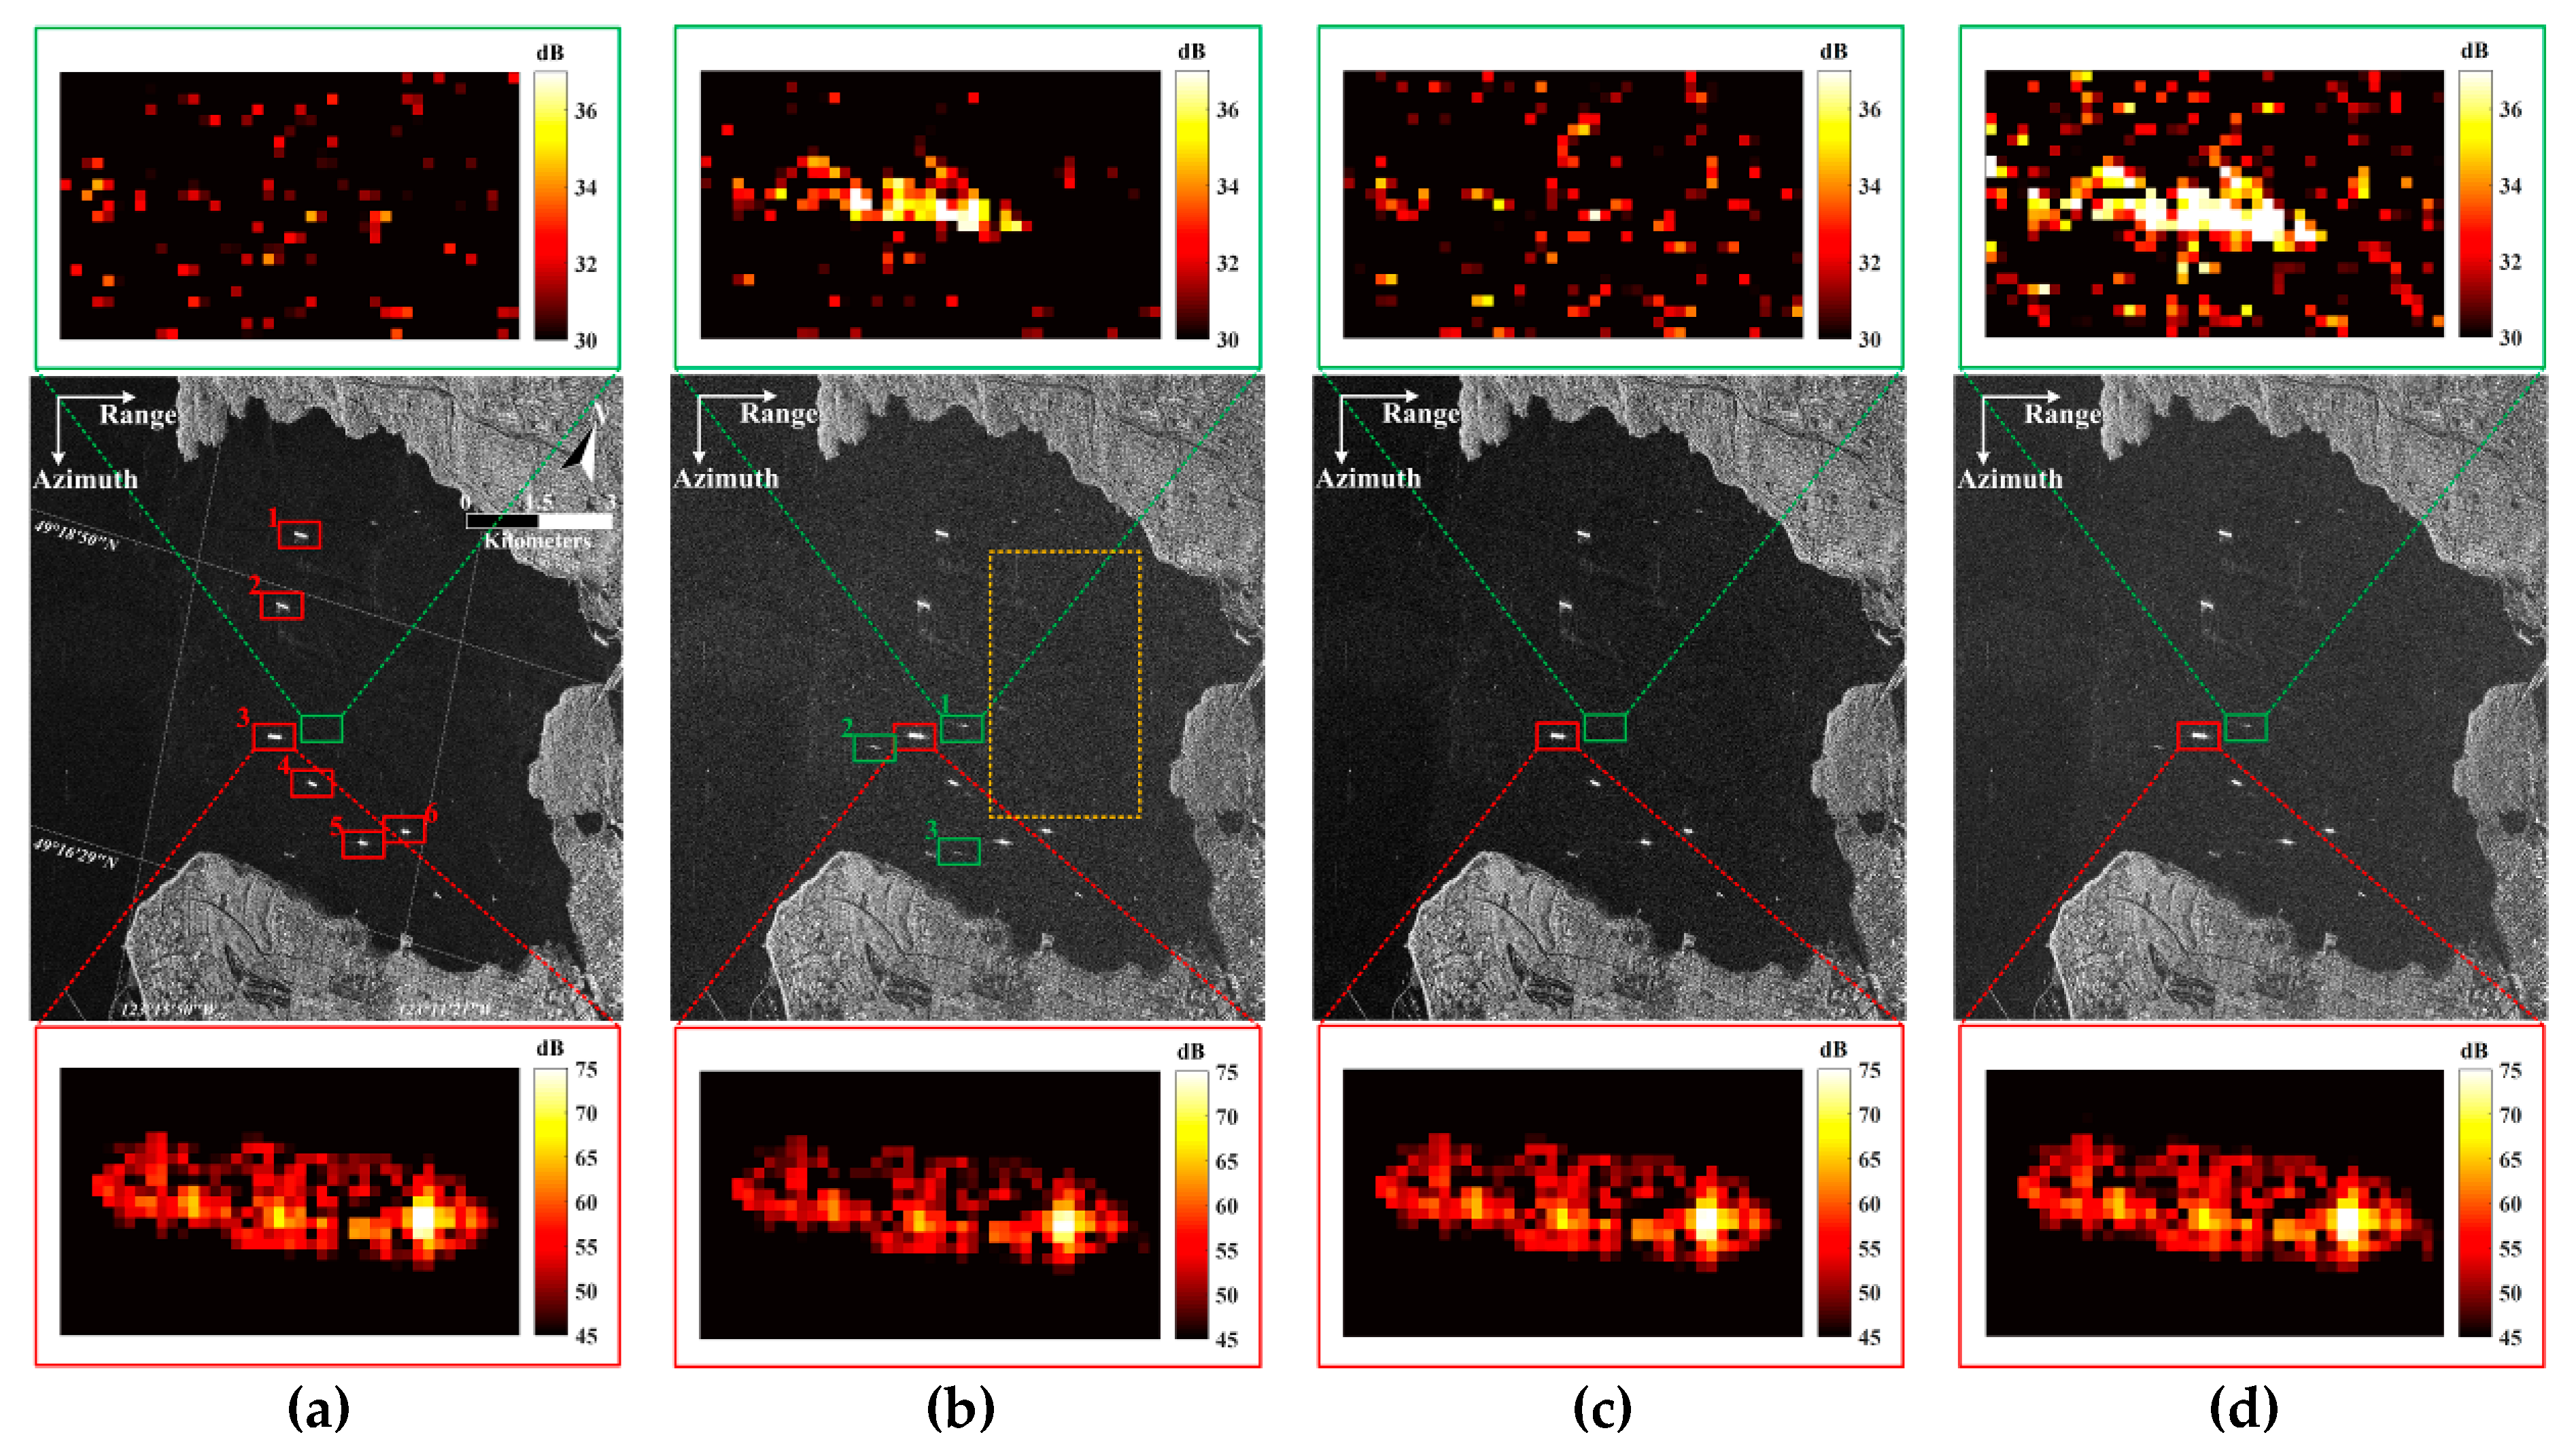
Table 6.
RAIs of the real targets in red boxes.
Table 7.
RRSs of the false targets in green boxes.
Compared with Figure 16a and Figure 17a, the saturated images in Figure 16b and Figure 17b became noisy, and obvious false targets (marked with green boxes) were caused by harmonics. In addition, isolated strong targets, which are generally areas of focus, were distorted, especially at the image edges (shown in the enlarged part of Figure 16b), resulting in difficulties in detection and recognition. After reconstructed processing with the proposed method, the false targets caused by saturation were effectively suppressed, and the real targets were recovered, as shown in the enlarged portions of Figure 16c and Figure 17c. Meanwhile, the reconstructed results with power loss compensation, which is regarded as a classical anti-saturation method [,], are presented in Figure 16d and Figure 17d for comparison. It is obvious that, although PLC could recover the energy loss of the image, false targets still existed, as shown in the enlarged portions of Figure 16d and Figure 17d. We calculated the RAIs of the saturated and compensated images for the isolated strong targets listed in Table 3 and Table 6. The results indicate that the RAI was improved by 9.47 and 12.96 dB and 10.69 and 10.43 dB on average for the proposed method and PLC, respectively, which confirms the better performance of the proposed method. Moreover, the improvement of RAI coincides with the theoretical compensation precision discussed above. Table 4 and Table 7 suggest that the mean energy of false targets was effectively suppressed by 8.16 and 0.61 dB with the proposed method (compared with an increase of 0.43 and 2.22 dB for PLC), which significantly improves image quality.
4.2.2. Simulation Based on Real Raw Data
When reasonable a priori information was used, the proposed method overcame the limitation of sparse expression [,] and was applied to complex scenes, such as in Figure 18a (with various natural and artificial features). This experimental area was chosen from the RADARSAT-1 raw data in [] of English Bay, because it encompasses a large dynamic range where saturation issues are likely to occur. To simulate saturation, the real and imaginary parts of the signal were limited by a threshold of four times the standard deviation of the one from the sea. The saturation factor of the land was 25%.
Figure 18.
Simulation based on a real SAR raw data from Radarsat-1. All images were quantized with the same method. (a) Imaging result for the original data. (b) Imaging result for the saturated data with a 25% saturation factor. This image contained a series of false targets beside ships and considerable noise in sea areas. (c) The reconstructed result with the proposed method. (d) The reconstructed result with power loss compensation (PLC factor 1.67).
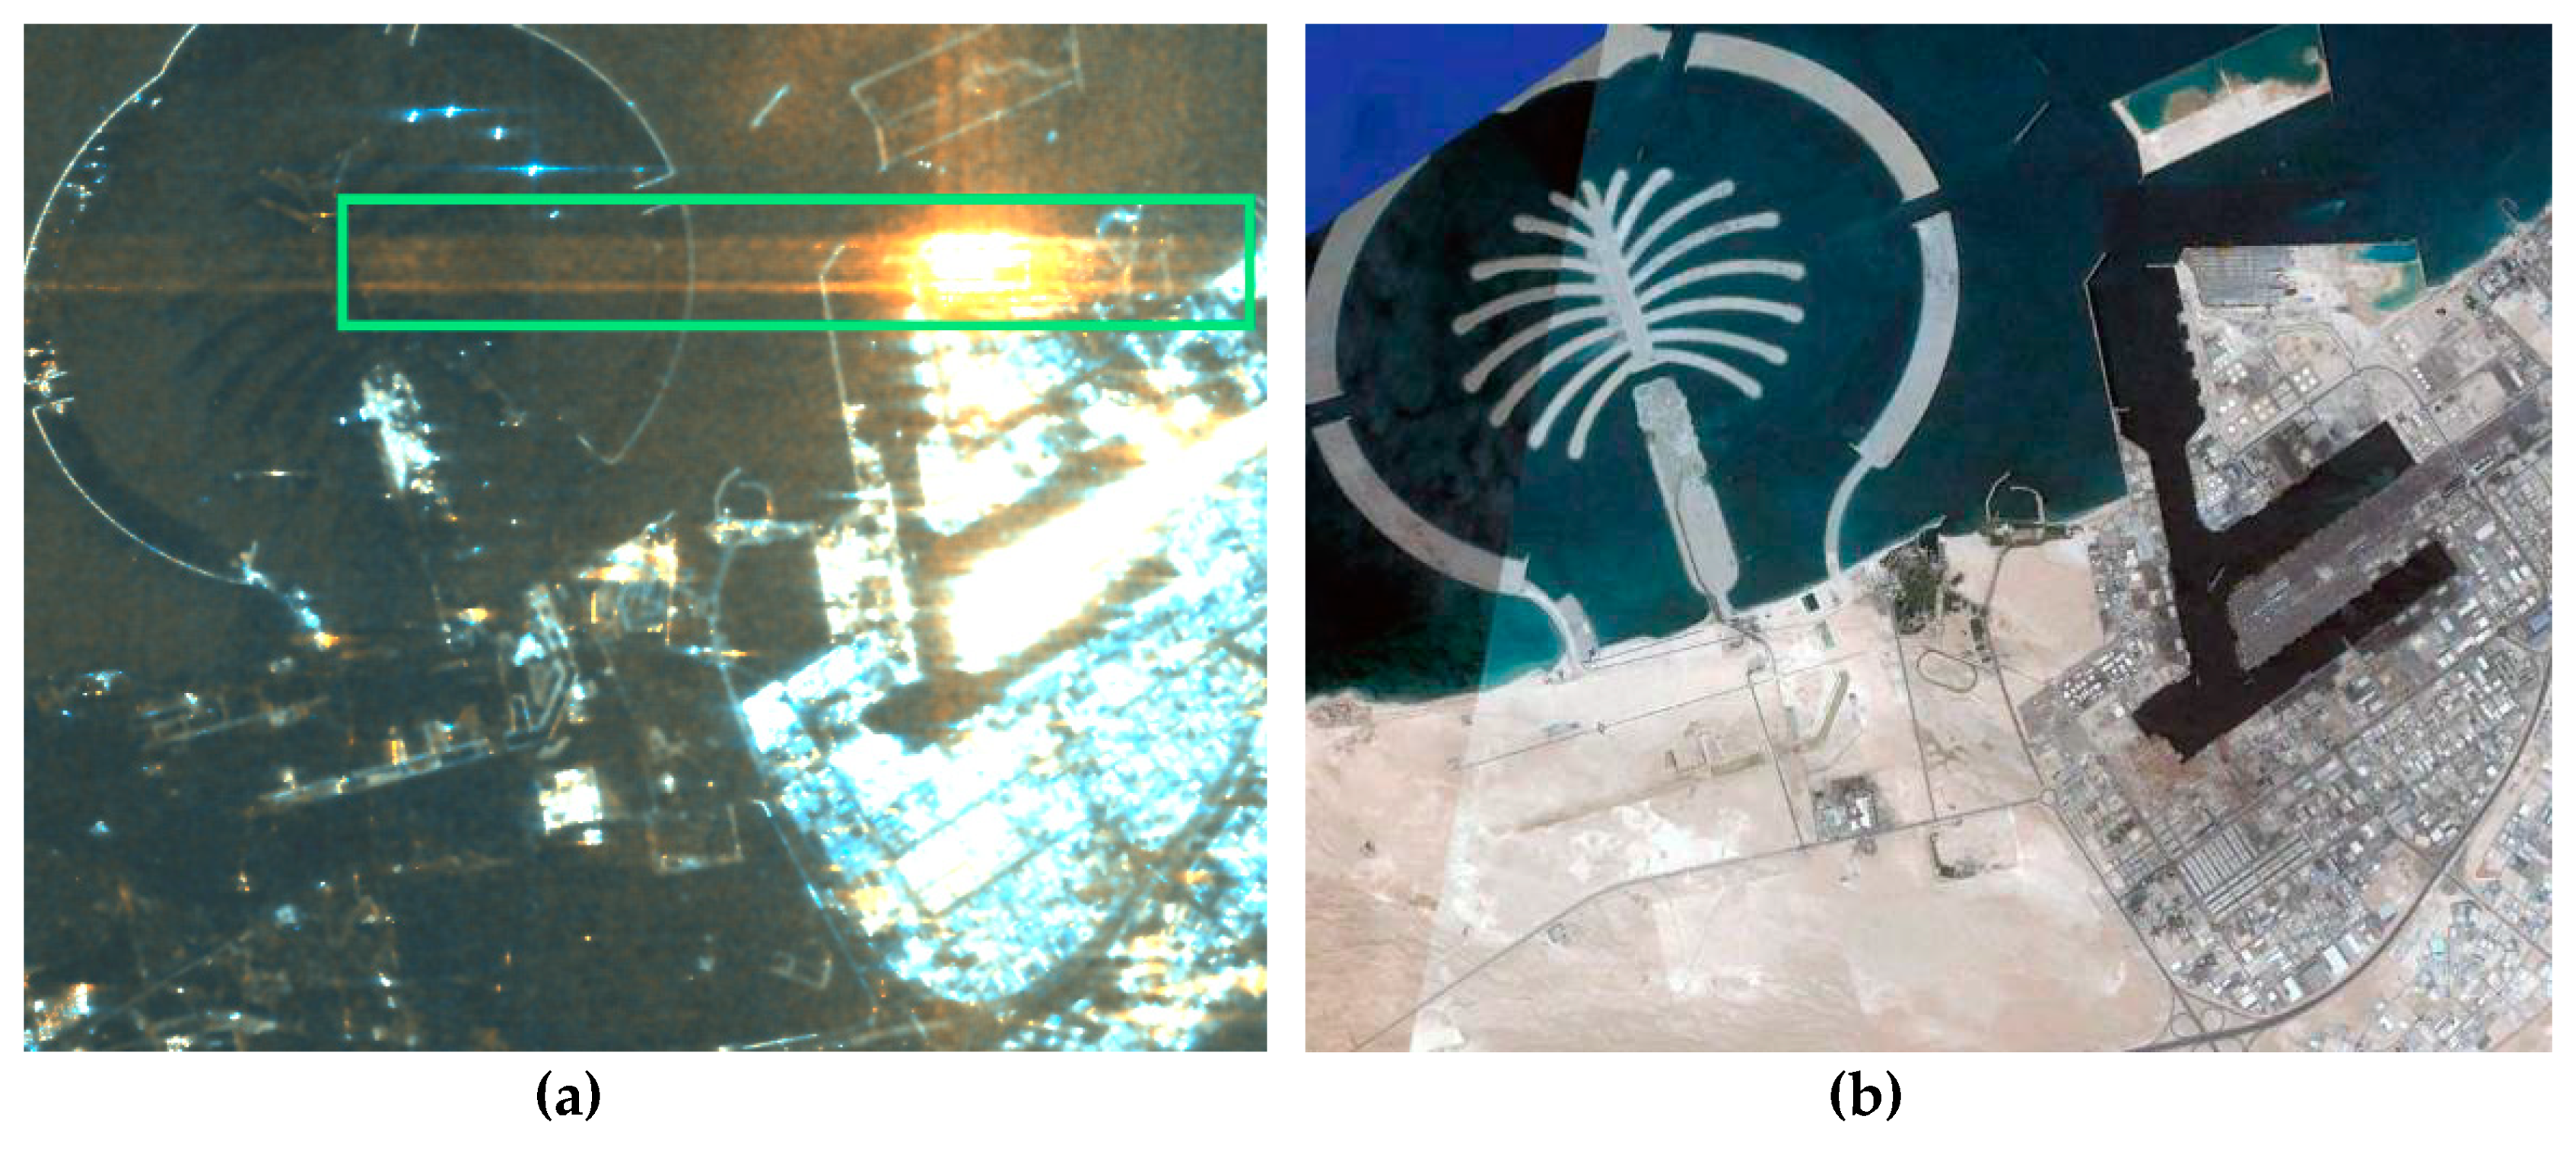
In Figure 18b, the saturated image became brighter (especially in the sea area marked with yellow boxes), and false targets appeared (marked with green boxes) that were not in the original image in Figure 18a. Similarly, the edges of the isolated strong targets (marked with red boxes) became fuzzy, as can be clearly seen in the enlarged view of Figure 18b. After reconstruction with the proposed method, the image (in Figure 18c) recovered perfectly, the luminance decreased, and false targets vanished. Moreover, the isolated strong targets were well preserved compared with those in Figure 18a, and results compensated for with PLC are also shown in Figure 18d. The energy loss of strong targets could be compensated for by using PLC, but the energy of the false targets and the saturated background were improperly strong. To obtain a quantitative reconstruction result, we calculated the RAIs of the saturated and compensated images for strong isolated targets (red boxes), as listed in Table 8. The results indicate that the RAI was improved by 9.18 dB on average for the proposed method and by 6.98 dB for PLC, which supports the results in the performance curve in Figure 14b. In addition, the mean energies of false targets (green boxes) and the scene (yellow box) decreased by 0.56 dB (in Table 9) and 0.20 dB, respectively, verifying the effectiveness of the proposed method for complex scenes. In contrast, the energies of false targets and the scene were increased by 3.08 dB with PLC due to the overall power compensation.
Table 8.
RAIs of the real targets in red boxes.
Table 9.
RRSs of the false targets in green boxes.
5. Discussion
The false targets and radiometric losses caused by ADC saturation in SAR images can lead to serious mistakes about classification and recognition of targets in SAR applications. Figure 19 shows a polarimetric decomposition mistake, in which the containers on the top leads to a larger red area (marked with a green box), which represents incorrect backscattering characteristics. Because the echo from the HV channel, which mainly carries volume scattering information, is much weaker than that from the HH channel, which mainly carries the double bounce scattering information, ADC saturation happens in the latter. Thus, parasitic sidelobes beside the containers caused by harmonic distortion are improperly identified as artificial objects in the decomposition results, and traditional PLC processing cannot suppress them.
Figure 19.
Polarimetric decomposition mistake caused by ADC saturation. The containers on the top lead to a larger area with orange than the truth. (a) Dual-polarized image from ALOS-1 at Dubai. (Red), (Green), (Blue). (b) Optical image. stands for horizontal-horizontal polarization. stands for horizontal-vertical polarization.
As shown in Section 4, the proposed method performs better than the traditional PLC. Because the false targets are treated as real targets when counting the energy loss caused by saturation, indiscriminate power loss compensation is conducted in traditional processing on both the real and false targets. Thus, the energy is falsely reinforced rather than eliminated. In contrast, the proposed method reconstructs the saturated raw data but not for image processing; thus, the false targets could be clearly distinguished from the real ones and then suppressed in the focused data.
Using a log-normal distribution to describe a large dynamic range scene is key in this article. The echo from a small quantity of strong targets disrupts the receiver, and also opens up the possibility to rebuild them. We consider two reasons that the algorithm can reconstruct the raw data accurately, even if some information is lost in saturation:
(1) For a scene obeying a log-normal distribution, there are two kinds of scatterers: a. distributed weak background, and b. isolated strong targets. With the appropriate amplification factor, the echo from the background should be among the quantization thresholds, and the echo from the strong targets periodically exceeds the thresholds which causes harmonic distortion. The algorithm reconstructs only the saturated part of the raw data and retains the non-saturated data. Thus, the weak background without harmonic distortion is not obviously affected by reconstructed processing. Moreover, as analyzed in Section 2.2, the phase error of the saturated data does not exceed , and at the last step of the algorithm, the phase is still controlled in the effective focus range; thus, the focusing result does not result in a loss of resolution.
(2) The small number of strong but sparse targets leads to information redundancy; thus, strong targets can be obtained from the raw data with information loss. The addition of a priori information (log-normal distribution) and a penalty function reinforce the advantage of the algorithm.
However, if the distribution of the scene is not log-normal but rather chi-squared (which is a uniform distributed target), the saturation cannot be very serious, as the VGA works well.
With the rapid development of electronic devices and the continuous optimization of control strategies, saturation errors are not very common in modern spaceborne SAR systems. However, if these errors occur, lost information cannot be retrieved by relying on a single observation, and control systems adjust only at the next observation. Therefore, we find the saturation phenomenon in some large dynamic range scenes. To ensure the timeliness of observation, the saturation reconstruction algorithm is still worthy of study. In the future, remote sensing data will surge rapidly, driven by a high resolution and a wide swath, and it will be accompanied by sampling and transmitting pressures. Therefore, ADC error with a low bit rate will come into focus. Moreover, interplanetary probes cannot achieve high-speed sampling because of the limitations of power consumption and transmission. The proposed method can solve the saturation problem based on data and simplify the hardware platform, which will help address these challenges.
6. Conclusions
In this paper, for large dynamic range scenes, we propose an anti-saturation algorithm that can reconstruct saturated raw data. This method can be used to improve the quality of images that have been polluted by saturation and to reduce the complexity of the radar receiver.
The echo from isolated strong targets results in a chaotic receiver and leads to saturated raw data. Traditional PLC methods compensate for only the energy loss in the focused data but cannot deal with false targets and saturation noise. We use a log-normal distribution to describe particular scenes consisting of weak backgrounds and strong isolated targets, such as buildings on vegetation and ships in bays, and find that the harmonic distortion caused by the isolated scatterers and ADC saturation is the main cause of false targets.
Using the statistical distribution of complex scenes as a priori information, a regularization algorithm is proposed to simultaneously compensate for the saturated values in the raw data and retain the non-saturated values. Thus, the details of the weak background are kept well, and the isolated strong targets with sparsity are reconstructed. Compared to PLC, the proposed method can improve the radiometric accuracy of real targets with better performance and effectively suppress the false targets and saturation noise. Through Monte Carlo simulation, this method can improve the radiometric accuracy by 5 to 10 dB and effectively suppress the energy of false targets caused by harmonic distortion. Based on TerraSAR-X, ALOS-2, and Radarsat-1 data, the effectiveness and robustness of the proposed method are verified via simulation.
Author Contributions
Conceptualization, P.X.; formal analysis, P.X.; methodology, P.X.; resources, W.C.; validation, M.L.; visualization, W.G.; writing—original draft, P.X.; writing—review and editing, W.G.
Funding
This research received no external funding.
Acknowledgments
This work was supported in part by the Innovation Workstation of Qian Xuesen Lab.
Conflicts of Interest
The authors declare no conflict of interest.
References
- Curlander, J.C.; Mcdonough, R.N. Synthetic Aperture Radar: Systems and Signal Processing; Wiley: New York, NY, USA, 1991. [Google Scholar]
- Mittermayer, J.; Younis, M.; Metzig, R.; Wollstadt, S.; Martinez, J.; Meta, A. TerraSAR-X System Performance Characterization and Verification. IEEE Trans. Geosci. Remote Sens. 2010, 48, 660–676. [Google Scholar] [CrossRef]
- Kwok, R.; Johnson, W.T.K. Block adaptive quantization of Magellan SAR data. IEEE Trans. Geosci. Remote Sens. 1989, 27, 375–383. [Google Scholar] [CrossRef]
- Benz, U.; Strodl, K.; Moreira, A. A comparison of several algorithms for SAR raw data compression. IEEE Trans. Geosci. Remote Sens. 1995, 33, 1266–1276. [Google Scholar] [CrossRef]
- Malz, E.; Scheiber, R.; Mittermayer, J.; Snoeij, P.; Attema, E. Sentinel-1 FDBAQ performance validation using TerraSAR-X data. In Proceedings of the 2012 IEEE International Geoscience and Remote Sensing Symposium, Munich, Germany, 22–27 July 2012. [Google Scholar]
- Gray, G.A.; Zeoli, G.W. Quantization and Saturation Noise Due to Analog-to-Digital Conversion. IEEE Trans. Aerosp. Electron. Syst. 1971, AES-7.1, 222–223. [Google Scholar] [CrossRef]
- Mirmak, E.; Blumgold, R.; Grimes, G. Quantization and saturation noise due to analog-to-digital conversion of radar returns from targets with log-normal radar cross-section distributions. IEEE Trans. Aerosp. Electron. Syst. 1977, 5, 546–548. [Google Scholar] [CrossRef]
- Max, J. Quantizing for minimum distortion. IRE Trans. Inf. Theory 1960, 6, 7–12. [Google Scholar] [CrossRef]
- Rizzoli, P.; Bräutigam, B.; Wollstadt, S.; Mittermayer, J. Radar Backscatter Mapping Using TerraSAR-X. IEEE Trans. Geosci. Remote Sens. 2011, 49, 3538–3547. [Google Scholar] [CrossRef]
- Meadows, P.J.; Wright, P.A. ERS-1 SAR analogue to digital convertor saturation. In Proceedings of the CEOS SAR Calibration and Validation Workshop, Ann Arbor, MI, USA, 28–30 September 1994; pp. 24–37. [Google Scholar]
- Martone, M.; Brautigam, B.; Krieger, G. Quantization Effects in TanDEM-X Data. IEEE Trans. Geosci. Remote Sens. 2014, 53, 583–597. [Google Scholar] [CrossRef]
- Nicoll, J.; Gens, R.; Denny, P. Pre-processing compensation for saturation power loss in SAR data. In Proceedings of the IEEE International Geoscience and Remote Sensing Symposium, Toronto, ON, Canada, 24–28 June 2002; pp. 2744–2746. [Google Scholar]
- Shimada, M. Radiometric correction of saturated SAR data. IEEE Trans. Geosci. Remote Sens. 1999, 37, 467–478. [Google Scholar] [CrossRef]
- Vachon, P.W.; Gray, A.L.; Livingstone, C.E.; Luscombe, A.P. Adaptive compensation of RADARSAT SAR analogue-to-digital converter saturation power loss. In Proceedings of the CD-ROM Geomatics in the ERA of RADARSAT (GER’97), Ottawa, ON, Canada, 25–30 May 1997; pp. 27–30. [Google Scholar]
- Li, Z.; Yu, Z.; Zhang, Y. Effects of receiver saturation on image formation. In Proceedings of the 2011 IEEE International Geoscience and Remote Sensing Symposium, Vancouver, BC, Canada, 24–29 July 2011; pp. 535–538. [Google Scholar]
- Li, Z.; Li, C.; Yu, Z.; Wang, Y. Effect of AD Converter saturation on SAR system performance. In Proceedings of the Asia-Pacific Conference on Synthetic Aperture Radar (APSAR), Tsukuba, Japan, 23–27 September 2013; pp. 333–335. [Google Scholar]
- Boufounos, P.T.; Baraniuk, R.G. 1-Bit compressive sensing. In Proceedings of the 2008 42nd Annual Conference on Information Sciences and Systems, Princeton, NJ, USA, 19–21 March 2008; pp. 16–21. [Google Scholar]
- Chen, W.J.; et al. The recovery algorithm of saturated SAR raw data based on compressed sensing. In Proceedings of the IGARSS 2018–2018 IEEE International Geoscience and Remote Sensing Symposium, Valencia, Spain, 22–27 July 2018; pp. 8022–8025. [Google Scholar]
- Xiao, D.; Zhang, Y. A MAP approach for 1-bit compressive sensing in synthetic aperture radar imaging. IEEE Geosci. Remote Sens. Lett. 2015, 12, 1237–1241. [Google Scholar] [CrossRef]
- Heidbreder, G.R.; Mitchell, R.L. Detection Probabilities for Log-Normally Distributed Signals. IEEE Trans. Aerosp. Electron. Syst. 2010, AES-3.1, 5–13. [Google Scholar]
- Valenzuela, G.R.; Laing, M.B. Point-Scatterer Formulation of Terrain Clutter Statistics; Naval Research Lab: Washington, DC, USA, 1972; Volume 58, p. 34. [Google Scholar]
- Cheng, D.K. Degradation effects of arbitrary phase errors on high-resolution radar performance. Electr. Eng. Proc. Inst. 1964, 111, 1375–1378. [Google Scholar] [CrossRef]
- Franceschetti, G.; Meroxa, S.; Tesatjro, M. Phase quantized SAR signal processing: Theory and experiments. IEEE Trans. Aerosp. Electron. Syst. 2002, 35, 201–214. [Google Scholar] [CrossRef]
- Davidson, G.W.; Wong, F.H.; Cumming, I.G. The effect of pulse phase errors on the chirp scaling SAR processing algorithm. IEEE Trans. Geosci. Remote Sens. 1996, 34, 471–478. [Google Scholar] [CrossRef]
- Franceschetti, G.; Pascazio, V.; Schirinzi, G. Processing of signum coded SAR signal: Theory and experiments. Radar Signal Process. IEEE Proc. F 1991, 138, 192–198. [Google Scholar] [CrossRef]
- Gaetano, P.; Salvatore, P. Harmonic distortion. In Feedback Amplifiers Theory and Design; Springer: Boston, MA, USA, 2003. [Google Scholar]
- Ender, J.H.G. On compressive sensing applied to radar. Signal Process. 2010, 90, 1402–1414. [Google Scholar] [CrossRef]
- Cumming, I.G.; Wong, F.H. Digital Signal Processing of Synthetic Aperture Radar Data: Algorithms and Implementation; Artech House: Norwood, MA, USA, 2005. [Google Scholar]
© 2019 by the authors. Licensee MDPI, Basel, Switzerland. This article is an open access article distributed under the terms and conditions of the Creative Commons Attribution (CC BY) license (http://creativecommons.org/licenses/by/4.0/).