Article

Spatial Modeling of Mosquito Vectors for Rift Valley Fever Virus in Northern Senegal: Integrating Satellite-Derived Meteorological Estimates in Population Dynamics Models

1
Centre de coopération Internationale en Recherche Agronomique pour le Développement (CIRAD), Unité Mixte de Recherche TETIS, F-97490 Sainte-Clotilde, Réunion, France
2
Centre de coopération Internationale en Recherche Agronomique pour le Développement (CIRAD), Unité Mixte de Recherche ASTRE, F-34090 Montpellier, France
3
TETIS, Université Montpellier, AgroParisTech, CIRAD, CNRS, IRSTEA, F-34090 Montpellier, France
4
ASTRE, Université Montpellier, CIRAD, INRA, F-34090 Montpellier, France
5
Laboratoire National de l’Elevage et de Recherches Vétérinaires, Institut Sénégalais de Recherches Agricoles, 11500 Dakar, Senegal
6
Epidemiology and Public Health Unit, Institut Pasteur du Cambodge, 99 Phnom Penh, Cambodia
*
Author to whom correspondence should be addressed.
Remote Sens. 2019, 11(9), 1024; https://doi.org/10.3390/rs11091024
Submission received: 19 March 2019 / Revised: 23 April 2019 / Accepted: 26 April 2019 / Published: 30 April 2019

Abstract

:
Mosquitoes are vectors of major pathogen agents worldwide. Population dynamics models are useful tools to understand and predict mosquito abundances in space and time. To be used as forecasting tools over large areas, such models could benefit from integrating remote sensing data that describe the meteorological and environmental conditions driving mosquito population dynamics. The main objective of this study is to assess a process-based modeling framework for mosquito population dynamics using satellite-derived meteorological estimates as input variables. A generic weather-driven model of mosquito population dynamics was applied to Rift Valley fever vector species in northern Senegal, with rainfall, temperature, and humidity as inputs. The model outputs using meteorological data from ground weather station vs satellite-based estimates are compared, using longitudinal mosquito trapping data for validation at local scale in three different ecosystems. Model predictions were consistent with field entomological data on adult abundance, with a better fit between predicted and observed abundances for the Sahelian Ferlo ecosystem, and for the models using in-situ weather data as input. Based on satellite-derived rainfall and temperature data, dynamic maps of three potential Rift Valley fever vector species were then produced at regional scale on a weekly basis. When direct weather measurements are sparse, these resulting maps should be used to support policy-makers in optimizing surveillance and control interventions of Rift Valley fever in Senegal.

Graphical Abstract

1. Introduction

Mosquitoes are vectors of many major pathogens worldwide, and the importance of the understanding and prediction of mosquito population dynamics to optimize surveillance and control of mosquito-borne diseases have long been acknowledged [1,2]. Different population dynamics models have been developed for mosquito species belonging to the Anopheles, Aedes or Culex genera [3] involved in the transmission of pathogen agents responsible for malaria [4,5], dengue fever [6,7], Chikungunya [8,9], or Rift Valley fever [10,11,12]. All of these models account for meteorological and environmental variables such as rainfall, temperature, humidity or flooding, as key drivers of mosquito population dynamics [13]. They require a good knowledge of the bio-ecology of the considered mosquito species, and of the influence of meteorological and environmental factors on the mosquito population dynamics. To be used as forecasting tools over large areas, mosquito population dynamics models thus require also geographic datasets revealing the spatial heterogeneity of meteorological and environmental variables, and could benefit, in context of data-scarce areas, from satellite-derived environmental estimates [14].
Indeed, satellite remote sensing techniques are alternative sources of environmental data and numerous applications for these techniques [15] have been developed to map the risk of mosquito-borne diseases [16,17,18,19,20] or predict mosquito population dynamics [21]. For example, rainfall estimates from the Tropical Rainfall Measuring Mission (TRMM) have been used in a process-based model of Rift Valley fever transmission in Eastern Africa [16]. Land surface temperatures and vegetation indices from the Moderate Resolution Imaging Spectroradiometer (MODIS) were identified from statistical analyses as significant risk factors for malaria transmission [20] or abundances of malaria vector species [21,22]. However, most of these studies are based on statistical inference approaches, which may be not appropriate to provide simulation tools allowing testing different control strategies. In this study we developed a process-based modeling framework for mosquito population dynamics using satellite-derived meteorological estimates as input variables.
Our study focused on the population dynamics of the mosquito species vectors of Rift Valley fever virus (RVFV) in Senegal. RVFV is an arthropod-borne zoonotic virus belonging to the genus Phlebovirus, family Bunyaviridae, and responsible for Rift Valley fever (RVF). RVF significantly affects the health of livestock and humans, and has a heavy economic impact in the countries where it is present [23]. RVFV is transmitted to vertebrates by mosquitoes, mainly of the genera Aedes and Culex, or direct contact with infected tissues or fluids of animals [24,25,26]. In Senegal, RVF is endemic, with recurrent detection of the virus among ruminants since the first severe epidemics that occurred in the Senegal River basin in 1987 [27,28,29,30]. The last recent widespread epidemics/epizootics among human and livestock populations occurred in 2013–2014 [31]. Aedes (Aedimorphus) vexans and Culex (Culex) poicilipes species were identified as the major RVFV vectors from several entomological studies [32,33,34,35]. Moreover, the role of Culex (Culex) tritaeniorhynchus as RVF vector is strongly suspected in the Senegal River Valley, where Ae. vexans is rarely observed and Cx. poicilipes is present in lower densities than Cx. tritaeniorhynchus [36]. In fact, studies have shown that Cx. tritaeniorhynchus is well distributed and the most abundant species during the rainy season in the Senegal River Delta and the Senegal River Valley [37] and shows preference for cattle, sheep and human [38]. Additionally, this species was one of the major vectors during the 2000 RVF epidemics in Saudi Arabia [39].
Previous observational and modeling studies have shown the impact of rainfall on the dynamics of the two major RVF vector species in Senegal, Ae. vexans and Cx. poicilipes [11,12,35,40]. These studies mostly focused on the Ferlo region, an agropastoral zone of northern Senegal characterized by the presence of temporary ponds that are filled during the rainy season. These studies, therefore, included a hydrologic model to describe the flooding dynamics from rainfall [11,12]. The present study expanded upon these previous works by developing a spatial weather-driven model of mosquito population dynamics applied to Ae. vexans, Cx. poicilipes and Cx. tritaeniorhynchus in different ecosystems of Northern Senegal, namely the Ferlo region, the Senegal River Delta (SRD) and the Senegal River Valley (SRV). The major study objectives were: (i) To apply a generic weather-driven model of mosquito population dynamics [41] to RVF vector species in northern Senegal; (ii) to validate the models against longitudinal trapping data on host-seeking adult females from three study sites; (iii) to compare the model outputs using meteorological data from satellite-based estimates vs ground station measurements.

2. Materials and Methods
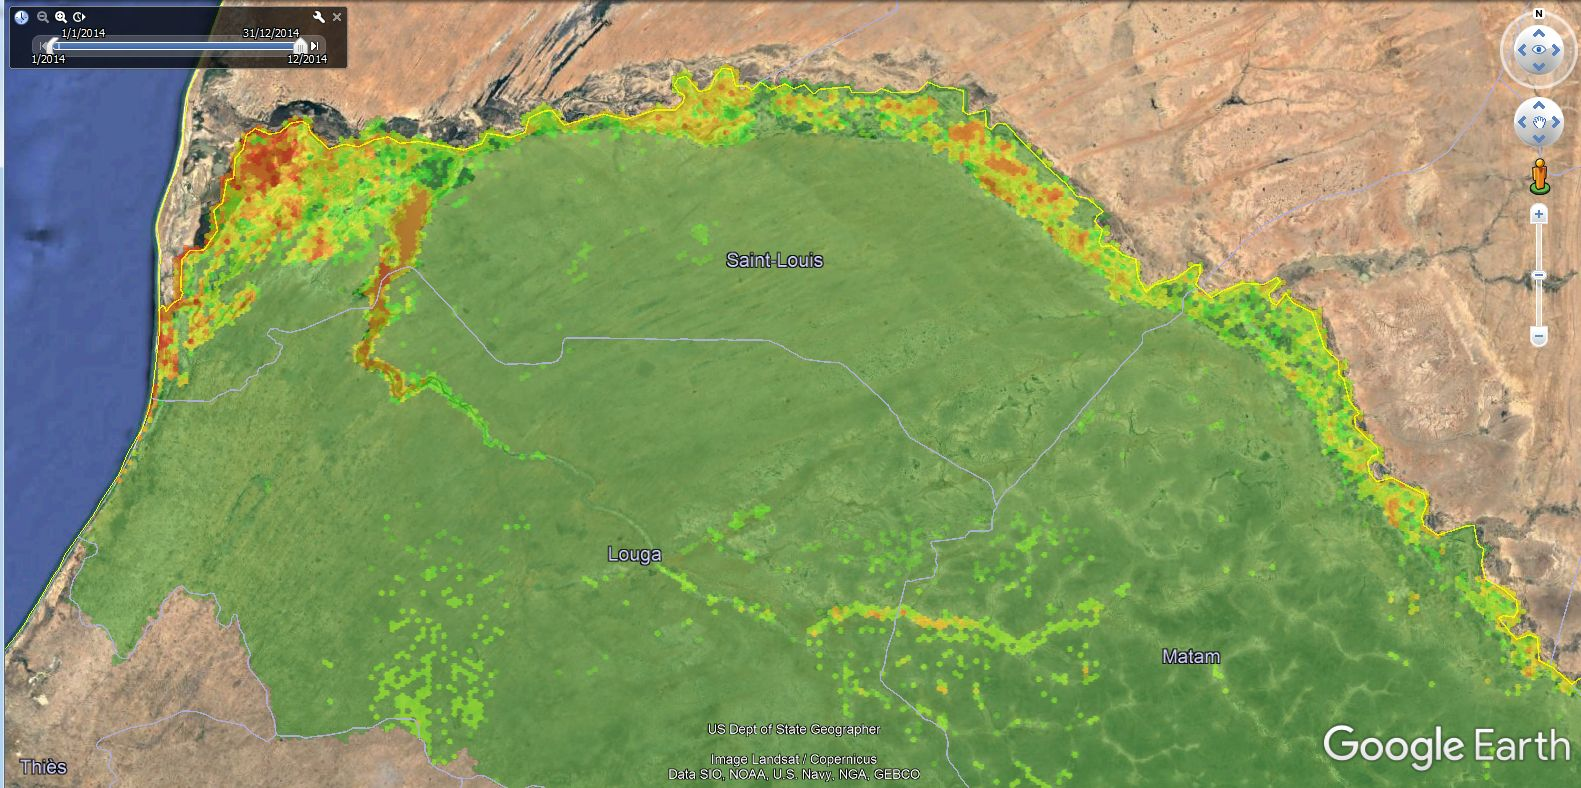
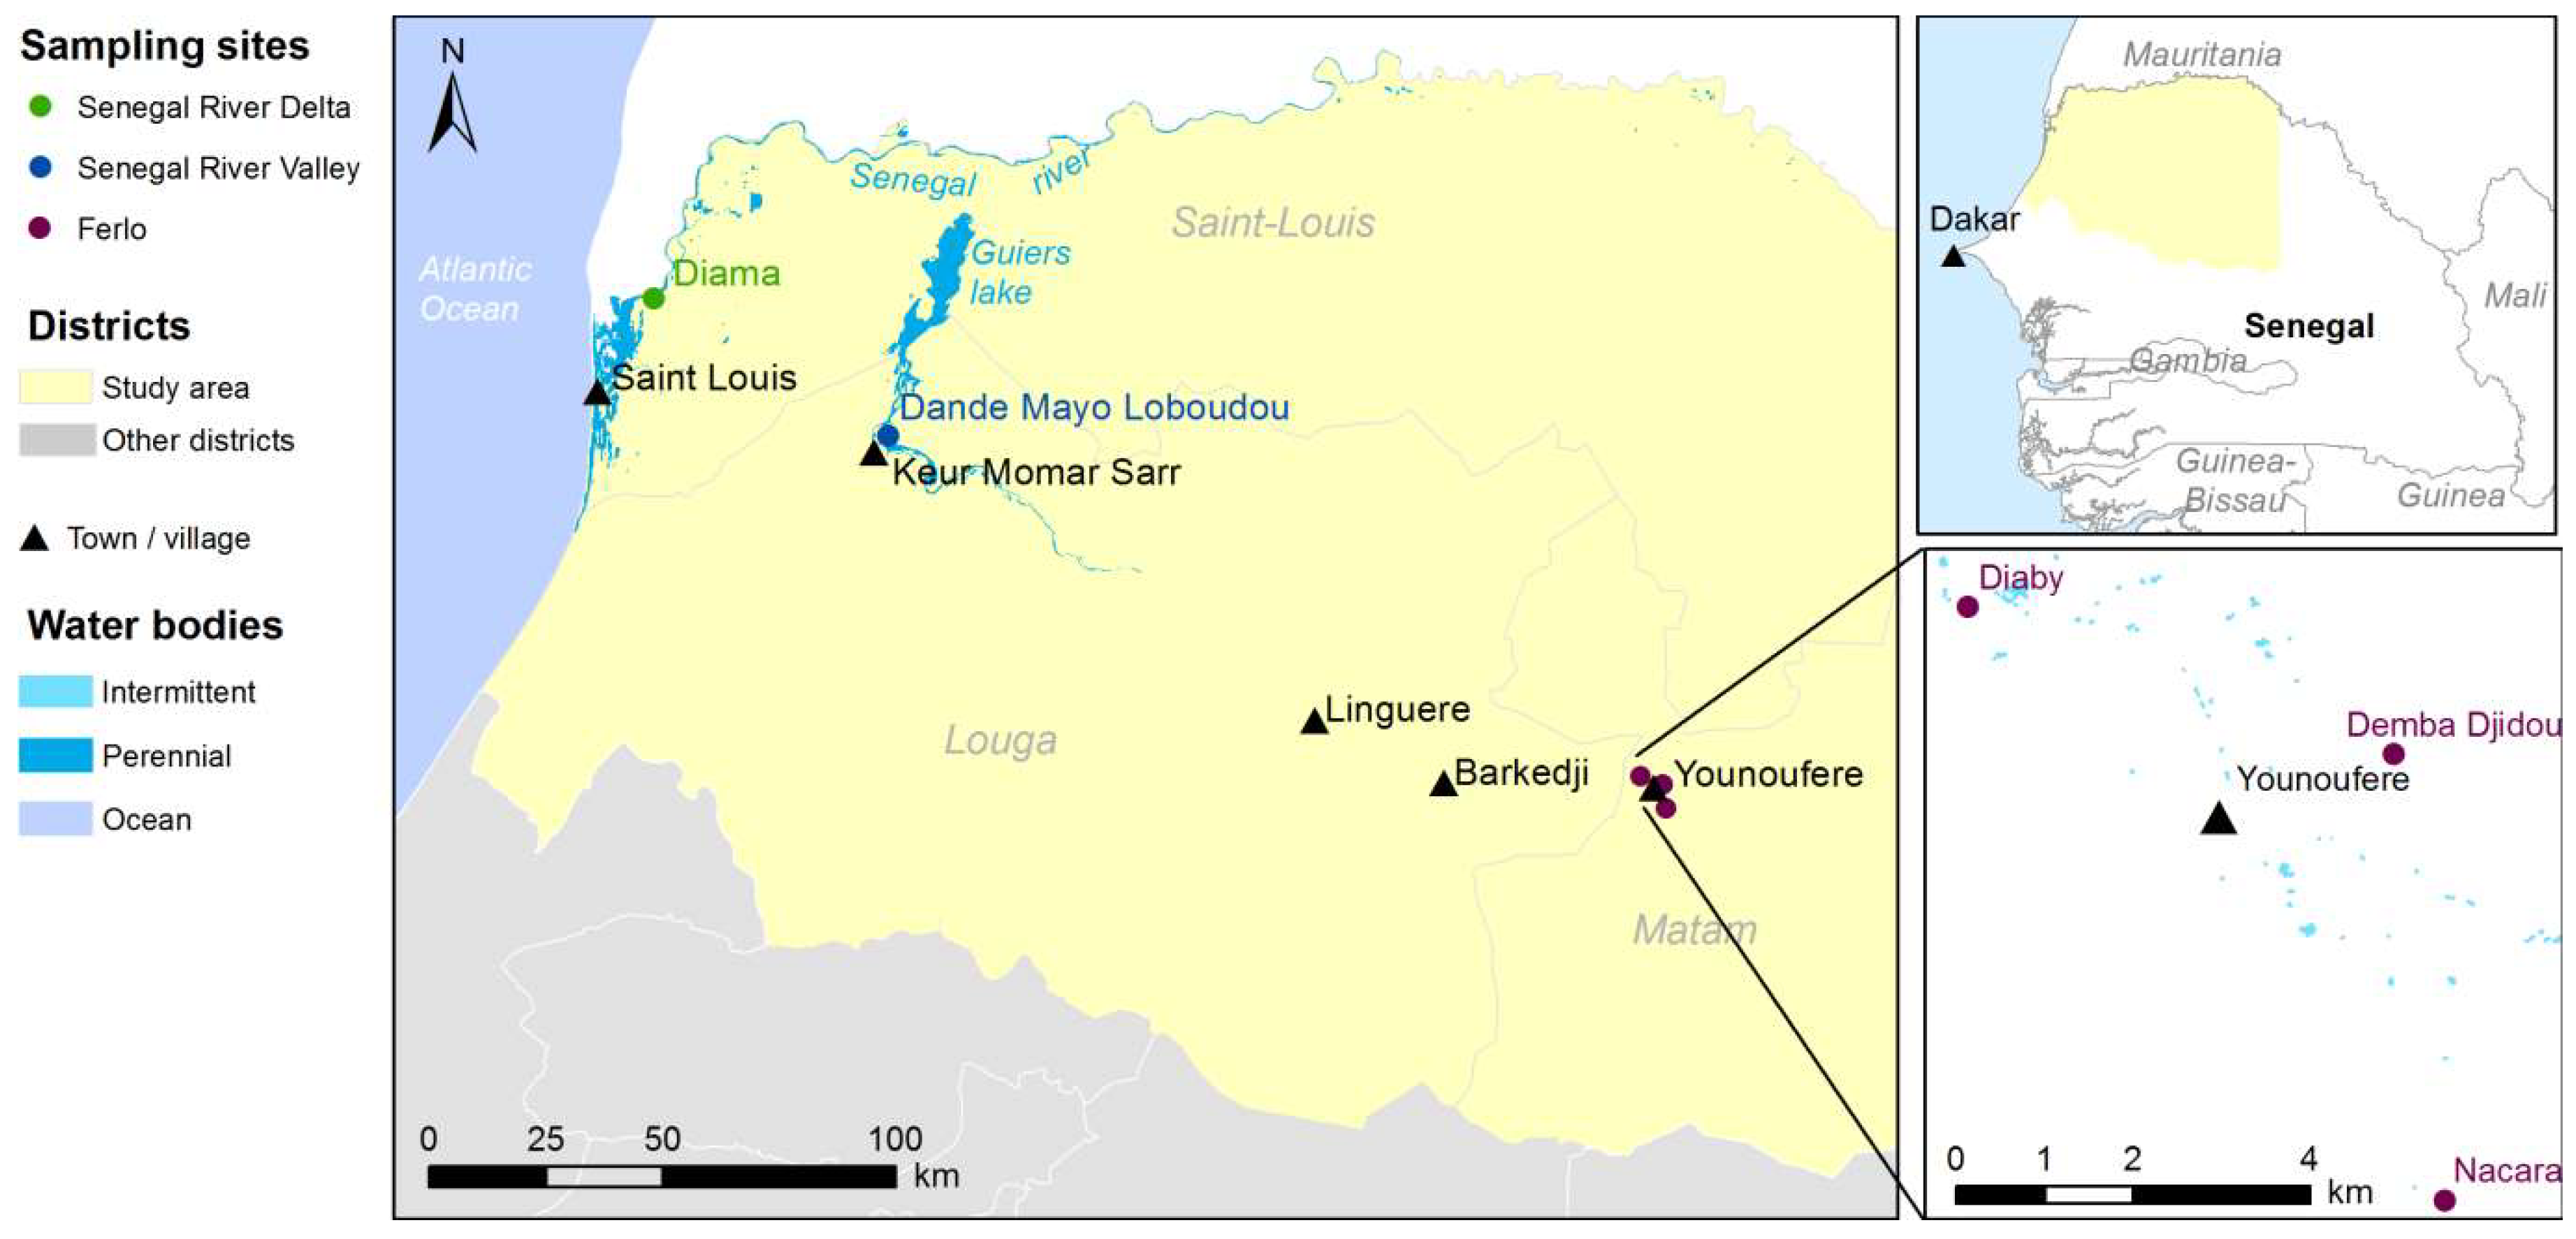
2.1. Study Sites

The study area covers the northwestern part of Senegal and encompasses three main agro-ecosystems, namely the Ferlo pastoral area, the Senegal River Delta (SRD) and the Senegal River Valley (SRV) (Figure 1). The Ferlo area is characterized by a semi-arid climate and a dense network of ponds that are filled during the rainy season (July–October) and dry out during the rest of the year. These temporary water bodies are the main breeding and resting sites for Aedes and Culex species, as well as the main water resource for pastoral populations and their livestock. Annual rainfall ranges between 120–450 mm and the annual mean temperature is 30 °C. The vegetation mainly consists of dry grassland with scattered trees and bushes, and subsistence crops. During the rainy season, the ground is covered with grass, providing grazing resources for the resident and transhumant herds of cattle, sheep and goats. SRD and SRV are agro-pastoral areas located south of the Senegal River, with a constant availability of water resources throughout the year, with the Senegal River and the Guiers Lake, an important fresh water reserve (Figure 1). These permanent water bodies are the main breeding and resting sites for Culex species. The vegetation is characterized by a mosaic of natural wetlands and extensive irrigated agricultural activities, including rice and sugar cane as main crops. Annual rainfall ranges between 400–500 mm and the annual mean temperature is 25 °C. Agricultural residues are an important source of food for resident and transhumant livestock during the post-harvest period.
Three study sites, namely Younoufere, Diama and Dande Mayo Loboudou, representative of Ferlo, SRD and SRV respectively, were selected for entomological surveys [36] and the collection of meteorological data from weather stations (Figure 1). These three localities had all been affected by the recent RVF outbreak [42]. In the Younoufere area, three different ponds (Diaby, Demba Djidou and Nacara—see Figure 1) were selected as sampling sites for mosquito sampling and the monitoring of pond surface.

2.2. In-Situ Meteorological Data

In each study site, the daily total precipitation was recorded from a rain gauge and the daily average temperature and relative humidity were computed from the hourly measurements of a HOBO data logger.

2.3. Satellite-Derived Meteorological Data

To cover the entire study area, satellite-derived meteorological estimates were collected from open databases. Tropical Applications of Meteorology using SATellite data and ground-based observations (TAMSAT) daily rainfall estimates with a 0.0375° × 0.0375° spatial resolution have been downloaded from the Tamsat website (http://www.tamsat.org.uk/cgi-bin/data/index.cgi) for three consecutive years (2014–2016). European Centre for Medium Range Weather Forecasts (ECMWF) 10-daily minimum and maximum temperatures with a 0.25° × 0.25° spatial resolution have been downloaded for the same period from the ECMWF website (https://confluence.ecmwf.int).
Relative humidity can be computed from daily minimum (Tmin) and maximum (Tmax) temperatures according to the method for estimating missing humidity detailed in [43]. This method relies on the relationship between temperature and relative humidity at dew point, adapted for arid areas:
RH = 100 · exp ( 17.27 ( T min 2 ) ( T min 2 ) + 237.3 ) exp ( 17.27   T max T max + 237.3 )

2.4. Satellite Multispectral Images

In order to estimate the availability of mosquito breeding sites for the entire study area, water surface was detected from Sentinel-2 images acquired during the 2016 rainy season, when the surface of the ponds is maximum. Twelve cloud-free Sentinel-2 scenes (Level 1-C) were downloaded from Earth Explorer website (https://earthexplorer.usgs.gov/). The images were processed to map the Modified Normalized Difference Water Index (MNDWI) [44]:
M N D W I = G M I R G + M I R
with G: Green (S2-band 3) and MIR: Middle Infrared (S2-band 11) [45].
Water bodies were then detected by thresholding the MNDWI images (threshold value = 0) [46].

2.5. Entomological Data

A longitudinal survey was conducted during the rainy seasons of three consecutive years (2014–2016) in the Younoufere, Diama and Dande Mayo Loboudou sites [36]. In each location, two consecutive nights per month from July to November, adult mosquitoes were trapped with Centers for Disease Control and prevention (CDC) light trap potentiated with CO2. In Diama (SRD) and Dande Mayo Loboudou (SRV), two traps were set per site. In Younoufere, 6 traps were set, 2 traps for each monitored pond (Diaby, Djidou and Nacara). Trapping episodes took place from sunset (6 PM) to sunrise (6 AM). The mosquitoes collected were immediately killed by freezing in dry ice, put in dry tubes and stored at −80 °C in dry ice until their transportation to the laboratory. They were then identified by sex and species under a binocular microscope on cold table at −20 °C using morphological keys and identification software [36]. This study highlighted the heterogeneous geographical distribution of Ae. vexans, Cx. poicilipes and Cx. tritaeniorhynchus species, with the predominance of Ae. vexans in the Ferlo area, and those of Cx. tritaeniorhynchus in both SRD and SRV (see details in [36]).

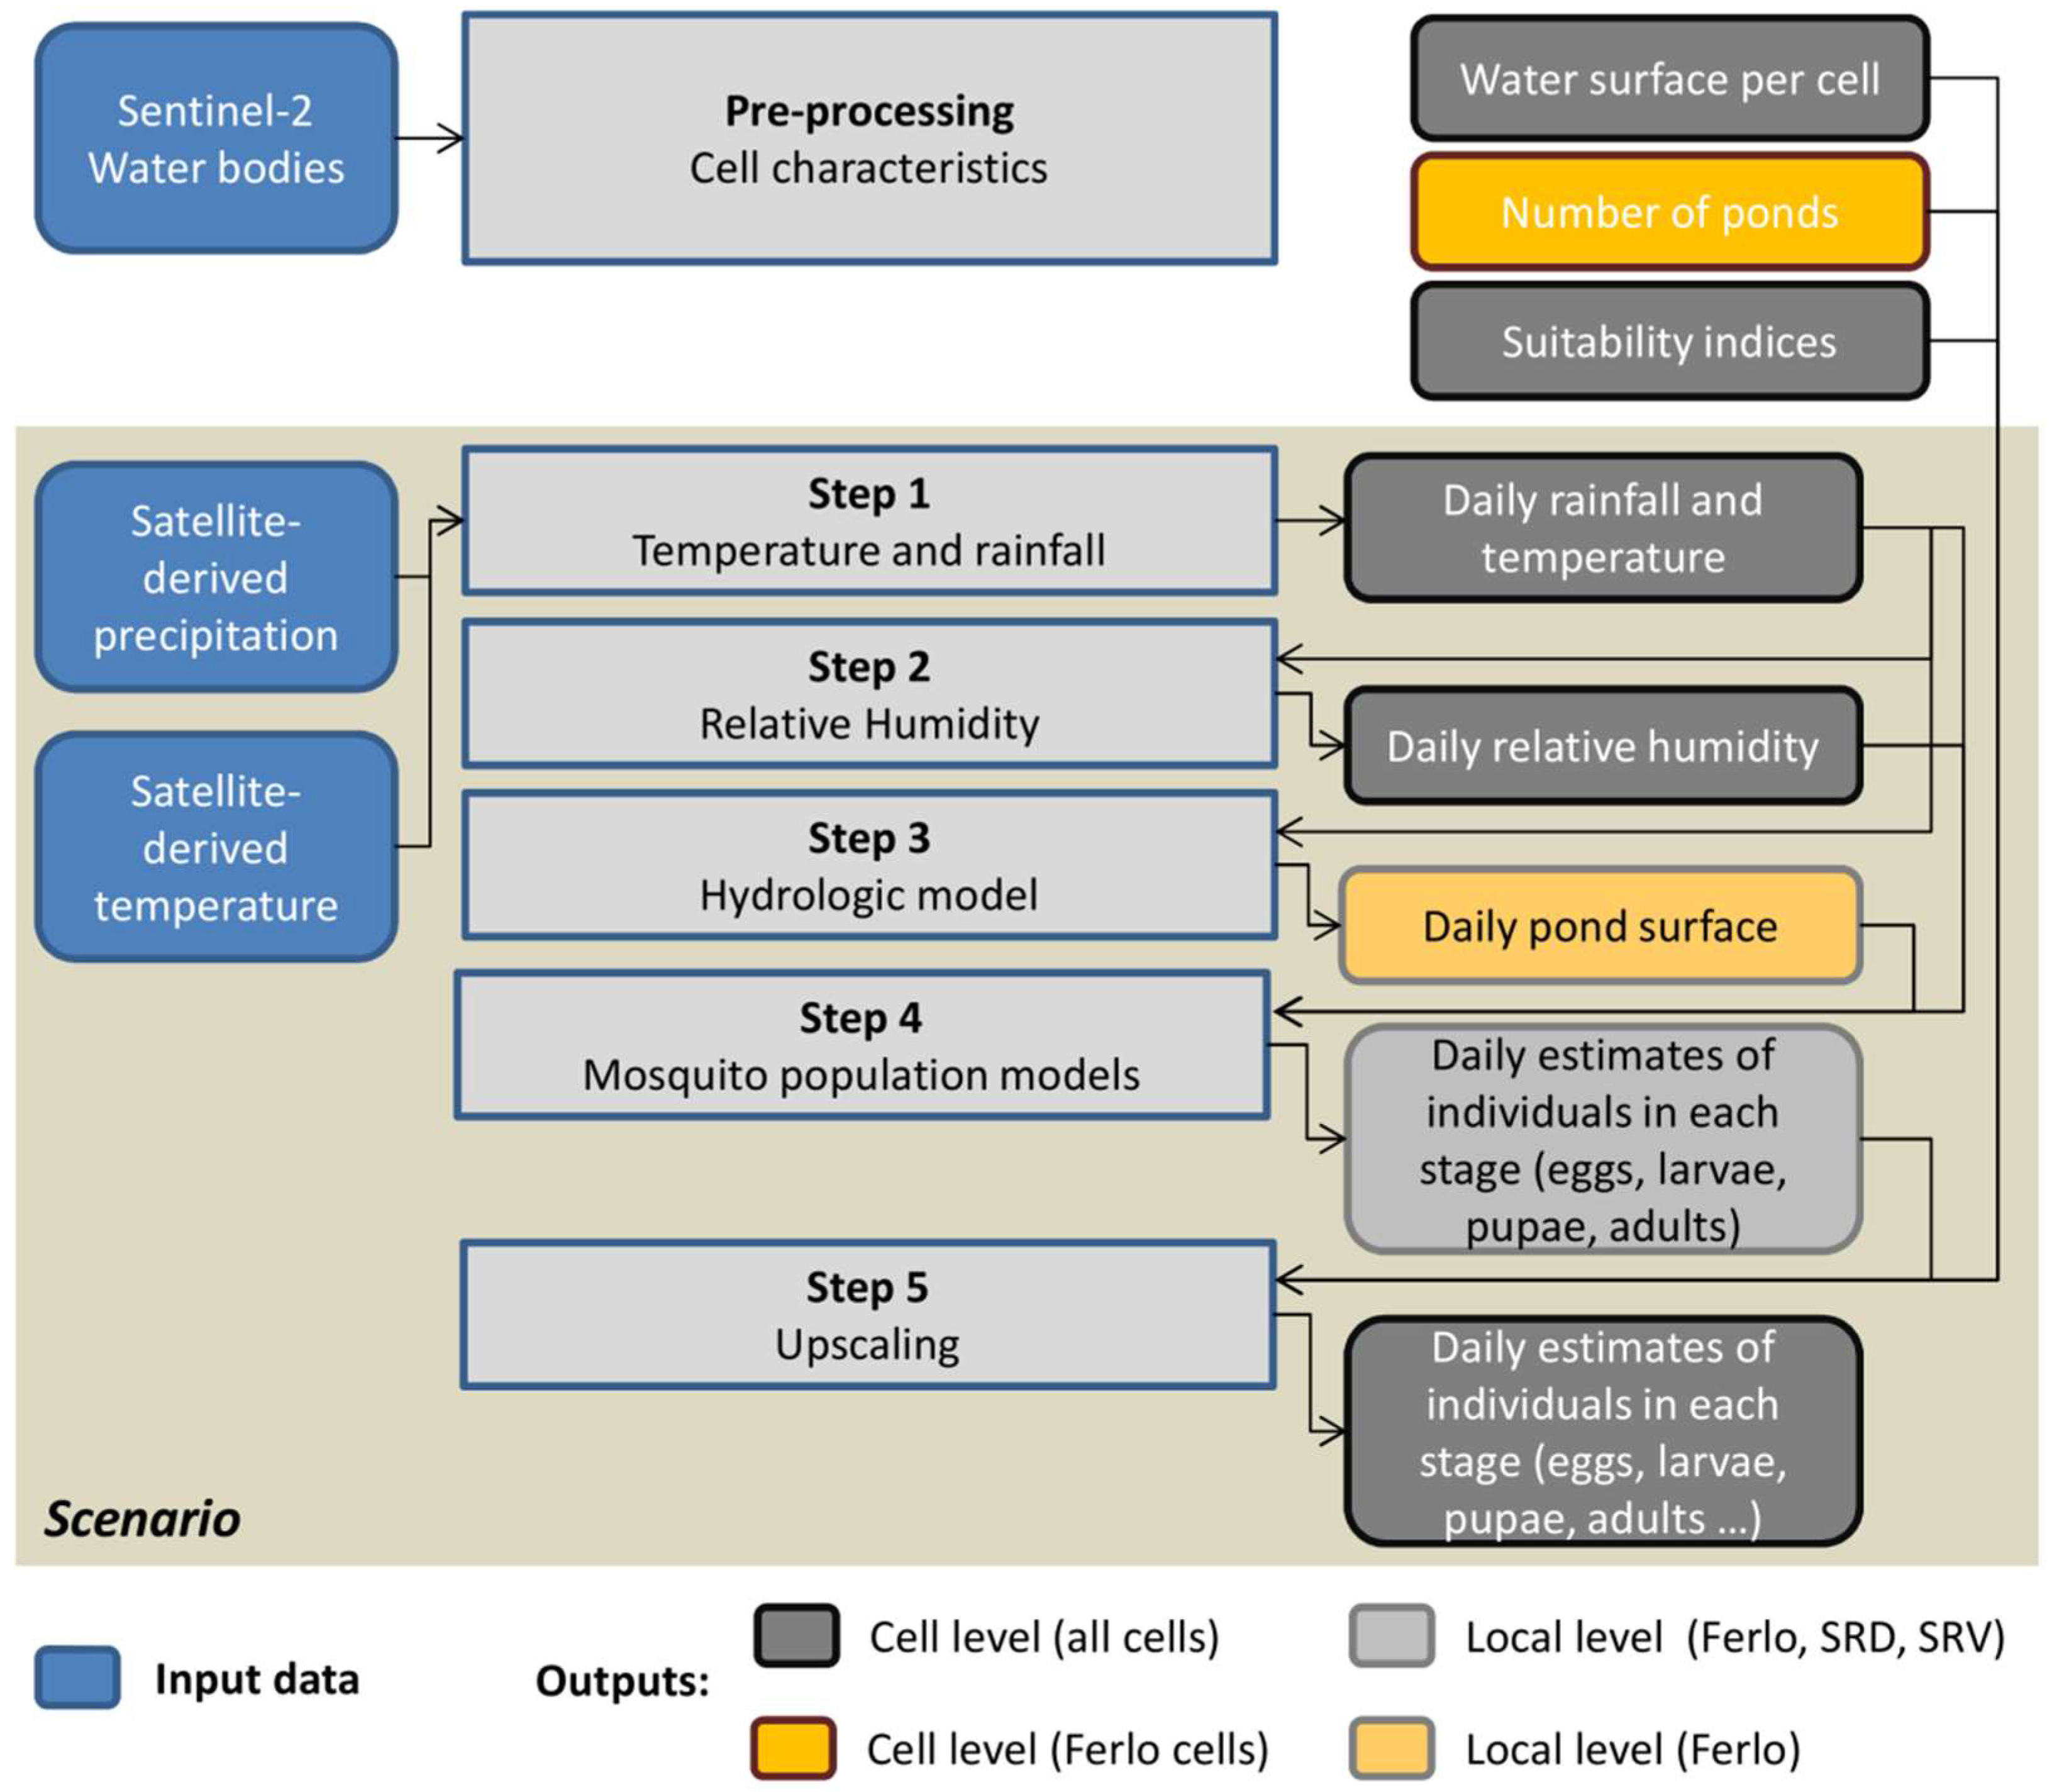
2.6. Overview of the Hydrologic Model Used in the Ferlo Area

In the Ferlo area, the pond surface is an essential driver of mosquito population dynamics [12]. We thus used a hydrologic pond model that simulates daily spatial and temporal variations of temporary ponds in arid areas and that was calibrated and validated for Barkedji, a Ferlo village located 43 km East from Younoufere (Figure 1) [46]. The model consists of a daily water balance model accounting for the contribution of direct rainfall, the runoff volumes of inflows and the water loss through evaporation and infiltration (Appendix A). We applied the model with the parameters determined in [46]. The inputs of the model were the daily rainfall measures from the weather station and alternatively, to assess their potential for hydrological modeling, the TAMSAT satellite-derived rainfall estimates. The output of interest for modeling mosquito population dynamics is the surface of the pond.

2.7. The Mosquito Population Dynamics Model

We developed predictive models of the abundance over time of three RVFV vector species, Ae. vexans, Cx. poicilipes and Cx. tritaeniorhynchus from the framework proposed by [41]. The generic structure of this mechanistic model makes possible its application to different mosquito species and geographical areas [3,8,10]. Indeed, the stages (aquatic juveniles and aerial adults) are common to Aedes and Culex species. Only the parameters and between-stage transitions may vary between species and areas, being specific to a given biological “species x area” system [3].
Mosquito aquatic stages include eggs, larvae, and pupae. Mating occurs rapidly after emergence. After insemination, females disperse to seek a host for blood feeding. Then, they remain in a sheltered place until they become gravid and can deposit eggs. Ae. vexans eggs are laid on the humid soil just above water level and must dry out for a minimum number of days before being submerged in water and hatched. In contrast, Cx. poicilipes and Cx. tritaeniorhynchus eggs are deposited directly on water surfaces and hatch immediately into larvae [35]. Poikilotherms, mosquitoes are unable to regulate their body temperature and are highly dependent on temperature and humidity [47].
Thus, the models for Ae. vexans, Cx. poicilipes and Cx. tritaeniorhynchus are driven by meteorological and environmental conditions, the transitions between stages and mortality rates depending on temperature, rainfall, humidity or water surfaces. As output, it predicts the seasonal dynamics on a daily basis of the different stages of a mosquito population over several years. Ten stages are modeled (Figure 2): Three aquatic stages (E, eggs; L, larvae; P, pupae), and seven adult stages, for which females only are represented, including one emerging adult stage (Aem), and six stages subdivided regarding their behavior during the gonotrophic cycle (h, host-seeking; g, transition from blood feeding and digestion to gravid; o, oviposition site seeking), i.e., three nulliparous stages (A1h, A1g, A1o), and three parous stages (A2h, A2g, A2o).
Density-dependent mortality was considered for larvae and the success of adult emergence was considered dependent on pupa density [3,41] with the definition of the environment carrying capacity (kL and kP) reflecting the availability of breeding sites. In the Ferlo area, the temporary ponds are the main breeding sites for Ae. vexans and Cx. poicilipes. Thus, the environment carrying capacity is driven by pond surface dynamics. In SRD and SRV, permanent water bodies (Senegal River, Guiers Lake) are the main breeding sites for Cx. poicilipes and Cx. tritaeniorhynchus and the environment carrying capacity is driven by rainfall.
The model is deterministic, based on a system of ordinary differential equations (ODE) describing the mosquito population dynamics during the period of the year mosquitoes are active (Equations (3)). In SRD and SRV, mosquitoes are active all over the year [37]. In the Ferlo area, the population dynamics of Culex and Aedes populations are strongly constrained by the pond dynamics [48,49]. Thus, in this area, we considered that mosquitoes progressively stop their activity during the unfavorable, dry season (November–June), which can be modeled using a second ODE system (Equation (4)). For each compartment represented in Figure 2, the first term of the ODE describes the individuals entering the compartment (e.g., eggs laid), and the second term describes the individuals removed from the compartment (e.g., deaths and eggs hatching to larval stage).
{ E ˙ = γ A o ( β 1 A 1 o + β 2 A 2 o ) ( m E + f E ) E L ˙ = f E E ( m L ( 1 + L / k L ) + f L ) L P ˙ = f L L ( m P + f P ) P A e m ˙ = f P P σ e ( μ e m ( 1 + P / k P ) ) ( m A + γ A e m ) A e m A 1 h ˙ = γ A e m A e m ( m A + μ r + γ A h ) A 1 h A 1 g ˙ = γ A h A 1 h ( m A + f A g ) A 1 g A 1 o ˙ = f A g A 1 g ( m A + μ r + γ A o ) A 1 o A 2 h ˙ = γ A o ( A 1 o + A 2 o ) ( m A + μ r + γ A h ) A 2 h A 2 g ˙ = γ A h A 2 h ( m A + f A g ) A 2 g A 2 o ˙ = f A g A 2 g ( m A + μ r + γ A o ) A 2 o
{ E ˙ = γ A o ( β 1 A 1 o + β 2 A 2 o ) ( μ E + ϕ f E ) E L ˙ = ϕ f E E ( m L ( 1 + L / k L ) + f L ) L P ˙ = f L L ( m P + f P ) P A e m ˙ = f P P σ e ( μ e m ( 1 + P / k P ) ) ( m A + ( 1 ϕ ) γ A e m ) A e m A 1 h ˙ = ( 1 ϕ ) γ A e m A e m ( m A + μ r + γ A h ) A 1 h A 1 g ˙ = γ A h A 1 h ( m A + f A g ) A 1 g A 1 o ˙ = f A g A 1 g ( m A + μ r + γ A o ) A 1 o A 2 h ˙ = γ A o ( A 1 o + A 2 o ) ( m A + μ r + γ A h ) A 2 h A 2 g ˙ = γ A h A 2 h ( m A + f A g ) A 2 g A 2 o ˙ = f A g A 2 g ( m A + μ r + γ A o ) A 2 o
with ϕ a Boolean whose value is 1 for the Culex species, 0 for the Aedes species, to account for the difference in resistant stages [3,41]: in the Ferlo area, Ae. vexans spend the unfavorable season as resistant desiccated eggs that hatch as soon as the ponds are flooded, whereas Cx. poicilipes spend the dry season as nulliparous mated females [48].
Greek letters are constant parameters (Table 1). Latin letters denote functions of meteorological and environmental factors (Table 2). Functions and parameter values specific to each “species x area” system were defined from available experimental data, and bibliographic review. If no information was available for the species considered, we used the information of a species of the same genus, or our own expertise.
Temperatures impact transition and mortality rates of all species. Rainfall drives the availability of additional breeding sites for Culex species in SRD and SRV. Pond surface is determinant for all aquatic stages in the Ferlo area: Cx poicilipes eggs are deposited directly on the water surface and immediately proceed through development into larvae; but Ae. vexans eggs are laid on the soil just above the current water level and to hatch, they must first dry out before being submerged in water by a rise of water level. The mortality of larvae and pupae stages is also dependent on pond surface. Humidity was found to impact Culex and Aedes adult mortality [36,37]. The main difference between Cx. tritaeniorhynchus and Cx. poicilipes is related to the environment carrying capacity, Cx. tritaeniorhynchus preferring clear water for breeding, whereas Cx. poicilipes breed in water with submerged green vegetation in areas subject to direct sunlight [50].
Table 1. Model parameters for Ae. vexans, Cx. poicilipes, Cx. tritaeniorhynchus in Northern Senegal.
ParameterDefinitionFerloSRV and SRDReference
Ae. vexansCx. poic.Cx. poic.Cx. tritae.
β 1 Number of eggs laid/ovipositing nulliparous female80100100100[13,51,52]
β 2 Number of eggs laid/ovipositing parous female70808080[10,13,51]
σ Sex-ratio at emergence0.50.50.50.5[13,51,53,54]
γ A e m Development rate of emerging adults (day−1)0.60.750.750.75[53,55,56]
γ A h Transition rate from host-seeking to engorged adults (day−1)0.330.330.330.33[35,49,56]
γ A o Transition rate from ovipositing to host-seeking adults (day−1)0.330.330.330.33[35,49,56]
μ e m Mortality rate during emergence (day−1)0.10.10.10.1[51]
μ r Mortality rate related to seeking behavior (day−1)0.080.080.080.08*
μ E Minimum egg mortality rate (day−1)0.0010.020.020.02*
μ L Minimum larvae mortality rate (day−1) 0.02 0.010.010.01[51,53,55]
μ P Minimum pupae mortality rate (day−1)0.020.010.010.01[51,53,55]
κ L Minimum environment carrying capacity for larvae (larvae ha−1)10,00010,00010,00010,000*
κ P Minimum environment carrying capacity for pupae (pupae ha−1)10,00010,00010,00010,000*
TdMinimal length of desiccation period for Aedes eggs (days)7___[11,35]
StartFirst day of the favorable seasondate of the first raindate of the first rain1st of January1st of January*
EndLast day of the favorable seasonMax (date with S = 0; 15th Nov.)Max (date with S = 0; 15th Nov.)31st Dec.31st Dec.*
* To the best of our knowledge (field observations and expertise).
Table 2. Model functions for Ae. vexans, Cx. poicilipes, Cx. tritaeniorhynchus in Northern Senegal.
Fct 1DefinitionAe. vexans
Ferlo
Cx. poic.
Ferlo
Cx. poic.
SRV/SRD
Cx. tritae.
SRV/SRD
Ref.
f E Transition rate from egg to larvae (day−1) ( T 10 ) / 110 *s
w i t h   s = { S / S m a x 0 i f   Δ S > 0 o t h e r w i s e
0.980 T + 273.15 298.15 . e 11216.85 ( 1 298.15 1 ( T + 273.15 ) ) 1 + e 31820.33 ( 1 303.67 1 ( T + 273.15 ) ) [11,57]
f L Transition rate from larvae to pupae (day−1) q 1 T 2 + q 2 T + q 3
with q1 = −0.0007; q2 = 0.0392; q3 = −0.3911
0.216 T + 273.15 298.15 e 12425.26 ( 1 298.15 1 ( T + 273.15 ) ) 1 + e 18757.03 ( 1 301.82 1 ( T + 273.15 ) ) [51,57]
f P Transition rate from pupae to emerging adults (day−1) q 1 T 2 + q 2 T + q 3
with q1 = −0.0008; q2 = −0.0051; q3 = −0.0319
0.555 T + 273.15 298.15 e 7875.51 ( 1 298.15 1 ( T + 273.15 ) ) 1 + e 22135.59 ( 1 T H 1 ( T + 273.15 ) ) [51,57]
f A g Transition rate from engorged to ovipositing adults (day−1) ( T 10 ) / 77 ( T 10 ) / 40 [51,53]
m E Egg mortality rate (day−1) μ E + { E _ d e s s 0 i f   Δ S > 0 o t h e r w i s e { μ E 1 i f   S > 0 o t h e r w i s e μ E μ E *
m L Larvae mortality rate (day−1) μ L + e T / 2 + 0.1 e 5 S / S m a x μ L + e T / 2 + 0.1 e 5 S / S m a x μ L + e T / 2 *
m P Pupae mortality rate (day−1) μ P + e T / 2 + 0.1 e 5 S / S m a x μ P + e T / 2 + 0.1 e 5 S / S m a x μ P + e T / 2 *
m A Adult mortality rate (day−1) q 1 T 2 + q 2 T + q 3
with q1 = 0.000148; q2 = −0.00667; q3 = 0.1
( q 1 T 2 + q 2 T + q 3 ) ( 1 0.016 H ) , with q1 = 0.000148; q2 = −0.00667; q3 = 0.1[3]
k L Environment carrying capacity for larvae (larvae ha−1) κ L ( 1 + S A ) κ L ( 1 + S C ) κ L ( 1 + 0.9 R ) κ L ( 1 + 0.9 R ) *
k P Environment carrying capacity for pupae (pupae ha−1) κ P ( 1 + S A ) κ P ( 1 + S C ) κ P ( 1 + 0.9 R ) κ L ( 1 + 0.9 R ) *
1S denotes the pond surface, Smax the maximum pond surface, T the temperature in °C, H the relative humidity (%), R the daily rainfall in mm, R’ the rainfall of the preceding month in mm, Edess the proportion of Ae. vexans eggs that have not achieved the minimum desiccation period (Td). SA and SC denote the area where Aedes and Culex females deposit their eggs and defined as 1-meter ring around and inside the pond, respectively. * To the best of our knowledge (field observations and expertise).
In situ daily weather station measurements, namely total precipitation, average temperature, average relative humidity and modeled pond surface were used as model input to simulate Ae. vexans and Cx. poicilipes dynamics in the Ferlo area (Diaby, Demba Djidou and Nacara ponds) and Cx. poicilipes and Cx. tritaeniorhynchus dynamics in the SRD (Diama) and SRV (Dande Mayo Loboudou) areas. The model was implemented in Scilab (www.scilab.org). Simulations were run over 2014–2016, after a starting period of one year. Initially, the population consisted of 103 nulliparous adults for Culex species and 106 eggs for Aedes species, with the 1st of January as the initial time. The model outputs are the abundance of mosquitoes per stage over time at local level, i.e. for one individual pond in the Ferlo area, and for a permanent water body surface of 4 ha in SRV and SRD.

2.8. Application at Regional Scale

Spatial dynamics models of RVF vectors were built within ‘Ocelet’ language and modeling platform (www.ocelet.org). The ‘Ocelet’ language is dedicated to the modeling of spatially explicit systems and their dynamics [58] and facilitates the handling of spatial information, as raster (e.g., time series of satellite images) and vector (e.g., geometries as Environmental Systems Research Institute (ESRI) shapefile format) representations [59]. In ‘Ocelet’ a system is represented by describing ‘entities’ of different spatial representations. The system dynamics is then applied in a ‘scenario’ where entities’ states evolve through time with ‘interaction functions’ described in ‘relations’ applied on entities that are susceptible to interact with each other.
In the present model, the study area is divided into regular 1 km radius hexagon cells (vector polygon geometry), which are flagged either as ‘Ferlo’ or ‘Senegal River’. In order to upscale the outputs of the mosquito population dynamics model from local level to cell level (Figure 3), the cells were characterized by the water surface in the cell, the estimated number of ponds (only for the ‘Ferlo’ cells), and suitability indices for the presence of Cx. tritaeniorhynchus, Cx. poicilipes, and Ae. vexans. These suitability indices reflect the probabilities of presence of the different mosquito species, which depend on the distance to the Senegal River and the density of water bodies during the rainy season. The details of the computation of cell characteristics are presented in Appendix B.
Temperature and rainfall satellite-derived estimates are imported into Ocelet as raster data and then attributed to hexagonal cells by spatial correspondence (i.e., when a hexagonal centroid is contained into a temperature or rainfall pixel) to combine information from different sources with different spatial resolutions. Given the active flight dispersal distance of Aedes and Culex in Senegal (500–600 m [49]), the 1-km radius cells are considered independent, and the mosquito dispersal between neighboring cells is neglected.
In the ‘scenario’ (Figure 3), the sequence of operations and interactions between 1 km hexagonal cells and rasters is specified as follows: Step (1) the daily rainfall, and the minimum and maximum temperatures values are read and attributed to each corresponding cell; step (2) the daily humidity is computed for each cell according to Equation (1); step (3) the dynamics of one pond is computed for each ‘Ferlo’ cell with rainfall as input; step (4) the mosquito population dynamics of the three studied species are computed (Equations (3) and (4) at local level (i.e., for one pond in the Ferlo area, and for a 4 ha area in SRD and SRV) for all cells with rainfall, temperature, humidity, and—for ‘Ferlo’ cells—pond dynamics as input; step (5) the mosquito population dynamics of the three studied species are computed at cell level by multiplying the local mosquito abundance values estimated in step 4 by the suitability index and by the number of ponds for ‘Ferlo’ cells, and by the cell water surface divided by 4 ha for ‘Senegal River’ cells. The time step is 1 day and the simulations were run over the 2014–2016 period, after a starting period of one year. Initially, the population in each cell consisted of 103 nulliparous adults for Culex species and 106 eggs for Aedes species, with the 1st of January as the initial time.

2.9. Validation

Simulated water areas of each monitored pond in the Ferlo area (Diaby, Demba Djidou and Nacara) were compared to water areas estimated in the field by walking around the ponds with a Global Positioning System (GPS) receiver device that recorded the geographic coordinates at regular intervals. The same method was applied at the time of the 2015 and 2016 entomological collections to delineate the contours of the three ponds. The degree of association between observed and simulated pond areas was assessed by calculating the Spearman correlation coefficient and Root-Mean-Square Error (RMSE).
For each species (Ae. vexans, Cx. poicilipes, Cx. tritaeniorhynchus) and each study site (SRD: Diama; SRV: Dande Mayo Loboudou; Ferlo area: Younoufere), we compared the observed average number of females per trap (relative to the maximum value of the observed average number of mosquito females per trap) with the simulated abundances of host-seeking females (A1h + A2h) (relative to the maximum value of simulated host-seeking females abundance over the 2014–2016 period) derived from in situ and satellite-derived weather data. The degree of association between observed and simulated number of adults at the time of entomological collection was assessed for each collection site by calculating the Spearman correlation coefficient.
A sensitivity analysis was carried out to assess the sensitivity of the models to the model parameters (Table 1). We used the OAT (one-factor-at-a time) Morris method [60]. Details are provided in Supplementary File S1.

3. Results

3.1. Assessment of the Hydrologic Model Used in the Ferlo Area

Over two observed years (2015 and 2016), model predictions of pond dynamics in Younoufere, Ferlo area, tallied well with field observations of pond surfaces (Figure 4). For the simulations computed from rainfall ground station measurements, the Spearman correlation coefficients were 0.90, 0.91 and 0.90 for the Nacara, Djemba Djidou and Diaby ponds, respectively. The RMSE values calculated for Nacara, Djemba Djidou and Diaby ponds were 1674 m2, 485 m2 and 3862 m2, respectively.

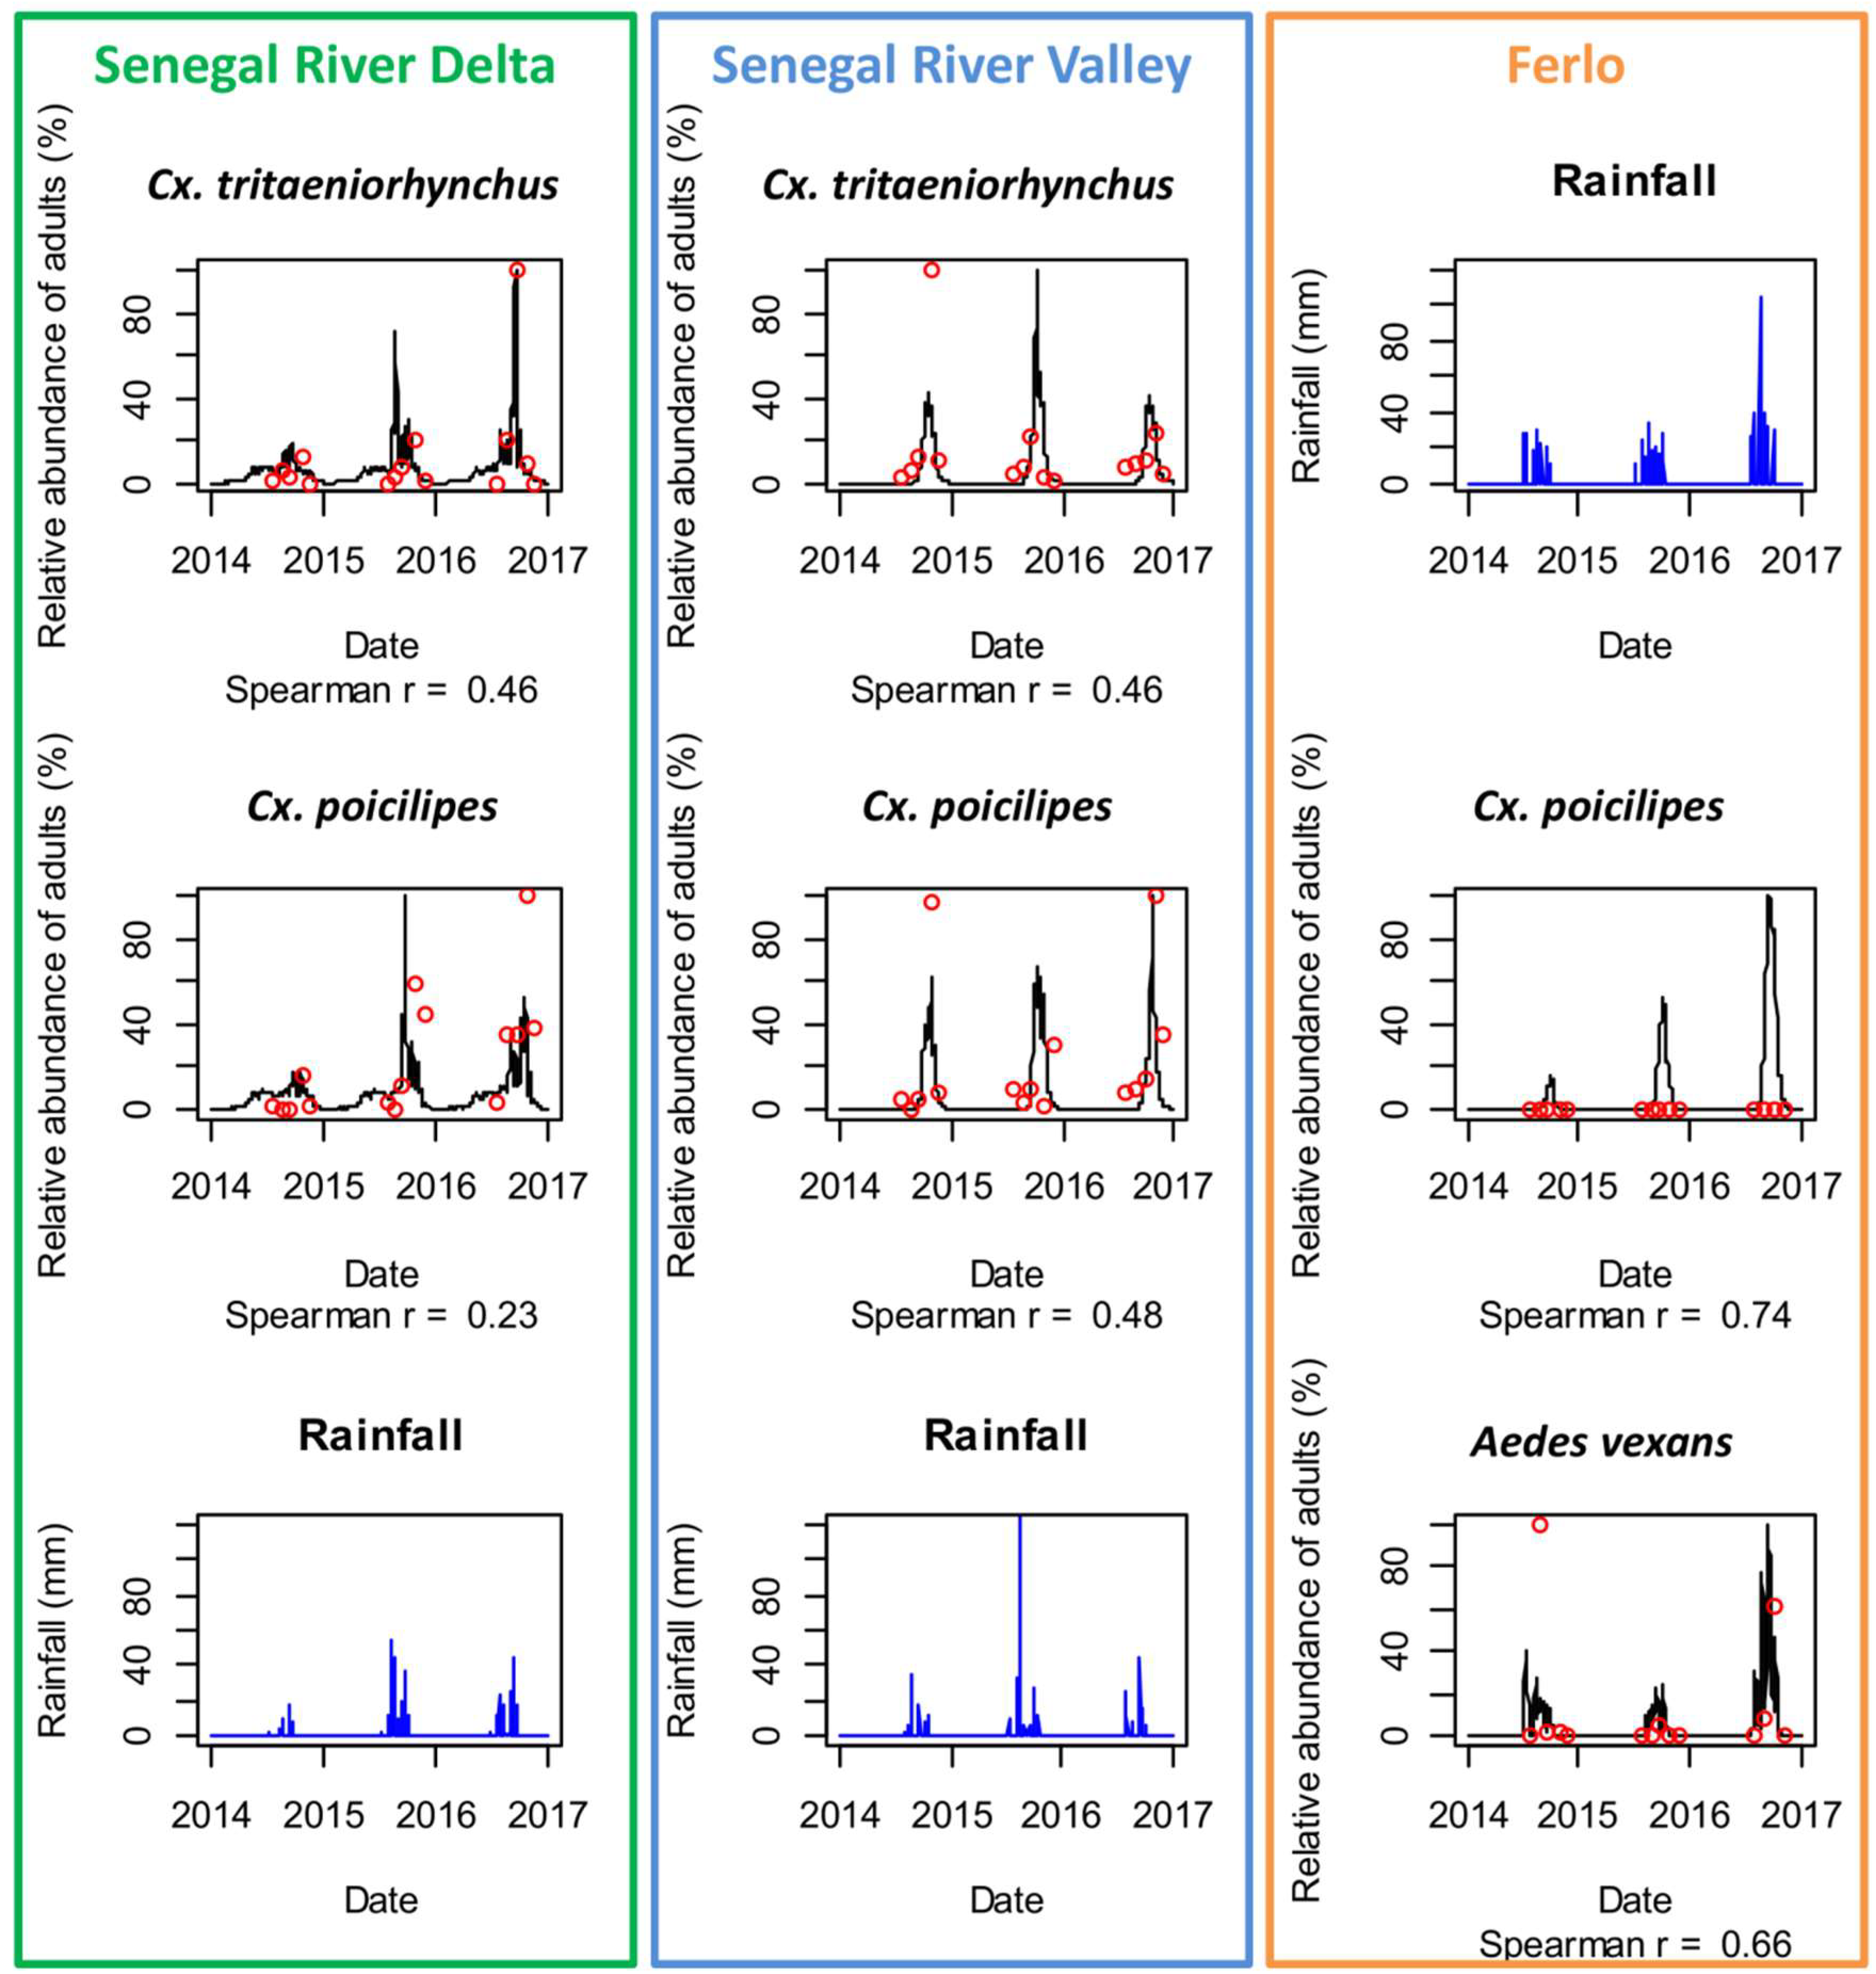
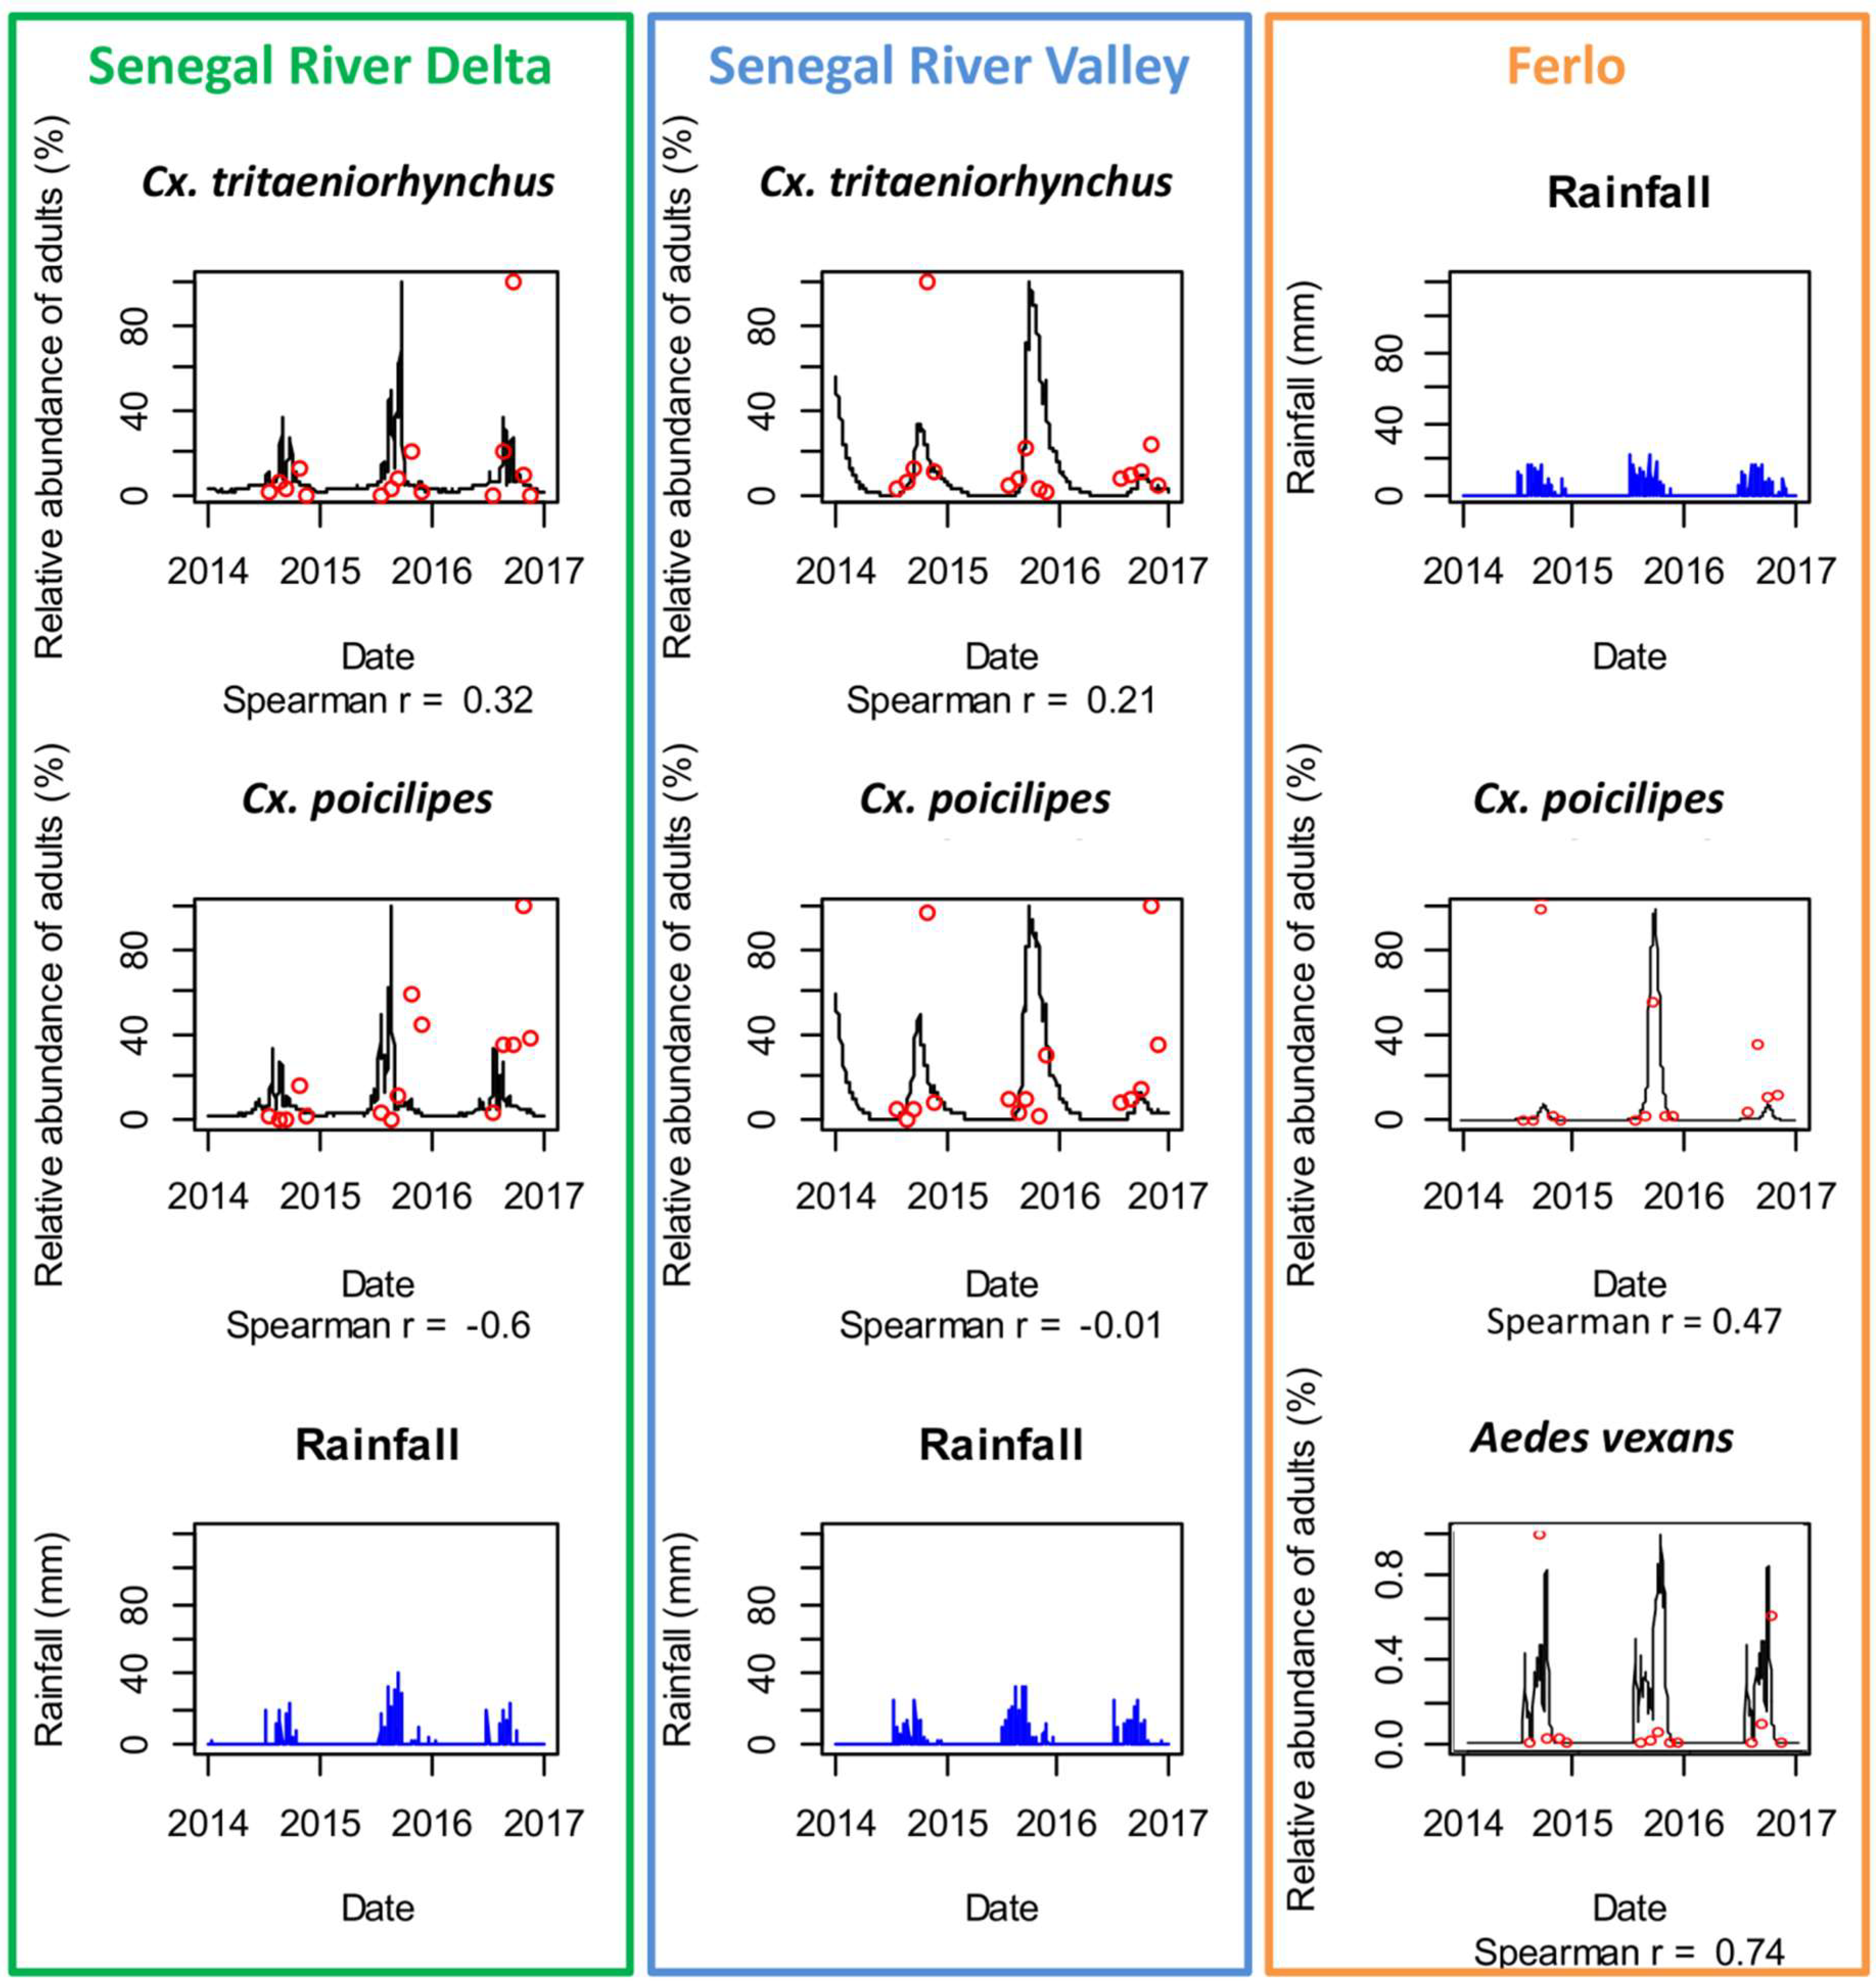
3.2. Mosquito Population Dynamics in the Three Study Sites

Based on in-situ daily rainfall, relative humidity and temperature data, the process-based model predicted the abundance of Ae. vexans, Cx. poicilipes and Cx. tritaeniorhynchus per stage (eggs, larvae, pupae, and nulliparous and parous female adult stages) over time. The predictions of the mosquito population models were consistent with the observed Ae. vexans, Cx. poicilipes and Cx. tritaeniorhynchus adult abundance for the three ecosystems in the period 2014–2016 (Figure 5 and Figure 6). In SRD, Cx. tritaeniorhynchus and Cx. poicilipes are present all over the year, with higher densities between April–November, and abundance peaks in August–September. In SRV, Cx. tritaeniorhynchus and Cx. poicilipes dynamics start in August with a peak in October. In the Ferlo ecosystem, Ae. vexans population dynamics starts with the first effective rain at the beginning of the rainy season (July), and is highly triggered by rainfall events until November whereas the population dynamics of Cx. poicilipes starts later (August) and increases gradually during the rainy season with a peak occurring in September and October.
Using in-situ weather data, the predicted and observed abundances were highly correlated in the Ferlo ecosystem where the population dynamics are driven by pond dynamics with a marked seasonality (Spearman correlation coefficient were 0.74 and 0.66 for Ae. vexans and Cx. poicilipes, respectively—detailed results for each monitored pond are provided in Figure S1). In SRD and SRV the correlation coefficients were lower (<0.5). Nevertheless, the observed and predicted periods of maximal abundance (between August–October) were well forecasted for all sites, and the presence of Culex species all over the year in SRD was reproduced by the model.
Using satellite-derived weather data, the model predicted correctly the dynamics of Ae. vexans and Cx. poicilipes in the Ferlo area (Spearman correlation coefficient = 0.74 and 0.47). In SRD and SRV, although the global trends of the Culex species dynamics were reproduced, the correlation coefficients between predicted and observed abundances were low (<0.3) and not significant (Figure 6).

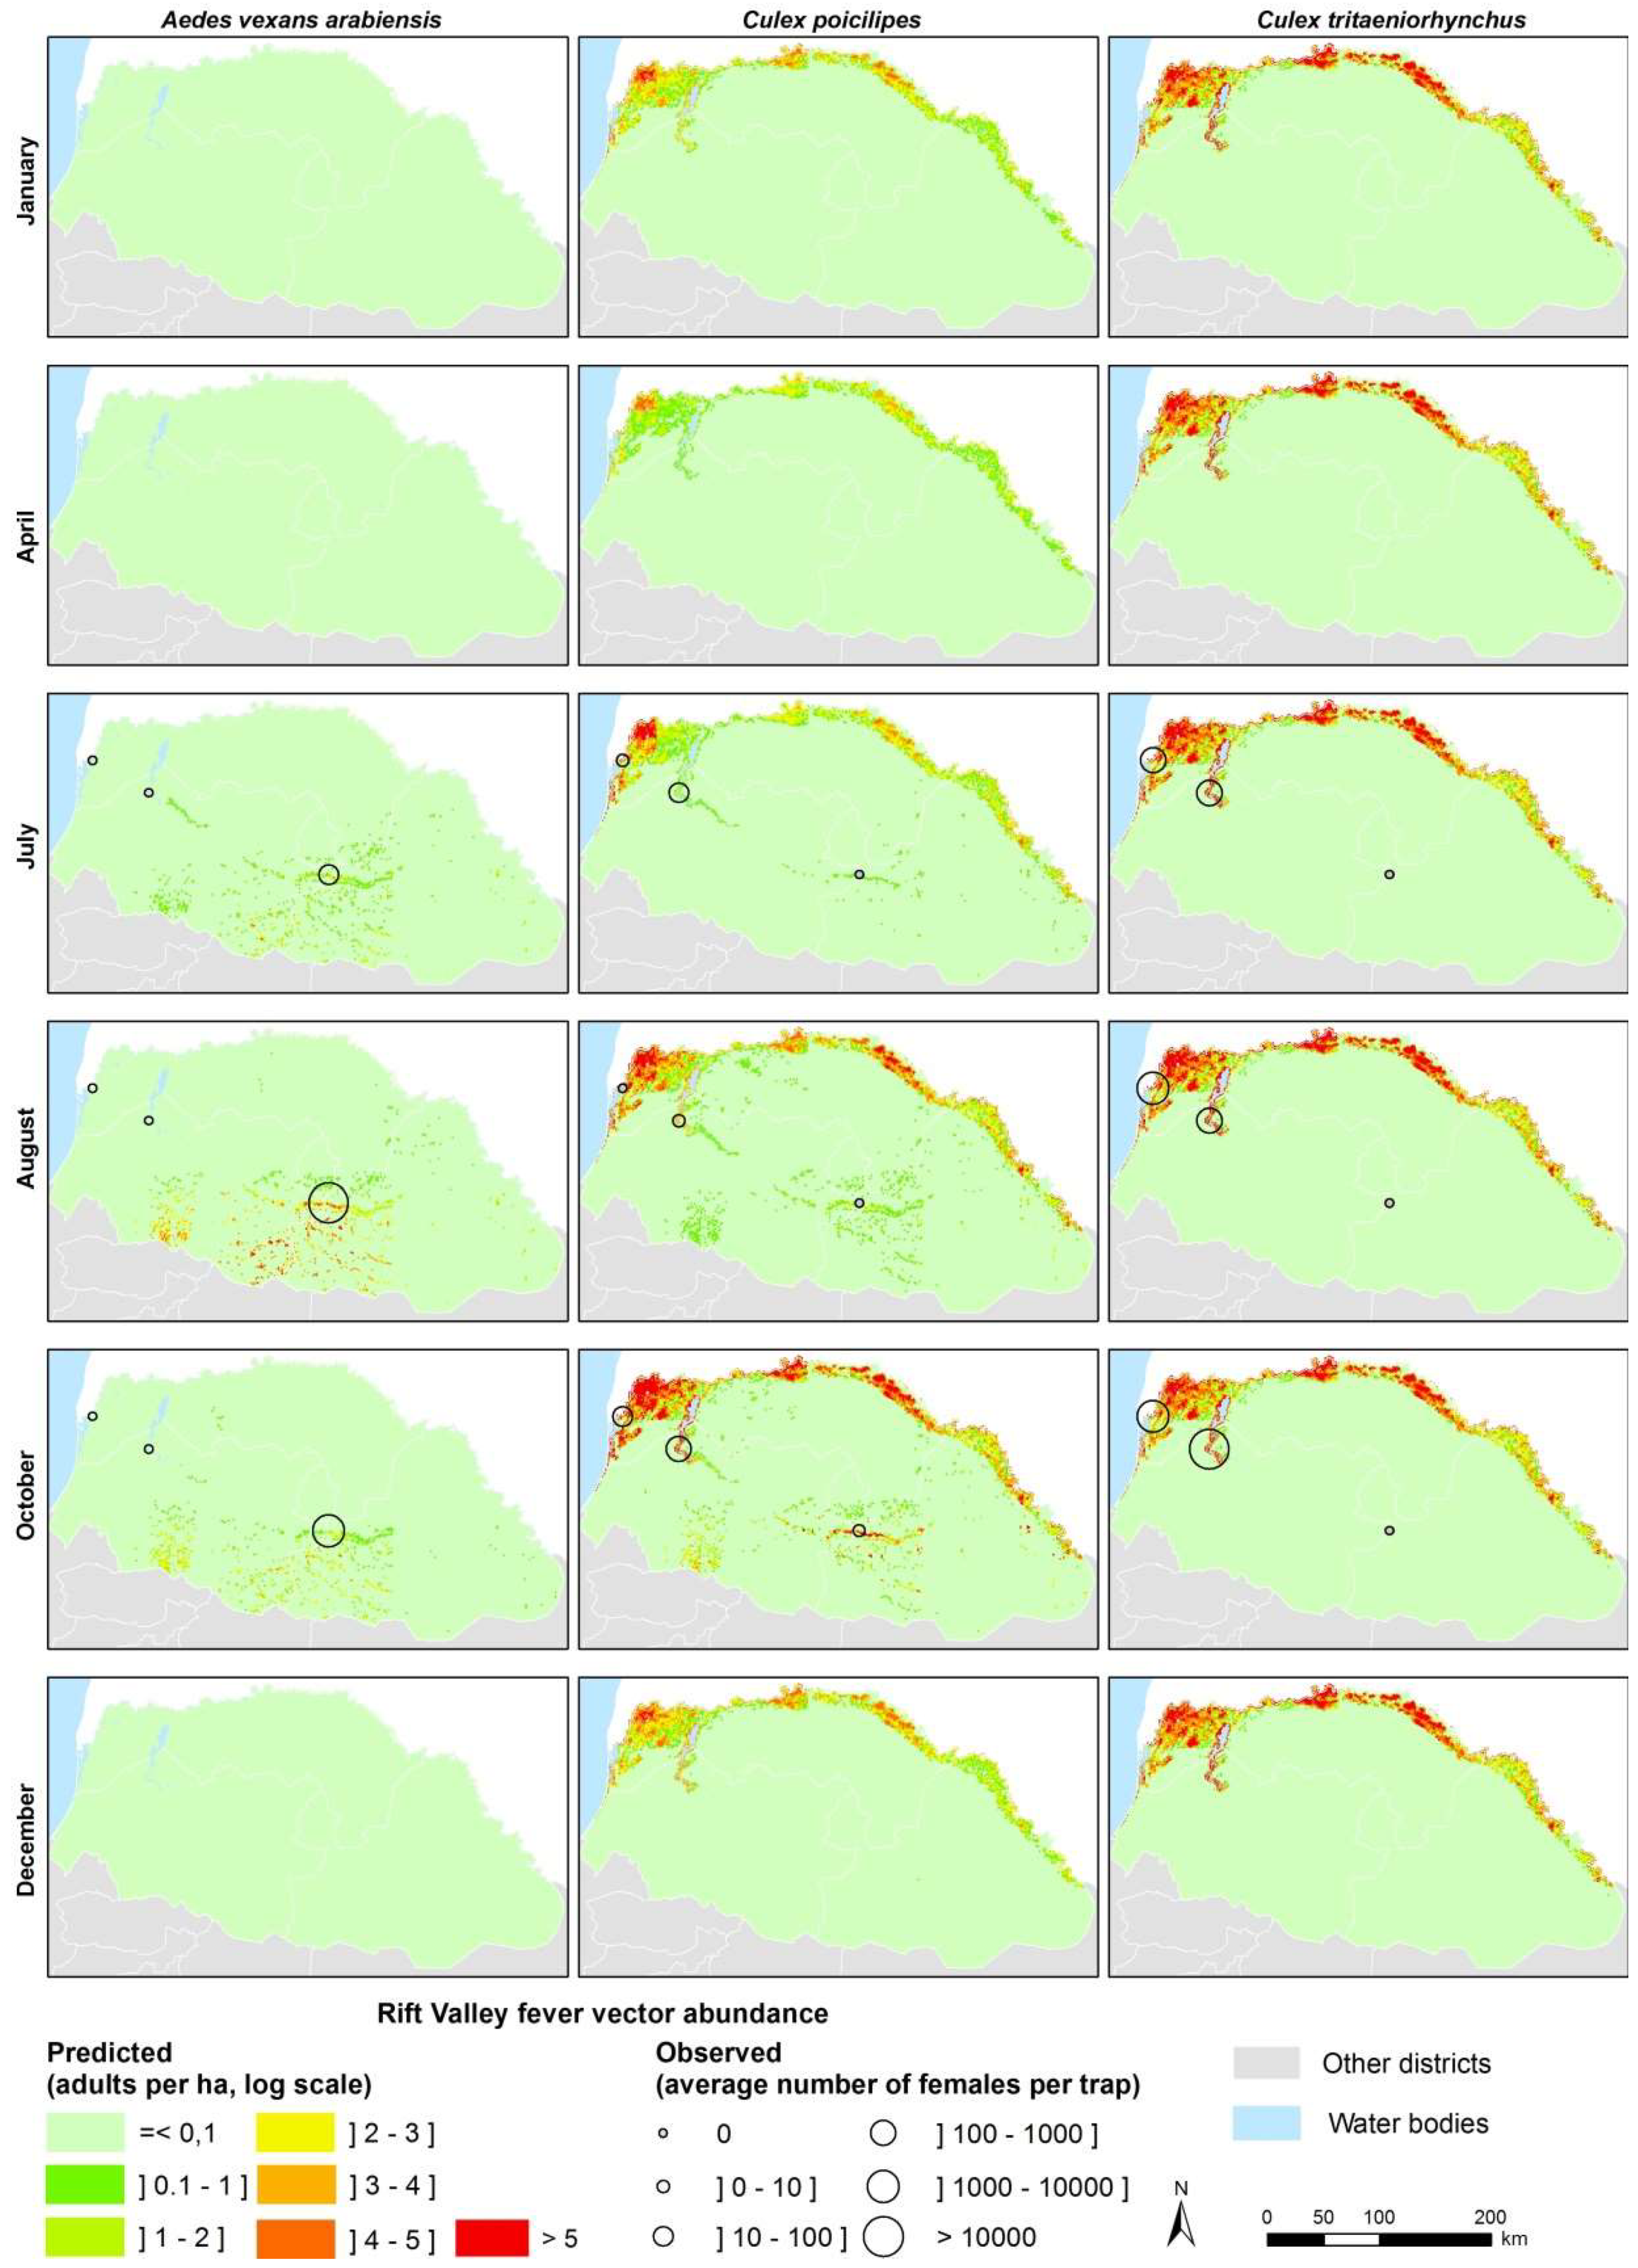
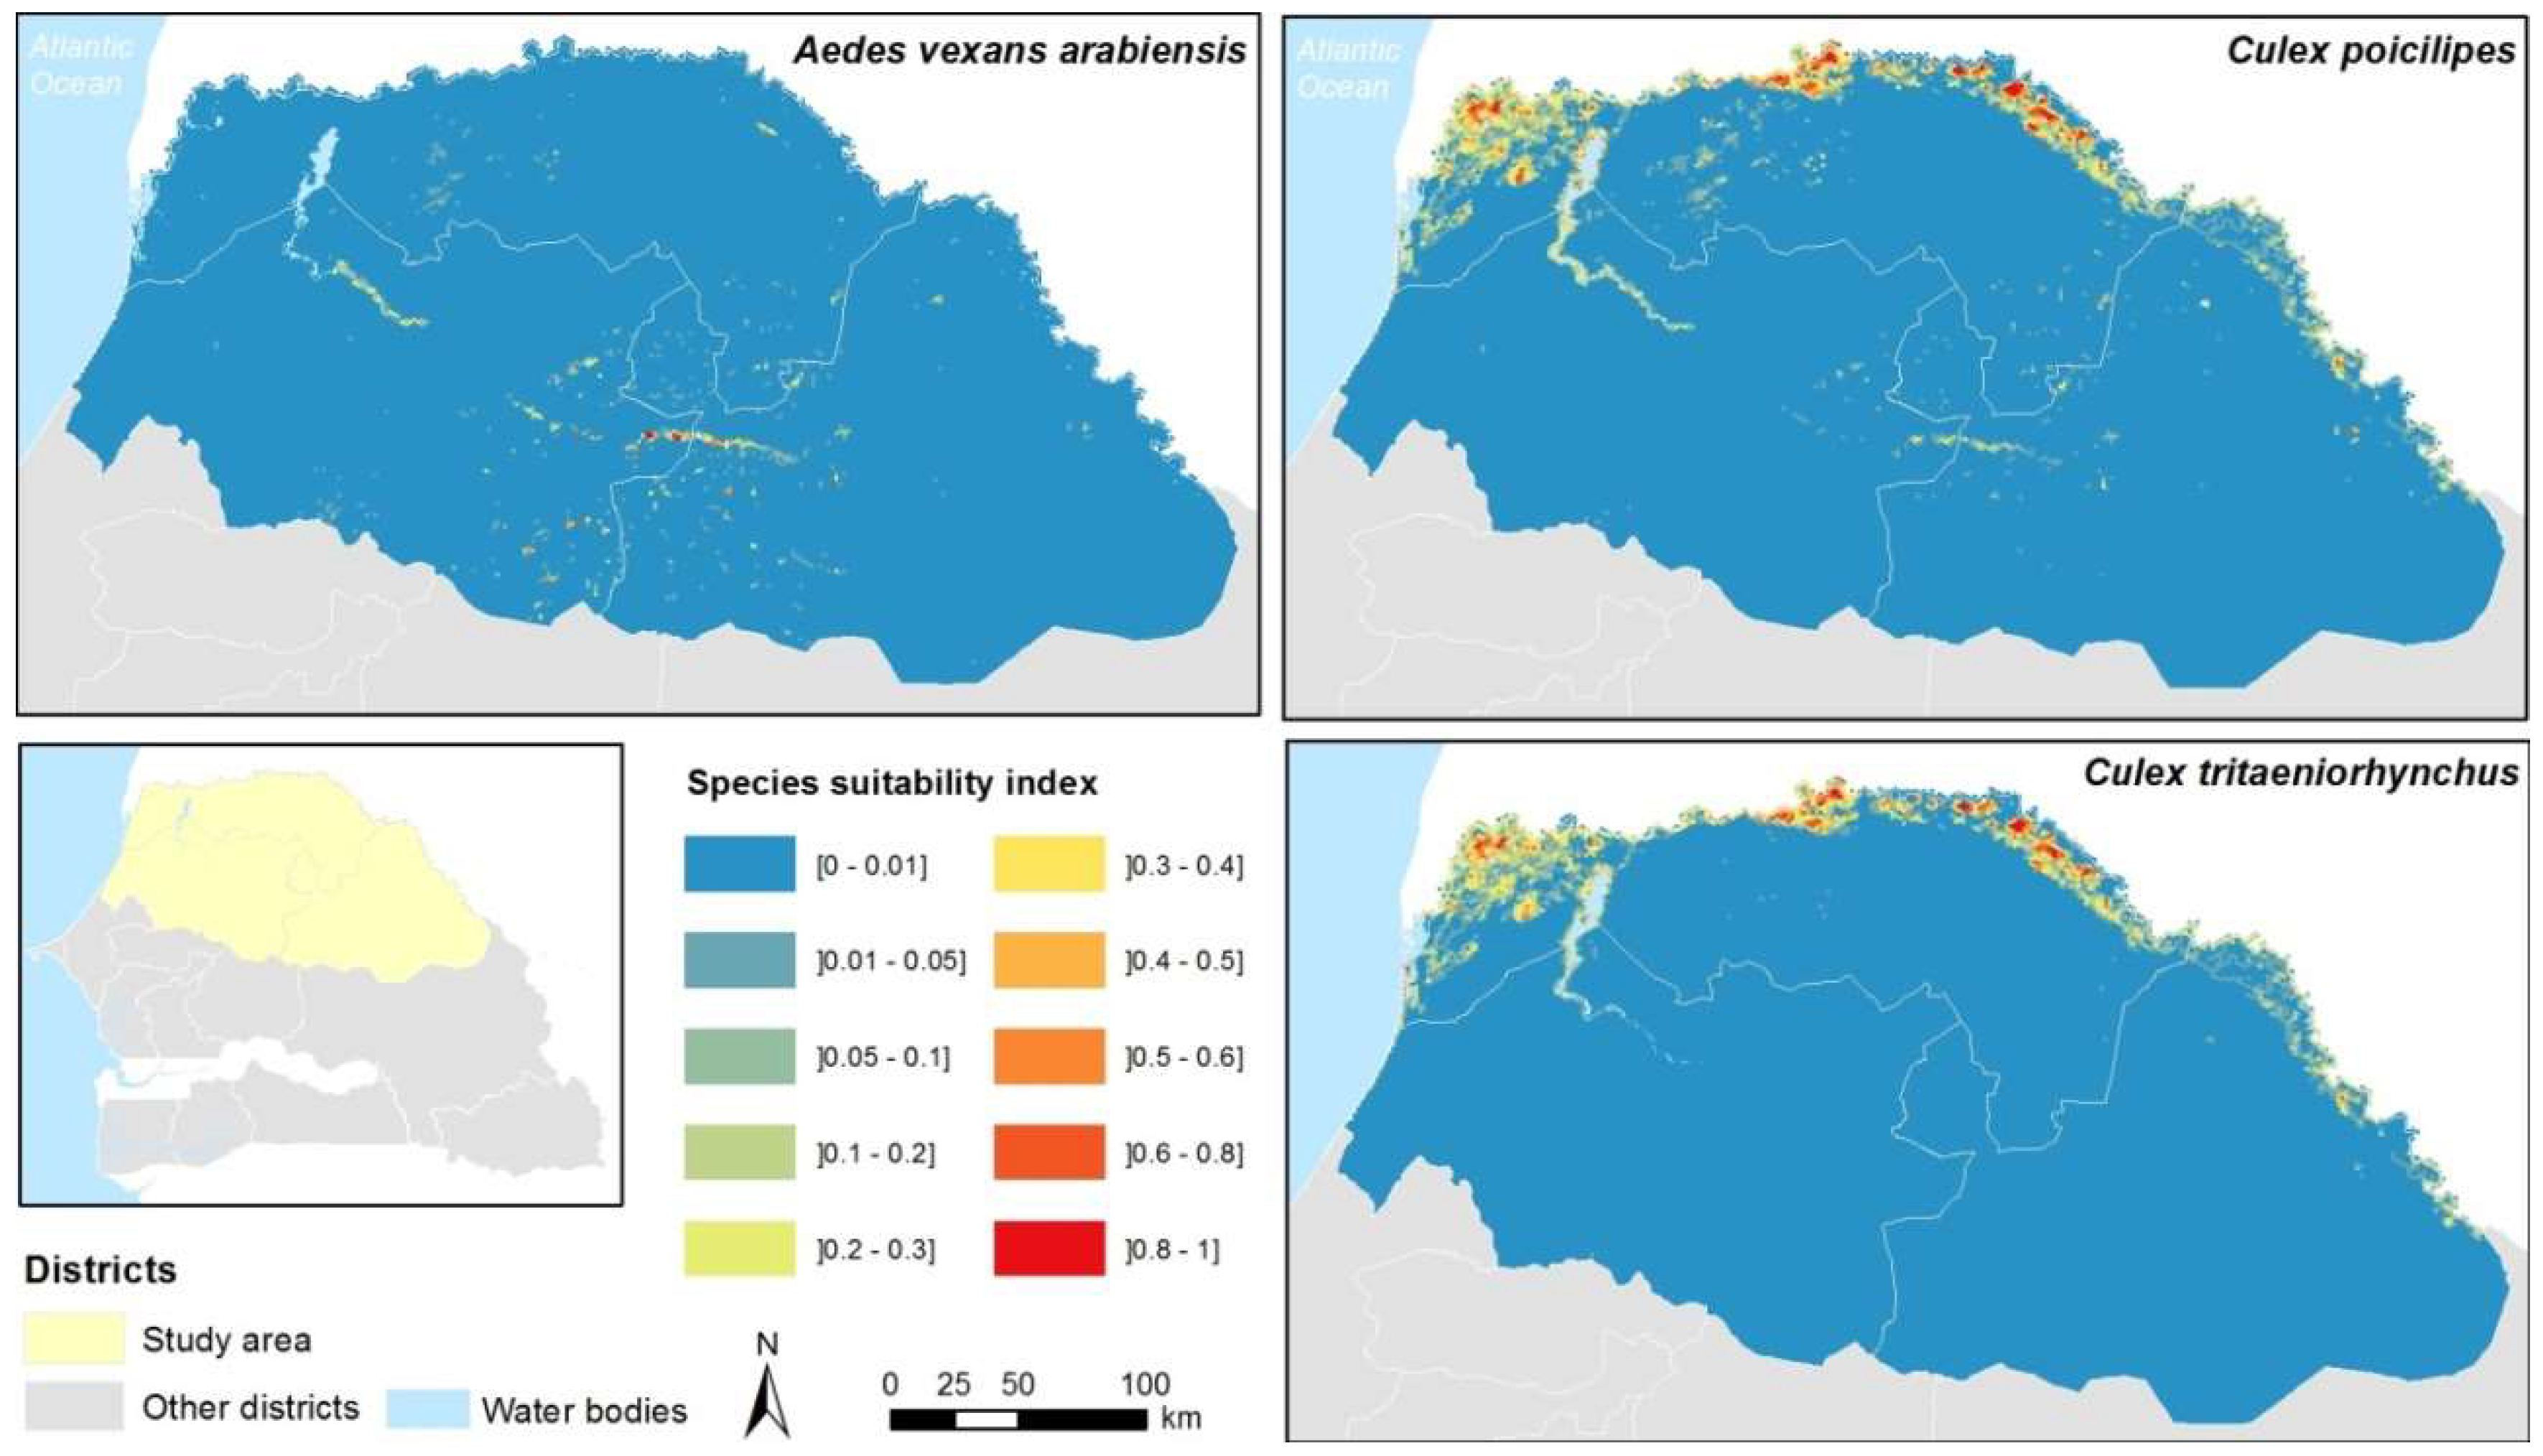
3.3. Model Predictions at Regional Scale

Based on satellite-derived rainfall and temperature data, maps of Ae. vexans, Cx. poicilipes and Cx. tritaeniorhynchus abundances were produced on a weekly basis for the three main agro-ecosystems of Northern Senegal (see examples of adult density maps for the year 2014 in Figure 7). The resulting maps highlight the spatial and temporal heterogeneity of the three species populations of concern (KML files are provided in Supplementary Information Videos S1–S3). Ae. vexans is mainly driven by rainfall and the related pond dynamics in the Ferlo area during the rainy season. The two Culex species are present all the year in SRD and SRV. Cx. poicilipes is present in the three ecosystems, less abundant than Cx. tritaeniorhynchus in SRD and SRV.

4. Discussion

RVF outbreak consequences may be devastating. Since no treatment exists for RVF, vaccination and vector control remain the most efficient tool to decrease disease incidence in both human and livestock. Obviously, periods and locations of outbreaks are strongly linked to vector abundances. Here we modeled the dynamics of Culicidae mosquito populations in three different ecosystems of Northern Senegal, at two different scales: (i) At local scale using in-situ weather data and (ii) at regional scale using satellite-derived data. To our best knowledge, this is the first time that such a modeling approach has been used to provide dynamic predictive maps of the main RVFV vector abundances at regional scale.

4.1. Environmental Drivers of RVFV Vector Populations

In this study we included three mosquito species as confirmed or potential RVFV vectors in Northern Senegal. Ae. vexans arabiensis and Cx. poicilipes have been identified as the main RVFV vectors in Ferlo [32,34,48]; Cx. tritaeniorhynchus is highly suspected to be involved in RVFV transmission in SRD and SRV because of its abundance [37,38] and frequent infections with RVFV [61].
Previous statistical modeling studies identified rainfall [35,36,48,62], temperature [36,62,63], and humidity [36,63] as important drivers of the population dynamic of these three species in Senegal. On the other hand, mechanistic modeling studies [11,12,46] aimed at modeling the pond dynamics from rainfall as main driver of Ae. vexans and Cx. poicilipes populations in the Ferlo area. In this work, we benefited from the complementarity of these different modeling methods and included the influence of all of these variables on transition and mortality rates of the three mosquito species considered. Other environmental variables, such as the vegetation cover around or inside the ponds or the dynamics of vegetation indices, were not included in our model, although their impact on mosquito dynamics has been reported [62,64]. Indeed, in arid areas it has been demonstrated that vegetation indices, such as the Normalized Difference Vegetation Index (NDVI) derived from MODIS imagery, was significantly correlated with the water height measured in the field [65]. In our model, rather than the NDVI proxy, we used the water surface of the temporary ponds as model inputs to model Ae. vexans and Cx. poicilipes dynamics in the Ferlo area. At regional scale, weather variables and their influence on the dynamics of water bodies seem sufficient to explain most of the observed variability in mosquito abundance. Vegetation cover around the water bodies may be introduced in the model of mosquito population dynamics to map the mosquito dispersal around the ponds at a finer landscape scale.

4.2. Mosquito Population Modeling Using in-Situ Weather Data

The parameters and functions of the process-based models developed in this study were defined from bibliographic review, including all expertise from studies conducted in Senegal [11,12,35,48,49]. Thus, by construction the outputs of the models are consistent with the results of previous entomological and modeling work on RVFV vectors in Senegal. In addition, we compared our model outputs with the results of entomological survey conducted in the three ecosystems over a three years period (2014–2016) [36]. The comparison between modeled and observed abundances (Figure 5) showed that our models can correctly predict the abundances of the three mosquito species over time using rainfall, temperature and humidity data. Yet, it should be noted that we compared relative values of observed and predicted abundances, and not absolute values. Indeed, the entomological collections give information on the number of mosquitoes per trap, not on the population. Standard mark-release-recapture experiments [66] would allow one to evaluate the capacity of the model to predict the absolute values of mosquito densities.
The best correlations between model outputs and observed abundances were obtained for Ae. vexans and Cx. poicilipes in the Ferlo ecosystem (Figure 5 and Figure S1), probably because most previous entomological and modeling studies on RVFV mosquito vectors were conducted in this ecosystem [11,12,35,48,49,62,63,64]. In addition, in the Ferlo ecosystem rainfall is the main driver of mosquito population dynamics, whereas in SRD and SRV other factors, such as irrigation, may have an impact.
On the other hand, less information on the life cycle of potential RVFV vectors in SRD and SRV is available [36,37,38,67]. Additional entomological field and lab surveys on the influence of weather and environmental conditions on the development, survival and gonotrophic cycles of Cx. poicilipes and Cx. tritaeniorhynchus may improve the models in SRD and SRV. Discrepancies between modeled and observed abundance for both Culex species in SRD and SRV may also be explained by the fact that water is available throughout the year in these two ecosystems, whereas it is the main limiting seasonal factor in the Ferlo area: Except in the close neighborhood of sinks, there are no mosquitoes in this area during the dry season, and the first Aedes vexans individuals appear after the first efficient rainfall event [35]. In SRD and SRV ecosystems, the Senegal River valley landscape includes a mosaic of wetlands and various crops, including rice fields, and thus provides various breeding sites for Culex species: Factors influencing vector population dynamics are probably more tricky to disentangle in this area than in the Ferlo where the link between rainfall and vector abundance has clearly been demonstrated. The environmental factors triggering the mosquito population dynamics in SRD and SRV remain to be fully understood from entomological field surveys.

4.3. Mosquito Population Modeling Using Satellite-Derived Weather Data

Using satellite-derived weather data, predictive dynamic maps of RVFV vectors at regional scale were produced (Figure 7), taking advantage of available remote sensing data in an otherwise data scarce region. In contrast to the more common statistical approach [17,18,68], our model incorporates satellite-derived data in a causal approach. As expected, the correlations between observed and modeled abundances were lower with satellite-derived weather data than using in-situ data. Significant correlations were observed between predicted and observed mosquito abundances from satellite estimates in the Ferlo area, but the correlation coefficients were not significant in SRD and SRV (Figure 6). These results suggest that with satellite-derived rainfall estimates as input, the model reproduces adequately the pond surfaces variations that trigger the Ae. vexans and Cx. poicilipes populations in the Ferlo area. Yet, in the two other ecosystems, our results demonstrate that in situ weather data are preferable to predict mosquito population dynamics. The combination of in-situ weather data collected from a network of meteorological stations and satellite-derived weather estimates may be an alternative to improve the precision of the predicted mosquito abundance maps.

4.4. Perspectives

In this study, we focused on the evaluation satellite-based estimates of meteorological variables as input of mosquito population dynamics models. We also used multispectral Sentinel-2 images to map, at a regional scale, the water bodies in the study area. Our results demonstrate that such a combination of different remote sensing data can provide valuable information to upscale in-situ data-based models developed at local scale. Other images from Earth Observation systems may provide complementary and useful information on the main drivers of mosquito dynamics and distribution, e.g. weather, water bodies, vegetation, land use, land cover. For example, the extent of flooded areas in Okavango Delta, Botswana, was derived from Moderate Resolution Imaging Spectroradiometer (MODIS) satellite imagery and used as input of the Culex pipiens population dynamics model [10]. The potential of recently launched Sentinel-1 and 2 satellites that provide high spatial resolution multispectral or radar images with wide swath width and high revisit time could be explored further [45,69]. Radar imagery can notably be used to detect both vegetated and open water bodies, map mosquito breeding sites [69] and thus provide better estimations of the number of ponds of each hexagonal cell used in our model (Appendix B). Another perspective of this work would consist in exploring the potential of Land Surface Temperature products (for example MODIS Land Surface Temperature and Emissivity MOD21 product), as a proxy for air temperature to be used as model input.
The regional predictive maps of Ae. vexans, Cx. poicilipes, and Cx. tritaeniorhynchus (Figure 7) reproduce the major trends of potential vectors of RVFV in Northern Senegal. These maps can be produced on a regular basis (daily, weekly, monthly) to monitor the vector populations (Videos S1–S3). Moreover, they could be integrated in spatial models of RVFV transmission, such as Geographic Information System-based multi-criteria evaluation models [70,71,72], spatial SIR models [73,74], or agent-based models [75]. Such models should take into account the animal mobility in Northern Senegal. Indeed, in the Ferlo area during rainy season, temporary ponds fill up, and combined with high quality grass, attract a massive flow of nomadic herds coming from the whole country. These nomadic herds start leaving the area, when ponds dry down, in October and November. There is a second documented nomadic flow arriving at the end of the rainy season and beginning of dry season, between November–January: These nomadic herders, take advantage of the few largest pools that remain flooded at this time [76]. Resident and nomadic herd densities, movements and immunity thus influence RVFV circulation in this area. Furthermore, ruminant herds are regularly moving across the boundaries between Senegal and Mauritania where RVF is also endemic. The role of ruminant herds, and their movement patterns should be further analyzed, before being able to combine all processes involved in RVFV circulation—and build a complete model of RVF circulation in that Sahelian region. Modeling this complex system that combines vector population dynamics, and ruminant herd related factors may provide in the coming years an efficient tool to forecast RVF outbreaks in the Ferlo area. This present work is a first essential step needed to build this early-warning tool.

5. Conclusions

For the first time, the population dynamics of RVFV vectors in Northern Senegal was modeled at regional scale, resulting in dynamic maps of mosquito abundances from satellite-derived estimates. These RVFV vector maps could be integrated in RVFV transmission models in order to provide RVF risk maps for planning surveillance and prevention activities. Our results stress the high potential of integrating remote sensing data from different sources in spatial models in order to model mosquito population dynamics in space and time.

Supplementary Materials

The following are available online at https://www.mdpi.com/2072-4292/11/9/1024/s1, File S1: Sensitivity analysis of the mosquito population dynamics models. Figure S1: Comparison of observed (red dots) and predicted (black lines) mosquito population dynamics in the three study ponds (Nacara, Djidou and Diaby) of Younoufere study area, Ferlo, Senegal, 2014–2016. Video S1: Illustration of predicted Aedes vexans adult dynamics in Northern Senegal, 2014 (KML file for visualization with Google Earth). Video S2: Illustration of predicted Culex poicilipes adult dynamics in Northern Senegal, 2014 (KML file for visualization with Google Earth). Video S3: Illustration of predicted Cx. tritaeniorhynchus adult dynamics in Northern Senegal, 2014 (KML file for visualization with Google Earth).

Author Contributions

Conceptualization, A.T., A.G.F., M.T.S., and V.C.; methodology, A.T.; software, A.T., and M.C. (Mathieu Castets); validation, A.T., and M.C. (Mamadou Ciss); formal analysis, A.T., and V.C.; investigation, A.T., A.G.F., B.B., and G.G.; resources, A.T., A.G.F., B.B., and M.T.S.; data curation, A.T.; writing—original draft preparation, A.T.; writing—review and editing, all co-authors; visualization, A.T.; supervision, V.C.; project administration, A.G.F., M.T.S., and V.C.; funding acquisition, V.C.

Funding

This research was funded by EU grant FP7-613996 Vmerge and is catalogued by the VMERGE Steering Committee as Vmerge026. The content of this publication are the sole responsibility of the authors and do not necessarily reflect the views of the European Commission.

Acknowledgments

The authors would like to thank the Direction des Services Vétérinaires (DSV), and the breeders for their collaboration. Thanks to Pascal Degenne and Danny Lo Seen (CIRAD) for technical support with Ocelet modeling language, and to Modou Moustapha Lo (ISRA), Benoît Durand (ANSES), Serafin Gutierrez, Patricia Gil, Thomas Balenghien and Renaud Lancelot (CIRAD) for discussions during the Vmerge project.

Conflicts of Interest

The authors declare no conflict of interest.

Appendix A. Hydrologic Model Description

In the hydrologic model [46], the relations between water height (H), surface (S) and volume (V) of a pond are modeled by two simple volume-depth and area-depth empirical equations:
S ( t ) = S 0 ( H ( t ) H 0 ) α
V ( t ) = V 0 ( H ( t ) H 0 ) α + 1 w i t h   V 0 = S 0 H 0 α + 1
A daily water balance model to predict surface of ponds (Figure A1):
d V d t = P ( t ) S ( t ) + Q i n ( t ) L . S ( t )
with P(t) the rainfall, L the water loss per unit surface are through evaporation and infiltration, and Qin(t) the runoff volume of inflows.
Figure A1. Schematic representation of the water balance model.
Remotesensing 11 01024 g0a1
Qin is expressed as the product of a runoff coefficient (Kr), the catchment area of the pond (Ac) and the effective rainfall Pe:
Q i n ( t ) = K r P e ( t ) A C
The effective rainfall Pe is the part of the precipitation that produces runoff and is calculated as follows:
P e ( t ) = max [ P ( t ) G ( t ) , 0 ]
with G(t) a threshold rainfall value over which runoff can occur:
G ( t ) = max [ G m a x I a p ( t ) , 0 ]
The Iap Index is a weighted sum of past precipitation amounts:
I a p ( t ) = [ I a p ( t 1 ) + P ( t 1 ) ] k
with k a dimensionless coefficient.
The model parameter values are those estimated in [46] for Ferlo main stream ponds: S0 = 50,000 m2, α = 2.57, H0 = 1 m, Kr = 0.21, Gmax = 15 mm·day−1, k = 0.4, and L = 15 mm·day−1.

Appendix B. Cell Characterization-Estimations of the Water Surface in the Cell, the Number of Ponds, and a Suitability Index for the Presence of Cx. tritaeniorhynchus, Cx. poicilipes, and Ae. vexans

To apply the mosquito population dynamics models at regional scale, we divided the study area (Figure 1) into 1 km radius hexagonal cells. Each cell was characterized by its surface in water in rain season, the number of ponds in the Ferlo area, and a suitability index for the presence of the three studied species.
For each 1 km hexagonal cell, the water surface in the cell was calculated from the water body map derived from Sentinel-2 MNDWI index. The proportion of surface covered by water was also calculated. This second index ranges from 0 (no water detected in the cell) to 1 (the cell is fully covered by water).
For ‘Ferlo’ cells, the number of ponds was estimated by dividing the water surface in a cell by the maximum size of Diaby pond (40,000 m2), chosen as being representative of Ferlo ponds.
Suitability indices for the presence of the three potential RVFV species were estimated for each 1 km hexagonal cell according to two information sources: (i) the proportion of the cell covered by water bodies and (ii) the distance to the Senegal river. Indeed, water bodies (temporary ponds, lakes or river) are the main drivers of mosquito presence in the semi-arid regions of Northern Senegal. According to previous studies, only Cx. poicilipes is present in the Ferlo and in the Senegal River Delta and the Senegal River Valley. Ae. vexans is rarely observed outside of the Ferlo area, and Cx. tritaeniorhynchus rarely observed in the Ferlo [36]. Thus, the probability of presence of Ae. vexans mosquitoes increases with the distance to the Senegal Valley, whereas the probability of presence of Cx. poicilipes and Cx. tritaeniorhynchus decreases with this distance [36]. Thus, for each 1 km hexagonal cell a distance index ranging from 0 (low suitability) to 1 (high suitability) was computed for each species according to the membership functions described in Figure A2. The distances to the Senegal Valley at which the probability observing Cx. poicilipes or Cx. tritaeniorhynchus is near zero, were estimated from expert knowledge.
Figure A2. Distance index of Ae. vexans arabiensis, Culex poicilipes and Culex tritaeniorhyncus, Northern Senegal.
Remotesensing 11 01024 g0a2
A suitability index was computed for each species and each 1 km cell as the product of the distance index and the proportion of water areas (Figure A3).
Figure A3. Suitability index maps for Ae. vexans arabiensis, Culex poicilipes and Culex tritaeniorhyncus, Northern Senegal.
Remotesensing 11 01024 g0a3

References

  1. Lord, C.C. Modeling and biological control of mosquitoes. J. Am. Mosq. Control Assoc. 2007, 23, 252–264. [Google Scholar] [CrossRef]
  2. Juliano, S.A. Population dynamics. J. Am. Mosq. Control Assoc. 2007, 23, 265–275. [Google Scholar] [CrossRef]
  3. Ezanno, P.; Aubry-Kientz, M.; Arnoux, S.; Cailly, P.; L’Ambert, G.; Toty, C.; Balenghien, T.; Tran, A. A generic weather-driven model to predict mosquito population dynamics applied to species of Anopheles, Culex and Aedes genera of southern France. Prev. Vet. Med. 2015, 120, 39–50. [Google Scholar] [CrossRef]
  4. Beck-Johnson, L.M.; Nelson, W.A.; Paaijmans, K.P.; Read, A.F.; Thomas, M.B.; Bjornstad, O.N. The effect of temperature on Anopheles mosquito population dynamics and the potential for malaria transmission. PLoS ONE 2013, 8, e79276. [Google Scholar] [CrossRef]
  5. Depinay, J.M.; Mbogo, C.M.; Killeen, G.; Knols, B.; Beier, J.; Carlson, J.; Dushoff, J.; Billingsley, P.; Mwambi, H.; Githure, J.; et al. A simulation model of African Anopheles ecology and population dynamics for the analysis of malaria transmission. Malar. J. 2004, 3, 29. [Google Scholar] [CrossRef] [PubMed]
  6. Focks, D.A.; Haile, D.G.; Daniels, E.; Mount, G.A. Dynamic life table model for Aedes aegypti (diptera: Culicidae): Simulation results and validation. J. Med. Entomol. 1993, 30, 1018–1028. [Google Scholar] [CrossRef] [PubMed]
  7. Otero, M.; Solari, H.G.; Schweigmann, N. A stochastic population dynamics model for Aedes aegypti: Formulation and application to a city with temperate climate. Bull. Math. Biol. 2006, 68, 1945–1974. [Google Scholar] [CrossRef]
  8. Tran, A.; L’Ambert, G.; Lacour, G.; Benoît, R.; Demarchi, M.; Cros, M.; Cailly, P.; Aubry-Kientz, M.; Balenghien, T.; Ezanno, P. A rainfall- and temperature-driven abundance model for Aedes albopictus populations. Int. J. Environ. Res. Public Health 2013, 10, 1698–1719. [Google Scholar] [CrossRef] [PubMed]
  9. Erguler, K.; Smith-Unna, S.E.; Waldock, J.; Proestos, Y.; Christophides, G.K.; Lelieveld, J.; Parham, P.E. Large-Scale Modelling of the Environmentally-Driven Population Dynamics of Temperate Aedes albopictus (Skuse). PLoS ONE 2016, 11, e0149282. [Google Scholar] [CrossRef]
  10. Hammami, P.; Tran, A.; Kemp, A.; Tschikae, P.; Kgori, P.; Chevalier, V.; Paweska, J.; Jori, F. Rift Valley fever vector diversity and impact of meteorological and environmental factors on Culex pipiens dynamics in the Okavango Delta, Botswana. Parasit. Vectors 2016, 9, 434. [Google Scholar] [CrossRef]
  11. Soti, V.; Tran, A.; Degenne, P.; Chevalier, V.; Lo Seen, D.; Thiongane, Y.; Diallo, M.; Guegan, J.F.; Fontenille, D. Combining hydrology and mosquito population models to identify the drivers of rift valley Fever emergence in semi-arid regions of west Africa. PLoS Negl. Trop. Dis. 2012, 6, e1795. [Google Scholar] [CrossRef] [PubMed]
  12. Porphyre, T.; Bicout, D.J.; Sabatier, P. Modelling the abundance of mosquito vectors versus flooding dynamics. Ecol. Model. 2005, 183, 173–181. [Google Scholar] [CrossRef]
  13. Clements, A.N. The Biology of Mosquitoes: Development; Nutrition and Reproduction; CABI Publishing: Eastbourne, UK, 2000. [Google Scholar]
  14. Chuang, T.W.; Henebry, G.M.; Kimball, J.S.; Vanroekel-Patton, D.L.; Hildreth, M.B.; Wimberly, M.C. Satellite Microwave Remote Sensing for Environmental Modeling of Mosquito Population Dynamics. Remote Sens. Environ. 2012, 125, 147–156. [Google Scholar] [CrossRef] [Green Version]
  15. Tran, A.; Kassié, D.; Herbreteau, V. Applications of Remote Sensing to the Epidemiology of Infectious Diseases: Some Examples. In Land Surface Remote Sensing: Environment and Risks; Baghdadi, N., Zribi, M., Eds.; Elsevier: Amsterdam, The Netherlands, 2016; pp. 295–316. [Google Scholar]
  16. Leedale, J.; Jones, A.E.; Caminade, C.; Morse, A.P. A dynamic, climate-driven model of Rift Valley fever. Geospat. Health 2016, 11, 394. [Google Scholar] [CrossRef] [PubMed]
  17. Anyamba, A.; Linthicum, K.J.; Small, J.; Britch, S.C.; Pak, E.; de La Rocque, S.; Formenty, P.; Hightower, A.W.; Breiman, R.F.; Chretien, J.P.; et al. Prediction, assessment of the Rift Valley fever activity in East and Southern Africa 2006-2008 and possible vector control strategies. Am. J. Trop. Med. Hyg. 2010, 83, 43–51. [Google Scholar] [CrossRef] [PubMed]
  18. Linthicum, K.J.; Anyamba, A.; Tucker, C.J.; Kelley, P.W.; Myers, M.F.; Peters, C.J. Climate and satellite indicators to forecast Rift Valley fever epidemics in Kenya. Science 1999, 285, 397–400. [Google Scholar] [CrossRef]
  19. Metras, R.; Jewell, C.; Porphyre, T.; Thompson, P.N.; Pfeiffer, D.U.; Collins, L.M.; White, R.G. Risk factors associated with Rift Valley fever epidemics in South Africa in 2008-11. Sci. Rep. 2015, 5, 9492. [Google Scholar] [CrossRef] [PubMed]
  20. Adimi, F.; Soebiyanto, R.P.; Safi, N.; Kiang, R. Towards malaria risk prediction in Afghanistan using remote sensing. Malar. J. 2010, 9, 125. [Google Scholar] [CrossRef] [PubMed]
  21. Moiroux, N.; Djenontin, A.; Bio-Bangana, A.S.; Chandre, F.; Corbel, V.; Guis, H. Spatio-temporal analysis of abundances of three malaria vector species in southern Benin using zero-truncated models. Parasit. Vectors 2014, 7, 103. [Google Scholar] [CrossRef]
  22. Dambach, P.; Machault, V.; Lacaux, J.P.; Vignolles, C.; Sie, A.; Sauerborn, R. Utilization of combined remote sensing techniques to detect environmental variables influencing malaria vector densities in rural West Africa. Int. J. Health Geogr. 2012, 11, 8. [Google Scholar] [CrossRef]
  23. Peyre, M.; Chevalier, V.; Abdo-Salem, S.; Velthuis, A.; Antoine-Moussiaux, N.; Thiry, E.; Roger, F. A Systematic Scoping Study of the Socio-Economic Impact of Rift Valley Fever: Research Gaps and Needs. Zoonoses Public Health 2015, 62, 309–325. [Google Scholar] [CrossRef]
  24. Wilson, M.L. Rift Valley fever virus ecology and the epidemiology of disease emergence. Ann. N. Y. Acad. Sci. 1994, 740, 169–180. [Google Scholar] [CrossRef]
  25. Pepin, M.; Bouloy, M.; Bird, B.H.; Kemp, A.; Paweska, J. Rift Valley fever virus (Bunyaviridae: Phlebovirus): An update on pathogenesis, molecular epidemiology, vectors, diagnostics and prevention. Vet. Res. 2010, 41, 61. [Google Scholar] [CrossRef]
  26. Nicolas, G.; Durand, B.; Rakotoarimanana, T.T.; Lacote, S.; Chevalier, V.; Marianneau, P. A 3-year serological and virological cattle follow-up in Madagascar highlands suggests a non-classical transmission route of Rift Valley fever virus. Am. J. Trop. Med. Hyg. 2014, 90, 265–266. [Google Scholar] [CrossRef]
  27. Jouan, A.; Le Guenno, B.; Digoutte, J.P.; Philippe, B.; Riou, O.; Adam, F. An RVF epidemic in southern Mauritania. Ann. Inst. Pasteur. Virol. 1988, 139, 307–308. [Google Scholar] [CrossRef]
  28. Zeller, H.G.; Fontenille, D.; Traore-Lamizana, M.; Thiongane, Y.; Digoutte, J.P. Enzootic activity of Rift Valley fever virus in Senegal. Am. J. Trop. Med. Hyg. 1997, 56, 265–272. [Google Scholar] [CrossRef] [PubMed]
  29. Chevalier, V.; Lancelot, R.; Thiongane, Y.; Sall, B.; Diaite, A.; Mondet, B. Rift Valley fever in small ruminants, Senegal, 2003. Emerg. Infect. Dis. 2005, 11, 1693–1700. [Google Scholar] [CrossRef] [PubMed]
  30. Thonnon, J.; Picquet, M.; Thiongane, Y.; Lo, M.A.; Sylla, R.; Vercruysse, J. Rift valley fever surveillance in lower Senegal river basin: Update 10 years after the epidemic. Trop. Med. Int. Health 1999, 4, 580–585. [Google Scholar] [CrossRef]
  31. Sow, A.; Faye, O.; Ba, Y.; Diallo, D.; Fall, G.; Faye, O.; Bob, N.S.; Loucoubar, C.; Richard, V.; Dia, A.T.; et al. Widespread Rift Valley Fever Emergence in Senegal in 2013-2014. Open Forum Infect. Dis. 2016, 3, ofw149. [Google Scholar] [CrossRef] [PubMed]
  32. Diallo, M.; Lochouarn, L.; Ba, K.; Sall, A.A.; Mondo, M.; Girault, L.; Mathiot, C. First isolation of the Rift Valley fever virus from Culex poicilipes (Diptera: Culicidae) in nature. Am. J. Trop. Med. Hyg. 2000, 62, 702–704. [Google Scholar] [CrossRef]
  33. Fontenille, D.; Traore-Lamizana, M.; Diallo, M.; Thonnon, J.; Digoutte, J.P.; Zeller, H.G. New vectors of Rift Valley fever in west Africa. Emerg. Infect. Dis. 1998, 4, 289–293. [Google Scholar] [CrossRef]
  34. Diallo, M.; Nabeth, P.; Ba, K.; Sall, A.A.; Ba, Y.; Mondo, M.; Girault, L.; Abdalahi, M.O.; Mathiot, C. Mosquito vectors of the 1998–1999 outbreak of Rift Valley Fever and other arboviruses (Bagaza, Sanar, Wesselsbron and West Nile) in Mauritania and Senegal. Med. Vet. Entomol. 2005, 19, 119–126. [Google Scholar] [CrossRef]
  35. Mondet, B.; Diaite, A.; Ndione, J.A.; Fall, A.G.; Chevalier, V.; Lancelot, R.; Ndiaye, M.; Poncon, N. Rainfall patterns and population dynamics of Aedes (Aedimorphus) vexans arabiensis, Patton 1905 (Diptera: Culicidae), a potential vector of Rift Valley Fever virus in Senegal. J. Vector Ecol. 2005, 30, 102–106. [Google Scholar]
  36. Biteye, B.; Fall, A.G.; Ciss, M.; Seck, M.T.; Apolloni, A.; Fall, M.; Gimonneau, G. Ecological distribution and population dynamics of Rift Valley fever virus mosquito vectors (Diptera, Culicidae) in Senegal. Parasit. Vectors 2018, 11, 1–6. [Google Scholar] [CrossRef]
  37. Fall, A.G.; Diaite, A.; Lancelot, R.; Tran, A.; Soti, V.; Etter, E.; Konate, L.; Faye, O.; Bouyer, J. Feeding behaviour of potential vectors of West Nile virus in Senegal. Parasit. Vectors 2011, 4, 99. [Google Scholar] [CrossRef]
  38. Fall, A.G.; Diaite, A.; Seck, M.T.; Bouyer, J.; Lefrancois, T.; Vachiery, N.; Aprelon, R.; Faye, O.; Konate, L.; Lancelot, R. West Nile virus transmission in sentinel chickens and potential mosquito vectors, Senegal River Delta, 2008-2009. Int. J. Environ. Res. Public Health 2013, 10, 4718–4727. [Google Scholar] [CrossRef]
  39. Jupp, P.G.; Kemp, A.; Grobbelaar, A.; Leman, P.; Burt, F.J.; Alahmed, A.M.; Al Mujalli, D.; Al Khamees, M.; Swanepoel, R. The 2000 epidemic of Rift Valley fever in Saudi Arabia: Mosquito vector studies. Med. Vet. Entomol. 2002, 16, 245–252. [Google Scholar] [CrossRef]
  40. Bicout, D.J.; Sabatier, P. Mapping Rift Valley Fever vectors and prevalence using rainfall variations. Vector-Borne Zoonotic Dis. 2004, 4, 33–42. [Google Scholar] [CrossRef]
  41. Cailly, P.; Tran, A.; Balenghien, T.; L’Ambert, G.; Toty, C.; Ezanno, P. A climate-driven abundance model to assess mosquito control strategies. Ecol. Model. 2012, 227, 7–17. [Google Scholar] [CrossRef]
  42. OIE. Rift Valley Fever-Senegal: (DK) Bovine. Available online: http://www.promedmail.org (accessed on 18 December 2018).
  43. Allen, R.G.; Pereira, L.S.; Raes, D.; Smith, M. Crop Evapotranspiration (Guidelines for Computing Crop Water Requirements); FAO—Food and Agriculture Organization of the United Nations: Rome, Italy, 1998; Volume 56, Available online: http://www.fao.org/docrep/X0490E/X0490E00.htm#Contents (accessed on 18 December 2018).
  44. Xu, H.Q. Modification of normalised difference water index (NDWI) to enhance open water features in remotely sensed imagery. Int. J. Remote Sens. 2006, 27, 3025–3033. [Google Scholar] [CrossRef]
  45. Du, Y.; Zhang, Y.; Ling, F.; Wang, Q.; Li, W.; Li, X. Water Bodies’ Mapping from Sentinel-2 Imagery with Modified Normalized Difference Water Index at 10-m Spatial Resolution Produced by Sharpening the SWIR Band. Remote Sens. 2016, 8, 354. [Google Scholar] [CrossRef]
  46. Soti, V.; Puech, C.; Lo Seen, D.; Bertran, A.; Vignolles, C.; Mondet, B.; Dessay, N.; Tran, A. The potential for remote sensing and hydrologic modelling to assess the spatio-temporal dynamics of ponds in the Ferlo Region (Senegal). Hydrol. Earth Syst. Sci. 2010, 14, 1449–1464. [Google Scholar] [CrossRef] [Green Version]
  47. Jetten, T.H.; Takken, W. Anophelism without Malaria in Europe: A Review of the Ecology and Distribution of the Genus Anopheles in Europe; Wageningen Agricultural University Press: Wageningen, The Netherlands, 1994. [Google Scholar]
  48. Diallo, D.; Talla, C.; Ba, Y.; Dia, I.; Sall, A.A.; Diallo, M. Temporal distribution and spatial pattern of abundance of the Rift Valley fever and West Nile fever vectors in Barkedji, Senegal. J. Vector Ecol. 2011, 36, 426–436. [Google Scholar] [CrossRef] [PubMed] [Green Version]
  49. Ba, Y.; Diallo, D.; Kebe, C.M.F.; Dia, I.; Diallo, M. Aspects of bioecology of two Rift Valley fever virus vectors in Senegal (West Africa): Aedes vexans and Culex poicilipes (Diptera: Culicidae). J. Med Entomol. 2005, 42, 739–750. [Google Scholar] [CrossRef]
  50. Horsfall, W.R. Mosquitoes: Their Bionomics and Relation to Disease; The Royal Press Company: New York, NY, USA, 1955. [Google Scholar]
  51. Delatte, H.; Gimonneau, G.; Triboire, A.; Fontenille, D. Influence of temperature on immature development, survival, longevity, fecundity, and gonotrophic cycles of Aedes albopictus, vector of chikungunya and dengue in the Indian Ocean. J. Med. Entomol. 2009, 46, 33–41. [Google Scholar] [CrossRef] [PubMed]
  52. Briegel, H.; Timmermann, S.E. Aedes albopictus (Diptera: Culicidae): Physiological aspects of development and reproduction. J. Med Entomol. 2001, 38, 566–571. [Google Scholar] [CrossRef]
  53. Vinogradova, E. Culex Pipiens Pipiens Mosquitoes: Taxonomy, Distribution, Ecology, Physiology, Genetic, Applied Importance and Control; Pensoft Publishers Sofia-Moscow: Sofia, Bulgaria, 2000. [Google Scholar]
  54. Gjullin, C.M.; Yates, W.W.; Stage, H.H. Studies on Aedes vexans (Meigen) and Aedes sticticus (Meigen), flood-water mosquitoes, in the lower Columbia river valley. Ann. Entomol. Soc. Am. 1950, 43, 262–275. [Google Scholar] [CrossRef]
  55. Carron, A.; Bichaud, L.; Platz, N.; Bicout, D.J. Life history traits of Aedes caspius (Diptera: Culicidae): A laboratory study of larval stages. Bull. Entomol. Res. 2008, 98, 431–436. [Google Scholar] [CrossRef]
  56. Buei, K.; Ito, S.; Nakamura, H.; Yoshida, M. Field study on the gonotrophic cycle of Culex tritaeniorhynchus. Med. Entomol. Zool. 1980, 31, 57–62. [Google Scholar] [CrossRef]
  57. Rueda, L.M.; Patel, K.J.; Axtell, R.C.; Stinner, R.E. Temperature-dependent development and survival rates of Culex quinquefasciatus and Aedes aegypti (Diptera: Culicidae). J. Med. Entomol. 1990, 27, 892–898. [Google Scholar] [CrossRef]
  58. Degenne, P.; Lo Seen, D. Ocelet: Simulating processes of landscape changes using interaction graphs. SoftwareX 2016, 5, 89–95. [Google Scholar] [CrossRef] [Green Version]
  59. Castets, M.; Degenne, P.; Poncelet, P.; Lo Seen, D. Integrating raster and vector spatial representations with interaction graphs for multi-scale environmental simulations. In Proceedings of the 7th International Congress on Environmental Modelling and Software, San Diego, CA, USA, 15–19 June 2014. [Google Scholar]
  60. Morris, M. Factorial sampling plans for preliminary computational experiments. Technometrics 1991, 33, 161–174. [Google Scholar] [CrossRef]
  61. Ba, Y.; Sall, A.A.; Diallo, D.; Mondo, M.; Girault, L.; Dia, I.; Diallo, M. Re-Emergence of Rift Valley Fever Virus in Barkedji (Senegal, West Africa) in 2002–2003: Identification of New Vectors and Epidemiological Implications. J. Am. Mosq. Control Assoc. 2012, 28, 170–178. [Google Scholar] [CrossRef]
  62. Talla, C.; Diallo, D.; Dia, I.; Ba, Y.; Ndione, J.A.; Sall, A.A.; Morse, A.; Diop, A.; Diallo, M. Statistical modeling of the abundance of vectors of West African Rift Valley fever in Barkedji, Senegal. PLoS ONE 2014, 9, e114047. [Google Scholar] [CrossRef]
  63. Talla, C.; Diallo, D.; Dia, I.; Ba, Y.; Ndione, J.A.; Morse, A.P.; Diop, A.; Diallo, M. Modelling hotspots of the two dominant Rift Valley fever vectors (Aedes vexans and Culex poicilipes) in Barkedji, Senegal. Parasit. Vectors 2016, 9, 111. [Google Scholar] [CrossRef]
  64. Soti, V.; Chevalier, V.; Maura, J.; Begue, A.; Lelong, C.; Lancelot, R.; Thiongane, Y.; Tran, A. Identifying landscape features associated with Rift Valley fever virus transmission, Ferlo region, Senegal, using very high spatial resolution satellite imagery. Int. J. Health Geogr. 2013, 12, 10. [Google Scholar] [CrossRef] [PubMed]
  65. Soti, V.; Tran, A.; Bailly, J.-S.; Puech, P.; Lo Seen, D.; Bégué, A. Assessing optical Earth observation systems for mapping and monitoring temporary ponds in arid areas. Int. J. Appl. Earth Obs. Geoinf. 2009, 11, 344–351. [Google Scholar] [CrossRef]
  66. Gouagna, L.C.; Dehecq, J.S.; Fontenille, D.; Dumont, Y.; Boyer, S. Seasonal variation in size estimates of Aedes albopictus population based on standard mark-release-recapture experiments in an urban area on Reunion Island. Acta Trop. 2015, 143, 89–96. [Google Scholar] [CrossRef]
  67. Fall, A.G.; Diaite, A.; Etter, E.; Bouyer, J.; Ndiaye, T.D.; Konate, L. The mosquito Aedes (Aedimorphus) vexans arabiensis as a probable vector bridging the West Nile virus between birds and horses in Barkedji (Ferlo, Senegal). Med. Vet. Entomol. 2012, 26, 106–111. [Google Scholar] [CrossRef]
  68. Anyamba, A.; Chretien, J.P.; Small, J.; Tucker, C.J.; Formenty, P.; Richardson, J.; Britch, S.; Linthicum, K.J. Forecasting the temporal and spatial distribution of a rift valley fever outbreak in east Africa: 2006–2007. Am. J. Trop. Med. Hyg. 2007, 77, 282–283. [Google Scholar]
  69. Hardy, A.; Ettritch, G.; Cross, D.E.; Bunting, P.; Liywalii, F.; Sakala, J.; Silumesii, A.; Singini, D.; Smith, M.; Willis, T.; et al. Automatic Detection of Open and Vegetated Water Bodies Using Sentinel 1 to Map African Malaria Vector Mosquito Breeding Habitats. Remote Sens. 2019, 11, 593. [Google Scholar] [CrossRef]
  70. Tran, A.; Trevennec, C.; Lutwama, J.; Sserugga, J.; Gely, M.; Pittiglio, C.; Pinto, J.; Chevalier, V. Development and Assessment of a Geographic Knowledge-Based Model for Mapping Suitable Areas for Rift Valley Fever Transmission in Eastern Africa. PLoS Negl. Trop. Dis. 2016, 10, e0004999. [Google Scholar] [CrossRef] [Green Version]
  71. Clements, A.C.; Pfeiffer, D.U.; Martin, V. Application of knowledge-driven spatial modelling approaches and uncertainty management to a study of Rift Valley fever in Africa. Int. J. Health Geogr. 2006, 5, 57. [Google Scholar] [CrossRef]
  72. Clements, A.C.; Pfeiffer, D.U.; Martin, V.; Pittliglio, C.; Best, N.; Thiongane, Y. Spatial risk assessment of Rift Valley fever in Senegal. Vector Borne Zoonotic Dis. 2007, 7, 203–216. [Google Scholar] [CrossRef]
  73. Pedro, S.A.; Abelman, S.; Tonnang, H.E. Predicting Rift Valley Fever Inter-epidemic Activities and Outbreak Patterns: Insights from a Stochastic Host-Vector Model. PLoS Negl. Trop. Dis. 2016, 10, e0005167. [Google Scholar] [CrossRef] [PubMed]
  74. Nicolas, G.; Chevalier, V.; Tantely, L.M.; Fontenille, D.; Durand, B. A spatially explicit metapopulation model and cattle trade analysis suggests key determinants for the recurrent circulation of rift valley Fever virus in a pilot area of madagascar highlands. PLoS Negl. Trop. Dis. 2014, 8, e3346. [Google Scholar] [CrossRef]
  75. Paul, P.N.T.; Bah, A.; Ndiaye, P.I.; Ndione, J.A. An Agent-Based Model for Studying the Impact of Herd Mobility on the Spread of Vector-Borne Diseases: The Case of Rift Valley Fever (Ferlo Senegal). Open J. Model. Simul. 2014, 2, 97–111. [Google Scholar] [CrossRef]
  76. Belkhiria, J.; Lo, M.; Sow, F.; Martínez-López, B.; Chevalier, V. Application of Exponential Random Graph Models to determine Nomadic herders’ movements in Senegal. Transbound Emerg. Dis. 2019. [Google Scholar] [CrossRef]
Figure 1. Location of the study area, Northern Senegal.
Remotesensing 11 01024 g001
Figure 2. Diagram of the model of mosquito population dynamics applied to Ae. vexans, Cx. poicilipes and Cx. tritaeniorhynchus species in Senegal. In blue, the aquatic stages (E: eggs, L: larvae, P: pupae); in orange, the adult female stages (Aem: emerging, A1: nulliparous, A2: parous, with h: host-seeking, g: bloodfed and resting, o: ovipositing). Parameters and functions are defined in Table 1 and Table 2, respectively. Associated model equations are provided in Equations (3)–(4).
Remotesensing 11 01024 g002
Figure 3. Workflow diagram for the application at regional scale of the mosquito population models.
Remotesensing 11 01024 g003
Figure 4. Comparison of observed (red dots) and predicted (black lines) pond surfaces in Younoufere study site, Ferlo, Senegal, 2015 and 2016. Observed pond surfaces were calculated from the GPS delineated contours of the ponds (right panel: solid and dashed lines correspond to 2015 and 2016 observations, respectively). Predicted pond surfaces were simulated from ground weather station rainfall data (blue bars in the left panel).
Remotesensing 11 01024 g004
Figure 5. Comparison of observed (red dots) and predicted (black lines) adult mosquito population dynamics in Diama, Senegal River Delta (SRD), Dande Mayo Loboudou, Senegal River Valley (SRV), and Younoufere, Ferlo, Senegal, 2014–2016. Predicted mosquito dynamics were simulated from ground weather station humidity, temperature, and rainfall data (blue bars).
Remotesensing 11 01024 g005
Figure 6. Comparison of observed (red dots) and predicted (black lines) adult mosquito population dynamics in Diama, Senegal River Delta (SRD), Dande Mayo Loboudou, Senegal River Valley (SRV), and Younoufere, Ferlo, Senegal, 2014–2016. Predicted mosquito dynamics were simulated from satellite-derived humidity, temperature, and rainfall estimates (blue bars).
Remotesensing 11 01024 g006
Figure 7. Examples of modeled density maps of Ae. vexans, Cx. poicilipes and Cx. tritaeniorhynchus in Northern Senegal, 2014.
Remotesensing 11 01024 g007

