Article

Analysis of Light-Induced Changes in the Photochemical Reflectance Index (PRI) in Leaves of Pea, Wheat, and Pumpkin Using Pulses of Green-Yellow Measuring Light

Department of Biophysics, N.I. Lobachevsky State University of Nizhny Novgorod, Nizhny Novgorod 603950, Russia
*
Author to whom correspondence should be addressed.
Remote Sens. 2019, 11(7), 810; https://doi.org/10.3390/rs11070810
Submission received: 7 March 2019 / Revised: 2 April 2019 / Accepted: 2 April 2019 / Published: 4 April 2019
(This article belongs to the Section Remote Sensing in Agriculture and Vegetation)

Abstract

:
The photochemical reflectance index (PRI) is a widely used spectral index which can show stress-induced changes in photosynthesis (e.g., increase of the nonphotochemical quenching of chlorophyll fluorescence (NPQ)). The artificial illumination of plants improves the efficiency of estimation of photosynthetic processes on the basis of PRI measurements. However, the simultaneous activity of different light sources with different locations can disturb the measurement of PRI. Using pulses of a green-yellow measuring light can potentially solve this problem. The aim of the present work was to investigate the possibility of using green-yellow light pulses for the investigation of light-induced changes in PRI in higher plants (pea, wheat, and pumpkin) and for the analysis of connection between PRI and the energy-dependent component of NPQ (NPQF). First, we showed that using green-yellow light pulses eliminated shifts of reflected light, which were connected with the application of a red actinic light. Second, analysis of light dependences of NPQF, the absolute value of PRI, and changes in PRI (the difference between the PRI under the actinic light and the initial value of PRI without this light, ΔPRI) showed that the dynamics of the increase of NPQF and the decrease of PRI and ΔPRI were similar. Changes in NPQF and ΔPRI were found to be significant. In contrast, changes in the absolute value of PRI were not significant in most of the variants of the experiments. Third, scatter plots between NPQF and ΔPRI showed similar linear correlations for investigated species; moreover, a total set of experimental points (for pea, wheat, and pumpkin) were also described by the same linear regression. Thus, our results show that (i) pulses of green-yellow measuring light can be used for measurements of PRI, and (ii) ΔPRI is a more effective indicator for the estimation of NPQ than the absolute value of PRI.

Graphical Abstract

1. Introduction

Terrestrial plants can be affected by numerous environmental stressors (excess light, high and low temperatures, drought, salinity, attacks of insects, phytopathogens, etc.). In particular, many stressors can disturb photosynthetic processes [1], and thereby decrease the productivity of plants. The early identification of stressor-induced photosynthetic changes plays an important role in precision agriculture and ecological monitoring, and accordingly, the development of methods for the remote sensing of photosynthetic processes is a topical practical problem [2]. Measurements of chlorophyll fluorescence and different spectral indices on the basis of reflected light are effective tools for such remote sensing [2,3,4,5,6,7]. In particular, one of the key spectral indices is the photochemical reflectance index (PRI), which is connected with photosynthetic parameters and the content of pigments in plant [4,5,6,7,8,9].
Traditionally, the PRI is calculated on the basis of Equation (1) [4,5,7] (however, other spectral bands can be also used [5]):
P R I = R 531 R 570 R 531 + R 570
where R531 and R570 are the intensities of reflected light at 531 and 570 nm, respectively. It is considered that a fast decrease of PRI (generally minutes to hours) is a standard response to the action of numerous stressors (including excess light, salinity, water stress, increased temperature, etc.) on plant leaf [5,8,10,11,12,13,14], as well as to the propagation of stress signals through the plant body [15]. Fast changes in PRI are based on a decrease in R531, which is probably connected to a xanthophyll de-epoxidation (increase of zeaxanthin concentration) [8] and/or a chloroplast shrinkage [5,10]. Both processes are induced by an increase in a transthylakoid ΔpH and the acidification of lumen in chloroplasts. In contrast, R570 is considered to be weakly affected by these physiological processes [5,8,9]. Therefore, R570 is often used as the reference spectral band for PRI calculation.
It can be expected that PRI will be strongly connected with a nonphotochemical quenching of chlorophyll fluorescence (NPQ), which shows the development of a photosynthetic stress in plant [1,16]. In particular, PRI should be connected with a fast-relaxing energy-dependent component of NPQ (NPQF; [16]), since NPQF is also caused by lumen acidification [1,16]. A negative correlation can be observed between NPQ and PRI [10,14,15,17]. However, values of correlation coefficients between NPQ (as well as other photosynthetic parameters) and PRI can vary strongly [7]. In particular, the correlation coefficient of NPQ with PRI can be very low [18] or positive [19]. Our meta-analysis [7] showed that the connection of PRI with photosynthetic parameters is stronger under artificial light, which has controlled characteristics, than it is under sunlight, which can fluctuate. The results of our experimental investigations [15,18] showed that the duration of illumination can also be a factor which changes the connection between PRI and NPQ.
Thus, the use of artificial light can potentially improve the efficiency of NPQ estimation on the basis of measurements of PRI [7], i.e., it can improve the efficiency of the identification of photosynthetic stress in plants. However, the application of additional light source(s) from artificial light can generate some errors. In particular, combinations of artificial light with fluctuating sunlight or with another artificial light source with changeable intensity, as well as deviations in the position of the investigated plant (in experiments with two or more light sources) can influence the intensities of reflected light in different spectral bands. Considering small magnitudes of changes in PRI (usually from 0.002–0.004 [15,18] to 0.02–0.04 [8,13,14]), the effect can strongly disrupt the measurement of the PRI. In accordance with Evain et al. [10], the problem can be solved on the basis of the continuous measurement of a reference panel that allows the exclusion of variations in the spectrum and intensity of sunlight or controlled changes in the intensity of artificial light. However, the use of the method requires a complex technical system, and moreover the method cannot fully exclude errors, which are connected with deviations in the position of different samples (leaves of experimental plants).
We suppose that an alternative approach can be based on using measuring pulses of green-yellow light (GYL). There are some observations which support the possibility of using GYL pulses as a measuring light for the measurement of PRI: (i) It is known [20,21] that the photosynthetic efficiency of GYL is lower than the efficiency of red or blue light, i.e. the influence of the GYL pulses on plants should be lower; (ii) spectral bands which are used for PRI calculation (usually, the reflected light at 531 and 570 nm [4,5,7]) are parts of the green-yellow spectral band, i.e. absolute intensities of the reflected light at 531 and 570 nm should be increased during the GYL pulses; and (iii) minutes are usually required for the development of PRI changes [8,9,10,15,18] (however, changes occurring on the order of seconds can be observed in some objects [10]), i.e. pulses with a duration of less than one minute should weakly influence PRI. Considering these points, GYL pulses with a period on the order of seconds or tens of seconds can potentially be used as measuring light for PRI measurement. This approach is similar to the Pulse-Amplitude-Modulation (PAM) method of fluorescence measurement, which is based on weak pulses of measuring light and measurements of differences in the intensity of fluorescence during and before a pulse [2,22]. Analogically, the intensities of reflected light at 531 and 570 nm (R531 and R570) can be calculated as differences between the intensities during the measuring pulse of GYL and before the pulse. The main potential advantage of using GYL pulses is the possibility of performing PRI measurement under illumination by several light sources (possibly including illumination by sunlight) because only reflected light from the source of GYL will be analyzed. It can be expected that this approach will allow the exclusion of the influence of changes in light intensities from other light sources without continuous measurement of the reference panel (if the duration of these changes is longer than that of the GYL pulses) or the influence of deviations in the position of different leaves during investigation.
Thus, the aim of the present work was to investigate the possibility of using GYL pulses for the investigation of light-induced changes in PRI in higher plants (pea, wheat, and pumpkin) and for the analysis of connection between PRI and the energy-dependent component of NPQ in these plants.

2. Methods

2.1. Materials

Seedlings of pea (Pisum sativum L., cultivar “Albumen”), wheat (Triticum aestivum L., cultivar “Zlata”), and pumpkin (Cucurbita pepo L., cultivar “Mozoleevskaya”) were used as objects in our investigation, since these are important agricultural plants with photosynthetic parameters, which were investigated in our previous works [15,18,23,24,25,26,27]. These plants were cultivated in a Binder KBW 240 plant growth chamber (BinderGmbH, Tuttlingen, Germany) at 24 °C under a 16/8 h (light/dark) photoperiod. Seedlings used in experiments were 2–3 weeks old. Second matter leaves of investigated plants were used for measurements.

2.2. Measurements of the Energy-Dependent Component of Nonphotochemical Quenching of Chlorophyll Fluorescence and the Photochemical Reflectance Index

Figure 1 shows details of measurements of the energy-dependent component of NPQ and PRI in leaves of investigated plants. A Dual-PAM-100 measuring system (Heinz Walz GmbH, Effeltrich, Germany) was used for photosynthetic measurements (Figure 1a). Standard weak pulses of blue light (maximum intensity at 460 nm, 24 μmol m−2 s−1, 2.5 μs pulse length) were used as a fluorescence measuring light (ML). The first saturation pulse (SP) of red light (maximum intensity at 630 nm, 10,000 mmol m−2 s−1, 300 ms pulse length) after dark adaptation for 15 min was used for measurement of the maximum yield of fluorescence (Fm) [2,16,22]. The next SPs were generated every 60 s and showed current maximum yields of fluorescence (Fm′). A red actinic light (AL, maximum intensity at 630 nm, variable intensity) was used in the experiments. The angle between the leaf surface and the direction of the AL, SP, and ML was about 60°.
In experiments with analysis of the light dependence of the energy-dependent component of nonphotochemical quenching of chlorophyll fluorescence, the following sequence of illuminations was subsequently applied for photosynthetic measurements: Periodical SPs without AL for 5 min; periodical SPs and AL (131 μmol m−2 s−1) for 5 min; periodical SPs without AL for 2 min (relaxation); periodical SPs and AL (344 μmol m−2 s−1) for 5 min; periodical SPs without AL for 2 min (relaxation); periodical SPs and AL (830 μmol m−2 s−1) for 5 min; periodical SPs without AL for 2 min (relaxation); periodical SPs and AL (1599 μmol m−2 s−1) for 5 min; and periodical SPs without AL for 2 min (relaxation). The duration of dark relaxations was 2 min, as the magnitude of the fast change in Fm′ after 2 min of relaxation was more than 90% from the maximal magnitude of this change (Figure 1c). It is known [2,16,22] that the fast relaxing NPQ shows the energy-dependent component of NPQ (NPQF). We calculated NPQF in accordance with Equation (2):
N P Q F = F m F m 0 F m F m S
where Fm0 and FmS are the Fm′ before the termination of illumination and for 2 min after that, respectively. In separate series of experiments, only an intensity of 1599 μmol m−2 s−1 of AL was used: Periodical SPs without AL for 5 min; periodical SPs and AL (1599 μmol m−2 s−1) for 5 min; periodical SPs without AL for 2 min (relaxation). Other details of experiment were similar to the first variant.
Pulses of GYL were used for measurements of PRI. The GYL source was a white TDS-P003L4U14 LED (TDS Lighting Co., Ltd., Jiangsu, China) which was placed in a tube. Standard yellow- (Y-1,4x) and yellow-green (YG-2x)-colored glass bandpass filters were placed in this tube at distances of 1 and 1.5 cm from the LED, respectively. The combination of the LED and the filters provided a GYL spectrum with a maximum intensity at 550 nm. The total spectral band of GYL was from 450 to 700 nm; however, 80% of the light intensity was in the range from 500–600 nm (Figure 1b). The intensity of GYL could be regulated, and was set at 60, 120, 180, or 240 μmol m−2 s−1 (in zone of leaf); 240 μmol m−2 s−1 was used in most of the experiments. The duration of the GYL pulses was 30 s (Figure 1c). The pulses were generated every minute, and each pulse was terminated 5 s before SP. The GYL pulses were generated during illumination by AL as well as without illumination by AL. The angle between the leaf surface and the direction of the GYL was about 30°.
The reflected light (RL) was measured by a compact wide-range S100 spectrometer (SOLAR Laser Systems, Minsk, Belarus) with a fiberoptic cable. Only absolute intensities of the reflected light were measured; the reflectance was not estimated. A tip of the cable was equipped with a small black tube (distance from the fiberoptic surface to end of the tube was 0.5 cm, diameter was 0.5 cm), which was used as the simplest collimator. The distance from the leaf surface to the fiberoptic surface (Figure 1a) was about 1.5 cm. The angle between the leaf surface and the input of the fiberoptic cable was about 30°. The spectral range and spectral resolution of the S100 spectrometer were 190–1050 nm and ~1 nm, respectively. The integration time for each spectral measurement was 5 s; this time is less than the usual time of development of changes in PRI in plants (which is on the order of minutes [8,9]). Measurements were continuously repeated during the experiment.
There were two analyzed spectral bands, at 531 and 570 nm, since RL at 531 nm is known to decrease under the action of stressors; RL at 570 nm was the reference band [4,5,7]. In accordance with our previous results [15], we calculated intensity of RL at 531 nm by averaging absolute intensities of RL from 526–536 nm, and calculated intensity of RL at 570 nm by averaging absolute intensities of RL from 565–575 nm, since this averaging decreased the variability of RL. The calculation of R531 and R570 for Equation (1) was based on the following algorithm, which did not require synchronization between GYL pulses and RL measurements. First, R531(570)First (the absolute intensity of the reflected light at 531 (570) nm at the initiation of the GYL pulse) and R531(570)BG (the absolute intensity of the reflected light at 531 (570) nm before this pulse) were calculated for each GYL pulse:
R 531 ( 570 ) F i r s t = R 531 ( 570 ) i
R 531 ( 570 ) B G = R 531 ( 570 ) i 2
if ( R 531 ( 570 ) i R 531 ( 570 ) i 2 ) 0.25 × ( R 531 ( 570 ) i + 1 R 531 ( 570 ) i 2 ) and ( R 531 ( 570 ) i 1 R 531 ( 570 ) i 2 ) < 0.25 × ( R 531 ( 570 ) i + 1 R 531 ( 570 ) i 2 ) , where i is the number of the spectrum.
Second, R531(570)Last (the absolute intensity of the reflected light at 531 (570) nm at the finalization of the GYL pulse) was calculated:
R 531 ( 570 ) L a s t = R 531 ( 570 ) i
if ( R 531 ( 570 ) i + 1 R 531 ( 570 ) B G ) 0.25 × ( R 531 ( 570 ) i 1 R 531 ( 570 ) B G ) .
Finally, R531(570)Averaged was calculated, which was an average of RL at 531 (570) nm between R531(570)First and R531(570)Last (usually five values of intensities of RL). Thus, there were two equations for the calculation of R531 and R570:
R 531 ( 570 ) = R 531 ( 570 ) A v e r a g e d R 531 ( 570 ) B G
R 531 ( 570 ) = R 531 ( 570 ) F i r s t R 531 ( 570 ) B G
Equation (6) was mainly used for the calculation of R531 and R570, while Equation (7) was used in the separate block of analysis.
The 18% grey card QPcard 101 Calibration Card ver. 3 (Argraph Corp., Carlstadt, NJ, USA), which was similar to leaf reflectance [15,28], was used as a standard for the initial calibration under the GYL pulses with different intensities. The calibration was performed before experiments. Position of the card was similar with the leaf position (Figure 1a); only the green-yellow light illuminated it. Averaging of absolute intensities of RL from the card at 526–536 nm (R531card) and 565–575 nm (R570card) was calculated; the ratio R570card/R531card (about 0.80) was used for correction of R531 (R531 × R570card/R531card was used). This correction eliminated influence of the difference between intensities of GYL at 531 and 570 nm from our light source on absolute values of PRI. Another calibration was absent in our work.
Light-induced changes in PRI (∆PRI) were also investigated in our work. ΔPRI was calculated as difference between PRI after 5 min of illumination by AL with different intensity (see above) and initial PRI, which was measured before the first illumination by the actinic light.

2.3. Statistics

A separate seedling of pea, wheat, or pumpkin was used for each experiment. The number of repetitions is shown in figures. Mean values, standard errors, scatter plots, and correlation coefficients are presented in figures. A Student’s t-test was used to identify significant differences.

3. Results

3.1. Correction of the Reflected Light Using Green-Yellow Light (GYL) Pulses

The first question of our work was whether using GYL pulses can exclude error which is connected with changes in the AL intensity. We investigated R531 and R570 under illumination by AL with different intensities (the GYL pulse was started after 20 s of illumination). R531 and R570 were either calculated in accordance with Equation (6) or were assumed as R531(570)Averaged.
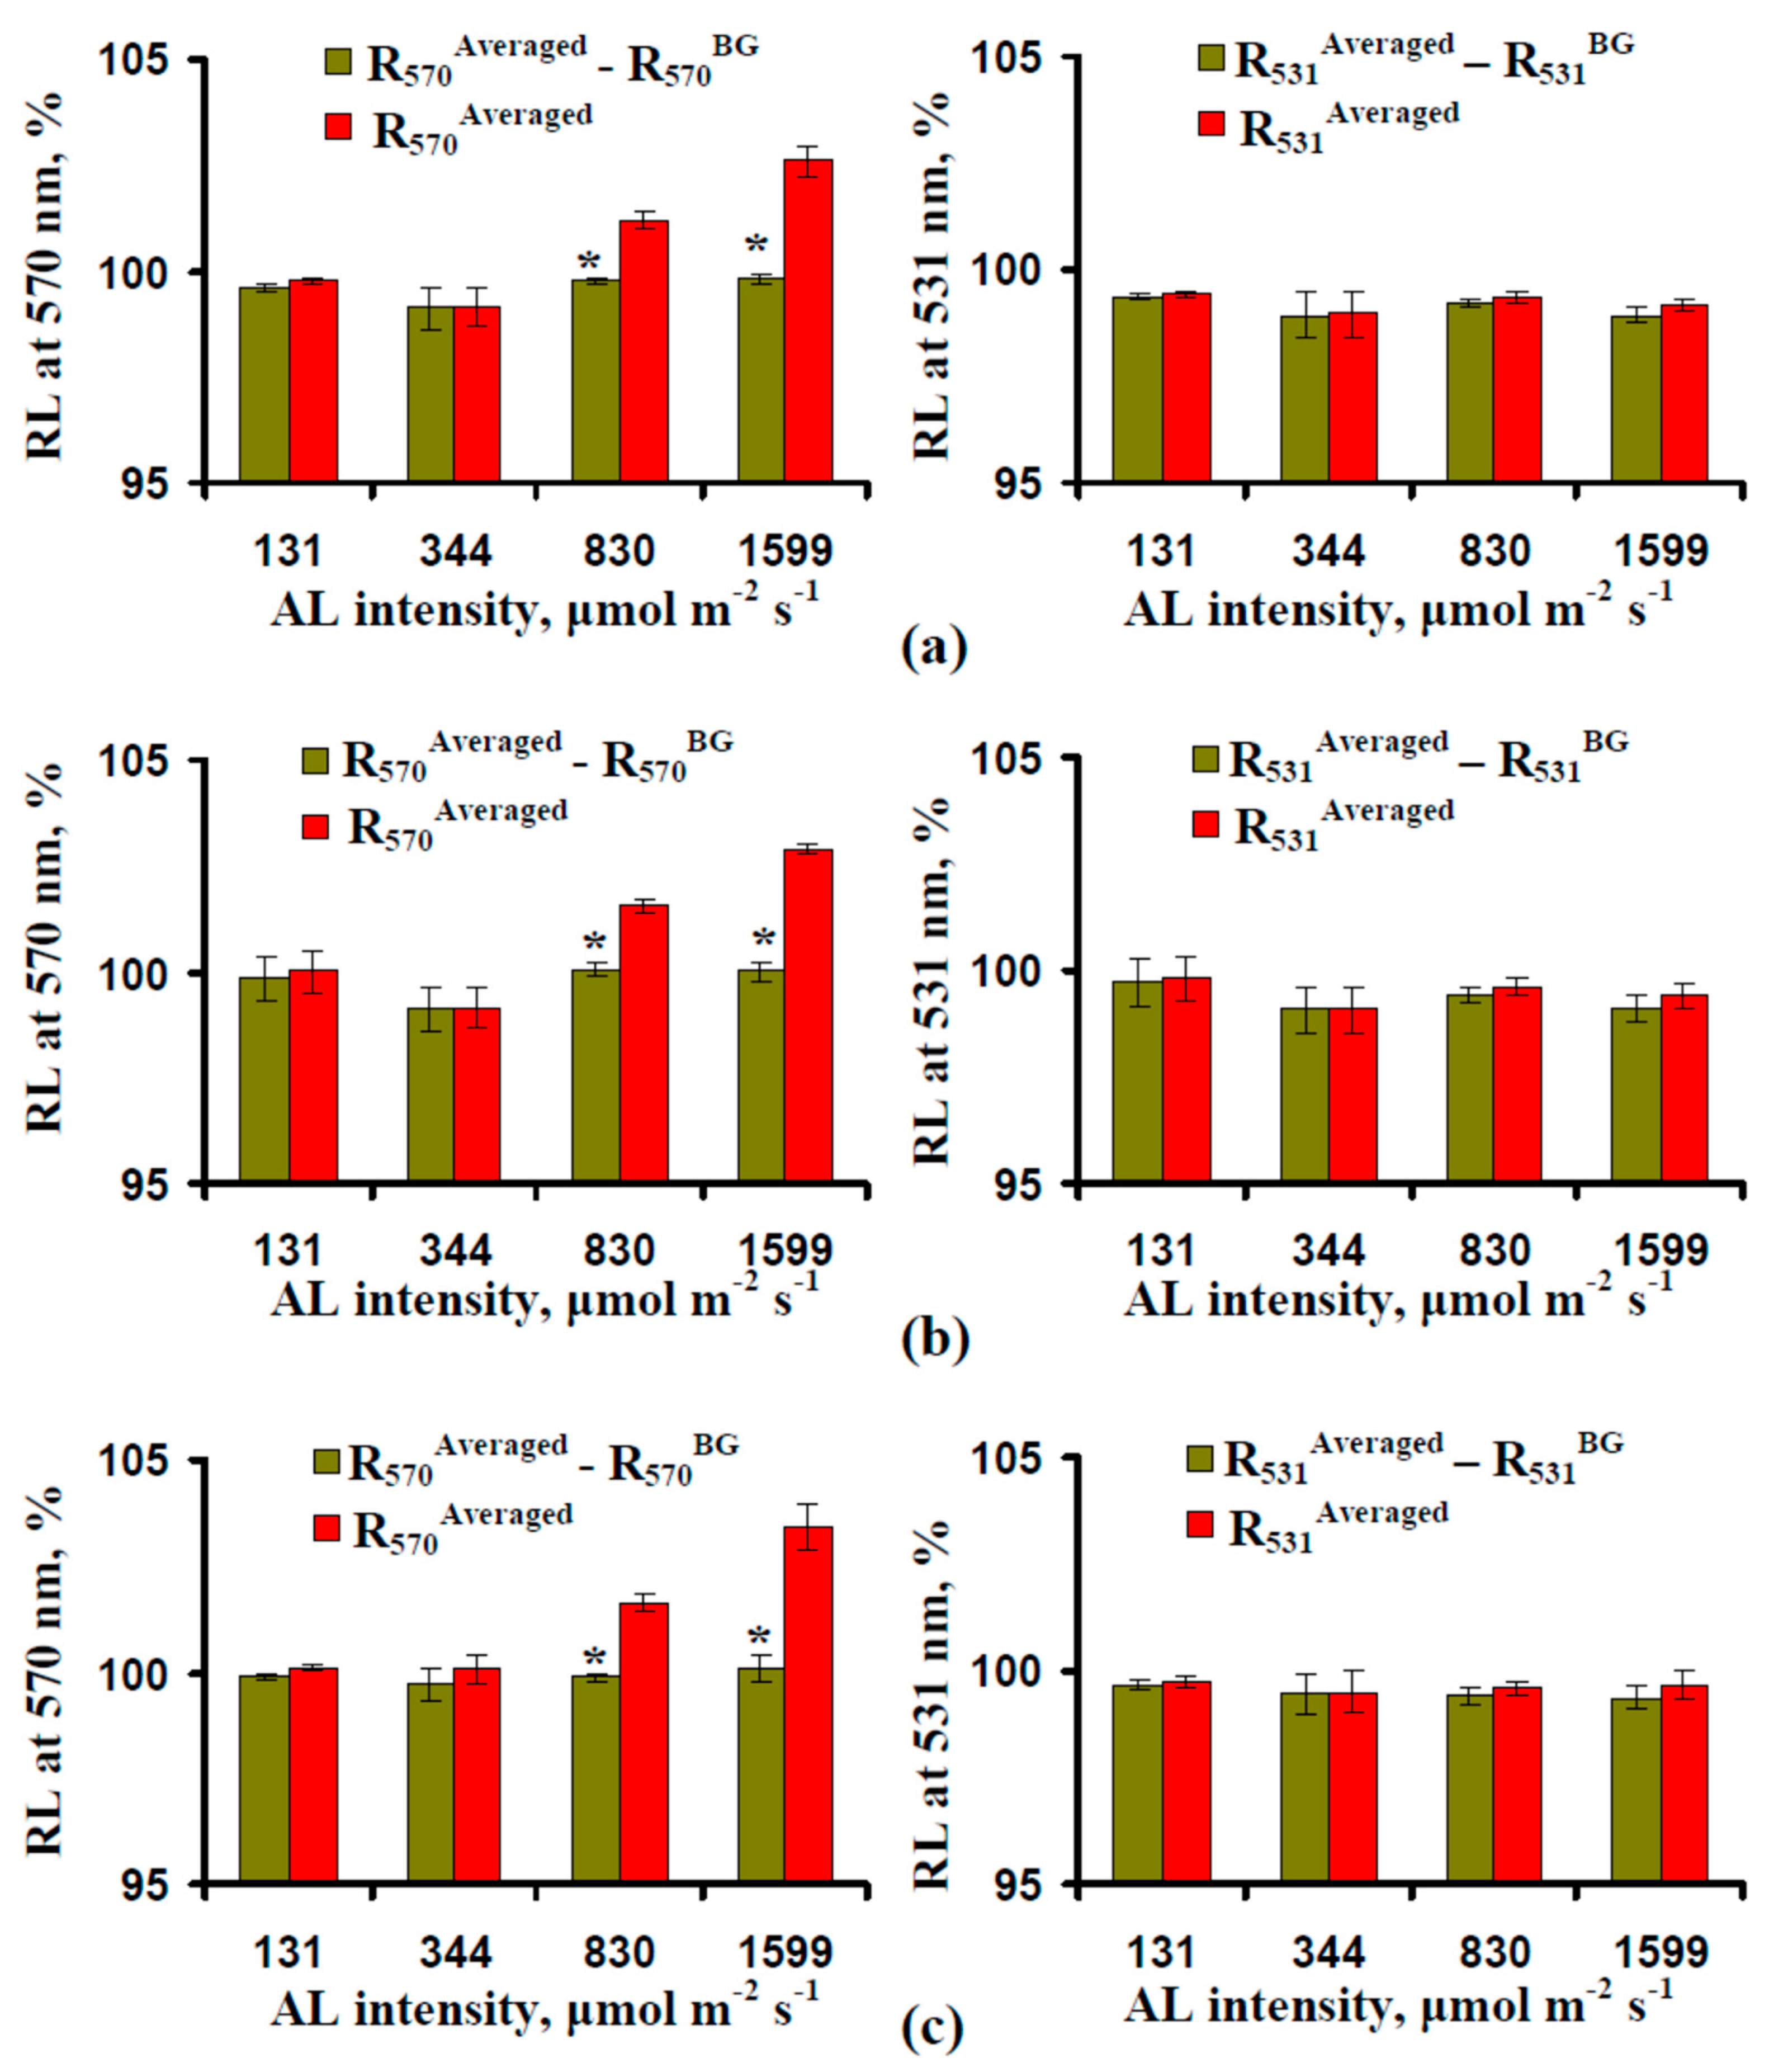
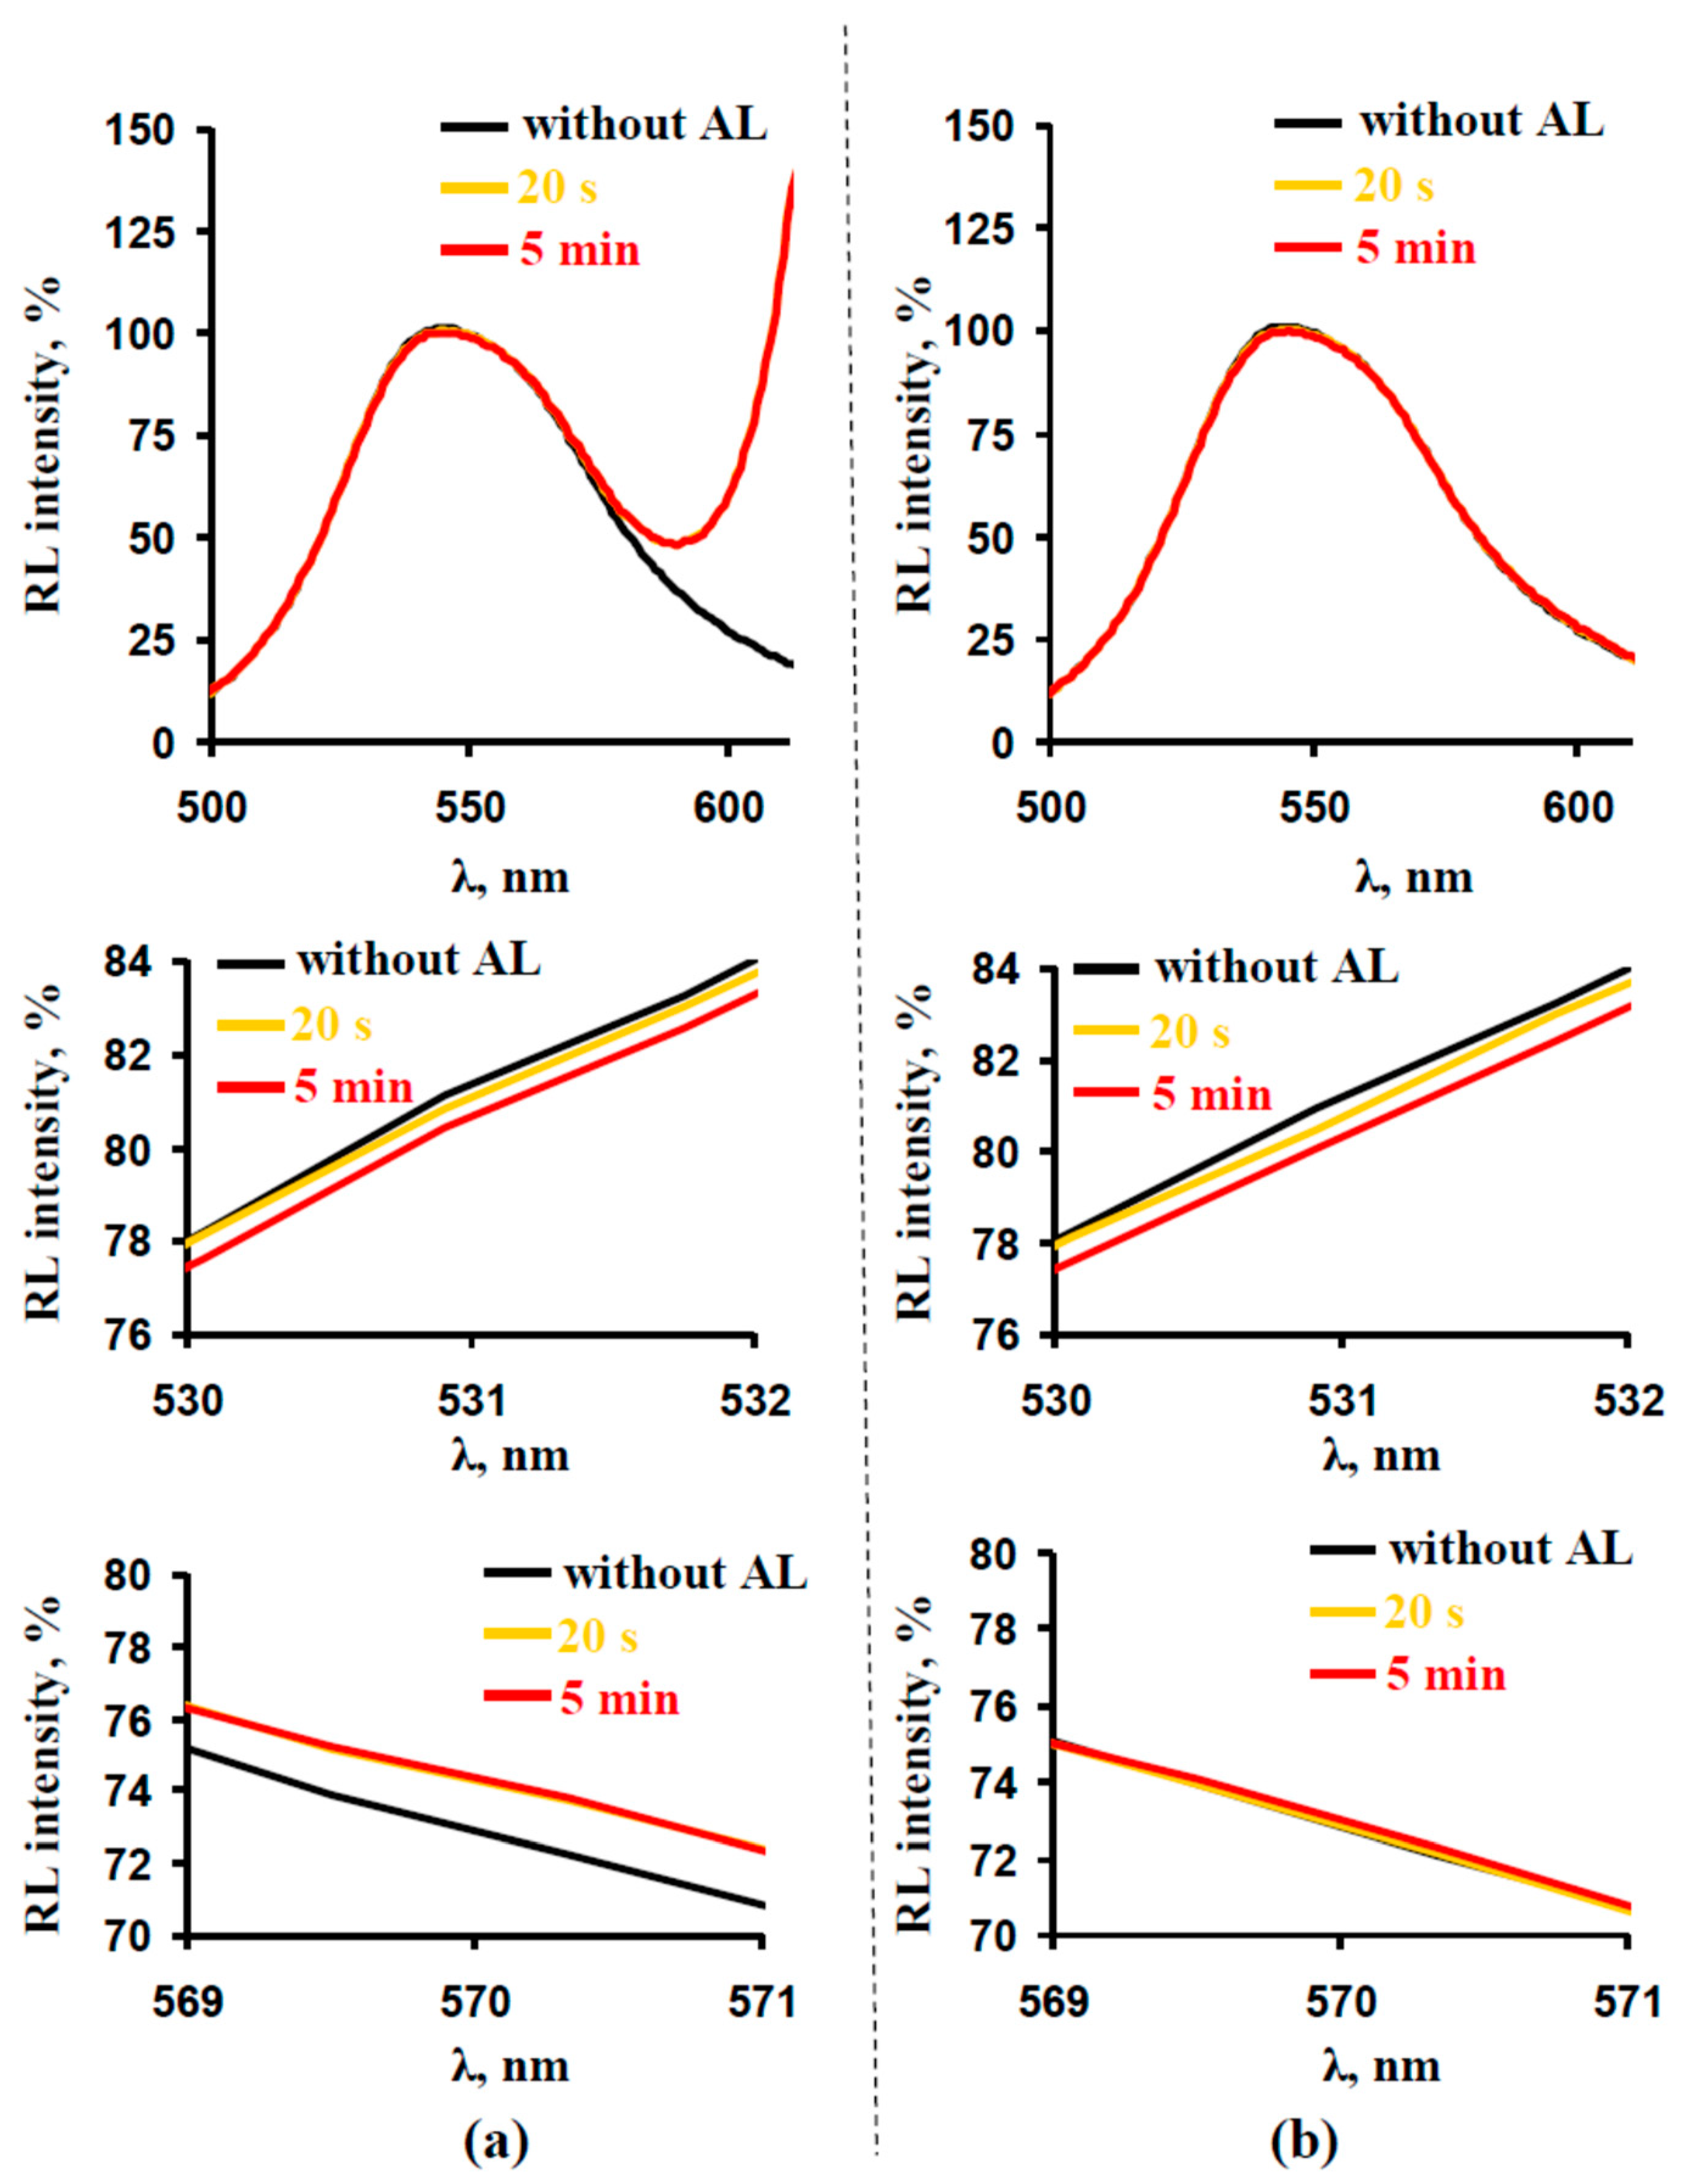
Figure 2 shows that AL with intensities of 131 and 344 μmol m−2 s−1 did not significantly influence the intensity of the reflected light at 570 nm (estimated as R570Averaged). However, illumination by AL with intensities of 830 and, especially, 1599 μmol m−2 s−1 was found to significantly increase RL at 570 nm in leaves of all investigated species. The effect was connected with the presence of the weak AL in the spectral range from 565–575 nm (less than 0.5% from the maximal intensity of AL). In particular, Figure 3a shows that increased intensity of the AL induced strong changes in RL at 570 nm in pea; the magnitudes of the changes were higher than those in RL at 531 nm. A similar effect was observed in other investigated plants (data not shown).
In contrast, the calculation of R570 in accordance with Equation (6) eliminated AL-induced changes in RL at 570 nm (Figure 2 and Figure 3b). It is known that R570 is a reference wavelength [8,29,30], and accordingly, the absence of changes in the reflected light at 570 nm was in a good accordance with theory.
Significant differences between R531, which was estimated as R531Averaged, and R531, which was calculated as R531AveragedR531BG, were absent in all investigated plant species and at all analyzed intensities of AL. It is interesting that illumination decreased R531 (Figure 3b); this was in good accordance with the main role of the decrease of RL at 531 nm during the action of stressors [5,8].
Thus, even LEDs with a narrow spectral band can disturb PRI measurements, since the shift of PRI values, which was connected with error of R570 measurement (ΔPRI × 1000 was from −6 to −8 at an intensity of 830 μmol m−2 s−1 and from −13 to −15 at 1599 μmol m−2 s−1), was similar to changes induced by stressors [8,13,14,15,18]. However, the use of the GYL pulses allowed the elimination of this error (changes in RL at 570 nm were eliminated by using the GYL pulses; see Figure 2 and Figure 3a) without new calibrations after each change of intensity of the AL.

3.2. Influence of the Actinic Light Intensity on the Energy-Dependent Component of Nonphotochemical Quenching of Chlorophyll Fluorescence (NPQ) and Photochemical Reflectance Index

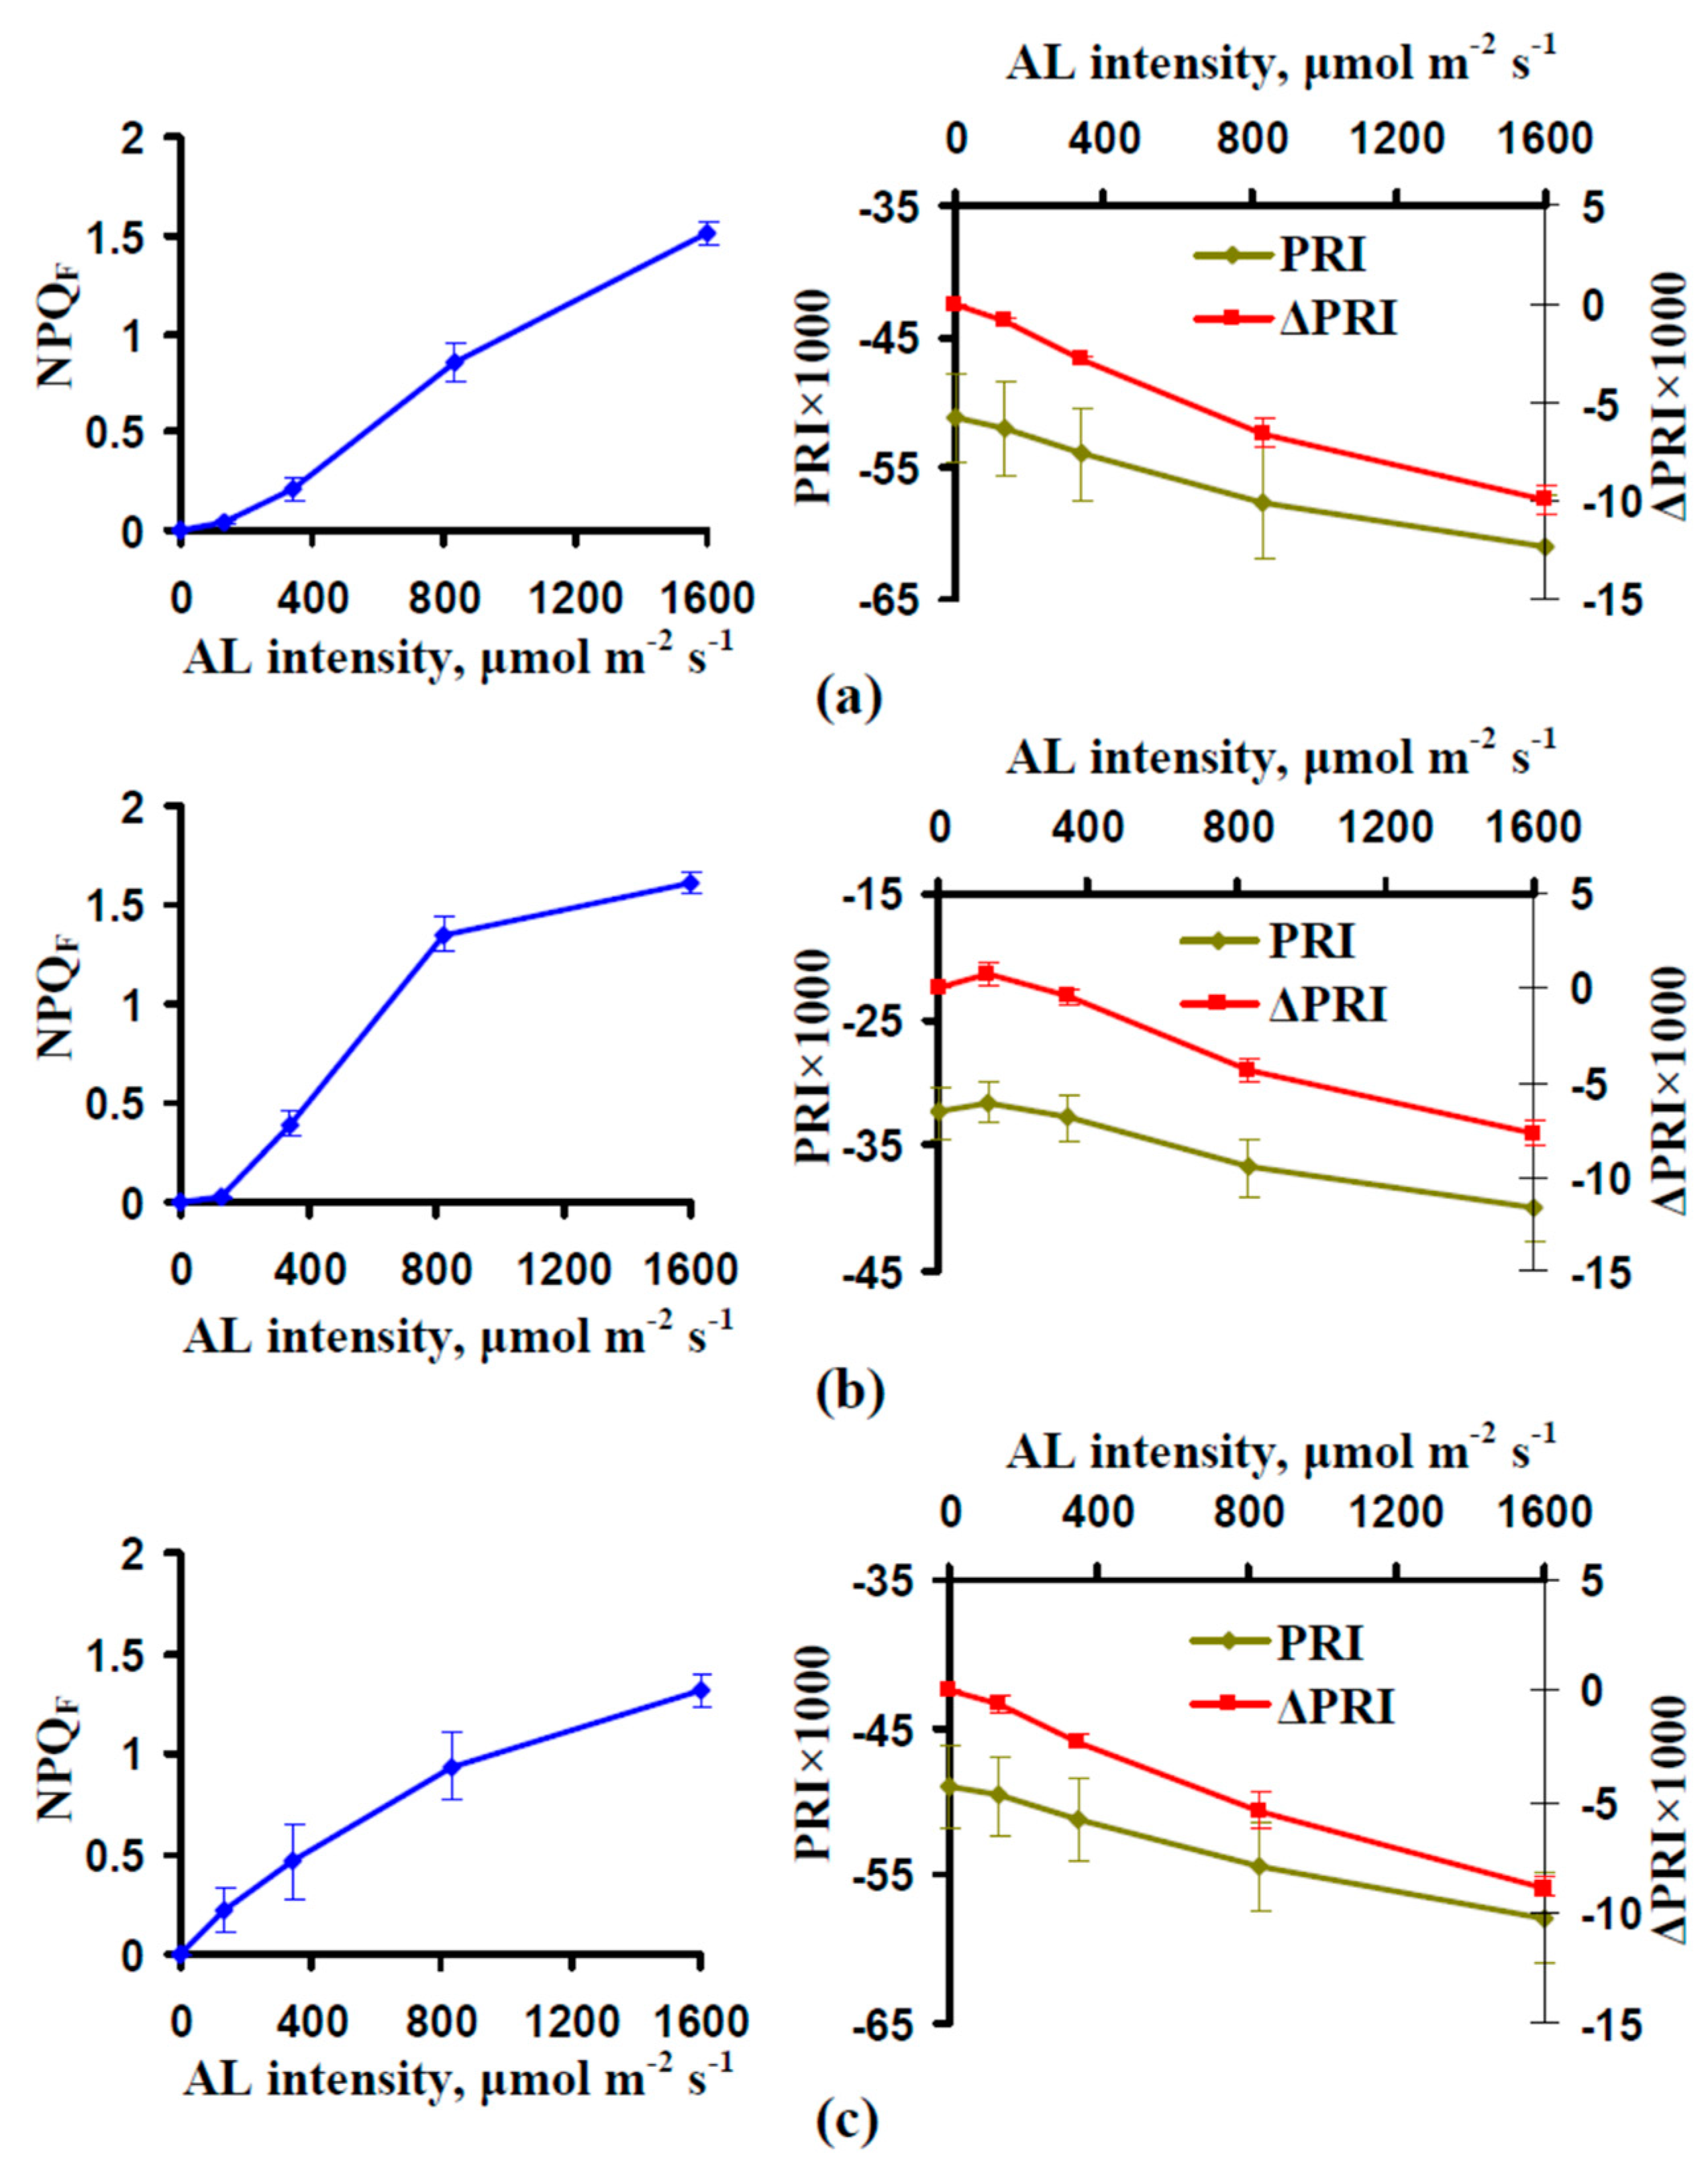
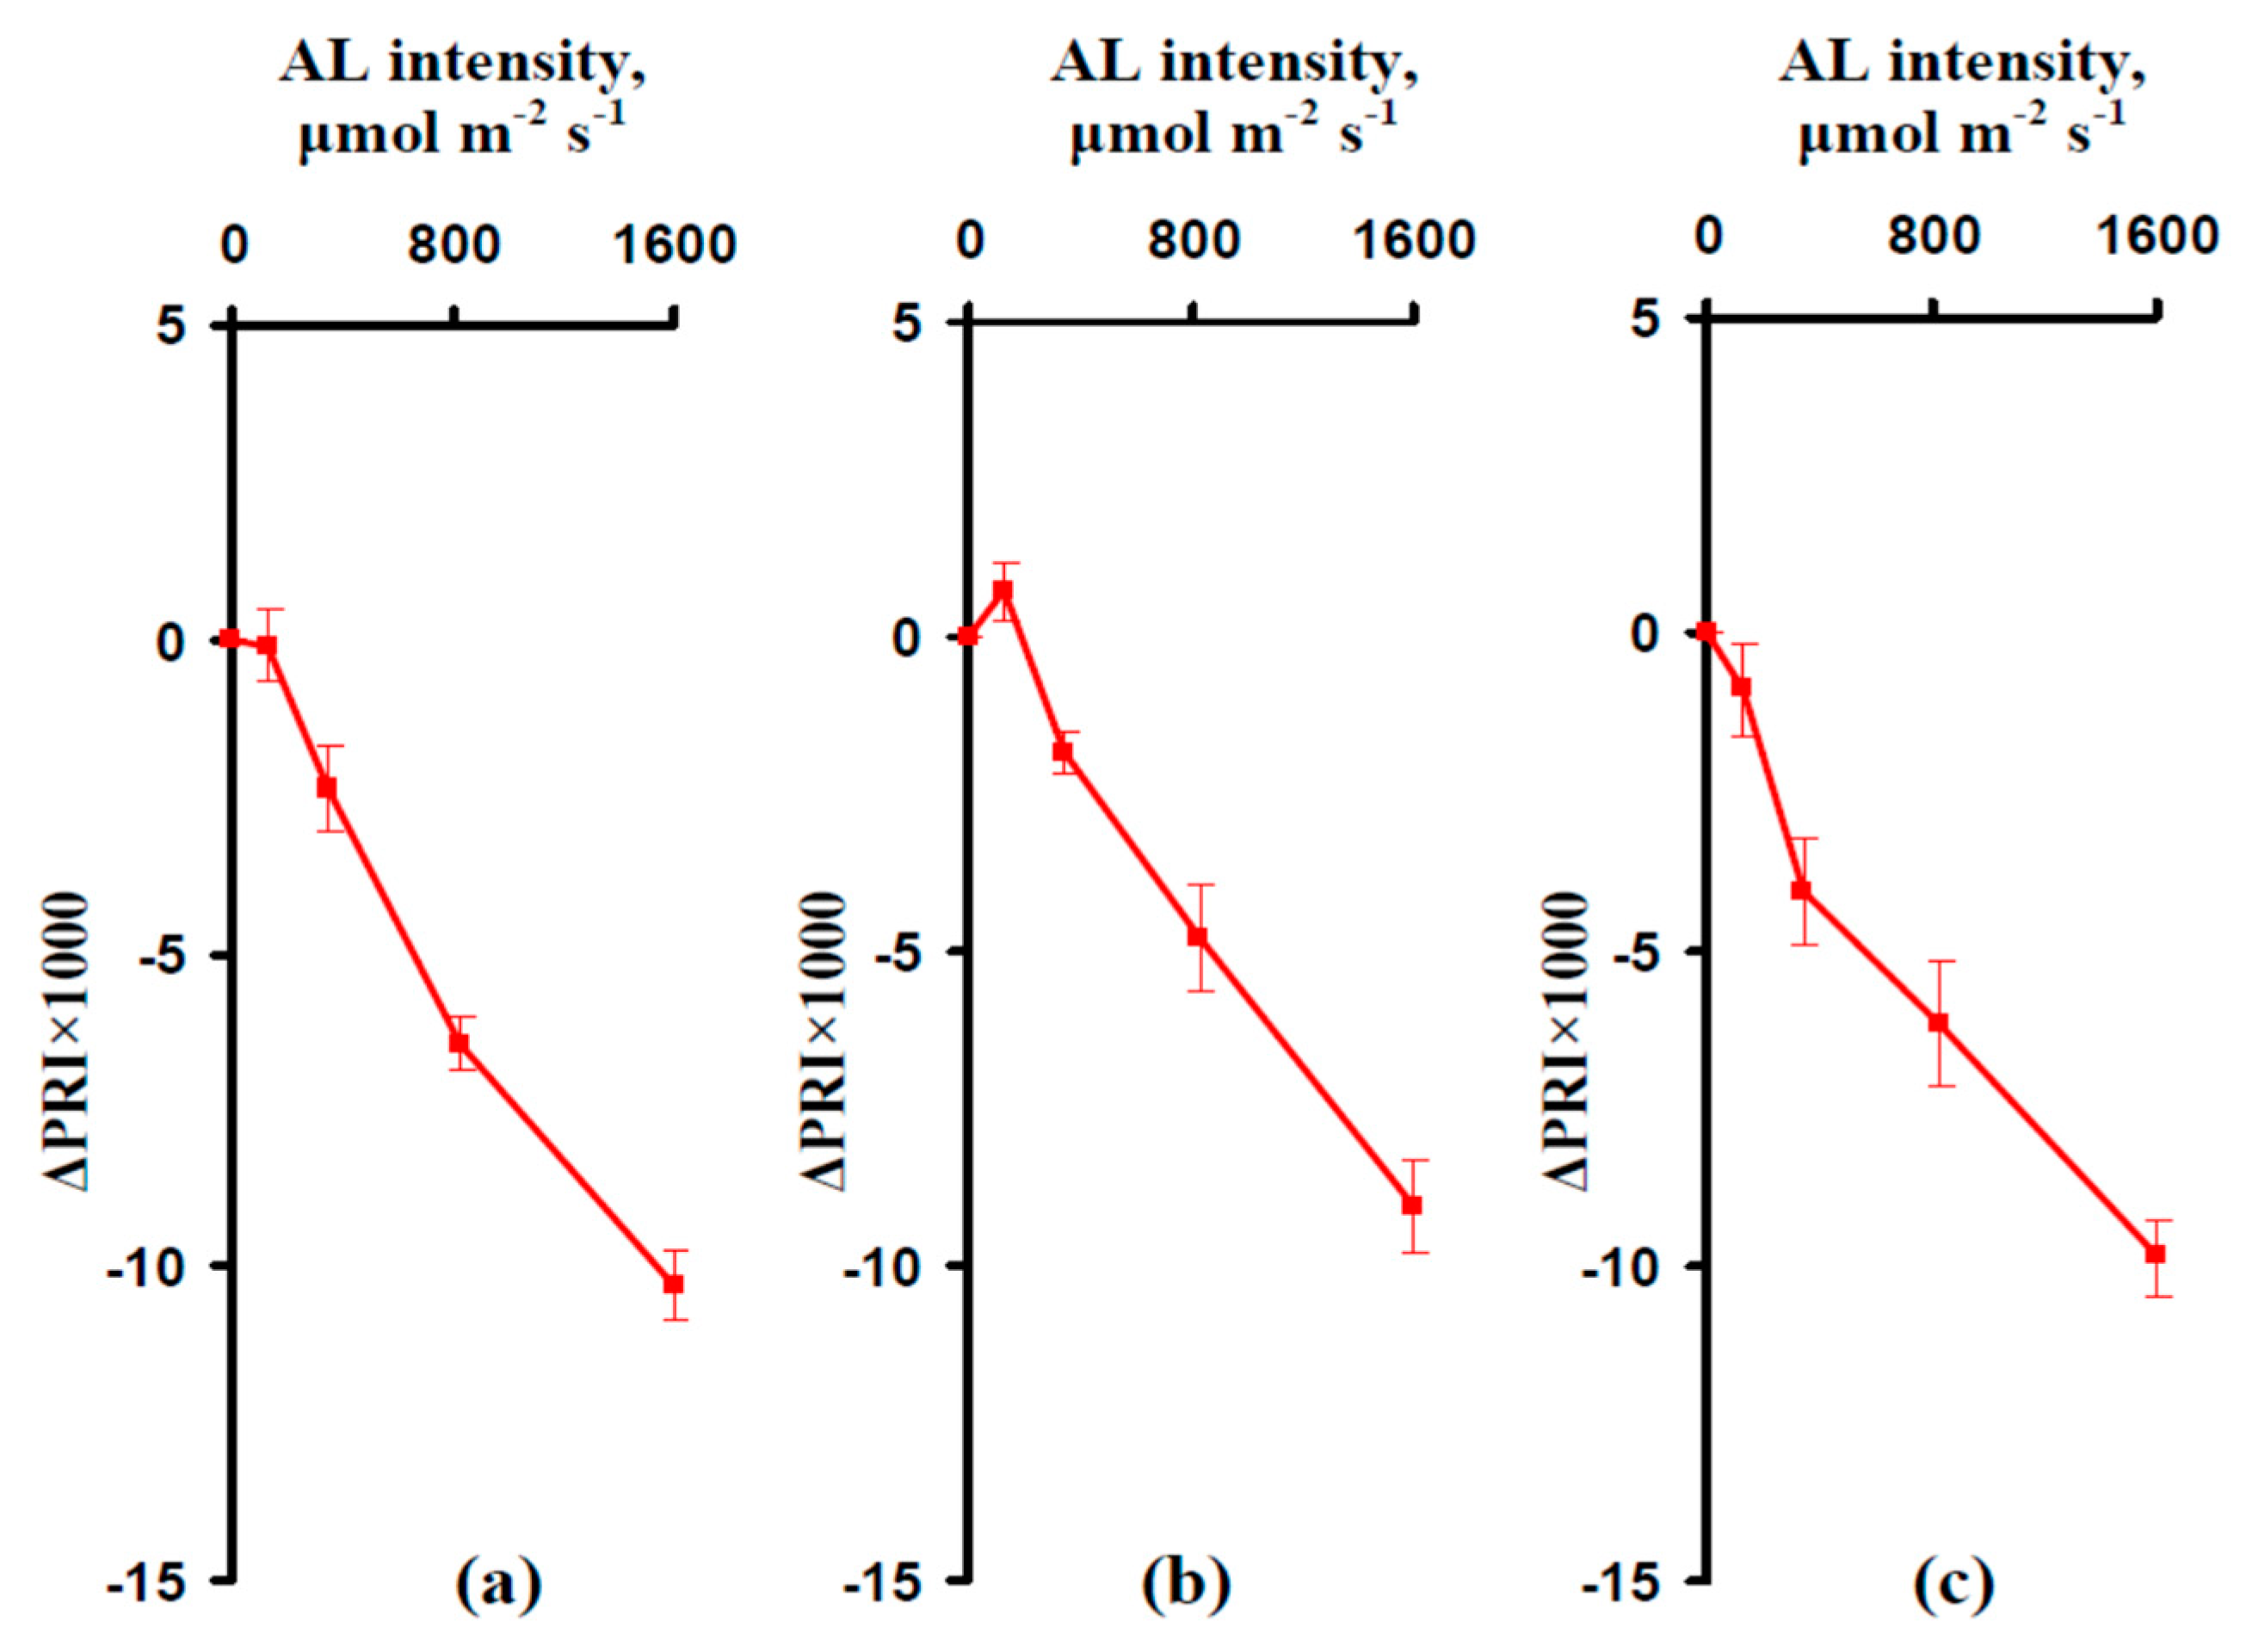
The analysis of the light dependences of NPQF and PRI showed that similar changes were observed in all investigated species of plants (Figure 4). The energy-dependent component of NPQ increased with an increase of the intensity of the AL, and an initial saturation effect was observed at high intensities of AL (830 and 1599 μmol m−2 s−1). Absolute values of PRI decreased with an increase of AL, however the dependence was only significant in leaves of wheat (Figure 4b). In pea (Figure 4a), and pumpkin (Figure 4c), differences between PRI at various AL intensities were not significant. It is known [2,31,32] that PRI is dependent on the content of chlorophyll and the pool size of the xanthophyll cycle pigments. The revealed variability of absolute values of PRI is probably connected with variability in the contents of photosynthetic pigments in individual leaves.
We eliminated the influence of the initial level of PRI on results using ΔPRI, which was calculated as the difference between the PRI value under illumination and the initial value of PRI (without AL).
Figure 4 shows that ΔPRI significantly changed with an increase of the AL intensity in all investigated species of plants; values of ΔPRI × 1000 at an intensity of 1599 μmol m−2 s−1 were from about −7.5 (wheat) to about −9 (pea). However, magnitudes of these changes in investigated plants were not significantly distinguished (p > 0.05). The values of ΔPRI were similar to the changes in the PRI under the action of various stressors (e.g., AL-induced changes in PRI × 1000 were about −20 in grapevine [10], about −5 in pea [18], from −20 to −30 in cucumber [33], about −14 in Arabidopsis [34], about −20 in maize [35], etc.). On the other hand, illumination can induce large changes in PRI (e.g., ΔPRI × 1000 was about −50 in [9]). The results show high variability of sensitivity of the PRI to the excess light in different objects.
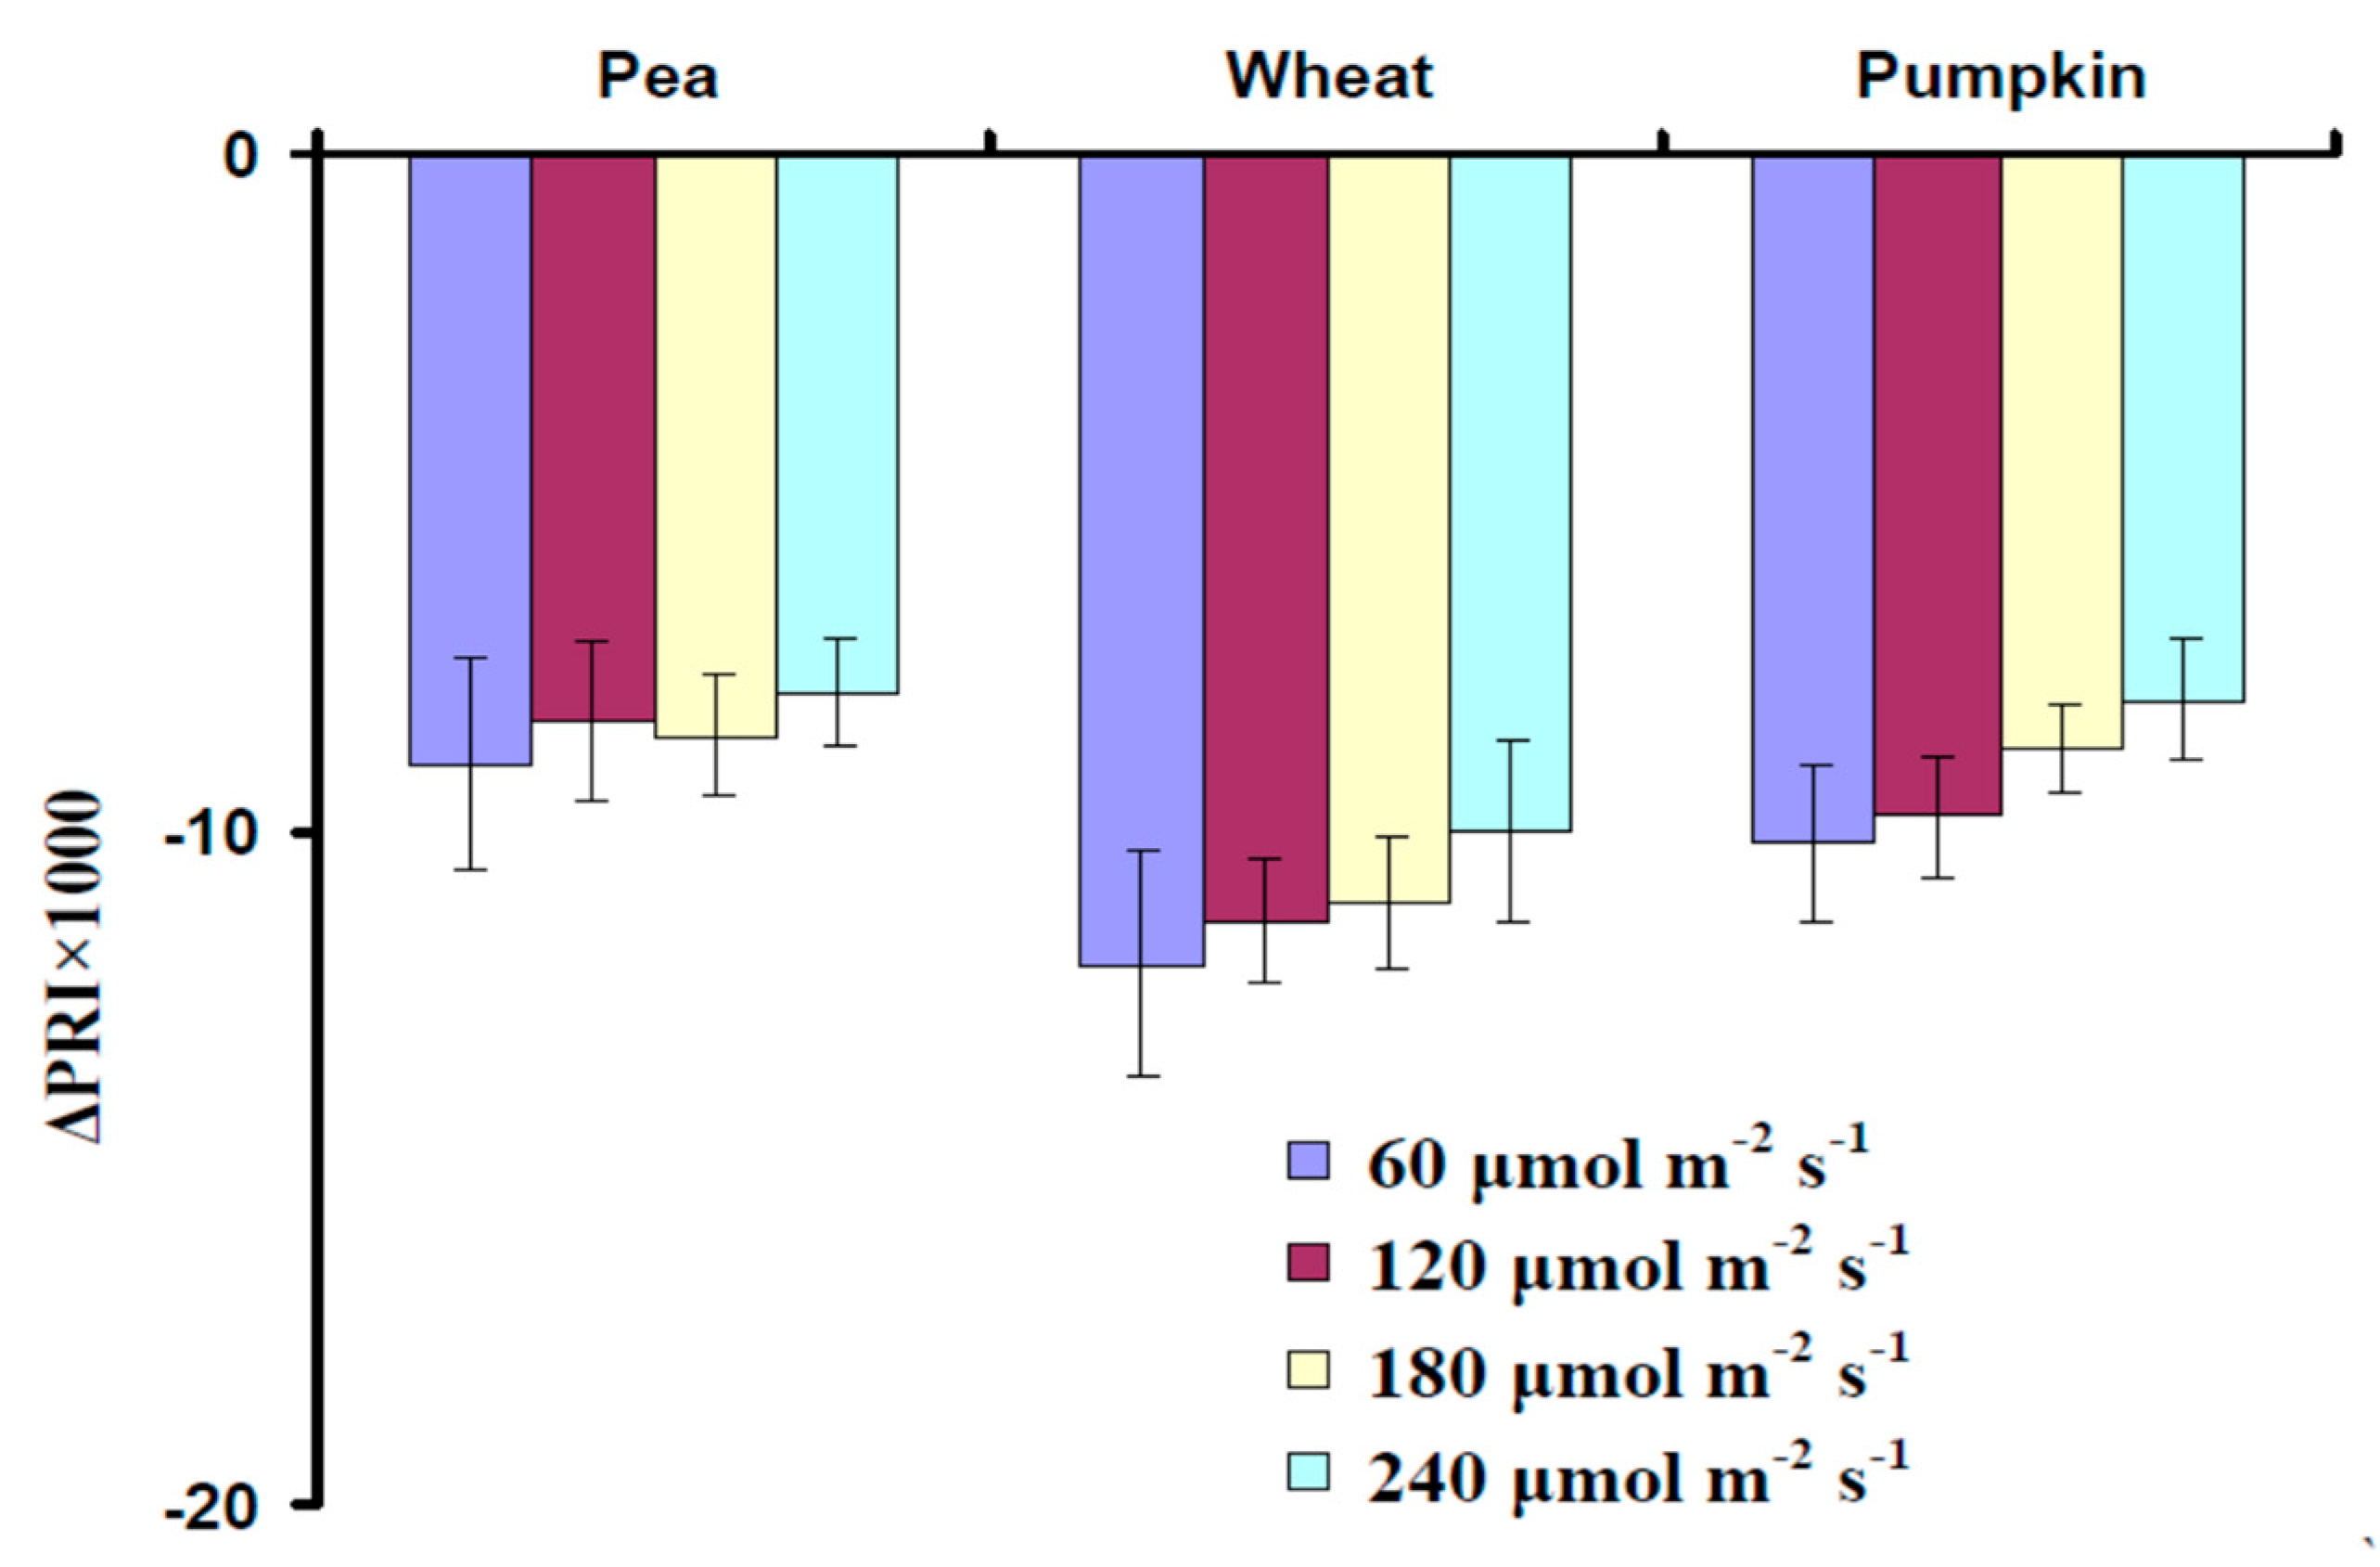
Subsequently, we analyzed the influence of the intensity of GYL on measurements of PRI. As shown in Figure 5, magnitudes of the PRI decrease, which was induced by the AL with high intensity (1599 μmol m−2 s−1), were not significantly different when using GYL with different intensity (from 60 to 240 μmol m−2 s−1). Magnitudes of ΔPRI × 1000 in this experiment ranged from −8 to −12. Significant differences between pea, wheat, and pumpkin were not observed.
Additionally, we analyzed the dependences of ΔPRI on the AL intensity at calculation of R531(570) as R531(570)FirstR531(570)BG (in accordance with Equation (7)). The main question of this analysis was whether changes in PRI can be measured without the averaging of RL values and with different durations of GYL illumination. The duration of GYL during R531(570)First measurement was varied from 1.25 s (5 s × 0.25) to 5 s (5 s × 1.00), in accordance with the assumed threshold for the identification of R531(570)First (0.25, see Section 2.2). Figure 6 shows that using R531(570)FirstR531(570)BG did not strongly influence the dependence of ΔPRI on the AL intensity in investigated plant species, i.e. short GYL pulses (about several seconds) can be also used for measurements of PRI.
Thus, the results in Section 3.2 show a decrease of PRI induced by AL illumination, measured using GYL pulses, and an increase of the energy-dependent component of NPQ. An analysis of the connection between PRI and NPQF is the task of the next stage of the present investigation.

3.3. Analysis of the Connection Between the Energy-Dependent Component of NPQ and Photochemical Reflectance Index

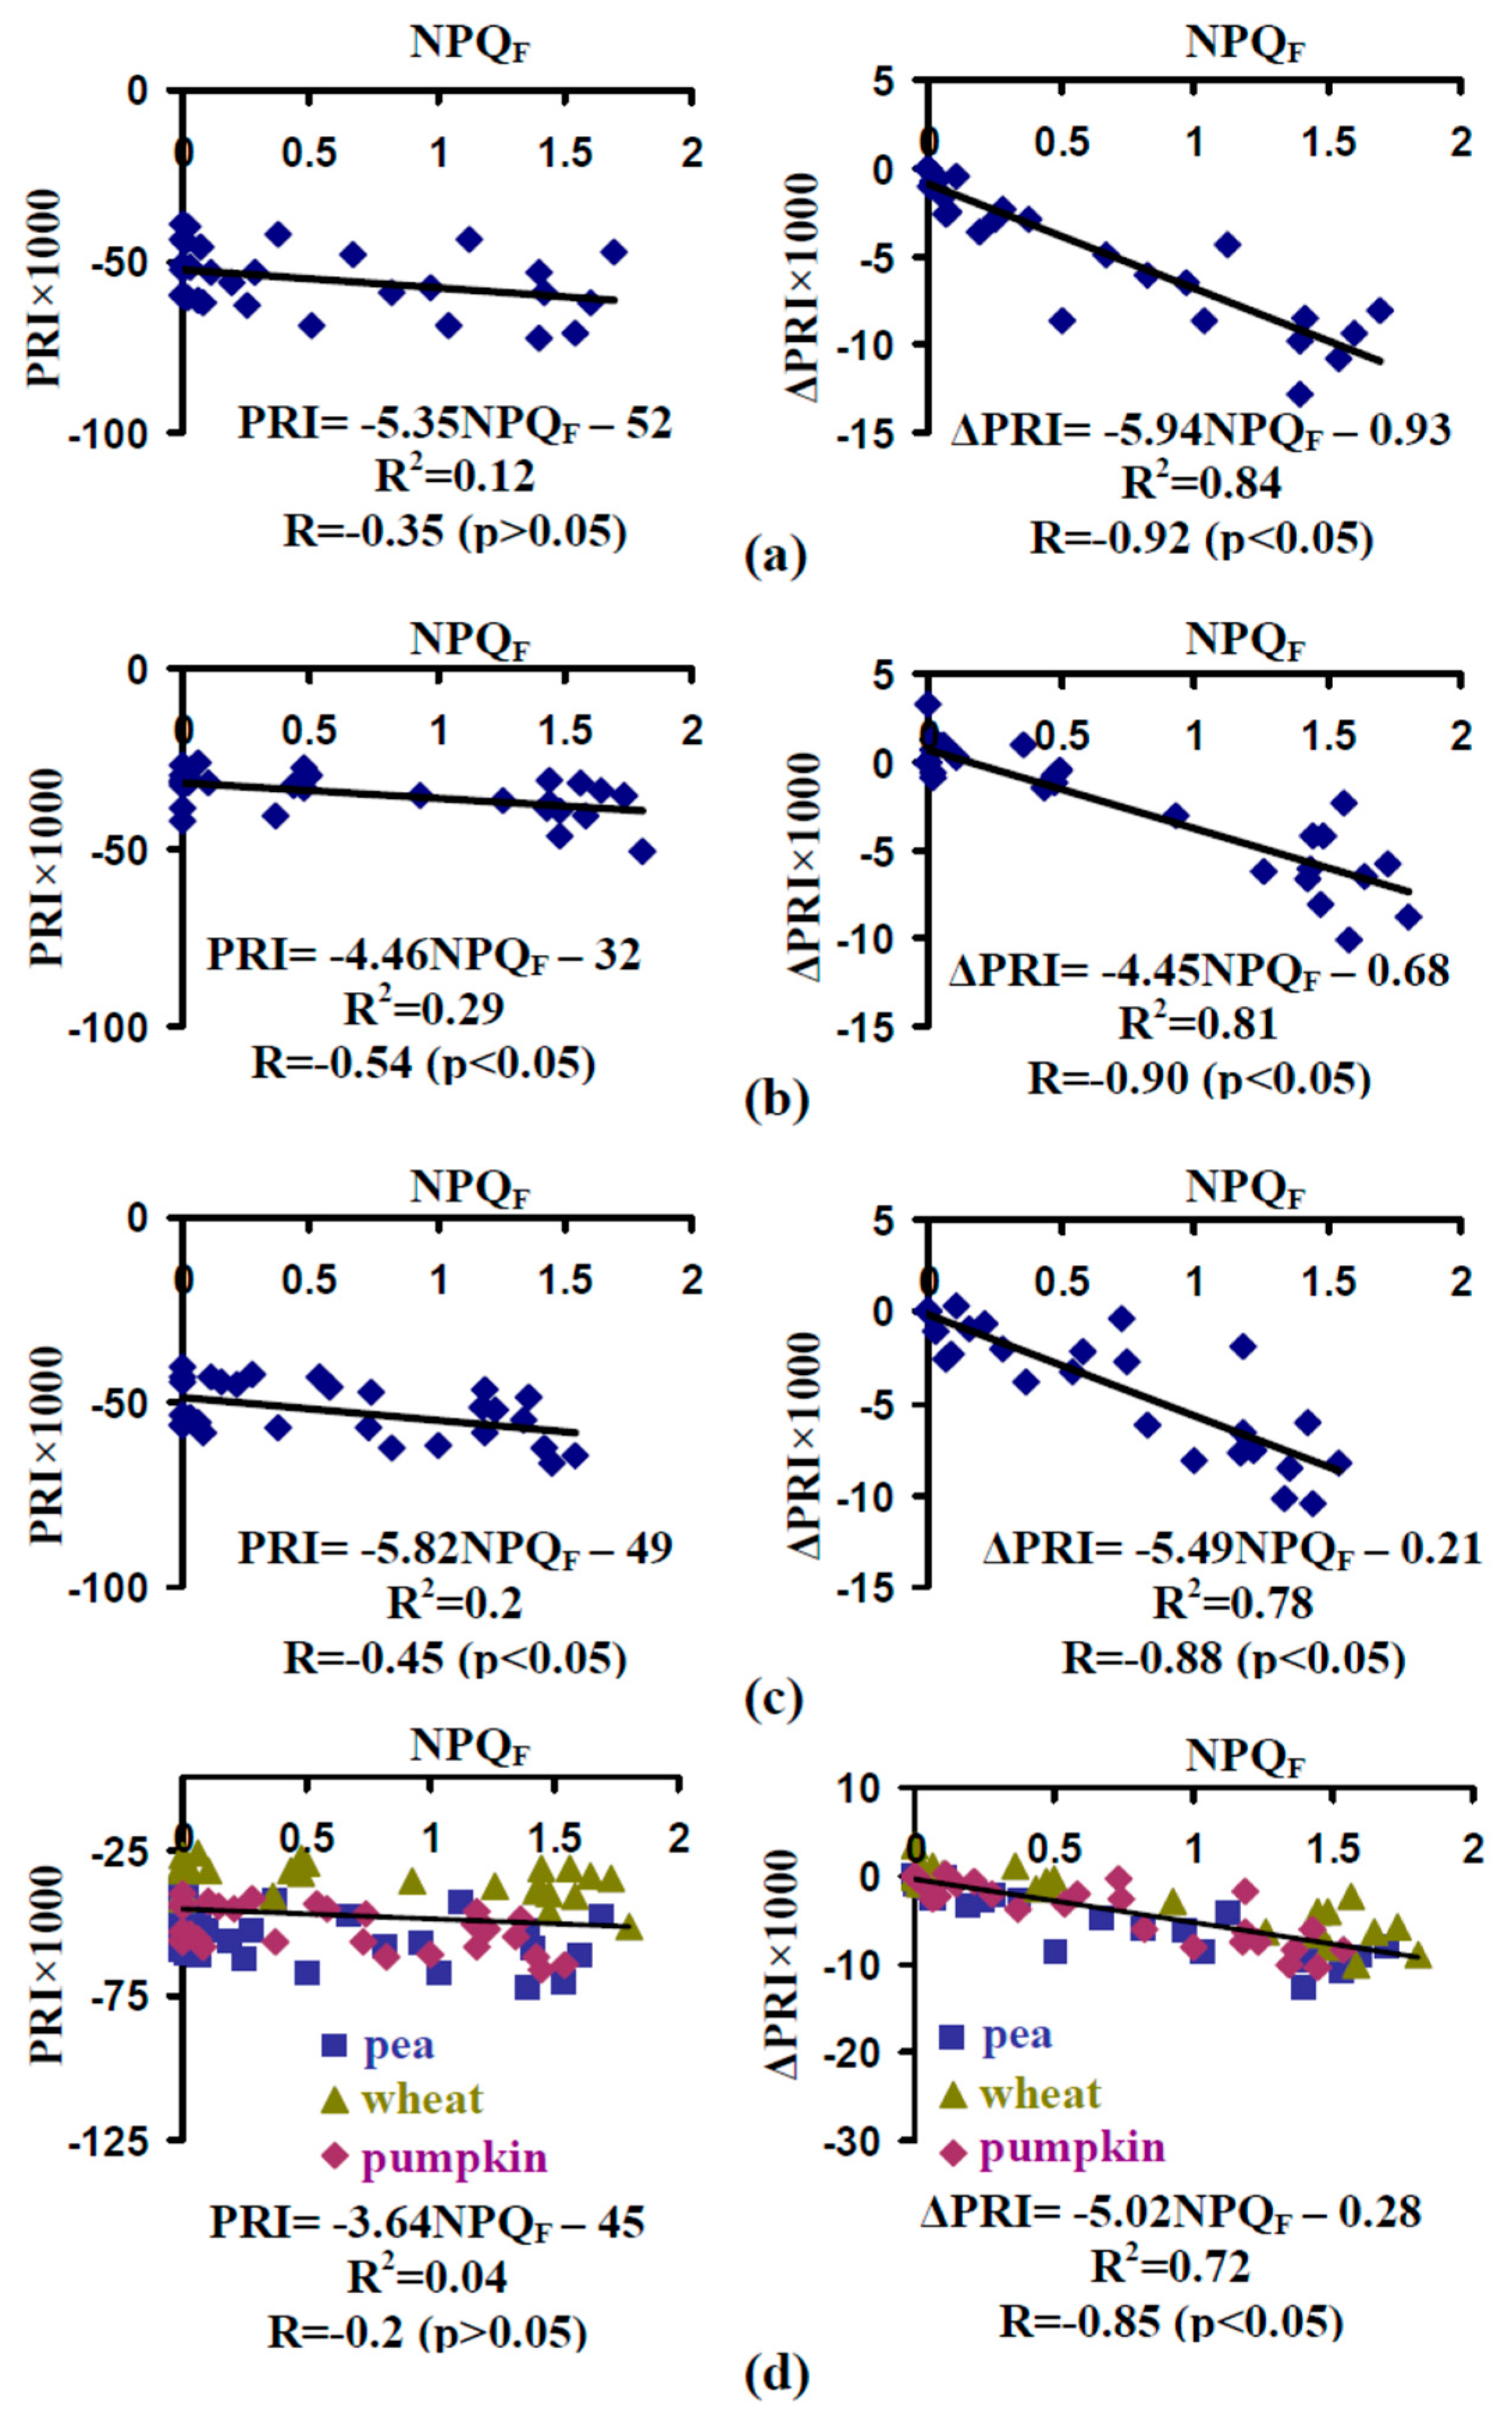
Figure 7 shows scatter plots between the energy-dependent component of NPQ and the photochemical reflectance index (PRI and ΔPRI) for individual seedlings of pea, wheat, and pumpkin. Absolute values of PRI were weakly connected with NPQF. However, moderate negative correlation coefficients were significant for wheat and pumpkin. Correlations between ΔPRI and NPQF were strong for all investigated species of plants; dependences of changes in the PRI on the energy-dependent component of NPQ were well approximated by linear regressions. Equations of the regressions were very similar for different investigated species. Considering this fact, we analyzed the total set of experimental values (for pea, wheat, and pumpkin). It was shown (Figure 7d) that the connection between PRI and NPQF was very weak; the dependence of ΔPRI on NPQF was very well approximated by the linear regression.
Thus, our results showed that fast light-induced changes in PRI (after 5 min of illumination by AL) were strongly connected to NPQF, caused by the AL action. In contrast, absolute values of PRI were weakly connected with the fast component of NPQ. The low efficiency of PRI for the estimation of NPQF is connected with a high variation of initial levels of PRI in individual plants, which was shown in our work (high standard errors for absolute values of PRI shown in Figure 4) as well as in works of other authors [31].

4. Discussion

The PRI is a widely used spectral index [2,4,5,7,8,30] which is connected with parameters of photosynthetic processes [9,10,11,14,15,36], the content of chlorophyll and xanthophyll cycle pigments [29,30,36,37], foliar isoprene emissions [38,39], etc. Measurements of PRI are noninvasive and can be performed at different spatial scales, including leaf, canopy, and ecosystem levels [5,31]. As a result, the improvement of methods of investigation of plant physiological state, which are based on PRI measurements, is an important task in the field of remote sensing.
There are three main points which are shown in our work. First, repetitive pulses of the green-yellow measuring light can be used for the measurement of the PRI under various intensities of light from another source without the continuous measurement of a reference panel, which was used in other works (e.g., Reference [10]). In particular, the GYL pulses removed error which was connected with the influence of the AL on the reflected light intensity at 570 nm (Figure 2 and Figure 3). The presence of this error could induce a shift of the measured PRI, which was similar to changes induced by stressors [8,13,14,15,18]. Moreover, the measurement using the GYL pulses does not require strong synchronization between pulses and reflectance measurements, since values of R531 and R570 can be revealed on the basis of analysis of the dynamics of the reflected light. Thus, the GYL pulses can be potentially used for the simplification of PRI measurement under sunlight with fluctuating intensity or under additional artificial light with controlled changes in intensity.
Second, our results show that illumination by AL induces a decrease of PRI, measured via the GYL pulses, and an increase of the energy-dependent component of NPQ (Figure 4, Figure 5 and Figure 6). The results are in a good accordance with literature data, as a number of works showed light-induced decreases of PRI [9,10,18,33,34,35] and increases of NPQF (e.g., References [40,41]). A conventional mechanism of the light-induced decrease of PRI is xanthophyll de-epoxidation (increase of the zeaxanthin concentration) [4,5,7,8]. The de-epoxidation was earlier considered to be mechanism of increase of the energy-dependent component of NPQ. However, in accordance with modern hypothesis, NPQF is induced by the protonation of PsbS and an increase of the zeaxanthin concentration only stimulates this process [1]. Considering these facts, it can be expected that changes in PRI and NPQF should not be very strongly connected. In contrast, an alternative hypothesis of PRI decrease, which is based on fast chloroplast shrinkage induced by lumen acidification [5,10], can predict high correlation between PRI and the energy-dependent component of NPQ. Our previous results [15] showed that changes in NPQF induced by propagation of electrical signals and probably lumen acidification [22,42,43] are strongly correlated with changes in PRI in pea. In contrast, the light-induced increase of NPQ is weakly connected with PRI in pea [18]. The results of the current analysis (Figure 7) show that NPQF is very strongly connected with ΔPRI (difference between PRI under the AL and the initial value of PRI without AL) that was in a good accordance with the number of works [44,45,46]. However, the connection between the fast component of NPQ with the absolute value of PRI was weak. We suppose that the weak correlation coefficient between NPQF and the absolute value of PRI is caused by the high variability of PRI, which is supported by the large standard errors of this index (Figure 4). This variability can probably be explained by dependences of the PRI on the content of chlorophyll and xanthophyll cycle pigments [2,31,32,37], since the parameters can vary between individual plants. The high correlation coefficient between NPQF and ΔPRI shows that light-induced changes in PRI on the range of minutes are mainly connected with the formation of the energy-dependent component of NPQ. The result is the indirect argument which supports the presence of alternative mechanisms of PRI (e.g., fast chloroplast shrinkage induced by lumen acidification [5,10]), since the NPQ dark relaxation for 2 min is considered to be connected with the protonation of PsbS rather than with the increase of the zeaxanthin concentration [34]; however, the problem requires further investigation). It is important that the calculation of ΔPRI requires the measurement of PRI under dark conditions (without photosynthetically active light) and its measurement under illumination by photosynthetically active light (maybe with different intensities), i.e. the use of short pulses of the GYL (with high intensity at wavelengths of 531 and 570 nm and with low photosynthetic efficiency) may be necessary for the solution of this task.
Third, our results show that the connection between ΔPRI and the energy-dependent component of NPQ can be quantitatively described by simple linear regressions. It is important that the regressions are similar for all investigated plants (pea, wheat, pumpkin), i.e. the general regression model can possibly be used for the estimation of NPQF on the basis of ΔPRI in different species of plants. The last point requires further investigations, under light with different spectra and intensities, and in different plants, etc. This possibility is very important for the remote sensing of plants, as the energy-dependent component of NPQ is an important marker of the action of stressors on photosynthetic processes [47,48,49,50].
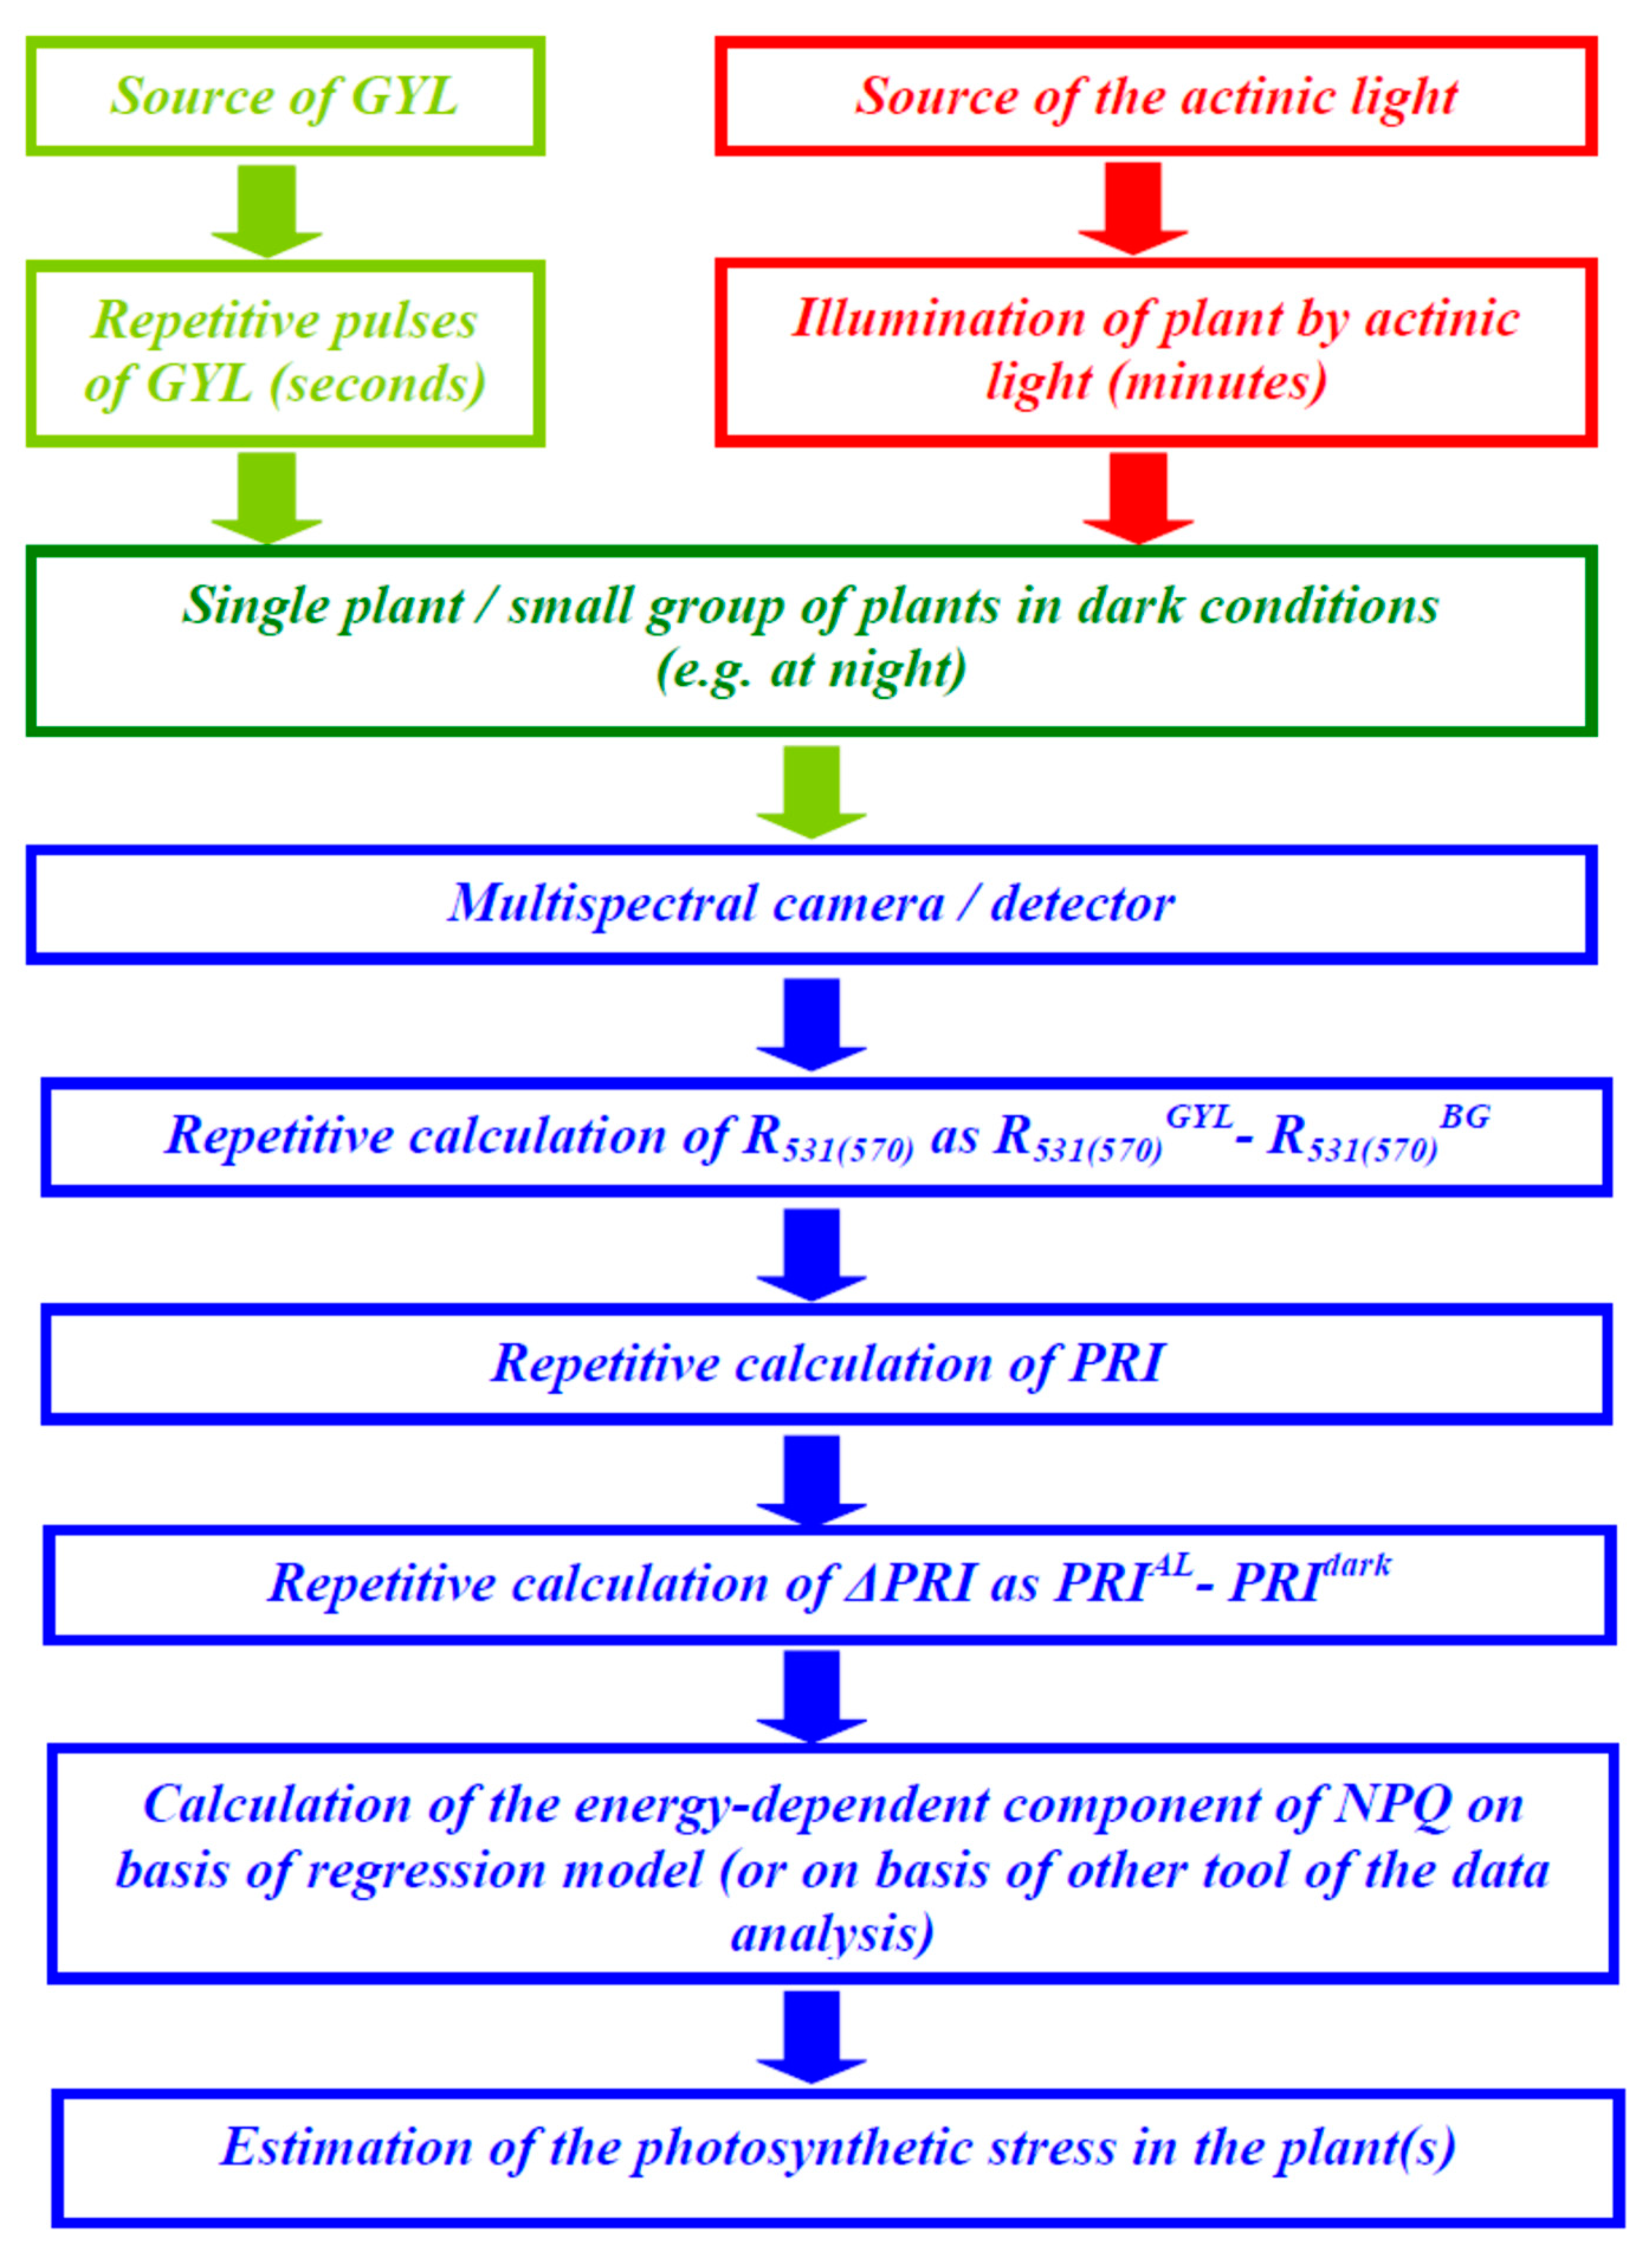
Figure 8 shows a hypothetical schema of the estimation of photosynthetic stress on the basis of measurements of ΔPRI using GYL pulses. The measurements can potentially be performed using a mobile platform and with the application of a multispectral camera, and investigations of such are potential future tasks.

5. Conclusions

The PRI is an important spectral index which is widely used for the remote monitoring of photosynthetic processes in plants [2,4,5,7]. Thus, the improvement of methods for its use is an important task in the field of remote sensing. In the current work, we showed that (i) repetitive GYL pulses can be used for the measurement of the photochemical reflectance index. The pulses can eliminate the error of the PRI measurement, which is caused by light from another source; (ii) ΔPRI (difference between PRI under AL and the initial value of PRI without AL) is more strongly connected with the energy-dependent component of NPQ than the absolute value of PRI; and (iii) the same linear regression can probably describe the connection between ΔPRI and the energy-dependent component of NPQ in the investigated plants (pea, wheat, and pumpkin).

Author Contributions

Conceptualization, E.S. and V.S.; Formal analysis, E.S. and V.S.; Funding acquisition, V.S.; Investigation, E.S.; Methodology, E.S.; Project administration, V.S.; Supervision, V.S.

Funding

This research was supported by the Russian Science Foundation, grant number 17-76-20032.

Conflicts of Interest

The authors declare no conflict of interest.

References

  1. Ruban, A.V. Nonphotochemical chlorophyll fluorescence quenching: Mechanism and effectiveness in protecting plants from photodamage. Plant Physiol. 2016, 170, 1903–1916. [Google Scholar] [CrossRef] [PubMed]
  2. Porcar-Castell, A.; Tyystjärvi, E.; Atherton, J.; van der Tol, C.; Flexas, J.; Pfündel, E.E.; Moreno, J.; Frankenberg, C.; Berry, J.A. Linking chlorophyll a fluorescence to photosynthesis for remote sensing applications: Mechanisms and challenges. J. Exp. Bot. 2014, 65, 4065–4095. [Google Scholar] [CrossRef]
  3. Grace, J.; Nichol, C.; Disney, M.; Lewis, P.; Quaife, T.; Bowyer, P. Can we measure terrestrial photosynthesis from space directly, using spectral reflectance and fluorescence? Glob. Chang. Biol. 2007, 13, 1484–1497. [Google Scholar] [CrossRef]
  4. Garbulsky, M.F.; Peñuelas, J.; Gamon, J.; Inoue, Y.; Filella, I. The photochemical reflectance index (PRI) and the remote sensing of leaf, canopy and ecosystem radiation use efficiencies. A review and meta-analysis. Remote Sens. Environ. 2011, 115, 281–297. [Google Scholar] [CrossRef]
  5. Zhang, C.; Filella, I.; Garbulsky, M.F.; Peñuelas, J. Affecting factors and recent improvements of the photochemical reflectance index (PRI) for remotely sensing foliar, canopy and ecosystemic radiation-use efficiencies. Remote Sens. 2016, 8, 677. [Google Scholar]
  6. Gamon, J.A.; Huemmrich, K.F.; Wong, C.Y.; Ensminger, I.; Garrity, S.; Hollinger, D.Y.; Noormets, A.; Peñuelas, J. A remotely sensed pigment index reveals photosynthetic phenology in evergreen conifers. Proc. Natl. Acad. Sci. USA 2016, 113, 13087–13092. [Google Scholar] [CrossRef] [PubMed] [Green Version]
  7. Sukhova, E.; Sukhov, V. Connection of the photochemical reflectance index (PRI) with the photosystem II quantum yield and nonphotochemical quenching can be dependent on variations of photosynthetic parameters among investigated plants: A meta-analysis. Remote Sens. 2018, 10, 771. [Google Scholar] [CrossRef]
  8. Gamon, J.A.; Peñuelas, J.; Field, C.B. A narrow-waveband spectral index that tracks diurnal changes in photosynthetic efficiency. Remote Sens. Environ. 1992, 41, 35–44. [Google Scholar]
  9. Peñuelas, J.; Filella, I.; Gamon, J.A. Assessment of photosynthetic radiation-use efficiency with spectral reflectance. New Phytol. 1995, 131, 291–296. [Google Scholar] [CrossRef] [Green Version]
  10. Evain, S.; Flexas, J.; Moya, I. A new instrument for passive remote sensing: 2. Measurement of leaf and canopy reflectance changes at 531 nm and their relationship with photosynthesis and chlorophyll fluorescence. Remote Sens. Environ. 2004, 91, 175–185. [Google Scholar] [CrossRef]
  11. Ripullone, F.; Rivelli, A.R.; Baraldi, R.; Guarini, R.; Guerrieri, R.; Magnani, F.; Peñuelas, J.; Raddi, S.; Borghetti, M. Effectiveness of the photochemical reflectance index to track photosynthetic activity over a range of forest tree species and plant water statuses. Funct. Plant Biol. 2011, 38, 177–186. [Google Scholar] [CrossRef]
  12. Osório, J.; Osório, M.L.; Romano, A. Reflectance indices as nondestructive indicators of the physiological status of Ceratonia siliqua seedlings under varying moisture and temperature regimes. Funct. Plant Biol. 2012, 39, 588–597. [Google Scholar] [CrossRef]
  13. Zinnert, J.C.; Nelson, J.D.; Hoffman, A.M. Effects of salinity on physiological responses and the photochemical reflectance index in two co-occurring coastal shrubs. Plant Soil 2012, 354, 45–55. [Google Scholar] [CrossRef]
  14. Magney, T.S.; Eusden, S.A.; Eitel, J.U.H.; Logan, B.A.; Jiang, J.; Vierling, L.A. Assessing leaf photoprotective mechanisms using terrestrial LiDAR: Towards mapping canopy photosynthetic performance in three dimensions. New Phytol. 2014, 201, 344–356. [Google Scholar] [CrossRef] [PubMed]
  15. Sukhov, V.; Sukhova, E.; Gromova, E.; Surova, L.; Nerush, V.; Vodeneev, V. The electrical signals-induced systemic photosynthetic response is accompanied with changes in photochemical reflectance index in pea. Funct. Plant Biol. 2018, 46, 328–338. [Google Scholar] [CrossRef]
  16. Maxwell, K.; Johnson, G.N. Chlorophyll fluorescence—A practical guide. J. Exp. Bot. 2000, 51, 659–668. [Google Scholar] [CrossRef] [PubMed]
  17. Yoshizumi, Y.; Li, M.-S.; Akihiro, I. Assessment of photochemical reflectance index as a tool for evaluation of chlorophyll fluorescence parameters in cotton and peanut cultivars under water stress condition. Agric. Sci. China 2010, 9, 662–670. [Google Scholar]
  18. Sukhov, V.S.; Gromova, E.N.; Sukhova, E.M.; Surova, L.M.; Nerush, V.N.; Vodeneev, V.A. Analysis of correlations between the indexes of light-dependent reactions of photosynthesis and the photochemical reflectance index (PRI) in pea leaves under short-term illumination. Biochem. Suppl. Ser. A 2019, 13, 67–77. [Google Scholar]
  19. Sarlikioti, V.; Driever, S.M.; Marcelis, L.F.M. Photochemical reflectance index as a mean of monitoring early water stress. Ann. Appl. Biol. 2010, 157, 81–89. [Google Scholar] [CrossRef]
  20. Balegh, S.E.; Biddulph, O. The photosynthetic action spectrum of the bean plant. Plant Physiol. 1970, 46, 1–5. [Google Scholar] [CrossRef]
  21. Inada, K. Action spectra for photosynthesis in higher plants. Plant Cell Physiol. 1976, 17, 355–365. [Google Scholar]
  22. Kalaji, H.M.; Schansker, G.; Ladle, R.J.; Goltsev, V.; Bosa, K.; Allakhverdiev, S.I.; Brestic, M.; Bussotti, F.; Calatayud, A.; Dąbrowski, P.; et al. Frequently asked questions about in vivo chlorophyll fluorescence: Practical issues. Photosynth. Res. 2014, 122, 121–158. [Google Scholar] [CrossRef] [PubMed]
  23. Sukhov, V.; Sherstneva, O.; Surova, L.; Katicheva, L.; Vodeneev, V. Proton cellular influx as a probable mechanism of variation potential influence on photosynthesis in pea. Plant Cell Environ. 2014, 37, 2532–2541. [Google Scholar] [CrossRef] [PubMed]
  24. Sukhov, V.; Surova, L.; Morozova, E.; Sherstneva, O.; Vodeneev, V. Changes in H+-ATP synthase activity, proton electrochemical gradient, and pH in pea chloroplast can be connected with variation potential. Front. Plant Sci. 2016, 7, 1092. [Google Scholar] [CrossRef]
  25. Sukhova, E.; Mudrilov, M.; Vodeneev, V.; Sukhov, V. Influence of the variation potential on photosynthetic flows of light energy and electrons in pea. Photosynth. Res. 2018, 136, 215–228. [Google Scholar] [CrossRef]
  26. Sherstneva, O.N.; Vodeneev, V.A.; Katicheva, L.A.; Surova, L.M.; Sukhov, V.S. Participation of intracellular and extracellular pH changes in photosynthetic response development induced by variation potential in pumpkin seedlings. Biochemistry 2015, 80, 776–784. [Google Scholar] [CrossRef]
  27. Sukhov, V.S.; Gaspirovich, V.V.; Gromova, E.N.; Ladeynova, M.M.; Sinitsyna, Y.V.; Berezina, E.V.; Akinchits, E.K.; Vodeneev, V.A. Decrease of mesophyll conductance to CO2 is a possible mechanism of abscisic acid influence on photosynthesis in seedlings of pea and wheat. Biochem. Suppl. Ser. A 2017, 11, 237–247. [Google Scholar] [CrossRef]
  28. Rahimzadeh-Bajgiran, P.; Munehiro, M.; Omasa, K. Relationships between the photochemical reflectance index (PRI) and chlorophyll fluorescence parameters and plant pigment indices at different leaf growth stages. Photosynth. Res. 2012, 113, 261–271. [Google Scholar] [CrossRef]
  29. Gamon, J.A.; Field, C.B.; Fredeen, A.L.; Thayer, S. Assessing photosynthetic downregulation in sunflower stands with an optically-based model. Photosynth. Res. 2001, 67, 113–125. [Google Scholar] [CrossRef] [PubMed]
  30. Peñuelas, J.; Garbulsky, M.F.; Filella, I. Photochemical reflectance index (PRI) and remote sensing of plant CO2 uptake. New Phytol. 2011, 191, 596–599. [Google Scholar] [CrossRef] [PubMed]
  31. Filella, I.; Porcar-Castell, A.; Munné-Bosch, S.; Bäck, J.; Garbulsky, M.F.; Peñuelas, J. PRI assessment of long-term changes in carotenoids/chlorophyll ratio and short-term changes in de-epoxidation state of the xanthophyll cycle. Int. J. Remote Sens. 2009, 30, 4443–4455. [Google Scholar] [CrossRef]
  32. Porcar-Castell, A.; Garcia-Plazaola, J.I.; Nichol, C.J.; Kolari, P.; Olascoaga, B.; Kuusinen, N.; Fernández-Marín, B.; Pulkkinen, M.; Juurola, E.; Nikinmaa, E. Physiology of the seasonal relationship between the photochemical reflectance index and photosynthetic light use efficiency. Oecologia 2012, 170, 313–323. [Google Scholar] [CrossRef] [PubMed]
  33. Murakami, K.; Ibaraki, Y. Time course of the photochemical reflectance index during photosynthetic induction: Its relationship with the photochemical yield of photosystem II. Physiol. Plant. 2019, 165, 524–536. [Google Scholar] [CrossRef] [PubMed]
  34. Kohzuma, K.; Hikosaka, K. Physiological validation of photochemical reflectance index (PRI) as a photosynthetic parameter using Arabidopsis thaliana mutants. Biochem. Biophys. Res. Commun. 2018, 498, 52–57. [Google Scholar] [CrossRef]
  35. Liu, L.; Zhang, Y.; Jiao, Q.; Peng, D. Assessing photosynthetic light-use efficiency using a solar-induced chlorophyll fluorescence and photochemical reflectance index. Int. J. Remote Sens. 2013, 34, 4264–4280. [Google Scholar] [CrossRef]
  36. Wong, C.Y.; Gamon, J.A. The photochemical reflectance index provides an optical indicator of spring photosynthetic activation in evergreen conifers. New Phytol. 2015, 206, 196–208. [Google Scholar] [CrossRef] [PubMed]
  37. Wong, C.Y.; Gamon, J.A. Three causes of variation in the photochemical reflectance index (PRI) in evergreen conifers. New Phytol. 2015, 206, 187–195. [Google Scholar] [CrossRef]
  38. Peñuelas, J.; Marino, G.; Llusia, J.; Morfopoulos, C.; Farré-Armengol, G.; Filella, I. Photochemical reflectance index as an indirect estimator of foliar isoprenoid emissions at the ecosystem level. Nat. Commun. 2013, 4, 2604. [Google Scholar] [CrossRef] [Green Version]
  39. Balzarolo, M.; Peñuelas, J.; Filella, I.; Portillo-Estrada, M.; Ceulemans, R. Assessing ecosystem isoprene emissions by hyperspectral remote sensing. Remote Sens. 2018, 10, 1086. [Google Scholar] [CrossRef]
  40. Guadagno, C.R.; Virzo De Santo, A.; D’Ambrosio, N. A revised energy partitioning approach to assess the yields of non-photochemical quenching components. Biochim. Biophys. Acta 2010, 1797, 525–530. [Google Scholar] [CrossRef] [Green Version]
  41. Zaks, J.; Amarnath, K.; Sylak-Glassman, E.J.; Fleming, G.R. Models and measurements of energy-dependent quenching. Photosynth. Res. 2013, 116, 389–409. [Google Scholar] [CrossRef] [PubMed] [Green Version]
  42. Sukhov, V. Electrical signals as mechanism of photosynthesis regulation in plants. Photosynth. Res. 2016, 130, 373–387. [Google Scholar] [CrossRef]
  43. Sukov, V.; Sukhova, E.; Vodeneev, V. Long-distance electrical signals as a link between the local action of stressors and the systemic physiological responses in higher plants. Prog. Biophys. Mol. Biol. 2019. [Google Scholar] [CrossRef] [PubMed]
  44. Hmimina, G.; Dufrêne, E.; Soudani, K. Relationship between photochemical reflectance index and leaf ecophysiological and biochemical parameters under two different water statuses: Towards a rapid and efficient correction method using real-time measurements. Plant Cell Environ. 2014, 37, 473–487. [Google Scholar] [CrossRef] [PubMed]
  45. Magney, T.S.; Vierling, L.A.; Eitel, J.U.H.; Huggins, D.R.; Garrity, S.R. Response of high frequency Photochemical Reflectance Index (PRI) measurements to environmental conditions in wheat. Remote Sens. Environ. 2016, 173, 84–97. [Google Scholar] [CrossRef]
  46. Vilfan, N.; Van der Tol, C.; Yang, P.; Wyber, R.; Malenovský, Z.; Robinson, S.A.; Verhoef, W. Extending Fluspect to simulate xanthophyll driven leaf reflectance dynamics. Remote Sens. Environ. 2018, 211, 345–356. [Google Scholar] [CrossRef]
  47. Huang, W.; Zhang, S.B.; Cao, K.F. Stimulation of cyclic electron flow during recovery after chilling-induced photoinhibition of PSII. Plant Cell Physiol. 2010, 51, 1922–1928. [Google Scholar] [CrossRef] [PubMed]
  48. Carmo-Silva, A.E.; Salvucci, M.E. The temperature response of CO2 assimilation, photochemical activities and Rubisco activation in Camelina sativa, a potential bioenergy crop with limited capacity for acclimation to heat stress. Planta 2012, 236, 1433–1445. [Google Scholar] [CrossRef]
  49. Huang, W.; Yang, S.J.; Zhang, S.B.; Zhang, J.L.; Cao, K.F. Cyclic electron flow plays an important role in photoprotection for the resurrection plant Paraboea rufescens under drought stress. Planta 2012, 235, 819–828. [Google Scholar] [CrossRef] [PubMed]
  50. Zivcak, M.; Brestic, M.; Balatova, Z.; Drevenakova, P.; Olsovska, K.; Kalaji, H.M.; Yang, X.; Allakhverdiev, S.I. Photosynthetic electron transport and specific photoprotective responses in wheat leaves under drought stress. Photosynth. Res. 2013, 117, 529–546. [Google Scholar] [CrossRef]
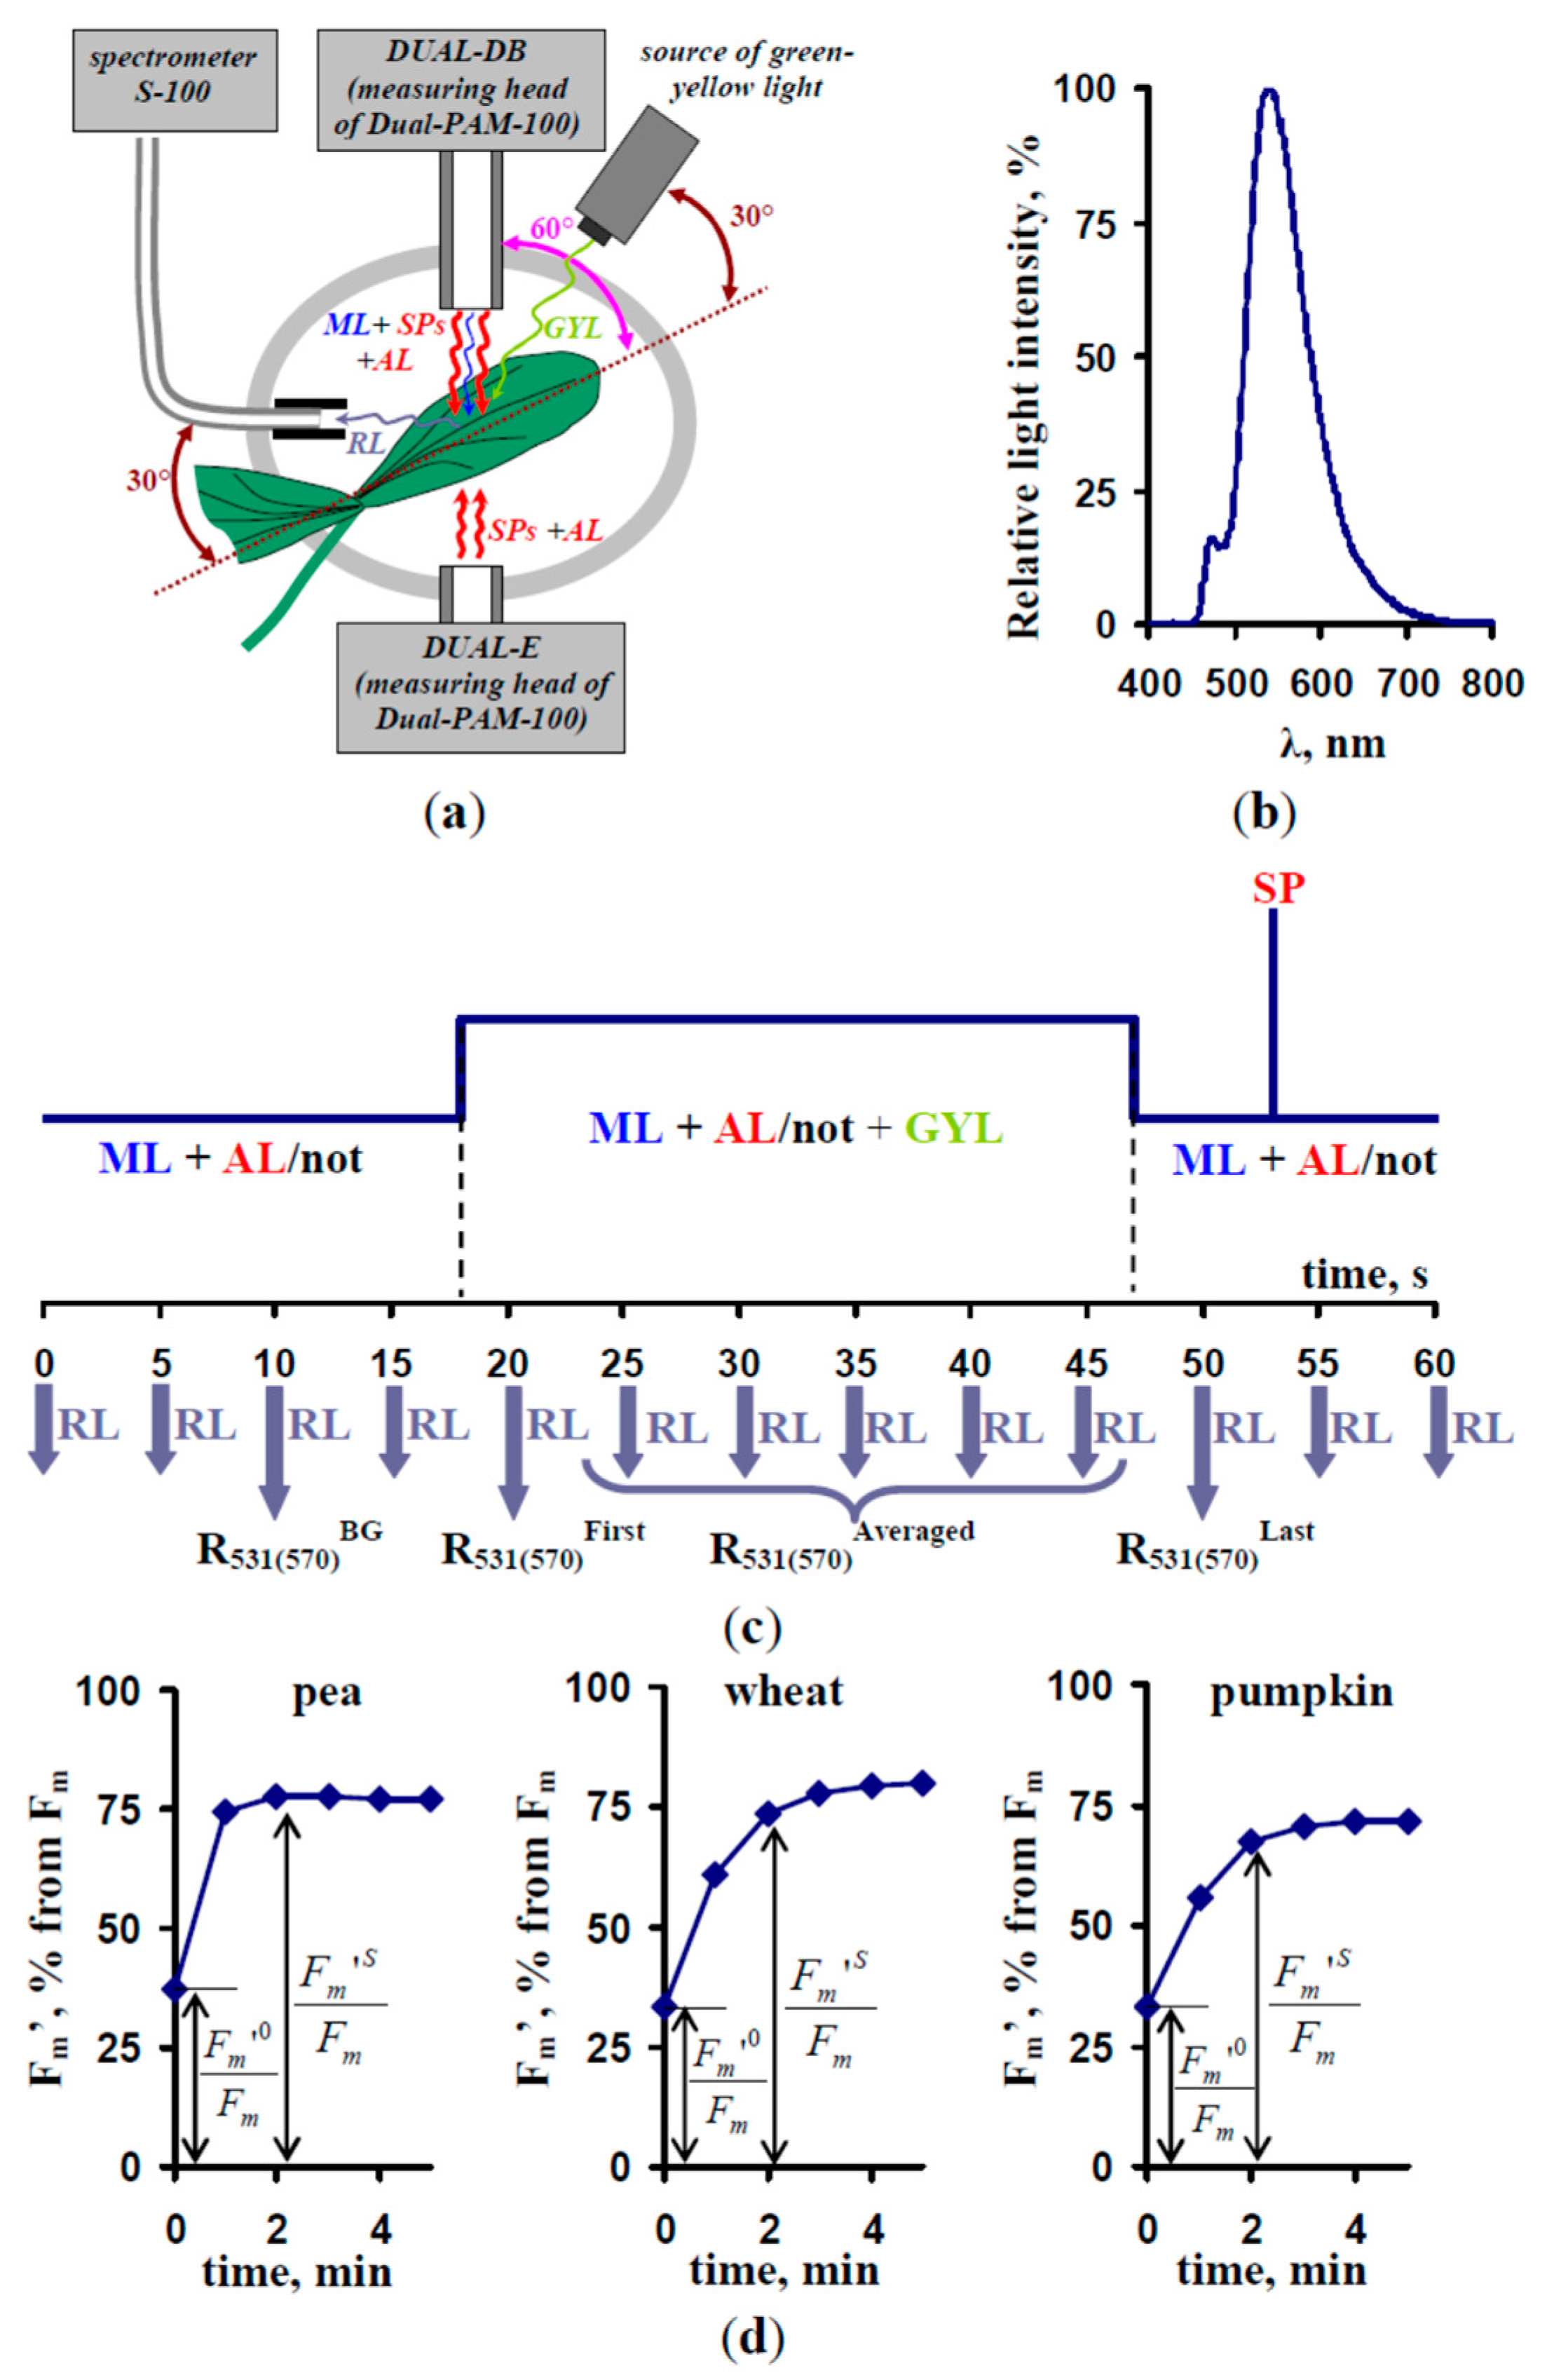
Figure 1. (a) Schema of measurements of the photochemical reflectance index (PRI) and photosynthetic parameters. Measuring light (ML) is standard pulses of the weak fluorescence measuring blue light (maximum intensity at 460 nm, 24 μmol m−2 s−1, 2.5 μs pulse length). The red actinic light (AL) is maximum at 630 nm, 131, 344, 830, or 1599 μmol m−2 s−1, and pulses of the measuring green-yellow light (GYL) are maximum at 550 nm, 60, 120, 180, or 240 μmol m−2 s−1, 30 s. RL is the reflected light. Saturation pulses (SP) are maximum at 630 nm, 10,000 μmol m−2 s−1, 300 ms. DUAL-DB and DUAL-E are the detector and emitter blocks of the Dual-PAM-100 measuring system. S-100 is a spectrometer with a fiber-optic cable. The GYL source was a white TDS-P003L4U14 LED with yellow and yellow-green glass bandpass filters. The angle between the leaf surface and the direction of the GYL was about 30°; the angle between the leaf surface and the input for RL was about 30°; and the angle between the leaf surface and the direction of AL, SP, and ML was about 60°. (b) Light spectrum of the GYL. (c) Schema of the measurement of the reflected light at 531(570) nm (R531(570)) at the pulse of GYL. R531(570) was calculated as R531(570)AveragedR531(570)BG or as R531(570)FirstR531(570)BG, where R531(570)BG is the absolute intensity of the reflected light at 531 (570) nm before the GYL pulse, R531(570)First is the absolute intensity of the reflected light at 531 (570) nm at the initiation of this pulse, R531(570)Averaged is the averaging of absolute intensities of the reflected light at 531 (570) nm during the GYL pulse, and R531(570)Last is the absolute intensity of the reflected light at 531 (570) nm at the finalization of this pulse. (d) A dark relaxation of the maximum yield of fluorescence (Fm′) in investigated plants after illumination by AL (1599 μmol m−2 s−1, 5 min). Fm is the maximum yield of fluorescence after dark adaptation and Fm0 and FmS are the maximum yields of fluorescence before the finalization of illumination and at 2 min of dark relaxation, respectively.
Remotesensing 11 00810 g001
Figure 2. Changes in the RL intensity at 531 and 570 nm under illumination by AL with different intensities in pea (a), wheat (b), and pumpkin (c) (n = 6). The absolute intensity of RL (R531(570)Averaged) and the magnitude of the change in the RL intensity during the GYL pulse (R531(570)AveragedR531(570)BG) were used. R531(570)BG is the absolute intensity of the reflected light at 531 (570) nm before the GYL pulse and R531(570)Averaged is the averaging of the absolute intensities of the reflected light at 531 (570) nm during the GYL pulse. The intensities of RL before illumination by AL were assumed to be 100%. The GYL pulse was started after 20 s of illumination by AL (maximum intensity at 630 nm, 1599 μmol m−2 s−1). * indicates that the difference between R531(570)Averaged and R531(570)AveragedR531(570)BG was significant (p < 0.05).
Remotesensing 11 00810 g002
Figure 3. The spectrum of intensity of the RL during the GYL pulse (a), and difference between the RL spectrum during the GYL pulse and this spectrum before the pulse (b) in pea (n = 6). The spectrum was measured before illumination by the AL (maximum intensity at 630 nm, 1599 μmol m−2 s−1) (“without AL”), after 20 s of illumination by the AL (“20 s”), and after 5 min of illumination by the AL (“5 min”). The upper panels show the spectrum from 500–610 nm, the medium panels show part of the spectrum from 530–532 nm, and the lower panels show part of spectrum from 569–571 nm. The maximum absolute intensity of RL at 550 nm was assumed to be 100%.
Remotesensing 11 00810 g003
Figure 4. Dependences of the energy-dependent component of the nonphotochemical quenching of fluorescence (NPQF), the absolute value of the PRI and its change (ΔPRI) on intensity of the AL (630 nm, AL) in pea (a), wheat (b), and pumpkin (c) (n = 6). Duration of illumination of each AL intensity was 5 min; the dark relaxation after that was 2 min. NPQF was calculated as F m F m 0 F m F m S , where Fm0 and FmS were Fm′ (the current maximum yield of fluorescence) before termination of the AL illumination and for 2 min after that, respectively. PRI was calculated as R 531 R 570 R 531 + R 570 . R531(570) was calculated as R531(570)AveragedR531(570)BG. R531(570)BG is the absolute intensity of the reflected light at 531 (570) nm before the GYL pulse, R531(570)Averaged is the averaging of the absolute intensities of the reflected light at 531 (570) nm during the GYL pulse. ΔPRI was calculated as difference between PRI after 5 min of illumination by AL and initial PRI (without AL).
Remotesensing 11 00810 g004
Figure 5. Magnitudes of AL-induced changes in the photochemical reflectance index (ΔPRI), which were measured at different intensities of GYL pulse in pea, wheat, and pumpkin (n = 6). ΔPRI was calculated as the difference between the PRI after 5 min of illumination by the AL (maximum intensity at 630 nm, 1599 μmol m−2 s−1) and initial PRI (without the AL). PRI was calculated as R 531 R 570 R 531 + R 570 . R531(570) was calculated as R531(570)AveragedR531(570)BG. R531(570)BG is the absolute intensity of the reflected light at 531 (570) nm before the GYL pulse and R531(570)Averaged is the averaging of the absolute intensities of the reflected light at 531 (570) nm during the GYL pulse.
Remotesensing 11 00810 g005
Figure 6. Dependences of the change in PRI (ΔPRI), which were calculated on the basis of non-averaged intensity of thereflected light, on the intensity of AL in pea (a), wheat (b), and pumpkin (c) (n = 6). ΔPRI was calculated as the difference between the PRI after 5 min of illumination by AL (wavelength 630 nm) and initial PRI (without the AL). PRI was calculated as R 531 R 570 R 531 + R 570 . R531(570) was calculated as R531(570)FirstR531(570)BG. R531(570)BG is the absolute intensity of the reflected light at 531 (570) nm before the GYL pulse and R531(570)First is the first value of the absolute intensity of the reflected light at 531 (570) nm during the GYL pulse.
Remotesensing 11 00810 g006
Figure 7. Dependences of the absolute value of the PRI and ΔPRI on the energy-dependent component of NPQF in pea (n = 30) (a), wheat (n = 30) (b), pumpkin (n = 30) (c), as well as in all plants of investigated species (d) (n = 90). The duration of illumination for each intensity of AL (wavelength 630 nm) was 5 min, and the subsequent dark relaxation was 2 min. NPQF was calculated as F m F m 0 F m F m S , where Fm0 and FmS are Fm′ (the current maximum yield of fluorescence) before the termination of AL illumination and for 2 min after that, respectively. PRI was calculated as R 531 R 570 R 531 + R 570 . R531(570) was calculated as R531(570)AveragedR531(570)BG. R531(570)BG is the absolute intensity of the reflected light at 531 (570) nm before the GYL pulse and R531(570)Averaged is the averaging of the absolute intensities of the reflected light at 531 (570) nm during the GYL pulse. ΔPRI was calculated as the difference between PRI after 5 min of illumination by AL and the initial PRI (without AL). Experimental plots include values, which were measured at different light intensities and under dark conditions. R2 and R are the determination and correlation coefficients, respectively.
Remotesensing 11 00810 g007
Figure 8. A hypothetical schema of the estimation of the photosynthetic stress in plants on the basis of repetitive GYL pulses and illumination by AL. R531(570)GYL and R531(570)BG are reflected light at 531 (570) nm during the GYL pulse and before this pulse. PRIAL and PRIdark are the PRI measured during the AL illumination and before the illumination. PRI is calculated as R 531 R 570 R 531 + R 570 .
Remotesensing 11 00810 g008