Abstract
Imaging spectroscopy is a promising tool for airborne tree species recognition in hyper-diverse tropical canopies. However, its widespread application is limited by the signal sensitivity to acquisition parameters, which may require new training data in every new area of application. This study explores how various pre-processing steps may improve species discrimination and species recognition under different operational settings. In the first experiment, a classifier was trained and applied on imaging spectroscopy data acquired on a single date, while in a second experiment, the classifier was trained on data from one date and applied to species identification on data from a different date. A radiative transfer model based on atmospheric compensation was applied with special focus on the automatic retrieval of aerosol amounts. The impact of spatial or spectral filtering and normalisation was explored as an alternative to atmospheric correction. A pixel-wise classification was performed with a linear discriminant analysis trained on individual tree crowns identified at the species level. Tree species were then identified at the crown scale based on a majority vote rule. Atmospheric corrections did not outperform simple statistical processing (i.e., filtering and normalisation) when training and testing sets were taken from the same flight date. However, atmospheric corrections became necessary for reliable species recognition when different dates were considered. Shadow masking improved species classification results in all cases. Single date classification rate was 83.9% for 1297 crowns of 20 tropical species. The loss of mean accuracy observed when using training data from one date to identify species at another date in the same area was limited to 10% when atmospheric correction was applied.
1. Introduction
The Amazon forest, the largest tropical forest basin on earth, covers an area of 5.5 million km2 and harbours an estimated 16,000 tree species []. It plays a major role in global climate regulation, particularly through the cycling and storage of carbon [] and it constitutes an extraordinary terrestrial reservoir of biodiversity []. However, the Amazon faces degradation threats [] from unsustainable logging [], climate change [], land use change [], agricultural [] and other human activities []. While the threats are increasing, our knowledge about tropical forest composition and its ecological functioning progresses at a slow pace. The total above ground carbon in the Amazon may still be poorly estimated []. Similarly, the mere number of tree species in the Amazon is a matter of debate [].
Large-scale tree species inventory capability would be instrumental in advancing fundamental knowledge on this complex and threatened biome and in helping with its sustainable management. Mapping species distribution at large scale in relation to environmental constraints is likely to provide novel insights to the long-standing question of why tropical forests are so species rich. From a management point of view, high-throughput airborne species mapping would help rationalizing logging. In particular, being able to map targeted commercial species could foster environmentally benign forestry practices. It would help prioritize areas that are rich in economically valuable species, while avoiding opening logging tracks in areas with low resources. It also has potential for monitoring invasive species [].
Imaging spectroscopy holds great promise to map canopy species by air, as has already been proven by a series of seminal studies [,,,]. However, to date only few case studies have been published, and to our knowledge there is no clear evidence that airborne imaging spectroscopy is sufficiently reliable and transferable to achieve operational tree species mapping in the absence of a large ground sampling effort to build a training data set for every new site to be mapped. Practical solutions for enhanced reliability and operationality of airborne tree species mapping include the collection of spectral libraries focusing on hyperspectral signatures from different tree species, which could be stored and organized in shared spectral databases like the Specchio database [,]. A prerequisite would then be to capture the representative spectral features independently of the particular acquisition settings (i.e., time and date, atmospheric composition, solar irradiance angles, topographic conditions, observation angle, and sensor characteristics).
A large number of pre-processing options have been identified through state-of-the-art techniques, aiming at improving the capabilities of hyperspectral data for tree species identification. The main goal is to reduce possible sourcesof signal variation that are extrinsic to vegetation, including sensor noise, illumination conditions and atmospheric composition. The first pre-processing step commonly used in order to reduce the noise is spatial filtering [,]. It consists in an homogenization of spectral information of each pixel based on the averaging of its reflectance and its neighbor’s reflectance. The second pre-processing step deals with the illumination variation. Clarck and Roberts [] suggested that illumination variation is not a relevant factor for species discrimination. They showed that excluding shadowed pixels leads to improved classification accuracy. The masking of shadowed pixel [,] or their correction by different methods [] should be considered, especially at very high spatial resolution []. Finally, atmospheric composition affects scattering and absorption of sunlight and thereby affects the reflected signal recorded by the sensor. Atmospheric correction then appears as an important step towards standardisation of spectral signature and applicability of classifiers from one image to another acquired at a different time. This atmospheric correction aims at converting at-sensor radiance into surface reflectance. The high spectral resolution offered by imaging spectroscopy is a particular advantage for achieving physically-based fine atmospheric corrections as the signal measured at particular wavelengths or combination of wavelengths may inform about atmospheric characteristics [,].
In this study, we evaluate the impact of various levels of image pre-processing steps on the classification accuracy of 20 tree species of tropical forest using Linear Discriminant analysis (LDA). We evaluate two different settings: the first setting focuses on single date imagery while the second setting uses training data from one date and testing data from a second flight date to appraise transferability of the classifier across dates.
2. Materials and Methods
2.1. Study Site
The study was conducted at Paracou (51°8′N, 52°53′W), an experimental site in the North of French Guiana set-up by CIRAD (Centre de coopération Internationale en Recherche Agronomique pour le Développement) in 1982. The local topography is gently rolling. The site is covered with lowland terra firme rain forests. Mean annual rainfall was 2875 ± 510 mm over the 1986–2005 period with a 3-month dry season from mid-August to mid-November []. All stems above 10 cm diameter at breast height have been censured every 1–2 years for more than 35 years. Nine of the plots were selectively logged in 1986. More than 750 tree species have been inventoried on the site, dominated by Leguminosae-Caesalpinioidae, Lecythidaceae, Chrysobalanaceae, and Sapotaceae. A detailed description of the site and experimental design can be found in [].
For the purpose of this study, a field survey was conducted to build a large ground truth dataset. Easily discernible crowns were first delineated manually on the Canopy Height Model derived from LiDAR (Light Detection And Ranging) data with the help of a high resolution (10 cm) RGB (Red, Green, Blue) mosaic. The correct delineation of these Individual Tree Crowns (ITC) was then validated in the field and the corresponding species ascertained. The 20 most represented species i.e., those with at least 24 individuals tagged, were selected for the purpose of the present study, totalling 1297 trees (Table 1, Figure 1). On the first flight date, all crowns were imaged twice (once each of two neighbouring flight lines) and the cumulated crown area considered for the single date analysis was 112,313 m2. On the second flight date, only a subset of the crowns was imaged (Table 1).

Table 1.
List of species used and their associated crown and pixel numbers. The entire site was covered on date 1 and a subset was imaged again on date 2.
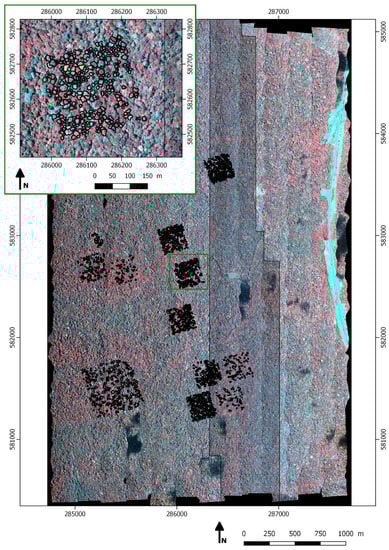
Figure 1.
Hyperspectral image (false colour, R: 775 nm, G: 637 nm, B: 426 nm) at sensor radiance, captured on 19 September. Black segments feature the tree crowns used in this study. The grid pattern in black represents the area imaged on 20 September. In the zoomed map (green box), crown segments are delineated in black too. Projection used is WGS 84 UTM 22N (EPSG: 32622).
2.2. Hyperspectral Data
Imaging spectroscopy was acquired with a Hyspex VNIR-1600 (Hyspex NEO, Skedsmokorset, Norway) sensor mounted alongside a Riegl LMSQ780 laser scanner (See Appendix D). The 160 spectral bands cover the range from 414 nm to 994 nm (i.e., visible to near infrared) with a spectral sampling distance of 3.64 nm. The entire spectral range was used in this study (no spectral masking). The King Air B200 airplane flew at an average altitude of 920 m. The two flights took place on cloudless days on the 19th (from 15:00 to 17:00, solar time) and the 20th (from 16:00 to 17:00, solar time) September 2016. The second flight covered approximately one third of the area imaged on the first date. Images were orthorectified and georeferenced (level L1b see below) at 1 m spatial resolution with the PARGE software [] using the canopy DSM (Digital Surface Model) produced from the LiDAR point cloud. The DSM was created from the point cloud by selecting point of maximum height on a 1-m resolution grid.
2.3. Statistically Based Spectral Data Pre-Processing
In this section, we present the various statistical data pre-processing steps that were tested as part of the different processing pathways evaluated (Figure 2, Table 2).
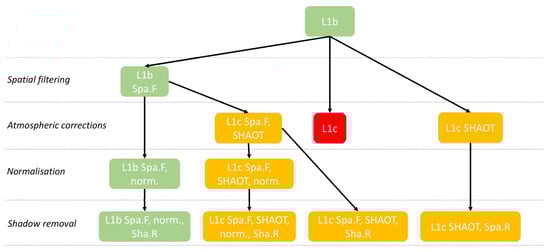
Figure 2.
Pathways of the processing workflows presented in this paper. Green, red and orange correspond to georeferenced (at sensor radiance), basic atmospheric correction and enhanced atmospheric correction using SHAOT data, respectively.
Table 2.
Nomenclatures for each processing.
Python programming language was used to compute mean filtering and spectrum normalisation using “Numpy” package.
2.3.1. Mean Filtering
In addition to atmosphere composition and illumination conditions, hyperspectral images may be affected by instrumental noise. Spatial filtering decreases the local noise on each pixel and may improve the separability of objects in hyperspectral data []. In several of the workflows explored in this study, a spatial filter (mean of a 3 × 3 moving window) was applied (Figure 2).
2.3.2. Spectrum Normalisation
A radiance/reflectance spectrum normalization was applied aside from atmospheric corrections. It was previously noted [] that a simple normalization could significantly improve segmentation from imaging spectroscopy, even more so than complex atmospheric corrections. The normalization consisted in dividing the spectrum of a pixel by its mean (Figure 2).
stands for the spectral signal value (radiance or reflectance) at wavelength . n = 160, is the number of spectral bands.
2.4. Physically Based Spectral Data Pre-Processing
In this section, we present the physically based pre-processing steps which were combined to statistical pre-processing into different pathways (Figure 2).
2.4.1. Atmospheric Corrections
Flight lines were clipped to 1 km long strips. For each strip, the mean sensor altitude was retrieved (ranging between approximatively 840 m and 940 m). Clouds contribution was negligible over the area of interest (Figure 1) and no cloud shadow correction or cloud masking nor haze removal were applied.
Contribution of oxygen and nitrogen, the major contributors to molecular scattering, to atmospheric optical thickness were inferred from atmospheric pressure. Water vapour was retrieved using the APDA (Atmospheric Precorrected Differential Absorption) algorithm implemented in ATCOR-4 []. The APDA algorithm is based on the depth of the absorption features derived from three specific spectral bands: one spectral band is centred at 820 nm and the other reference spectral bands correspond to neighboring spectral bands (just before and just after 820 nm), which are less affected by water vapour. The depth of the absorption feature at 820 nm is then directly related to the water vapour column under consideration of the aerosol path scattering effect. The AOT (Aerosol Optical Thickness) was either considered constant or allowed to vary spatially. AOT represents the amount of aerosols in the entire column of the atmosphere. We used the shadow-based AOT retrieval method (SHAOT) proposed in [] to map the spatial variability of this parameter. This method builds on an idea proposed in [] to use shadows in urban areas. It was optimized for all kinds of shadows and refined for hyperspectral images with a spatial resolution less than or equal to 5 m [,]. The method for detecting the effects of aerosol scattering relies on the comparison between well illuminated vegetation and shaded vegetation based on the identification of the shadows. The method is based on two main hypotheses: (i) diffuse irradiance, as the main contributor to the illumination of shaded areas, depends on aerosol distribution and multiple scattering effects, and (ii) the average adjacent shaded and directly illuminated pixels have the same reflectance level. First, only the four spectral bands (450, 530, 670, and 780 nm) not impacted by water vapour absorption are used to compute shadows maps. The aerosol amount is tuned using an iterative procedure to adjust the diffuse irradiance onto the cast shadow areas until the areas have reached the same reflectance characteristics as the well-illuminated area (0.05% difference in average reflectance). A moving window smoothing is applied to derive the AOT distribution. Then, in the process of atmospheric correction, the atmospheric compensation model uses AOT value for each pixel. This approach produces a map of AOT distribution.
2.4.2. Shadow Removal
Shadow-induced illumination variations among tree crowns affect spectral information. Several studies reported improved tree classification accuracy when selecting sunlit pixels only [,,]. Consequently, before training the classifier, the dark pixels were removed to evaluate the ensuing gain in classification accuracy. For this step, we used the shadow detection method described in [] to compute the illumination ratio and the pixels with a scaled shadow fraction value lower than 0.6 were removed. The number of pixels used in the classification was reduced by 20% after this step.
2.4.3. Bidirectional Reflectance Distribution Function
Bidirectional Reflectance Distribution Function (BRDF) correction can be applied to reduce spectrum variation caused by acquisition conditions. The moderate change in sun-sensor angles (variation in scan angle ±6.5 deg.; variation in sun zenith angles: 6.5–10.0 deg.; variation in sun azimuth angle 285.9–267.7 deg.) in the present settings suggested that BRDF effects were of moderate intensity. Therefore, no BRDF correction was applied. First order BRDF effects were considered to stem from tree-tree shadowing. Little or no projected shadows are visible when sun and view directions are aligned and maximum shadows are apparent when sun and view directions are opposite. Such BRDF effects were minimized by shadow masking.
2.4.4. Impact of Flight Line Overlap
Individual flight lines were not mosaicked prior to crown extraction. In this way the full spectral variability of the crowns species in the images was preserved (and notably variability among flight lines induced by changes in the atmospheric properties and solar angle). Hence, due to a 50% overlap between flight lines on date 1, most of the crowns were extracted from two neighbouring flight lines. On date 2, only about 40% of the crowns were imaged twice. The effect of this lower redundancy on date 2 imagery is later considered.
We specifically evaluated the effect of prior mosaicking for an arbitrarily selected processing pathway (L1c Spa.F, SHAOT). To this end, we mosaicked the strips using center cropped method in the PARGE software. Hence, mosaicking was done by selecting the most central pixel of any two overlapping flight lines and not by averaging reflectance values of co-occuring pixels.
2.5. Data Analysis
2.5.1. Variance Analysis
For each wavelength, one-way analyse of variance (ANOVA) with species identity as the unique factor was run to assess how much variance in the reflectance at a particular wavelength could be ascribed to species. We compared effectiveness of various pre-processing steps by analyzing the R2 averaged across the spectral domain. We interpret an increase in R2 as an enhancement of species-specific spectral discrimination [].
2.5.2. Classification
We used a LDA classification algorithm that is well adapted to classification problems in high dimension feature spaces provided that the number of observation is larger than the number of feature in the least abundant class []. LDA also has the advantage of not being affected by the possible inconsistent relative abundance of classes in training set and test set, provided prior probabilities of class membership are set to 1 for all classes as done in the present case. This method maximizes the ratio of between-class variance to the within-class variance. The “Mass” package version 7.3-50 [] of R language [] was used to compute LDA method. Good performance of LDA has been reported for tropical tree species classification from hyperspectral data in various studies [,,]. In the first approach, the LDA classifier was trained using a random selection of 70% of the tree crowns (Table 1) using hyperspectral data from the 19 September for all processing levels. For every tree included in the training set both image segments (from neighbouring flight lines) were selected if available. The remaining 30% of crown segments were used to evaluate the performance of the classifier. This procedure was repeated 20 times to limit the impact of the random draw of the crowns used in training and testing sets. Classification accuracy was evaluated for all image-processing pathways using the same random sampling. The choice of using LDA can be questioned, as many alternative machine learning algorithms can be used as well. These state of the art classification algorithms include Random Forest (RF) [], Support Vector Machine (SVM) [] or neural network. The goal of our study was not to compare of the performances of the different algorithms available for tree species discrimination, or to identify the most suitable as proposed by [,,]. We compared the performances of LDA with a “state of the art” machine learning algorithm, RF. The RF classification algorithm was applied, following the exact same training and validation scheme as defined for LDA. The RandomForest R package [] was used for this task, and 1000 trees were defined in the forest during the training stage. The results obtained with the RF algorithm are described in Appendix C Table A2.
In a second approach (cross date validation), the classifier was trained using hyperspectral data from 19 September, excluding any crown imaged on 20 September and the prediction was applied to crowns imaged on 19 September (single date case) and on 20 September (multidate case).
2.5.3. Classification Strategy
Numerous studies concluded on the gain in performances obtained when using object oriented approaches based on ITCs, combining pixel-wise classification with a majority vote rule to decide on the species to be assigned to individual tree crowns [,,]. For each processing level, we compared classification accuracy at pixel level and crown level. Table 1 summarizes the crowns and pixels available for classification. The column named “proportion of area covered on date 2” corresponds to proportion of crown area viewed on date 2 which was viewed on date 1 (double counting any pixel viewed twice on a given date).
2.5.4. Spectral Stability Analysis
We computed various measures of spectral stability based on spectral correlation matrices in order to explore the sensitivity of the various processing pathways to changes in acquisition parameters induced by the multi date classification scenario.
For every species, we computed indices of species spectral signature stability over time, based on crowns viewed on both dates. Firstly, we computed the Pearson correlation between spectral correlation matrices at different dates. Secondly, we computed species specific F-measures for single date and multiple date cases.
Thirdly, we computed a “between dates spectrum distortion rate” by taking for each spectral band the difference between date 1 and date 2 of normalized values of signal divided by values at date 1. Then, the average (over all spectral bands) of the absolute value of that difference was computed per species. Both indices were computed for radiance spectrum (i.e., prior to atmospheric correction) and reflectance spectrum (post atmospheric correction).
and represent the first and the second date respectively.
The contribution of each wavelength to the LDA was evaluated by summing absolute scaling values (coefficient of each wavelength to each linear discriminant function) after centring and reducing the data.
3. Results
3.1. Variance Analysis
We report the effect of various pre-processing steps on species specific signal noise ratio (SNR) as captured by the R2 of the ANOVA of the different wavelengths.
Spatial filtering significantly increased the spectral variance part explained by species for radiance and reflectance values (from 12.1% to 14.2% for L1b and 12.3% to 16.1% for L1c, see Table 3). An even more significant surge in R2 followed from normalisation of spectra (14.2% to 32.3% for L1b and 16.1 to 29% for L1c, see Table 3). This was not expected to be the case for L1c reflectance data, since it was implemented primarily to correct illumination variation affecting the whole spectrum.
Table 3.
Mean proportion of variance explained by the tree species identity (mean R2 over the entire spectrum) for each processing level (data acquired on the 19 September). The treatments are listed in order of application.
Overall, ANOVA following spectral normalization of spatially filtered radiance data achieved the highest R2 (32.3%). ANOVA following atmospheric correction, spatial filtering, SHAOT and shadow exclusion also had a high R2 (29.5%). Removal of shadowed pixels (“Sha.R”) had a slightly positive impact on L1c data only.
The atmospheric correction taking into account the spatial variation of AOT led to a reduction of R2 in the spectral domain from 400 nm to 550 nm when compared to the standard correction (Figure 3), resulting in a slight overall decrease in R2 (Table 3). Shadow removal mostly increased R2 between 500 nm and 1000 nm. Spectral normalisation decreased R2 both for L1b and L1c spectral data in the region from 902 nm to 956 nm due to very low signal and low SNR in the raw data. Not surprisingly, R2 increase was found to have some similarities with the SNR evolution along the spectral variation following the different processing pathways (see Appendix B, Figure A1). Atmospheric correction alone (L1c with SHAOT or L1c without SHAOT) barely increased R2 compared to radiance (L1b) values (Table 3).
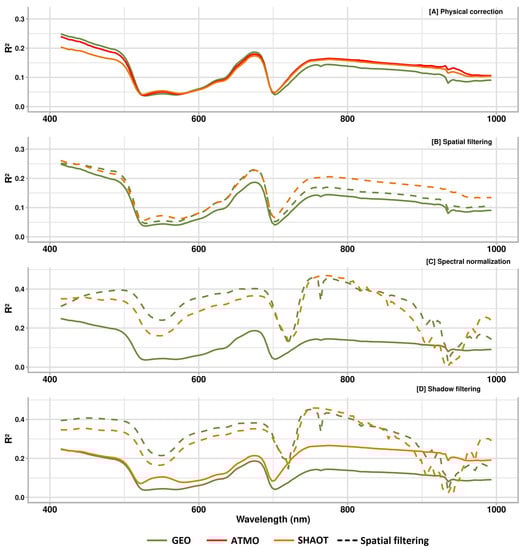
Figure 3.
Proportion of variance explained by tree species identity (20 species) for each wavelength (data acquired on 19 September). L1b (GEO in green solid line) is plotted on each graphic as a reference. (A) After atmospheric corrections only. (B) After spatial filtering (either alone or in addition to atmospheric corrections). (C) After normalisation applied to spatially filtered data. (D) After additional shadow removal.
3.2. Discriminant Analysis
Results are given for a subset of pre-processing pathways at pixel and crown level.
3.2.1. First Setting (Single Date)
Analysis of the impact of atmospheric correction was evaluated on all processing levels for a single data set to check the consistency of the methods. Standard deviation of accuracy at pixel level computed for the 20 runs was typically around 1–1.5% giving a standard deviation of the reported mean accuracy of 0.2–0.3%.
The pre-processing pathways that yielded the most accurate classifications (both at pixel and pixel-majority level) were L1b Spa.F, norm., Sha.R followed by L1c Spa.F, SHAOT, norm.,Sha.R (Table 4). Figure 4 shows a scatter plot of R2 from the analysis of variance against the LDA accuracy. A slight positive correlation can be observed.
Table 4.
Summary of mean accuracies and kappa results from data acquired on 19 September using the 20 most abundant species. The highest scores are highlighted in bold.
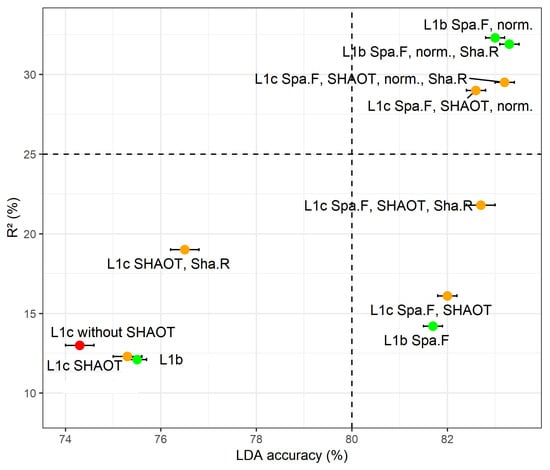
Figure 4.
Treatments performance ranking by the mean R2 (%) from the analysis of variance and LDA (%) accuracy of the object based on spectrum. Error bars represent ± standard error of the mean of 20 replicate runs. The legends and the colors refer to Figure 2.
The majority vote approach systematically outperformed the pixel classification. The majority vote was more efficient to retrieve species identity than a classifier based on a mean crown spectrum (see Appendix A, Table A1). Moreover, the standard deviation of accuracy using the mean crown spectrum computed for the 20 runs was around 4% which is higher than through majority vote procedure. The spatial filtering improved classification, especially at pixel level (from 64.2% to 73.8% for L1b and from 63.6% to 73.4% for L1c).
The confusion matrix (Table 5) indicated that not all species were recognized with equal accuracy. Qualea rosea was the best-identified species followed by Tachigali melinonii. While some species were poorly represented like Tapura capitulifera, their F-measure was still higher than 80.0%. By contrast, Licania heteromorpha was poorly identified and was mixed with an extremely abundant species Eschweilera sagotiana.
Table 5.
Confusion matrix from L1b Spa.F, norm. at the crowns scale for the twenty most abundant species.
Additionally, an extra set of processing options not detailed here was tested. Spectrum derivation following spectral smoothing were applied and spectrum derivative used instead of raw spectrum. Excluding the noisy region between 900 and 950 nm prior to applying the LDA was also tested. Finally, we tested whether including the pixel spectral mean as an additional feature to the standardized spectrum would make a significant difference. None of those variants yielded a significant improvement of the best classification results (improvement <1%).
3.2.2. Second Setting (Cross Date Training and Validation)
In this operational situation training is done on a well-known scene at first and the training results are transferred to the second date of data acquisition.
One species was absent from the area covered on the second date. The 19 species left were trained on date 1 imagery and predicted on date 2 imagery (multidate case). For comparison purposes, we report the performance of the LDA classifier trained and predicted on date 1 (single date case) using the same subset of crowns in both training and testing sets as used in cross date validation. The same combination of processing steps was considered in this setting and their effectiveness is compared in Table 6.
Table 6.
Summary of the results from the comparison between two dates using 19 species with respect of each treatment.
Regardless of the processing pathway considered, the transition from a single date to a multiple date case induced a marked decrease in the accuracy of the classification especially at object level. Nonetheless, the pathway including atmospheric correction (L1c, Spa.F, SHAOT, norm.) clearly outperformed (by more than 8 percentage points at object level) any filtering/normalizing strategy when training and testing data came from different dates. The best pathway is the L1c, Spa.F, SHAOT, norm., Sha.R (pixel illumination was considered) which uses 20% less data.
Remarkably the gain in accuracy at crown level (as compared to pixel level) was not significant in the multidate scenario for most processing pathways whereas it typically improved accuracy by c. 10% in the single date scenario.
Table 7 presents classification accuracy (at pixel and crown level) for one particular processing pathway L1c, Spa.F, SHAOT when either training or prediction applies to mosaicked data or raw flight lines.
Table 7.
Summary of the results comparing learning and prediction when multi-flight lines or mosaicked data were applied in the classification process. Standard error of the mean (SEM) is given at pixel and object level. Pixel and object express the accuracy rate. * 60% of the data is not viewed twice.
Pixel accuracy was higher when training and prediction sets used multiple flight lines. The gain in accuracy ensuing a majority vote (i.e., going from pixel to pixel-majority level accuracy) is larger in the single date settings and also larger when multiple flight lines are used (both for training and testing) instead of mosaic. Mosaicked imagery is not only on average slightly less effective but it is also more variable at crown level.
3.3. Comparing ANOVA and LDA Results
Figure 3 indicates that while normalization improved ANOVA R2 very significantly (10–18 percentage points) it had only a modest effect on LDA pixel classification accuracy (1–2 percentage points). Conversely, spatial filtering brought significant improvement to LDA accuracy (6–10 percentage points) irrespective of the processing level considered and also improved R2 albeit less significantly (2–3 percentage points). Spatial filtering reduced noise and increased both separability and signal to noise ratio in each band as expected []. Normalisation mostly affected ANOVA results by smoothing out effects of variable illumination between pixels, which was confirmed by a slight increase using L1c Spa.F, SHAOT and norm., Sha.R data. LDA benefitted less from normalisation probably because it is sensitive to covariation between wavelengths, which may not be as sensitive to illumination level.
Although we focused on mean R2 in ANOVA analysis, the improvement was not homogeneous across wavelengths. In some extreme cases processing increased R2 overall while decreasing it in some particular spectral window (e.g., Figure 3, normalisation method from 900 nm to 950 nm). This may further blur the relationship between mean R2 from single band ANOVA analysis and LDA since the net effect of a global increase in R2 associated with a decrease in a particular spectral window may affect LDA classification accuracy either way.
3.4. Spectral Stability Analysis
Species were differently affected by the date transfer. The most impacted species were Qualea Rosea, Licania heteromorpha, Vouacapoua americana and Eperua grandiflora, with a loss in F-measure of 41%, 31%, 27% and 20% respectively (Table 8). Removal of shadow pixels increased classification accuracy at pixel level more than at crown level.
Table 8.
Person’s correlation between spectral correlation matrices at each date for two processing pathways, corresponding classification F-measure * and spectrum distortion rates (multiple date scenario, see text). L1b and L1c refer to L1b Spa.F, norm., Sha.R and to L1c Spa.F, norm., Sha.R data respectively.
LDA scaling values (applied to reduced and centered data from date 1) are plotted in Figure 5.
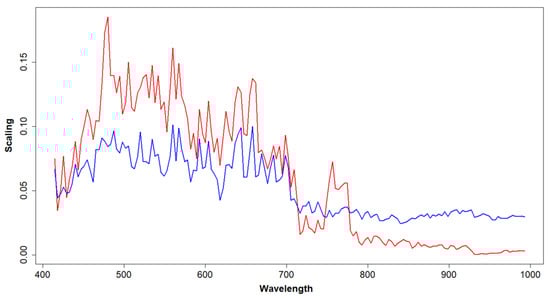
Figure 5.
Sum of absolute scaling values over the spectrum from linear combinations. Blue and red lines represent L1b Spa.F, norm., Sha.R and L1c Spa.F, norm., Sha.R data respectively.
Figure 5 reveals a close correlation between scaling values with and without atmospheric correction. However, the contribution of the 800–1000-nm region is much lower in atmospherically corrected (L1c Spa.F, norm., Sha.R) data, especially relative to the visible range.
Species-specific distortion rates between dates are reported in Table 8. Those rates were higher for normalized radiance values than for normalized reflectance (i.e., corrected for atmospheric effects) in 17 out of 19 species. Remarkably, the distortion rate was contrasted across species (ranging from 1% to 9.3%). There was a systematic and almost complete reduction of distortion in the 700–900 nm region following atmospheric correction, as illustrated for three arbitrarily chosen species in Figure 6.
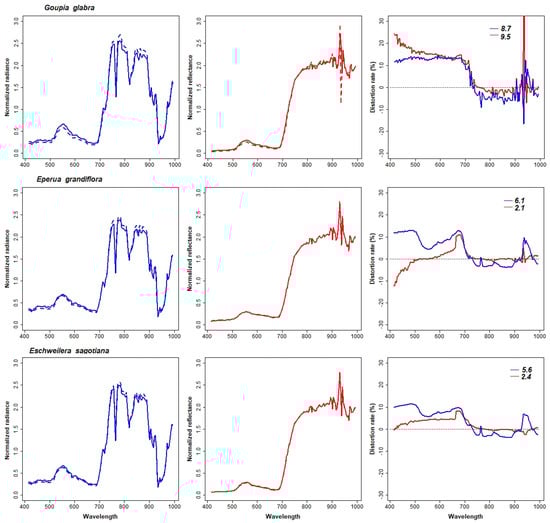
Figure 6.
Mean normalized radiance (first column) and mean normalized reflectance (second column) for 3 arbitrarily selected species. Solid line stands for date 1, dotted line for date 2. Third column represents normalized difference of average spectrum using the two acquisition dates. Blue line is for L1b filtered and normalized spectrum and red line for L1c SHAOT, filtered and normalized spectrum. The mean distortion rate (over all wavelengths) is given in the upper right corner for each curve.
Table 8 shows how species signature and discrimination rate (F-measure) were affected by change in dates between training and testing data sets for the two best pre-processing pathways. The correlation between spectral correlation matrices of date 1 and date 2 are also reported.
The global correlation between spectral correlation matrices at date 1 and date 2 is lower for L1b Spa.F, norm., Sha.R data than to L1c Spa.F, norm., Sha.R. For a majority of species, the correlation between dates is similar in both processing pathways. For four species this correlation is more than 10 percentage points lower (marked with an asterisk in Table 8). Species classification F-measure are globally more affected using L1b Spa.F, norm., Sha.R data than to L1c Spa.F, norm., Sha.R, and spectrum distortion rates are larger. Large differences across species in distortion rates and change in distortion rates from L1b to L1c are striking.
Correlation coefficients, distortion rates and change in F-measure are not strongly related. However, in some extreme cases the indicators do appear to vary consistently. For instance Bocoa prouacensis, has a much lower correlation coefficient across dates for L1b data than L1c data, it also suffers from a stronger reduction in F-measure and a higher distortion rate.
4. Discussion
4.1. LDA Classification Accuracy
The impact of different preprocessing pathways on species separability was evaluated both at pixel and crown scale. Classification accuracies tend to decrease with the number of classes []. The classification of 20 tree species is a task of slightly higher complexity than what had been previously attempted in studies concerning tree species classification in tropical forests. References [,] classified seven species and achieved an accuracy of 86% and 87.4% respectively with a lower spatial resolution (1.6 m) using HYDICE (HYperspectral Digital Imagery Collection Experiment) airborne sensor, which measures radiance between 400 nm and 2500 nm in 210 discrete bands. Ferreira et al. [] classified eight tropical tree species using the full spectrum (400–2400 nm) using airborne AisaEAGLE and AisaHAWK instruments, achieving 84.9% overall accuracy of crowns. Feret et al. [] classified 17 pure species with SVM (Support Vector Machine) algorithm using RBF (Radial Basic function) kernel reaching an overall accuracy around 72%. A pure species was determined by similarity measure based on the difference in amplitude and spectral angle, which is a specific approach taking into account seasonal and environmental factors. In the above-mentioned studies, there are no species in common with those studied here. In our case (Table 4), the accuracy of crown scale classification was 83.3% via L1b Spa.F, norm., Sha.R data, and 83.2% for L1c Spa.F, SHAOT, norm., Sha.R, comparable to the results of the above-mentioned studies.
On date 1 crowns were imaged twice and all views were used in the classification thereby preserving a greater variability. This proved beneficial for the identification of trees at the crown scale compared to the use of a mosaic image (77.8% vs. 82.0%, tested on L1c Spa.F, SHAOT at crown level cf Table 7). Moreover, once the classifier is trained on a low variability (mosaicked data) and used for prediction on multi flight lines data, the results are similar (77.8% and 78.1% on the object scale). Increasing the variability in the learning step improved the performance of the classifier. The gain was mostly achieved at crown level after application of the majority filter. Therefore, we found that increasing the size of the training set increases the classifier’s performance even if the variability in the validation data set increases in parallel. Increasing the size (and variability) of the training set data more than compensated for the correlative increase in the size of the data set to be classified.
Despite the admittedly small sample of species examined, it is worth noting that confusion between phylogenetically close species was not systematically higher than between more distant species. In particular, species from the same genus (L. heteromorpha and L. alba on one side and E. grandiflora and E. falcata on the other) were well separated.
Regarding the wavelength contributing most to the LDA (Figure 5), we found similarities with the results of [] who used a partial least squares discriminant analysis (PLS-DA) for the identification of tree species on a site in South Africa (KwaZulu-Natal). Große-Stoltenberg et al. [] also report a major contribution of the visible range (400–700 nm) to the discrimination of vegetation sampled with hand held spectrometer within a Mediterranean dune ecosystem. They also found a large contribution of SWIR range (not included in this study).
4.2. Simple Methods
Although physical approaches have a role to play in identifying trees in the canopy through atmospheric corrections, other methods that are easier to implement have previously been shown to perform well. Shahriari et al. [] explored Gaussian filtering applied to raw spectrum prior to atmospheric correction. Classification accuracy was not systematically improved by filtering. Results depended on the smoothing window size and the atmospheric corrections made (either using FLAASH or ATCOR). Nevalainen et al. [] tested normalization (division by the sum of all bands) which improved slightly the classification accuracy. In the present study, a spatial filter improved the classification in all cases (single date and multi date) as opposed to atmospheric correction alone. The average filtering reduced the spatial noise and homogenized the spectral signature of trees. The results suggest that noise in the signal remained after atmospheric correction which was later reduced using a simple spatial filtering.
Another part of our study focused on the improvement brought by the removal of shadow (low illumination pixels). Lopatin et al. and De Sa et al. [,] used an UAV (unmanned aerial vehicles) for the classification of invasive species, and reported that shadows have a high negative effect on classification. Lopatin et al. [] identify shadows by histogram thresholding, as also proposed by [,] at a higher spatial resolution. In the present study, removal of shadowed pixels increased the separability both at the pixel and object-crown level. Crown level separability was less significantly improved than pixel level suggesting that majority filter contributed to sieve out many shadowed pixel in the first place. However, this filtering decreased the number of pixels by c. 20% in the present case. Nagendra, H. [] shows that a classification can be more efficient by smoothing shadowed and well illuminated pixels. This may partly explain the accuracy increase when the data is filtered by mean filtering, reducing intra-class variability. De-shadowing would allow preserving shadowed pixels but may be more difficult to achieve in a consistent way. As high radiometric sensitivity is required to analyse shaded pixels radiometrically, such approaches require careful further analysis.
4.3. Operational Setting
In an operational perspective, the comparison made between dates is more relevant to consider, as this setting is a standard use case. Selecting one part of the imaged area to predict the other (both at the same date) yielded a decrease in tree identification rate of about 5% compared to random selection of training and testing of individuals (compare Table 4 and Table 6). This was probably due to the unbalanced training versus testing set. The split between training and testing sets of the crowns was imposed by the actual spatial distribution of the species and resulted in a sub-optimal design (Table 1, last column).
Training on one date and predicting on another date (in a same area) yielded a further decrease in tree identification rate of c. 10% point (Table 6). The benefits of atmospheric correction data became obvious as full atmospheric correction outperformed simple statistical procedures by 8% (Table 6). Hence, despite very similar conditions (single site, same flight time, same cloudiness, and only 24 h delay between successive flights) neglecting atmospheric corrections degraded classification accuracy very significantly. In a multiple site context, simple standardization that does not consider atmospheric variations may not allow effective species identification using a classifier trained on a single site. Normalisation of hyperspectral signal through atmospheric correction seems to be required to effectively transfer a classifier from one site to another. It should be stressed that other parameters affect transferability and should be taken into account. These include phenological changes and notably seasonality (transferring from one date to another), degree of similarity of the species communities (transferring from one site to another), technical specifications of imager and acquisition parameters (all cases) [].
In addition, the use of multiple flight lines should be preferred over the use of a mosaic image, both for the learning and prediction steps (Table 7). The lower accuracy observed in date 2 prediction is partly due to the lower redundancy in training data with only 40% of the crowns being viewed twice.
Intriguingly, species were not equally affected by change in date, and their sensitivity depended both on the processing pathway considered and the wavelength considered (Figure 6).
In our case, the use of ATCOR-4 was primarily motivated by its ability to derive spatially explicit AOT estimates (SHAOT method). The SHAOT method for AOT recovery had not been previously tested for tree species classification purposes. SHAOT correction did not increase ANOVA R2 and notably reduced the variance explained by species identity in the 400–550 nm range (Figure 3, red and orange lines). However, the SHAOT method included in the atmospheric correction slightly improved tree species discrimination achieved by the LDA, at pixel (0.5%) and crown level (1.0%).
Overall, the results of this study are very encouraging as a number of improvements are foreseen for the near future. First, improved matching of tree crowns (mostly delineated on the LiDAR derived canopy height) and pixels may be achieved by better data co-alignment between lidar and spectral data as shown in []. Second, only VNIR data (400 nm to 1000 nm) were used. Ferreira et al. [] reported that the addition of SWIR (Short-Wave Infrared) data improved the identification of species of interest by 13% in their study. SWIR data was acquired simultaneously and will be used to enrich species spectral characterization. Third, LiDAR derived features such as tree height [], crown density and crown shape may constitute complementary features to include in the species classification []. Additional information related to pulse distribution or other features extracted from the lidar wave form have also proven to be useful []. Ultimately, more advanced classification methods such as SVM or Convolutional Neural Networks may provide some additional improvement in classification accuracy.
Discriminating trees species becomes more difficult as the number of species increases []. Detecting targeted species within a large set of species, many of which not being identified, is a slightly different problem from the one addressed in this study, in which a predetermined subset of species had to be sorted out. The former problem is particularly challenging in the case of hyperdiverse canopies []. Yet it is an unavoidable step to be taken before a reference hyperspectral database for the vast number of tropical species becomes available. The extreme species richness of tropical forests makes recognition of all species in the canopy a very challenging enterprise, even if those species constitute only a subset of the tree species diversity. Futher complication comes from the fact that species abundance is extremely variable and that some species are globally or locally rare []. However mapping diversity patterns does not necessarily rely on species identification. Spatial patterns of species diversity can correlate to patterns of spectral diversity [,].
The majority filter per crown used here requires a pre-segmentation of individual crowns. In the present case, crown segmentation was performed manually on high-resolution images and validated in the field. However, automatic segmentation of tree crowns from point clouds is becoming effective even in dense tropical forests [] and can be further refined using hyperspectral data []. Therefore high throughput mapping of selected species in complex tropical forest canopies seems to be a realistic goal for the near future. One limitation to automatic detection of targeted species may stem from locally abundant lianas and epiphytes, which can strongly affect or even mask out the tree’s specific spectral signature. Detection of lianas and characterization of their abundance at crown level seems to be tractable [] but deserves further study.
BRDF effects caused by anisotropic scattering property, related to view and illumination geometry during images acquisition [], may affect the mapping of tree species. Colgan et al. [] reported a slight improvement using SVM classification after applying a MODIS derived BRDF model to airborne hyperspectral data. The spectrum range most impacted by this effect seemed to be in the visible range. Correction of such bi-directional reflectance effects may also be required to fully standardize species spectral signature, in particular in cases of large variation in Viewing Zenith Angle (VZA).
5. Conclusions
This study confirms earlier ones showing that the discrimination and identification of tree species in a hyper-diverse canopy by means of imaging spectroscopy is possible with a high accuracy, even for as many as 20 species. A major contribution of our study was to clearly show that the best pre-processing pathway will likely depend on the particular settings of the study.
We found that atmospheric correction did not improve the classifier’s accuracy in a single date-single site setting (as compared to more readily applicable statistical procedures). However, when different dates were considered (the classifier trained on one date and tested on another date using different trees in training and testing sets) the atmospheric correction provided an obvious benefit, improving classification accuracy by 8% at crown level.
We, therefore, recommend to systematically conduct atmospheric compensation, in order to gradually build databases of standardized species spectral signatures. Such databases will be required to effectively move towards high throughput species mapping of tropical forest canopies, by allowing to circumvent or significantly alleviate the site specific calibration stage of the classifier. Finally, our results showed that the use of raw flight lines images improved both training and classifying over the use of a mosaic image. We recommend to systematically examine the benefit of using overlapping images for species recognition.
Author Contributions
G.V., J.-B.F., L.D. and A.L. designed the study, A.L. and G.V. conducted the analysis, D.S. provided expert advice on atmospheric correction methodology, A.L. and G.V. wrote the original draft, all authors contributed to final review and editing.
Funding
This research was funded by the French Ministry of Agriculture, grant number FSFB-2017. This study benefited from funding by the Centre National d’Etudes Spatiales (CNES Tosca Leaf EXPEVAL). This is a publication of Laboratoire d’Excellence CEBA (ANR-10-LABX-25).
Acknowledgments
Field support from Jean-Louis Smock (AMAP-IRD), Chantal Geniez (AMAP-IRD), Carla Baltzer (AMAP-IRD) and Raphaël Dutrieux (AMAP-IRD) is gratefully acknowledged.
Conflicts of Interest
The authors declare no conflict of interest. The funders had no role in the design of the study; in the collection, analyses, or interpretation of data; in the writing of the manuscript, or in the decision to publish the results.
Abbreviations
The following abbreviations are used in this manuscript:
| CIRAD | Centre de coopération internationale en recherche agronomique pour le développement |
| LiDAR | Light Detection And Ranging |
| RGB | Red, Green, Blue |
| ITC | individual tree crowns |
| DSM | Digital Surface Model |
| WGS | World Geodetic System |
| UTM | Universal Transverse Mercator |
| EPSG | European Petroleum Survey Group |
| APDA | Atmospheric Precorrected Differential Absorption |
| AOT | Aerosol Optical Thickness |
| SHAOT | shadow-based AOT |
| BRDF | bidirectional reflectance distribution function |
| SNR | Signal to Noise Ratio |
| LDA | Linear Discriminant Analysis |
| SVM | Support Vector Machine |
| RBF | Radial Basic function |
| SWIR | Short-Wave Infrared |
Appendix A
Table A1 shows the discrepancy between two strategies: mean spectrum and majority vote by crown. The mean spectrum was computed using the multi flight line. The training was realized as described in the classification section. The standard deviation of accuracy using the mean crown spectrum computed for the 20 runs was around 4% which it is higher than using majority vote procedure (1–1.5%). This is probably due to the much lower number of elementary observations when mean crown spectra are used.
Table A1.
Summary of mean accuracies and kappa results from data acquired on the 19 September using the 20 most abundant species and comparing two strategies: object and majority vote.
Table A1.
Summary of mean accuracies and kappa results from data acquired on the 19 September using the 20 most abundant species and comparing two strategies: object and majority vote.
| Treatment | Spectral Average | Majority Vote | ||
|---|---|---|---|---|
| Accuracy (%) | Kappa (%) | Accuracy (%) | Kappa (%) | |
| L1b | 79.4 | 76.2 | 75.5 | 70.6 |
| L1b Spa.F | 79.6 | 76.4 | 81.7 | 78.9 |
| L1b Spa.F, norm. | 81.7 | 79.0 | 83 | 80.5 |
| L1b Spa.F, norm., Sha.R | 81.7 | 79.0 | 83.3 | 80.9 |
| L1c without SHAOT | 79.1 | 75.7 | 74.3 | 68.9 |
| L1c with SHAOT | 79.2 | 75.9 | 75.3 | 70.3 |
| L1c SHAOT, Spa.F | 79.2 | 75.9 | 81.9 | 79.1 |
| L1c Spa.F, SHAOT | 79.4 | 76.2 | 82.0 | 79.3 |
| L1c SHAOT, Sha.R | 79.7 | 76.5 | 76.5 | 71.9 |
| L1c Spa.F, SHAOT, norm. | 81.3 | 78.5 | 82.7 | 80.1 |
| L1c Spa.F, SHAOT, Sha.R | 79.7 | 76.5 | 82.6 | 80.0 |
| L1c Spa.F, SHAOT, norm., Sha.R | 81.4 | 78.6 | 83.2 | 80.8 |
Appendix B
Figure A1 shows the similarities with the ANOVA results.

Figure A1.
SNR (Signal to Noise Ratio) computed for one flight line.
The SNR was computed on one cloudless flight line based on the PARGE method. The algorithm applies a high pass filtering on a dark homogeneous ROI (Region Of Interest) and works as follows:
- Search for the 7 × 7 pixels patch with smallest noise throughout the whole image in each band.
- Calculate the mean of the whole image and the mean of the patch
- Calculate the noise in the found patch after high pass filtering
- Obtain SNR values as mean reflectance divided by the noise in the patch
The smallest noise is obtained as the pixel of the minimum squared deviation between of high-pass filtered image (with 7 pixel size kernel). The obtained SNRs are a best-guess estimate and should not be taken as absolute quality measure for an imaging system. More details are given in PARGE documentation [].
Appendix C
A Random Forest classifier was used with 1000 trees repeated 20 times while keeping the same methodology used for the LDA classifier (see Table A2). The atmospheric correction and the suppression of shadowed pixels have an impact on classification accuracies. Nevertheless, these accuracies are lower than using a LDA classifier (about 18% difference, see Table A2 and Table 4).
Table A2.
Summary of mean accuracies and kappa results from data acquired on the 19 September using the 20 most abundant species based on a Random Forest classifier.
Table A2.
Summary of mean accuracies and kappa results from data acquired on the 19 September using the 20 most abundant species based on a Random Forest classifier.
| Treatment | Pixel | Object | ||
|---|---|---|---|---|
| Accuracy (%) | Kappa (%) | Accuracy (%) | Kappa (%) | |
| L1b Spa,F, norm, | 56.4 | 21.5 | 59.0 | 40.7 |
| L1c Spa,F, SHAOT, norm, | 58.3 | 28.2 | 61.7 | 46.8 |
| L1b Spa,F, norm., Sha,R | 57.3 | 25.4 | 60.3 | 44.0 |
| L1c Spa,F, SHAOT, norm., Sha,R | 59.3 | 32.6 | 62.4 | 48.6 |
Appendix D
The airborne LiDAR scanning data were acquired at the same time as the hyperspectral data, using a LMS Q780 RIEGL. The scan frequency was 400 khz and the final point density was around 33 pts/m2. The scan angle was between ±30°. The point cloud was processed to provide geo-referenced 3D point cloud. The position and orientation of the platform were given by on-board GPS/IMU measurements. These parameters provided a point cloud in the WGS84/UTM zone 22N coordinate system. Point cloud filtering was done to remove non-valid points.
References
- Ter Steege, H.; Pitman, N.C.A.; Sabatier, D.; Baraloto, C.; Salomao, R.P.; Guevara, J.E.; Phillips, O.L.; Castilho, C.V.; Magnusson, W.E.; Molino, J.F.; et al. Hyperdominance in the Amazonian Tree Flora. Science 2013, 342, 1243092. [Google Scholar] [CrossRef]
- Brienen, R.J.W.; Phillips, O.L.; Feldpausch, T.R.; Gloor, E.; Baker, T.R.; Lloyd, J.; Lopez-Gonzalez, G.; Monteagudo Mendoza, A.; Malhi, Y.; Lewis, S.L.; et al. Long-term decline of the Amazon carbon sink. Nature 2014, 519, 344–348. [Google Scholar] [CrossRef]
- Barlow, J.; França, F.; Gardner, T.A.; Hicks, C.C.; Lennox, G.D.; Berenguer, E.; Castello, L.; Economo, E.P.; Ferreira, J.; Guénard, B.; et al. The future of hyperdiverse tropical ecosystems. Nature 2018, 559, 517–526. [Google Scholar] [CrossRef]
- DRYFLOR; Banda, K.; Delgado-Salinas, A.; Dexter, K.G.; Linares-Palomino, R.; Oliveira-Filho, A.; Prado, D.; Pullan, M.; Quintana, C.; Riina, R.; et al. Plant diversity patterns in neotropical dry forests and their conservation implications. Science 2016, 353, 1383–1387. [Google Scholar] [CrossRef]
- McDowell, N.; Allen, C.D.; Anderson-Teixeira, K.; Brando, P.; Brienen, R.; Chambers, J.; Christoffersen, B.; Davies, S.; Doughty, C.; Duque, A.; et al. Drivers and mechanisms of tree mortality in moist tropical forests. New Phytol. 2018, 219, 851–869. [Google Scholar] [CrossRef]
- O’Neill, D.W.; Fanning, A.L.; Lamb, W.F.; Steinberger, J.K. A good life for all within planetary boundaries. Nat. Sustain. 2018, 1, 88–95. [Google Scholar] [CrossRef]
- Deininger, K.; Byerlee, D. Rising Global Interest in Farmland: Can It Yield Sustainable and Equitable Benefits? The World Bank: Washington, DC, USA, 2011. [Google Scholar] [CrossRef]
- Alamgir, M.; Campbell, M.J.; Sloan, S.; Goosem, M.; Clements, G.R.; Mahmoud, M.I.; Laurance, W.F. Economic, Socio-Political and Environmental Risks of Road Development in the Tropics. Curr. Biol. 2017, 27, R1130–R1140. [Google Scholar] [CrossRef]
- Mitchard, E.T.A.; Feldpausch, T.R.; Brienen, R.J.W.; Lopez-Gonzalez, G.; Monteagudo, A.; Baker, T.R.; Lewis, S.L.; Lloyd, J.; Quesada, C.A.; Gloor, M.; et al. Markedly divergent estimates of Amazon forest carbon density from ground plots and satellites: Divergent forest carbon maps from plots & space. Glob. Ecol. Biogeogr. 2014, 23, 935–946. [Google Scholar] [CrossRef]
- Cardoso, D.; Särkinen, T.; Alexander, S.; Amorim, A.M.; Bittrich, V.; Celis, M.; Daly, D.C.; Fiaschi, P.; Funk, V.A.; Giacomin, L.L.; et al. Amazon plant diversity revealed by a taxonomically verified species list. Proc. Natl. Acad. Sci. USA 2017, 114, 10695–10700. [Google Scholar] [CrossRef]
- Somers, B.; Asner, G.P. Hyperspectral Time Series Analysis of Native and Invasive Species in Hawaiian Rainforests. Remote Sens. 2012, 4, 2510–2529. [Google Scholar] [CrossRef]
- Baldeck, C.; Asner, G. Improving Remote Species Identification through Efficient Training Data Collection. Remote Sens. 2014, 6, 2682–2698. [Google Scholar] [CrossRef]
- Baldeck, C.A.; Asner, G.P.; Martin, R.E.; Anderson, C.B.; Knapp, D.E.; Kellner, J.R.; Wright, S.J. Operational Tree Species Mapping in a Diverse Tropical Forest with Airborne Imaging Spectroscopy. PLoS ONE 2015, 10, e0118403. [Google Scholar] [CrossRef] [PubMed]
- Clark, M.; Roberts, D.; Clark, D. Hyperspectral discrimination of tropical rain forest tree species at leaf to crown scales. Remote Sens. Environ. 2005, 96, 375–398. [Google Scholar] [CrossRef]
- Feret, J.B.; Asner, G.P. Tree Species Discrimination in Tropical Forests Using Airborne Imaging Spectroscopy. IEEE Trans. Geosci. Remote Sens. 2013, 51, 73–84. [Google Scholar] [CrossRef]
- Hueni, A.; Nieke, J.; Schopfer, J.; Kneubühler, M.; Itten, K. The spectral database SPECCHIO for improved long-term usability and data sharing. Comput. Geosci. 2009, 35, 557–565. [Google Scholar] [CrossRef]
- Bojinski, S.; Schaepman, M.; Schläpfer, D.; Itten, K. SPECCHIO: A spectrum database for remote sensing applications. Comput. Geosci. 2003, 29, 27–38. [Google Scholar] [CrossRef]
- Chen, C.; Li, W.; Tramel, E.W.; Cui, M.; Prasad, S.; Fowler, J.E. Spectral–Spatial Preprocessing Using Multihypothesis Prediction for Noise-Robust Hyperspectral Image Classification. IEEE J. Sel. Top. Appl. Earth Obs. Remote Sens. 2014, 7, 1047–1059. [Google Scholar] [CrossRef]
- Hively, W.D.; McCarty, G.W.; Reeves, J.B.; Lang, M.W.; Oesterling, R.A.; Delwiche, S.R. Use of Airborne Hyperspectral Imagery to Map Soil Properties in Tilled Agricultural Fields. Appl. Environ. Soil Sci. 2011, 2011, 1–13. [Google Scholar] [CrossRef]
- Clark, M.L.; Roberts, D.A. Species-Level Differences in Hyperspectral Metrics among Tropical Rainforest Trees as Determined by a Tree-Based Classifier. Remote Sens. 2012, 4, 1820–1855. [Google Scholar] [CrossRef]
- Friman, O.; Tolt, G.; Ahlberg, J. Illumination and shadow compensation of hyperspectral images using a digital surface model and non-linear least squares estimation. In Proceedings of SPIE—The International Society for Optical Engineering; SPIE: Bellingham, WA, USA, 2011; p. 81800Q. [Google Scholar] [CrossRef]
- Lopatin, J.; Dolos, K.; Kattenborn, T.; Fassnacht, F.E. How canopy shadow affects invasive plant species classification in high spatial resolution remote sensing. Remote Sens. Ecol. Conserv. 2019. [Google Scholar] [CrossRef]
- Gao, B.C.; Montes, M.J.; Davis, C.O.; Goetz, A.F. Atmospheric correction algorithms for hyperspectral remote sensing data of land and ocean. Remote Sens. Environ. 2009, 113, S17–S24. [Google Scholar] [CrossRef]
- Thompson, D.R.; Guanter, L.; Berk, A.; Gao, B.C.; Richter, R.; Schläpfer, D.; Thome, K.J. Retrieval of Atmospheric Parameters and Surface Reflectance from Visible and Shortwave Infrared Imaging Spectroscopy Data. Surv. Geophys. 2018. [Google Scholar] [CrossRef]
- Wagner, F.; Hérault, B.; Stahl, C.; Bonal, D.; Rossi, V. Modeling water availability for trees in tropical forests. Agric. For. Meteorol. 2011, 151, 1202–1213. [Google Scholar] [CrossRef]
- Gourlet-Fleury, S.; Guehl, J.M.; Laroussinie, O. (Eds.) Ecology and Management of a Neotropical Rainforest: Lessons Drawn From Paracou, a Long-Term Experimental Research Site in French Guiana; Elsevier: Paris, France, 2004. [Google Scholar]
- Richter, R.; Schlapfer, D. PARametric GEocoding: Orthorectification for Airborne Scanner Data. User Manual, Version 3.4. 2018. Available online: http://dev.rese.ch/software/parge/index.html (accessed on 1 April 2019).
- Kang, X.; Li, S.; Benediktsson, J.A. Feature Extraction of Hyperspectral Images With Image Fusion and Recursive Filtering. IEEE Trans. Geosci. Remote Sens. 2014, 52, 3742–3752. [Google Scholar] [CrossRef]
- Dalponte, M.; Ørka, H.O.; Ene, L.T.; Gobakken, T.; Næsset, E. Tree crown delineation and tree species classification in boreal forests using hyperspectral and ALS data. Remote Sens. Environ. 2014, 140, 306–317. [Google Scholar] [CrossRef]
- Schläpfer, D.; Borel, C.C.; Keller, J.; Itten, K.I. Atmospheric Precorrected Differential Absorption Technique to Retrieve Columnar Water Vapor. Remote Sens. Environ. 1998, 65, 353–366. [Google Scholar] [CrossRef]
- Schläpfer, D.; Richter, R. Atmospheric correction of imaging spectroscopy data using shadow-based quantification of aerosol scattering effects. EARSeL eProc. 2017, 16, 21. [Google Scholar]
- Thomas, C.; Briottet, X.; Santer, R. Remote sensing of aerosols in urban areas from very high spatial resolution images: Application of the OSIS code to multispectral PELICAN airborne data. Int. J. Remote Sens. 2013, 34, 919–937. [Google Scholar] [CrossRef]
- Schläpfer, D.; Hueni, A.; Richter, R. Cast Shadow Detection to Quantify the Aerosol Optical Thickness for Atmospheric Correction of High Spatial Resolution Optical Imagery. Remote Sens. 2018, 10, 200. [Google Scholar] [CrossRef]
- Shen, X.; Cao, L. Tree-Species Classification in Subtropical Forests Using Airborne Hyperspectral and LiDAR Data. Remote Sens. 2017, 9, 1180. [Google Scholar] [CrossRef]
- Fisher, R. Statistical Methods and Scientific Induction. J. R. Stat. Soc. Ser. B (Methodol.) 1955, 17, 69–78. [Google Scholar] [CrossRef]
- Yu, H.; Yang, J. A direct LDA algorithm for high-dimensional data—With application to face recognition. Pattern Recogit. 2001, 34, 2067–2070. [Google Scholar] [CrossRef]
- Venables, W.N.; Ripley, B.D.; Venables, W.N. Modern Applied Statistics with S, 4th ed.; Statistics and Computing; Springer: New York, NY, USA, 2002. [Google Scholar]
- R Development Core Team. R: A Language and Environment for Statistical Computing; R Foundation for Statistical Computing: Vienna, Austria, 2008. [Google Scholar]
- Breiman, L. Random Forests. Mach. Learn. 2001, 45, 5–32. [Google Scholar] [CrossRef]
- Vapnik, V.N. The Nature of Statistical Learning Theory; Springer: New York, NY, USA, 2000. [Google Scholar] [CrossRef]
- Ferreira, M.P.; Zortea, M.; Zanotta, D.C.; Shimabukuro, Y.E.; de Souza Filho, C.R. Mapping tree species in tropical seasonal semi-deciduous forests with hyperspectral and multispectral data. Remote Sens. Environ. 2016, 179, 66–78. [Google Scholar] [CrossRef]
- Liaw, A.; Wiener, M. Classification and Regression by randomForest. R News 2002, 2, 18–22. [Google Scholar]
- Colgan, M.; Baldeck, C.; Féret, J.B.; Asner, G. Mapping Savanna Tree Species at Ecosystem Scales Using Support Vector Machine Classification and BRDF Correction on Airborne Hyperspectral and LiDAR Data. Remote Sens. 2012, 4, 3462–3480. [Google Scholar] [CrossRef]
- Vidal, M.; Amigo, J.M. Pre-processing of hyperspectral images. Essential steps before image analysis. Chemom. Intell. Lab. Syst. 2012, 117, 138–148. [Google Scholar] [CrossRef]
- Cohen, J. Weighted kappa: Nominal scale agreement provision for scaled disagreement or partial credit. Psychol. Bull. 1968, 70, 213–220. [Google Scholar] [CrossRef]
- Peerbhay, K.Y.; Mutanga, O.; Ismail, R. Commercial tree species discrimination using airborne AISA Eagle hyperspectral imagery and partial least squares discriminant analysis (PLS-DA) in KwaZulu–Natal, South Africa. ISPRS J. Photogramm. Remote Sens. 2013, 79, 19–28. [Google Scholar] [CrossRef]
- Große-Stoltenberg, A.; Hellmann, C.; Werner, C.; Oldeland, J.; Thiele, J. Evaluation of Continuous VNIR-SWIR Spectra versus Narrowband Hyperspectral Indices to Discriminate the Invasive Acacia longifolia within a Mediterranean Dune Ecosystem. Remote Sens. 2016, 8, 334. [Google Scholar] [CrossRef]
- Shahriari Nia, M.; Wang, D.Z.; Bohlman, S.A.; Gader, P.; Graves, S.J.; Petrovic, M. Impact of atmospheric correction and image filtering on hyperspectral classification of tree species using support vector machine. J. Appl. Remote Sens. 2015, 9, 095990. [Google Scholar] [CrossRef]
- Nevalainen, O.; Honkavaara, E.; Tuominen, S.; Viljanen, N.; Hakala, T.; Yu, X.; Hyyppä, J.; Saari, H.; Pölönen, I.; Imai, N.; Tommaselli, A. Individual Tree Detection and Classification with UAV-Based Photogrammetric Point Clouds and Hyperspectral Imaging. Remote Sens. 2017, 9, 185. [Google Scholar] [CrossRef]
- De Sá, N.C.; Castro, P.; Carvalho, S.; Marchante, E.; López-Núñez, F.A.; Marchante, H. Mapping the Flowering of an Invasive Plant Using Unmanned Aerial Vehicles: Is There Potential for Biocontrol Monitoring? Front. Plant Sci. 2018, 9. [Google Scholar] [CrossRef] [PubMed]
- Richter, R.; Müller, A. De-shadowing of satellite/airborne imagery. Int. J. Remote Sens. 2005, 26, 3137–3148. [Google Scholar] [CrossRef]
- Adeline, K.; Chen, M.; Briottet, X.; Pang, S.; Paparoditis, N. Shadow detection in very high spatial resolution aerial images: A comparative study. ISPRS J. Photogramm. Remote Sens. 2013, 80, 21–38. [Google Scholar] [CrossRef]
- Nagendra, H. Using remote sensing to assess biodiversity. Int. J. Remote Sens. 2001, 22, 2377–2400. [Google Scholar] [CrossRef]
- Vanden Borre, J.; Spanhove, T.; Haest, B. Towards a Mature Age of Remote Sensing for Natura 2000 Habitat Conservation: Poor Method Transferability as a Prime Obstacle. In The Roles of Remote Sensing in Nature Conservation; Díaz-Delgado, R., Lucas, R., Hurford, C., Eds.; Springer: Cham, Switzerland, 2017; pp. 11–37. [Google Scholar] [CrossRef]
- Valbuena, R.; Mauro, F.; Arjonilla, F.J.; Manzanera, J.A. Comparing airborne laser scanning-imagery fusion methods based on geometric accuracy in forested areas. Remote Sens. Environ. 2011, 115, 1942–1954. [Google Scholar] [CrossRef]
- Große-Stoltenberg, A.; Hellmann, C.; Thiele, J.; Werner, C.; Oldeland, J. Early detection of GPP-related regime shifts after plant invasion by integrating imaging spectroscopy with airborne LiDAR. Remote Sens. Environ. 2018, 209, 780–792. [Google Scholar] [CrossRef]
- Yao, W.; Krzystek, P.; Heurich, M. Tree species classification and estimation of stem volume and DBH based on single tree extraction by exploiting airborne full-waveform LiDAR data. Remote Sens. Environ. 2012, 123, 368–380. [Google Scholar] [CrossRef]
- Bruggisser, M.; Roncat, A.; Schaepman, M.E.; Morsdorf, F. Retrieval of higher order statistical moments from full-waveform LiDAR data for tree species classification. Remote Sens. Environ. 2017, 196, 28–41. [Google Scholar] [CrossRef]
- Féret, J.B.; Asner, G.P. Mapping tropical forest canopy diversity using high-fidelity imaging spectroscopy. Ecol. Appl. 2014, 24, 1289–1296. [Google Scholar] [CrossRef] [PubMed]
- Vaglio Laurin, G.; Chen, Q.; Lindsell, J.A.; Coomes, D.A.; Frate, F.D.; Guerriero, L.; Pirotti, F.; Valentini, R. Above ground biomass estimation in an African tropical forest with lidar and hyperspectral data. ISPRS J. Photogramm. Remote Sens. 2014, 89, 49–58. [Google Scholar] [CrossRef]
- Ferraz, A.; Saatchi, S.; Mallet, C.; Meyer, V. Lidar detection of individual tree size in tropical forests. Remote Sens. Environ. 2016, 183, 318–333. [Google Scholar] [CrossRef]
- Tochon, G.; Féret, J.; Valero, S.; Martin, R.; Knapp, D.; Salembier, P.; Chanussot, J.; Asner, G. On the use of binary partition trees for the tree crown segmentation of tropical rainforest hyperspectral images. Remote Sens. Environ. 2015, 159, 318–331. [Google Scholar] [CrossRef]
- Marvin, D.C.; Asner, G.P.; Schnitzer, S.A. Liana canopy cover mapped throughout a tropical forest with high-fidelity imaging spectroscopy. Remote Sens. Environ. 2016, 176, 98–106. [Google Scholar] [CrossRef]
- Susaki, J.; Hara, K.; Kajiwara, K.; Honda, Y. Robust estimation of BRDF model parameters. Remote Sens. Environ. 2004, 89, 63–71. [Google Scholar] [CrossRef]
© 2019 by the authors. Licensee MDPI, Basel, Switzerland. This article is an open access article distributed under the terms and conditions of the Creative Commons Attribution (CC BY) license (http://creativecommons.org/licenses/by/4.0/).