Article

AS-CRI: A New Metric of FTIR-Based Apparent Spectral-Contrast Radiant Intensity for Remote Thermal Signature Analysis

1
Department of Electronic Engineering, Yeungnam University, 280 Daehak-Ro, Gyeongsan, Gyeongbuk 38541, Korea
2
Agency for Defense Development, P.O. Box 35, Daejeon 34186, Korea
*
Author to whom correspondence should be addressed.
Remote Sens. 2019, 11(7), 777; https://doi.org/10.3390/rs11070777
Submission received: 25 February 2019 / Revised: 27 March 2019 / Accepted: 28 March 2019 / Published: 1 April 2019

Abstract

:
Infrared signature analysis that considers both the target and background is fundamentally important to the development of target detection systems as well as in the design of ships for thermal stealth. This paper presents the analysis results of long-term infrared signature variations in terms of the apparent spectral-contrast radiant intensity measured using Fourier transform infrared (FTIR)-based hyperspectral images. A novel apparent spectral-contrast radiant intensity (AS-CRI) measure is proposed to evaluate the spectral infrared signature accurately at the sensor point of view. The spectral information by AS-CRI can provide the optimal band for either target detection or thermal stealth purposes, considering the background and atmospheric transmittance. In addition, the effects of seasonal and weather variations were analyzed from the long-term hyperspectral image database constructed during 2018.01–2018.08 (three times a day). A TELOPS HYPER-CAM MWE camera was adopted to acquire 374 bands in 1.5–5.5 μm. The automatic weather system (AWS) can provide 24 h weather recordings for the signature evaluation. The experimental results validate the utility of the novel AS-CRI method to find spectral bands for a range of infrared signature applications including small infrared target detection.

Graphical Abstract

1. Introduction

The infrared (IR) signature is the appearance of objects to infrared sensors, such as InSb, mercury-cadmium-telluride (MCT), or micro-bolometer [1]. IR cameras provide a temperature field that cannot be obtained from single-point radiometers. Such radiance measurements are of great utility in infrared signatures. The IR signature is important to various areas, including Earth science [2], environment [3], weather [4], and military [5]. Remote measurements of Earth’s temperature are useful for an analysis of the global warming problem. In particular, the IR signature is used frequently in target detection and thermal stealth problems in military applications [6,7,8].
The signature can be measured in terms of the absolute temperature, temperature contrast, absolute radiant intensity, or contrast radiant intensity. The absolute temperature can be measured using thermocouples or by converting the radiance to temperature via Planck’s law [9]. The absolute temperatures of target and background are important theoretically but the spatial distribution of remote scenes (target + background) is very hard to measure because of the atmospheric attenuation and path radiance [10]. In target detection applications, the temperature contrast can be used to measure the IR signature in ships and aircraft signature optimization by removing the effect of path radiance [11,12,13]. The temperature contrast between the surfaces of a ship and the environment is a crucial signature in remote target detection [12]. Although the temperature contrast can be useful to guide signature contrast intuitively, it cannot reflect the amount of thermal energy quantitatively.
A method to overcome this is the absolute radiant intensity, which considers both surface temperature and target area. The temperature information is reflected in the form of the radiance and the multiplication with the target area gives the absolute radiant intensity [ W / s r ] . There is still the problem of unwanted path radiance in remote signature measurements. The contrast radiant intensity (CRI) is a more accurate and popular measure of the IR signature when calculating the radiant contrast between the target and background because the signature contrast can reduce the path radiance [14,15,16]. The contrast of the radiant intensity is linked directly to infrared small target detection applications. The previous small target detection methods usually use the contrast of the target and background, such as the least mean square (LMS) filter [17,18,19], modified Mean subtraction filter (M-MSF) [20], localized directional Laplacian-of-Gaussian (LoG) filter, scale invariant approach to the LoG filter [21], and steering kernel reconstruction [22].
The CRI is usually measured on the target and background surface. The radiant contrast is attenuated by atmospheric transmittance and measured using infrared detectors. On the other hand, it is almost impossible to estimate the correct atmospheric transmittance due to the time-varying properties [23]. In addition, the emissivity of the target surface is difficult to estimate in real time [24]. The apparent CRI can be a practical method for infrared signature characterization because it is measured at the IR detectors, reflecting the atmospheric attenuation effects [6,10]. The radiant intensity in the CRI is calculated by integrating Planck’s law with the estimated temperature [25]. This approach, however, is inaccurate because the atmospheric transmissivity and target emissivity are not considered. In addition, the effects of the spectral bands are not considered when calculating the CRI, which is crucial in target detection or thermal stealth analysis.
In this paper, a novel IR signature measure, called the apparent spectral-CRI (AS-CRI), is proposed to measure the physical thermal characteristics accurately. The AS-CRI can calculate the apparent CRI with a specified spectral band range from the measured hyperspectral infrared images. The optimal spectral bands can be estimated by maximizing the AS-CRI measure for seeker (detection) applications. Similarly, optimal spectral bands can be found by minimizing the AS-CRI measure for stealth applications. The effects of time, day, month, seasons, and weather on the AS-CRI were analyzed by year-round database acquisition.
The remainder of this paper is organized as follows. Section 2 introduces the basics of the experimental set-up and CRI-based IR signature modeling. Section 3 explains the proposed apparent spectral-CRI signature and optimization, including the AS-CRI calculation flow. Section 4 analyzes the AS-CRI for detection and stealth applications considering a range of environmental changes. The paper is concluded in Section 5.

2. Background of Signature Measurement and Characterization

2.1. Set-Up for Controlled Field Experiment

Figure 1 summarizes the operational concept of remote thermal signature measurement in sea/sky background. The research objective was to estimate the AS-CRI of a target surface (chimney) heated by solar energy under different weather conditions. The target has four surfaces painted with different emissivities. The surface heated by direct sunlight was rotated 180 after thermal equilibrium (20 min) to determine the thermal radiation of each surface. The thermal energy radiated by the rotated surface passes through the atmosphere, which alters the spectral radiation. The atmospheric transmittance changes according to the molecular contents, such as carbon dioxide and water vapor. Additional thermal energy coming from the path was added to the remote surface radiation. This thermal radiation was recorded using a Michelson interferometer (TELOPS-HYPCAM-MWE, 374 bands in 1.5–5.5 μ m) and the spectra were obtained by applying the fast Fourier transform (FFT) to the interferograms.
Figure 2 shows the real set-up for controlled field experiments. The target was made of four-sided steel plates (plate-A, plate-B, plate-C, and plate-D) to model the chimney of a ship. Each side was painted with different types of material to evaluate the thermal stealth capability. A gas burner was installed in the chimney to test real combustion and a servo motor was used to control the rotation angle of the target. Five thermocouples were mounted on each target surface and additional two thermocouples were inserted in the inner side to record the physical target temperature. The remote target was located 78 m from the TELOPS-HYPCAM-MWE camera, where raw data (interferogram, 352 × 288, 1184 images) was acquired. The hyperspectral IR data acquisition system was installed in a coastal environment to consider both the sky and sea background simultaneously, as shown in Figure 2(left).
Figure 3 shows the camera specifications. The hyperspectral radiance image cube (spatial resolution, 352 × 288; spectral resolution, 374 bands in 1.5–5.5 μ m) data was obtained by the consecutive FFT and wavelength/radiometric calibration. This model can provide a high-resolution spectrum using a Michelson interferometer from the shortwave to midwave band [26]. The spectral resolution is user-selectable up to 0.25 [cm 1 ]; the noise equivalent spectral radiance (NESR) was 7 [nW/(cm 2 · sr · cm 1 )]; the radiometric accuracy is approximately 2 K. Such high sensitivity and accuracy is possible because the high-sensitivity sensor is combined with automatic high-efficiency calibration sources (hot black body, 95 ; cold black body, 25 ). An automatic weather station (AWS) recorded the environmental weather information per 10 s. The controlled field experiment was conducted three times (11:00, 14:00, and 16:00) a day between January to August in 2018. Details are explained in the following sections.

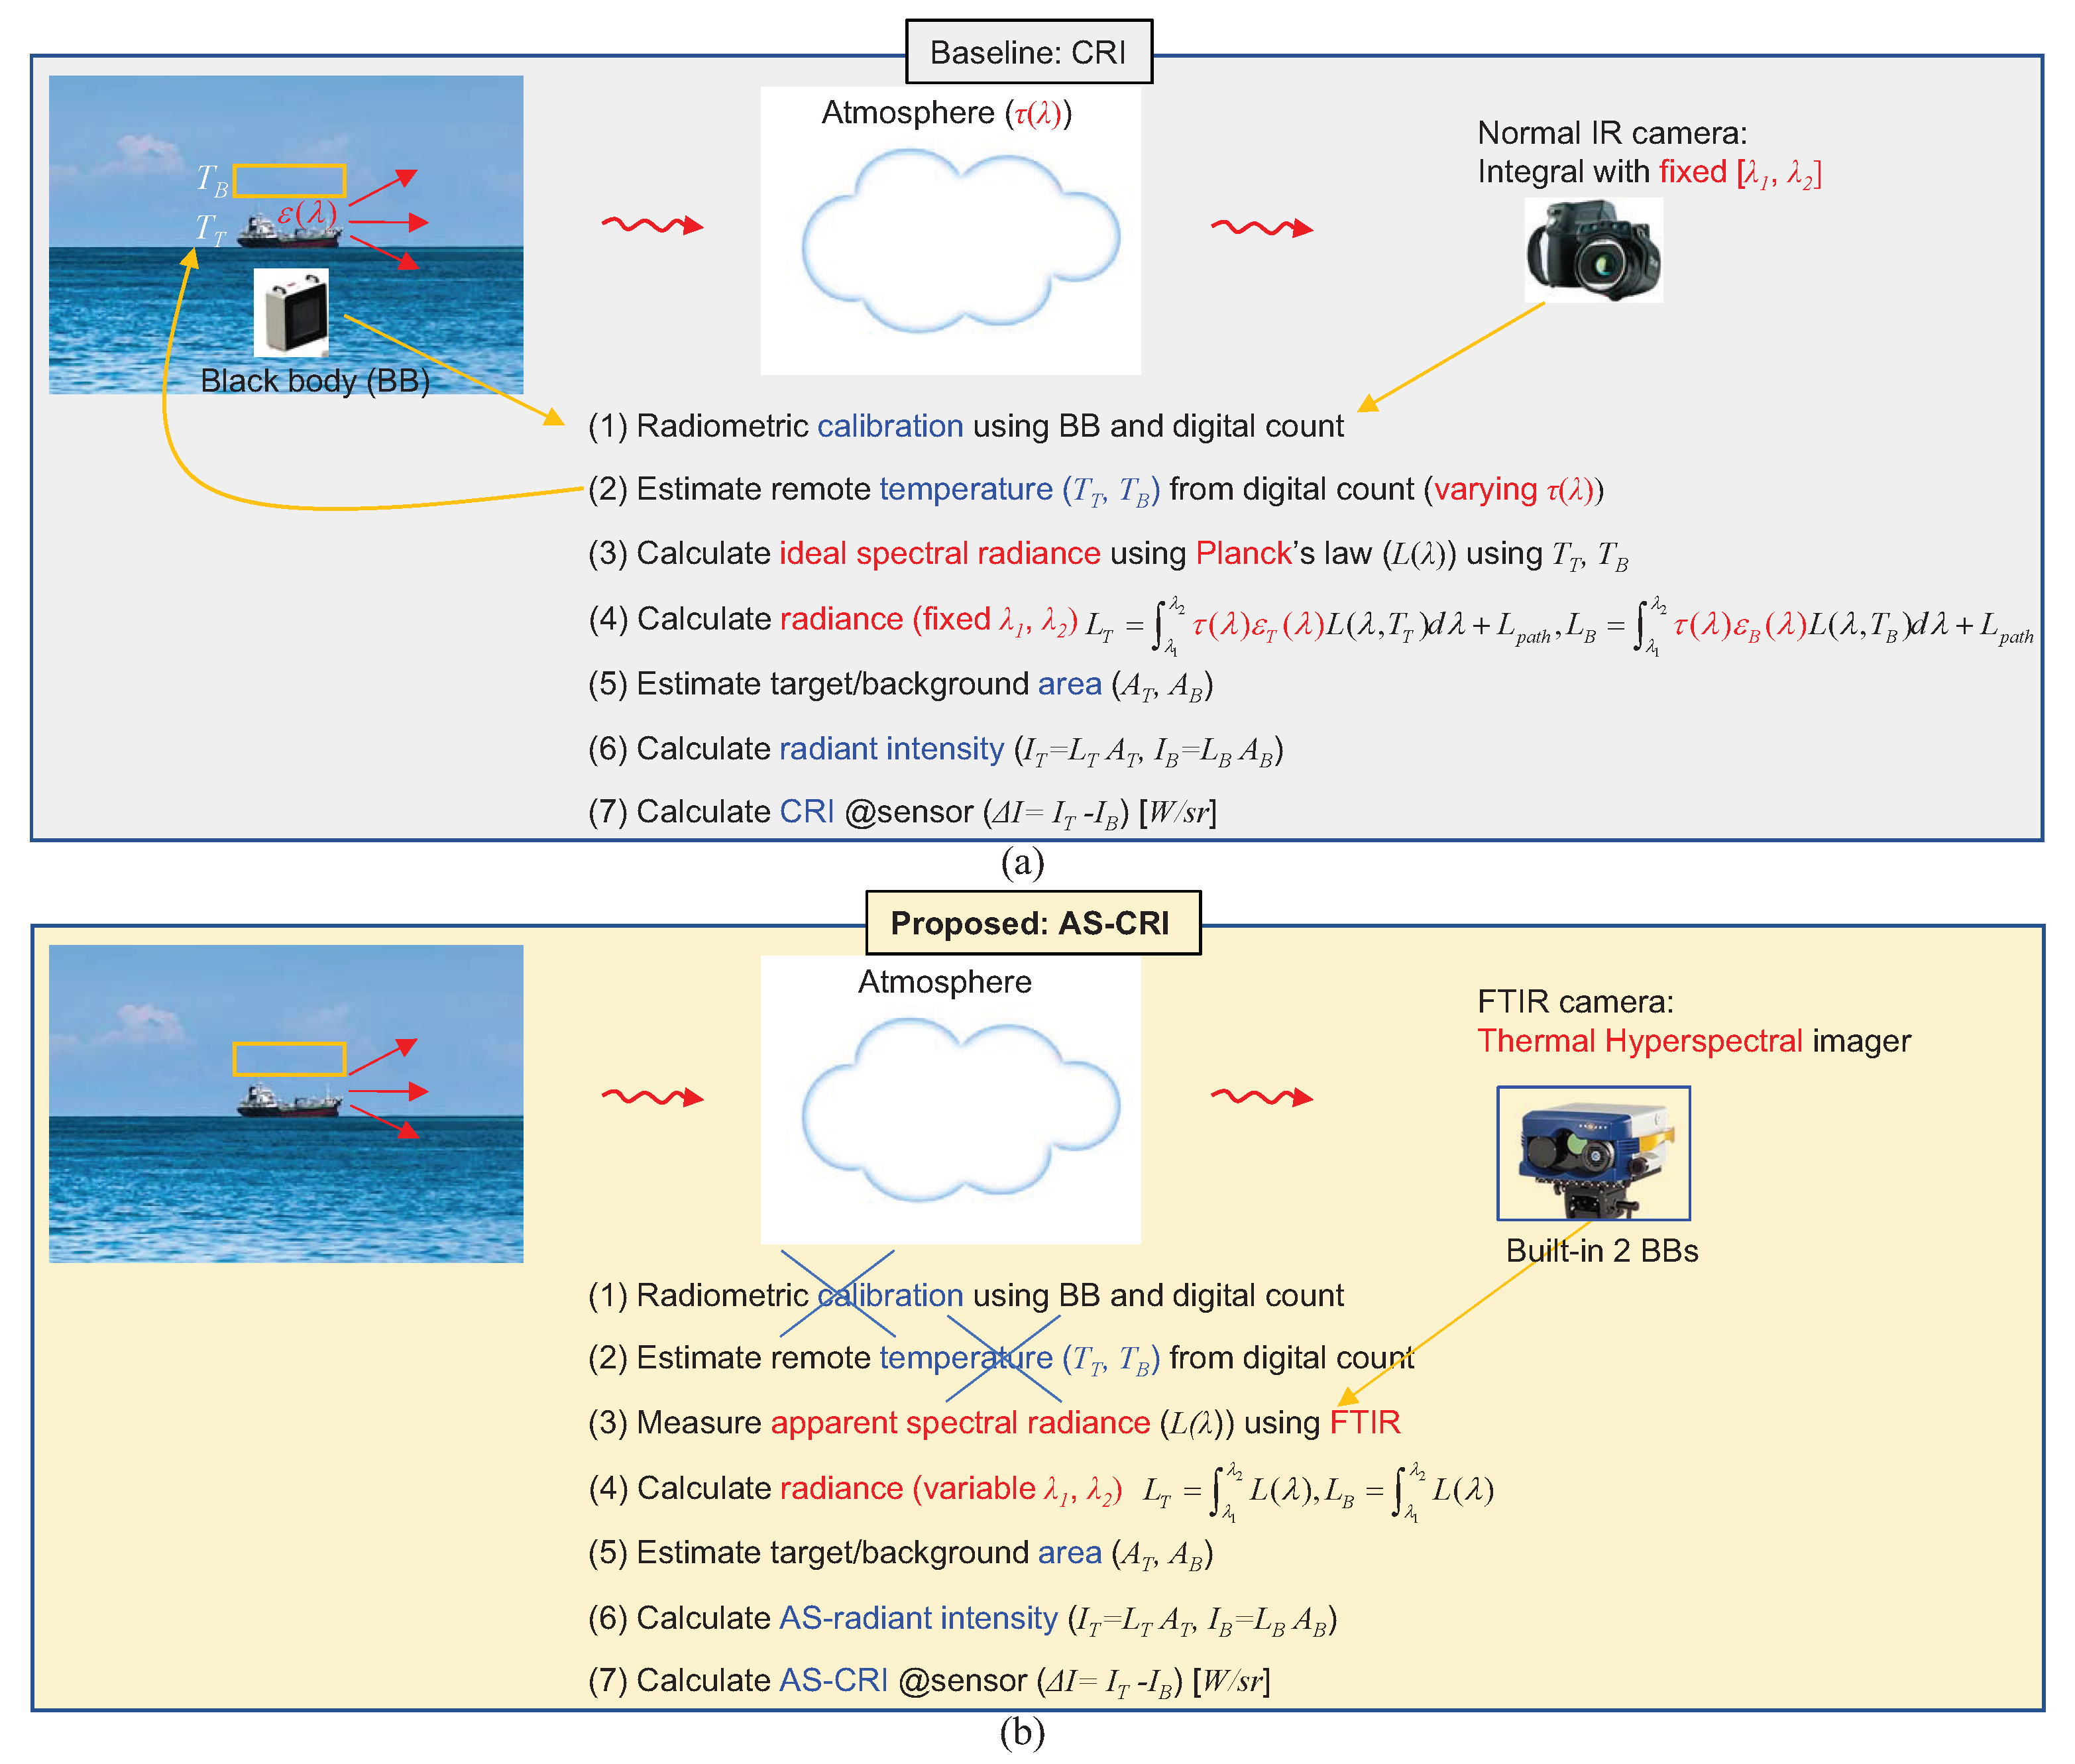
2.2. Basics of IR Signature Modeling: CRI

Figure 4 shows the general scenario with various components in IR sensing processing, such as the source (target), atmosphere, and sensor. As indicated in the figure, the most important parameters are the contrast radiant intensity ( Δ I [W/sr]) between the target and background and atmospheric transmittance ( τ ( λ ) ) because they are the basic input parameters of IR sensor systems.
The general CRI calculation procedure follows the NATO SIMVEX (Ship Infrared Model Validation Experiment), as shown in Figure 5 [27,28]. The radiant intensity of the target ( I T [W/sr]) was calculated by multiplying the emissivity of the target ( ε T ), target radiance ( L T [W/sr/m 2 ]), and target area ( A T [m 2 ]) defined in Equation (1).
I T = ε T · L T · A T
The target radiance ( L T ) can be calculated by integrating the spectral radiance ( L ( λ ) ) in the band range [ λ 1 λ 2 ] , as expressed in Equation (2).
L T = λ 1 λ 2 L ( λ ) d λ ,
where L ( λ ) represents Planck’s law defined in Equation (3).
L ( λ ) = 2 h c 2 λ 5 1 e h c λ k B T 1 ,
where k B denotes the Boltzmann constant; h represents Planck’s constant and c is the speed of light. The target temperature, T, is the key parameter in the spectral radiance calculation. The temperature is estimated by IR sensor calibration with blackbodies [29]. The radiant intensity of the background ( I B ) is calculated by similar processing. The target area ( A T ) is calculated by the instantaneous field of view (IFOV) and target distance. The final CRI is defined as Equation (4) where the effect of the path radiance is almost removed.
Δ I = I T I B

3. Proposed IR Signature Metric: AS-CRI

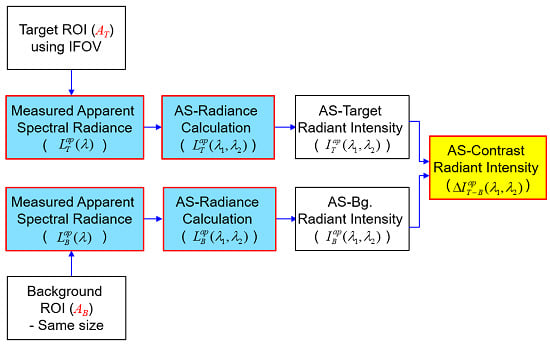
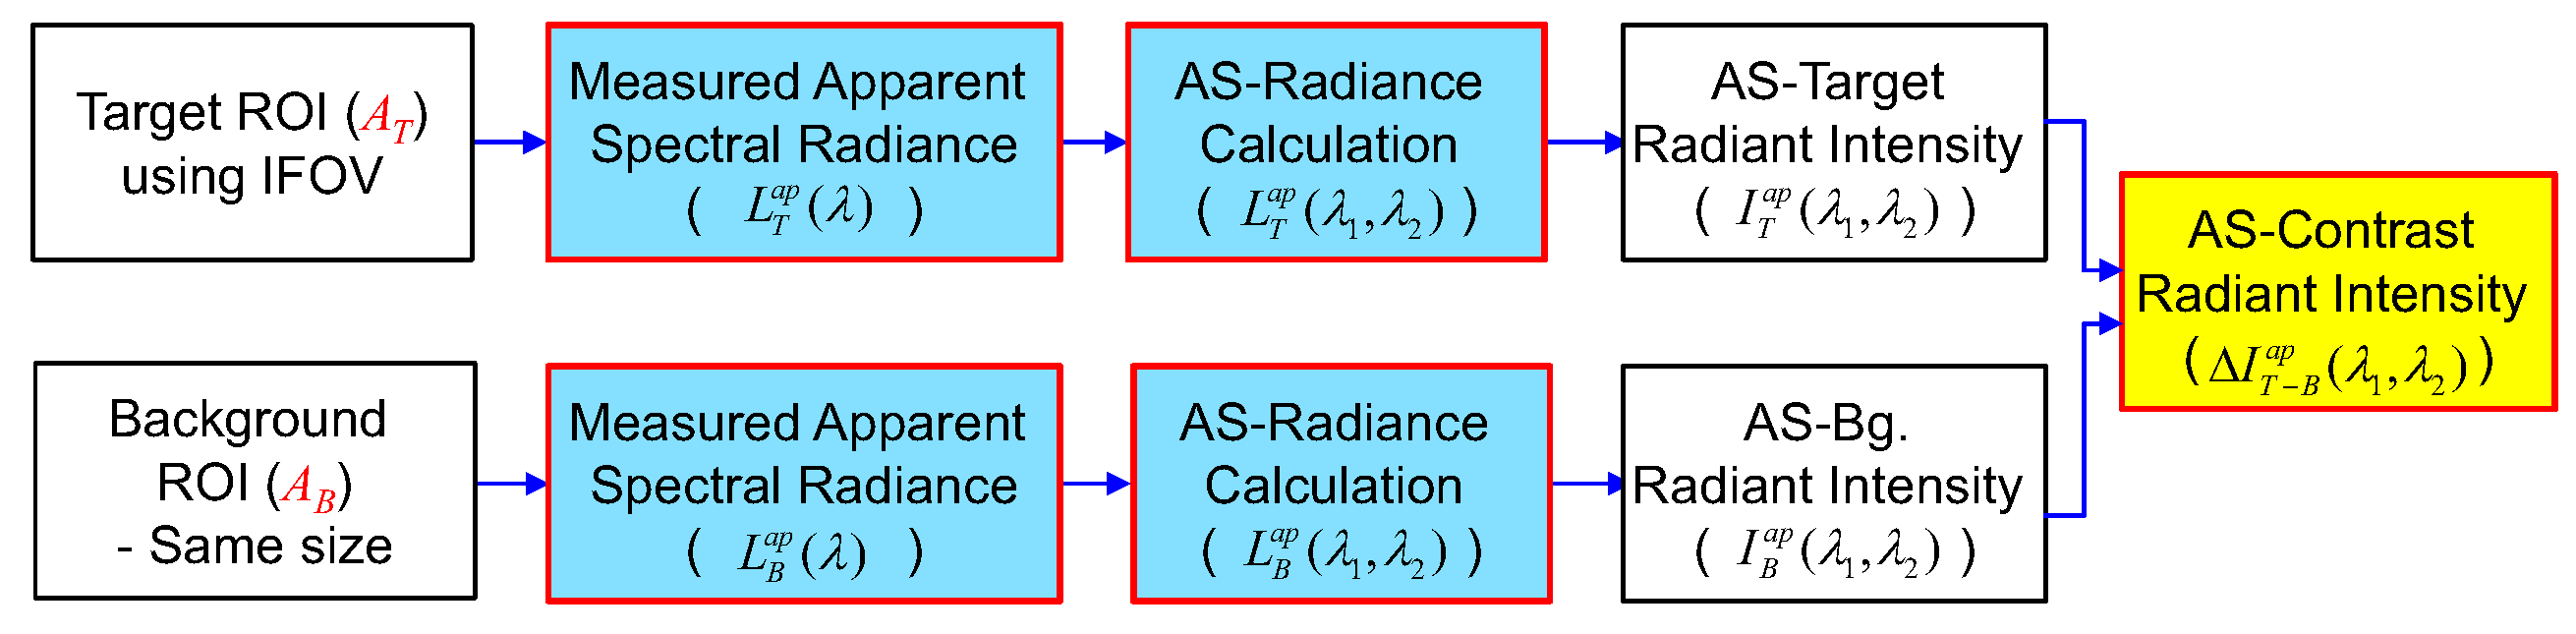
3.1. AS-CRI Calculation Flow

Although the conventional CRI measure described in the previous section can provide a quantitative radiant intensity value, it has three limitations. First, it is difficult to measure the temperature (T) of remote targets and background due to the small blackbody size and time-varying atmospheric conditions. An inaccurate temperature leads to an inaccurate calculation of the spectral radiance ( L ( λ ) ). Second, it is difficult to measure the target emissivity ( ε T ) correctly in the real world. Third, the unknown and time-varying atmospheric transmittance ( τ ( λ ) ) in Equation (1) is the most critical problem. Therefore, it is almost impossible to estimate the actual radiant intensity arriving at sensors. Moreover, there is no spectral information in the CRI that is useful for target detection and thermal stealth analysis. Figure 6a summarizes the steps required to acquire the CRI at the sensor point of view not the target side. First, a blackbody-based radiometric calibration is required to measure the physical target and background temperatures. This process is unstable because the atmospheric transmittance is time-varying. Second, the target and background temperatures are estimated using the digital count of a normal IR camera. Third, the ideal spectral radiance is calculated using the Planck’s law. Fourth, sensed radiance is calculated using the target emissivity, atmospheric transmittance, and integral with a fixed wavelength range. This step is required to extract a physical quantity for the sensor point of view. Fifth, the area of the target and background is estimated using the IFOV of camera and the target distance. Sixth, radiant intensity can be calculated by multiplying the radiance and area. Final CRI at the sensor is obtained by subtracting the target radiant intensity and background intensity.
This paper proposes a novel measure, the AS-CRI, which is defined as Equation (5). Figure 6b summarizes the steps required to obtain the AS-CRI at the sensor point of view by a comparison with the conventional CRI. The first and second steps are skipped because the FTIR-based hyperspectral imager can measure the spectral radiance directly using the built-in two blackbodies at a sensor point of view reflecting the target emissivity, atmospheric transmittance, and path spectral radiance. The next important step is a radiance calculation by the integral with a varying wavelength range, which can provide useful band information for the stealth and max signal-to-background analysis. The remaining steps are the same as the baseline CRI flow. Figure 7 presents the AS-CRI calculation flow including the specific notation.
Δ I T B a p ( λ 1 , λ 2 ) = I T a p ( λ 1 , λ 2 ) I B a p ( λ 1 , λ 2 )
where
I T a p ( λ 1 , λ 2 ) = L T a p ( λ 1 , λ 2 ) · A T
I B a p ( λ 1 , λ 2 ) = L B a p ( λ 1 , λ 2 ) · A B
The proposed AS-Radiance of the target ( L T a p ( λ 1 , λ 2 ) ) can be calculated by integrating the apparent spectral radiance ( L T a p ( λ ) ) in the band range [ λ 1 λ 2 ] , as expressed in Equation (8).
L T a p ( λ 1 , λ 2 ) = λ 1 λ 2 L T a p ( λ ) d λ ,
where L T a p ( λ ) is the measured spectral radiance using a Fourier transform infrared (FTIR)-based hyperspectral imager. The apparent spectral target radiance is measured in the sensor point of view, as shown in Figure 4(right). On the other hand, the spectral target radiance is measured on the target surface, as shown in Figure 4(left). The background radiant intensity ( I B a p ( λ 1 , λ 2 ) ) can be obtained using the same process with the same target size ( A T ) using Equation (7).

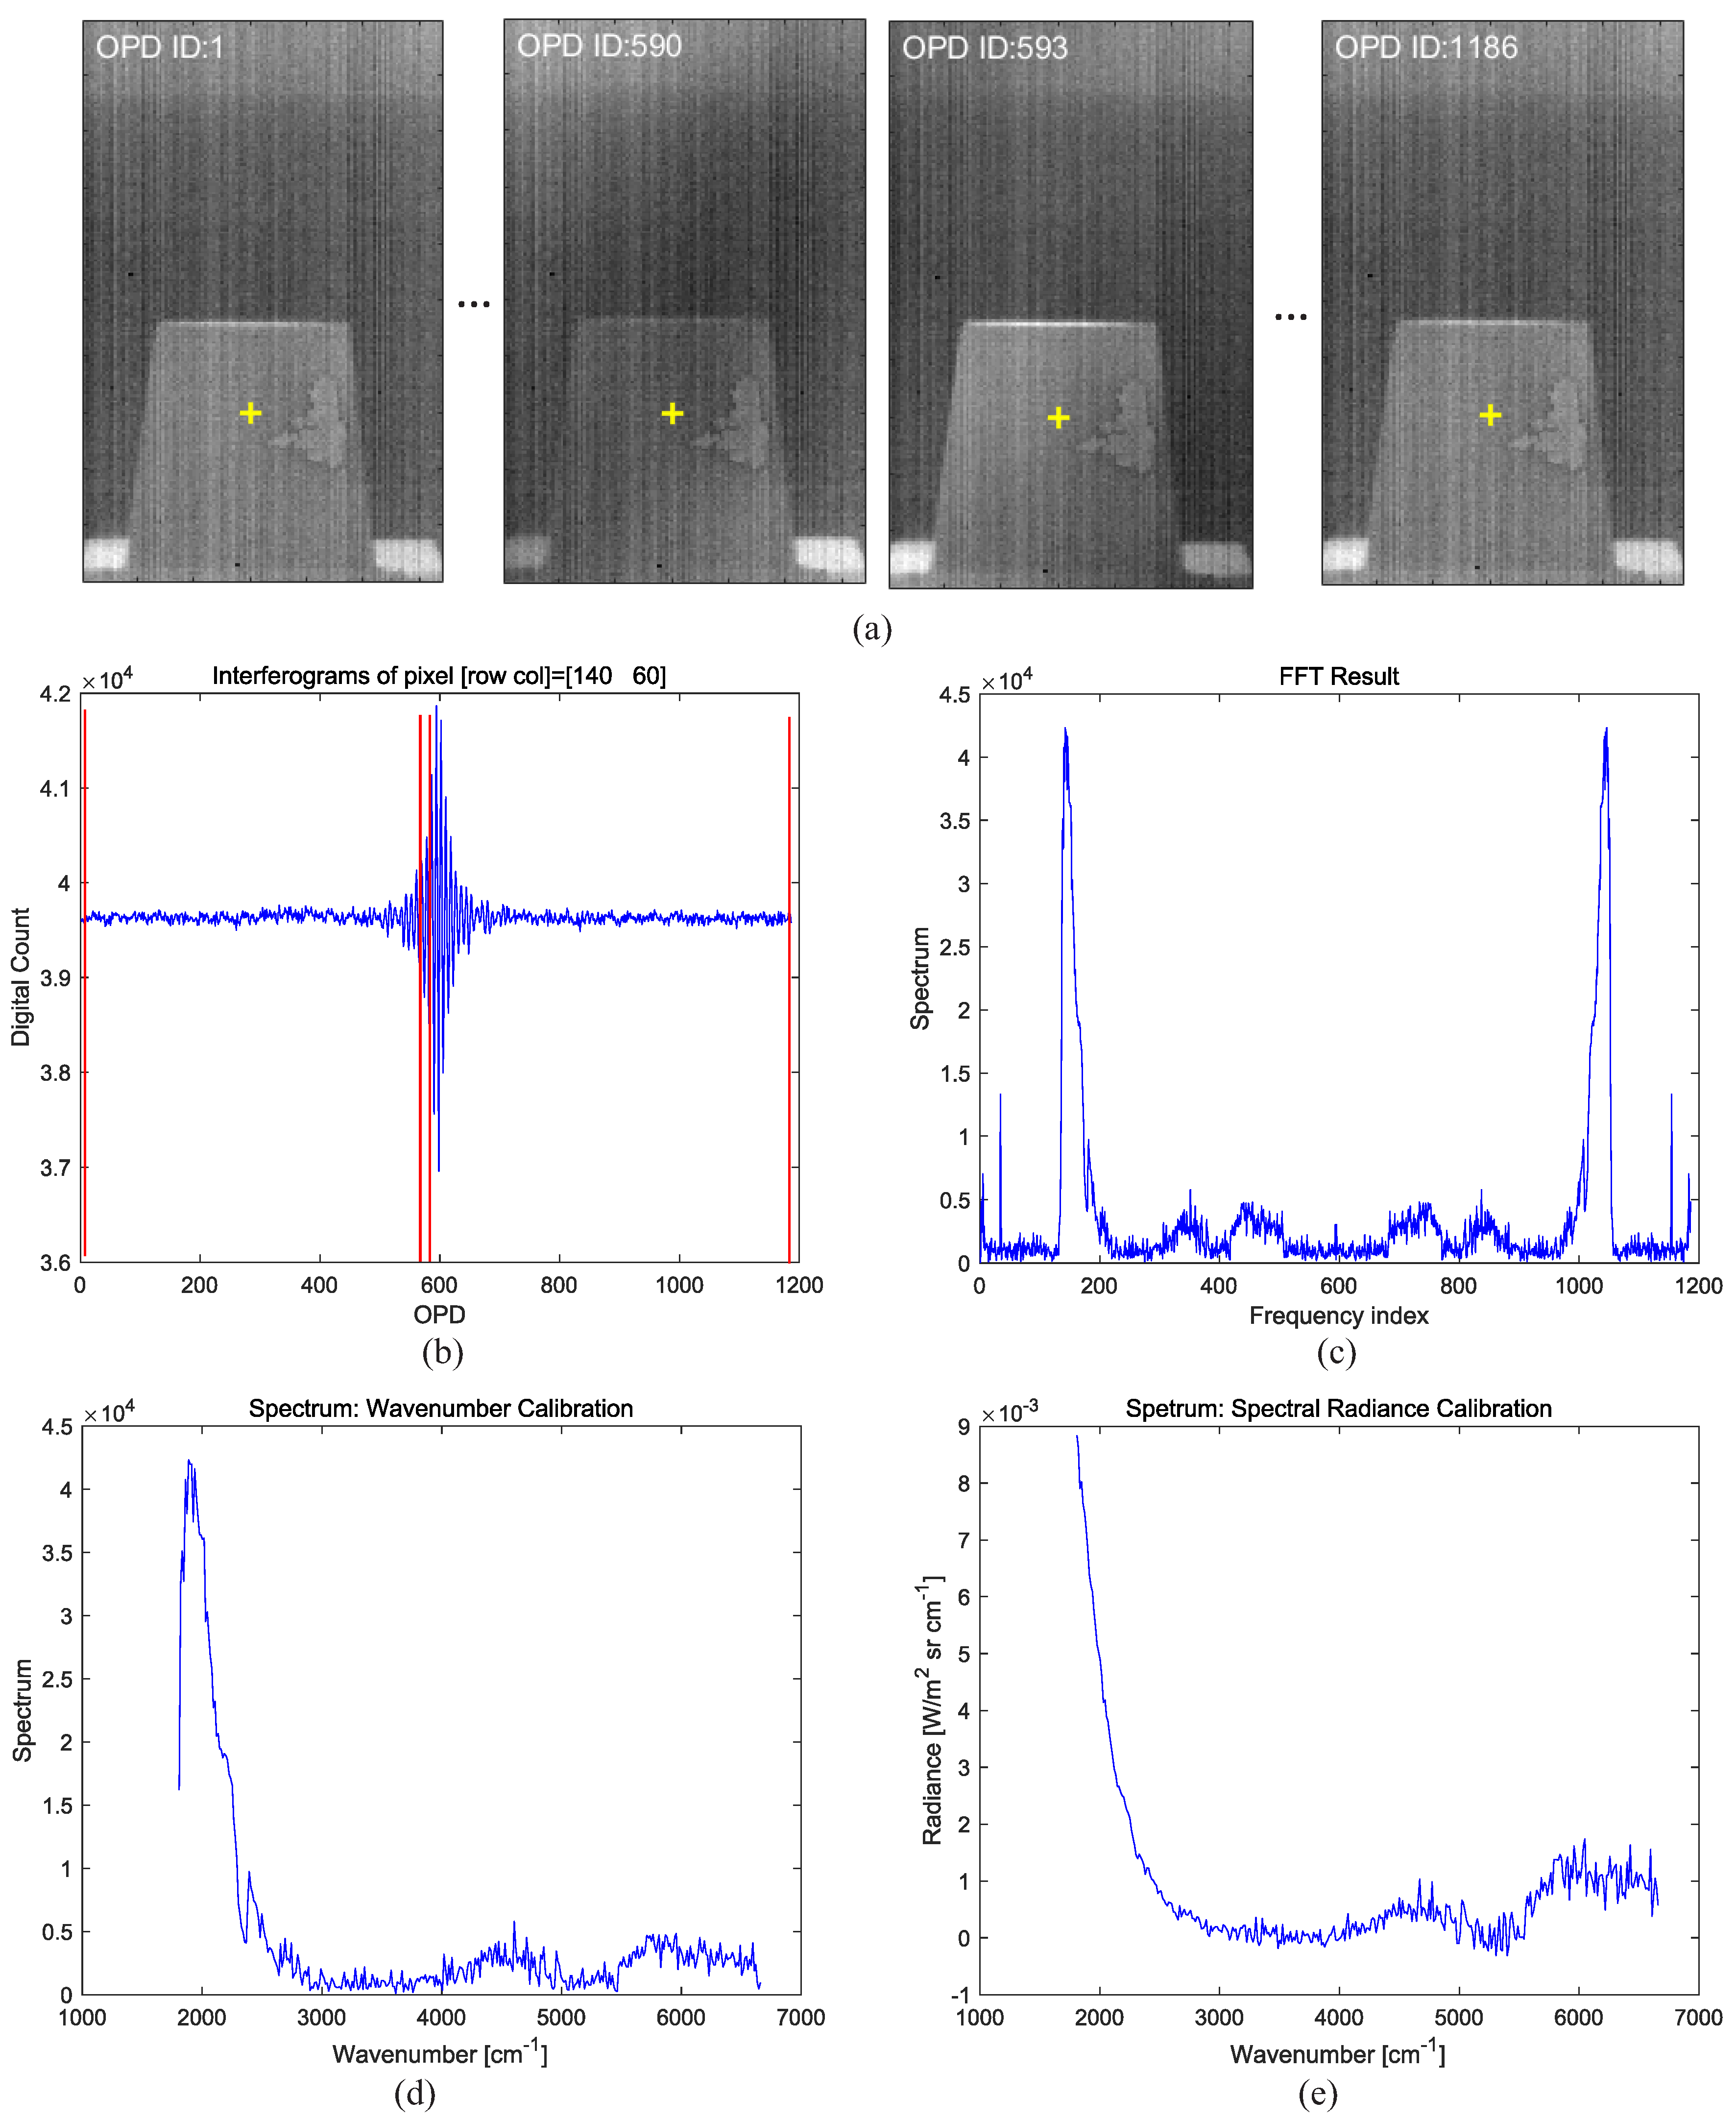
3.2. FTIR-Based Hyperspectral Image Acquisition System

The apparent spectral radiance ( L T a p ( λ ) ) is the core measurement information used in the AS-CRI calculation. A passive open path Michelson interferometer can be adopted for outdoor remote sensing applications [30]. Figure 8 presents the mechanism of a passive open path Michelson interferometer to acquire the interferogram. The focusing mirror of the Michelson interferometer receives an input radiation from a remote target. The collimated beam is divided into two paths through the beam splitter. Two beams reflected from the fixed mirror and moving mirror are recombined [31]. Two mirrors can make a path difference after the beams reflect off the mirrors. The recombined two beams generate an interference pattern (interferogram) that is recorded in the detector (InSb).
Figure 9a presents sample interferogram images at various optical path difference (OPD) indices, such as ID = 1, 590, 593 (zero path difference), 1186. Figure 9b gives an example of the whole interferogram at a pixel (140, 60). The red lines indicate the OPD IDs used in Figure 9a. Figure 9c shows the results of spectrum extraction by applying the FFT to the interferogram (Figure 9b). The unit of the y-axis in Figure 9c is just the spectral intensity in arbitrary units. Figure 9d shows the wavenumber [cm 1 ]-calibrated spectrum using the Nyquist sampling theorem and HeNe laser with λ = 632.8 nm. Figure 9e presents the finally estimated spectral radiance [W/(m 2 · sr · cm 1 )] at the same pixel calibrated using the hot/cold blackbody and Planck’s law.
The TELOPS FTIR system provides the spectral radiance in wavenumber units ([W/(m 2 sr cm 1 )]). For physical interpretation and analysis, however, it is useful to use the wavelength unit [ μ m] instead of the wavenumber unit [cm 1 ]. Figure 10 presents the probing scene points (sky, sea, target in Figure 10a) in the image and acquired spectral profiles in terms of the wavenumber unit (Figure 10b) and wavelength unit (Figure 10c). If k denotes the wavenumber [cm 1 ] with k = 1 / λ , the unit conversion can be derived as Equation (9) using the integral of the spectral radiance.
λ 1 λ 2 L λ ( λ ) d λ = 1 / λ 1 1 / λ 2 L λ ( 1 / k ) d k k 2 = k 2 k 1 L λ ( 1 / k ) k 2 d k = k 2 k 1 L k ( k ) d k
The final conversion form is L λ ( λ ) = k 2 L k ( k ) because the two terms should be equal in the integral. For example, if L k ( k ) = 0.00264877 [W/(m 2 sr cm 1 )], where k = 2081 cm 1 , then L λ ( λ ) = 1.1471 [W/(m 2 sr μ m)] because L λ ( λ ) = k 2 L k ( k ) = 0.00264877 [W/(m 2 sr cm 1 )] × (2081 cm 1 ) 2 × 1 m/(10 6 μ m). Figure 10b,c present the unit conversion of the spectral radiance for the sky, sea, and target pixels, as indicated in Figure 10a. Please note that there is strong atmospheric absorption of the sky pixel in the short wavelength band (1.5–1.8 μ m) due to water vapor.
Figure 11a presents the calculated AS-Radiance ( L T a p ( λ 1 , λ 2 ) ) by applying Equation (8) to the measured apparent spectral radiance ( L T a p ( λ ) ) for every spectral band. Figure 11b shows the AS-Radiant Intensity ( I T a p ( λ 1 , λ 2 ) ) using Equation (6), which multiplies the area ( A T ) by the AS-Radiance.
The area ( A T ) of a remote target is difficult to estimate. On the other hand, target area can be estimated by a geometrical interpretation if the distance between the target and sensor is available, as shown in Figure 12.
Assume that l denotes a physical length corresponding to IFOV. D is the target distance; θ is IFOV; f is the focal length, and N is the number of target pixels. The final target area can be calculated using Equations (10) and (11). For example, if θ = 3.25 × 10 4 [rad], D = 78 [m], N = 5446 , then l = 0.0254 [m] and A T = 3.5 [m 2 ] .
l = 2 ( D · t a n θ 2 )
a r e a = N · l 2
The proposed AS-CRI can provide several roles depending on the application. If the spectral range is defined as λ 1 = λ C Δ λ / 2 , λ 2 = λ C + Δ λ / 2 , where λ C B with a fixed Δ λ , then Equation (5) can be used to evaluate the apparent CRI variations according to the time of day, weather, and season. The band range, B, is defined as [1.5 μ m, 5.5 μ m].
The optimal spectral band for target detection can be obtained by modifying Equations (5)–(12) by applying the maximum operation to the AS-CRI function.
[ λ ^ 1 λ ^ 2 ] = max λ 1 , λ 2 B s . t . λ 1 < λ 2 Δ I T B a p ( λ 1 , λ 2 )
Similarly, the optimal spectral band for target stealth can be obtained by modifying Equations (5)–(13) by applying the minimum operation to the AS-CRI function.
[ λ ^ 1 λ ^ 2 ] = min λ 1 , λ 2 B s . t . λ 1 < λ 2 Δ I T B a p ( λ 1 , λ 2 )
Please note that the unit of AS-Radiant Intensity is [W/sr]. Figure 11c shows the AS-CRI ( Δ I T B a p ( λ 1 , λ 2 ) ) between the target-sky and target-sea by applying Equation (5). The AS-CRI profile can provide important information on the signal-background contrast according to the spectral band. For example, the short waveband (1.5–1.8 μ m) shows high negative signal-background contrast between the target and sky, as shown in Figure 13a. If the band of 2.8–3.3 μ m is selected, almost no contrast (0 AS-CRI) is obtained; Figure 13b shows the corresponding band image. On the other hand, the midwave band (4.7–5.1 μ m) shows a high positive AS-CRI, as shown in Figure 13c. Please note that the target is bright and the background (sky, sea) is black, which leads to high contrast.

4. Experimental Results

4.1. Acquisition of Hyperspectral IR Database

Figure 14 shows the developed software platform to display the acquired hyperspectral IR data in terms of the spectral image at a specific band, spectral profile at a selected point (’+’), and broadband image with a selected spectral range. The band range can be adjusted for broadband image generation. The brightness temperature and radiance can be calculated using the adjustable ROI and band range in Figure 14(right). The spectral unit can be either the wavelength ( μ m) or wavenumber (cm 1 ) by unit selection.
The total number of valid hyperspectral images of plate-D was 234, where each image provides a 128 × 200 × 374 ( w i d t h × h e i g h t × b a n d s ) hypercube. In addition, and AWS recorded the environmental weather information, such as the date, time, plate ID, wind speed, maximum wind speed, wind direction, maximum wind direction, air temperature, ground temperature, humidity, air pressure, visibility, current, solar LW Radiation, and LW Temperature, including 5 target surface temperatures (TD1, TD2, TD3, TD4, and TD5), and inner temperatures (TD6 and TD7) measured by thermocouples, as shown in Table 1. Figure 15 summarizes the monthly database size with sample broadband images, including the atmospheric temperature and humidity. Note the wide variations of the target and background (sky and sea) according to the different weather conditions with qualitative analysis.
The probe region consisted of three regions, sky, sea, and target, as shown in Figure 16, to reduce the noise effect. Each hypercube region contained 10 × 10 pixels and 100 spectral bands, which were averaged for each band and used to calculate the region-specific AS-Radiance.

4.2. Evaluation of AS-CRI

In the first experiment, the AS-CRIs of the target-sky and target-sea were extracted according to the wavelength by applying Equation (5) to all 234 hypercubes. Figure 17a presents the calculated AS-Radiant Intensity for the target, sky, and sea regions. In the short wavelength band, the sky region showed the highest AS-Radiant Intensity followed in order by the sea and target regions. On the other hand, the target region showed the highest AS-Radiant Intensity in 4–5.5 μ m. Figure 17b shows the final AS-CRIs by subtracting the background (sky, sea) AS-Radiant Intensities from the target AS-Radiant Intensity. The AS-CRIs of the target-sky and target-sea showed negative values in 1.5–2.5 μ m; the former showed stronger negative contrast than the latter. The AS-CRI of the target-sea showed a positive contrast from 3.5 μ m and that of the target-sky showed positive contrast from 3.85 μ m.
The experimental stealth band was extracted by applying Equation (13) to the AS-CRI, as shown in Figure 17b. Although the stealth band could be selected at 0 AS-CRI, actual stealth was selected by applying thresholding (0.002 [W/sr]) considering the measurement noise. Table 2 lists the stealth band found for the target-sky and target-sea. Figure 18 presents the stealth bands and corresponding representative band images. The stealth bands shown in Figure 18b is strongly correlated with the atmospheric transmittance bands, as shown in Figure 18a, which leads to no signal-to-background contrast in the images. The atmospheric transmittance was obtained from the web-based MODTRAN (http://modtran.spectral.com) with the following parameters: atmospheric model, mid-latitude summer; ground temperature, 294.2 K; aerosol model, rural; visibility, 15 km. Therefore, similar to a stealth object in SWIR or MWIR cameras, no targets can be detected, if the targets are coated with a special material that radiates only these bands.
The experimental maximum AS-CRI band was extracted by applying Equation (12) to the total 234 AS-CRIs by an exhaustive search of the starting wavelength ( λ s ) and ending wavelength ( λ s ), as shown in Figure 19(top). The indicated circles represent the maximum points of the band ranges for the target-sky and target-sea regions. The estimated maximum band of AS-CRI for the target-sky is [3.8636 μ m 5.5313 μ m] and that of the AS-CRI for the target-sea is [3.1903 μ m 5.5313 μ m]. Please note that the spectral ranges found are the positive parts in Figure 17b. Figure 19(bottom) shows the maximum broad band using the band ranges found. Note the high contrast between the target and background. Therefore, targets can be more detectable using MWIR cameras with the determined band integration.
In the second experiment, the daily AS-CRI was extracted using the maximum AS-CRI band (3.8–5.5 μ m) obtained in the previous experiment to evaluate the daily/monthly/seasonal variations. Figure 20 presents the AS-CRI(3.8,5.5) trend according to different measurement dates starting from 2017.12.27 to 2018.08.31 with a fixed observation time (11:00). As shown in Figure 20a, the AS-Radiant Intensity(3.8,5.5) of the target, sky, and sea increased according to the seasonal observations (winter, spring, and summer). The AS-CRI(3.8,5.5) showed similar behavior as the seasons changed (Figure 20b). In contrast, the AS-CRI(3.8,5.5) showed low values on rainy days, such as 2018.03.26 and 2018.05.30. Figure 20c,d shows the daily air temperature and relative humidity. The AS-CRI strength in summer is five times higher than that in winter.
The effects of the measurement time for AS-CRI(3.8,5.5) were compared, as shown in Figure 21. The AS-CRI showed a high value with time (11:00 < 14:00 < 16:00) because of the integral effects of solar energy radiation (See the 20180723 data). On the other hand, the ranking of AS-CRI values changed to 11:00 < 16:00 < 14:00 when it was cloudy or rainy (see the 20180326 data), as shown in Figure 22. In addition, the AS-CRI variation range per day increased when it was sunny (low humidity) and the temperature was high. Such phenomena were similar for both target-sky and target-sea, as shown in Figure 21. The AS-CRI of Target-Sea was relatively low compared to that of target-sky in winter because the sea is warmer than the sky in winter.

4.3. Comparison of CRI and AS-CRI

Until now, the properties of AS-CRI were experimented and analyzed in terms of the signature variations and band selection for stealth and detection purposes. This subsection focuses on the target-background contrast depending on the conventional CRI and proposed AS-CRI metric. The baseline CRI uses infrared images generated by integrating the whole spectral bands in a FLIR camera (ex. T620) [16]. The proposed AS-CRI uses infrared images generated by integrating the specific spectral bands (3.8636 μ m–5.5313 μ m), which were obtained through the maximum of the AS-CRI metric. As shown in Figure 6a, the theoretical CRI at the sensor point view is almost impossible to estimate because of the unknown emissivity and transmittance. In this test, the broadband image (entire band) of FTIR is used for the baseline CRI.
Figure 23 compares the results from the baseline method (CRI) and proposed method (AS-CRI) in terms of the target-sky contrast according to different days and seasons. The AS-CRI metric showed higher signal-background contrast than the base line method. The average of the proposed target-background radiant intensity was 1.4414 [W/sr] and that of the baseline target-background radiant intensity were −5.4524 [W/sr]. The indicated arrows show the partial images used to calculate the target-background radiant intensity. Note the bright target image with very low intensity in the sky background.
The comparison was conducted in a real-world environment by measuring a ship on the sea surface, as shown in Figure 24. The image (Figure 24a) used in the baseline CRI showed strong clutter in the sea and sky background. On the other hand, the image (Figure 24b) used in the proposed AS-CRI showed suppressed background clutter, which leads to higher target-background contrast radiant intensity. The target-sky contrast of the AS-CRI was 4.8 times higher than that of the baseline method (CRI).

4.4. Application to Small Target Detection

The infrared image quality generated by the maximum AS-CRI measure can be analyzed by combining existing infrared small target detection methods such as, [21,22,32,33]. The combination of the local contrast feature and the global uniqueness of the small targets can improve the detection of small targets with low signal-to-noise ratios [22]. The local steering kernel can be used to encode the infrared image patch for poor quality images [32]. Remote targets can also be detected by extracting moving parts from infrared remote sensing images [33]. Although these recent approaches are excellent detectors, this paper adopted the background subtraction and signal-to-clutter optimization method to validate the effects of AS-CRI on the target detection problem [21].
Figure 25 presents the small target detection results, including the experimental environment (Figure 25a), detection flows of the baseline method (CRI-based image, Figure 25b), and that of the proposed method (AS-CRI metric-based image, Figure 25c). The small targets were detected by the consecutive processes of the background estimation, subtraction of the background from the input image, double window filter to reduce noise, and thresholding. Please note that the small target was detected successfully in the image obtained using the proposed AS-CRI metric-based method. Figure 26 shows another small target detection result by comparing the baseline CRI and AS-CRI metric-based infrared images. Please note that the proposed AS-CRI metric can enhance the small target detection capability by providing higher signal-to-background contrast images.

5. Conclusions and Discussions

The CRI is an important radiometric measure in various signal processing applications, particularly infrared target detection. On the other hand, it is impractical to measure the CRI using a blackbody for distant targets. In addition, the sensed signal changes considerably according to the unknown spectral target emissivity and time-varying atmospheric transmittance. The most critical issue is what spectral band should be used for reliable target detection or stealth applications. This paper proposed a novel AS-CRI( λ s , λ e ) measure to solve these problems. The Michelson interferometry-based FTIR (TELOPS-HYPERCAM-MWE) system can acquire the apparent spectral radiance, which can reflect the spectral target emissivity, atmospheric transmittance, and path radiance. The AS-Radiant Intensity was calculated using the given spectral range and the AS-CRI was finally acquired by multiplying the target area by the AS-Radiant Intensity. A huge infrared hyperspectral database was constructed by measuring a specific target on a coastal environment three times a day (11:00H, 14:00H, and 16:00H) from January to August. The proposed measure could identify the stealth bands by minimizing the AS-CRI( λ s , λ e ). Furthermore, it could find the optimal band for target detection by maximizing the AS-CRI( λ s , λ e ). Finally, the AS-CRI trend was evaluated by applying the optimal AS-CRI band to the huge database constructed. The AS-CRI method was combined with a small infrared target detection method to validate the utility of the novel metric. Broadband infrared images generated by the optimal bands of AS-CRI showed higher signal-to-background contrast than the baseline images used in the conventional CRI. The small target detection method found true targets accurately with reduced false alarms in AS-CRI-based images compared to the baseline CRI images. In the future, the analyzed AS-CRI values will be used to predict the target detection range with different types of stealth paints.

Supplementary Materials

Supplementary File 1

Author Contributions

The contributions were distributed between authors as follows: S.K. wrote the text of the manuscript and programmed the hyperspectral AS-CRI method. J.K., J.L. and J.A. provided the midwave infrared hyperspectral database, operational scenario, performed the in-depth discussion of the related literature, and confirmed the accuracy experiments that are exclusive to this paper.

Funding

This research was funded by ADD grant number UE171 04GD, 2018 Yeungnam University Research Grants, the NRF (NRF-2018R1D1A3B07049069) and the APC was funded by NRF.

Acknowledgments

This study was supported by the Agency for Defense Development (UE171 04GD). This research was supported by the 2018 Yeungnam University Research Grants. This research was also supported by Basic Science Research Program through the National Research Foundation of Korea (NRF) funded by the Ministry of Education (NRF-2018R1D1A3B07049069).

Conflicts of Interest

The authors declare no conflict of interest.

References

  1. Kim, S.; Sun, S.G.; Kim, K.T. Analysis of Infrared Signature Variation and Robust Filter-Based Supersonic Target Detection. Sci. World J. 2014, 2014, 140930. [Google Scholar] [CrossRef] [PubMed]
  2. Romand, F.; Vialatte, A.; Croizé, L.; Payan, S.; Barthélémy, M. CO2 Thermal Infrared Signature Following a Sprite Event in the Mesosphere. J. Geophys. Res. Space Phys. Banner 2018, 123, 8039–8059. [Google Scholar] [CrossRef]
  3. Huang, W.; Ji, H. Effect of environmental radiation on the long-wave infrared signature of cruise aircraft. Aerosp. Sci. Technol. 2016, 56, 125–134. [Google Scholar] [CrossRef]
  4. Piñeros, M.F.; Ritchie, E.A.; Tyo, J.S. Estimating Tropical Cyclone Intensity from Infrared Image Data. Weather Forecast. 2011, 26, 690–698. [Google Scholar] [CrossRef]
  5. Wang, W.; Li, S.; Wang, Q.Z.N. Infrared radiation signature of exhaust plume from solid propellants with different energy characteristics. Chin. J. Aeronaut. 2013, 26, 594–600. [Google Scholar] [CrossRef] [Green Version]
  6. Soldani, F. Infrared signature: Theory and example of practical measurement methods. In Proceedings of the 2015 IEEE Metrology for Aerospace (MetroAeroSpace), Benevento, Italy, 4–5 June 2015; pp. 472–478. [Google Scholar]
  7. Moghimi, M.J.; Lin, G.; Jiang, H. Broadband and Ultrathin Infrared Stealth Sheets. Adv. Eng. Mater. 2018, 20, 1800038. [Google Scholar] [CrossRef]
  8. Kim, S. High-Speed Incoming Infrared Target Detection by Fusion of Spatial and Temporal Detectors. Sensors 2015, 15, 7267–7293. [Google Scholar] [CrossRef] [PubMed] [Green Version]
  9. Kim, S.; Kim, J.; Lee, J.; Ahn, J. Midwave FTIR-Based Remote Surface Temperature Estimation Using a Deep Convolutional Neural Network in a Dynamic Weather Environment. Micromachines 2018, 9, 495. [Google Scholar] [CrossRef] [PubMed]
  10. Jacobs, P.A. Thermal Infrared Characterization of Ground Targets and Backgrounds, 2nd ed.; SPIE Optical Engineering Press: Bellingham, WA, USA, 2004. [Google Scholar]
  11. Neele, F. Infrared ship signature analysis and optimisation. Proc. SPIE 2014, 5811, 188–198. [Google Scholar]
  12. del P. Marrugo Llorente, S.; Diaz, V.; Gómez Torres, J.M. Infrared Signature Analysis of Surface Ships. Ship Sci. Technol. 2015, 8, 57–68. [Google Scholar]
  13. Mahulikar, S.P.; Rao, G.A.; Sonawane, H.R.; Prasad, H.S.S. Infrared Signature Studies of Aircraft and Helicopters. PIERS Proc. 2009, 27, 26–30. [Google Scholar]
  14. Kim, D.G.; Park, S.J.; Choi, J.H.; Ahn, J.M.; Kim, T.K. An estimation method for radiation contrast via the inverse distance weighting. J. Mech. Sci. Technol. 2015, 29, 2529–2533. [Google Scholar] [CrossRef]
  15. Chen, C.; Dai, M.; Liu, H.; Fang, G.; Xie, C.; Zhang, T. Comparison and analysis on test methods of infrared radiant intensity of infrared decoy. Proc. SPIE 2014, 9300, 93000K-1. [Google Scholar]
  16. Han, K.I.; Kim, D.H.; Choi, J.H.; Kim, T.K. Development of an inverse distance weighted active infrared stealth scheme using the repulsive particle swarm optimization algorithm. Appl. Opt. 2018, 57, 3072–3077. [Google Scholar] [CrossRef] [PubMed]
  17. Longmire, M.S.; Takken, E.H. LMS and matched digital filters for optical clutter suppression. Appl. Opt. 2003, 27, 1141–1159. [Google Scholar] [CrossRef] [PubMed]
  18. Soni, T.; Zeidler, J.R.; Ku, W.H. Performance Evaluation of 2-D Adaptive Prediction Filters for Detection of Small Objects in Image Data. IEEE Trans. Image Process. 1993, 2, 327–340. [Google Scholar] [CrossRef]
  19. Sang, H.; Shen, X.; Chen, C. Architecture of a configurable 2-D adaptive filter used for small object detection and digital image processing. Opt. Eng. 2003, 48, 2182–2189. [Google Scholar] [CrossRef]
  20. Kim, S. Double Layered-Background Removal Filter for Detecting Small Infrared Targets in Heterogenous Backgrounds. J. Infrared Milli. Terahertz Waves 2011, 32, 79–101. [Google Scholar] [CrossRef]
  21. Kim, S.; Lee, J. Scale invariant small target detection by optimizing signal-to-clutter ratio in heterogeneous background for infrared search and track. Pattern Recognit. 2012, 45, 393–406. [Google Scholar] [CrossRef]
  22. Xia, C.; Li, X.; Zhao, L. Infrared small target detection via modified random walks. Remote Sens. 2018, 10, 2004. [Google Scholar] [CrossRef]
  23. Tonooka, H. Accurate atmospheric correction of ASTER thermal infrared imagery using the WVS method. IEEE Trans. Geosci. Remote Sens. 2005, 43, 2778–2792. [Google Scholar] [CrossRef]
  24. Hook, S.; Gabell, A.; Green, A.; Kealy, P. A comparison of techniques for extracting emissivity information from thermal infrared data for geologic studies. Remote Sens. Environ. 1992, 42, 123–135. [Google Scholar] [CrossRef]
  25. Plesa, C.; Ţurcanu, D.; Bodoc, V. The use of infrared radiation for thermal signatures determination of ground targets. Rom. J. Phys. 2006, 51, 63–72. [Google Scholar]
  26. Adler-Golden, S.M.; Conforti, P.; Gagnon, M.; Tremblay, P.; Chamberland, M. Long-wave infrared surface reflectance spectra retrieved from Telops Hyper-Cam imagery. Proc. SPIE 2014, 9088, 90880U. [Google Scholar]
  27. Espen, S.; Trygve, H.L.; Kjell, W. SIMVEX 2001 Trial—Radiant Intensity Contrast. AFRL Tech. Rep. 2002, FFI/RAPPORT-2002/02568, 1–131. [Google Scholar]
  28. Vaitekunas, D.A. Validation of ShipIR (v3.2): Methodology and results. Proc. SPIE 2006, 6239, 62390K. [Google Scholar]
  29. Kuenzer, C.; Dech, S. Thermal Infrared Remote Sensing: Sensors, Methods, Applications, 1st ed.; Springer: Berlin, Germany, 2013. [Google Scholar]
  30. Beil, A.; Daum, R.; Matz, G.; Harig, R. Remote sensing of atmospheric pollution by passive FTIR spectrometry. Proc. SPIE 1998, 3493, 32–43. [Google Scholar] [Green Version]
  31. Roy, S.A. Data Processing Pipelines Tailored for Imaging Fourier-Transform Spectrometers. Ph.D. Thesis, Université Laval Québec, Québec, QC, Canada, 2008. [Google Scholar]
  32. Li, Y.; Zhang, Y. Robust infrared small target detection using local steering kernel reconstruction. Pattern Recognit. 2018, 77, 113–125. [Google Scholar] [CrossRef]
  33. Oishi, Y.; Oguma, H.; Tamura, A.; Nakamura, R.; Matsunaga, T. Animal detection using thermal images and its required observation conditions. Remote Sens. 2018, 10, 1050. [Google Scholar] [CrossRef]
Figure 1. Operational concept of thermal signature measurement using the passive open path Fourier transform infrared (FTIR) imaging system.
Remotesensing 11 00777 g001
Figure 2. Details of the controlled field measurement system using a chimney target and FTIR camera in sea/sky background environment.
Remotesensing 11 00777 g002
Figure 3. Specifications of the TELOPS Hyper-Cam MWE sensor.
Remotesensing 11 00777 g003
Figure 4. Basic diagram of IR sensing flow.
Remotesensing 11 00777 g004
Figure 5. CRI estimation process using the target and background temperature at target point of view.
Remotesensing 11 00777 g005
Figure 6. Comparison of the conventional CRI and proposed AS-CRI calculation flow at sensor point of view: (a) Baseline CRI flow, (b) proposed AS-CRI flow.
Remotesensing 11 00777 g006
Figure 7. Proposed AS-CRI calculation flow.
Remotesensing 11 00777 g007
Figure 8. Basic diagram of a Michelson interferometer for passive open path applications.
Remotesensing 11 00777 g008
Figure 9. Spectral radiance extraction: (a) interferogram images at various OPD indices: ID = 1, 590, 593 (zero pass difference), 1186, (b) interferogram at a pixel ([row, col] = [140, 60]) where red lines indicate the OPD IDs used in (a), (c) FFT results, (d) wavenumber calibration result, and (e) spectral radiance calibration result.
Remotesensing 11 00777 g009
Figure 10. Profiles of the measured spectral radiance data: (a) Three probing points (sky, sea, and target) and corresponding spectral radiances in (b) wavenumber unit ([W/(m 2 , sr, μ m)]), and (c) wavelength unit.
Remotesensing 11 00777 g010
Figure 11. AS-CRI extraction flow: (a) AS-Radiance, (b) AS-Radiant Intensity, and (c) AS-CRI.
Remotesensing 11 00777 g011
Figure 12. Target area calculation using (b) the physical length/pixel corresponding IFOV of a pixel and the number of pixels in (a).
Remotesensing 11 00777 g012
Figure 13. Selected band images depending on the AS-CRI values: (a) negative AS-CRI (1.5–1.8 μ m), (b) 0 AS-CRI (2.8–3.3 μ m), and (c) positive AS-CRI (4.7–5.1 μ m).
Remotesensing 11 00777 g013
Figure 14. Infrared hyperspectral data acquisition software platform.
Remotesensing 11 00777 g014
Figure 15. Acquired monthly database size with sample broadband image examples with temperature and humidity information.
Remotesensing 11 00777 g015
Figure 16. Locations of the sky, sea, and target probe regions to extract the representative spectral radiance.
Remotesensing 11 00777 g016
Figure 17. Average AS-CRI of the measured spectral radiance over all measurements: (a) AS-Radiant Intensities for target, sky, and sea region, (b) calculated AS-CRIs from AS-Radiant Intensities.
Remotesensing 11 00777 g017
Figure 18. Visualization of stealth bands of AS-CRI for target-sky and target-sea: (a) atmospheric transmittance using the MODTRAN, (b) stealth bands and corresponding examples of a specific spectral band image measured on 12 April 2018, 11:00 (temperature: 12.8°, humidity: 75%).
Remotesensing 11 00777 g018
Figure 19. (a) AS-CRI graph by varying spectral integeral range (starting wavelength, ending wavelength) for maximum AS-CRI search, (b) corresponding broad band images using the optimal spectral band ranges for target-sea, (c) for target-sky.
Remotesensing 11 00777 g019
Figure 20. AS-CRI(3.8,5.5) trend according to different measurement dates with a fixed observation time (11:00): (a) AS-Radiant Intensity(3.8,5.5) of the target, sky, and sea, (b) AS-CRI(3.8,5.5) of target-sky and target-sea, (c) air temperature, and (d) relative humidity.
Remotesensing 11 00777 g020
Figure 21. Comparative analysis of daily AS-CRI according to the measurement time (11:00, 14:00, 16:00): (a) AS-CRI for the target-sky, (b) AS-CRI for the target-sea.
Remotesensing 11 00777 g021
Figure 22. Comparative examples of weather effect on AS-CRI: (a) rainy weather (26 March 2018, 14:00), (b) clear weather (25 April 2018, 14:00).
Remotesensing 11 00777 g022
Figure 23. Comparison of the baseline method (CRI) [16] and proposed method (AS-CRI) in target-sky contrast intensity calculation.
Remotesensing 11 00777 g023
Figure 24. Comparative examples of ship signature: (a) the baseline method (CRI) [16], (b) proposed method (AS-CRI).
Remotesensing 11 00777 g024
Figure 25. Application to small target detection example 1: (a) remote ship target image (CCD), (b) target detection flow and result using the baseline CRI measure-based infrared image, (c) target detection flow and result using the AS-CRI measure-based infrared image.
Remotesensing 11 00777 g025
Figure 26. Application to small target detection example 2: (a) remote ship target image (CCD), (b) target detection flow and result using the baseline CRI measure-based infrared image, (c) target detection flow and result using the AS-CRI measure-based infrared image.
Remotesensing 11 00777 g026
Table 1. Environmental measurement information: Date, time, plate ID, wind speed, maximum wind speed, average wind direction, maximum wind direction, air temperature, ground temperature, humidity, pressure, visibility, current, solar radiance, LW radiance, LW temperature, and seven plate temperature sensors (TD3 is located at the plate center).
Date
dd/mm/yy
TimePlateSpeedMaxSpeedDirMaxDirAirTempGndTempHumPressVisibilityCurrentSolarLWRadTempTD1TD2TD3TD4TD5TD6TD7
201712271107412.2163174−1.2−0.1391030.6200000473.7200.42.1−0.3−0.3−0.60.0−1.00.1−0.1
20171227135742.64139169−0.63.3361028.7200000485.6203.52.80.30.50.51.20.41.50.9
20171227155642.43.8133112−0.54.6451028.6200000213.2209.92.51.71.71.82.61.33.73.8
20171228111640.81.43123260.80.0571029.8186230113.2296.06.1−0.6−0.9−1.00.0−1.5−0.3−0.6
20171228140240.6134834920.0541027.7171300171.5289.78.30.00.40.10.70.11.00.5
20171228155940.40.81181122.53.1561026.51271120128.2231.98.01.51.61.62.21.43.13.2
20180102112640.91.92552642.30.6741028.181370167.7293.97.93.33.53.53.03.43.43.7
20180102145842.43.11441522.55.1421027.1200000156.0260.05.53.43.53.54.53.44.14.3
20180102161441.72.21882081.94.0451027.6200000104.3226.95.02.62.62.73.62.53.63.7
20180103110343.55.61681860.90.0531031.1200000502.1214.33.60.60.60.71.40.51.11.3
20180103135941.94.21782310.57.8531029.5200000510.7203.13.31.61.71.72.11.52.52.1
20180103160341.64.21991860.76.1531029.3200000256.6214.43.62.12.32.43.12.33.43.8
201801041101423.1138152−1.10.0551027.7200000340.8223.43.2−0.2−0.1−0.10.7−0.20.00.2
20180104140641.93.6143135−0.54.2511024.4200000288.9256.52.31.21.41.52.41.21.81.9
20180104160042.33.4147124−1.52.9521024.620000097.1256.81.5−0.7−0.5−0.50.3−0.7−0.30.0
201801081111411.4113542.44.6771011.5597910165.2299.18.64.74.94.75.74.84.74.6
20180108140241.1220394.67.0541007.8200000437.5244.510.86.76.96.67.56.87.26.8
20180108161044.46.830393.94.2711007.69303013.5315.65.24.04.04.15.03.94.04.3
201801091104434.6337354−0.21.3661014.21900724513.1238.43.62.01.81.62.61.41.71.6
20180109140242.26.13839−0.14.1701013.02000085249.6237.92.51.21.31.21.71.01.41.3
20180109160741.64.93352140.33.9651013.22000024200.2241.43.02.62.62.72.92.53.33.5
20180110111241.83.5160225−4.30.8881017.115125056.6294.2−1.0−2.6−2.6−2.4−1.7−2.9−2.4−2.1
20180110140042.87225225−3.80.8821016.567690165.9281.1−0.9−1.3−1.4−0.9−0.1−1.2−0.9−0.8
20180110155844.78.7231259−4.80.8791017.81680079.0279.2−2.6−3.5−3.4−3.2−2.4−3.5−3.3−2.9
20180115110041.62.72522087.78.2671024.376700406.4242.413.78.68.68.59.38.49.59.4
20180115135742.94.81711808.513.1521022.137610391.8234.811.29.79.89.910.79.811.810.7
201801151558422.81561748.511.4481021.447010221.7235.311.911.411.411.612.610.913.713.5
201801161059400.41411585.75.1751018.03367090.0311.612.66.46.56.67.56.46.46.5
20180116135840.50.71571586.66.7741014.82931053.0320.712.07.77.87.88.77.68.08.0
2018011615594001802195.96.1841014.92259021.7323.113.26.76.76.67.66.56.97.0
20180118105941.52.81831694.65.5711022.760090194.4276.97.85.45.55.66.55.55.45.7
20180118140041.82.41591864.97.8681022.053980335.5262.38.86.16.16.27.16.06.56.5
20180118155841.42.21591413.77.3661022.559510111.5270.56.94.74.74.65.64.65.35.3
20180726110141.11.843026.937.1881007.2114670461.1441.036.232.532.932.434.332.733.332.2
20180726140041.72.31135427.750.2861006.2843310874.0438.537.636.236.335.337.835.837.636.4
20180726160341.01.4457328.449.7841005.3104380607.2424.140.337.737.836.238.236.940.336.7
20180731110043.33.7535130.750.4691003.5200000864.0429.238.935.235.734.7−210−210−210−210
20180731140042.64.814315234.757.1481002.4200000893.0434.438.636.837.037.3−210−210−210−210
20180731160042.43.616918632.453.5531001.7200000634.2431.039.540.240.139.7−210−210−210−210
20180801110041.42.5111733.751.4621001.8126680844.0439.445.837.537.836.838.137.138.737.6
20180801143144.06.417119735.356.7511000.9200000829.0437.239.738.338.538.739.538.340.740.3
20180801160043.04.517121935.053.1491000.8200000647.9431.939.138.438.538.639.638.440.740.1
20180802110241.92.593429.050.0751004.8139670835.0428.040.035.035.834.535.934.836.435.0
20180802140342.23.316822534.357.3541003.8200000877.0441.740.738.639.238.839.838.740.942.5
20180802160041.22.51075133.253.3541003.4200000598.7438.342.840.741.140.842.040.743.942.6
20180807110041.72.322030.149.7771006.6101140819.0431.742.036.537.035.837.436.137.835.9
20180807140042.43.610312432.257.0621005.4182600882.0434.640.338.438.738.939.938.640.742.1
20180807160042.64.310413531.253.2651004.4200000624.5429.939.438.638.938.340.538.641.440.7
Table 2. Obtained stealth band information.
AS-CRITarget-SkyTarget-Sea
Stealth band [ μ m]1.8048–2.01271.8048–1.9564
2.0022–2.01272.0022
2.4802–3.15102.4802–3.6964
3.1771–3.3722-
3.8443–3.8636-
4.2014–4.31944.2014–4.3194

