Article

Translating Fire Impacts in Southwestern Amazonia into Economic Costs

by
Wesley A. Campanharo
1,*,
Aline P. Lopes
1,
Liana O. Anderson
2,
Thiago F. M. R. da Silva
3 and
Luiz E. O. C. Aragão
1,4
1
National Institute for Space Research, Remote Sensing Division, Av. dos Astronautas, n1758, São José dos Campos, SP CEP: 12227-010, Brazil
2
National Center for Monitoring and Early Warning of Natural Disasters – Cemaden, Technological Park of São José dos Campos, Dr. Altino Bondensan Road, n500, São José dos Campos, SP CEP: 12247-016, Brazil
3
Federal University of ABC – Center for Engineering, Modeling, and Applied Social Sciences, Alameda da Universidade – Bairro Anchieta, São Bernardo do Campo, SP CEP: 09606-045, Brazil
4
College of Life and Environmental Sciences Amory Building, University of Exeter, Rennes Drive, Exeter EX4 4RJ, UK
*
Author to whom correspondence should be addressed.
Remote Sens. 2019, 11(7), 764; https://doi.org/10.3390/rs11070764
Submission received: 2 March 2019 / Revised: 25 March 2019 / Accepted: 26 March 2019 / Published: 29 March 2019
(This article belongs to the Special Issue Remote Sensing of Wildfire)

Abstract

:
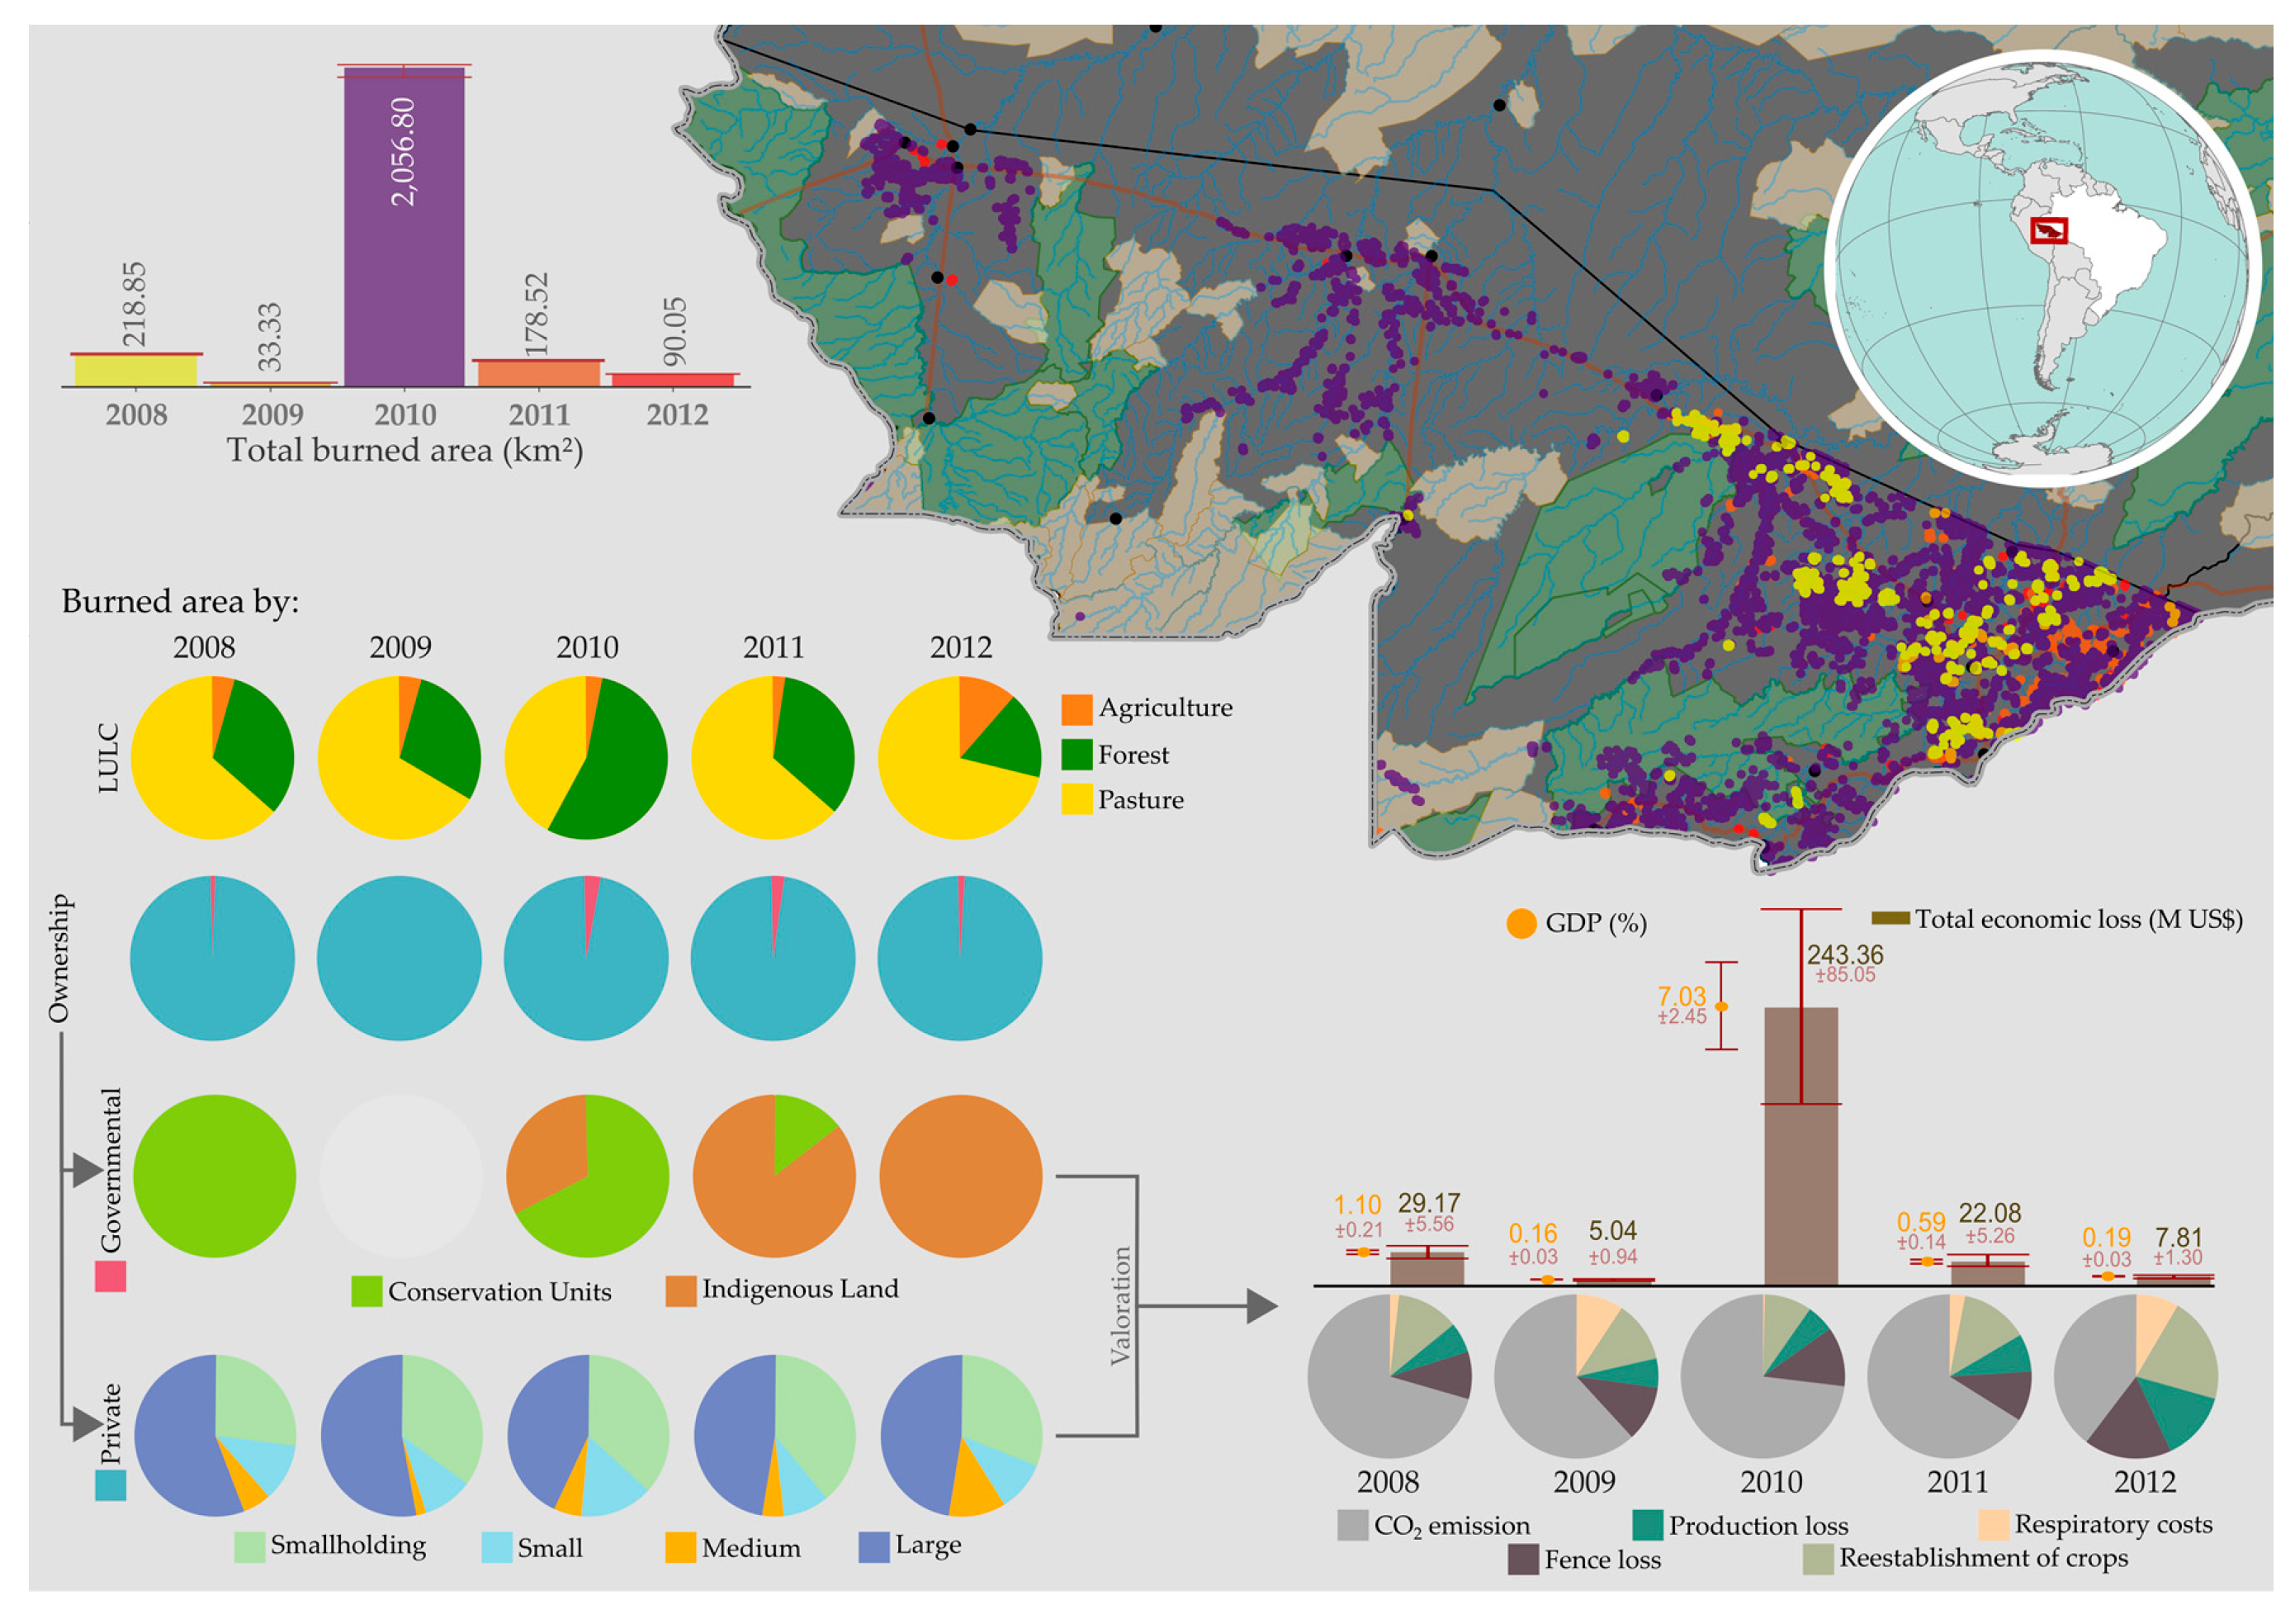
Between 1998 and 2017, climate-related disasters represented 91% of all occurrences worldwide, causing approximately US$ 2.245 billion of direct economic losses. In the Amazon region, fire is used as a widely spread technique for land clearing, agricultural management, hunting, and religious rituals. However, over the past 20 years, severe droughts caused a major amplification of fire occurrences, leading to several socioeconomic and environmental impacts. Particularly in Acre state, located in the southwestern Brazilian Amazon, the occurrence of extensive fires, associated with extreme climatic events, has been reported since 2005. However, fire dynamics, land tenure relationships, and associated impacts are poorly quantified. In this study, we aim to investigate the following: (1) The spatiotemporal variability of fire dynamics during anomalously dry and regular climate conditions; (2) the attribution of fire occurrence and land tenure relationship, and (3) the environmental, social, and economic impacts caused by fires and its consequences for Acre’s economy. We analyzed information on the spatial patterns of fire, its direct impacts on land use and land cover, carbon stocks, CO2 emissions, the indirect impact on human illness, and finally the costs of these impacts from 2008 to 2012. During the studied period, burned areas were concentrated around the major cities and roads, forming polygons up to 0.6 km2. However, in 2010, an extremely dry year, fires spread to remote areas, impacting protected private areas and sustainable-use conservation areas. In 2010, the total area affected by forest fires was approximately 16 times greater than in meteorologically normal years. The total economic loss estimated in 2010 was around US$ 243.36 ± 85.05 million and for the entire period, US$ 307.46 ± 85.41 million. These values represent 7.03 ± 2.45% and 9.07 ± 2.46% of Acre’s gross domestic product (GDP), respectively.

Graphical Abstract

1. Introduction

Fire-dependent ecosystems, such as the Brazilian Cerrado and the African Savannah, evolved in the presence of periodic or episodic fires and depend on them for maintaining their ecological processes [1]. However, in the Amazon, natural fires are rare in the absence of humans and fire’s presence can be an indicator of human activity [2,3]. The use of fires in this region is a usual agricultural practice for farmers, for both clearing new areas and preparing productive lands [4,5], to increase the soil fertility and the amount of organic carbon in a short period [6,7], and to prevent massive fires by reducing fire fuels [8]. Additionally, fire is part of the culture of many indigenous and traditional communities, and is used for hunting and religious rituals as well [9,10].
Over the past 20 years, severe droughts were reported in the Amazon [11,12] and major wildfires were associated with them [13,14,15,16]. Usually, the severe droughts are caused by one or a combination of climatic phenomenon, such as the El Niño-Southern Oscillation (ENSO), the Atlantic Multidecadal Oscillation (AMO), and warming of the Tropical North Atlantic (TNA), where the environmental conditions, characterized by high temperatures and low air humidity, are more suitable for the rapid spread of fires [11,12].
Moreover, many studies suggest an increase in drought frequencies in the Amazon [17] with a collateral increase of fires in forests adjacent to anthropic areas [18]. As a consequence, burnings can escape and escalate into wildfires, causing several environmental and socioeconomic losses [12,19,20,21,22,23]. With that, this phenomena may have a greater environmental change potential than the drought event itself [12,13,14].
The State of Acre, located in the southwestern flank of the Brazilian Amazon, has suffered from the high frequency of extreme climatic events since 2005 [11,24,25] and more recently in 2016 and 2017 [26]. In the first two decades of the 21st century, socioeconomic impacts, caused by such events, have been particularly critical in Acre, especially in relation to the direct and indirect impacts of wildfires [19,27,28]. Brown et al. [28], for instance, estimated that during the 2005 drought, more than 400 thousand people were affected by fire-related air pollution and over 300 thousand hectares of forests burned, with direct losses surpassing US$ 50 million and approximately US$100 million in economic, social, and environmental losses [27].
As a consequence of the 2005 drought, Acre’s authorities created a temporary Situation Room to effectively monitor forest fires and gather meteorological data for fire risk analysis, aiming to assist the placement of fire-fighting crews in the field [27]. In 2013, after many extreme events such as floods, droughts, and wildfires, the Situation Unit of Hydrometeorological Monitoring was permanently established under the Secretariat of the Environment of Acre, for following purposes: Monitoring critical hydrologic events, supporting prevention actions to cope with extreme events, gathering information about critical events, and managing platforms for collecting and integrating pluvial and fluviometric data [29].
Additionally, in the last decade, Acre State established environmental policies for reducing deforestation, designing mechanisms of payments for environmental services, and creating new governmental and non-governmental sectors to directly deal with solutions for mitigating disasters in the region. All these policies are aligned with the Sendai Framework, of which Brazil has been a signatory country since 2015. This framework includes measures to reduce direct economic losses due to disasters, as well as the establishment of techniques for assessing losses associated with economic, social, environmental, and cultural heritage [30]. Nevertheless, information on economic losses from disasters remains critically lacking for entities and governmental institutions, especially in countries under development. The United Nations Office for Disaster Risk Reduction (UNISDR, 2018) [31] showed that only 37% of all disasters cataloged between 1998 to 2017 had estimated economic losses, suggesting that the direct costs of the majority of disasters (63%) worldwide are unknown or not well documented.
Techniques for valuing disaster-related environmental and socioeconomic costs have a great and critical role in public policies. These techniques are essential for characterizing the magnitude of the problem and for supporting regional development models [5]. Moreover, information on costs can facilitate the communication of the value of nature or any affected good to different people using a unique language that unites political and economic visions [32]. Finally, this type of analysis can provide a legal basis for managing natural resources, assessing damage, and developing mechanisms for environmental compensation [33].
It is clear that quantitative information about the impact of wildfires on ecosystems and humans is mandatory for supporting the development of strategies and public policies for the prevention of disasters and related impact assessment. Therefore, in this study, our objective is to investigate the spatiotemporal pattern of fires, their attribution regarding fire occurrence and land tenure, and the environmental, social, and economic impacts of fire in Acre state. More specifically, this study aims to answer the following: (1) What are the spatiotemporal variabilities of fires during anomalously dry years and years with regular climatic conditions? (2) Who are the actors, in terms of land tenure, to which fire occurrence can be attributed to? and (3) What is the potential magnitude of the environmental, social, and economic impact caused by fires and their consequences for Acre’s economy?
In this study, we go beyond the analysis of ecological impacts on natural resources to show that, during droughts, the increase in fire events, in comparison to normal climatological years, raises the annual estimated cost related to infrastructure damages, production losses, CO2 emissions, and respiratory morbidities around 15-fold. This estimate represents 7.03 ± 2.45% of Acre’s gross domestic product (GDP). The observed increment in costs was driven by the spatially extensive impact of fires on forests, which enhanced gross carbon emission from biomass burning and its associated costs to society.

2. Materials and Methods

2.1. Study Area

Acre state has an area of approximately 164,124 km2 [34] and is located in the southwest flank of the Brazilian Amazon, with borders with Peru and Bolivia (Figure A1). Approximately 68,000 km2 (41%) of its territory is covered by conservation units, including indigenous areas. Approximately 12% of its total area was deforested until 2010 [35], concentrated in Acre’s southeastern region, around urban centers, and along the state’s road network, especially BR-364, BR-317, and AC-40. Although deforestation rates decreased between 2004 and 2010, forest clearing and burning for agricultural activities are still the major agents of regional landscape transformation [36].
The climate in this region is characterized, under the Köppen system, as tropical (A) with 30% of the state area in a tropical monsoon climate (Am), characterized by the compensation of the short dry season by large amounts of precipitation throughout the year. The other 70% of the state is classified as a tropical rainforest climate (Af), which is characterized by average precipitation of at least 60 mm in every month [37]. The rainy season occurs from October to April and the dry season between June and August, while May and September are characterized as transition months among these seasons [38].

2.2. Data

This study integrates different spatial data products (Table A1) and non-spatial datasets (Table A2). The spatially explicit information refers to georeferenced vector and raster data, while the non-spatial datasets are composed of tables and numerical values. All the data and products were gathered from open-source repositories and official government databases, journal articles, market research, and web-pages from governmental and non-governmental organizations. Details of each dataset are presented below.

2.2.1. Spatial Datasets

Maps containing burned area information from 2008 to 2012 were provided by the Tropical Ecosystems and Environmental Science Laboratory (TREES) at the Brazilian National Institute for Space Research (INPE). This dataset was generated following a well-established methodology [15,39,40,41]. These maps are derived from MODIS surface reflectance products collection 5, which were resampled to 250 m of spatial resolution and subsequently processed by applying a Spectral Mixture Analysis (SMA) with vegetation, soil, and shade endmembers [42]. Based on the shade fraction image, a region growth segmentation procedure was applied, followed by a manual post-classification edition [15]. The final maps display information on the yearly burned area, corresponding to the cumulative burned area occurring during the dry season of each year. The validation of this product at a significance level of 5%, exhibited an overall accuracy of 99.20% with a lower and upper confidence interval of 97.67% to 99.48%, respectively, for forest areas and an overall accuracy of 96.30%, with a lower and upper confidence interval of 92.88% to 98.55%, respectively, for non-forest areas [39].
For characterizing land use and land cover (LULC) in the region, we used maps provided by the TerraClass project [43] for the years 2008, 2010, and 2012. TerraClass is a project for monitoring LULC in the Brazilian Legal Amazon, providing 15 LULC types. To retrieve classes of LULC within the TerraClass project, an analysis of Landsat-5/TM images using SMA is performed, followed by a slicing procedure and visual interpretation. This analysis is supported by temporal information based on the normalized difference vegetation index (NDVI) product from MODIS (Moderate Resolution Imaging Spectroradiometer) and the mask of deforestation, forest, and hydrography from the PRODES project [44,45].
For this study, we aggregated the LULC thematic classes into the following three generalist categories: Forests, agriculture, and pastures (Table 1). The land cover class “Forests” refers to old-growth and secondary forests. The “Agriculture” class refers to annual crops, generally mechanized agriculture, and the mosaic of uses, which is a mix of agriculture and pastures. Finally, the land use class “Pastures” refers to areas where pastures dominate the landscape. Seven LULC thematic classes were not used in this research because their contribution in terms of area coverage in the Acre state territory was not representative (<1%).
Data on aboveground carbon density (ACD) was acquired from three datasets. First, for the Forest category, we assigned the respective value of the pantropical biomass map developed by Baccini et al. [46]. This product consists of a single raster map at 30-meter resolution, representing the ACD of live woody vegetation for the 2000–2009 decade, created based on field measurements, vegetation height maps from GLAS-Lidar (Geoscience Laser Altimeter System), a digital elevation model from SRTM (Shuttle Radar Topography Mission), and Landsat-7 ETM+ surface reflectance products.
Secondly, for the Agriculture category we identified maize and cassava as the main agricultural crops of Acre state, according to the Brazilian Institute of Geography and Statistics (IBGE) [47]. Due to the lack of regional reports, the maize values were based on dry biomass for the whole aerial part of plantations located in southern Brazil [48], added by the maize grain mean annual yield in the own state of Acre [49], estimated at 3.07 ± 0.72 Mg.ha−1. The cassava’s biomass was based on the aboveground dry biomass of plantations in central Brazil [50], estimated at 5.48 ± 0.43 Mg.ha−1. To convert these biomass values to ACD, we used a conversion factor of 0.4, as described by Redin [51]. This can be considered as a conservative value of C content in the vegetation biomass. These reference studies reported intensive and homogeneous plantations, with a certain degree of technology, like those indicated by the TerraClass annual crop category. Therefore, for the agriculture land cover class, we attributed the mean ACD value of 1.71 MgC.ha−1, calculated from the maize and cassava ACD, with a standard deviation of 0.17, estimated through the uncertainty propagation method (Equations (A2) and (A4)) [52].
Finally, for the Pasture category, we used an average value of 38.61 MgC.ha−1, with a standard deviation of 16.54, based on the sum of the total alive pools of aboveground wood biomass, grasses and herbaceous dicots, and the dead pools of fine litter and wood debris, found in three different pasture areas in the Brazilian states of Rondônia and Pará [53].
The final ACD map corresponds to the year 2008, with C values associated to each class, as follows: Forest, agriculture, and pasture, at each spatial location, as mapped by the TerraClass product for this same year.
The territorial information about land tenure was based on official data provided by the Brazilian government. We have integrated information from different databases, encompassing the following data: Rural private property boundaries, rural module specifications, protected private areas (Areas of Permanent Preservation, APPs, and Legal Reserves, LRs), and governmental protected areas (Conservation Units, CUs, and Indigenous Lands, ILs).
The boundaries of private rural properties and their respective APPs and LRs were obtained at the Rural Environmental Registry System (SICAR). These two kinds of protected areas are mandatory for all private property, according to the actual Brazilian Forest Code (FC, Federal Law no 12.651 of 2012) [54]. The LR is an area of native vegetation that must occupy at least 80% of the property area in the Amazonian biome, excluding the environmentally sensitive areas (e.g. riparian and hilltop zones), which are titled APPs [55].
We classified each private property according to the rural module (r.m.) specifications of each municipality. This classification was defined according to the Federal Law no 8.629 of 25 February 1993 [56], which classifies the properties in smallholdings (area ≤ 1 r.m.), small (1 < area ≤ 4 r.m.), medium (4 < area ≤ 15 r.m.), and large properties (area > 15 r.m.). The rural module size for the Acre State ranges from 70 to 100 ha per municipality and it was defined in 2013 by the National Institute for Settlement and Agrarian Reform (INCRA) [57].

2.2.2. Non-Spatial Datasets

Records of hospitalization cases caused by respiratory illness and the total cost of treatments are provided by the Brazilian Unified Health System (SUS). In its information system (Tabnet-DATASUS) [58], we searched for the number of hospitalization cases and the total economic cost according to the place of residence, filtered for respiratory system diseases and distinguished by municipality and year/month of occurrence.
Among all the costs related to infrastructure, we computed only the impacts on the property fences due to the unavailability of data on all other costs and, thus, the infrastructure damage costs due to fires can be considered underestimated. This information was obtained from the National Department of Transport Infrastructure (DNIT), which provides the reference costs to repair and reconstruct different kinds of fences. Thus, we calculated the mean price of all the kinds of build and repair, which were described by DNIT annual reports [59].
We assume that the cost related to land recovery was US$ 813.62 ha−1 for agriculture and US$ 883.27 ha−1 for pasture, both obtained by Townsend [60] for areas in the Brazilian Amazon region. The costs of forest restoration were not considered because such practice is not usual in the region.
The value of crop production was generated by multiplying the productivity values by their market price in each year. For maize and cassava production (Table A2), we used the values provided by the National Supply Company (CONAB) [61] and the Brazilian Institute of Geography and Statistics (IBGE) [47] systems. The mean productivity for 2008 to 2012 was 2.01 t.ha−1 for maize and 19.08 t.ha−1 for cassava. The mean cattle weight gain for 2009 was 60.09 kg.ha−1.y−1, a value based on a technical report of the Brazilian Agricultural Research Corporation (EMBRAPA) [62]. Market prices for those products were provided at an annual time-scale by the Center for Advanced Studies in Applied Economics (CEPEA) system [63]. These prices are presented in Table A2.
For forest-related losses, we only considered commercial wood stocks, due to the data availability. For this, we used the value of US$ 5 ha−1, quantified by De Mendonça et al. [4], which denotes the mean price of marketable adult trees after a fire event that the lumber mill would be willing to pay to the landowners in an exploited forest in Eastern Amazonia.
Carbon emission values were accounted by using the market prices of carbon available at the Carbon Emission Future system [64] between 2009 and 2012 (Table A2). As these prices were in Euros, we converted these values into US dollars using the exchange rates available from the Brazil Central Bank (BCB) system [65], shown in Table A2.

2.3. Data Analysis

In the next sections, we describe all the procedures that were carried out to reach our three research goals. We also present a section of assumptions and uncertainties of our data and analysis.

2.3.1. Quantifying the Spatiotemporal Variability of Fire Dynamics

To analyze the spatial dynamics of the burned areas, first we quantified the total burned areas by year, the wildfire frequency and recurrence, and the burned area anomalies. To understand how far the fire could start inside Acre’s territory, excluding common anthropic ignitions such as roads and urban centers, we built a grid of Euclidian distance from rivers and roads and then we determined the mean distance and standard deviation of burned areas by intersecting the fire scars and the Euclidian distance grid from these features.

2.3.2. Fire Occurrence and Land Tenure Relationship

An intersection between burned area and the spatial data of land tenure and LULC was carried out for determining the areas affected by fires. Then, the annual burned areas were stratified by each LULC class, land tenure and protected areas inside and outside private properties. The year of 2010 was excluded from the time-series mean average due to the anomalous drought that occurred during that year, leading to extensive fires [15].

2.3.3. Estimating the Environmental, Social, and Economic Impacts of Fires

The environmental impact is represented here by biomass loss and gross carbon emission by fire. It is quantified for each year, as shown in Figure 1. To determine the annual post-fire biomass loss, we first used the 2008 biomass map and then applied the relationship of biomass loss developed by Anderson et al. [15], which states that the remaining above-ground biomass after fire is a function of the above-ground biomass prior the fire event. Then, for the areas mapped as Agriculture and Pastures, the reference biomass values (1.71 and 38.61 MgC.ha−1, respectively) were attributed to the remaining biomass map in order to simulate their seasonal renewal, resulting in the following year biomass map. For 2010 and 2012, we not only updated the biomass values but also dynamically revised the spatial location of Agriculture and Pasture areas, according to the available LULC maps.
Finally, to quantify the total annual gross carbon emissions, we applied the CO2 gross emission model (Equation (1)) to the biomass loss maps (Figure 1b).
F CO 2 =   θ   ( 1 α ) j = 1 2   λ j x y Bi ( x , y , j ) A ( x , y )
where FCO2 is the carbon dioxide gross emission (Mg CO2) in the year of interest (immediate flux to the atmosphere); θ converts carbon to carbon dioxide (3.67); α is the slope of Anderson et al. [15] equation’s (α = 0.7084 ± 0.034); λj is the release constant specific for forest (j = 1, λ = 50%) and non-forest covers (j = 2, λ = 100%); Bi(x,y,j) is the pre-burn biomass (Mg C.ha−1) for the pixel at the location (x,y), distinguished for forest and non-forest covers (j); and A(x,y) is the burned area (ha) at the pixel (x,y), for which the value in our studies is 0.09 ha at burned pixels.
The health data, considered here as social impact, was determined by building a relationship between fire and respiratory morbidity in Acre state. We computed a linear correlation between the total burned area and the total cases of hospitalization by municipality and year. First, we summarized the total burned area by municipalities and aggregated the number of cases grouped in last semester, which includes the peak of the fire occurrence, in September. The dry season period was extended for three months in this analysis because not all health case manifests were registered at the same time as the fires.
We calculated five types of economic losses divided into two categories, directly and indirectly fire-related. The first direct cost is associated with infrastructure damages, for which we assume only fence losses. The second and third direct costs are the production losses, for which we considered costs related to crop reestablishment and affected future production. Finally, the quantified indirect costs were related to CO2 emissions and respiratory morbidities.
Fence losses were calculated using the land property boundaries over burned Pasture and Agricultural fields, then extracting these vector lengths. This analysis can be considered conservative since fences are also usually used to separate pasture from agriculture inside the same property. The wildfire factor was applied and then the total cost of the fence reconstruction and repair was calculated using the respective prices for each year (Table A2).
Production losses were estimated by multiplying the production and reestablishment coefficients for each class and their market prices for each year. Just for the Agriculture class, we assume that there was the same proportion of cassava and maize crops.
Not all burned areas in rural properties are intentional, but the main losses are caused when fires escape and accidentally spread to adjacent areas. For that reason, we considered the wildfire factor of 45%, estimated by De Mendonça et al. [4], to calculate the economic losses of infrastructure damages, crop reestablishment, and affected future production. This factor was estimated using an econometric model in the database from field research done by the Amazon Environmental Research Institute (IPAM). The database is related to an information set, acquired between 1994 and 1995, of 202 properties spread over five municipalities in the “Arco do Desmatamento” region, specifically at Paragominas, PA, Santana do Araguaia, PA, Alta Floresta, PA, Ariquemes, RO, and Rio Branco, AC.
To quantify the costs of CO2, we multiplied the total CO2 emissions by the market prices and exchange rates. So, we didn’t use the wildfire factor because the CO2 emission is independent of the fire aim.
To evaluate the illness costs, we assumed that a factor of only 8% of respiratory morbidities can be attributed to smoke from fires and wildfires, as shown by De Mendonça et al. [4], and then applied the respiratory morbidity costs for June to December.
Finally, we updated all values to the same year (2017), using the cumulative inflation rates (Table A2), available at the Brazilian Central Bank (BCB) [65] website using Equation (A1). All the economic costs in Brazilian currency (Reais) were converted to US dollars, using an average exchange value of 0.31 ± 0.01, which referred to the 2017 quotation given by the BCB [65].

2.3.4. Assumptions and Uncertainties

Assumptions were made in order to accommodate the limited data available with the method we developed. First, we assumed that (1) the TerraClass Agriculture and Mosaic of Uses classes cover all crops over the Acre state, ranging from mechanized to traditional agriculture; (2) the class Mosaic of Uses from TerraClass are a mix of agriculture and pasture of traditional agriculture, but it is reclassified in our analysis as Agriculture class as it is more representative of the landscape in these areas; (3) the delimitation of properties, APP and LR from Rural Environmental Registry (acronym CAR) have no remarkable spatial overlaps; and (4) the entire biomass loss is immediately combusted and released to the atmosphere, being accounted only in the period of one year, thus no decay rate or emissions from the decomposing pool were considered.
The CAR dataset is not used as official territorial delimitation due to overlaps between different properties, boundaries, and special areas, however, this dataset is the best spatially explicit public information on land tenure from the Brazilian Amazon.
The economic costs errors were estimated using the values and errors of the burned area, CO2 equivalent emission, asset prices, and dollar exchange, by applying the methods of uncertainty propagation to compute each category uncertainty, and the total economic uncertainty, through the multiplication method, according to Vuolo [52]. Details about the method are provided below.
For the burned area error, we used the lower and upper values of the confidence interval of each land cover class related to the TREES product to estimate the uncertainty of the burned area. Thus, we propagated each burned class error to the total burned area error using the sum method (Equation (A2)).
The biomass error was first calculated using a multiplication method of uncertainty propagation (Equation (A3)) to estimate the uncertainty of each class, and second, the sum method (Equation (A2)) quantified the total biomass loss uncertainty. We used the burned area, the burned area uncertainty, the biomass value, and a standard deviation of each class. To the Agriculture and Pasture classes, we used a standard deviation available in the consulted literature. For the Forest class, we calculated the total standard deviation, based on the uncertainty map provided by Baccini. Therefore, the total forest biomass uncertainty was the product of the uncertainty map and the biomass map, with a subsequent numeric scale correction (dividing each pixel value by 1000) and a spatial scale correction from unit per pixel to hectares (multiplying each pixel value by 0.09 ha). Finally, we used a sum method of uncertainty propagation (Equation (A2)) to estimate the total standard deviation of the Forest class biomass.
The CO2 emissions error followed the same principle of biomass error estimation, where the biomass total value, a biomass error, a CO2 equivalence conversion, and its error were used in a multiplication method of uncertainty (Equation (A3)), achieving the class error. This value was then applied to the sum method (Equation (A2)) to estimate the total CO2 equivalent emission error.

3. Results

3.1. Spatiotemporal Variability of Fire Dynamics

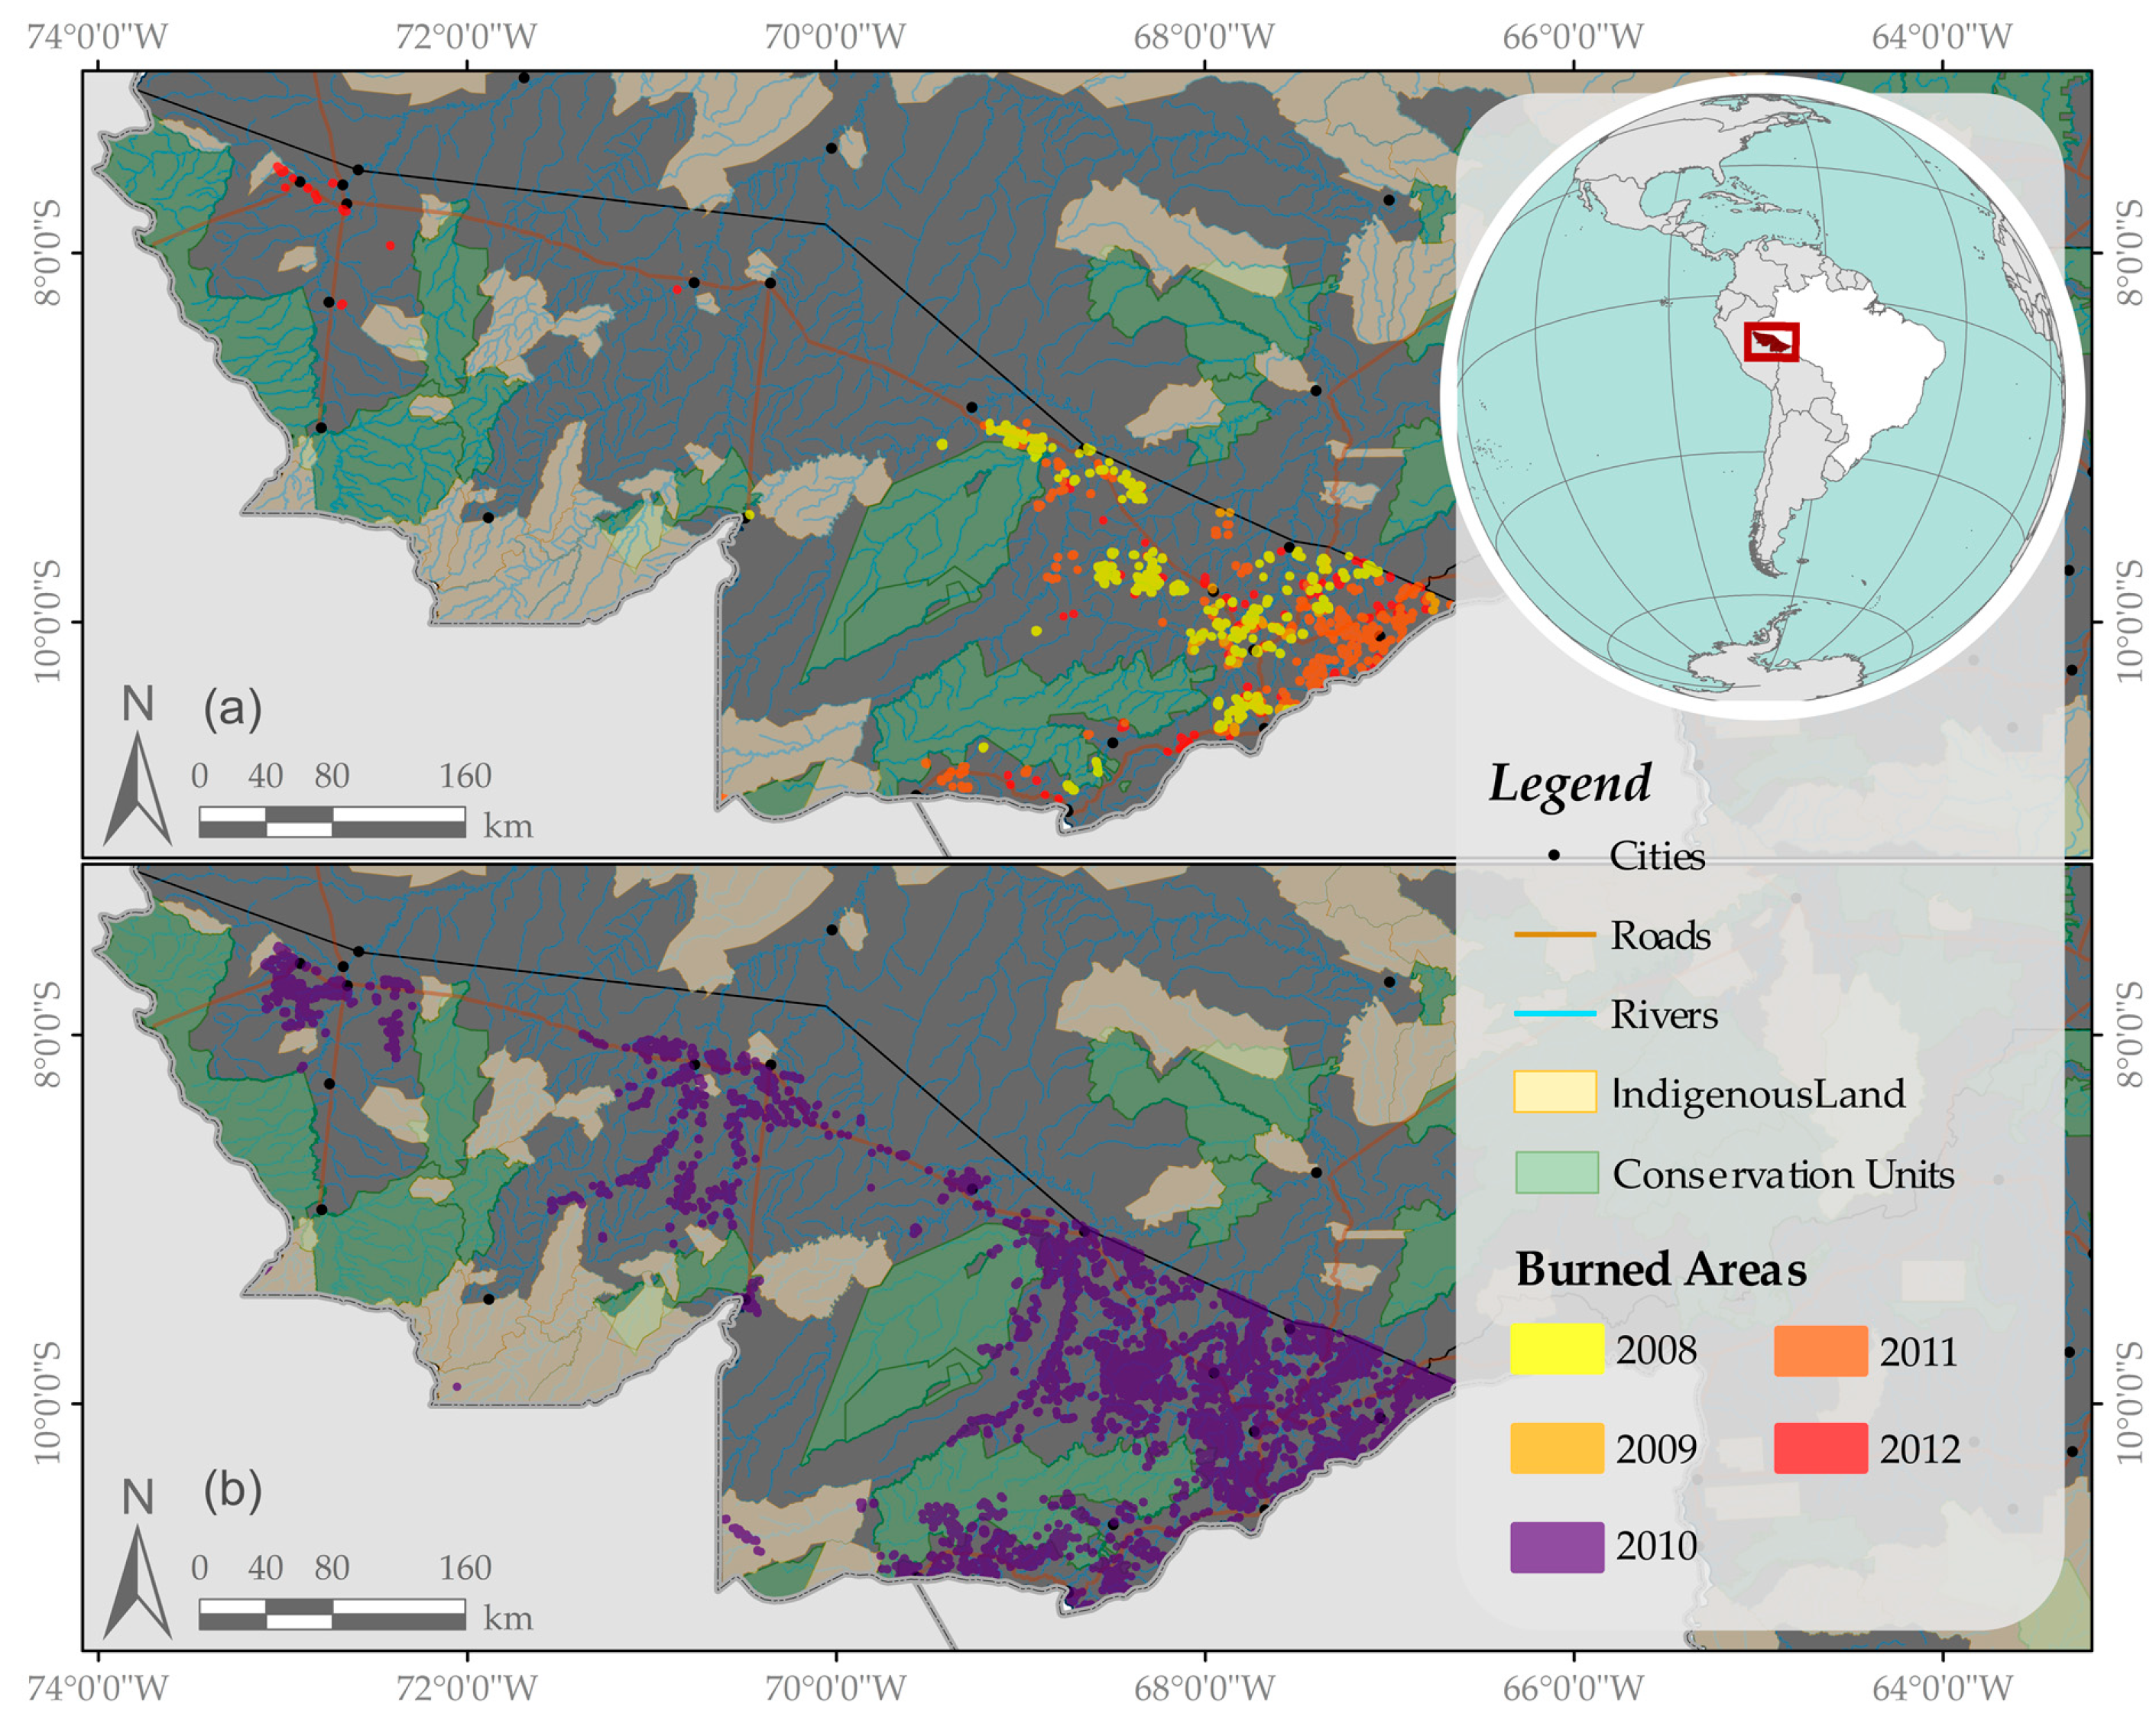
During all the analyzed years, more than 2577 km2 were burned. Of these, approximately 12% burned more than once and 3% occurred in following years, with a maximum three-year sequence (Table A3). Burning events in Acre (Figure 2) were concentrated near the major urban centers (Rio Branco, Cruzeiro do Sul, Sena Madureira, Tauaracá, Feijó, and Brasiléia), highways (BR-364, BR-317, AC-040, and AC-075) and waterways (Iaco, Muru, Acre, and Envira rivers).
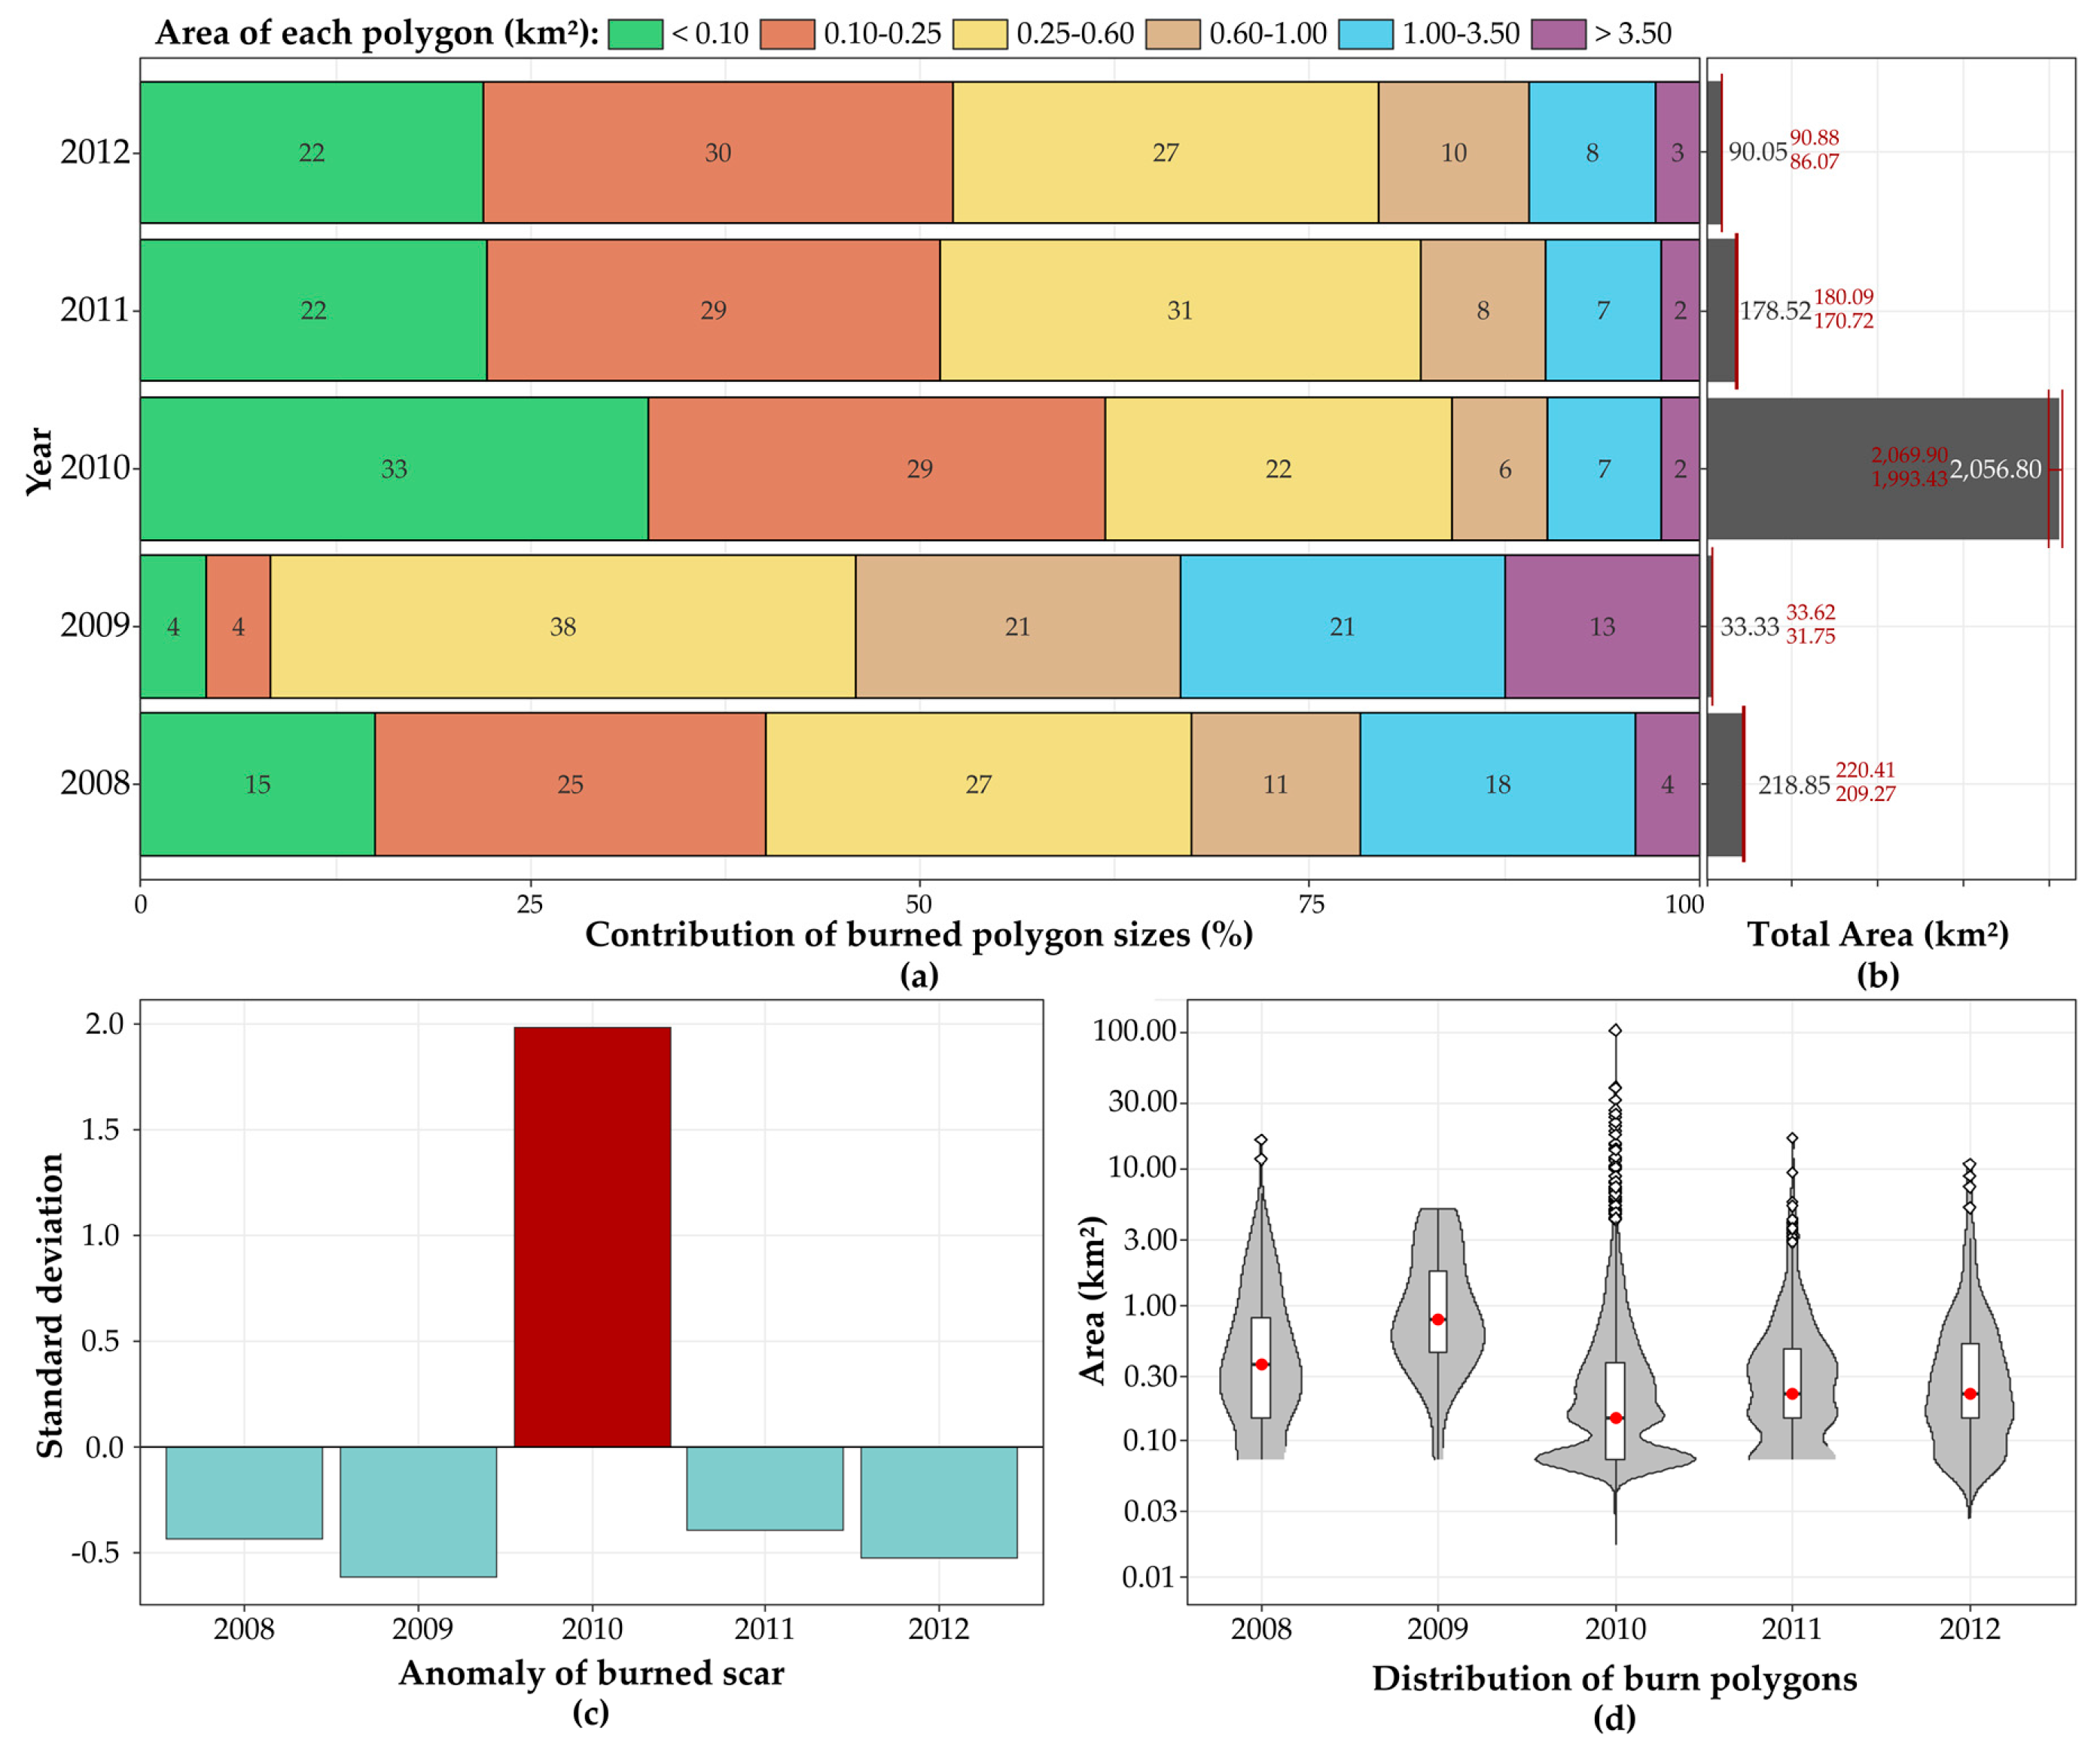
Every year new burn scars were mapped (Table A4). However, the number of polygons varied substantially (24–3521). Their size also had a large annual standard deviation (SD). The maximum SD reached 2.54 km2 in 2010, while the minimum SD of 1.28 km2 was recorded in 2011. In 2010 the highest number of polygons were observed (3521) and the largest total burned area (2056.8 km2) among all years analyzed was expressed, respectively, 19 times larger and 16 times higher than the mean of the other four years. The largest polygon observed in our time-series had more than 100 km2, which occurred in 2010, while, in any other year the largest burned polygon had an area of 16.90 km2.
Considering that Acre’s dry season (months with monthly rainfall < 100 mm) in 2010 extended by one month, totaling four months in this year, the 3521 observed burn scars (2056.8 km2) corresponded to around 29 burning events per day in the dry season, with an average of 16.85 ± 0.52 km2 each. During the three dry months of the regular climate year of 2012, conversely, only 146 burn scars (90 km2) were detected, corresponding to about 2 burning events per day in the dry season, with an average of 0.98 ± 0.04 km2 burned daily.
Analyzing the distance to roads (Table A5), we found that, in 2010, burn scars reached longer distances from the main highways (11.15 ± 9.67 km) than the average distance of other years (7.27 ± 6.52 km). These burned scars also occurred closer to the waterways in 2010 (1.49 ± 1.15 km) than during the other years (1.66 ± 1.13 km).
In all the analyzed years, there was a dominance of burned scars with areas up to 0.60 km2 (Figure 3a). However, in 2009 there was a significant change in the proportions of burned scar classes, where the larger polygons (>0.25 km2) stood out over small polygons (<0.25 km2).
In 2010, we observed the largest burned area (2056.80 km2) among all years analyzed, making this year anomalous in relation to the average burned area value (+2.39 SD, Table A4) and also to a number of burned scars (+1.99 SD, Figure 3b, and Table A4). Additionally, this year presented the larger number of outliers compared to the other years (Figure 3c and Table A4).

3.2. Fire Occurrence and Land Tenure Relationship

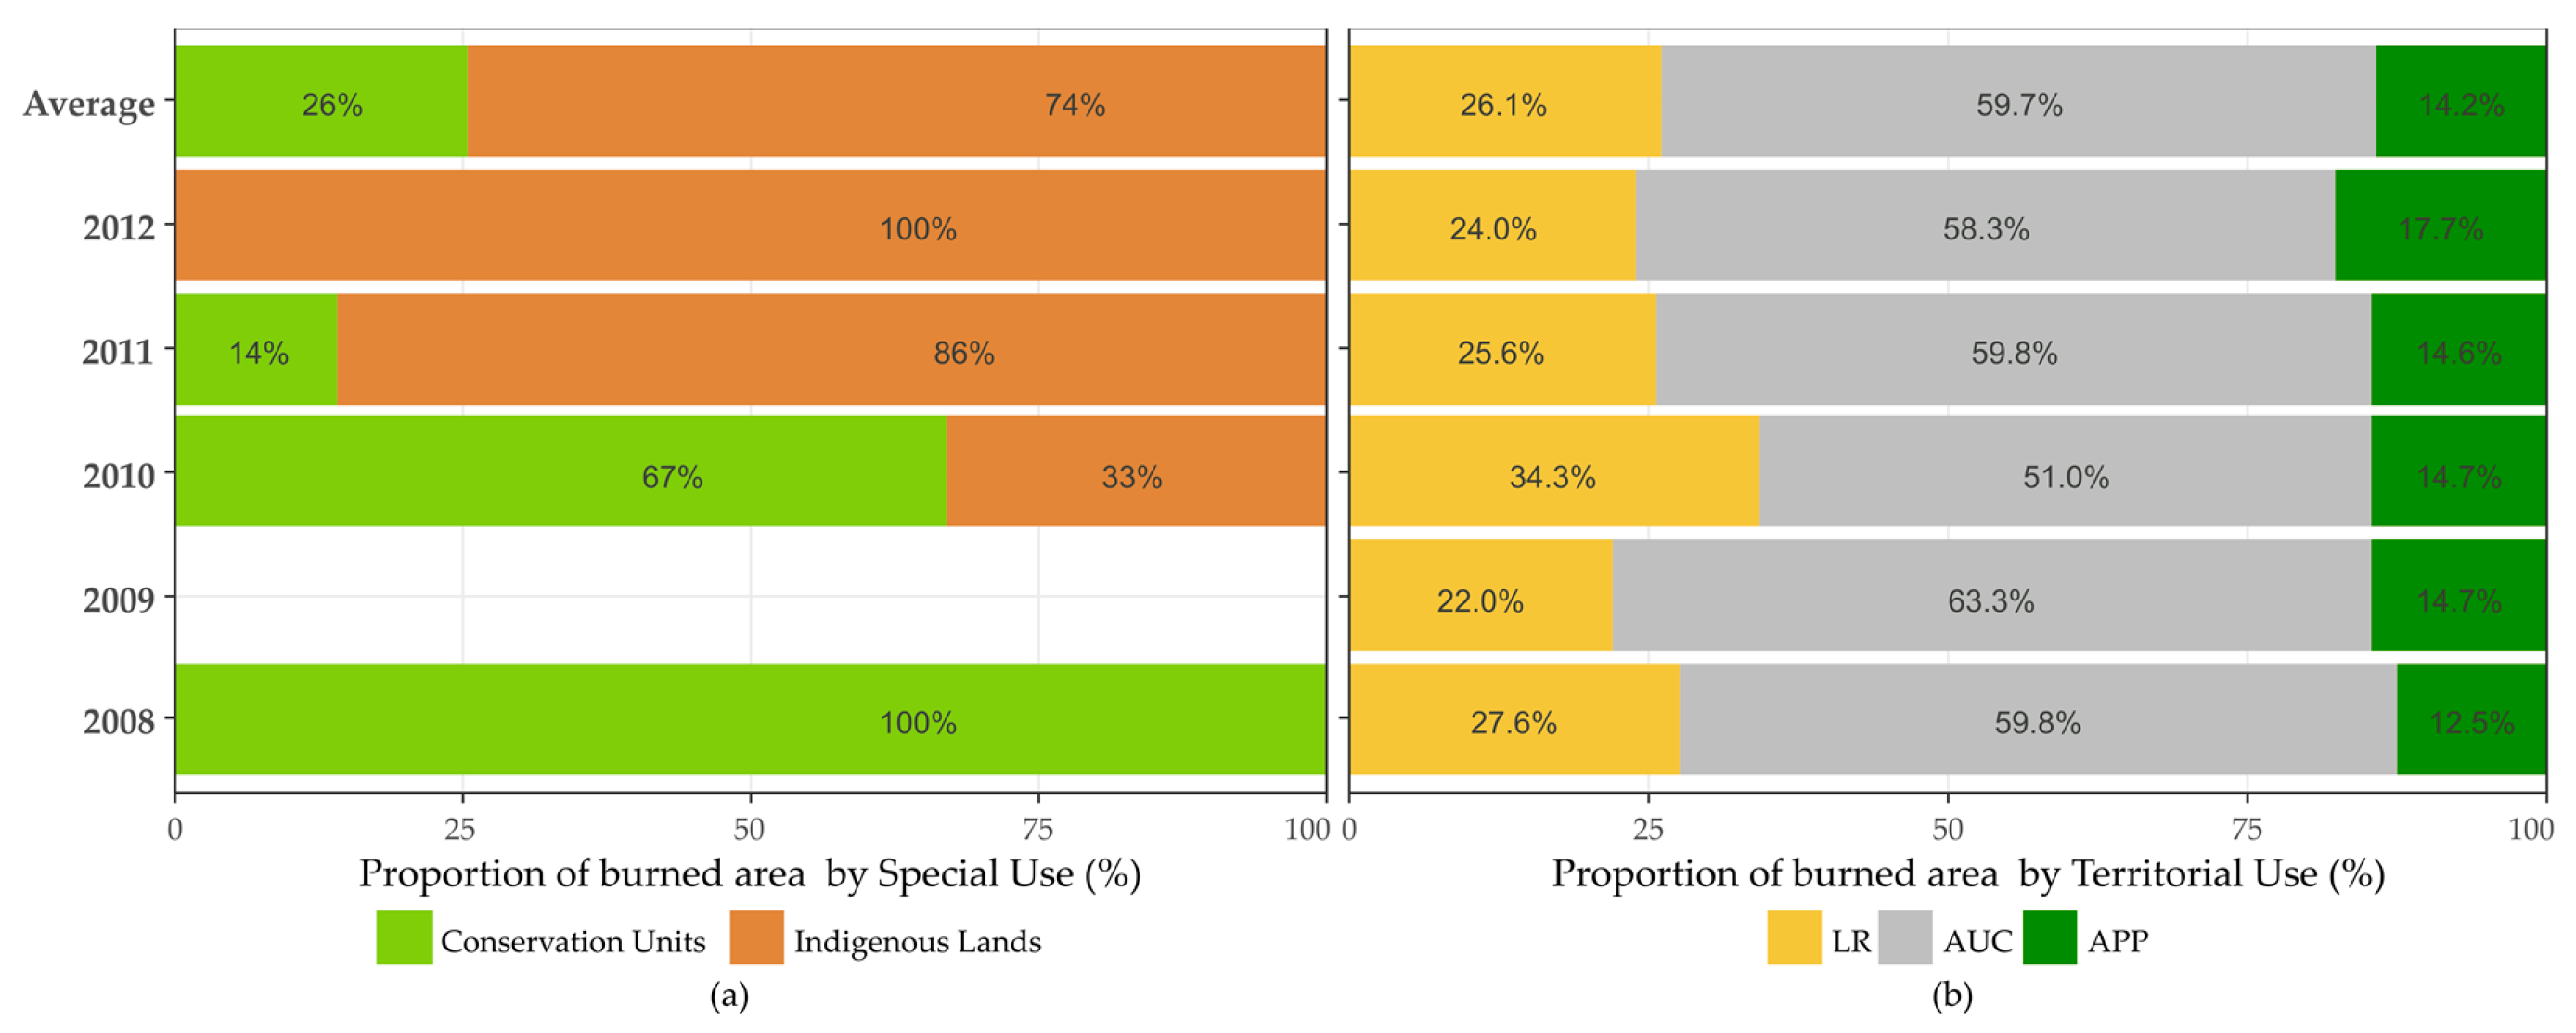
Usually, the extent of the fires’ impact was greatest for private areas (98.8%) than for public governmental lands (1.2%). Burned areas were not observed in governmental lands in 2009 and were lower than 1% in 2008. However, in 2010, fire occurrences increased by 2.86 percentage points (p.p) within the areas managed by governmental institutes (Figure 4a).
The dominant LULC in Acre is the Forest class (Table A6), representing 91% of all territory in the period studied. The area of Pasture and Agriculture corresponded to 8.3% and 0.7% of the territory, respectively. The Pastures class was the LULC predominantly affected by fire during regular years (63.5%). For the same period, the areas of Forests and Agriculture affected by fires corresponded, respectively, to 29.7% and 6.8% of Acre’s territorial extent (Figure 4b). On the other hand, during the 2010 drought, the burned area increased by almost 25 p.p. in forests (contributing to 54.5% of the total area burned) and decreased in the other two classes (totaling 42.4% of Pasture and 3.1% of Agriculture).
Acre registered, by 10 January 2018, 31901 proprieties with the Rural Environmental Registry (acronym CAR). From this total, 78% were classified as smallholdings, 18.5% as small, 1.9% as medium, and 1.5% as large properties. In regular years, around 38 large proprieties, 19 medium, 438 smallholdings, and 68 small proprieties were affected by fires. These numbers represent, for each class area respectively, 8%, 3.2%, 1.8%, and 1.2%. This same pattern persisted during 2010, with a change in the total amount of proprieties affected (Table A7). This pattern was not observed when we analyzed the total of the burned area (Figure 4c). Interestingly, a new configuration emerged in all regular climate and anomalous years, with large properties contributing to the largest affected areas, followed by smallholdings, then small, and finally medium properties.When analyzing the occurrence of burned areas in governmentally protected areas (CU and IL), we found that the total burned area was predominant in 2008 and 2012, respectively by CU and IL (Figure 5a). In 2009, burned areas did not occur in governmentally protected areas. Inside the boundaries of private areas, common-use areas (AUC, 59.7%) were more affected by fires than protected areas (LR, 26.1% and APP, 14.2%) (Figure 5b).
Five of the eleven CUs in Acre were affected by fires between 2008 and 2012 (Table A8). The RESEX Chico Mendes was the only one to burn every time that CU was affected. During 2010, we observed the highest number of CUs affected, reaching a total of 45.63 km2 of area burned. In addition, less than 1% of the burnings occurred in Integral Protection reserves (PARNA Serra do Divisor), while about 99% occurred in sustainable-use reserves, such as the RESEX Chico Mendes (34.73 km2), RESEX Cazumbá-Iracema (7.76 km2), FLONA Santa Rosa dos Purus (1.87 km2), and ARIE Seringal Nova Esperança (1.26 km2).
In relation to the 31 ILs existing in Acre, only eleven of them were affected by fires between 2008 and 2012 (Table A9), which were the following: Alto Rio Purus; Cabeceira do Rio Acre; Igarapé do Caucho; Kampa do Rio Amonea; Kampa e Isolados do Rio Envira; Katukina/Kaxinawá; Kaxinawá Colônia Vinte e Sete; Kaxinawá do Rio Humaitá; Mamoadate; and Poyanawa. The Mamoadate land had the greatest burned extent in 2010 (11.20 km2) and was the only one to burn in 2011.

3.3. Environmental, Social, and Economic Impacts of Fire

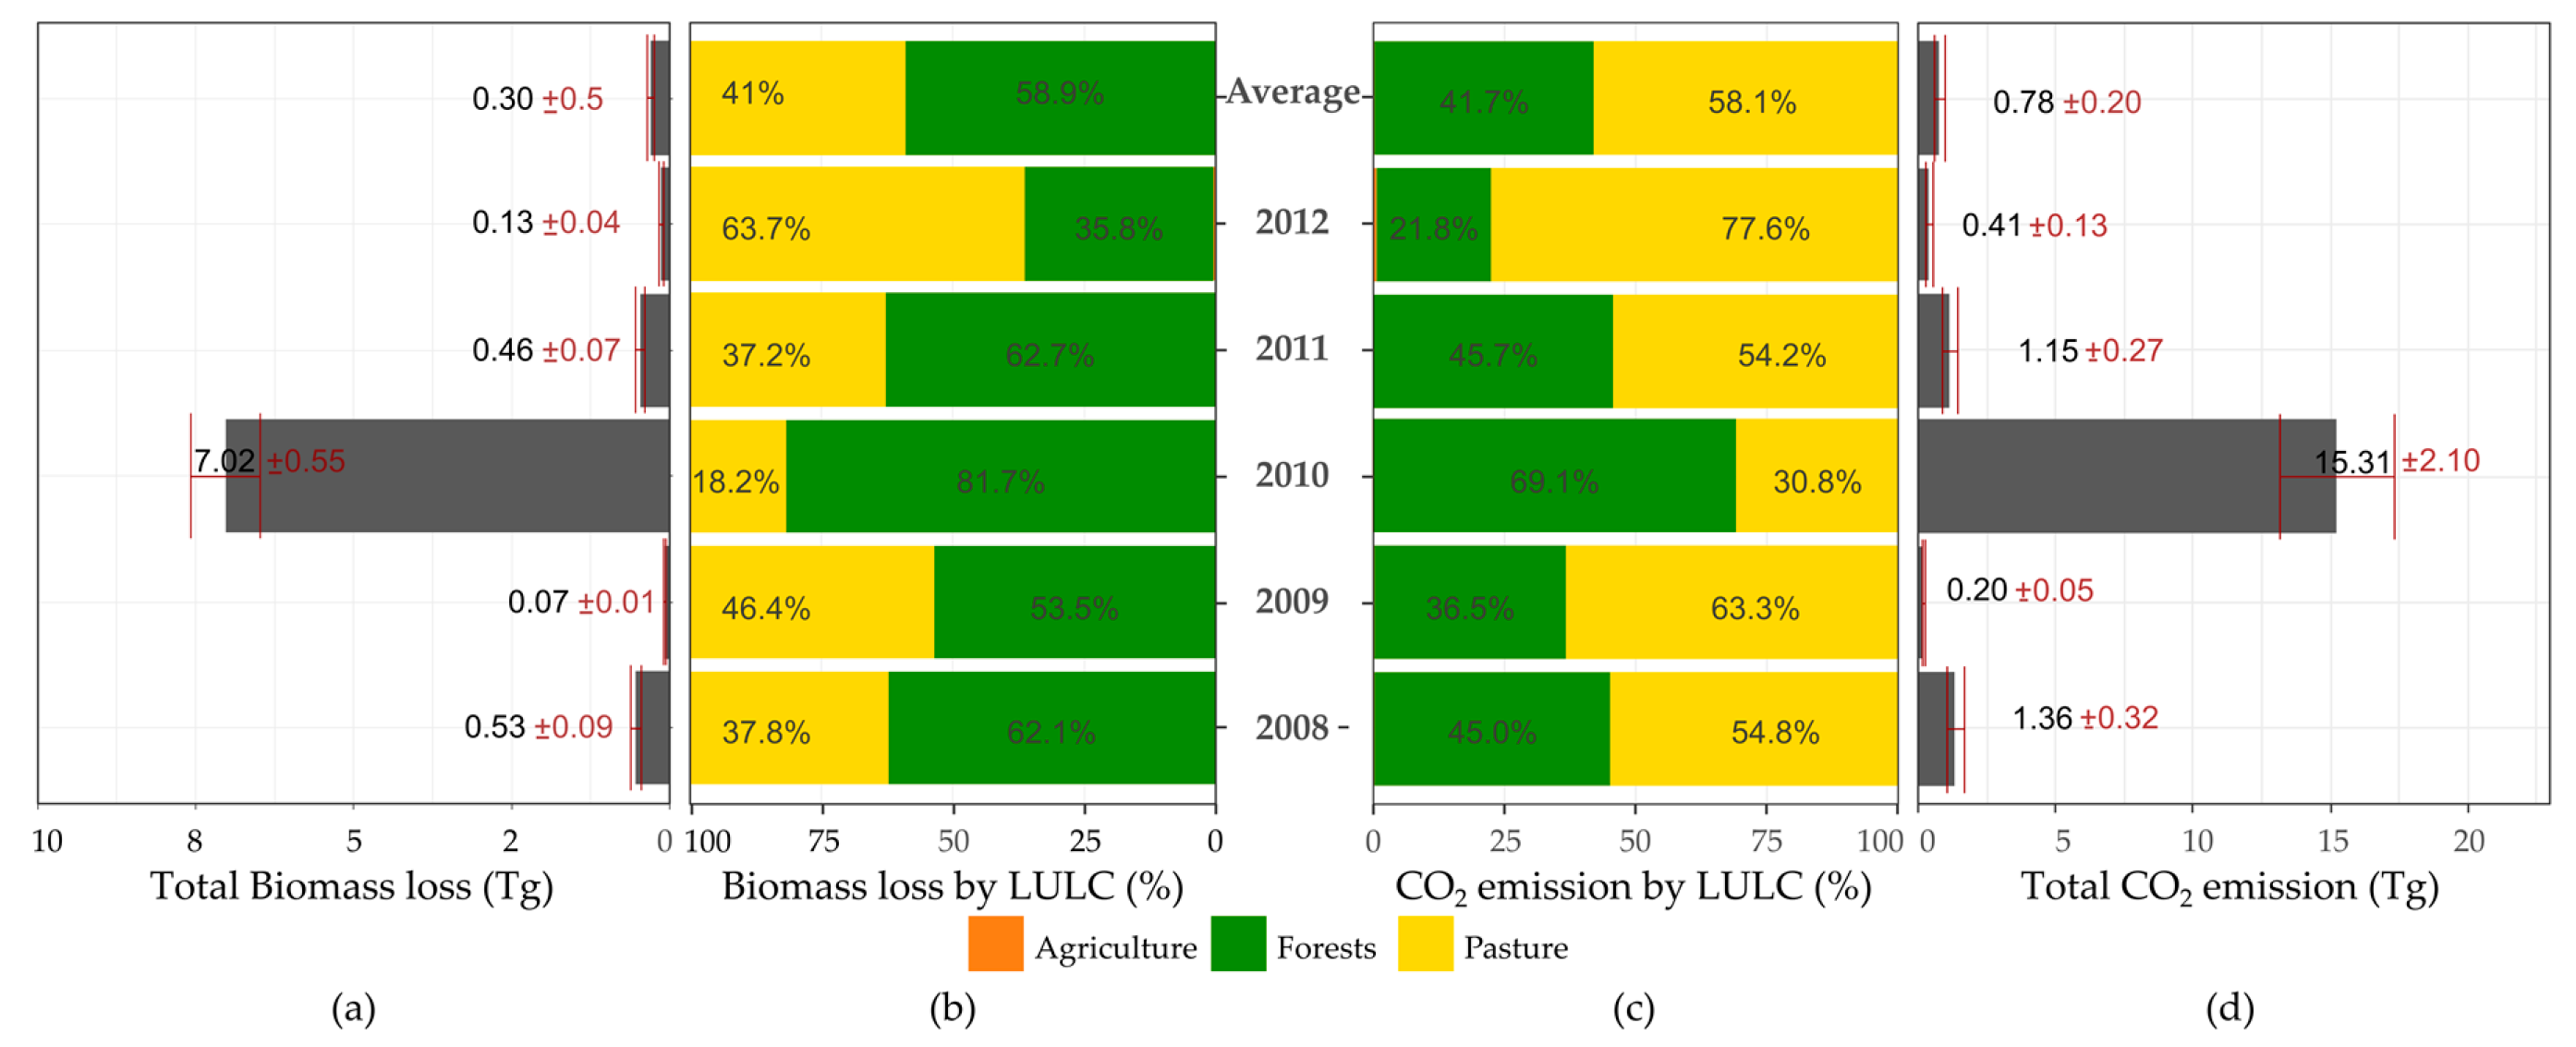
The average biomass loss during normal climate years was about 0.3 ± 0.5 Tg.y−1, however, this value increased to 7.02 ± 0.55 Tg.y−1 in 2010 (Figure 6a). Fires in forested areas were responsible for almost 59% of biomass loss in Acre during all years, except for 2012 (Figure 6b).
Pastures contributed with approximately 58% of the total CO2 emissions in normal years (0.78 ± 0.20 Tg.y−1) (Figure 6c). The Agriculture class, on the other hand, contributed less than 0.2% of emissions, on average. During 2010, however, forests alone contributed to 69% of the total CO2 emission from fires in Acre (Figure 6c), corresponding to 15.31 ± 2.10 Tg.y−1 (Figure 6d).
By analyzing the social impacts, we observed up to 2500 respiratory morbidity cases during the second semester of all the analyzed years. In the normal climate years (2008, 2009, 2011, and 2012), the mean cases of respiratory illness were around 2711. Surprisingly, the lowest record of respiratory morbidity cases (2545 cases in total) was found during 2010. Rio Branco, Cruzeiro do Sul, and Sena Madureira were the main municipalities in number of respiratory illness cases in all years.
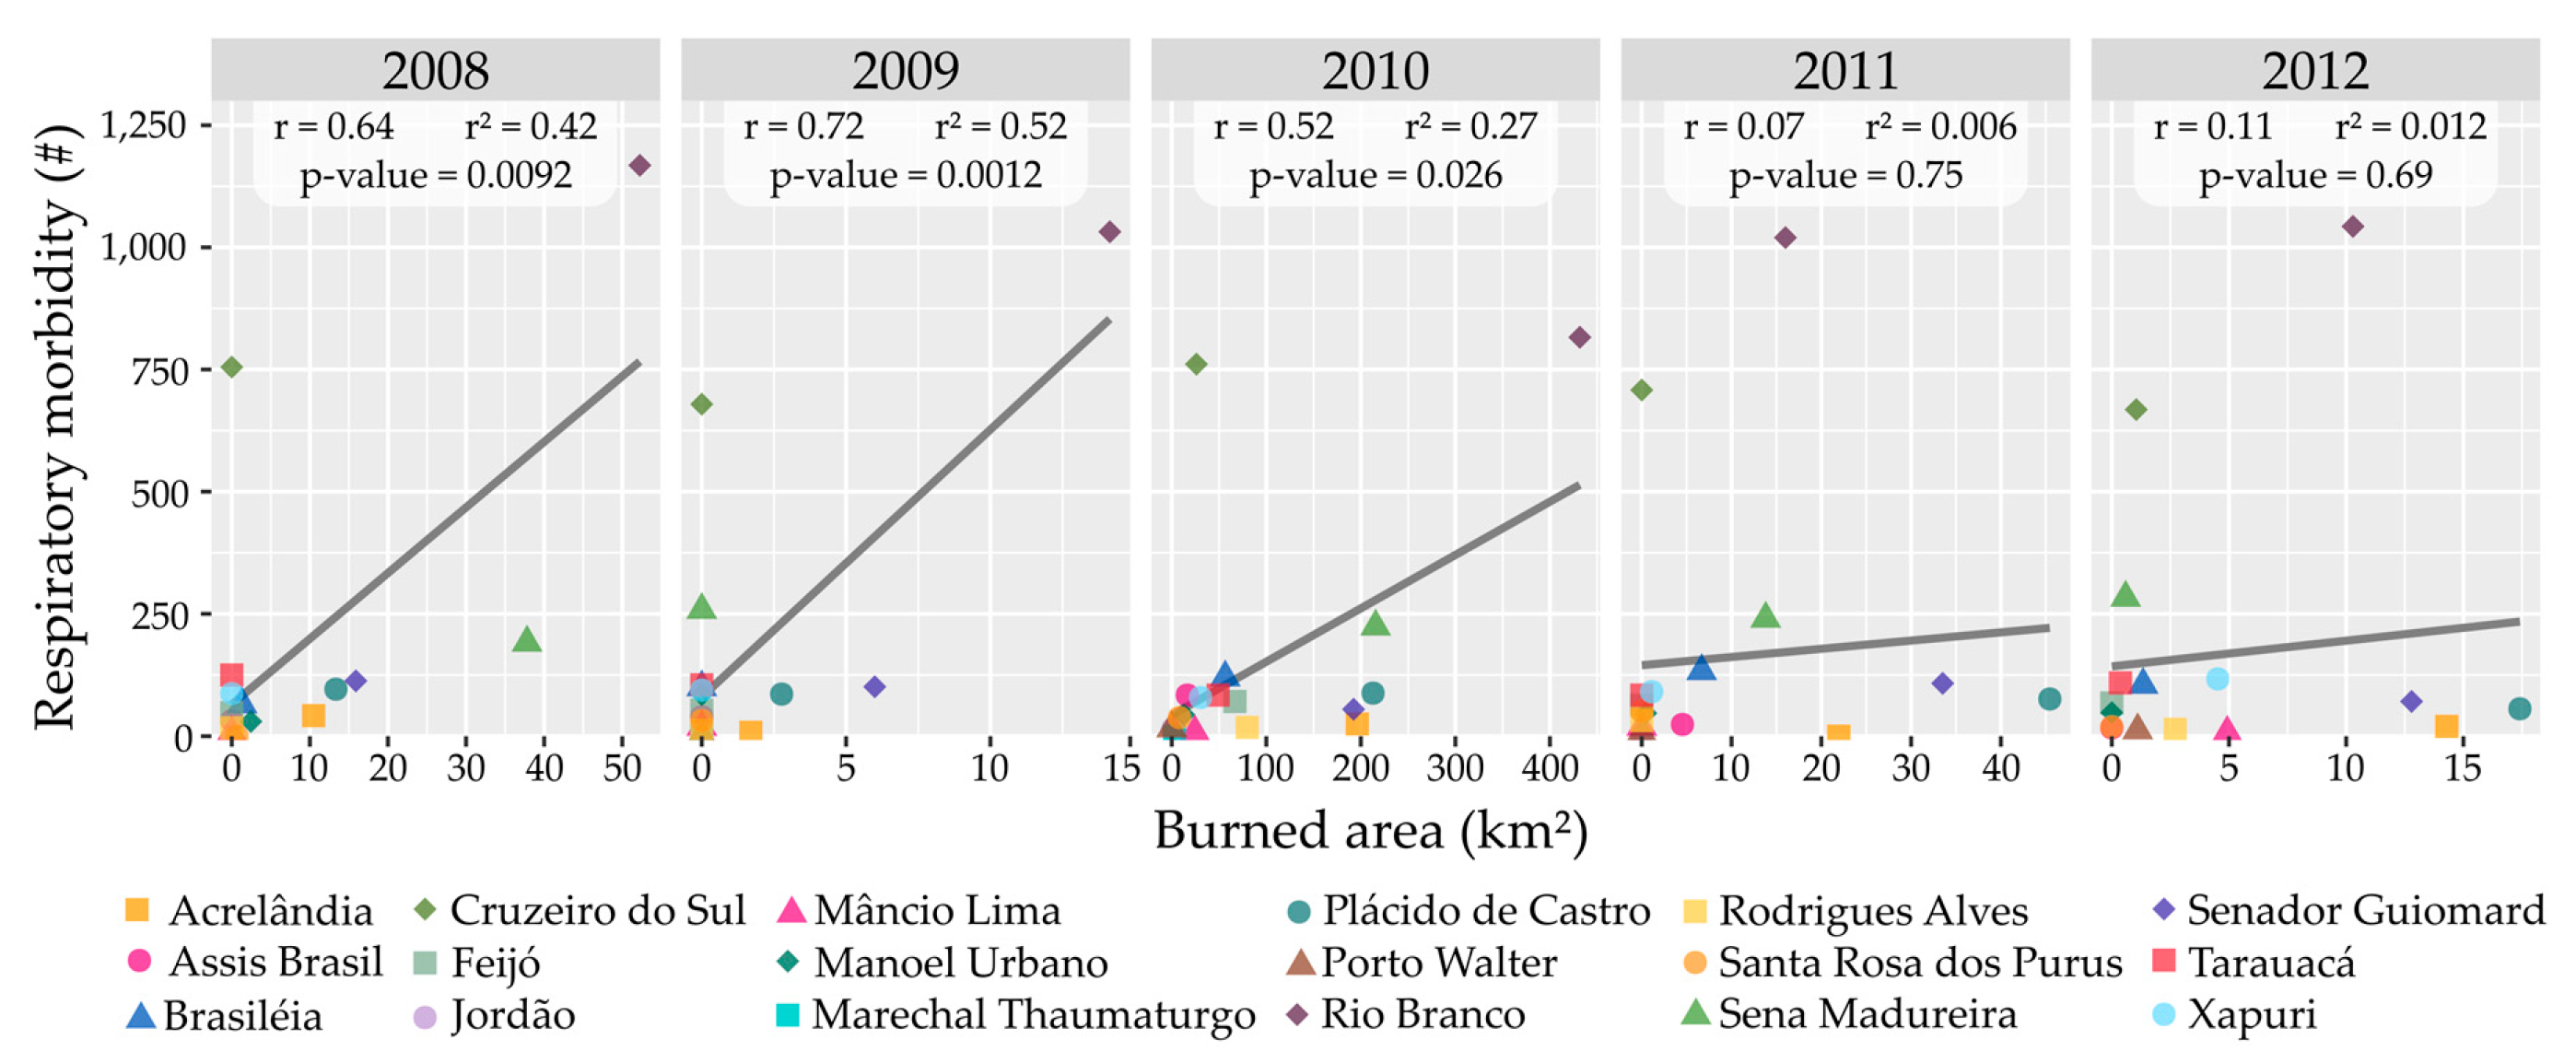
The relationship between respiratory morbidity cases and burned area during the extend dry season (Figure 7), suggests that Rio Branco is an outlier, with a higher amount of burned area and a high number of hospitalizations in the first three years analyzed. Meanwhile, Plácido de Castro, Senador Guiomard, and Acrelândia had an increase in burned area through the years, while their numbers of respiratory cases remained approximately the same. Contrarily, Cruzeiro do Sul persisted with almost the same number of hospitalizations and burned area through all the years analyzed.
After designing a linear regression where respiratory morbidity was the dependent variable and respiratory morbidity cases was the independent variable, modeled for each year (Figure 7), we observed a positive correlation coefficient (r > 0) more explicit for 2008 (r = 0.64, r2 = 0.42, p-value = 0.0092), 2009 (r = 0.72, r2 = 0.52, p-value = 0.0012), and 2010 (r = 0.52, r2 = 0.27, p-value = 0.026) years. This result suggests that an increase in the burned area will lead to an increase in the number of hospitalizations. However, the quality of those models described by the determination coefficient (r2), indicates that 2009 exhibited a better model fit than the others years. The 2008, 2009, and 2010 year models indicate that the burned area is relevant to explaining the respiratory morbidity cases, using a 5% significance level.
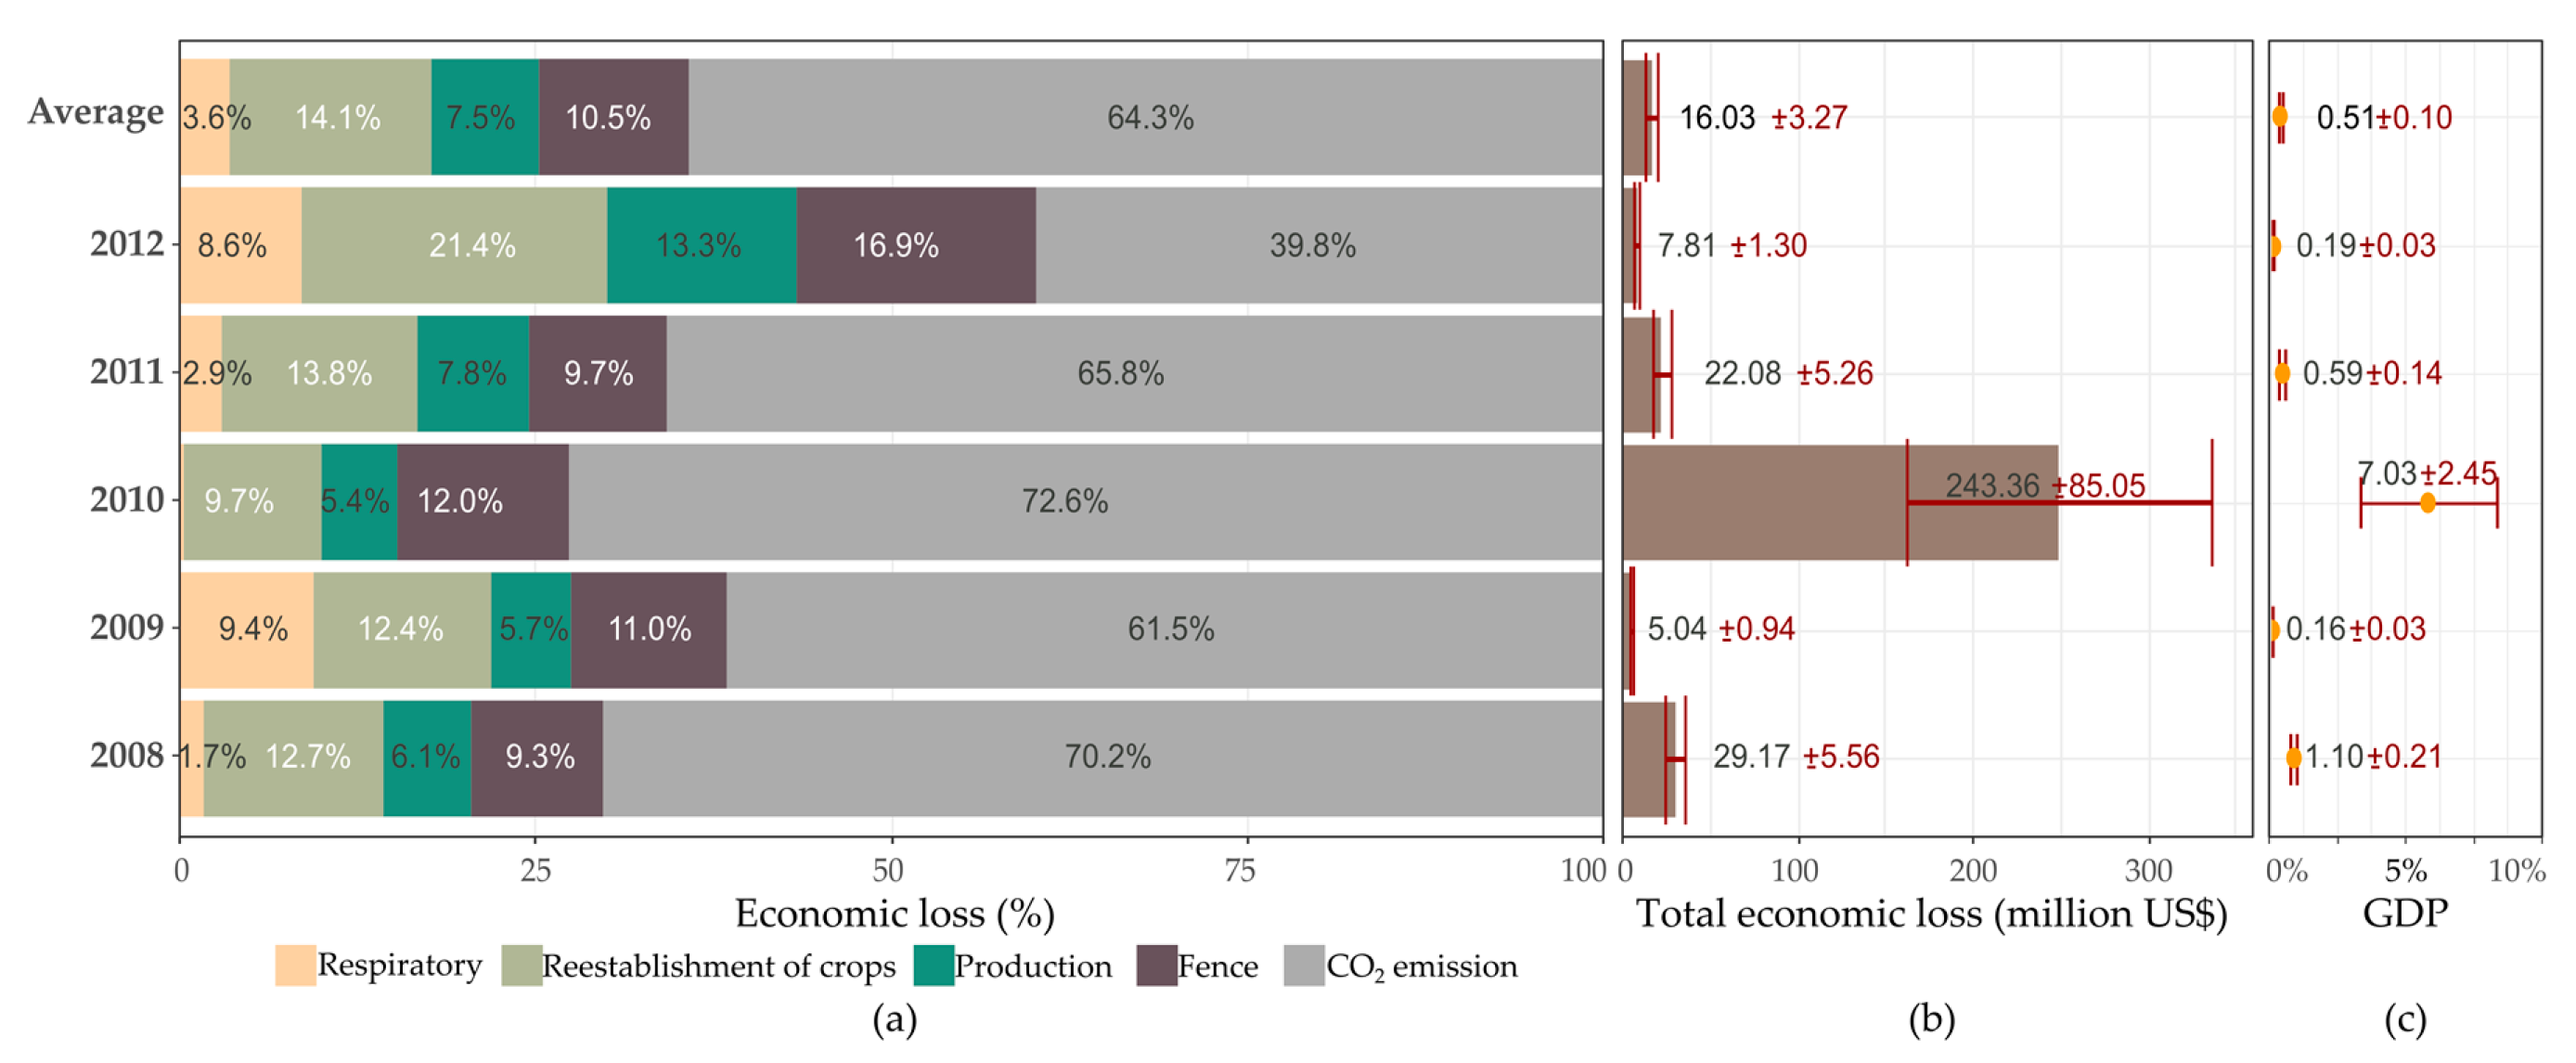
The fire-mediated economic losses in Acre between 2008 and 2012 are discriminated in Figure 8 and Table A10, where the values are specified by damage type, summarized with its total deviation and GDP equivalence. CO2 emissions represented the greatest contribution to the total economic loss, ranging from 40% to 73%. Respiratory illness costs had the smallest contribution, representing up to 9.4% of all costs in 2009. In 2010, there was an increase of 8 percentage points in the CO2 emission contribution for the total economic loss, compared to the average of the normal climatic years. Losses in propriety infrastructure (fences) represented 12% in 2010, the most representative year before 2012.
As expected, 2010 had the highest economic loss, corresponding to a total of US$ 243.36 ± 85.05 million, representing around 7 ± 2.45% of Acre’s GDP for that year. Nevertheless, during normal climate years, the average loss was around US$ 16.03 ± 3.27 million, representing 0.51 ± 0.10% of the mean GDP.

4. Discussion

4.1. Spatio-Temporal Variability of Fire Dynamics

The eastern flank of Acre was the region with the greatest extent of burned area. This region is historically the epicenter for land use and land cover change, with up to 10% of forests burning twice between 1999–2010 [66] and up to three times, when expanding the time-window from 1984 to 2016 [67], mostly occurring in Acre’s frontier with Pando (Bolivia), Amazonas (Brazil), and Pucallpa (Peru).
The widespread occurrence of fires in 2010 is attributed to the severe drought that occurred in Amazonia as a consequence of the El Niño-Southern Oscillation (ENSO) phenomenon, intensified by the warming of the tropical North Atlantic Ocean [24,25]. In 2010, the total area burned increased by 16 times in relation to the 2008–2012 average. Using the Burn Damage and Recovery (BDR) algorithm applied to MODIS and LANDSAT images, Morton et al. [66] found that the total extent of burned forests in 2010 was 9.14 times greater in southern Amazonia than during the 2008–2009 mean. Silva et al. [67], applying the Burn Scar Index (BSI) to LANDSAT images in Acre state, found an increase of 166.9 times in the total burned forest area in 2010, when compared to the 2008–2012 mean. These increases were associated with the environmental conditions during severe drought years when fires rapidly spread into forest areas, a fact that does not occur during regular climate years [12]. This statement is supported by the exacerbation of burn scars’ occurrence in areas distant from roads and rivers and the total affected forests areas in 2010.

4.2. Fire Occurrence and Land Tenure Relationship

Pasture was the first LULC type burned more in all the regular climatic years. Usually, pasture management with fire during the dry season aims to eliminate accumulated dead material on the ground, which represents a physical barrier to the development of new plants, more palatability, and with a higher nutritive value [68,69]. Furthermore, according to Costa 2008 [68], in the northern Amazon, fire is a widespread practice for increasing pastures’ productivity.
Observing at property scales, 8% of the large rural properties presented 52% of the burned areas while less than 2% of the small properties, where there is the prevalence of small producers and family farmers, accounted for 32% of the burnings. This indicates that fire is a widespread tool for management, independently of the land tenure.
Despite this, Soares-Filho et al. [55] reported that, with the New Forest Code accession, the vegetation management within private properties becomes increasingly essential to mitigate global climate change effects, since about 53% of vegetation is located in these properties. In addition, with the possibility of delimitation and spatial location of properties and preservation areas in the SICAR system, environmental agencies have a supporting tool to inspect forest management and protected areas in private properties, increasing law enforcement.
Currently, the three main fire-dependent activities in Acre are deforestation, undertaken by all classes of landholders [70], subsistence agriculture by smallholders and pasture management, and recovery by small and medium cattle ranchers. Deforestation-related fires decreased with the reduction in deforestation [71], a change which is part of a slowdown of the boom-and-bust dynamics of frontier expansion [72]. In fact, the "bust" stage appeared to be replaced by the decoupling of agriculture and the rest of the economy from forest suppression and degradation, as evidenced by Weinhold et al. [72], Tritsch and Arvor [73], and Caviglia-Harris et al. [74]. In this new development paradigm, which is more adherent to the “industry life cycle” thesis [75], the two other fire causes remain. The first is due to the still limited inclusion of smallholders in the formal economy, as they remain located mainly in remote government-administered settlements with low capacities to generate income and obtain funding [76]. Secondly, barriers to income and funding, which limit capitalization of landholders, also contribute to perpetuating the low-input and extensive cattle ranching, which remains the rule in Amazon [62].
The decrease in fires due to agricultural expansion and intensification is, in fact, a global trend, as argued by Andela et al. [77] and endorsed for Western Amazonia by our results, where large proprieties decrease its contribution in 9 percentage points through the years, and additionally by the non-correlation between fires and the economic data of the agricultural sector after 2010 (Figure A2).
This detachment of fire as a management tool could be explained by the increased effectiveness of agricultural sustainability policy within the context of policies, such as the REDD+ for Early Movers [78], the Sustainable Development Plan [79], the farm certification program [80], the rural-environmental registry [81], the Integrated Plan for prevention and control of deforestation and fires [82], Brazil’s Low-Carbon Agriculture (ABC) Plan [83], or even for a combination of them.
Most of those policies are addressed to private properties, however, governmental areas represented, on average, 1.2% of the total burned area in Acre, where Indigenous Lands are often found (~74%). Fire in these lands is part of several subsistence techniques of land clearing, agricultural management, hunting, planting, and religious rituals, being used with precaution and caution in all applications [1,84,85]. Graf [85] argues that fire use for deforestation and soil enrichment for those communities has been gradually eliminated in Acre, thanks to the inclusion of mitigation measures of the Environmental and Territorial Indigenous Management Plans (PGATIs) and through the formation of indigenous agroforestry agents (AAFIs) at these communities.
Another type of protected government area counted in this study were Conservation Units (CU). In Brazil there are two types, one that aims to preserve nature where only the indirect use of its natural resources is allowed, called Units of Integral Protection (UIP), and the other denominated Units of Sustainable Use (USU), that aim to make nature conservation compatible with the sustainable use of a portion of their natural resources and with human occupation. Each CU has their own groups. For UIP there are five types, ecological stations; biological reserves; national parks; natural monuments; and wildlife refuges. For USU, the groups are environmental protection areas; areas of relevant ecological interest; national forests; extractive reserves; wildlife reserves; sustainable development reserves; and private reserves of the natural patrimony [86].
In Acre, extractive reserves were the ones with the largest burning throughout the analyzed period (44.09 km2, Table A8). In these areas, the traditional communities, whose subsistence activities are based on extractives, subsistence farming, and raising small animals, are allowed [86]. The study of Torres et al. [87], using a Brazilian firefighters database, revealed that the fire use for land clearing is the main cause of wildfires in the CUs. Incendiarism was the second recurrent cause of wildfires in CUs. With these two anthropogenic causes at the top, the authors showed that there is a strong human pressure on CUs, mainly on their borders. Allied to this, there is an existing agricultural pressure in this region of the Amazon as a whole, as it is now considered a new frontier for agricultural expansion.

4.3. Environmental, Social, and Economic Impacts of Fire

The impact of fire can be felt by different groups and at different scales [88]. Here, we look through five distinct components, CO2 emissions, respiratory morbidity, infrastructure damages, future production losses, and crop reestablishment. Our analysis can be considered conservative because these five components are a small part of the whole impact and are at a low scale of what fire impact can influence.
Using deforestation rates given by PRODES [35] as a baseline and the mean biomass value proposed by Salimon et al. [89], the average biomass removed by deforestation in Acre between the 2008–2012 period was approximately 6.19 ± 2.26 Tg. This is much higher than the average biomass committed by fire in the same period (0.30 ± 0.5 Tg). However, the fire impacted more biomass (7.02 ± 0.55 Tg) than deforestation (6.37 ± 2.33 Tg) in 2010, due to the extreme drought. Thus, even though the emissions reduction by deforestation in Acre was about 85 Tg CO2 between 2006 and 2010 [90], with the increasing probability of extreme droughts predicted due to climate change and the consequent collateral increasing of fires, the fire-related carbon emissions can substantially increase.
We did not find a clear temporal relationship between the number of cases of respiratory morbidities and the total area burned in each year. However, we found a strong relationship between these variables during the anomalous year. These results confront some of the studies already carried out for the Amazon [4,21] or even for Acre [91]. This divergence may be associated with other factors or a combination of factors, not accounted here, that could influence illness prevalence (such as vehicle pollution, and access to health assistance). The top three cities in the occurrence of respiratory illness (Rio Branco, Cruzeiro do Sul, and Sena Madureira) are the main centers of each microregion in Acre, being the most populated and developed [92]. Hence, these cities are likely to concentrate all medical assistance for each region, inflating the amount of hospitalization, even while not showing a higher burned area.
The quantified fire-mediated impacts for the normal years amounted to 0.51 ± 0.10% of the Acre’s GDP for the analyzed period. During 2010 these impacts represented 7.03 ± 2.45% of the GDP, considering just a restrained part of the direct losses (fences, agriculture production, and CO2 emissions) and indirect losses (respiratory illness). By conducting a more comprehensive assessment of direct and indirect impacts, these values will certainly be higher, with larger impacts upon the local economy. Brown et al. [27] estimated that the economic, social, and environmental losses related to the 2005 burning events in Acre were to the order of US$100 million, which is equivalent to around 0.9% of the GDP. Additionally, De Mendonça et al. [4] calculated an economic loss related to 0.2 to 0.9% of the GDP for the Amazon from 1996 to 1999, considering the impact of fire on agriculture, forests, CO2 emissions, and hospitalizations due to respiratory problems.

5. Conclusions

In five years, fire affected a total area of 2577 km2, which represents around 2% of Acre’s territorial area, or 1.6 times the area of São Paulo city. Just in 2010, as a consequence of the extreme droughts associated with El Niño and the subsequent warming of the Tropical North Atlantic, the total burn area was 2057 km2. We demonstrated that drought effect on fire patterns favors spreading to places farther from the main means of ignition, such as roads and highways, entering protected areas (UC and IL), and areas with restricted use (APP and RL).
Interestingly, the pattern of use of fire in Acre has changed since 2010. The fire was closely linked to the agricultural sector, especially connected to large proprieties, as a tool for deforesting and also for pasture management. However, possibly due to some governmental policies, international pressure, and even the socioeconomic impacts of the 2010 fires, this relationship weakened after the 2010 drought. Additionally, during this later period, the number of properties that use fire as a tool for pasture management and subsistence has decreased.
Fire in traditional communities in the state is small compared to private proprieties, nonetheless, special projects and policies for these communities must continue and the existing ones should be shared with other communities, and even across the Amazon, to ensure minimum fire usage.
The impact of fire is more expressive than we anticipated, however, those five direct and indirect components that were calculated indicated an expressive influence on Acre’s economy, representing 0.16 ± 0.03% to 7.03 ± 2.45% of the state’s total GDP. The total CO2 emission from fire can be more expressive than deforestation in extreme drought years, while infrastructure damages and production losses represented 27% to 52% of all fire costs.
Quantifying social fire impacts related to respiratory morbidity is complex. The difficulty to establish a robust diagnostic of cause and effect, with relation to fires and respiratory illness, introduces large uncertainties for defining the proportional contribution of these costs to the total economic loss estimates.
Our study showed that the economic impacts of fire can be large, especially in years of extreme drought. The state of Acre must take advantage of the National Policy on Climate Change (PNMC), instituted by Law 12,187/2009, which aims to encourage the development and improvement of actions mitigating greenhouse gas emissions in Brazil and to improve the formulation of environmental policies to restrain fire usage.

Author Contributions

W.A.C. and A.P.L. prepared, performed the processing, and analyzed the data. W.A.C, L.O.A, and L.E.O.C.A. wrote the manuscript with input from all the co-authors. W.A.C. prepared the graphics and figures; L.O.A., L.E.O.C.A., and T.F.M.R.S. contributed with the analysis and discussion of the results, with input from all the authors.

Acknowledgments

The authors thanks to the Brazilian National Council for Scientific and Technological Development (CNPq) for the scholarship to W.A.C. (process 140261/2018-4) and for the productivity grant to L.O.A. (309247/2016-0) and L.E.O.C.A. (305054/2016-3); to the São Paulo Research Foundation (FAPESP) for the project 2016/02018-2 for the scholarship to A.P.L. (2016/21043-8) and to the Inter-American Institute for Global Change Research (IAI) SGP-HW 016.

Conflicts of Interest

The authors declare no conflict of interest.

Appendix A

Figure A1. Location of the study area.
Remotesensing 11 00764 g0a1
Table A1. Summary of the spatial dataset used to develop the present work.
DataStructureSpatial ResolutionPeriodSource
Burned area mapRaster250 m2008 to 2012TREES Group [15]
Aboveground carbon density mapRaster30 m2000sGlobal Forest Watch Climate [46]
Land use and land cover map (LULC)Raster30 m2010, 2008, and 2012TerraClass
(INPE/Embrapa) [43,44]
Rivers and RoadsPolygonsMulti-scale2016IBGE [93]
Property boundaries and protected private areas
(APPs and LRs)
PolygonsMulti-scale2017Sicar [81]
Rural module specificationsTable-2013Incra [57]
Municipal boundariesPolygonsMulti-scale2015IBGE [93]
Conservation units (UCs) and Indigenous Lands (ILs)PolygonsMulti-scale2016MMA [94] e Funai [95]
Table A2. Costs, prices, and index used.
VariableUn.Ag20082009201020112012References
Morbidity cases
(Jun–Dec)
# 27762708254527062657DATASUS * [58]
Cost of morbidityMUS$ 34.2524.8728.7636.5841.27
Fence recoveryUS$/mmn49.4642.2433.1238.0122.20DNIT * [59]
sd18.3215.3511.6712.867.10
Pasture reestablishment US$/hamn883.27 1883.27 1883.27883.27 1883.27 1Townsand (2010) ** [60]
sd300.01 1300.01 1300.01300.01 1300.01 1
Agriculture reestablishmentUS$/ha 813.62 1813.62 1813.62813.62 1813.62 1
Maize productivityt/ha 1.751.832.002.212.27CONAB * [61]
Maize price US$/tmn182.27201.29215.29269.54243.20CEPEA ** [63]
sd22.7012.9737.9311.5129.33
Cassava productivity t/ha 21.7118.7320.6719.0015.33PAM-IBGE * [47]
Cassava priceUS$/tmn62.3986.62134.14103.60107.09CEPEA ** [63]
sd2.4417.279.7912.6927.72
Cattle Densidy 2#/ha 1.801.861.881.851.79PPM-IBGE * [96] /Terraclass ** [43]
Cattle productivity@/ha/y 4.06 34.064.06 34.06 34.06 3EMBRAPA * [62]
Cattle priceUS$/@mn36.1045.3253.1554.2646.40CEPEA ** [63]
sd3.061.716.971.591.30
CO2 price€/tmn13.69 313.6911.9813.067.50Carbon Emission Future ** [64]
sd0.68 30.685.423.350.72
Euro changeUS$/€mn1.151.591.401.241.23Banco Central Brasil * [65]
sd0.100.100.070.040.07
Cumulative Inflation%b.y 32.5132.4632.4132.3532.29IPCA-IBGE * [97]
US$ changes 4US$/R$ 0.430.570.600.530.49IPEAData * [97]
Un.—Unit of measurement; Ag—type of aggregation, as mean value (mn) or standard deviation (sd); *—data form governmental institutes; **—data from literature; 1—Used values from 2010; 2—Calculated by the total of cattle from PPM-IBGE divided by the pasture area from TerraClass; 3—Used values of 2009; 4—Used to convert the market prices as reais to US dollars.
Correction equation of values by cumulative inflation taxes:
Vf = Vp * (1 + ∑ IPCAy)
where Vf is the future value; Vp is the present value; and IPCAy is the annual inflation tax.
Uncertainty propagation methods considering variable independency by Vuolo (1996) [52], where A2 is the sum method, A3 is the multiplication method, and A4 is the constant method.
σ w 2 = σ x 2 + σ y 2
( σ w w ) 2 = ( σ x x ) 2 + ( σ y y ) 2
σ w = | e |   .   σ x
where σw is the uncertainty resultant; σx and σy are the uncertainty of X and Y; X and Y are the measures values; W is the final result; and e is a constant error-free.
Table A3. Total burned area in hectares (km2) that burned one time, more than once, and the number of burned scars in sequence of year.
YearTotalFrequencyRecurrence
One>One1 Years2 Years3 Years
2008218.85218.85161.8257.042.470.53
200933.3333.338.4324.913.322.37
20102056.802056.81928.22128.5829.834.22
2011178.52178.52135.7442.788.50
201290.0590.0534.255.8600
Total2577.552577.552268.41309.1654.127.12
Table A4. Summary of burned scars between 2008 and 2012 for Acres state.
VariableYears
20082009201020112012
Number of scars267243521324146
Total area (km2)218.8533.332056.80178.5290.05
Maximum area (km2)16.415.03104.3416.9010.74
Mean area (km2)0.821.390.580.550.62
Minimum area (km2)0.070.070.020.00090.01
Standard deviation1.501.382.541.281.39
Variance225.09190.09644.56162.88192.70
Anomaly of quantity−0.44−0.621.99−0.40−0.53
Anomaly of area−1.32−2.542.39−2.07−2.21
Table A5. Distance, in kilometers, of rivers (Ri) and roads (Rd) to burned scars.
Distance (km)20082009201020112012
RiRdRiRdRiRdRiRdRiRd
Minimum1.286.890.9810.291.2110.801.265.711.534.27
Mean1.687.361.5210.991.4911.151.586.101.864.65
Maximum5.3928.883.7241.866.2056.545.6934.285.7324.81
Standard deviation1.125.510.939.941.159.671.125.861.344.77
Variance 1.2730.350.8698.881.3293.511.2534.321.7922.74
Table A6. The proportion of each land use and land cover class in Acre state through the years.
LULC200820102012Average
Forest91.0%91.2%90.5%91.0%
Agriculture0.9%0.6%0.7%0.7%
Pasture8.1%8.2%8.8%8.3%
Table A7. Number of proprieties affected by fires through the years.
Class of ProprietiesTotal20082009201020112012Average
Smallholdings24964658 (2.6%)80 (0.3%)6394 (25.6%)672 (2.7%)341 (1.4%)438 (1.8%)
Small5867126 (2.1%)14 (0.2%)1368 (23.3%)91 (1.6%)42 (0.7%)68 (1.2%)
Medium59335 (5.9%)3 (0.5%)215 (36.3%)22 (3.7%)16 (2.7%)19 (3.2%)
Large47760 (12.6%)15 (3.1%)258 (54.1%)46 (9.6%)30 (6.3%)38 (8.0%)
Total31901879 (2.8%)112 (0.4%)8235 (25.8%)831 (2.6%)429 (1.3%)563 (1.8%)
Table A8. Area (km2) of Conservation Units affected by fire through the years analyzed.
TypeClass (Acronym)Nome20082009201020112012
UIPNational Park (PARNA)Serra do Divisor0.000.000.020.000.00
USUArea of Relevant Ecological Interest (ARIE)Seringal Nova Esperaça0.000.001.260.000.00
USUNational Forest (FLONA)Santa Rosa do Purus0.000.001.870.000.00
USUExtractive Reserve (RESEX)Cazumbá-Iracema0.640.007.760.000.00
USUExtractive Reserve (RESEX)Chico Mendes0.370.0034.730.590.00
Total 1.000.0045.630.590.00
UIP—Integral Protection; USU—Sustainable use.
Table A9. Area (km2) of Indigenous land affected by fire through the years analyzed.
Terra Indigena20082009201020112012
Alto Rio Purus0.000.000.330.000.00
Cabeceira do Rio Acre0.000.000.000.000.00
Igarapé do Caucho0.000.000.960.000.00
Kampa do Rio Amonea0.000.002.930.000.00
Kampa e Isolados do Rio Envira0.000.000.150.000.00
Katukina/Kaxinawá0.000.000.150.000.00
Kaxinawá Colônia Vinte e Sete0.000.000.290.000.00
Kaxinawá do Rio Humaitá0.000.000.130.000.00
Mamoadate0.000.0011.203.640.00
Poyanawa0.000.006.460.001.03
Total0.000.0022.593.641.03
Table A10. Cost in millions of dollars of losses by fire in Acre state between 2008 and 2012, with a percent of total costs (%) and a related percent of total GDP.
Type of Impact20082009201020112012Average
Fence2.72(9.3%)0.55(11%)29.27(12%)2.14(9.7%)1.32(16.9%)1.68(10.5%)
Reestablishment 3.70(12.7%)0.63(12.4%)23.63(9.7%)3.05(13.8%)1.67(21.4%)2.26(14.1%)
Production 1.78(6.1%)0.29(5.7%)13.11(5.4%)1.72(7.8%)1.04(13.3%)1.21(7.5%)
CO2 emission20.49(70.2%)3.10(61.5%)176.77(72.6%)14.52(65.8%)3.11(39.8%)10.31(64.3%)
Respiratory 0.49(1.7%)0.47(9.4%)0.57(0.2%)0.65(2.9%)0.67(8.6%)0.57(3.6%)
Total29.17± 5.565.04± 0.94243.36± 85.0522.08± 5.267.81± 1.3016.03± 3.27
%GDP1.10%± 0.210.16%± 0.037.03%± 2.450.59%± 0.140.19%± 0.030.5%± 0.10
Figure A2. Correlation between GDP of the agricultural sector and burned area.
Remotesensing 11 00764 g0a2
Figure A3. Graphical Abstract.
Remotesensing 11 00764 g0a3

References

  1. Pivello, V.R. The Use of Fire in the Cerrado and Amazonian Rainforests of Brazil: Past and Present. Fire Ecol. 2011, 7, 24–39. [Google Scholar]
  2. Bush, M.; Colinvaux, P.; Miller, M.; Moreno, J.; Bush, M.; De Oliveira, P. Amazonian paleoecological histories: One hill, three watersheds. Palaeogeogr. Palaeoclim. Palaeoecol. 2004, 214, 359–393. [Google Scholar] [CrossRef]
  3. Bush, M.B.; Silman, M.R.; De Toledo, M.B.; Listopad, C.; Gosling, W.D.; Williams, C.; E De Oliveira, P.; Krisel, C. Holocene fire and occupation in Amazonia: Records from two lake districts. Philos. Trans. R. Soc. B Boil. Sci. 2007, 362, 209–218. [Google Scholar] [CrossRef] [PubMed]
  4. De Mendonça, M.J.C.; Diaz, M.D.C.V.; Nepstad, D.; Da Motta, R.S.; Alencar, A.; Gomes, J.C.; Ortiz, R.A. The economic cost of the use of fire in the Amazon. Ecol. Econ. 2004, 49, 89–105. [Google Scholar] [CrossRef]
  5. da Motta, R.S.; Mendonça, M.J.C.; Nepstad, D.; del C.V. Diaz, M.; Alencar, A.; Gomes, J.C.; Ortiz, R.A. Text for Discussion (TD) 912: The economic cost of fire in the Amazon; The Institute for Applied Economic Research (IPEA): Rio de Janeiro, Brasil, 2002; ISBN 1415-4765. [Google Scholar]
  6. Santín, C.; Doerr, S.H. Fire effects on soils: The human dimension. Philos. Trans. R. Soc. B Boil. Sci. 2016, 371, 20150171. [Google Scholar] [CrossRef] [PubMed]
  7. Braz, A.M.D.S.; Fernandes, A.R.; Alleoni, L.R.F. SOIL ATTRIBUTES AFTER THE CONVERSION FROM FOREST TO PASTURE IN AMAZON. Degrad. Dev. 2011, 24, 33–38. [Google Scholar] [CrossRef]
  8. de M. Falleiro, R.; Santana, M.T.; Berni, C.R. As Contribuições do Manejo Integrado do Fogo para o Controle dos Incêndios Florestais nas Terras Indígenas do Brasil. Biodiversidade Bras. 2016, 6, 88–105. Available online: http://www.icmbio.gov.br/revistaeletronica/index.php/BioBR/article/view/655 (accessed on 22 March 2019).
  9. Posey, D.A. Indigenous management of tropical forest ecosystems: the case of the Kayapó indians of the Brazilian Amazon. Agrofor. Syst. 1985, 3, 139–158. [Google Scholar] [CrossRef]
  10. Mistry, J.; Bilbao, B.A.; Berardi, A. Community owned solutions for fire management in tropical ecosystems: case studies from Indigenous communities of South America. Philos. Trans. R. Soc. B: Boil. Sci. 2016, 371, 20150174. [Google Scholar] [CrossRef] [Green Version]
  11. Marengo, J.A.; Espinoza, J.C. Extreme seasonal droughts and floods in Amazonia: Causes, trends and impacts. Int. J. Clim. 2015, 36, 1033–1050. [Google Scholar] [CrossRef]
  12. Brando, P.M.; Balch, J.K.; Nepstad, D.C.; Morton, D.C.; Putz, F.E.; Coe, M.T.; Silvério, D.; Macedo, M.N.; Davidson, E.A.; Nóbrega, C.C.; et al. Abrupt increases in Amazonian tree mortality due to drought–fire interactions. Proc. Natl. Acad. Sci. 2014, 111, 6347–6352. [Google Scholar] [CrossRef] [Green Version]
  13. Lima, A.; Silva, T.S.F.; Aragão, L.E.O.E.C.D.; De Feitas, R.M.; Adami, M.; Formaggio, A.R.; Shimabukuro, Y.E. Land use and land cover changes determine the spatial relationship between fire and deforestation in the Brazilian Amazon. Appl. Geogr. 2012, 34, 239–246. [Google Scholar] [CrossRef]
  14. Aragão, L.E.O.C.; Malhi, Y.; Roman-Cuesta, R.M.; Saatchi, S.; Anderson, L.O.; Shimabukuro, Y.E.; Roman-Cuesta, R.M. Spatial patterns and fire response of recent Amazonian droughts. Geophys. Res. Lett. 2007, 34. [Google Scholar] [CrossRef] [Green Version]
  15. Anderson, L.O.; Aragão, L.E.O.C.; Gloor, M.; Arai, E.; Adami, M.; Saatchi, S.S.; Malhi, Y.; Shimabukuro, Y.E.; Barlow, J.; Berenguer, E.; et al. Disentangling the contribution of multiple land covers to fire-mediated carbon emissions in Amazonia during the 2010 drought. Glob. Biogeochem. Cycles 2015, 29, 1739–1753. [Google Scholar] [CrossRef] [PubMed]
  16. Aragao, L.E.O.C.; Anderson, L.O.; Fonseca, M.G.; Rosan, T.M.; Vedovato, L.B.; Wagner, F.H.; Silva, C.V.J.; Junior, C.H.L.S.; Arai, E.; Aguiar, A.P.; et al. 21st Century drought-related fires counteract the decline of Amazon deforestation carbon emissions. Nat Commun 2018, 9, 536. [Google Scholar] [CrossRef]
  17. Li, W.; Fu, R.; Dickinson, R.E. Rainfall and its seasonality over the Amazon in the 21st century as assessed by the coupled models for the IPCC AR4. J. Geophys. Res. Phys. 2006, 111. [Google Scholar] [CrossRef] [Green Version]
  18. Junior, C.H.L.S.; Aragao, L.E.O.C.; Fonseca, M.G.; Almeida, C.T.; Vedovato, L.B.; Anderson, L.O. Deforestation-Induced Fragmentation Increases Forest Fire Occurrence in Central Brazilian Amazonia. Forests 2018, 9, 305. [Google Scholar] [CrossRef]
  19. Aragão, L.E.O.C.; Marengo, J.A.; Cox, P.M.; Betts, R.A.; Costa, D.; Kaye, N.; Alves, L.; Smith, L.; Cavalcanti, I.F.A.; Sampaio, G.; et al. Assessing the Influence of Climate Extremes on Ecosystems and Human Health in Southwestern Amazon Supported by the PULSE-Brazil Platform. Am. J. Clim. Chang. 2016, 5, 399–416. [Google Scholar] [CrossRef]
  20. Da Silva, R.G.; De Lima, J.E. Avaliação econômica da poluição do ar na Amazônia Ocidental: um estudo de caso do Estado do Acre. Rev. de Econ. e Sociol. Rural. 2006, 44, 157–178. [Google Scholar] [CrossRef]
  21. Smith, L.T.; Aragão, L.E.O.C.; Sabel, C.E.; Nakaya, T. Drought impacts on children’s respiratory health in the Brazilian Amazon. Sci. Rep. 2014, 4. [Google Scholar] [CrossRef] [PubMed]
  22. Da Rocha, V.R.; Yamasoe, M.A. Estudo da variabilidade espacial e temporal da profundidade óptica do aerossol obtida com o MODIS sobre a região amazônica. Rev. Bras. de Meteorol. 2013, 28, 210–220. [Google Scholar] [CrossRef] [Green Version]
  23. Nepstad, D.; McGrath, D.; Stickler, C.; Alencar, A.; Azevedo, A.; Swette, B.; Bezerra, T.; DiGiano, M.; Shimada, J.; Da Motta, R.S.; et al. Slowing Amazon deforestation through public policy and interventions in beef and soy supply chains. Science 2014, 344, 1118–1123. [Google Scholar] [CrossRef]
  24. Lewis, S.L.; Brando, P.M.; Phillips, O.; Van Der Heijden, G.M.F.; Nepstad, D. The 2010 Amazon Drought. Science 2011, 331, 554. [Google Scholar] [CrossRef]
  25. Marengo, J.A.; Soares, W.R.; Tomasella, J.; Alves, L.M.; Rodriguez, D.A. The drought of 2010 in the context of historical droughts in the Amazon region. Geophys. Res. Lett. 2011, 38. [Google Scholar] [CrossRef] [Green Version]
  26. Dolman, D.I.; Brown, I.F.; Anderson, L.O.; Warner, J.F.; Marchezini, V.; Santos, G.L.P. Re-thinking socio-economic impact assessments of disasters: The 2015 flood in Rio Branco, Brazilian Amazon. Int. J. Dis. Risk Reduct. 2018, 31, 212–219. [Google Scholar] [CrossRef]
  27. World Resources Report: Decision Making in a Changing Climate. PsycEXTRA Dataset 2013.
  28. Brown, I.F.; Schroeder, W.; Setzer, A.; Maldonado, M.D.L.R.; Pantoja, N.; Duarte, A.; Marengo, J. Monitoring fires in southwestern Amazonia Rain Forests. Eos Trans. AGU 2006, 87, 253. [Google Scholar] [CrossRef] [Green Version]
  29. Reis, V.; Gomes, J.J.; Santos Neto, L.A.; Paiva, E.; Pimental, A.; Marluce, Y.; Marinho, S.C. Operation Manual of the Situation Unit for the Monitoring of Hydrometeorological Events of the Acre State; State Secretary for the Environment - SEMA: Rio Branco, AC, Brazil, 2015; p. 112.
  30. UNIDSR Sendai Framework for Disaster Risk Reduction 2015 – 2030. Sendai, Japan, 2015; p. 37. Available online: https://www.unisdr.org/we/inform/publications/43291 (accessed on 13 July 2018).
  31. Wallemacq, P.; House, R.; McClean, D.; Below, R. Economic Losses, Poverty e Disasters (1998–2017); UNISDR: Geneva, Switzerland, 2018; p. 31. [Google Scholar]
  32. Kumar, P.; Brondizio, E.; Gatzweiler, F.; Gowdy, J.; De Groot, D.; Pascual, U.; Reyers, B.; Sukhdev, P. The economics of ecosystem services: From local analysis to national policies. Curr. Opin. Environ. Sustain. 2013, 5, 78–86. [Google Scholar] [CrossRef]
  33. Mendelsohn, R.; Olmstead, S. The Economic Valuation of Environmental Amenities and Disamenities: Methods and Applications. Annu. Rev. Environ. Resour. 2009, 34, 325–347. [Google Scholar] [CrossRef]
  34. BRASIL Determining territorial boundaries. 2018. Available online: http://www.in.gov.br/materia/-/asset_publisher/Kujrw0TZC2Mb/content/id/27932200 (accessed on 13 July 2018).
  35. OBT-INPE Taxas anuais de desmatamento na Amazônia Legal brasileira. Available online: http://www.obt.inpe.br/prodes/dashboard/prodes-rates.html (accessed on 13 July 2018).
  36. Rodrigues, M.A. Dinâmica espacial do desmatamento no estado do Acre entre 1999 e 2010: o papel do Zoneamento Ecológico Econômico. Doutorado Thesis, UNICAMP, Campinas, SP, Brazil, 2014. [Google Scholar]
  37. Alvares, C.A.; Stape, J.L.; Sentelhas, P.C.; Gonçalves, J.L.D.M.; Sparovek, G. Köppen’s climate classification map for Brazil. Meteorol. Z. 2013, 22, 711–728. [Google Scholar] [CrossRef]
  38. Duarte, A.F. Aspectos da climatologia do Acre, Brail, com base no intervalo 1971–2000. Rev. Bras. Meteorol. 2006, 21, 308–317. Available online: http://www.rbmet.org.br/port/revista/revista_artigo.php?id_artigo=219 (accessed on 1 January 2018).
  39. Anderson, L.O.; Cheek, D.; Aragao, L.E.; Andere, L.; Duarte, B.; Salazar, N.; Lima, A.; Duarte, V.; Arai, E. Development of a Point-based Method for Map Validation and Confidence Interval Estimation: A Case Study of Burned Areas in Amazonia. J. Remote Sens. GIS 2017, 06. [Google Scholar] [CrossRef]
  40. Anderson, L.O.; Aragão, L.E.O.C.; Lima, A.D.; Shimabukuro, Y.E. Detecção de cicatrizes de áreas queimadas baseada no modelo linear de mistura espectral e imagens índice de vegetação utilizando dados multitemporais do sensor MODIS/TERRA no estado do Mato Grosso, Amazônia brasileira. Acta Amaz. 2005, 35, 445–456. [Google Scholar] [CrossRef]
  41. Shimabukuro, Y.E.; Duarte, V.; Arai, E.; Freitas, R.M.; Lima, A.; Valeriano, D.M.; Brown, I.F.; Maldonado, M.L.R. Fraction images derived from Terra Modis data for mapping burnt areas in Brazilian Amazonia. Int. J. Remote Sens. 2009, 30, 1537–1546. [Google Scholar] [CrossRef]
  42. Shimabukuro, Y.E.; Smith, J.A. The least-squares mixing models to generate fraction images derived from remote sensing multispectral data. IEEE Trans. Geosci. Remote Sens. 1991, 29, 16–20. [Google Scholar] [CrossRef]
  43. INPE TerraClass. Available online: http://www.inpe.br/cra/projetos_pesquisas/dados_terraclass.php (accessed on 9 July 2018).
  44. Almeida, C.A.D.; Coutinho, A.C.; Esquerdo, J.C.D.M.; Adami, M.; Venturieri, A.; Diniz, C.G.; Dessay, N.; Durieux, L.; Gomes, A.R. High spatial resolution land use and land cover mapping of the Brazilian Legal Amazon in 2008 using Landsat-5/TM and MODIS data. Acta Amaz. 2016, 46, 291–302. [Google Scholar] [CrossRef] [Green Version]
  45. Coutinho, A.C.; Almeida, C.; Venturieri, A.; Esquerdo, J.C.D.M.; Silva, M. Use and Land Cover in Deforested Areas of the Legal Amazon: TerraClass 2008; Embrapa: Brasilia, DF, Brazil, 2013; ISBN 978-85-7035-180-7. [Google Scholar]
  46. Baccini, A.; Walker, W.; Carvalho, L.; Farina, M.; Sulla-Menashe, D.; Houghton, R.A. Tropical forests are a net carbon source based on aboveground measurements of gain and loss. Science 2017, 358, 230–234. [Google Scholar] [CrossRef]
  47. IBGE PAM - Produção Agrícola Municipal. Available online: https://sidra.ibge.gov.br/pesquisa/pam/tabelas (accessed on 9 July 2018).
  48. Vian, A.L.; Bredemeier, C.; Fochesatto, E.; Drum, M.A.; Pagliarini, N.H.F. Estimating maize biomass through digital images and vegetation sensor. Presented at XXXI CNMS, Bento Gonçalvez, RS, Brazil, 25–29 September 2016. [Google Scholar]
  49. Instituto FNP. Agrianual 2012: Brazilian Agriculture Yearbook; FNP Consultoria: São Paulo, SP, Brazil, 2012; ISBN 9988-7777-7-9. [Google Scholar]
  50. Fernandes, F.D.; Guimarães Júnior, R.; Vieira, E.A.; de F. Fialho, J.; Ramos, A.K.B.; Faleiro, F.G. Productivity of biomass of cassava genotypes in Distrito Federal. 2009. [Google Scholar]
  51. Redin, M. Biochemical composition and decomposition of shoot and roots from comercial crops and cover soil plants. Ph.D. Dissertation, UFSM, Santa Maria, RS, Brazil, 2010. [Google Scholar]
  52. Vuolo, J.H. Fundamentals of Error Theory; 2a.; Edgard Blücher Ltda: São Paulo, Brazil, 1996; ISBN 85-212-0056-0. [Google Scholar]
  53. Boone Kauffman, J.; Cummings, D.L.; Ward, D.E. Fire in the Brazilian Amazon 2. Biomass, nutrient pools and losses in cattle pastures. Oecologia 1998, 113, 415–427. [Google Scholar] [CrossRef] [PubMed]
  54. BRASIL New brazilian forest code. 2012. Available online: http://www.planalto.gov.br/ccivil_03/_Ato2011-2014/2012/Lei/L12651.htm (accessed on 13 July 2018).
  55. Soares-Filho, B.; Rajao, R.; Macedo, M.; Carneiro, A.; Costa, W.; Coe, M.; Rodrigues, H.; Alencar, A. Cracking Brazil’s Forest Code. Science 2014, 344, 363–364. [Google Scholar] [CrossRef] [PubMed]
  56. BRASIL Regulates the constitutional provisions related to agrarian reform. 1993. Available online: http://www.planalto.gov.br/CCIVIL_03/LEIS/L8629.htm (accessed on 13 July 2018).
  57. INCRA Tabela com módulo fiscal dos municípios. Available online: http://www.incra.gov.br/tabela-modulo-fiscal (accessed on 9 July 2018).
  58. Ministério da Saúde Informações de Saúde (TABNET). Available online: http://www2.datasus.gov.br/DATASUS/index.php?area=02 (accessed on 9 July 2018).
  59. DNIT SICRO2. Available online: http://www.dnit.gov.br/custos-e-pagamentos/sicro-2/norte/norte (accessed on 30 June 2018).
  60. Townsend, C.R.; de L. Costa, N. Aspectos econômicos da recuperação de pastagens na Amazônia brasileira. Amaz. Ciênc. Desenvolv. 2010, 5, 27–50. Available online: https://www.alice.cnptia.embrapa.br/bitstream/doc/879776/1/BASAClaudioAspectoseconomicosRecpastCDN10AspectosEconomicosRe1.pdf (accessed on 10 January 2018).
  61. CONAB Grãos - série histórica. Available online: https://portaldeinformacoes.conab.gov.br/index.php/safras/safra-serie-historica (accessed on 9 January 2018).
  62. de Sá, C.P.; de Andrade, C.M.S.; Valentim, J.F. Economic Analysis for Cattle Ranching in Improved Pastures in Acre; EMBRAPA: Rio Branco, AC, Brazil, 2010; ISSN 0100-9915. [Google Scholar]
  63. CEPEA Consulta ao banco de dados de série de preços. Available online: https://www.cepea.esalq.usp.br/br/consultas-ao-banco-de-dados-do-site.aspx (accessed on 9 January 2018).
  64. Markets Insiders Historical prices co2 emission. Available online: https://markets.businessinsider.com/commodities/historical-prices/co2-emissionsrechte/euro/15.11.2007_31.12.2009 (accessed on 30 September 2018).
  65. BCB Cotações e boletins. Available online: https://www4.bcb.gov.br/pec/taxas/port/ptaxnpesq.asp?id=txcotacao (accessed on 9 January 2018).
  66. Morton, D.C.; Le Page, Y.; DeFries, R.; Collatz, G.J.; Hurtt, G.C. Understorey fire frequency and the fate of burned forests in southern Amazonia. Philos. Trans. R. Soc. B Biol. Sci. 2013, 368, 20120163. [Google Scholar] [CrossRef] [PubMed]
  67. Silva, S.S.D.; Fearnside, P.M.; de A. Graça, P.M.L.; Brown, I.F.; Alencar, A.; de Melo, A.W.F. Dynamics of forest fires in the southwestern Amazon. For. Ecol. Manag. 2018, 424, 312–322. [Google Scholar] [CrossRef]
  68. de L. Costa, N. Uso do Fogo no Manejo de Pastagens. AgroLink 2008, 12. Available online: https://www.agrolink.com.br/colunistas/coluna/uso-do-fogo-no-manejo-de-pastagens_385477.html (accessed on 15 January 2018).
  69. Costa, M.R.G.F.; Cândido, M.J.D.; de S. Carneiro, M.S.; de Morais Neto, L.B.; Magalhães, J.A.; de L. Costa, N. Uso do fogo em pastagens naturais. Pubvet 2011, 5. [Google Scholar] [CrossRef] [Green Version]
  70. Godar, J.; Gardner, T.A.; Tizado, E.J.; Pacheco, P. Actor-specific contributions to the deforestation slowdown in the Brazilian Amazon. Proc. Natl. Acad. Sci. 2014, 111, 15591–15596. [Google Scholar] [CrossRef] [Green Version]
  71. Aragão, L.E.O.C.; Shimabukuro, Y.E. The Incidence of Fire in Amazonian Forests with Implications for REDD. Science 2010, 328, 1275–1278. [Google Scholar] [CrossRef] [PubMed]
  72. Weinhold, D.; Reis, E.J.; Vale, P.M. Boom-bust patterns in the Brazilian Amazon. Glob. Environ. Change 2015, 35, 391–399. [Google Scholar] [CrossRef] [Green Version]
  73. Tritsch, I.; Arvor, D. Transition in environmental governance in the Brazilian Amazon: emergence of a new pattern of socio-economic development and deforestation. Land Use Policy 2016, 59, 446–455. [Google Scholar] [CrossRef] [Green Version]
  74. Caviglia-Harris, J.; Sills, E.; Bell, A.; Harris, D.; Mullan, K.; Roberts, D. Busting the Boom–Bust Pattern of Development in the Brazilian Amazon. World Dev. 2016, 79, 82–96. [Google Scholar] [CrossRef] [Green Version]
  75. Hall, S.C.; Caviglia-Harris, J. Agricultural development and the industry life cycle on the Brazilian frontier. Environ. Dev. Econ. 2013, 18, 326–353. [Google Scholar] [CrossRef]
  76. Guedes, G.R.; Brondízio, E.S.; Barbieri, A.F.; Anne, R.; Penna-Firme, R.; D’Antona, Á.O. Poverty and Inequality in the Rural Brazilian Amazon: A Multidimensional Approach. Hum. Ecol. 2012, 40, 41–57. [Google Scholar] [CrossRef]
  77. Andela, N.; Morton, D.C.; Giglio, L.; Chen, Y.; van der Werf, G.R.; Kasibhatla, P.S.; DeFries, R.S.; Collatz, G.J.; Hantson, S.; Kloster, S.; et al. A human-driven decline in global burned area. Science 2017, 356, 1356–1362. [Google Scholar] [CrossRef] [PubMed] [Green Version]
  78. Sills, E.O.; Atmadja, S.S.; Sassi, C.; Duchelle, A.E.; Kweka, D.L.; Resosudarmo, I.A.P.; Sunderlin, W.D. (Eds.) REDD+ on the Ground: A Case Book of Subnational Initiatives across the Globe; Center for International Forestry Research (CIFOR): Bogor, Indonesia, 2014; ISBN 978-602-1504-55-0. [Google Scholar]
  79. BID BR-L1289: The Acre Sustainable Development Program (PDSA-II). Available online: https://www.iadb.org/fr/project/0?projectNumber=2928/OC-BR;BR-L1289 (accessed on 30 September 2018).
  80. de S. Costa, F.; Amaral, E.F. Inventory of Anthropogenic Emissions and Greenhouse Gas Sinks of the State of Acre: Base Year 2012; Embrapa: Brasilia, DF, Brazil, 2014; ISBN 978-85-7035-433-4. [Google Scholar]
  81. SFB Sistema Nacional de Cadastro Ambiental Rural – SICAR. Available online: http://www.car.gov.br/publico/imoveis/index (accessed on 9 January 2018).
  82. CEGDRA Integrated Plan for the Prevention, Control and Combat of Burning and Forest Fires in the State of Acre, 3rd ed.; SEMA: Rio Branco, AC, Brazil, 2013; ISBN 577.4098112.
  83. MAPA Sector Plan for Mitigation and Adaptation to Climate Change for the Consolidation of a Low Carbon Economy in Agriculture: ABC (Low Carbon Agriculture) Plan; MAPA/ACS: Brasilia, DF, Brazil, 2012; ISBN 978-85-7991-062-0.
  84. Leonel, M. O uso do fogo: o manejo indígena e a piromania da monocultura. Estud. Av. 2000, 14, 231–250. [Google Scholar] [CrossRef] [Green Version]
  85. Graf, R. Agroecology of the indigenous peoples of Acre: Ethics of well-being. Presented at the AGROECOL, Dourados, MS, Brazil, 16–19 November 2016. [Google Scholar]
  86. BRASIL National System of Conservation Units. 2000. Available online: http://www.planalto.gov.br/ccivil_03/LEIS/L9985.htm (accessed on 13 July 2018).
  87. Torres, F.T.P.; Lima, G.S.; Costa, A.D.G.; Félix, G.D.A.; Silva Júnior, M.R. Profile of forest fires in Brazilian Conservation Units from 2008 to 2012. FLORESTA 2017, 46, 531. [Google Scholar] [CrossRef]
  88. Kurtis, J.N.; Joel, A.C.; Birgit, E.P.; Joshua, J.P. LANDFIRE 2010 - updated data to support wildfire and ecological management. IEEE 2013. Available online: http://pubs.er.usgs.gov/publication/70048192 (accessed on 19 January 2018).
  89. Salimon, C.I.; Putz, F.E.; Menezes-Filho, L.; Anderson, A.; Silveira, M.; Brown, I.F.; Oliveira, L.C. Estimating state-wide biomass carbon stocks for a REDD plan in Acre, Brazil. For. Ecol. Manag. 2011, 262, 555–560. [Google Scholar] [CrossRef]
  90. Nepstad, D.; Moutinho, P.; Boyd, W.; Azevedo, A.; Bezerra, T.; Smid, B.; Stabile, M.C.C.; Stickler, C.; Stella, O. Unlocking jurisdictional REDD+ as a policy framework for low-emission rural development: research results and recommendations for governments. 2012, p. 22. Available online: https://earthinnovation.org/wp-content/uploads/2014/09/re-framing_redd_english.pdf (accessed on 10 January 2018).
  91. Silva, R.G.D.; Silveira, B.C.; Silveira, A.O.D.A. Relationship between burnings and respiratory morbidities in Acre from 1998 to 2005: A spatial approach 2008. Presented at XLVI Sober, Rio Branco, AC, Brazil, 2008; Available online: http://www.sober.org.br/palestra/9/139.pdf (accessed on 13 July 2018).
  92. IBGE Censo Demográfico 2010. Available online: https://censo2010.ibge.gov.br/resultados.html (accessed on 9 January 2018).
  93. IBGE Bases e referências: Malhas digitais. Available online: https://mapas.ibge.gov.br/bases-e-referenciais/bases-cartograficas/malhas-digitais (accessed on 9 January 2018).
  94. MMA Download de dados geográficos. Available online: http://mapas.mma.gov.br/i3geo/datadownload.htm (accessed on 30 September 2018).
  95. FUNAI Geoprocessamento. Terras Indígenas do Brasil. Available online: http://www.funai.gov.br/index.php/shape (accessed on 9 January 2018).
  96. IBGE Pesquisa da Pecuária Municipal. Available online: https://sidra.ibge.gov.br/tabela/3939 (accessed on 30 September 2018).
  97. IPEA IPEA-Data. Available online: http://www.ipeadata.gov.br/Default.aspx (accessed on 30 September 2018).
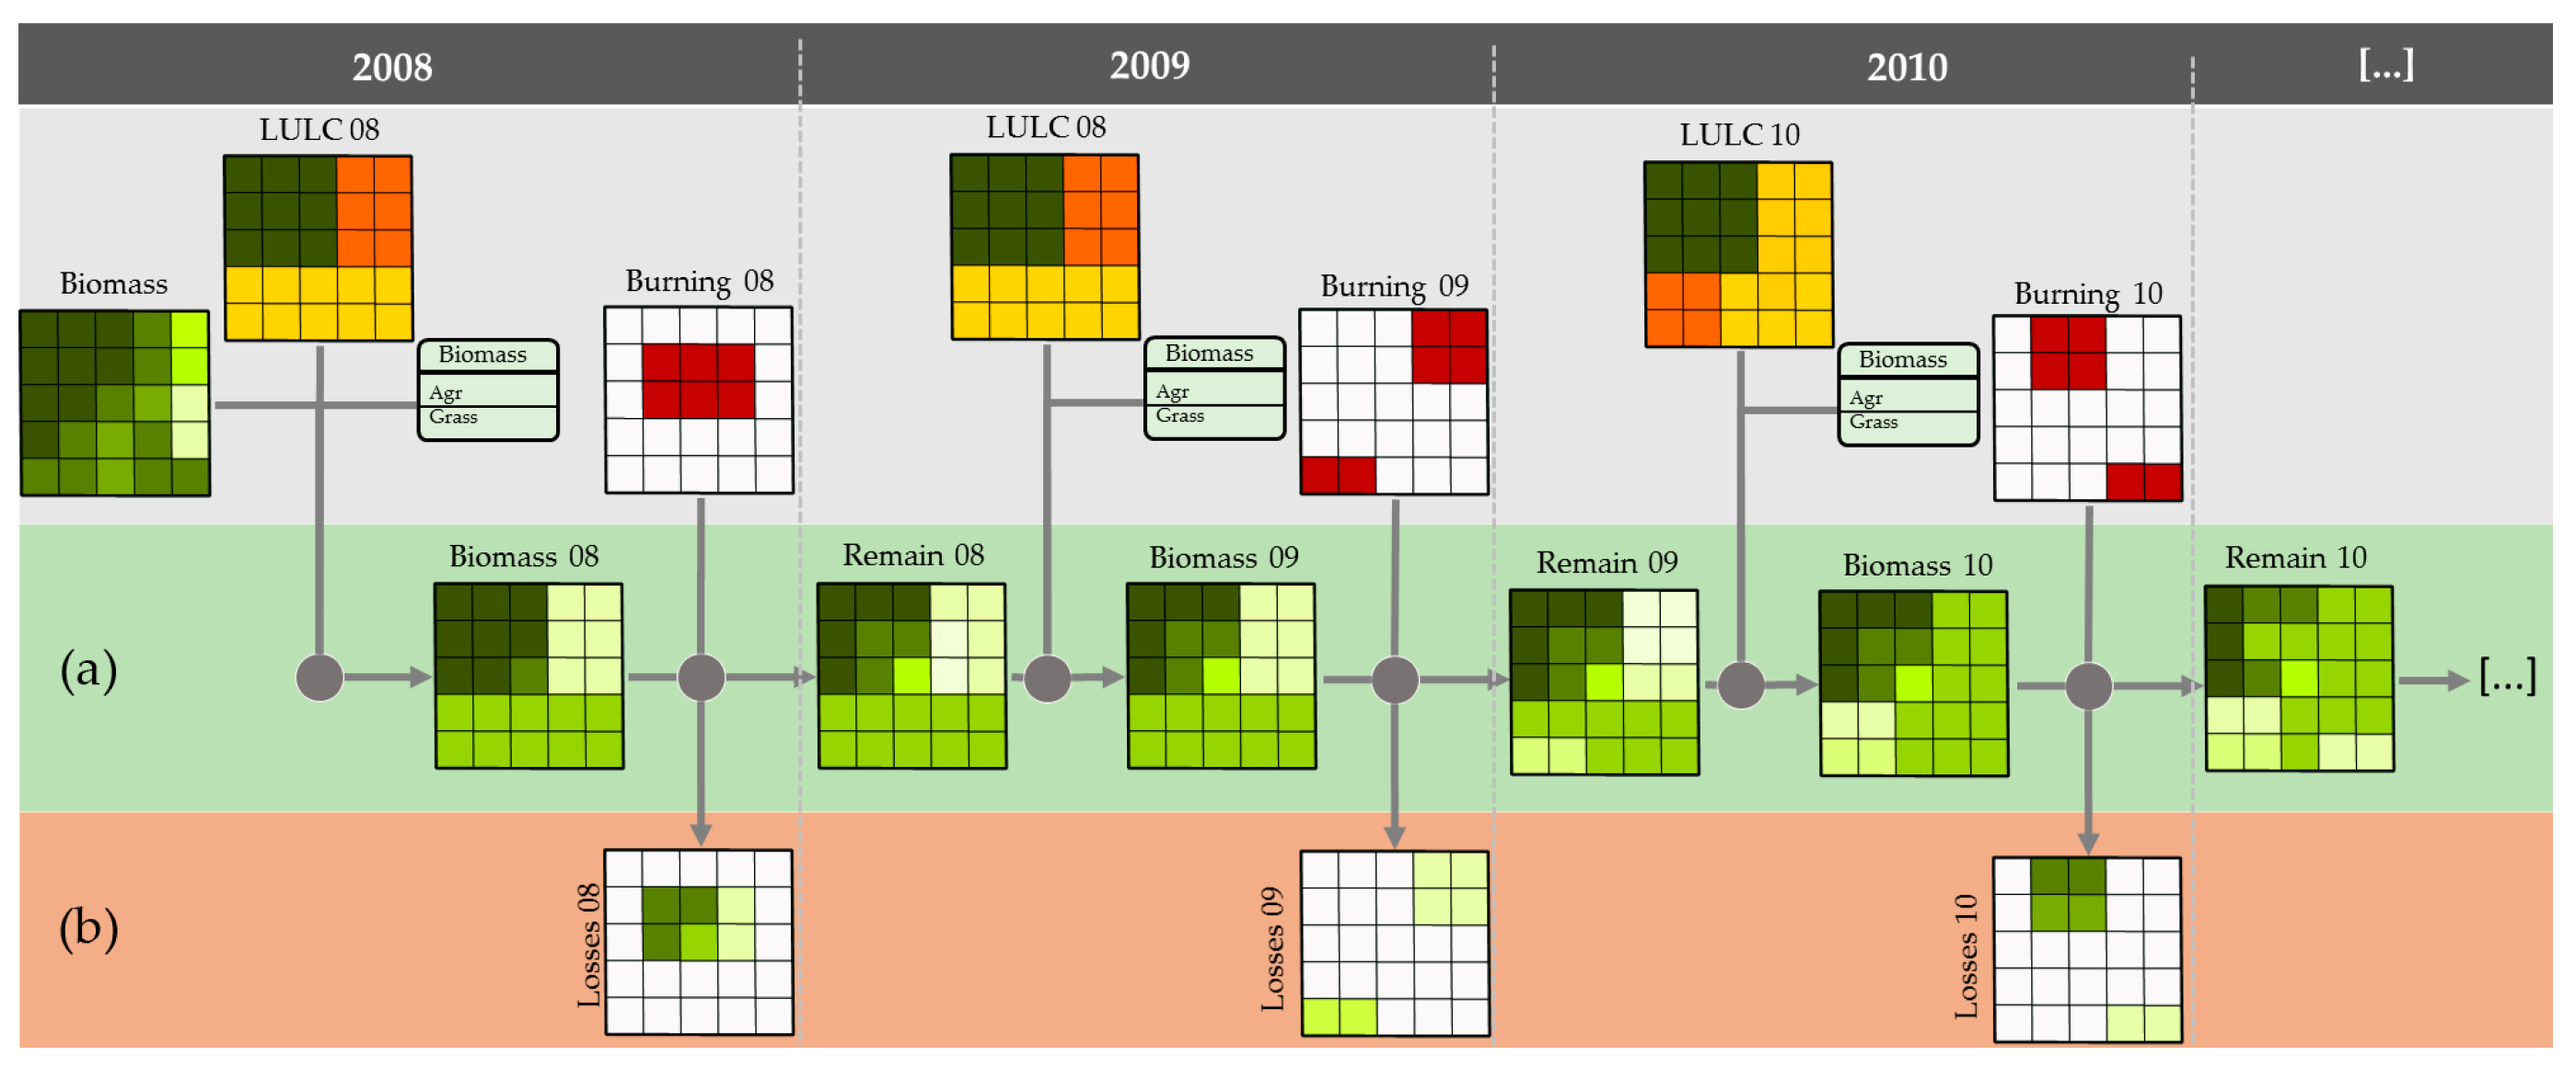
Figure 1. Workflow for generating the annual maps of remaining and loss of biomass. (a) The green panel represents the 2008–2010 annual potential biomass maps, which were processed from the annual burned area maps; 2008, 2010, and 2012 land use and land cover (LULC) maps; and a table of reference biomass values for each grouped LULC classes. (b) The red panel represents the 2008–2010 annual biomass loss maps, derived from an empirical relationship between pre and post-fire biomass applied to the potential biomass maps where a fire event was depicted by the burned area maps.
Remotesensing 11 00764 g001
Figure 2. Burn scars in Acre state (Brazil), mapped with 250 m spatial resolution, for the regular climate years of 2008, 2009, 2011, and 2012 (a) and for the 2010 drought year (b).
Remotesensing 11 00764 g002
Figure 3. Evaluation of the annual burned area time series from 2008 to 2012. (a) Contribution of each burned polygon size to the total burned area; (b) total burned area (ha) with upper and lower limits; (c) anomaly of number of burned scars, normalized by its standard deviation (σ) for the 2008–2012 period; (d) Distribution of burn polygon sizes, where the sides of each violin is a kernel density function; the red dot represents the median; the white bar indicates the interquartile range; the straight vertical line represents the 95% confidence interval; and the white dots represent outlier polygons.
Remotesensing 11 00764 g003
Figure 4. The proportion of burned area by (a) management types; (b) land use and land cover; (c) propriety class.
Remotesensing 11 00764 g004
Figure 5. The proportion of burned area by land use and land cover types (a) and by special areas (b), through the years analyzed.
Remotesensing 11 00764 g005
Figure 6. The proportion of biomass loss (b) and CO2 emissions (c) by land use and land cover types and the total biomass loss (a) and total emissions(d) through the years analyzed.
Remotesensing 11 00764 g006
Figure 7. Correlation between respiratory morbidity and burned area by year analyzed, with the determination coefficient value (r2), the correlation coefficient value (r), and the specific p-values.
Remotesensing 11 00764 g007
Figure 8. Percentage of economic loss by type of damage (a), total economic loss (b), and GDP equivalence (c) by year.
Remotesensing 11 00764 g008
Table 1. Summary of TerraClass land use and land cover (LULC) types, which were grouped for developing this work.
TerraClass LULC TypesGrouped LULC Categories
Primary forests and secondary vegetationForests
Annual crops and Mosaic of usesAgriculture
Herbaceous pasture, Scrubby pasture, Pasture with exposed soil and Regeneration with pasture Pastures