Characterizing and Monitoring Ground Settlement of Marine Reclamation Land of Xiamen New Airport, China with Sentinel-1 SAR Datasets


Abstract
1. Introduction
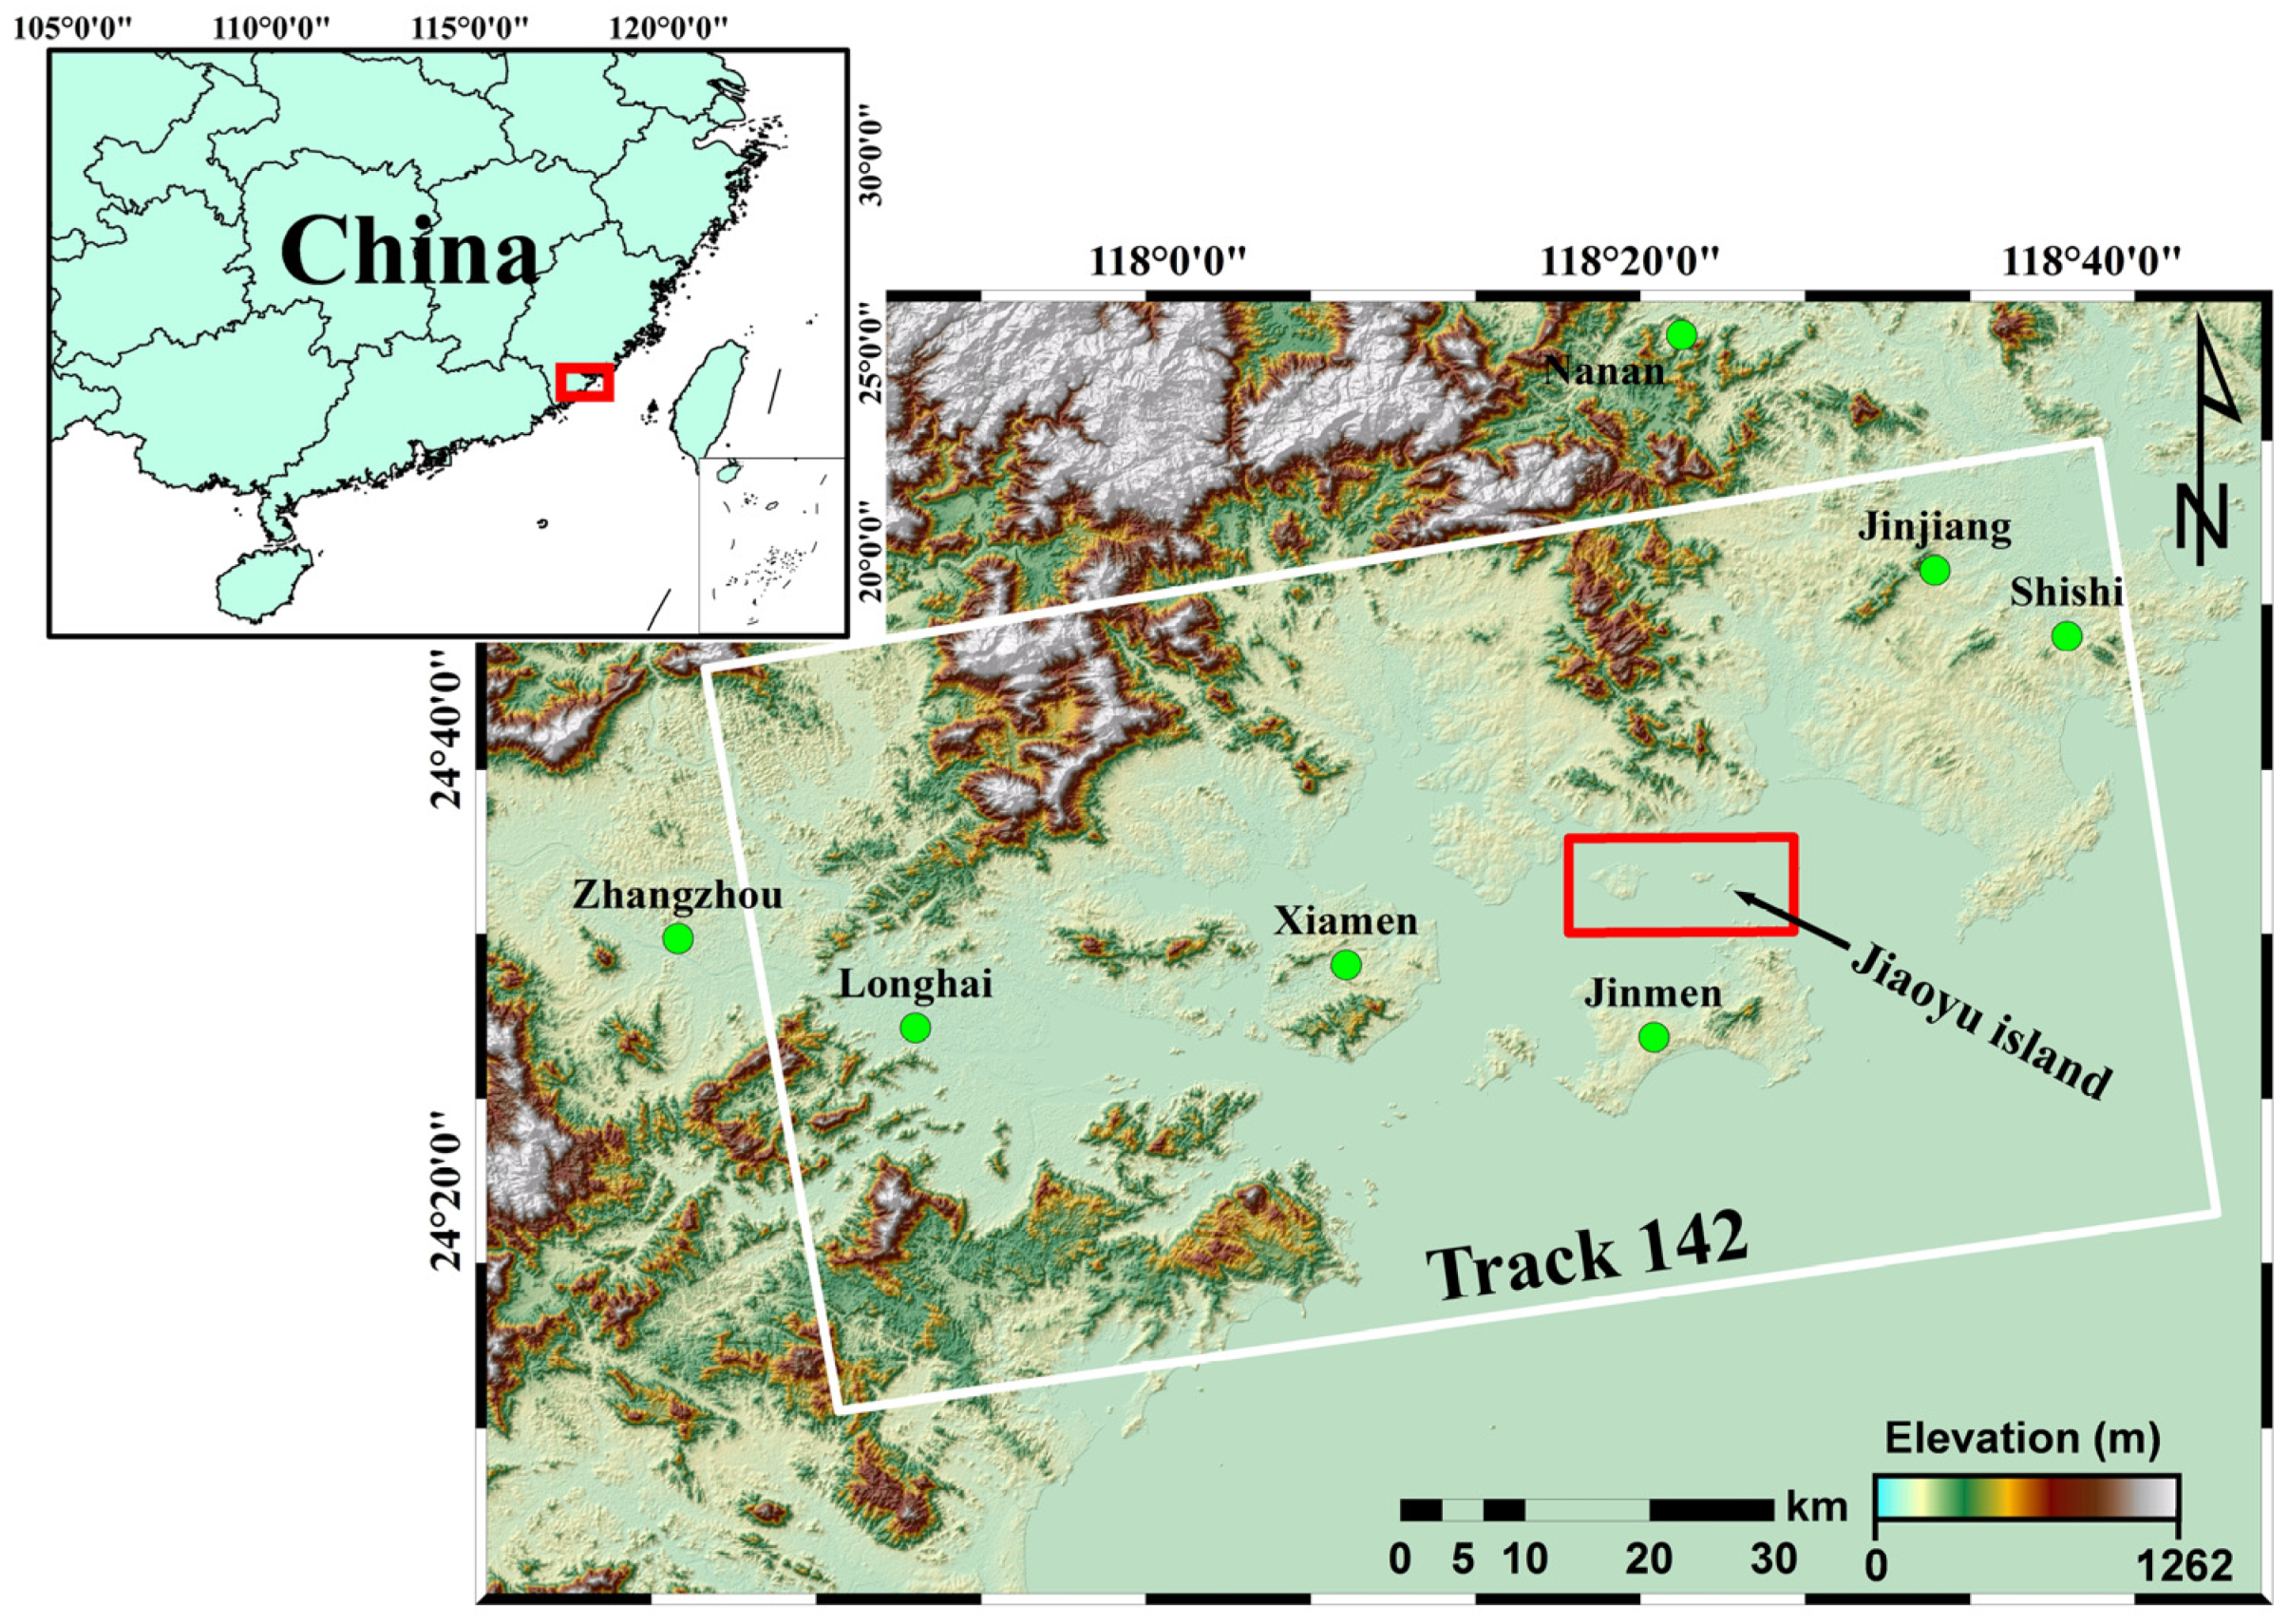
2. Study Area
3. Data and Methodology
3.1. Datasets
3.2. Methodology
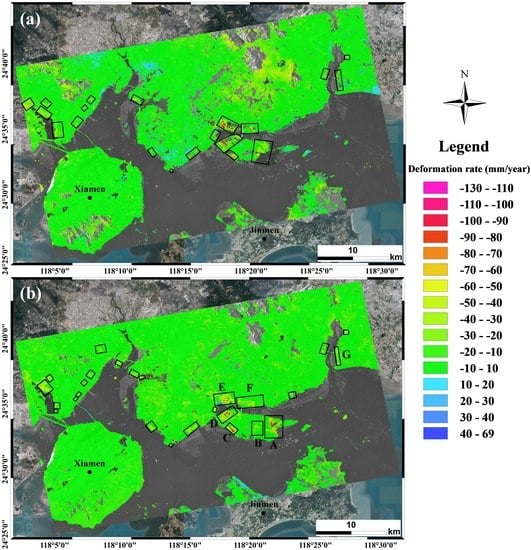
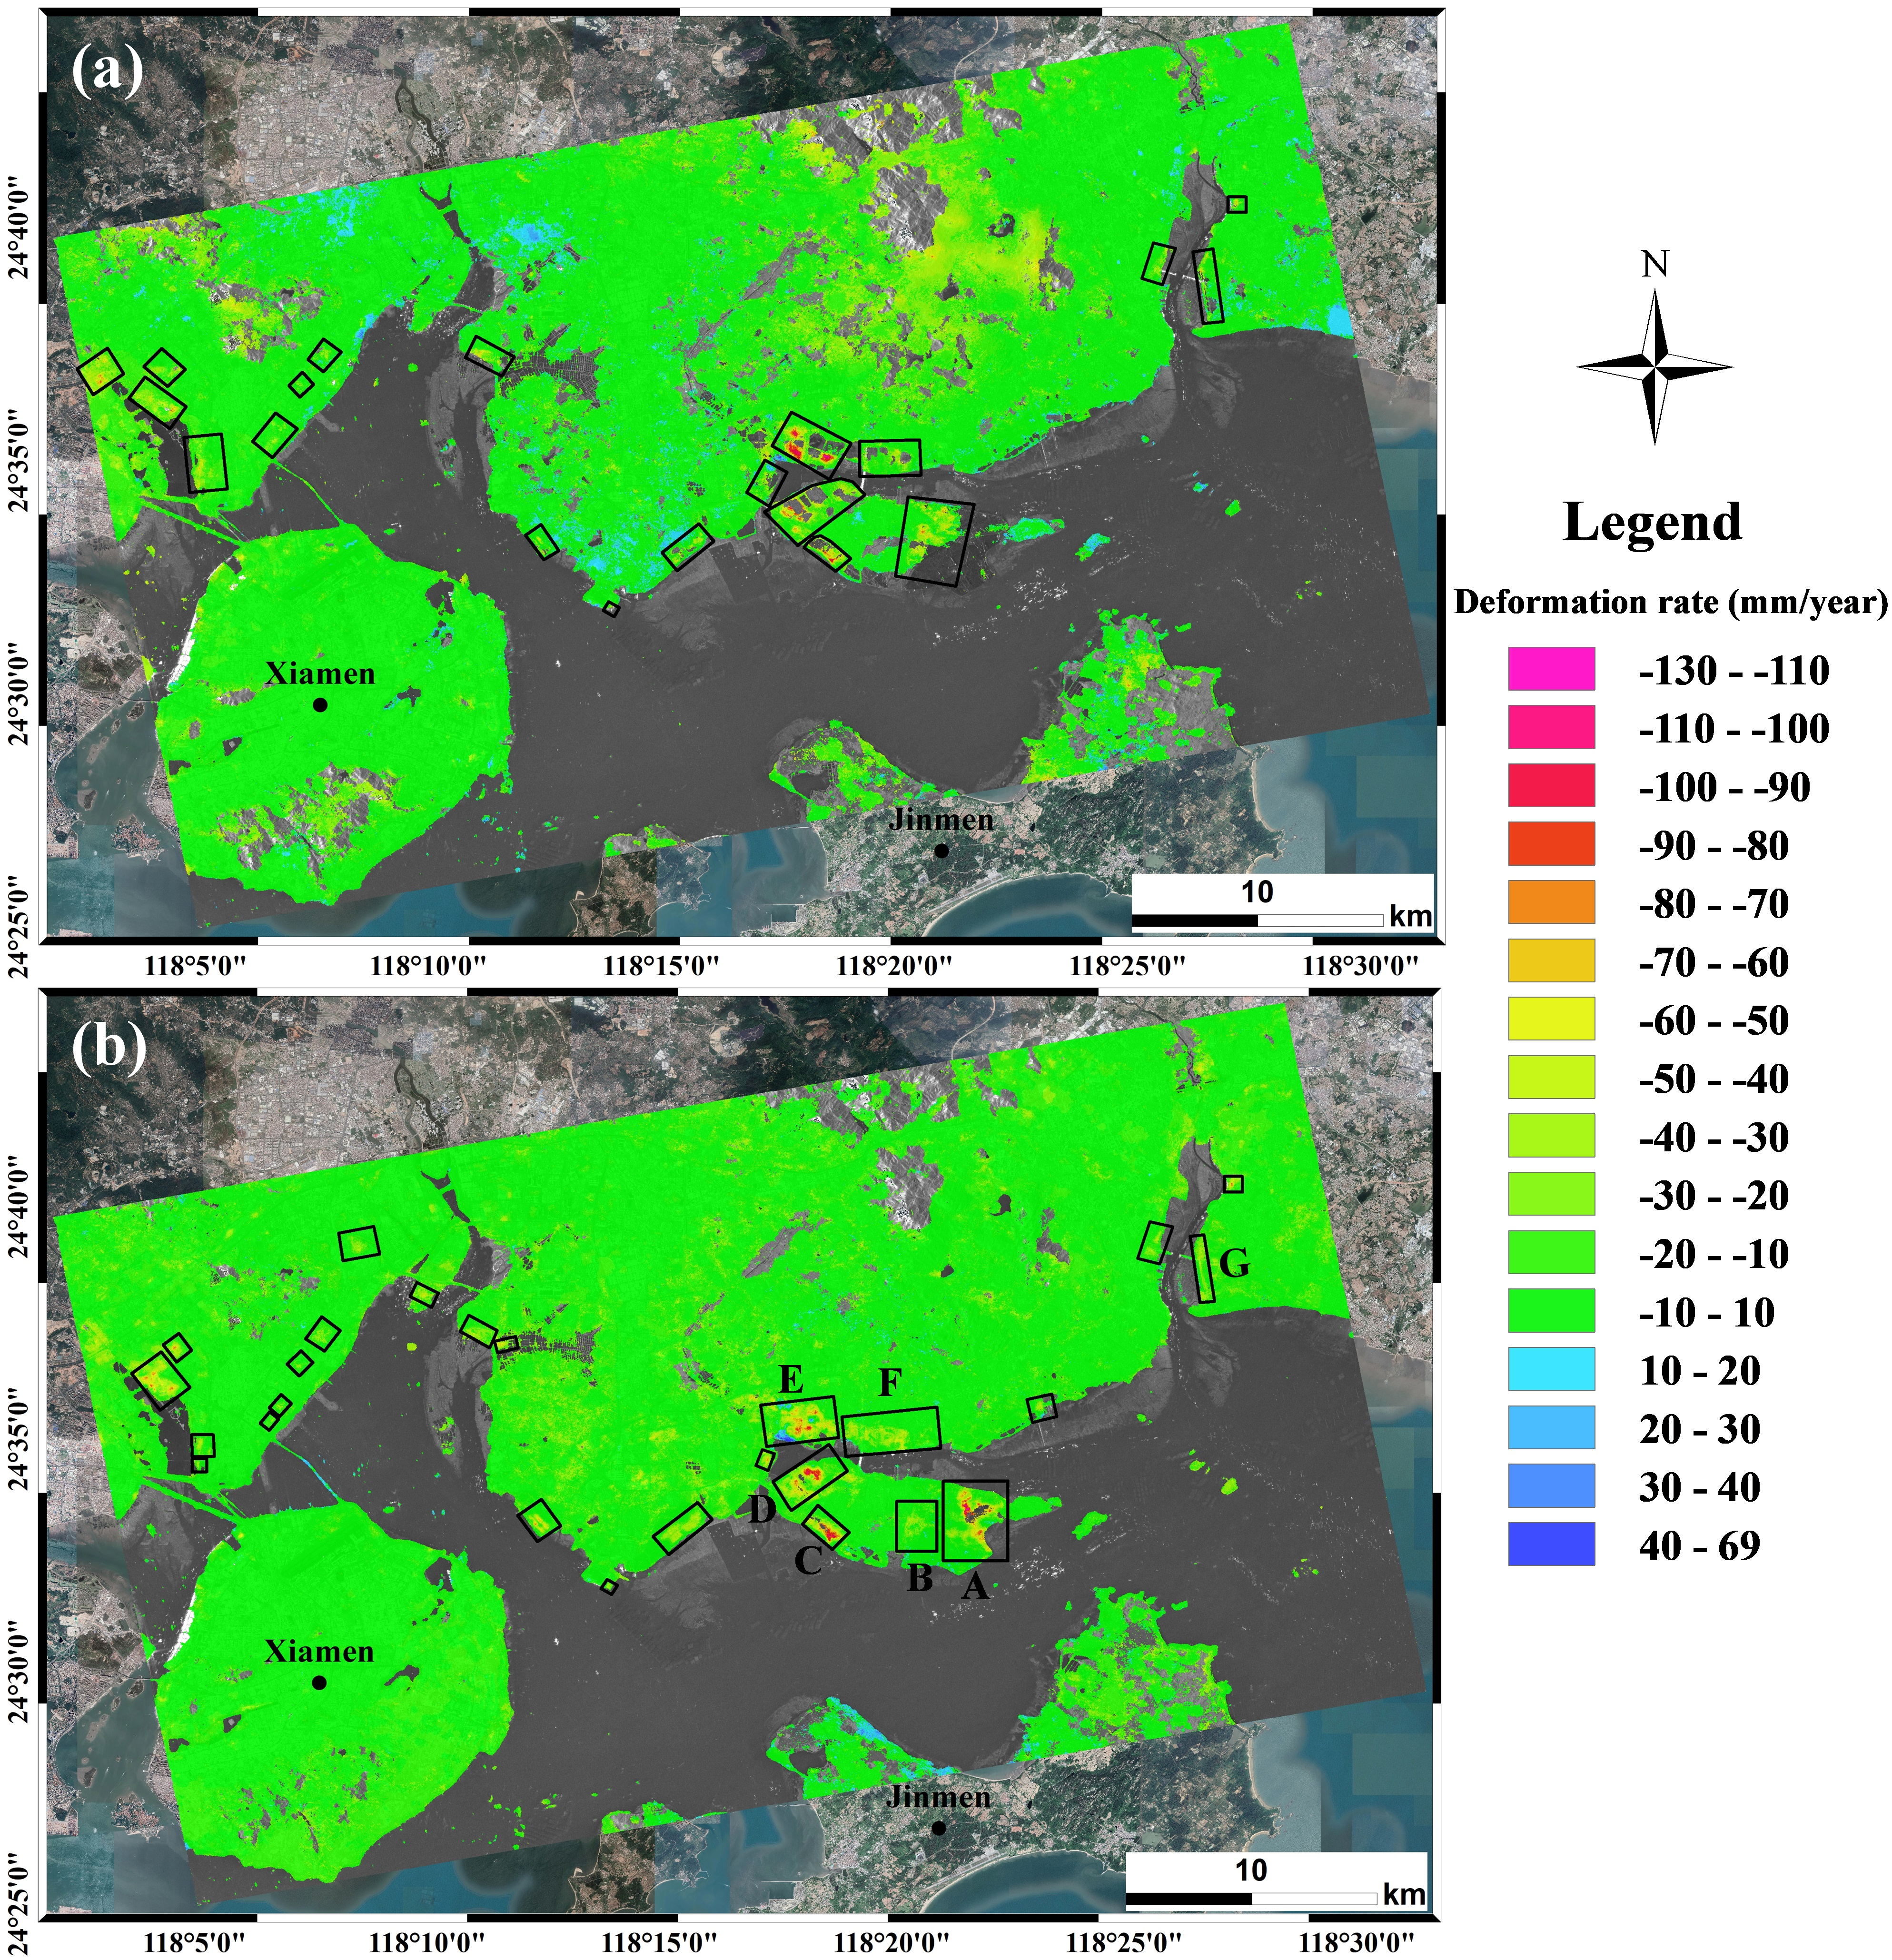
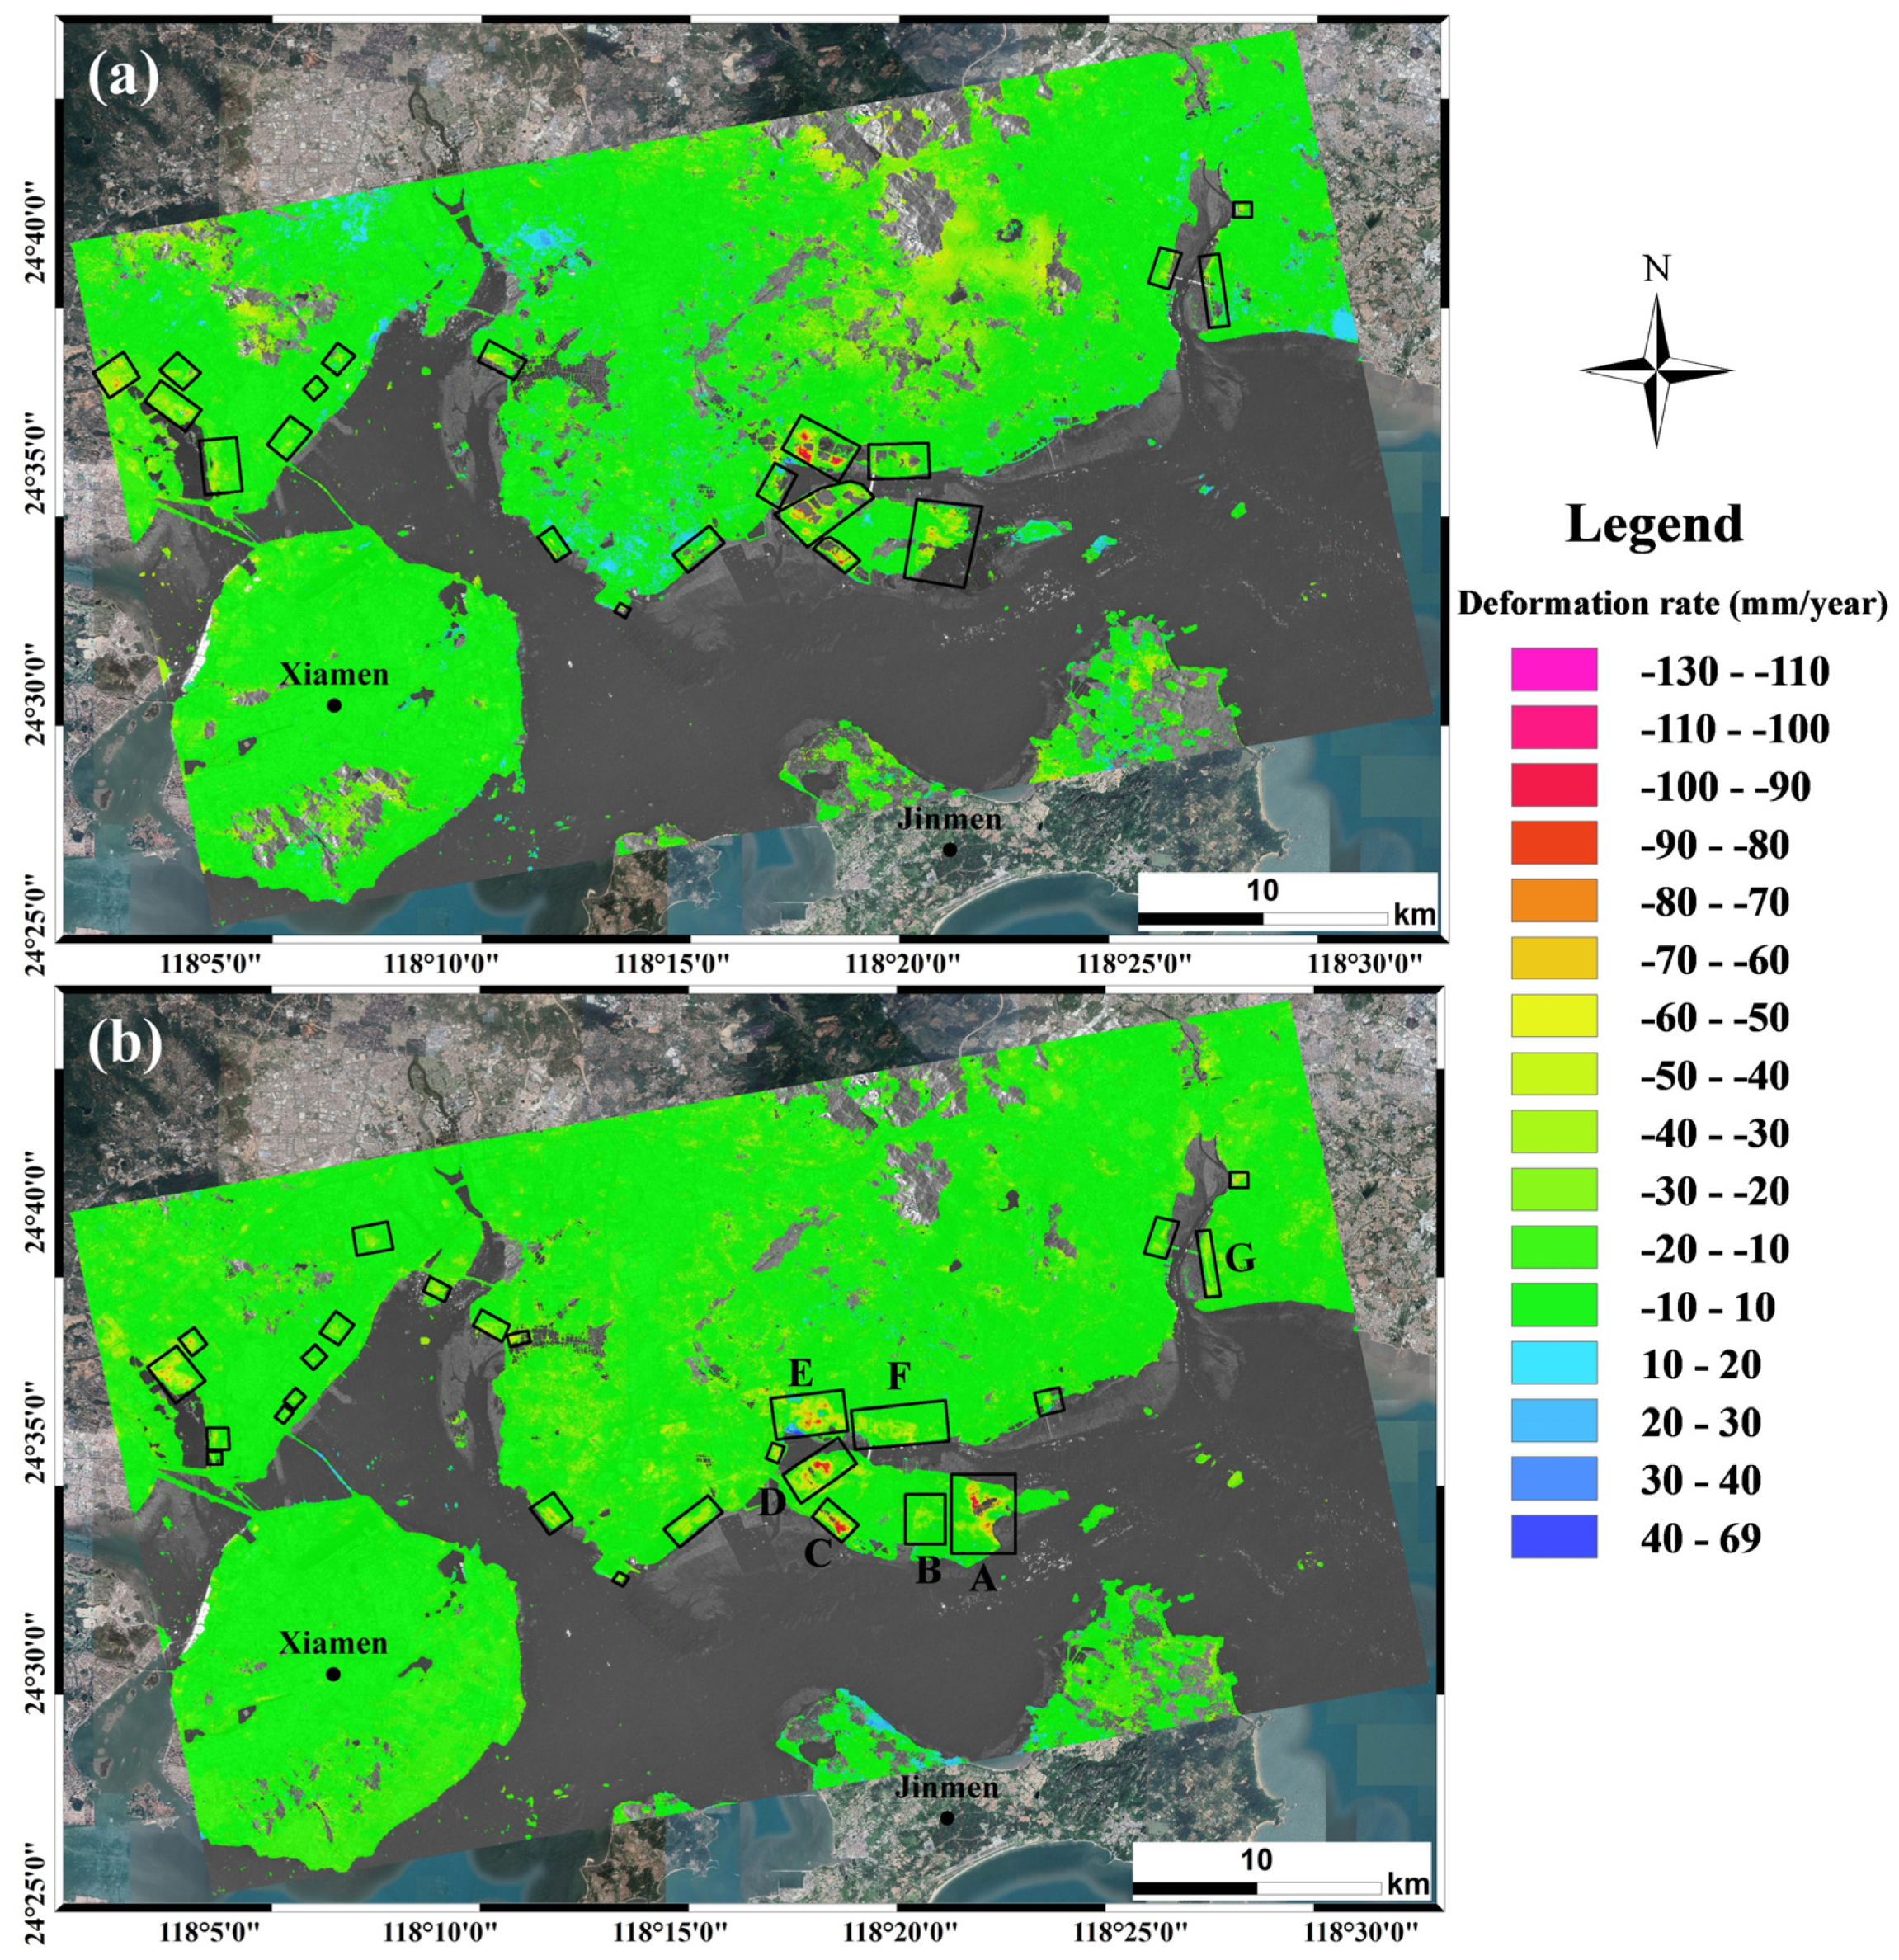
4. InSAR Results
5. Analysis and Discussion
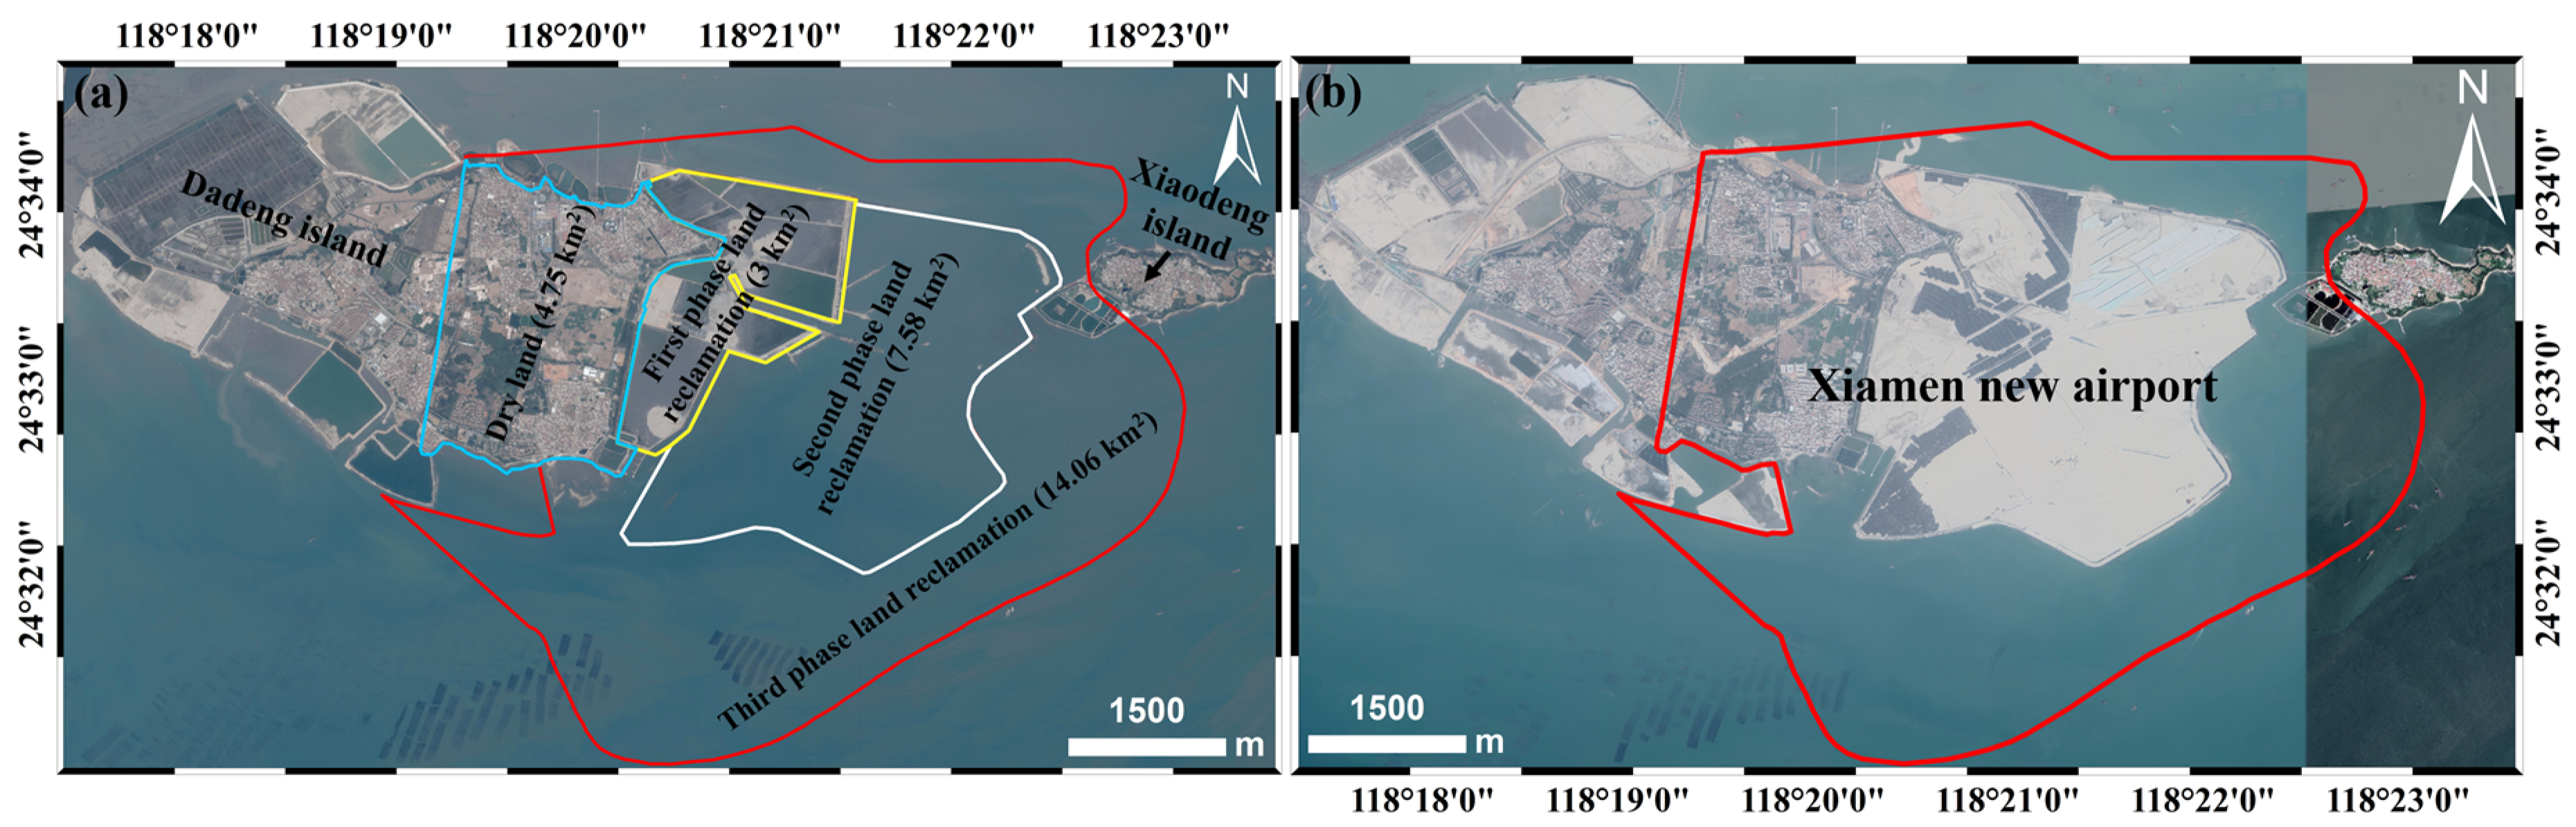
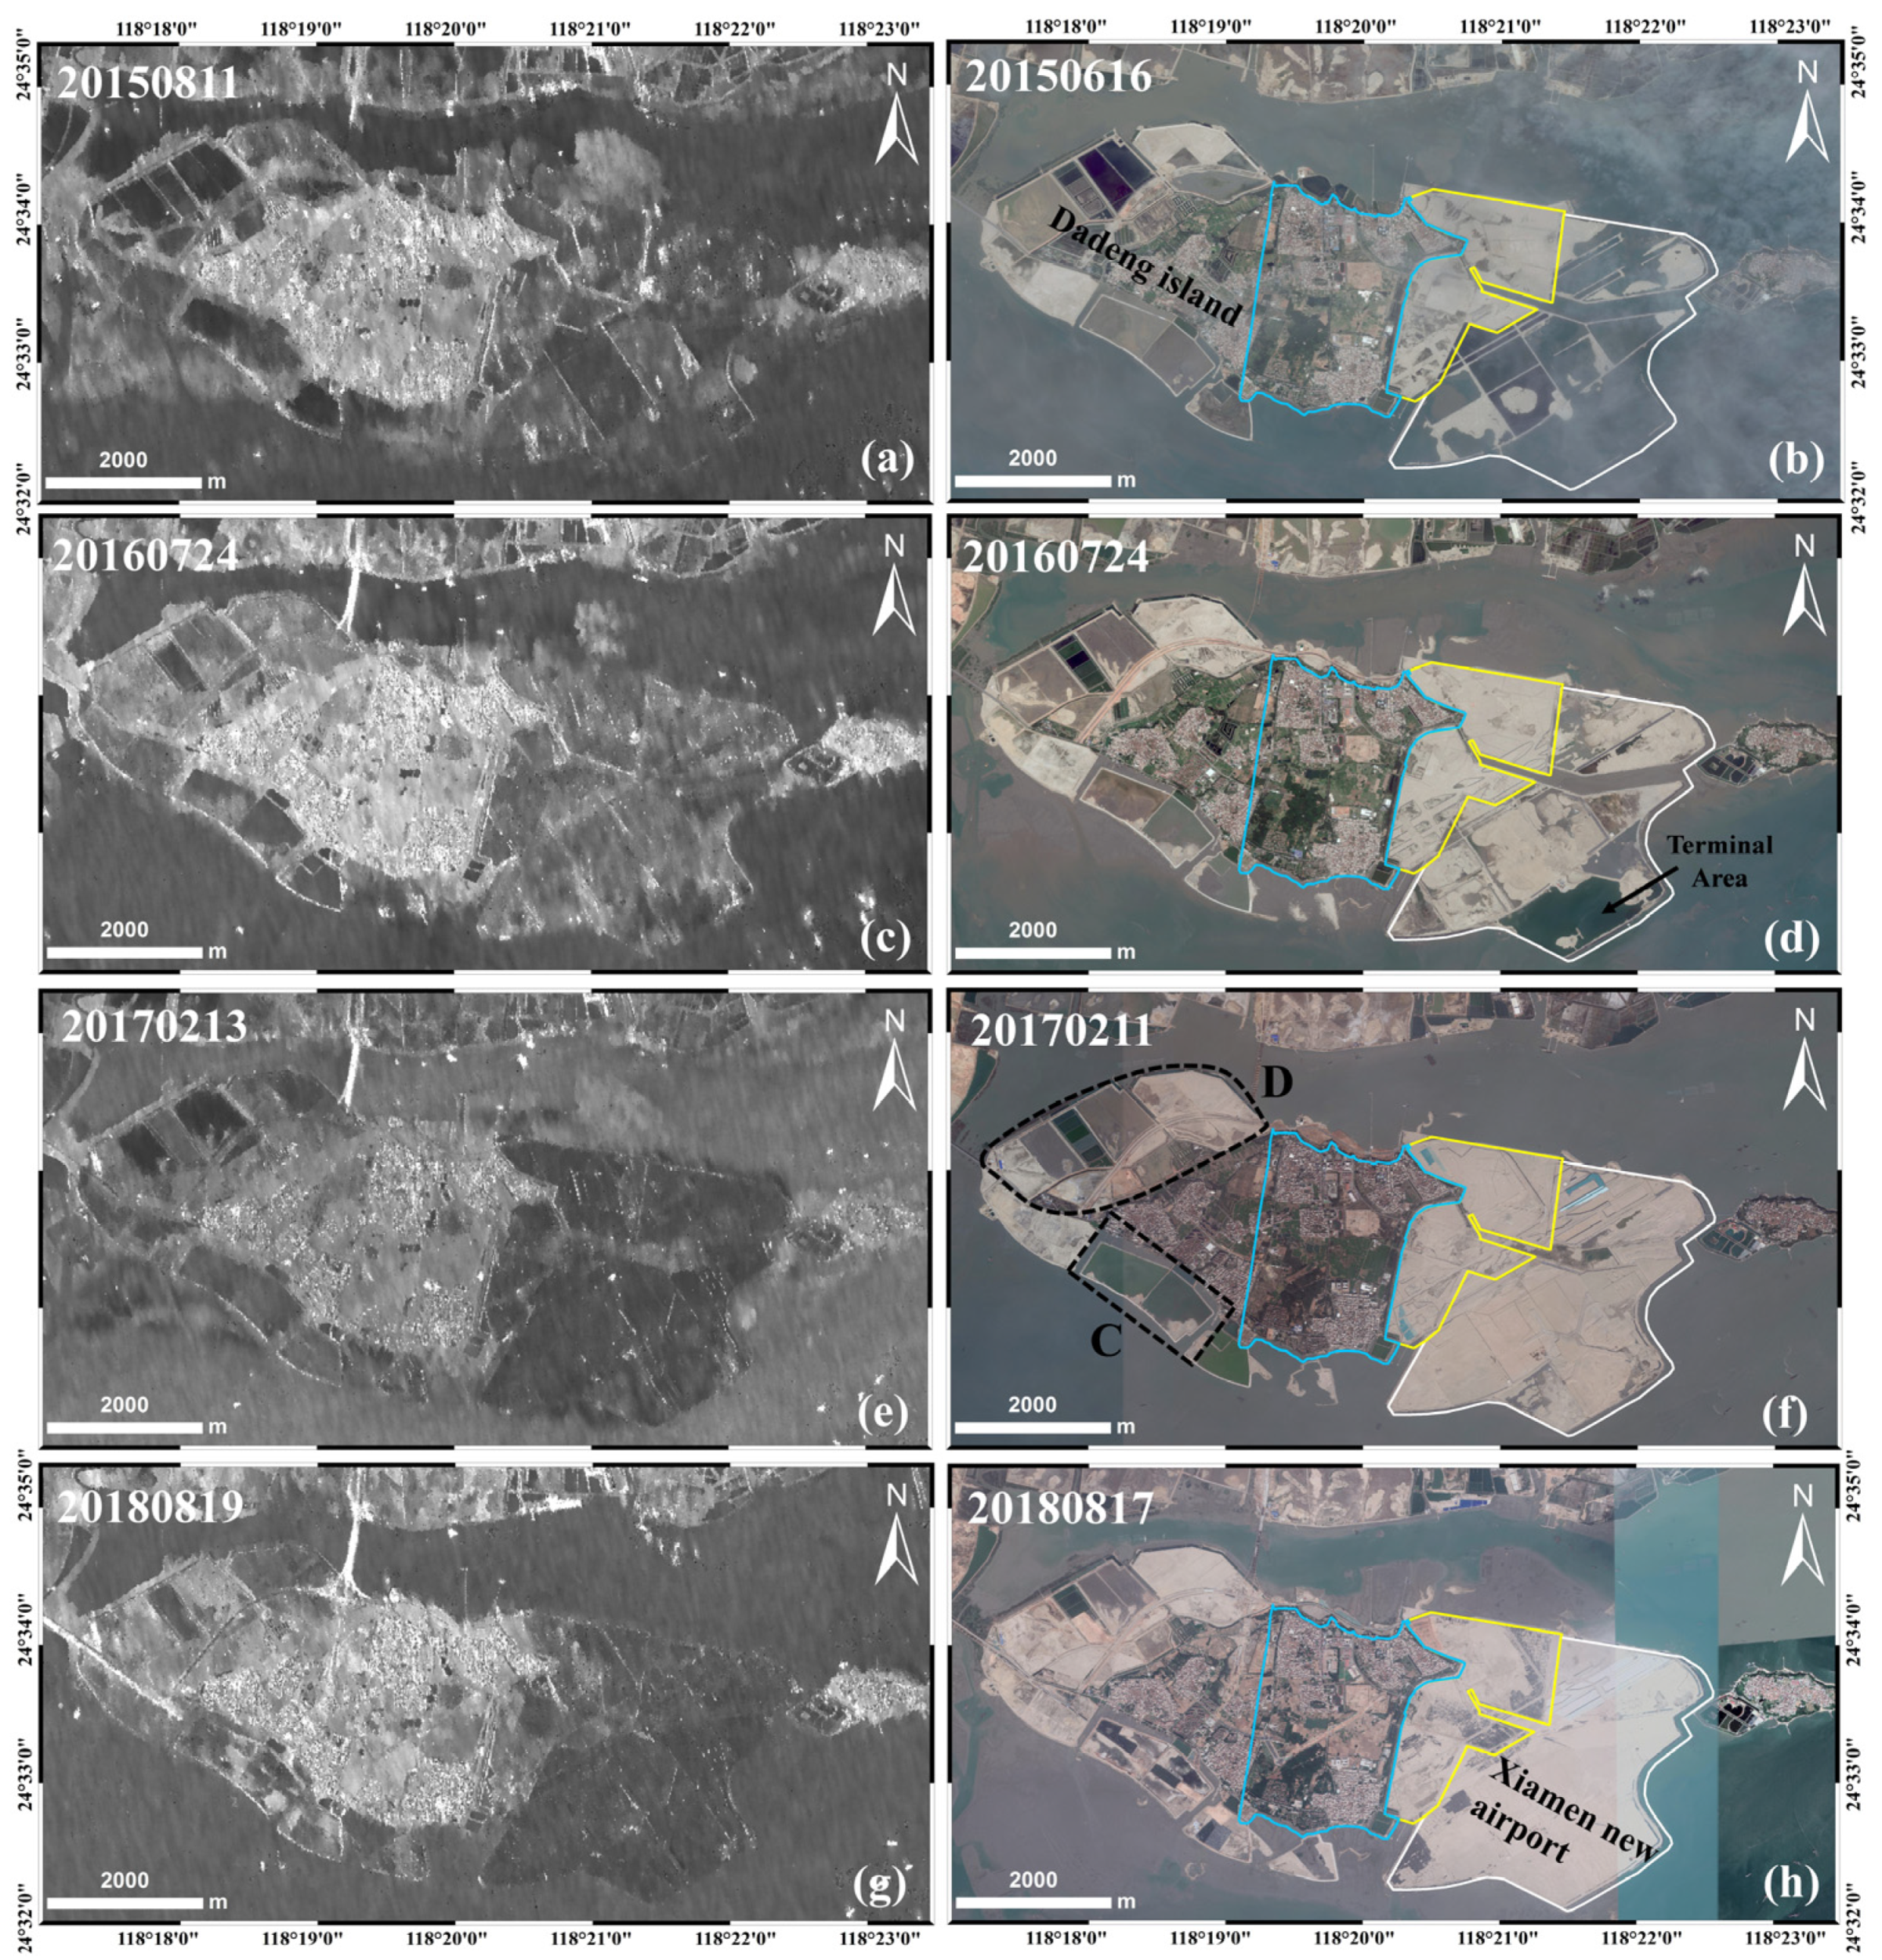
5.1. Spatial Evolution of Land Reclamation at Xiamen New Airport
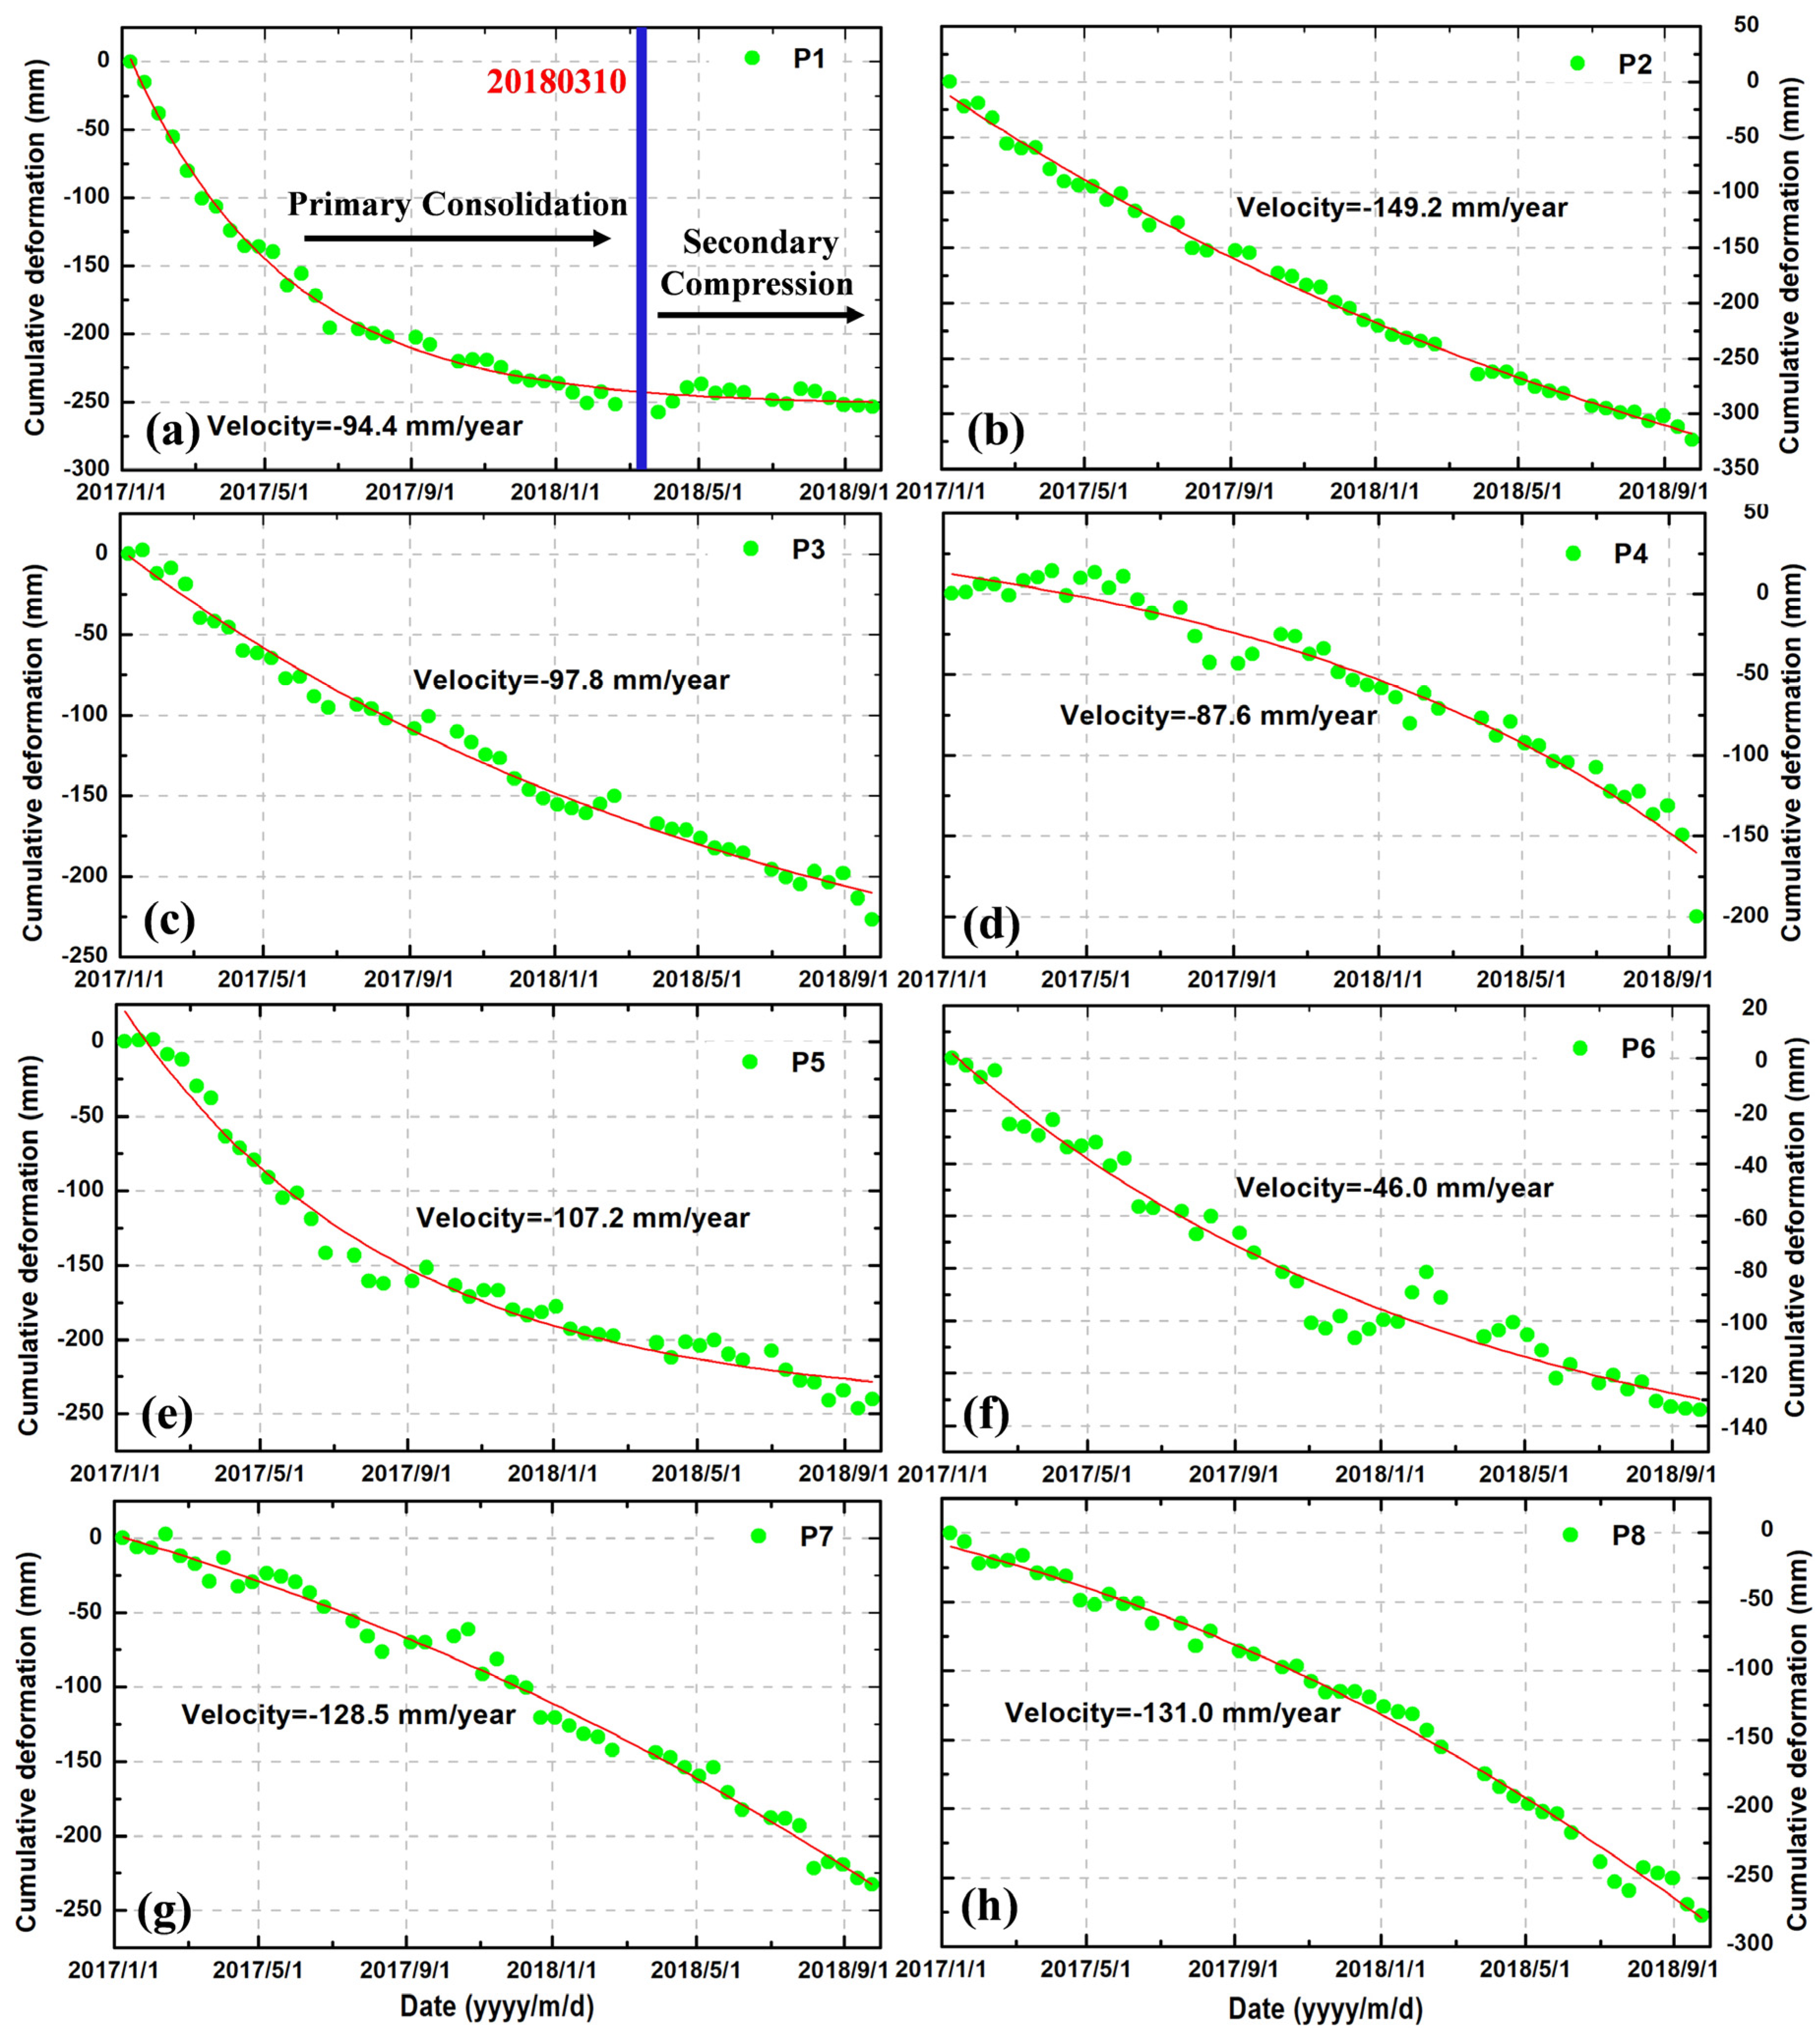
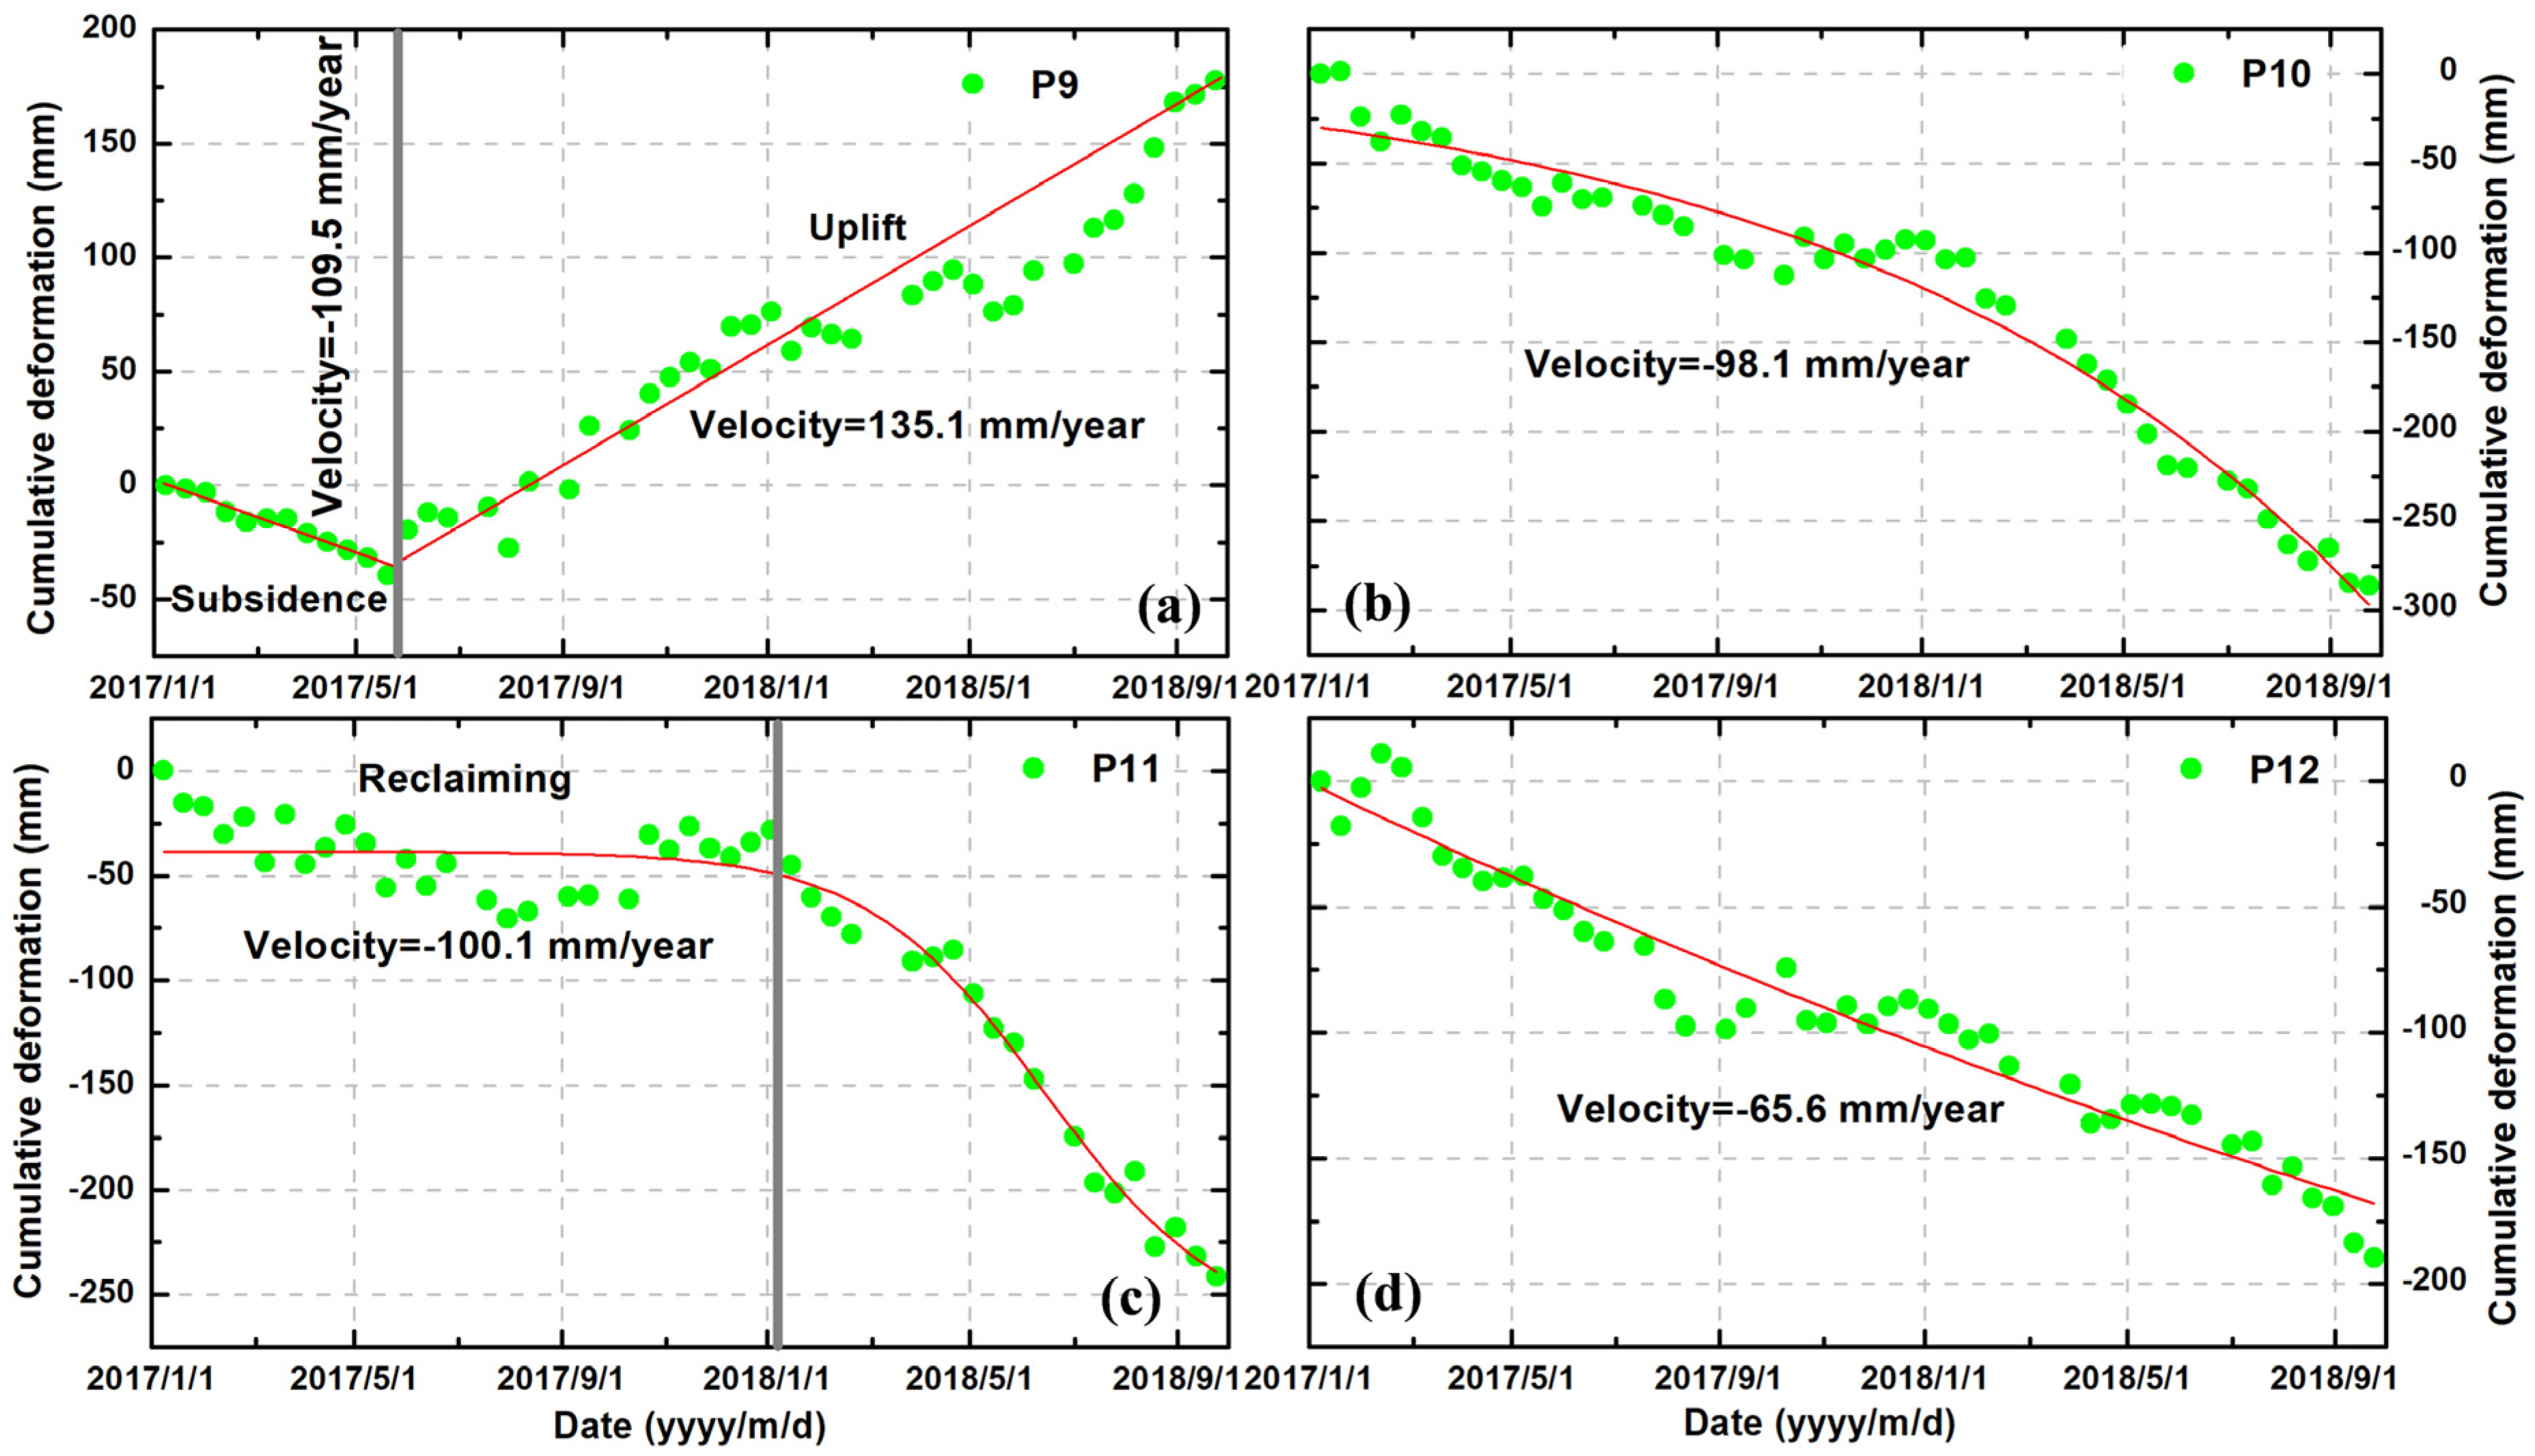
5.2. Spatiotemporal Deformation Patterns of Xiamen New Airport
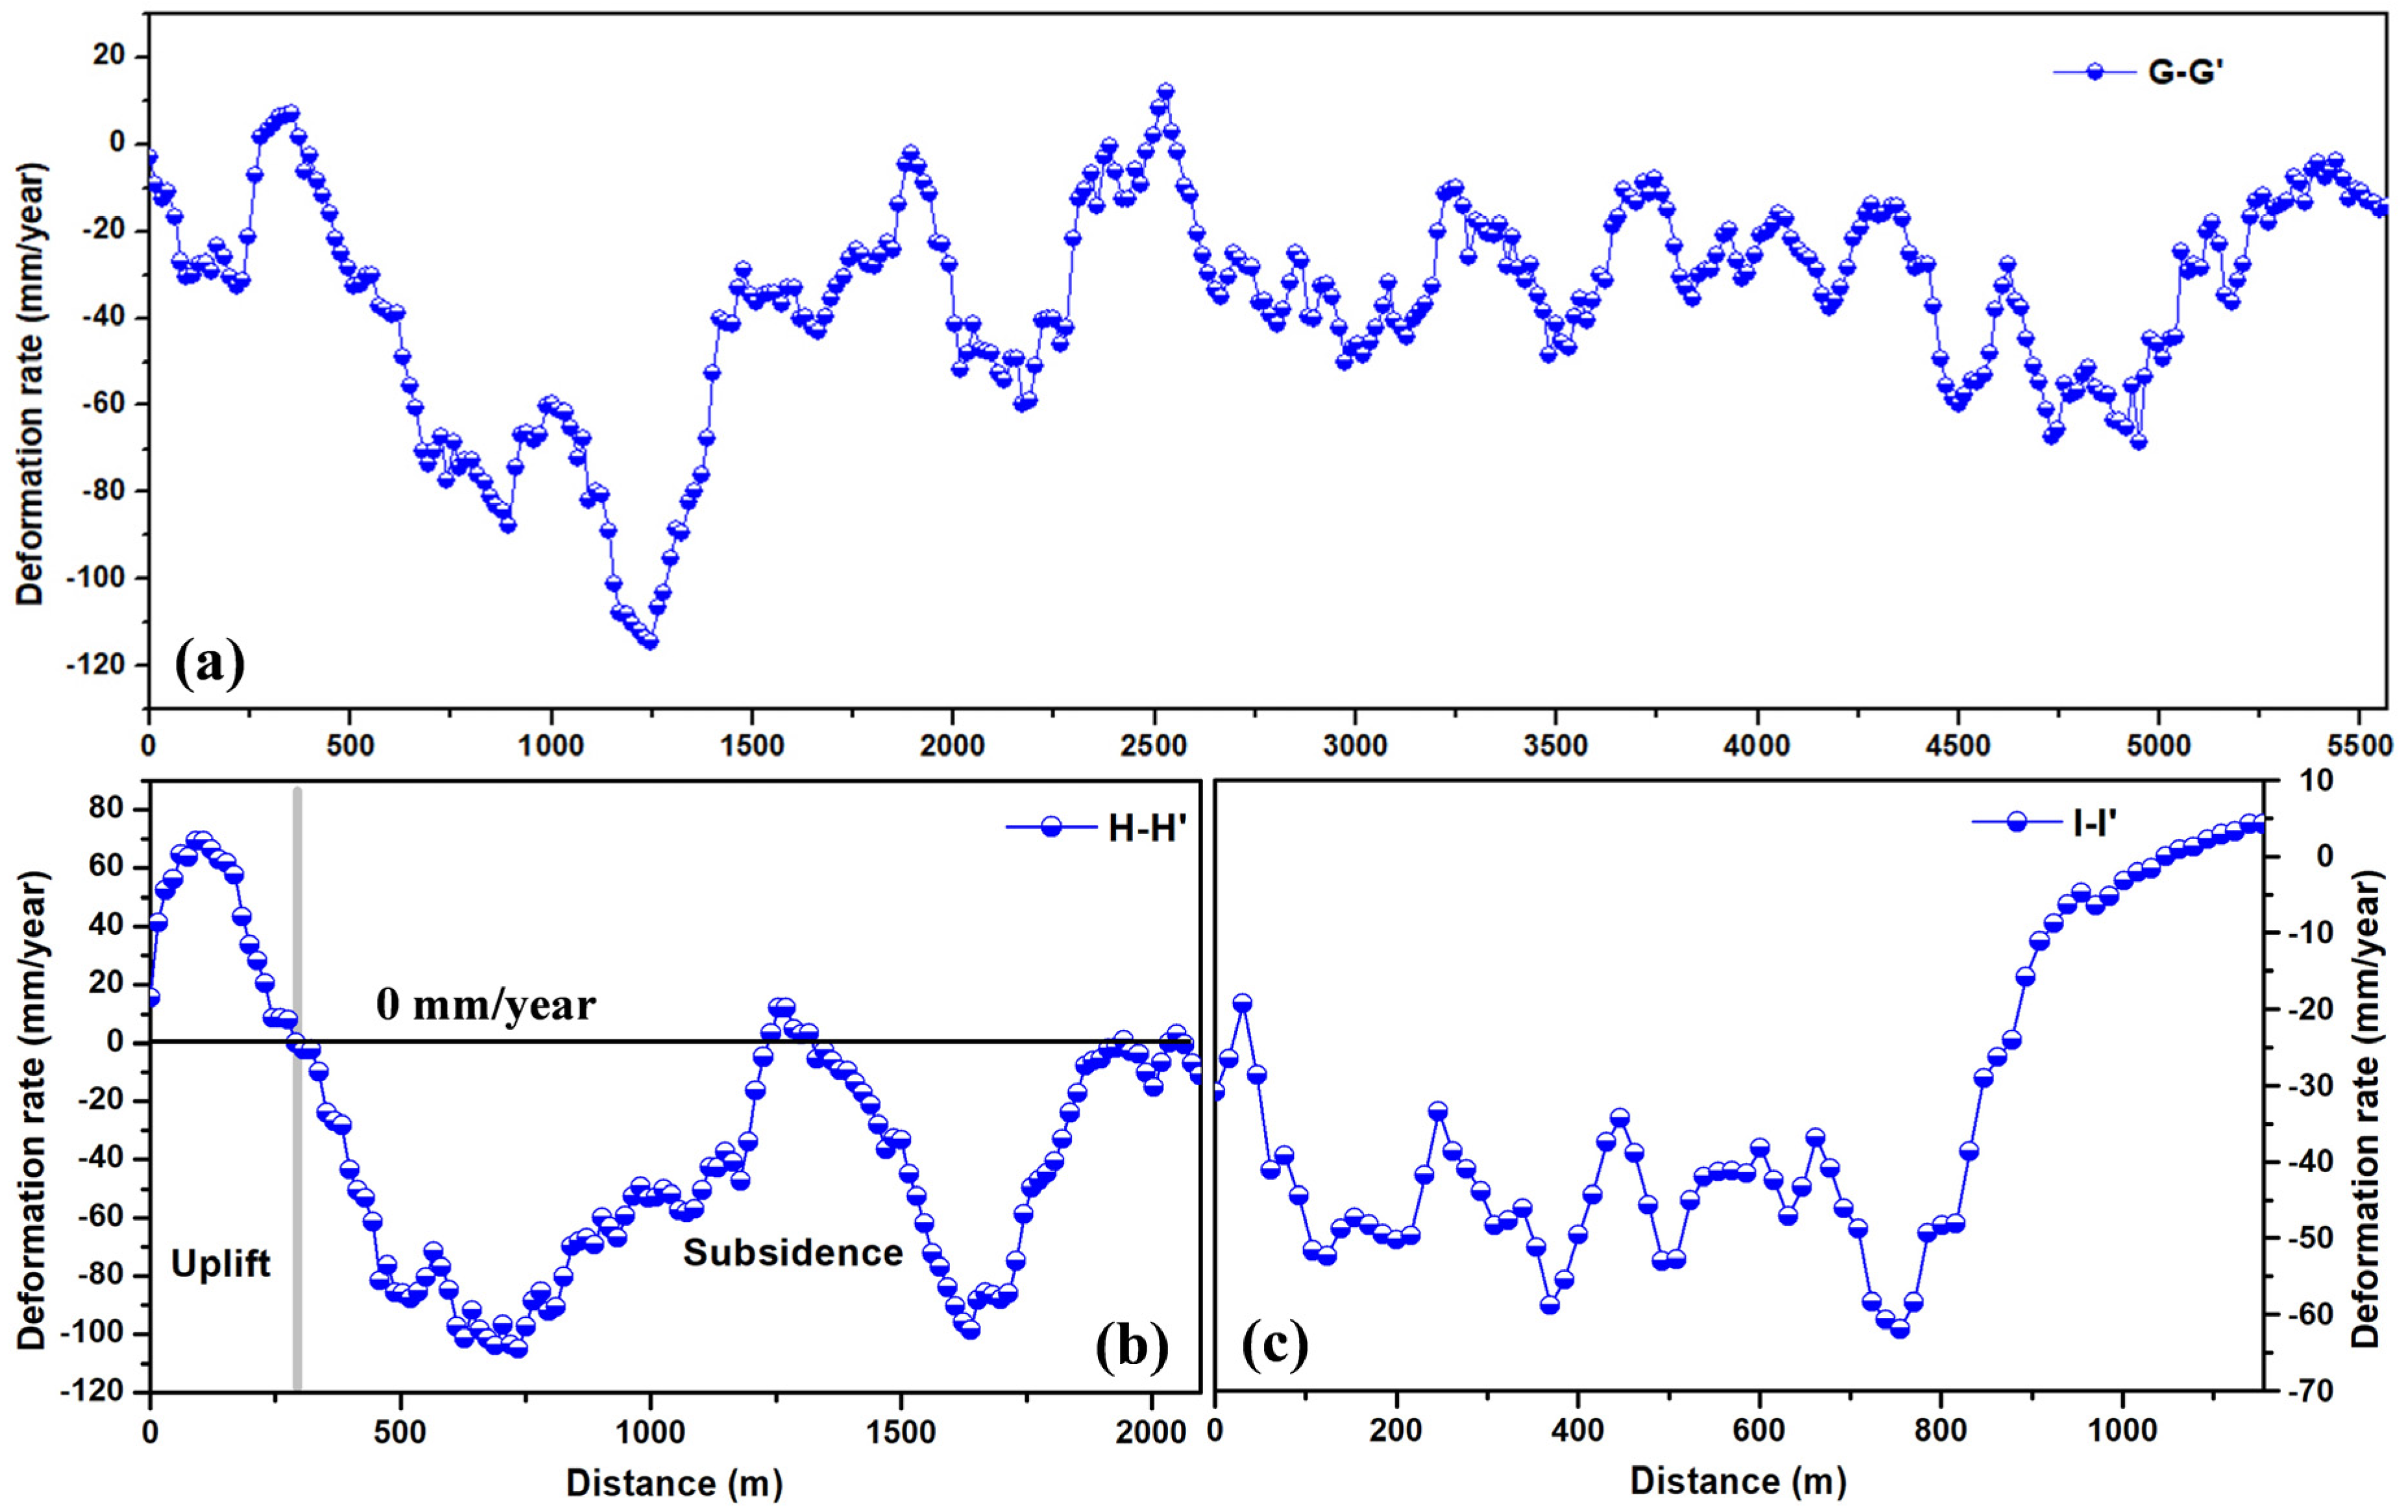
5.3. Coastal Land Subsidence and Uplift
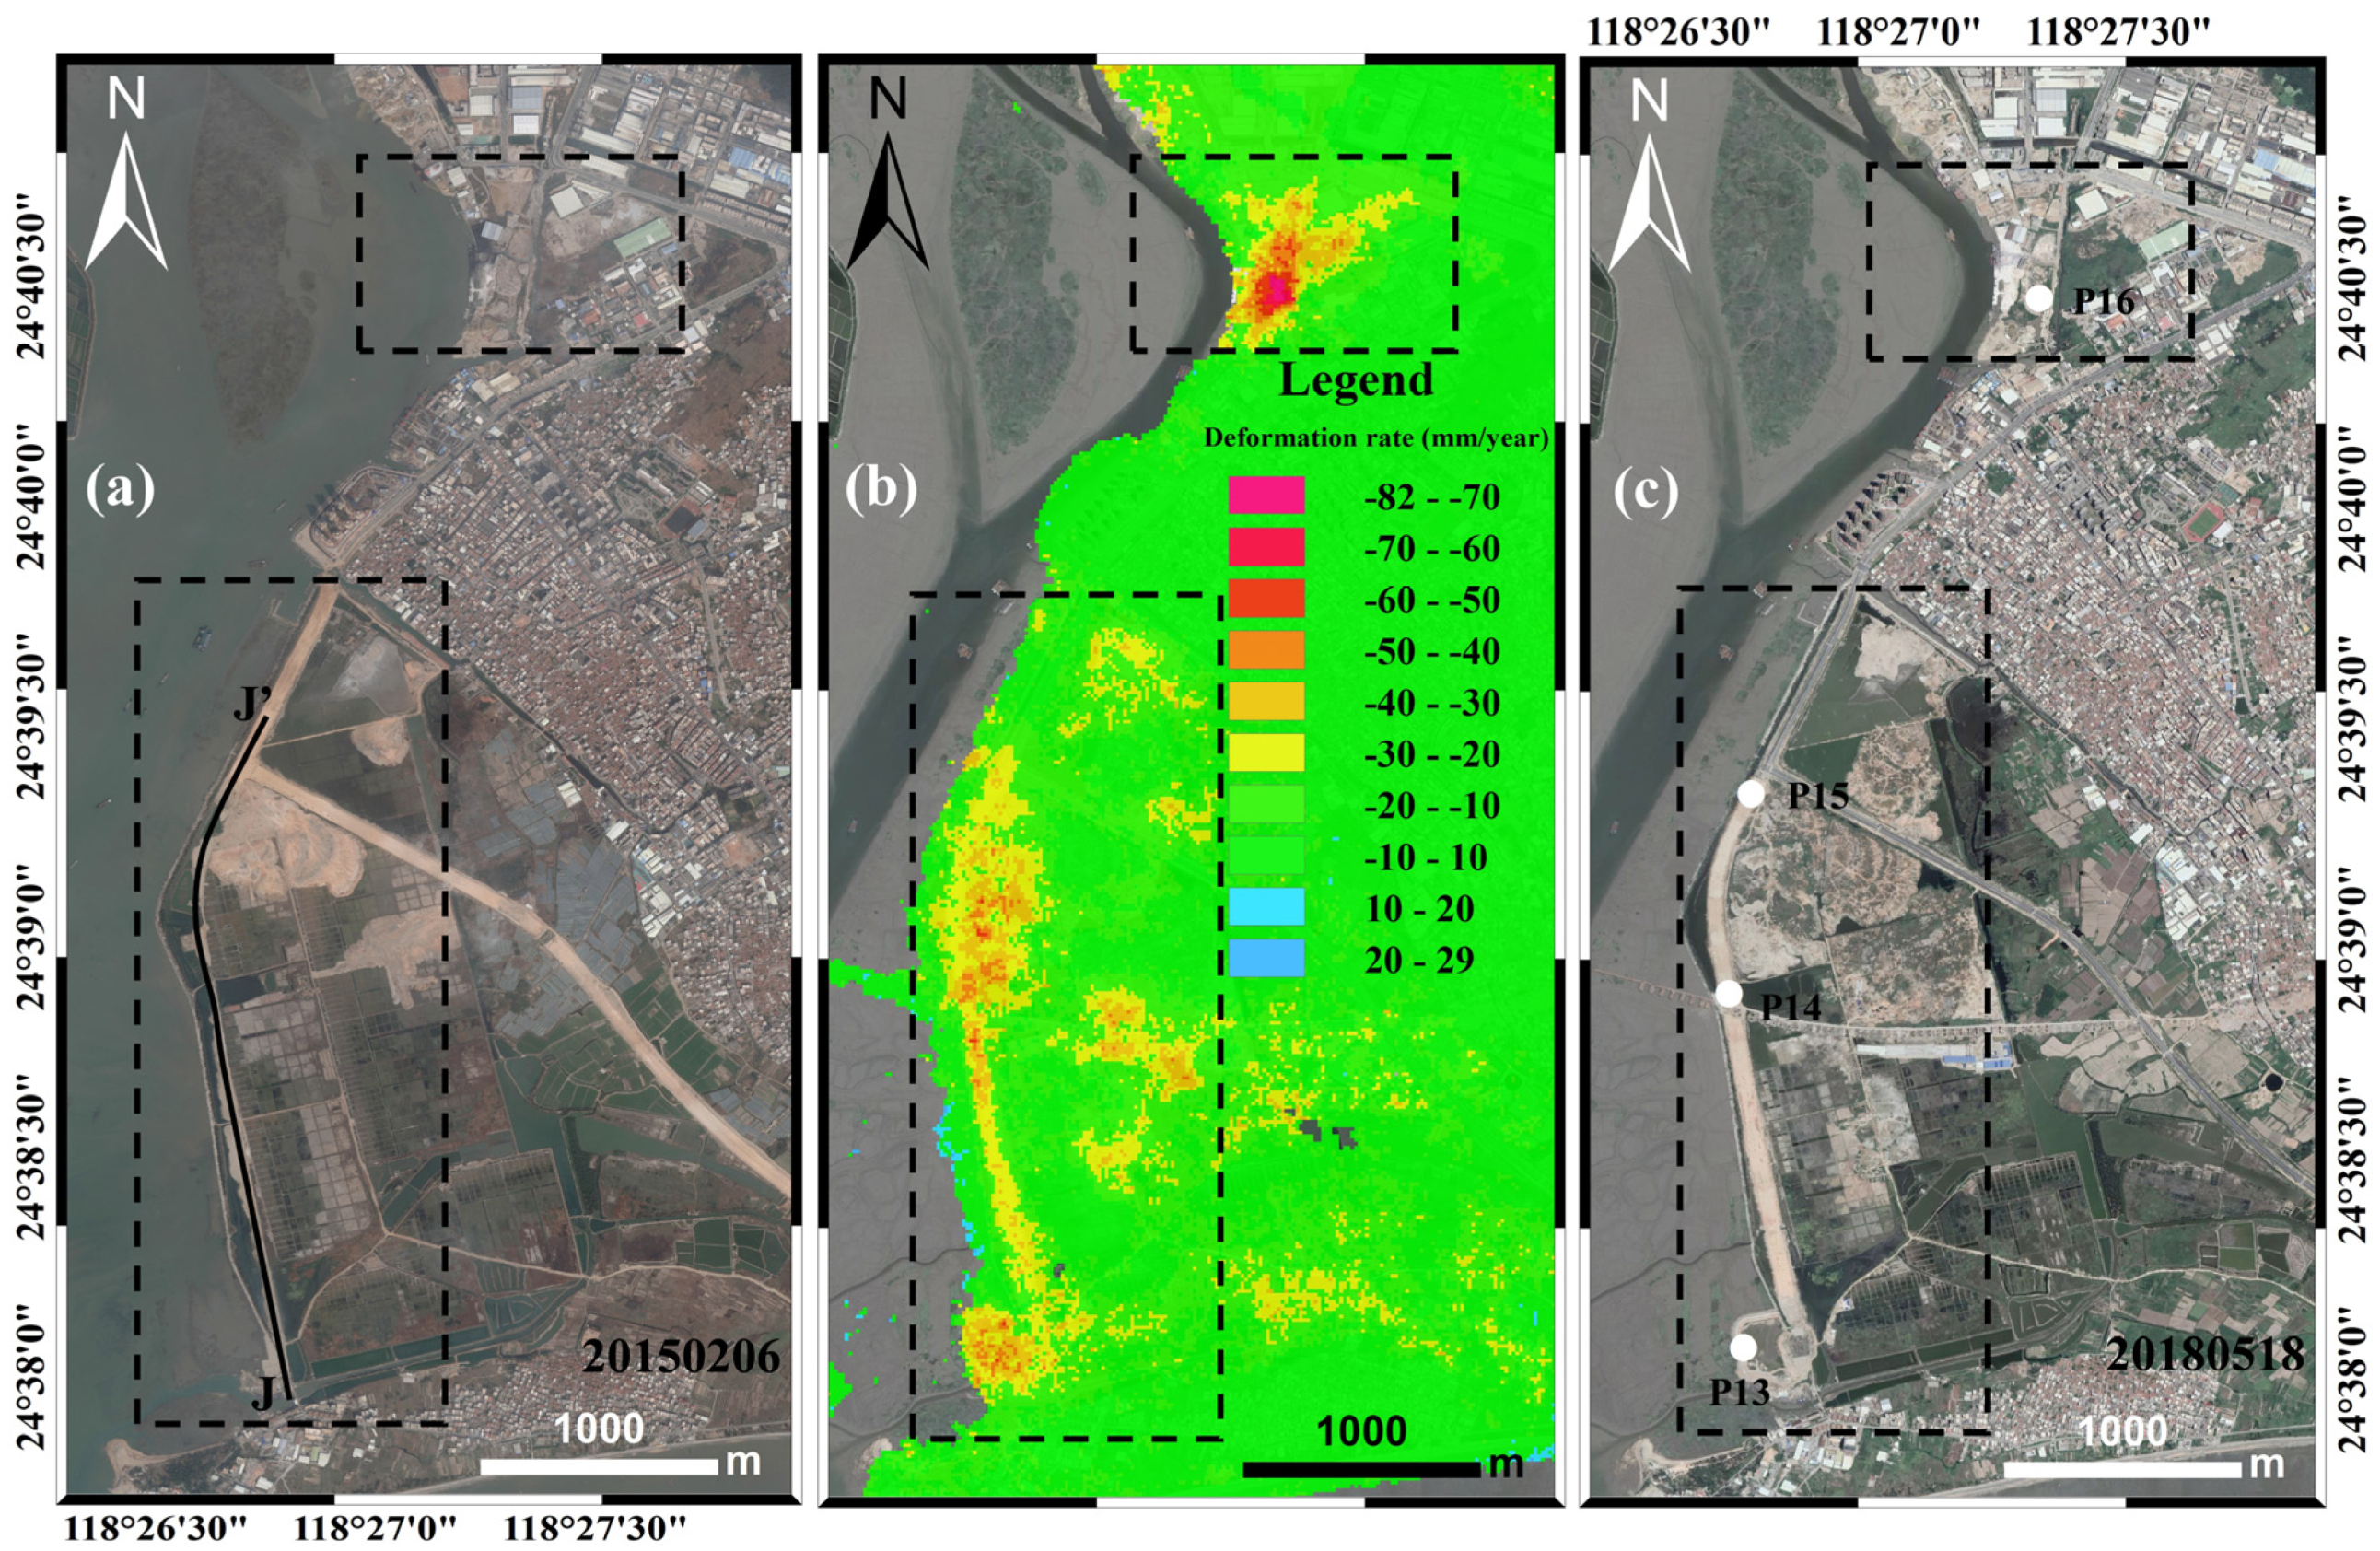
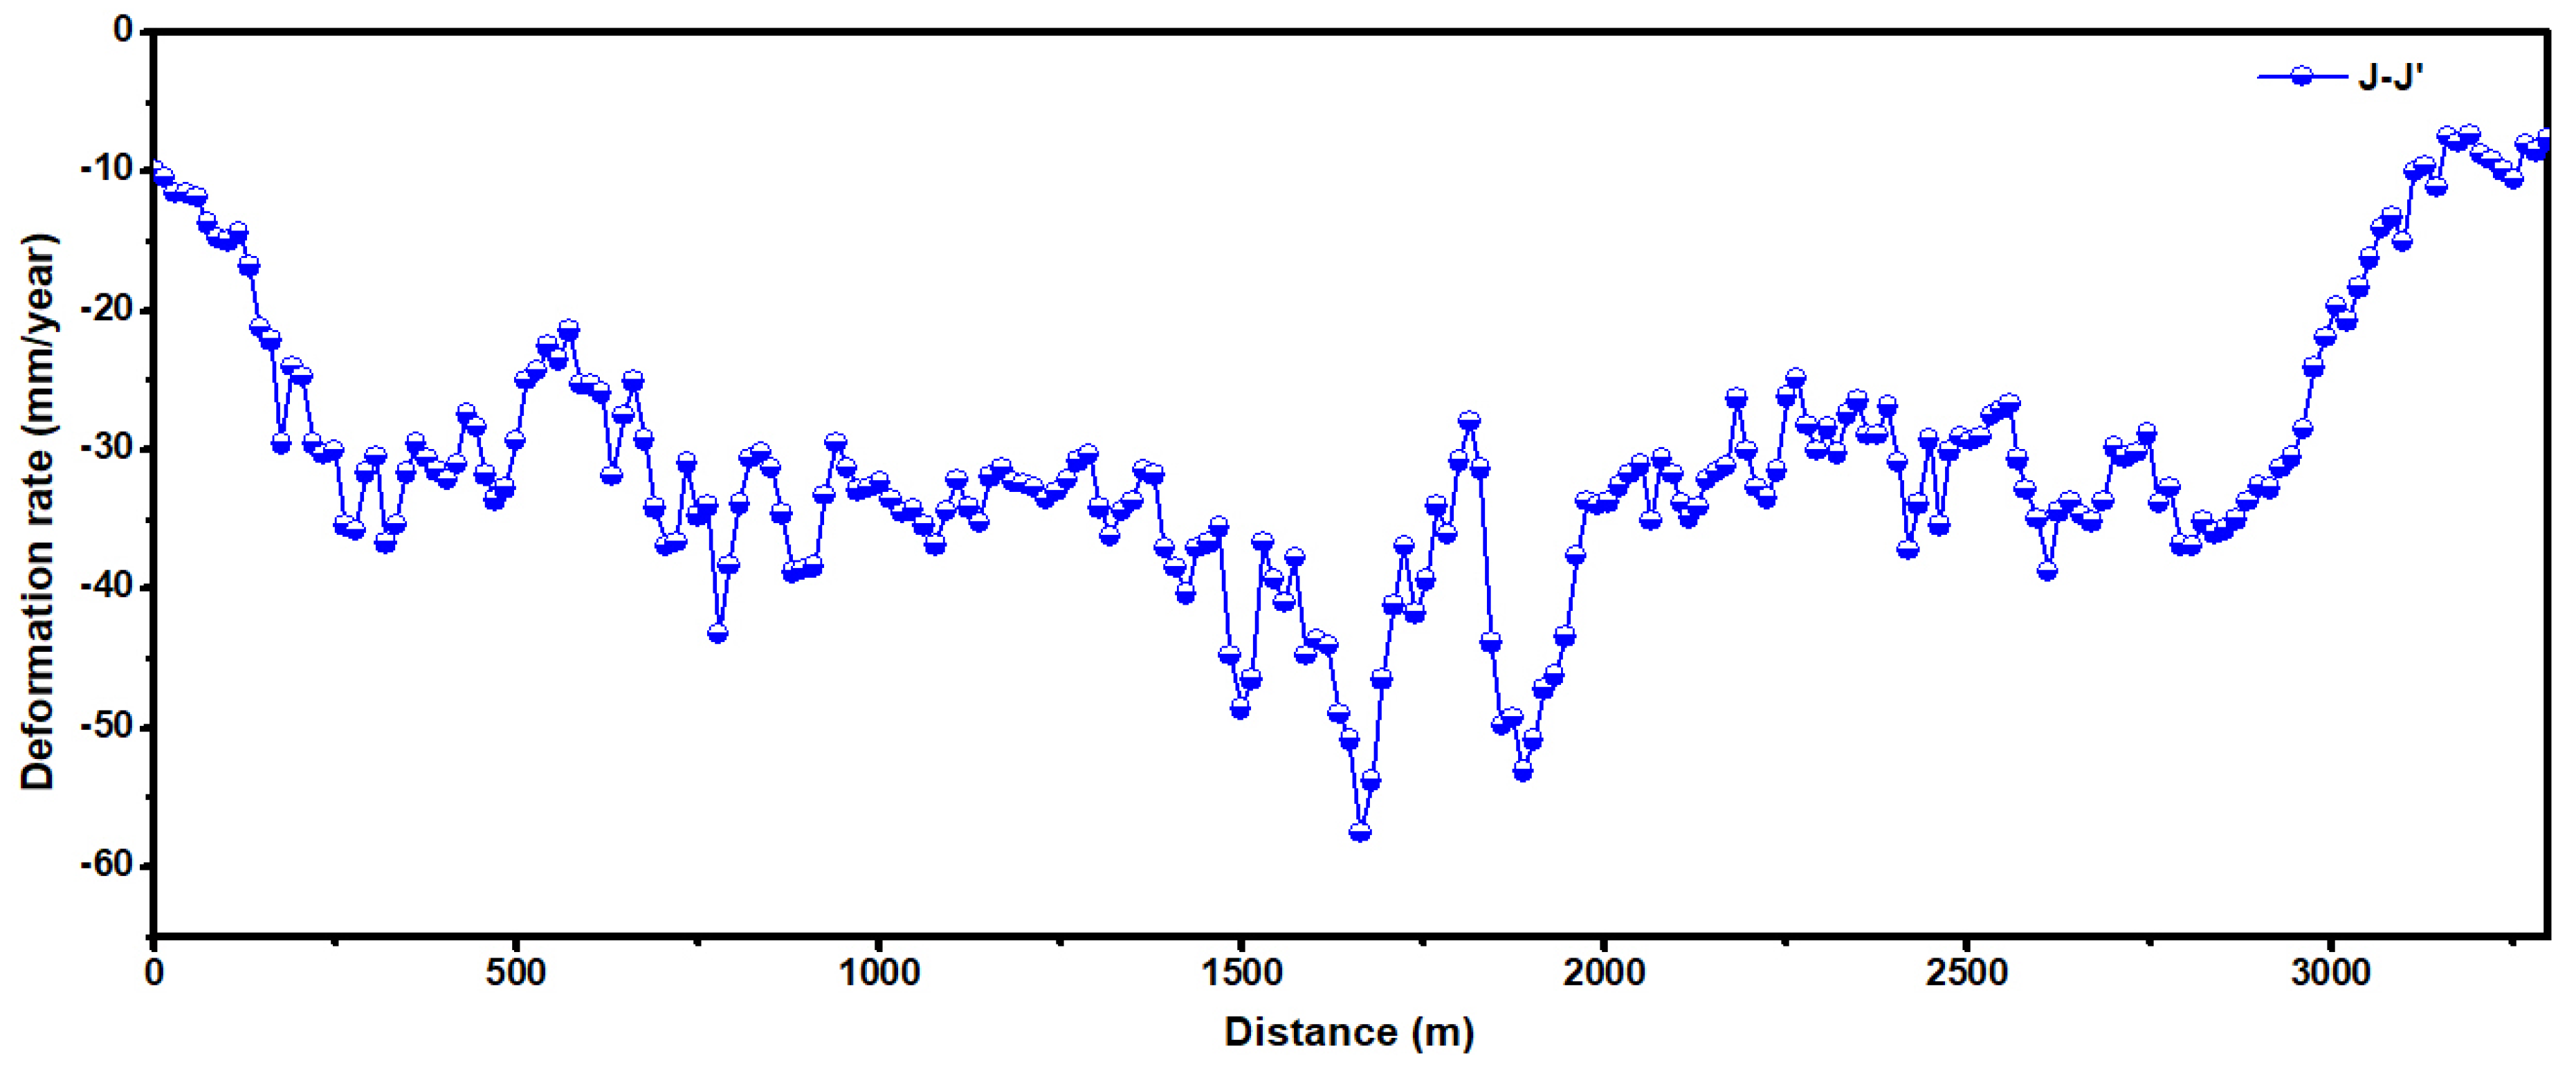
5.4. Subsidence Along the Road
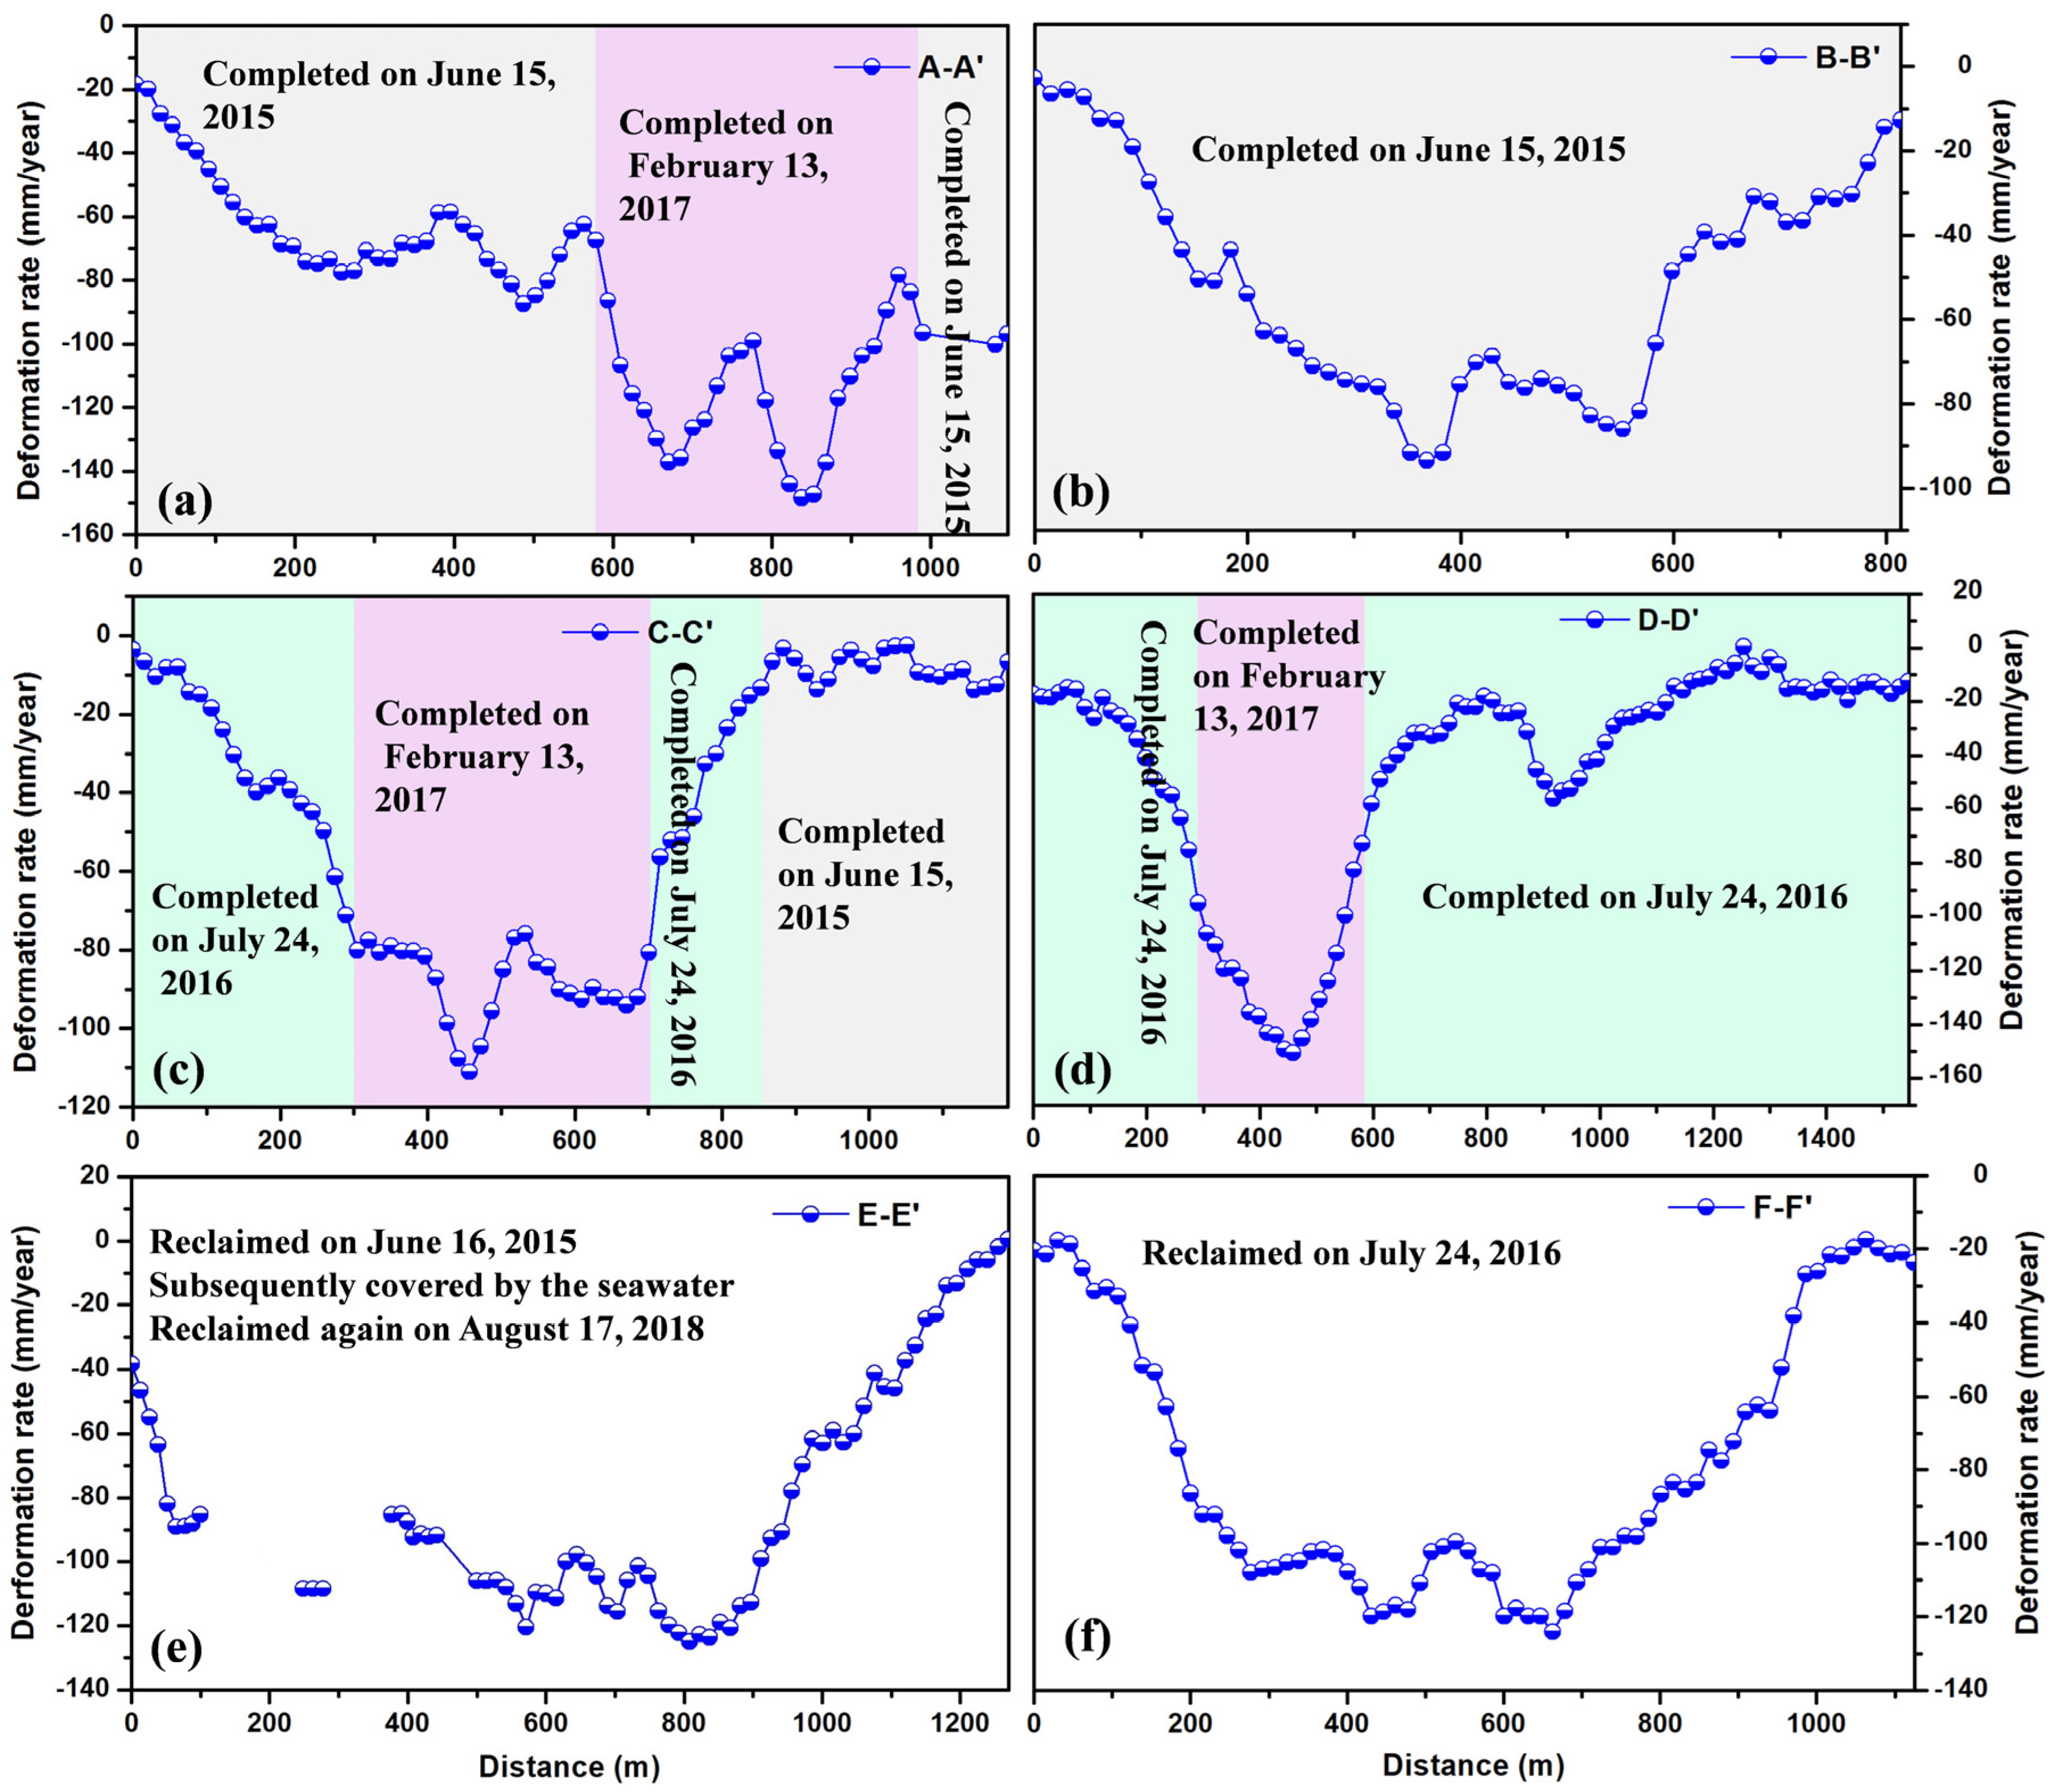
5.5. Detailed Analysis of Land Subsidence at Xiamen New Airport
6. Conclusions
Author Contributions
Funding
Acknowledgments
Conflicts of Interest
References
- Wali, M.K. Practices and Problems of Land Reclamation in Western North America; University of North Dakota Press: Grand Forks, ND, USA, 1975. [Google Scholar]
- Douglas, I.; Lawson, N. Airport construction: Materials use and geomorphic change. J. Air Trans. Manag. 2003, 9, 177–185. [Google Scholar] [CrossRef]
- De Mulder, E.; Van Bruchem, A.; Claessen, F.; Hannink, G.; Hulsbergen, J.; Satijn, H. Environmental impact assessment on land reclamation projects in the Netherlands: A case history. Eng. Geol. 1994, 37, 15–23. [Google Scholar] [CrossRef]
- Suzuki, T. Economic and geographic backgrounds of land reclamation in Japanese ports. Mar. Pollut. Bull. 2003, 47, 226–229. [Google Scholar] [CrossRef]
- Zhao, Q.; Pepe, A.; Gao, W.; Lu, Z.; Bonano, M.; He, M.L.; Wang, J.; Tang, X. A DInSAR Investigation of the Ground settlement Time Evolution of Ocean-Reclaimed Lands in Shanghai. IEEE Sel. Top. Appl. Earth Obs. Remote Sens. 2015, 8, 1763–1781. [Google Scholar] [CrossRef]
- Breber, P.; Povilanskas, R.; Armaitiene, A. Recent evolution of fishery and land reclamation in curonian and lesina lagoons. Hydrobiologia 2008, 611, 105–114. [Google Scholar] [CrossRef]
- Yang, M.S.; Yang, T.L.; Zhang, L.; Lin, J.X.; Qin, X.Q.; Liao, M.S. Spatial-Temporal Characterization of a Reclamation Settlement in the Shanghai Coastal Area with Time Series Analyses of X-, C-, and L-band SAR datasets. Remote Sens. 2018, 10, 329. [Google Scholar] [CrossRef]
- Pepe, A.; Bonano, M.; Zhao, Q.; Yang, T.L.; Wang, H.M. The Use of C-/X-Band Time-Gapped SAR data and Geotechnical Models for the Study of Shanghai’s Ocean-Reclaimed Lands through the SBAS-DInSAR Technique. Remote Sens. 2016, 8, 911. [Google Scholar] [CrossRef]
- Baek, W.K.; Jung, H.S.; Jo, M.J.; Lee, W.J.; Zhang, L. Ground settlement observation of solid waste landfill park using multi-temporal radar interferometry. Int. J. Urban Sci. 2018, 1–16. [Google Scholar] [CrossRef]
- Jiang, L.M.; Lin, H. Integrated analysis of SAR interferometric and geological data for investigating long-term reclamation settlement of Chek lap KoK Airport, Hong Kong. Eng. Geol. 2010, 110, 77–92. [Google Scholar] [CrossRef]
- Yu, L.; Yang, T.L.; Zhao, Q.; Liu, M.; Pepe, A. The 2016-2016 ground displacements of the Shanghai coastal area inferred a combined COSMO-SkyMed/Sentinel-1 DInSAR analysis. Remote Sens. 2017, 9, 1194. [Google Scholar] [CrossRef]
- Liu, P.; Chen, X.F.; Li, Z.H.; Zhang, Z.G.; Xu, J.K.; Feng, W.P.; Wang, C.S.; Hu, Z.W.; Tu, W.; Li, H.Z. Resolving surface displacements in Shenzhen of China from time series InSAR. Remote Sens. 2018, 10, 1162. [Google Scholar] [CrossRef]
- Aslan, G.; Cakır, Z.; Ergintav, S.; Lassere, G.; Renard, R. Analysis of secular ground motions in Istanbul from a long-term InSAR time series (1992–2017). Remote Sens. 2018, 10, 408. [Google Scholar] [CrossRef]
- Zebker, H.A.; Villasensor, J. Decorrelation in interferometric radar echoes. IEEE Trans. Geosci. Remote Sens. 1992, 30, 950–959. [Google Scholar] [CrossRef]
- Yague-Martinez, N.; Prats-Iraola, P.; Gonzalez, F.R.; Brcic, R.; Shau, R.; Geudtner, D.; Eineder, M.; Bamler, R. Interferometric Processing of Sentinel-1 TOPS Data. IEEE Trans. Geosci. Remote Sens. 2016, 54, 2220–2234. [Google Scholar] [CrossRef]
- Xu, B.; Feng, G.C.; Li, Z.W.; Wang, Q.J.; Wang, C.C.; Xie, R.G. Coastal subsidence monitoring associated with land reclamation using the point target based on SBAS-InSAR method: A case study of Shenzhen, China. Remote Sens. 2016, 8, 652. [Google Scholar] [CrossRef]
- Berardino, P.; Fornaro, G.; Lanari, R.; Sansosti, E. A new algorithm for surface deformation monitoring based on small baseline differential SAR interferograms. IEEE Trans. Geosci. Remote Sens. 2002, 40, 2375–2383. [Google Scholar] [CrossRef]
- Mora, O.; Mallorquí, J.J.; Broquetas, A. Linear and nonlinear terrain deformation maps from a reduced set of interferometric SAR images. IEEE Trans. Geosci. Remote Sens. 2003, 41, 2243–2253. [Google Scholar] [CrossRef]
- Usai, S. A least squares database approach for SAR interferometric data. IEEE Trans. Geosci. Remote Sens. 2003, 41, 753–760. [Google Scholar] [CrossRef]
- Ferretti, A.; Prati, C.; Rocca, F. Permanent scatterers in SAR interferometry. IEEE Trans. Geosci. Remote Sens. 2001, 39, 8–20. [Google Scholar] [CrossRef]
- Kampes, B.M. Radar Interferometry: Persistent Scatterer Technique; Springer: New York, NY, USA, 2006. [Google Scholar]
- Hooper, A.; Zebker, H.; Segall, P.; Kampes, B. A new method for measuring deformation on volcanoes and other natural terrains using InSAR persistent scatterers. Geophys. Res. Lett. 2004, 31, L23611. [Google Scholar] [CrossRef]
- Xiang’an, Xiamen City, International Airport. Available online: https://baike.baidu.com/item/%E5%8E%A6%E9%97%A8%E7%BF%94%E5%AE%89%E5%9B%BD%E9%99%85%E6%9C%BA%E5%9C%BA/3898600?fr=aladdin (accessed on 16 November 2018).
- Werner, C.; Wegmüller, U.; Strozzi, T.; Wiesmann, A. GAMMA SAR and interferometric processing software. In Proceedings of the ERS-Envisat Symposium, Gothenburg, Sweden, 16–20 October 2000. [Google Scholar]
- Sowter, A.; Moh, B.C.A.; Cigna, F.; Marsh, S.; Athab, A.; Alshammari, L. Mexico City land subsidence in 2014-2015 with Sentinel-1 IW TOPS: Results using the Intermittent SBAS (ISBAS) technique. Int. J. Appl. Earth Obs. Geoinf. 2016, 52, 230–242. [Google Scholar] [CrossRef]
- Scheiber, R.; Moreira, A. Coregistration of interferometric SAR images using spectral diversity. IEEE Trans. Geosci. Remote Sens. 2000, 38, 2179–2191. [Google Scholar] [CrossRef]
- Jiang, M.; Ding, X.; Hanssen, R.F.; Malhotra, R.; Chang, L. Fast Statistically Homogeneous Pixel Selection for Covariance Matrix Estimation for Multitemporal InSAR. IEEE Trans. Geosci. Remote Sens. 2015, 53, 1213–1224. [Google Scholar] [CrossRef]
- Jiang, M.; Miao, Z.; Gamba, P.; Yong, B. Application of Multitemporal InSAR Covariance and Information Fusion to Robust Road Extraction. IEEE Trans. Geosci. Remote Sens. 2017, 55, 3611–3622. [Google Scholar] [CrossRef]
- Goldstein, R.; Werner, C. Radar interferogram filtering for geophysical applications. Geophys. Res. Lett. 1998, 21, 4035–4038. [Google Scholar] [CrossRef]
- Liu, Y.Y.; Zhao, C.Y.; Zhang, Q.; Yang, C.S. Complex surface deformation monitoring and mechanism inversion over Qingxu-Jiaocheng, China with multi-sensor SAR images. J. Geodyn. 2018, 114, 41–52. [Google Scholar] [CrossRef]
- Costantini, M. A novel phase unwrapping method based on network programming. IEEE Trans. Geosci. Remote Sens. 1998, 36, 813–821. [Google Scholar] [CrossRef]
- Kang, Y.; Zhao, C.Y.; Zhang, Q.; Lu, Z.; Li, B. Application of InSAR Techniques to an analysis of the Guanling Landslide. Remote Sens. 2017, 9, 1046. [Google Scholar] [CrossRef]
- Liu, X.J.; Zhao, C.Y.; Zhang, Q.; Peng, J.B.; Zhu, W.; Lu, Z. Multi-Temporal Loess Landslide Inventory Mapping with C-, X- and L-Band SAR Datasets—A Case Study of Heifangtai Loess Landslides, China. Remote Sens. 2018, 10, 1756. [Google Scholar] [CrossRef]
- Liao, M.S.; Wang, T. Time Series InSAR Technique and Application; Science Press: Beijing, China, 2014; pp. 69–71. (In Chinese) [Google Scholar]
- Wang, H.; Wright, T.J.; Yu, Y.; Lin, H.; Jiang, L.; Li, C.; Qiu, G. InSAR reveals coastal subsidence in the Pearl River Delta. China Geophys. J. Int. 2012, 191, 1119–1128. [Google Scholar]
- Terzaghi, K.; Peck, R.B.; Mesri, G. Soil Mechanics in Engineering Practice; John Wiley and Sons: Hoboken, NJ, USA, 1996; pp. 1–592. [Google Scholar]
- Plant, G.W.; Covil, C.S.; Hughes, R.A. Site Preparation for the New Hong Kong International Airport—The Design, Construction and Performance of the Airport Platform; Thomas Telford: London, UK, 1998. [Google Scholar]
- Pickles, A.R.; Tosen, R. Settlement of reclaimed land for the new Hong Kong International Airport. Proc. ICE Geotech. Eng. 1998, 131, 191–209. [Google Scholar] [CrossRef]


© 2019 by the authors. Licensee MDPI, Basel, Switzerland. This article is an open access article distributed under the terms and conditions of the Creative Commons Attribution (CC BY) license (http://creativecommons.org/licenses/by/4.0/).
Share and Cite
Liu, X.; Zhao, C.; Zhang, Q.; Yang, C.; Zhang, J. Characterizing and Monitoring Ground Settlement of Marine Reclamation Land of Xiamen New Airport, China with Sentinel-1 SAR Datasets. Remote Sens. 2019, 11, 585. https://doi.org/10.3390/rs11050585
Liu X, Zhao C, Zhang Q, Yang C, Zhang J. Characterizing and Monitoring Ground Settlement of Marine Reclamation Land of Xiamen New Airport, China with Sentinel-1 SAR Datasets. Remote Sensing. 2019; 11(5):585. https://doi.org/10.3390/rs11050585
Chicago/Turabian StyleLiu, Xiaojie, Chaoying Zhao, Qin Zhang, Chengsheng Yang, and Jing Zhang. 2019. "Characterizing and Monitoring Ground Settlement of Marine Reclamation Land of Xiamen New Airport, China with Sentinel-1 SAR Datasets" Remote Sensing 11, no. 5: 585. https://doi.org/10.3390/rs11050585
APA StyleLiu, X., Zhao, C., Zhang, Q., Yang, C., & Zhang, J. (2019). Characterizing and Monitoring Ground Settlement of Marine Reclamation Land of Xiamen New Airport, China with Sentinel-1 SAR Datasets. Remote Sensing, 11(5), 585. https://doi.org/10.3390/rs11050585