1. Introduction
Information regarding the temporal and spatial variation of the Surface Soil Moisture (SSM) is of crucial importance for an understanding of hydrological processes. It governs energy fluxes by controlling the exchange and partitioning of water over land. It also plays a significant role in predictions of the weather climate from the regional scale to the global scale [
1]. At the global scale, accurate SSM measurements are fundamental in improving numerical weather prediction [
2] and hydrological modeling [
3,
4]. Accurate information on SSM is important in the simulations and future projections of climate variables, such as temperature [
5], and also in predicting extreme events, such as floods [
6]. SSM accurate temporal and spatial characterization is also essential for agriculture and irrigation management practices, particularly in arid and semiarid regions [
7]. In addition, information on this parameter is important in biodiversity and ecosystems management [
8,
9]. Moreover, it influences the water cycle through evapotranspiration [
10] and precipitation [
11]. Land use and land cover are factors that influence soil moisture spatiotemporal variability and can alter soil hydraulic properties because of changes in the porosity and structure of the soil [
12]. Seasonal changes also control the water exchange between that land surface and the atmosphere and hence influence the behavior of soil moisture [
13]. On this basis, to improve the methods of water resources management, climate modeling requires an accurate representation of SSM at a high temporal and spatial resolution [
14].
Soil moisture can be directly measured using appropriate ground instrumentation, and there is a wide range of options for this purpose [
15]. Yet, direct measurement has been a difficult and it is often a challenging task given the heterogeneous nature of soil moisture in both time and space (due to variability in climate/weather, snow, topography, vegetation, land use, water table depth, and soil type). Generally, in situ observations cannot fully characterize the spatial and temporal variability of soil moisture at large scale [
16]. Moreover, it is impractical to deploy dense network stations all over the world. Alternatively, large scale monitoring soil moisture at a range of spatial and temporal resolution of different land cover types can only rely on remote sensing from space-borne approaches [
17]. Remote sensing techniques have the advantage of simultaneously achieving satisfactory sampling frequency and global coverage. They also show a direct sensitivity to the SSM at different microwave bands [
18]. In spite of efforts to model global soil moisture at high temporal and spatial scales, practically, at the current maturity of technology and computational resource, global soil moisture measurements can only be attained through satellite remote sensing [
19]. Indeed, advances in Earth Observation (EO) over the past decades have been effectively applied to measure SSM, resulting in the global availability of this parameter at an increased temporal and spatial resolution. Researchers have exerted great efforts on the development of soil moisture retrieval algorithms for various microwave remote sensing satellite/sensors.
Currently, several satellite soil moisture operational products are available from microwave, optical, and thermal sensors (e.g., [
20]. One of the most widely used ones includes that from the Soil Moisture Active and Passive (SMAP) satellite, which was launched in January 2015 starting from April 2015 with ∼36 km
2/2-day spatial/temporal resolution [
21]. The Advanced Microwave Scanning Radiometer (AMSR-2) on the GCOM-W1 (Global Change Observation Mission-Water) satellite (C- and X-band radiometers), starting from July 2012 with ∼25 km
2/1-day spatial/temporal resolution [
22]. The European Space Agency (ESA) Soil Moisture and Ocean Salinity (SMOS) satellite product (L-band radiometer), starting from January 2010 with ∼50 km
2/2-day spatial/temporal resolution [
23]. Advanced Scaterometter (ASCAT) onboard Metop-A and Metop-B satellites (C-band scatterometer) starting from January 2007 with ∼25 km
2/1-day spatial/temporal resolution [
24]. Additionally, there are efforts dedicated to the merging of the passive and active soil moisture products under the ESA (European Space Agency) Climate Change Initiative (CCI) soil moisture product (CCI SM), in an attempt to generate a long term global scale soil moisture record [
25,
26] and the Microwave Radiation Imager onboard Feng Yun [
24,
27,
28,
29,
30].
A fundamental aspect is related to the error characterization of the soil moisture products. It includes two aspects: one is that the result of the validation can be used as a feedback to algorithm developers for further improvements in the retrieval of SSM; the other is to facilitate the potential users to understand the status of the product, such as the accuracy, magnitude, and the uncertainties of the remote sensed products. Both are very important as they help in better understanding their potential use for practical applications (e.g., [
20,
31]). Additionally, long term soil moisture datasets are been used in hydrological and land surface modeling assimilation [
26,
32]. Several studies have been dedicated to assessing the accuracy specifically of the ASCAT soil moisture product by either comparing it against model simulations or ground measurements from networks that operated from around the world [
33,
34,
35,
36,
37]. Yet, to our knowledge, there is not too many such studies performed in Europe [
27,
38,
39], the United States [
40] and Australia [
22]. Consequently, a better global understanding of the ASCAT SSM product accuracy is required.
In light of the above, this study aims at evaluating the accuracy of ASCAT global operational soil moisture product at different sites globally representative of a variety of climatic, environmental, biome, and topographical conditions. For this purpose, in situ measurements from the global validated FLUXNET ground observational network acquired nearly concurrently to ASCAT overpass have been utilized. The appraisal of the product accuracy was investigated herein with respect to seasons and land use/land cover patterns. Such assessment is an important step for successful hydrological modeling, agriculture, and water resource management, and it can provide importance assistance in policy and decision making.
3. Methods
The quality of the in situ data was first assessed by the information acquired from the in situ data providers, where only the quality-passed data were used in further analysis. The pre-processed in situ soil moisture data values that corresponded to the date/time of the satellite overpasses were extracted (Excel Macro VBA) and then assigned to point shapefiles of the study site (Tabular join in ArcMap 10.2); the shapefiles were imported on the top of the pre-processed ASCAT image pixels in the BEAM VISAT and ASCAT toolbox. Using the correlation tool, in situ soil moisture was matched against the ASCAT soil moisture unit of the pixel containing the site point. These pixels were then extracted to Microsoft Excel for further analysis and comparisons against the in situ data. In a few cases, the in situ soil moisture data had an assigned value of “0” SSM, or the satellite data had an assigned value of “0” SSM. Data values of “0” were removed from the dataset if the difference between the in situ and ASCAT measurements were above 0.1 SSM, as they are considered to be instrumental errors.
Agreement between the ASCAT-predicted soil moisture and the corresponding in situ data was evaluated based on direct point by point comparisons of the two datasets. Several statistical metrics were used to evaluate the agreement between the compared datasets, which have already been used in other similar studies (e.g., [
31,
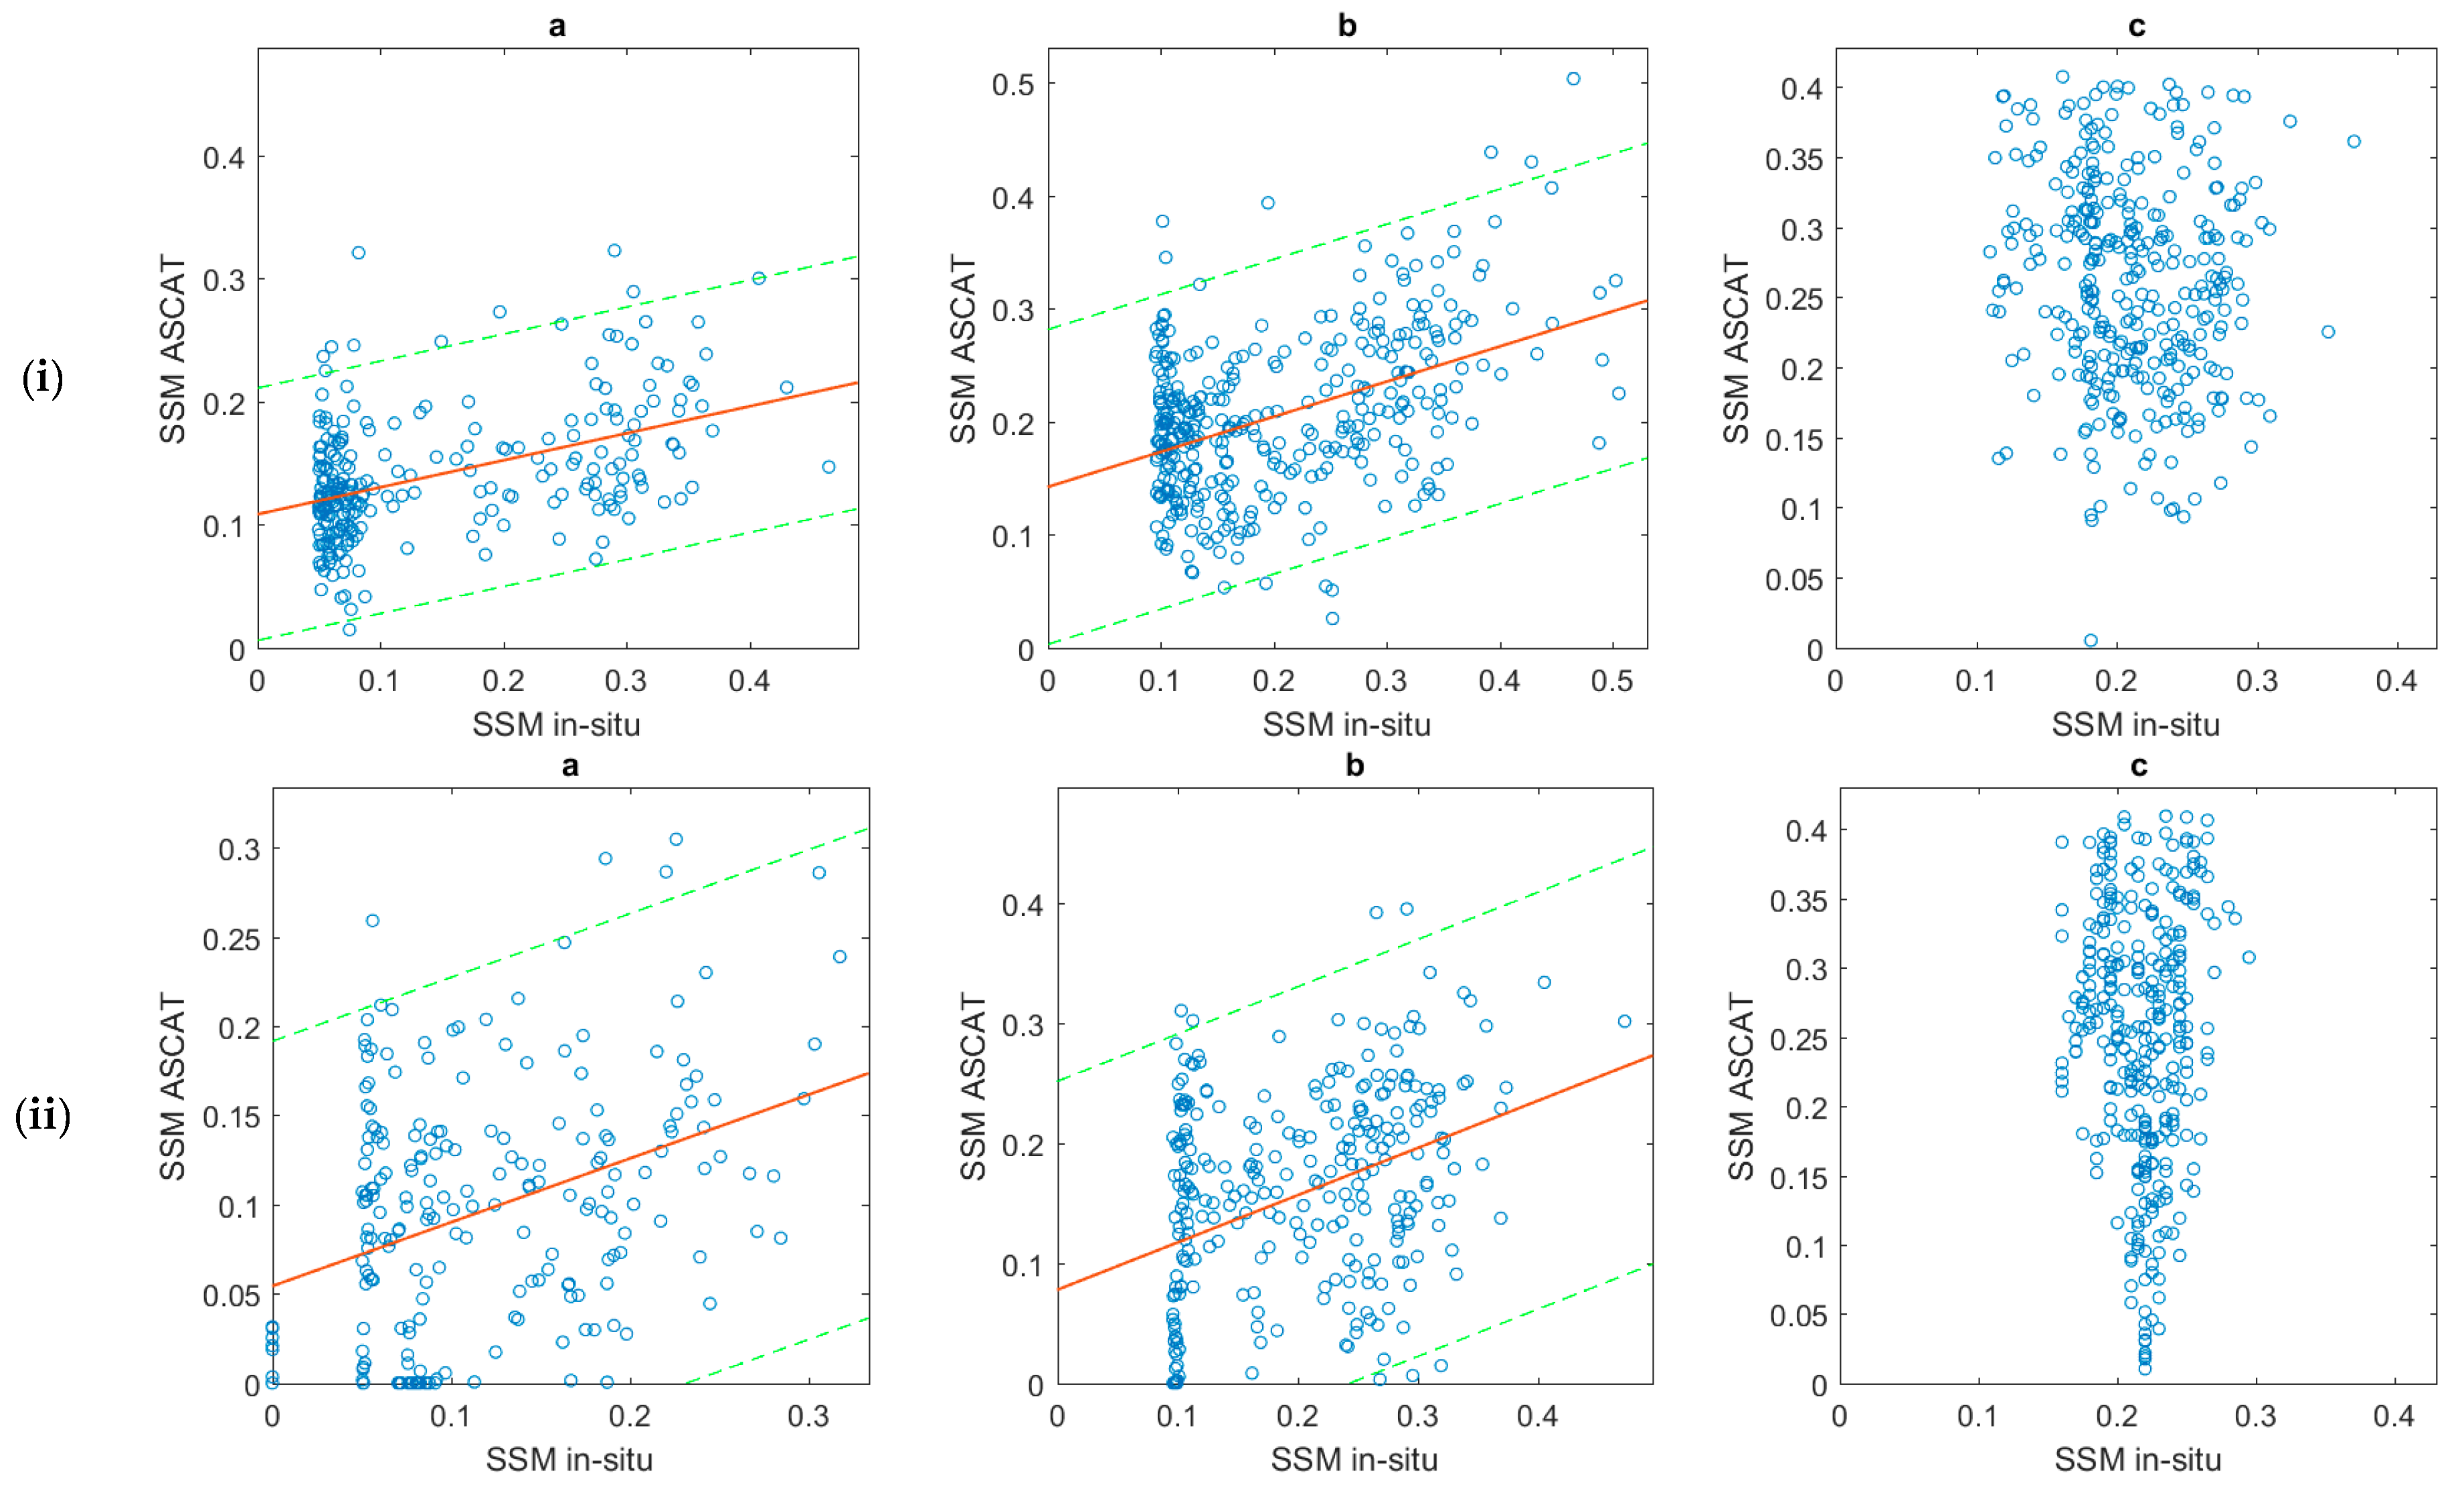
44]). Those included the Root Mean Square Error (RMSE, Equation (2)), the Pearson’s correlation coefficient (R), Spearman’s correlation coefficient (Rs) (assesses the correlation between the rank of each value), the Mean Error (ME, Equation (1)) or Bias, and the Standard Deviation or Scatter (Equation (3)). The Spearman’s correlation coefficient was used in this study to assess the monotonic relationship between the in situ data and ASCAT products. The confidence intervals for the estimated coefficients of the linear model (slope and Intercept) were examined. They are represented in the figures of this research wherever applicable with green dashed lines. If the range of the 95% confidence interval is very wide, which implies that the linear correlation is weak, the regression line is not shown. A detailed description of the statistical metrics can be found in Silk (1979), Burt and Barber (1996), and Willmott (1982). These statistical metrics have also been previously used in analogous validation experiments of relevant operational products [
15].
Additional analysis explored the agreement between the satellite-derived and in situ SSM as a function of land cover type and seasonality. For analysis by land cover type, agreement was evaluated for nine sites, which are inclusive of four different land cover types: ES_AGU, ES_LJU and US_WGH—open shrubland, IT_REN—evergreen needleleaf forest, US_VAR, AU_DPA and AU_STP—grasslands, AU_HOW and USA_TON—woody savannas. Similarly, agreement was also evaluated for the four seasons, spring (March–May\September–November), summer (June–August\December–February), autumn (September–November\March–May), and winter (December–February\June–August). Seasons in the Southern hemisphere are given their correct calendar dates. Direct point-by-point comparisons were performed at every in situ station to evaluate the statistical agreement for each threshold. Analysis was independently performed for each scenario, for both 2010 and 2011.
4. Results
In this section, the results of each of the study locations are analyzed. For each group of sites that belong to a specific continent, an analysis into how the soil moisture product performed over different land covers, both seasonally and annually is presented. Such information can reveal the temporal behavior of the observed and estimated soil moisture during the entire period. The key results from the ASCAT product and the corresponding in situ soil moisture in all nine experimental sites with varying land use and land cover in 2010 and 2011 are presented in
Table 2,
Table 3,
Table 4,
Table 5,
Table 6 and
Table 7 and
Figure 1,
Figure 2,
Figure 3,
Figure 4,
Figure 5,
Figure 6,
Figure 7,
Figure 8 and
Figure 9. As shown in the results, in all sites the RMSE was low (around 0.1 m
3 m
−3), suggesting satisfactory product accuracy. In most cases, the correlation coefficient was moderate (above 50%). Notably, the validation measures for 2011 underperformed those of 2010.
A comparison between in situ and ASCAT SSM in shrublands shows low to very low RMSE (below 0.1 m3 m−3) and mediocre correlation (between 35% and 50%) coefficient for both of the years. Grasslands perform well in 2010 with low RMSE and a correlation coefficient above 65%. Yet, the performance decreased in 2011 with an RMSE above 0.1 m3 m−3 and correlation coefficient dropping to 35% in AU_STP. Woody Savannas present a moderately high RMSE at both sites for both of the years (0.11–0.12 m3 m−3, with one case at 0.135 m3 m−3). The correlation coefficient is high (between 66% and 74%), except for US_TON2011 (RMSE 0.135, R 0.393). Finally, the agreement was worse for the needleleaf forests with an RMSE that was slightly above 0.1 m3 m−3, but very low correlation coefficient. Furthermore, the coefficients for the slope and intercept for IT_REN exhibited wide confidence intervals (at 95% confidence) for both 2010 and 2011. Thus, the ASCAT and in situ measurements are essentially uncorrelated for IT_REN sites.
Table 3,
Table 5 and
Table 7 present the results of the seasonal analysis over a two-year period (2010 and 2011) for all three continents. As such, there are six representations for each season (three sites for two years). Winter presents the greatest variation in performance with some of the highest and lowest validation measures (RMSE ranging from 0.076 to 0.140 m
3 m
−3 and R ranging between 21% to 92%). For autumn, the RMSE for 2010 is relatively good (between 0.08 to 0.11 m
3 m
−3), but 2011 autumn gives high RMSE (above 0.12 m
3 m
−3 in all cases). The Pearson’s R is adequate in Europe and United States of America (USA) (above 63%) and it has a slightly higher value in 2011. In Australia, a correlation coefficient above 53% was obtained for both years. In most cases, spring has relatively high RMSE (between 0.10 to 0.13 m
3 m
−3), with the exception of spring 2010 in Australia. There is high variation in the correlation coefficient for the spring period, with values that range from 28% to 75%. The results for the summer period are similar with those of the spring period, if a little worse, with RMSE values that are in the range of 0.074 to 0.160 m
3 m
−3 and R between 28% and 62%.
4.1. Europe
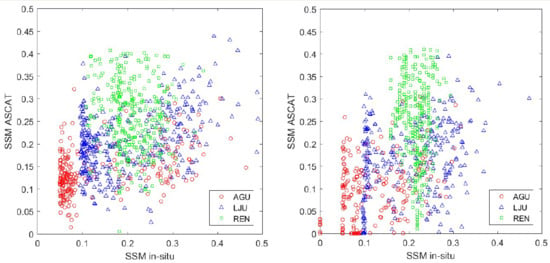
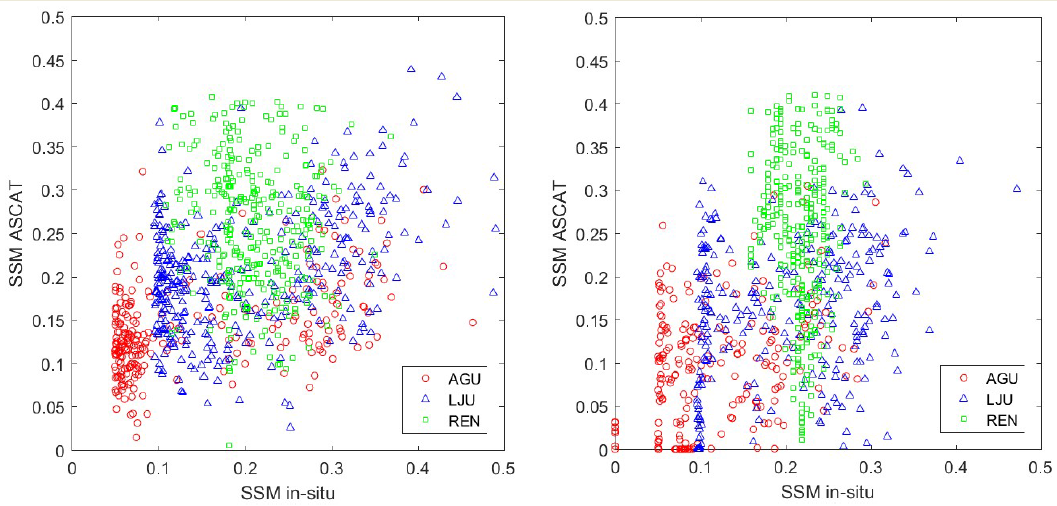
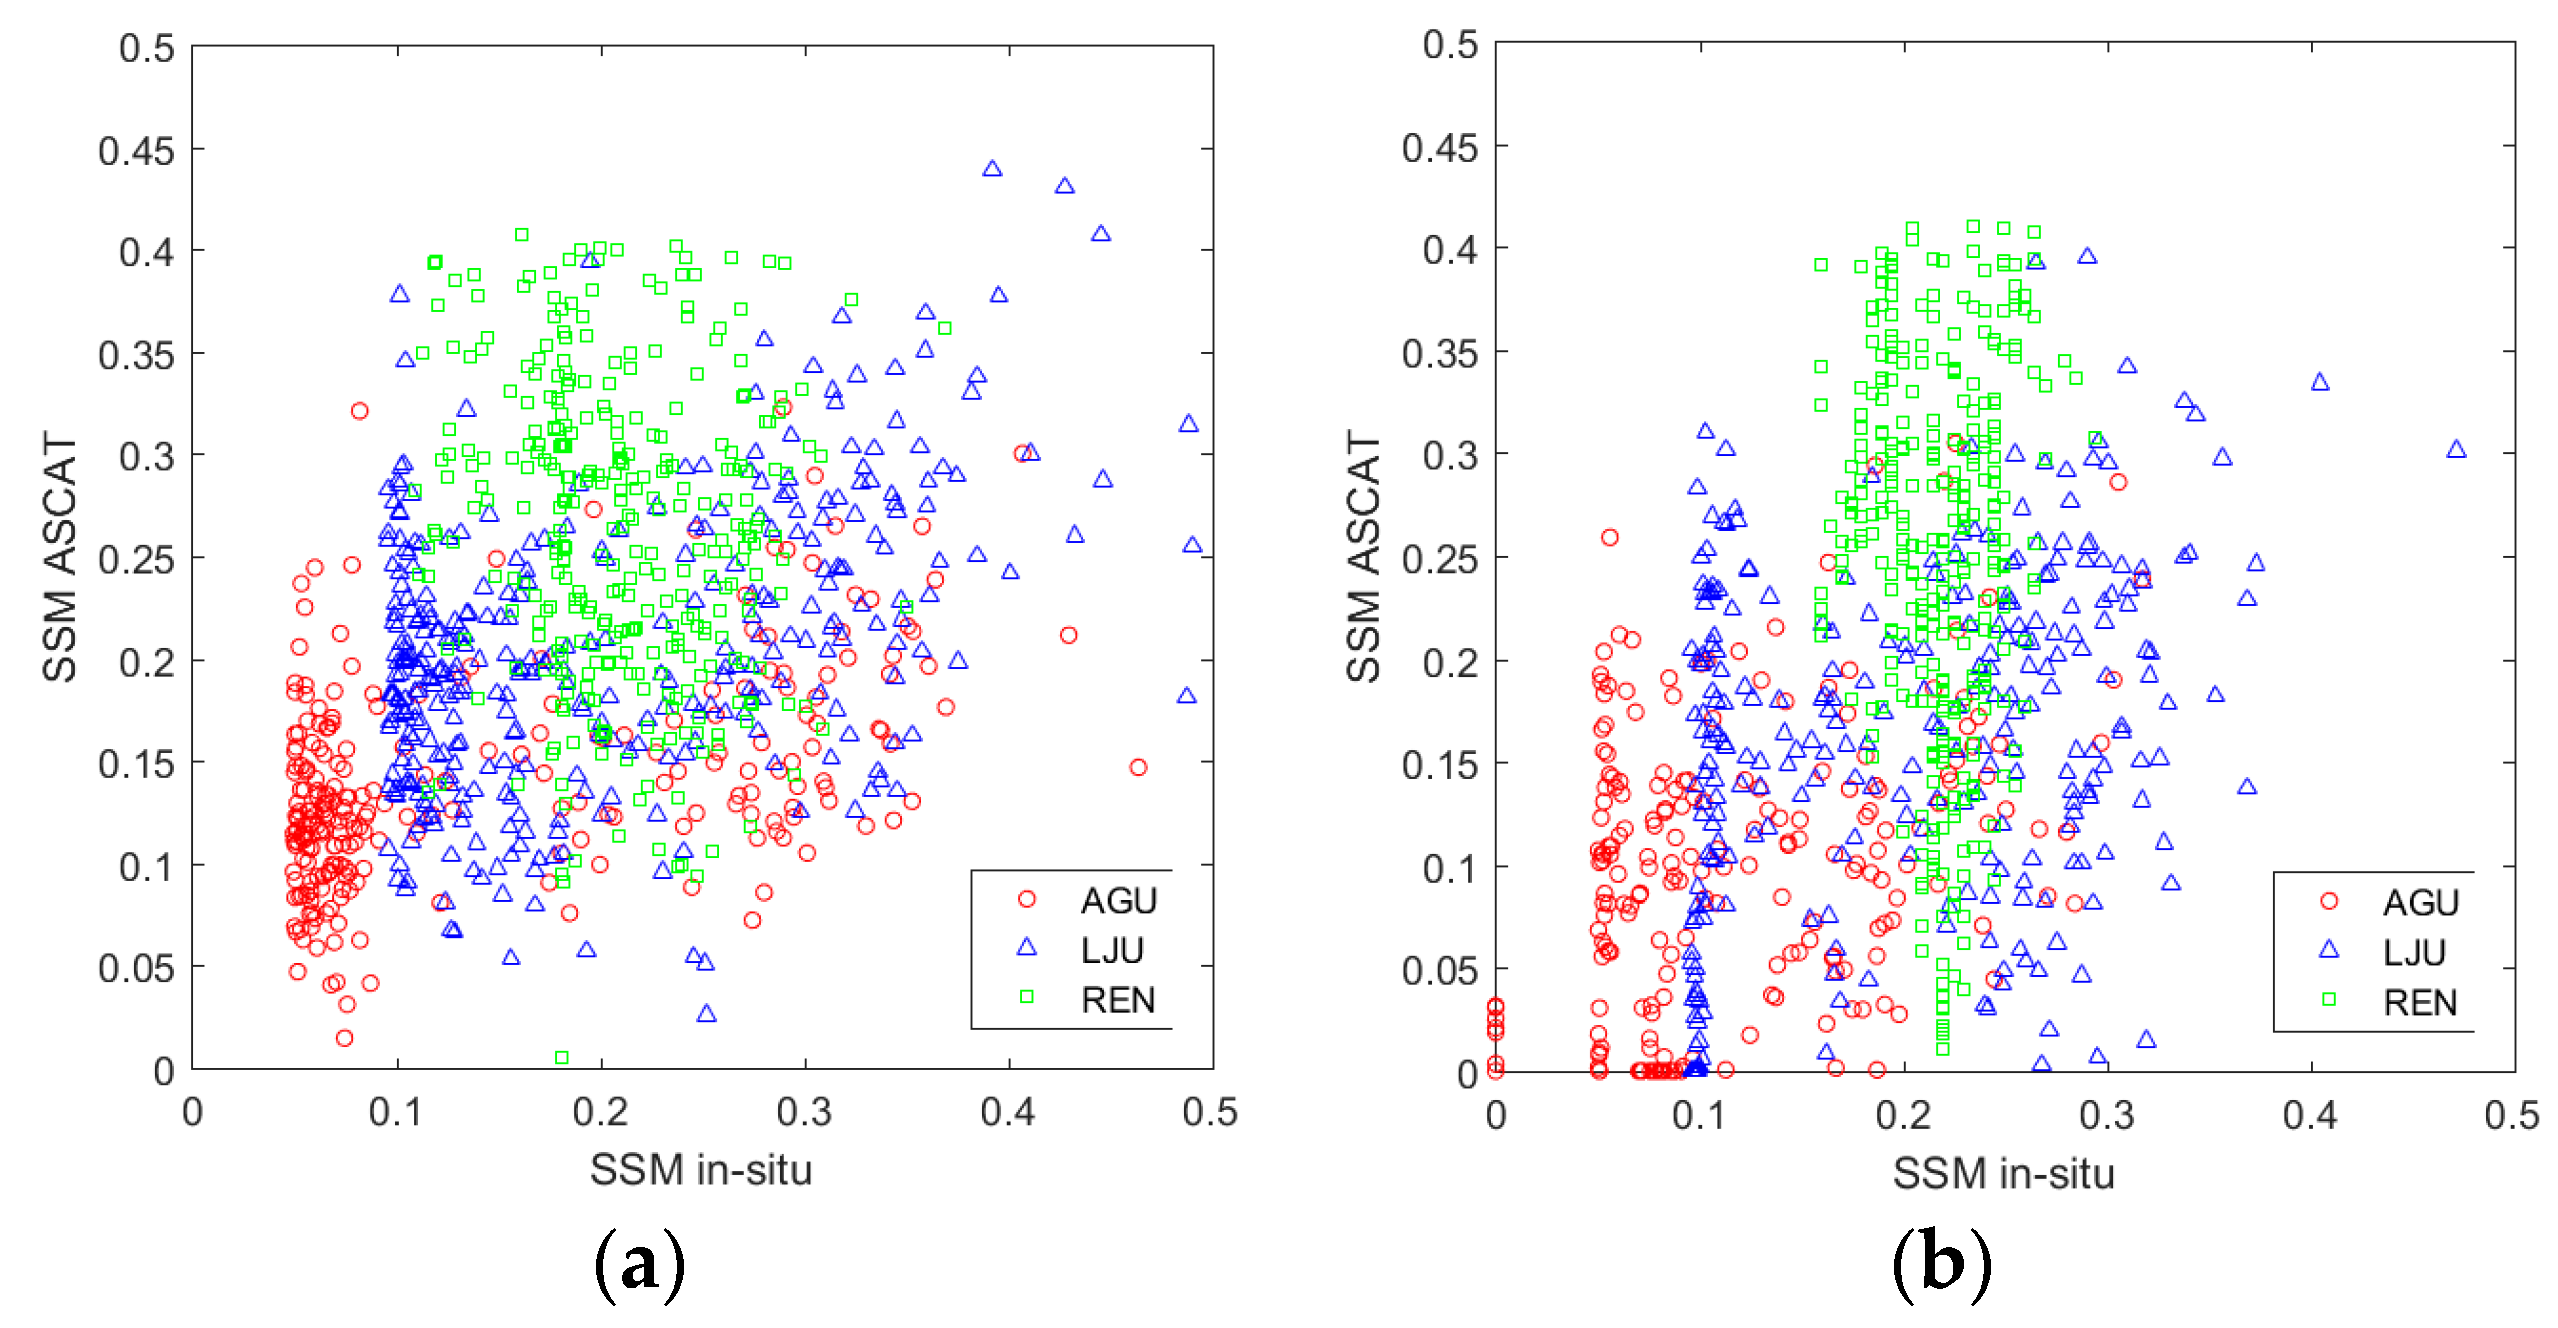
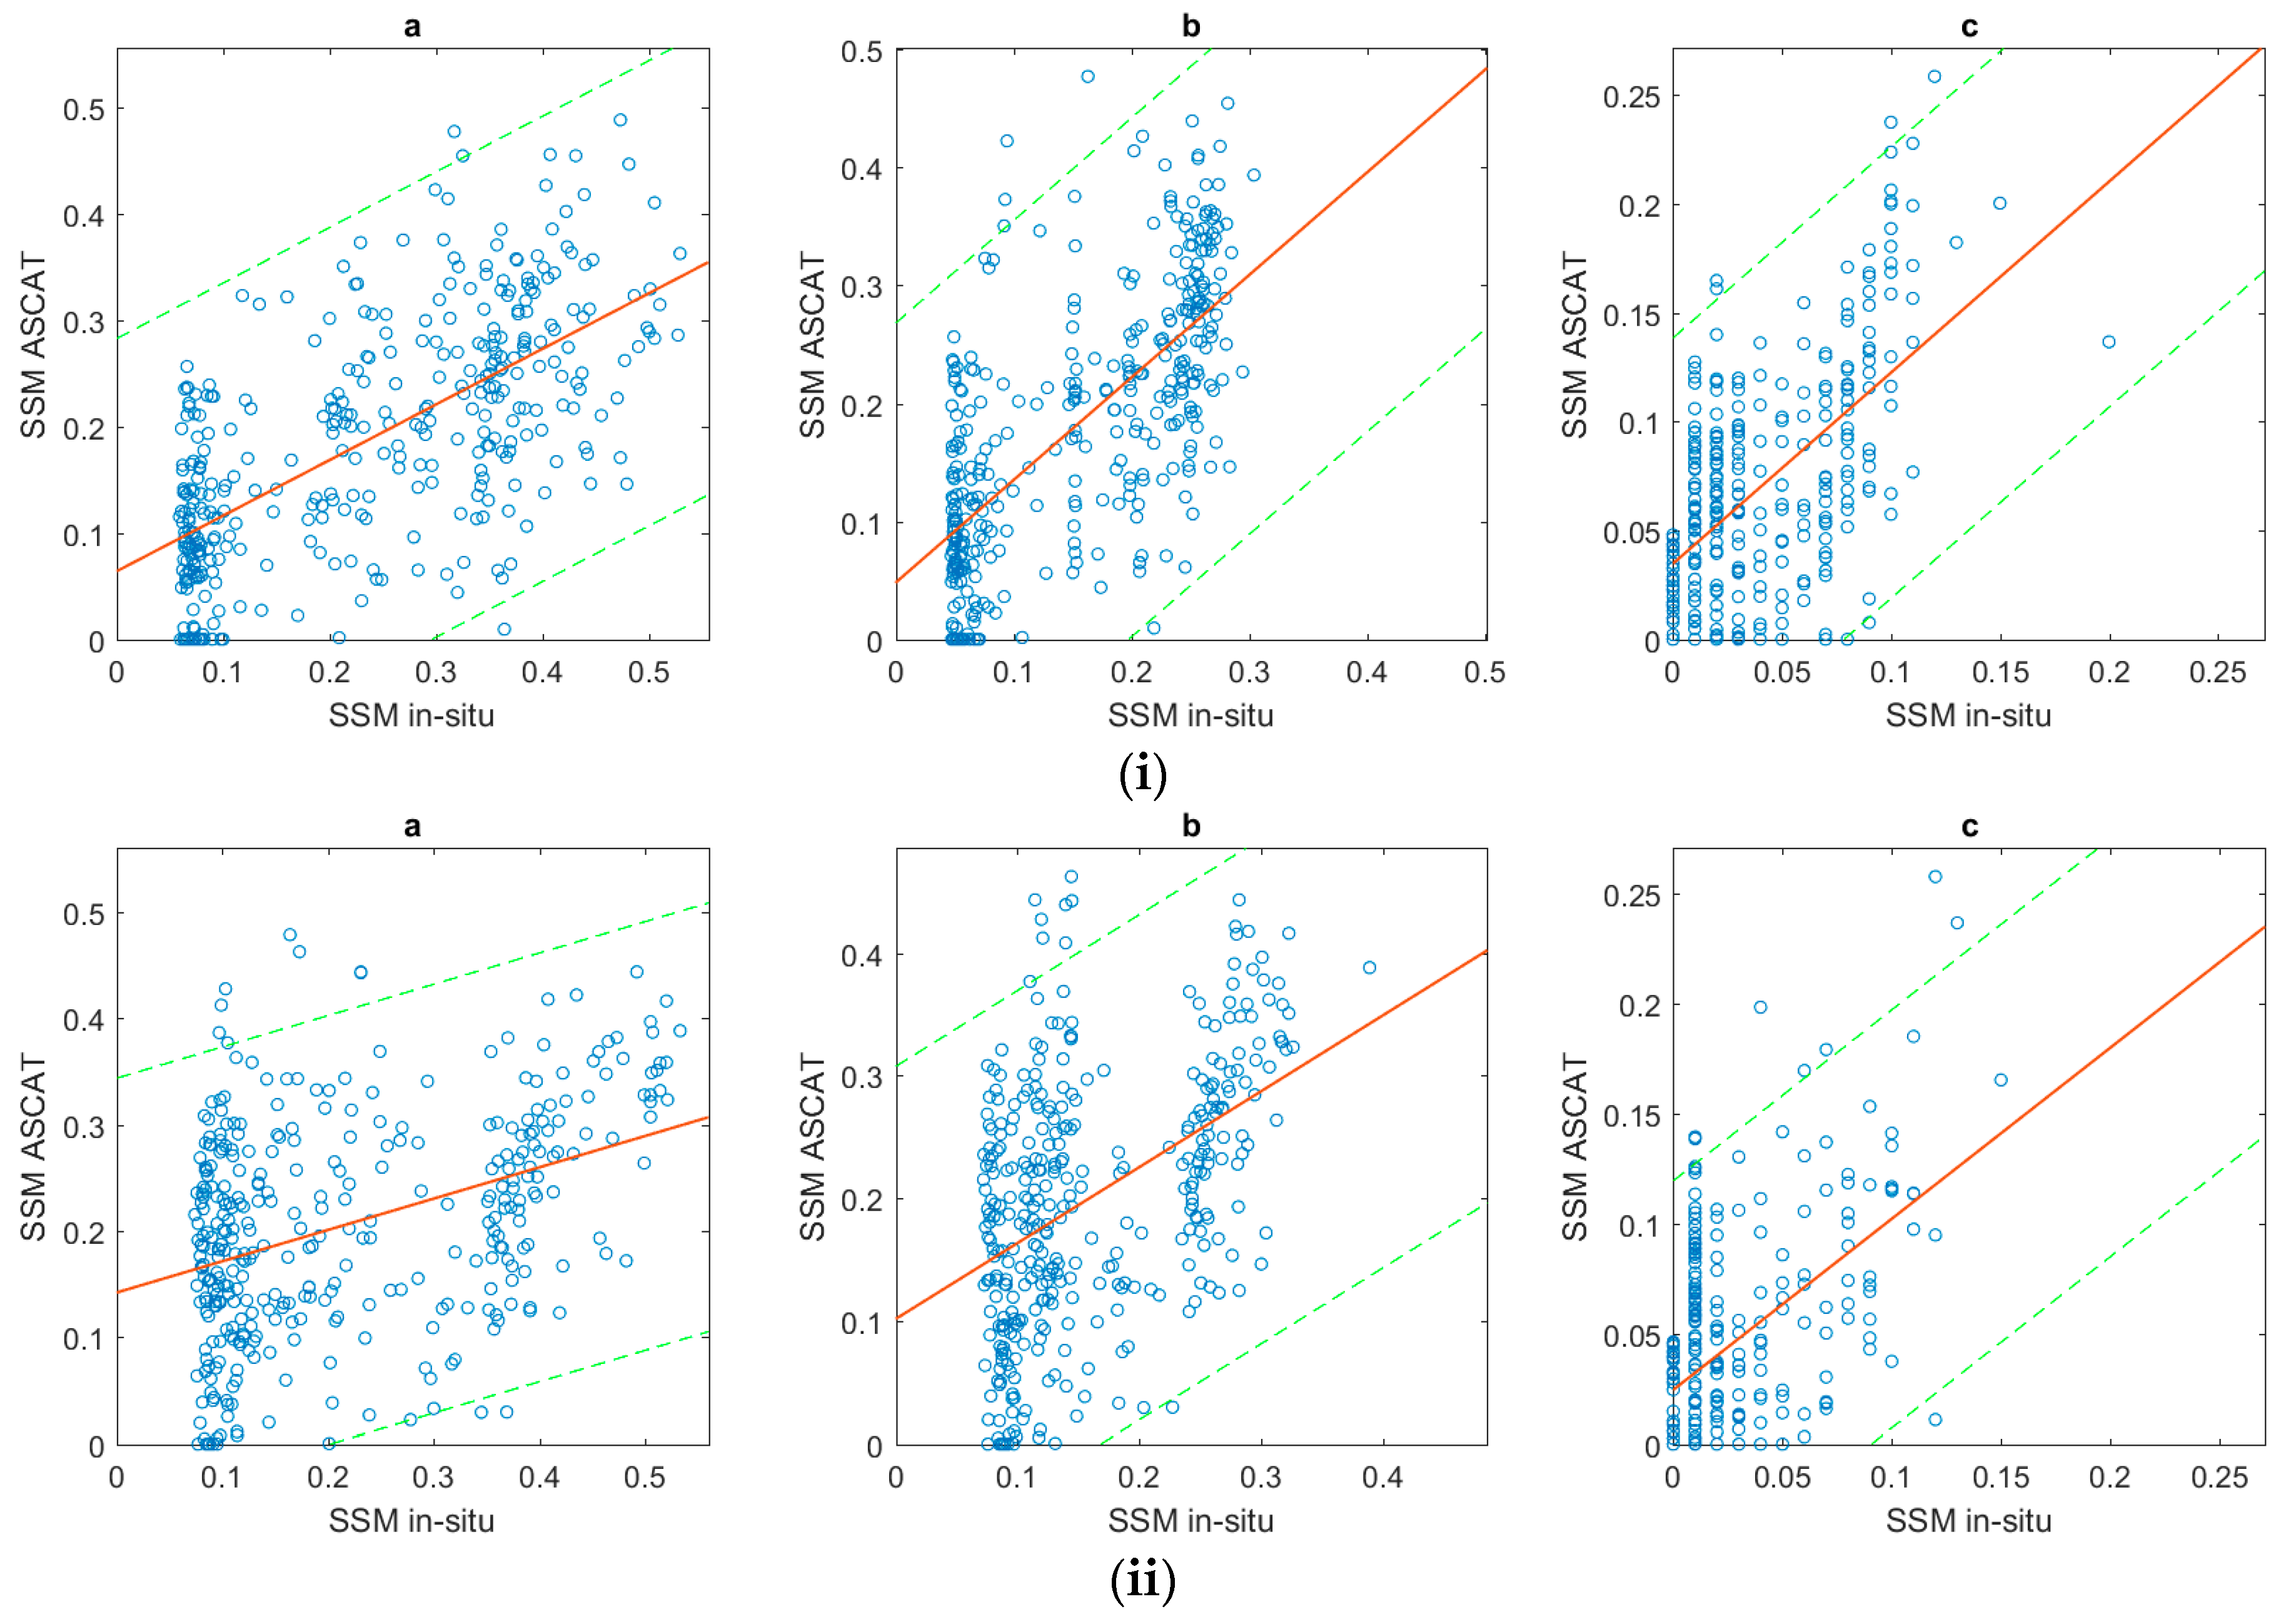
Table 2 and
Figure 1 and
Figure 2 summarize the results from the comparisons of SSM between ASCAT and in situ. Both for the individual sites and for the combined data from all sites, the bias of the ASCAT measurements is low when compared to the range of the observed values. In the combined comparison, with 1788 points, the bias is 0.005 m
3 m
−3, while the values of in situ SSM range from 0 to 0.5 m
3 m
−3. In general, the ASCAT predictions show a mild RMSE (ranging between 0.82 and 1.06 m
3 m
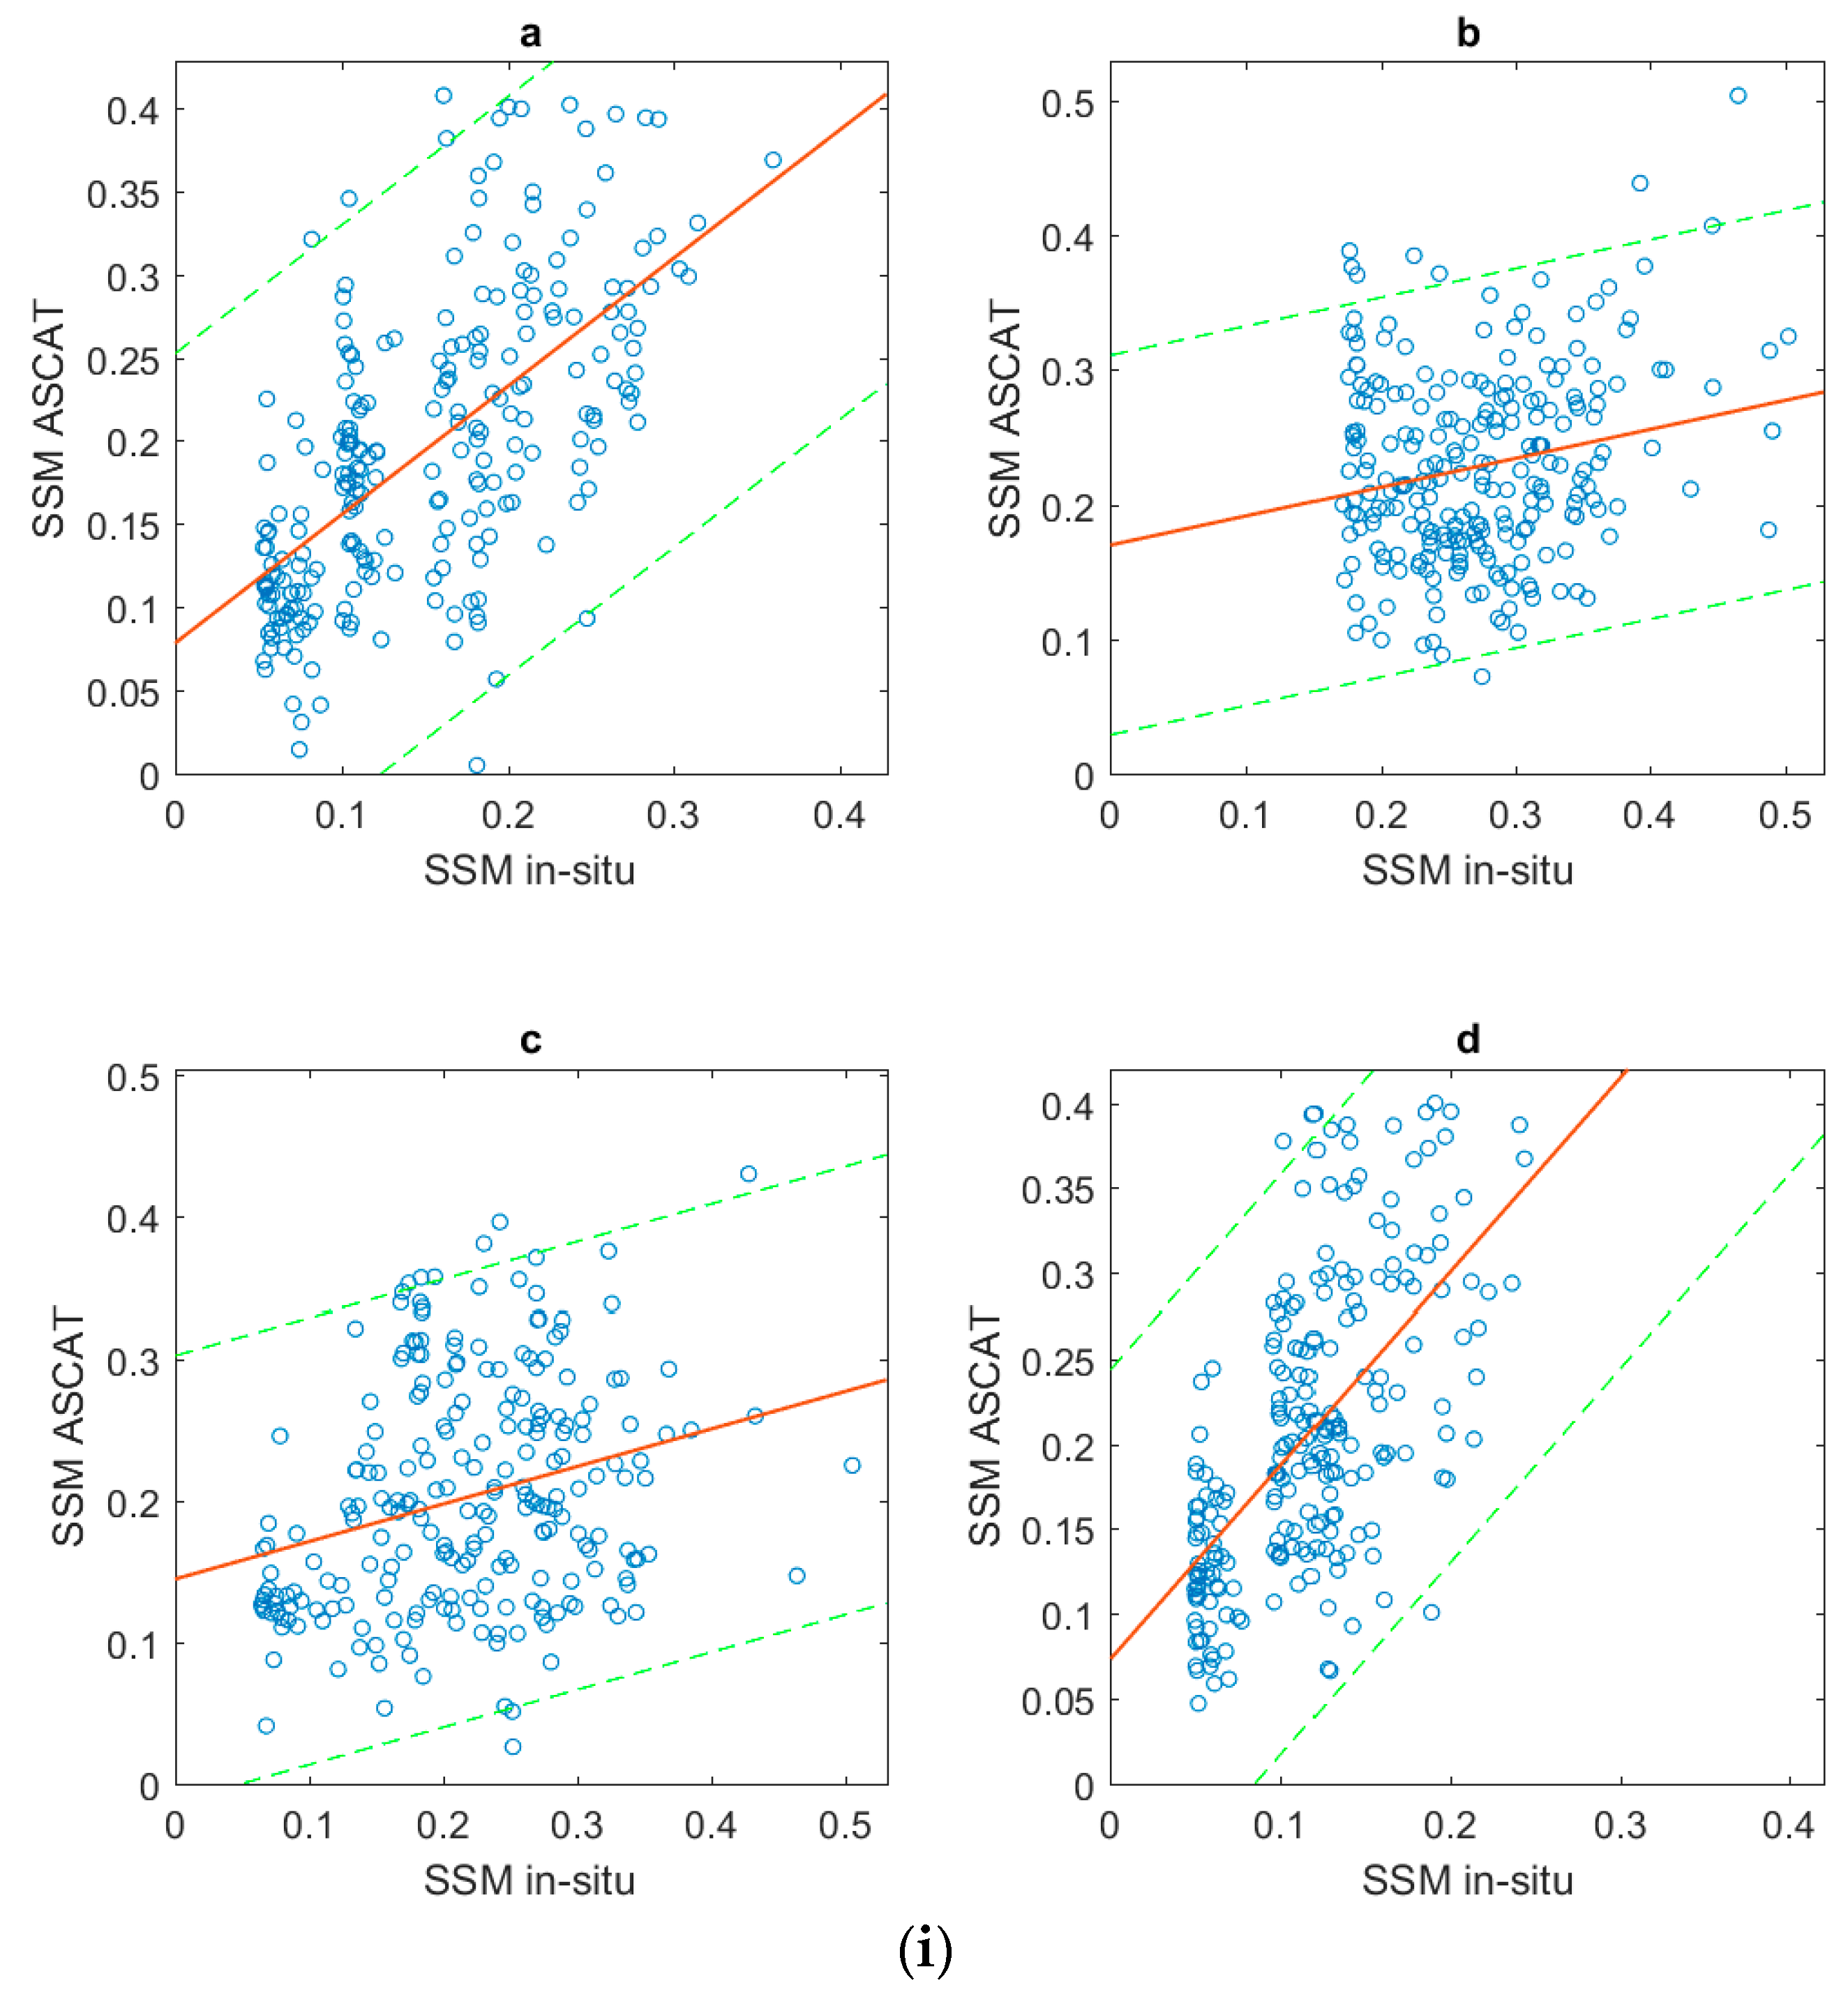
−3) and also a generally unsatisfactory correlation coefficient. In contrast, the in situ and ASCAT measurements for the needleleaf forests are uncorrelated. The coefficients for the slope and intercept for IT_REN exhibited wide confidence intervals (at 95% confidence) for both 2010 and 2011. As such, the values for these parameters could not be estimated with statistical confidence. Thus, the ASCAT and in situ measurements are essentially uncorrelated for REN sites.
4.1.1. Land Use and Land Cover Comparisons
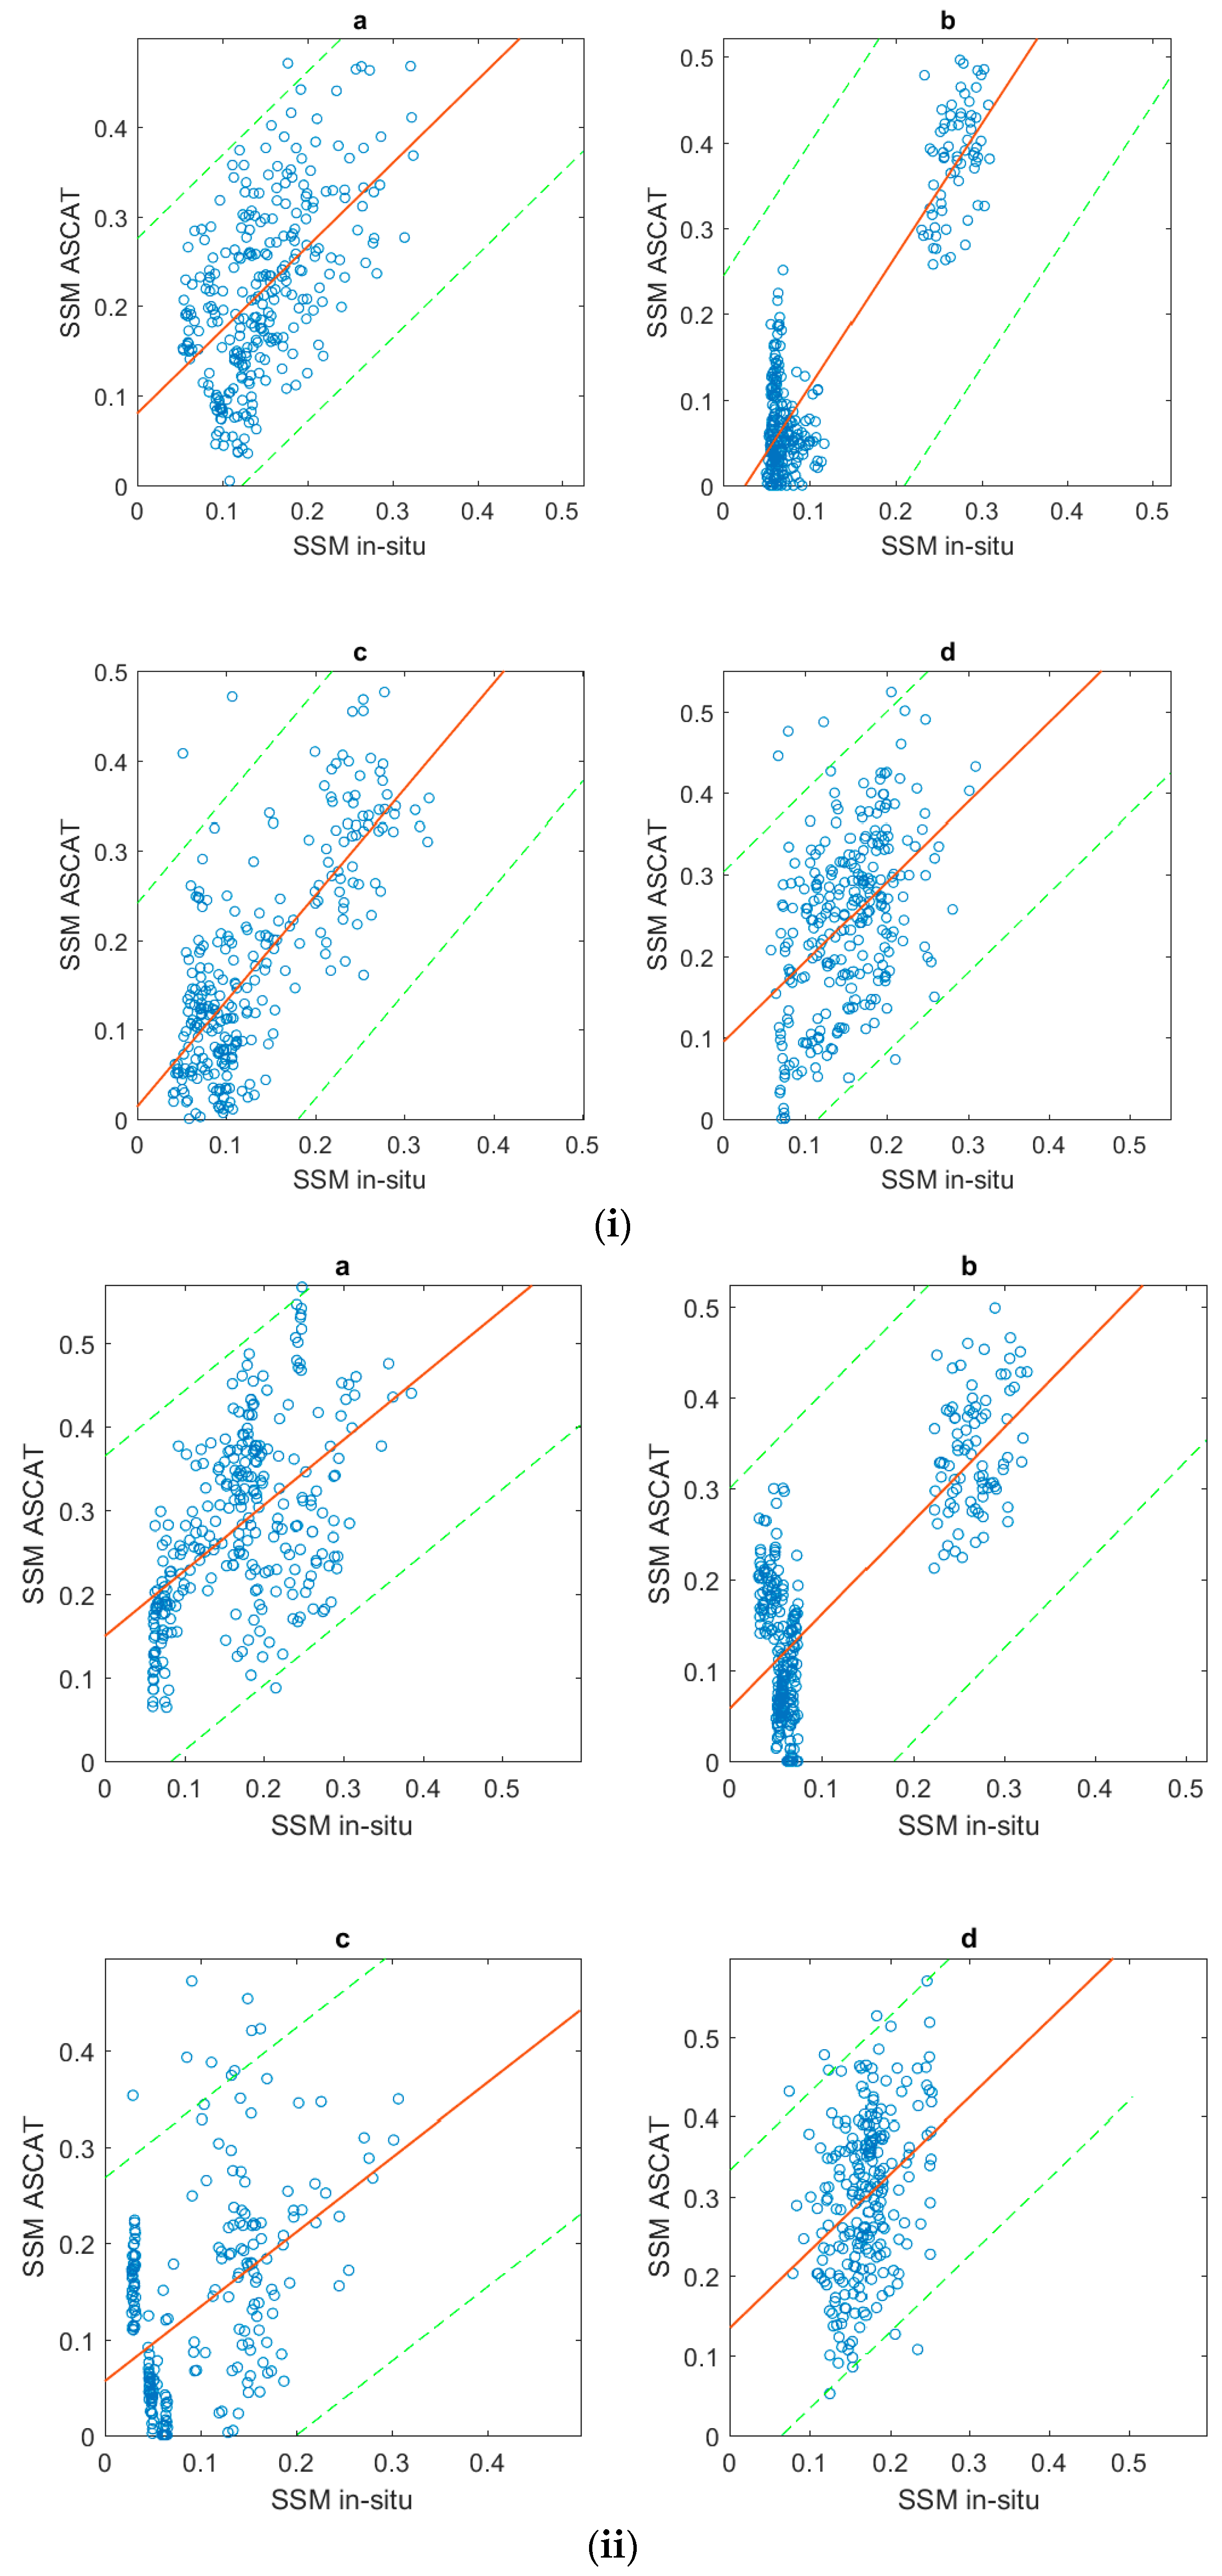
Table 2 and
Figure 1 and
Figure 2 summarize the SSM comparisons between the ASCAT product and the corresponding in situ values at the different experimental sites in Europe varying land use and land cover in 2010 and 2011. It shows various performances that are associated to land surface types when data for both years plotted combined or individual sites. It can be noted that, over the evergreens forest, there is no correlation between in situ and ASCAT soil moisture, at least for the data that are explored in our study.
4.1.2. Seasonality
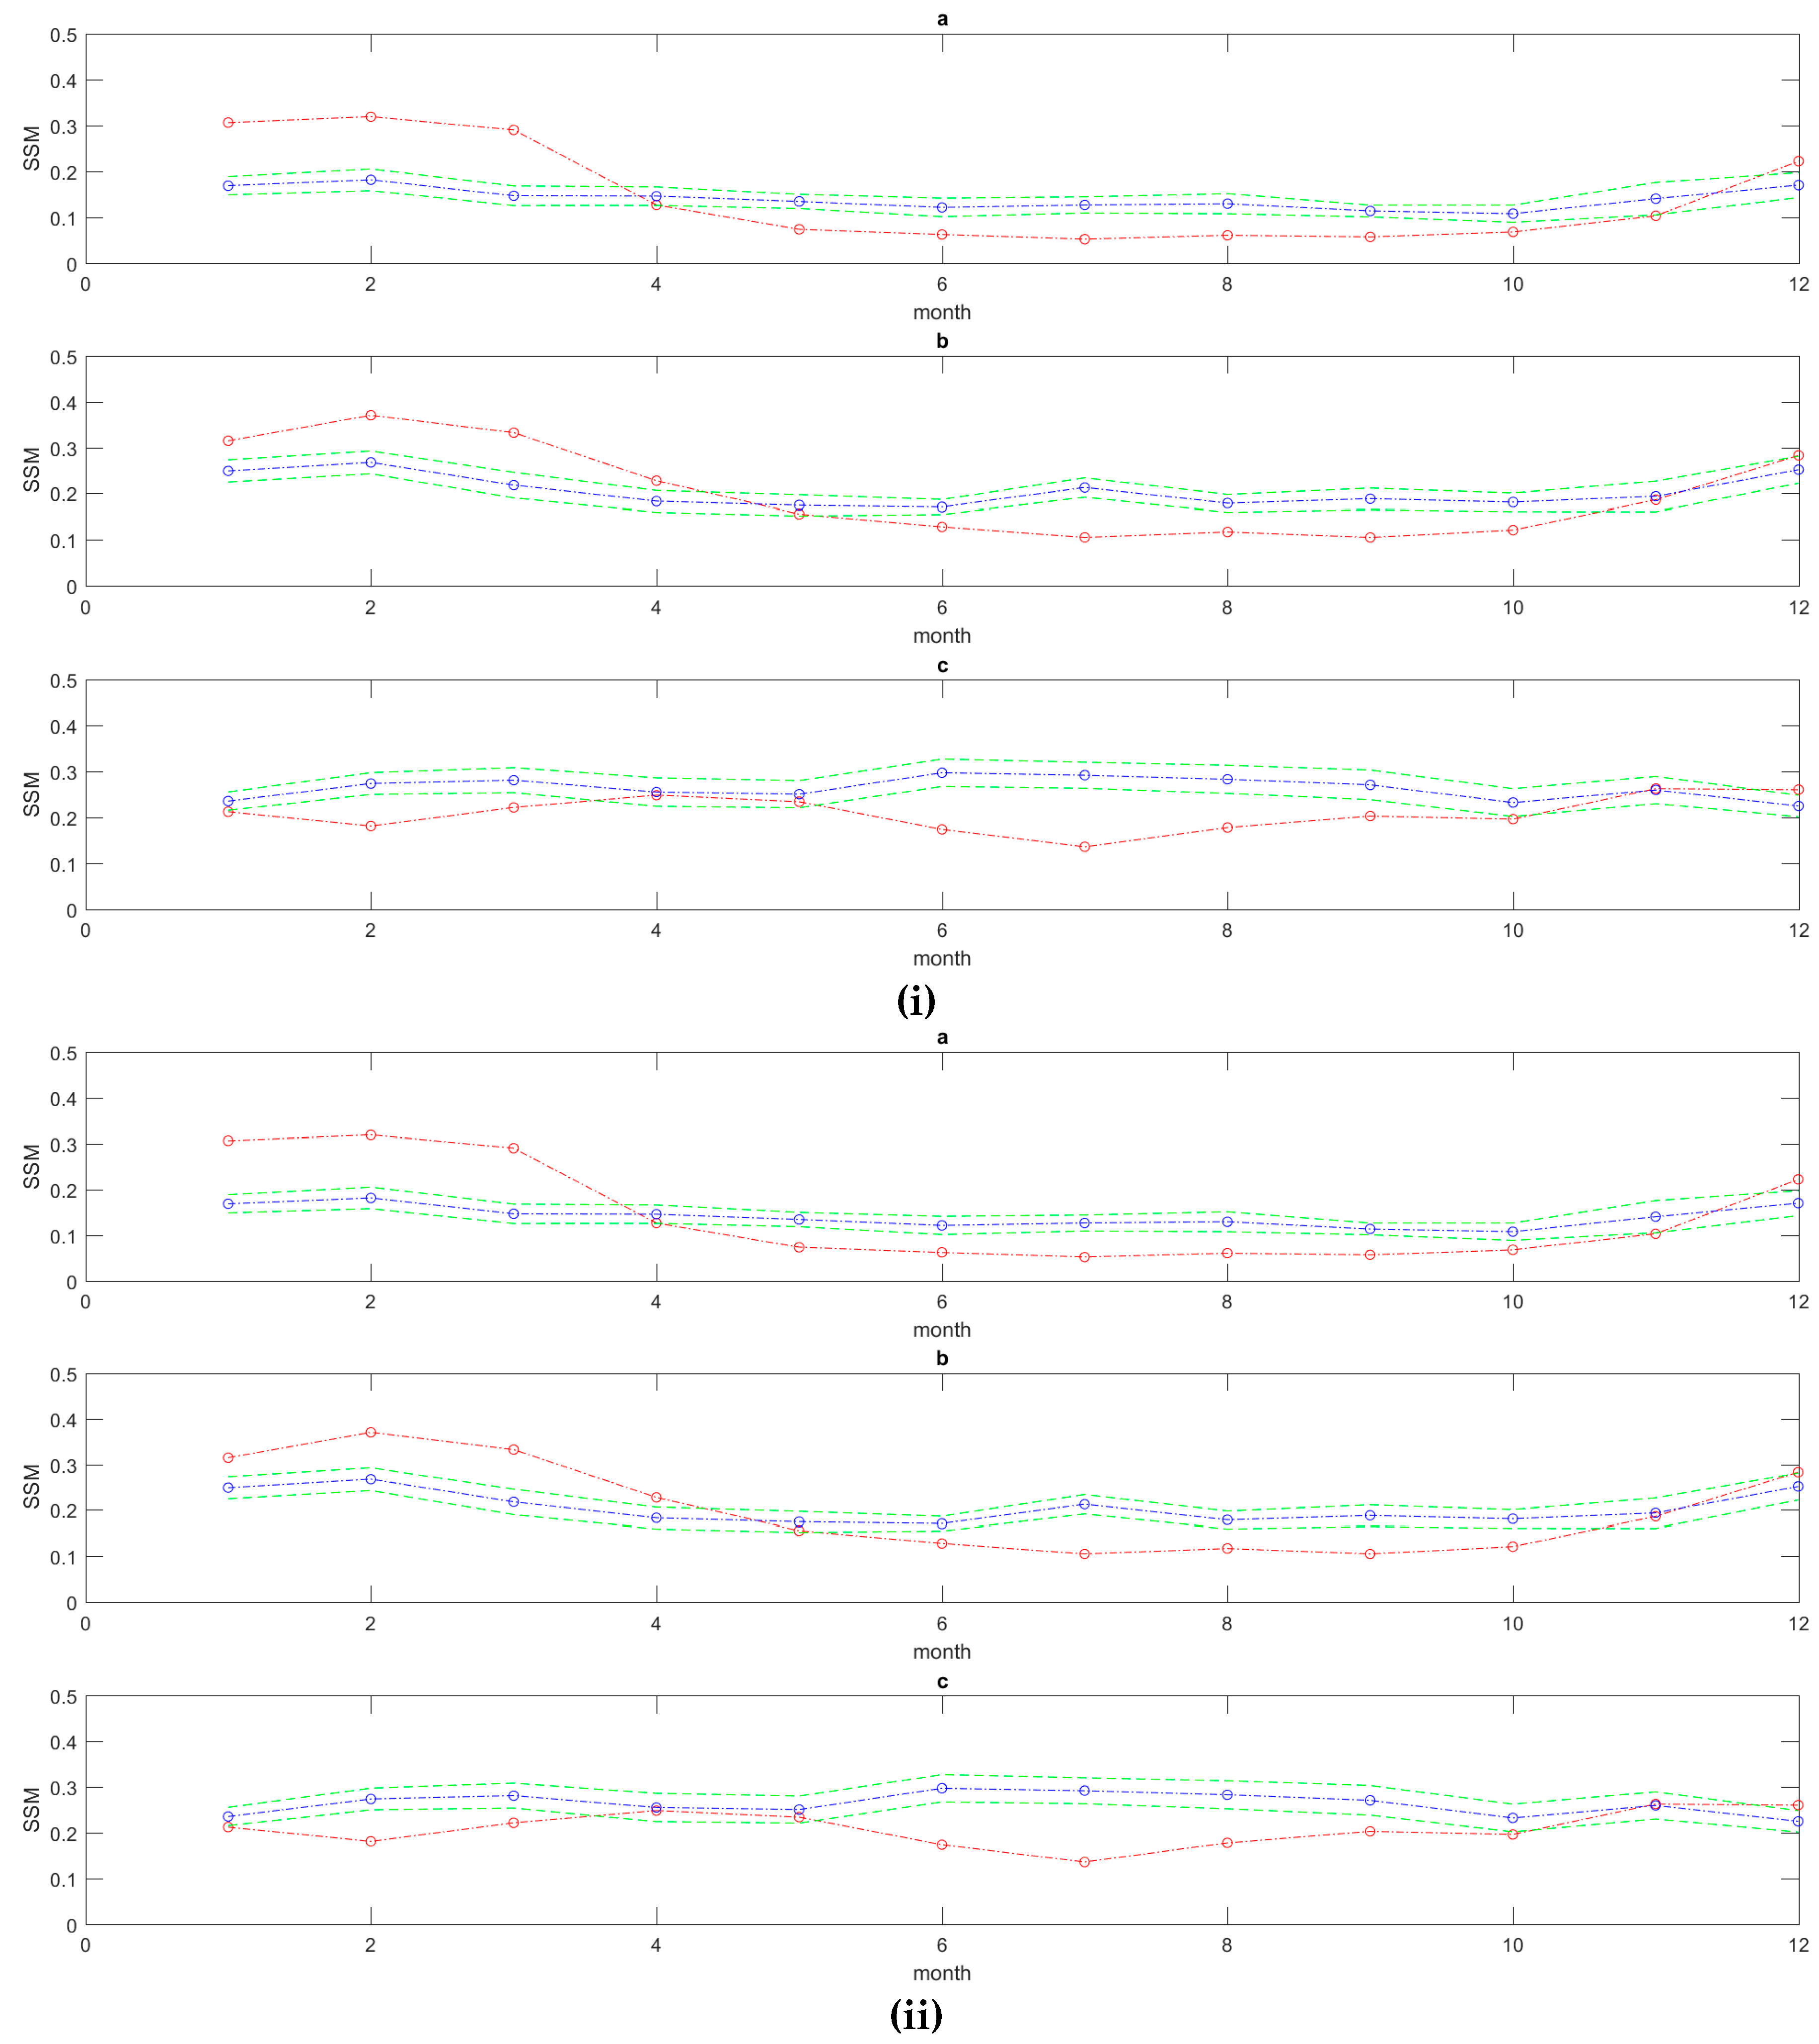
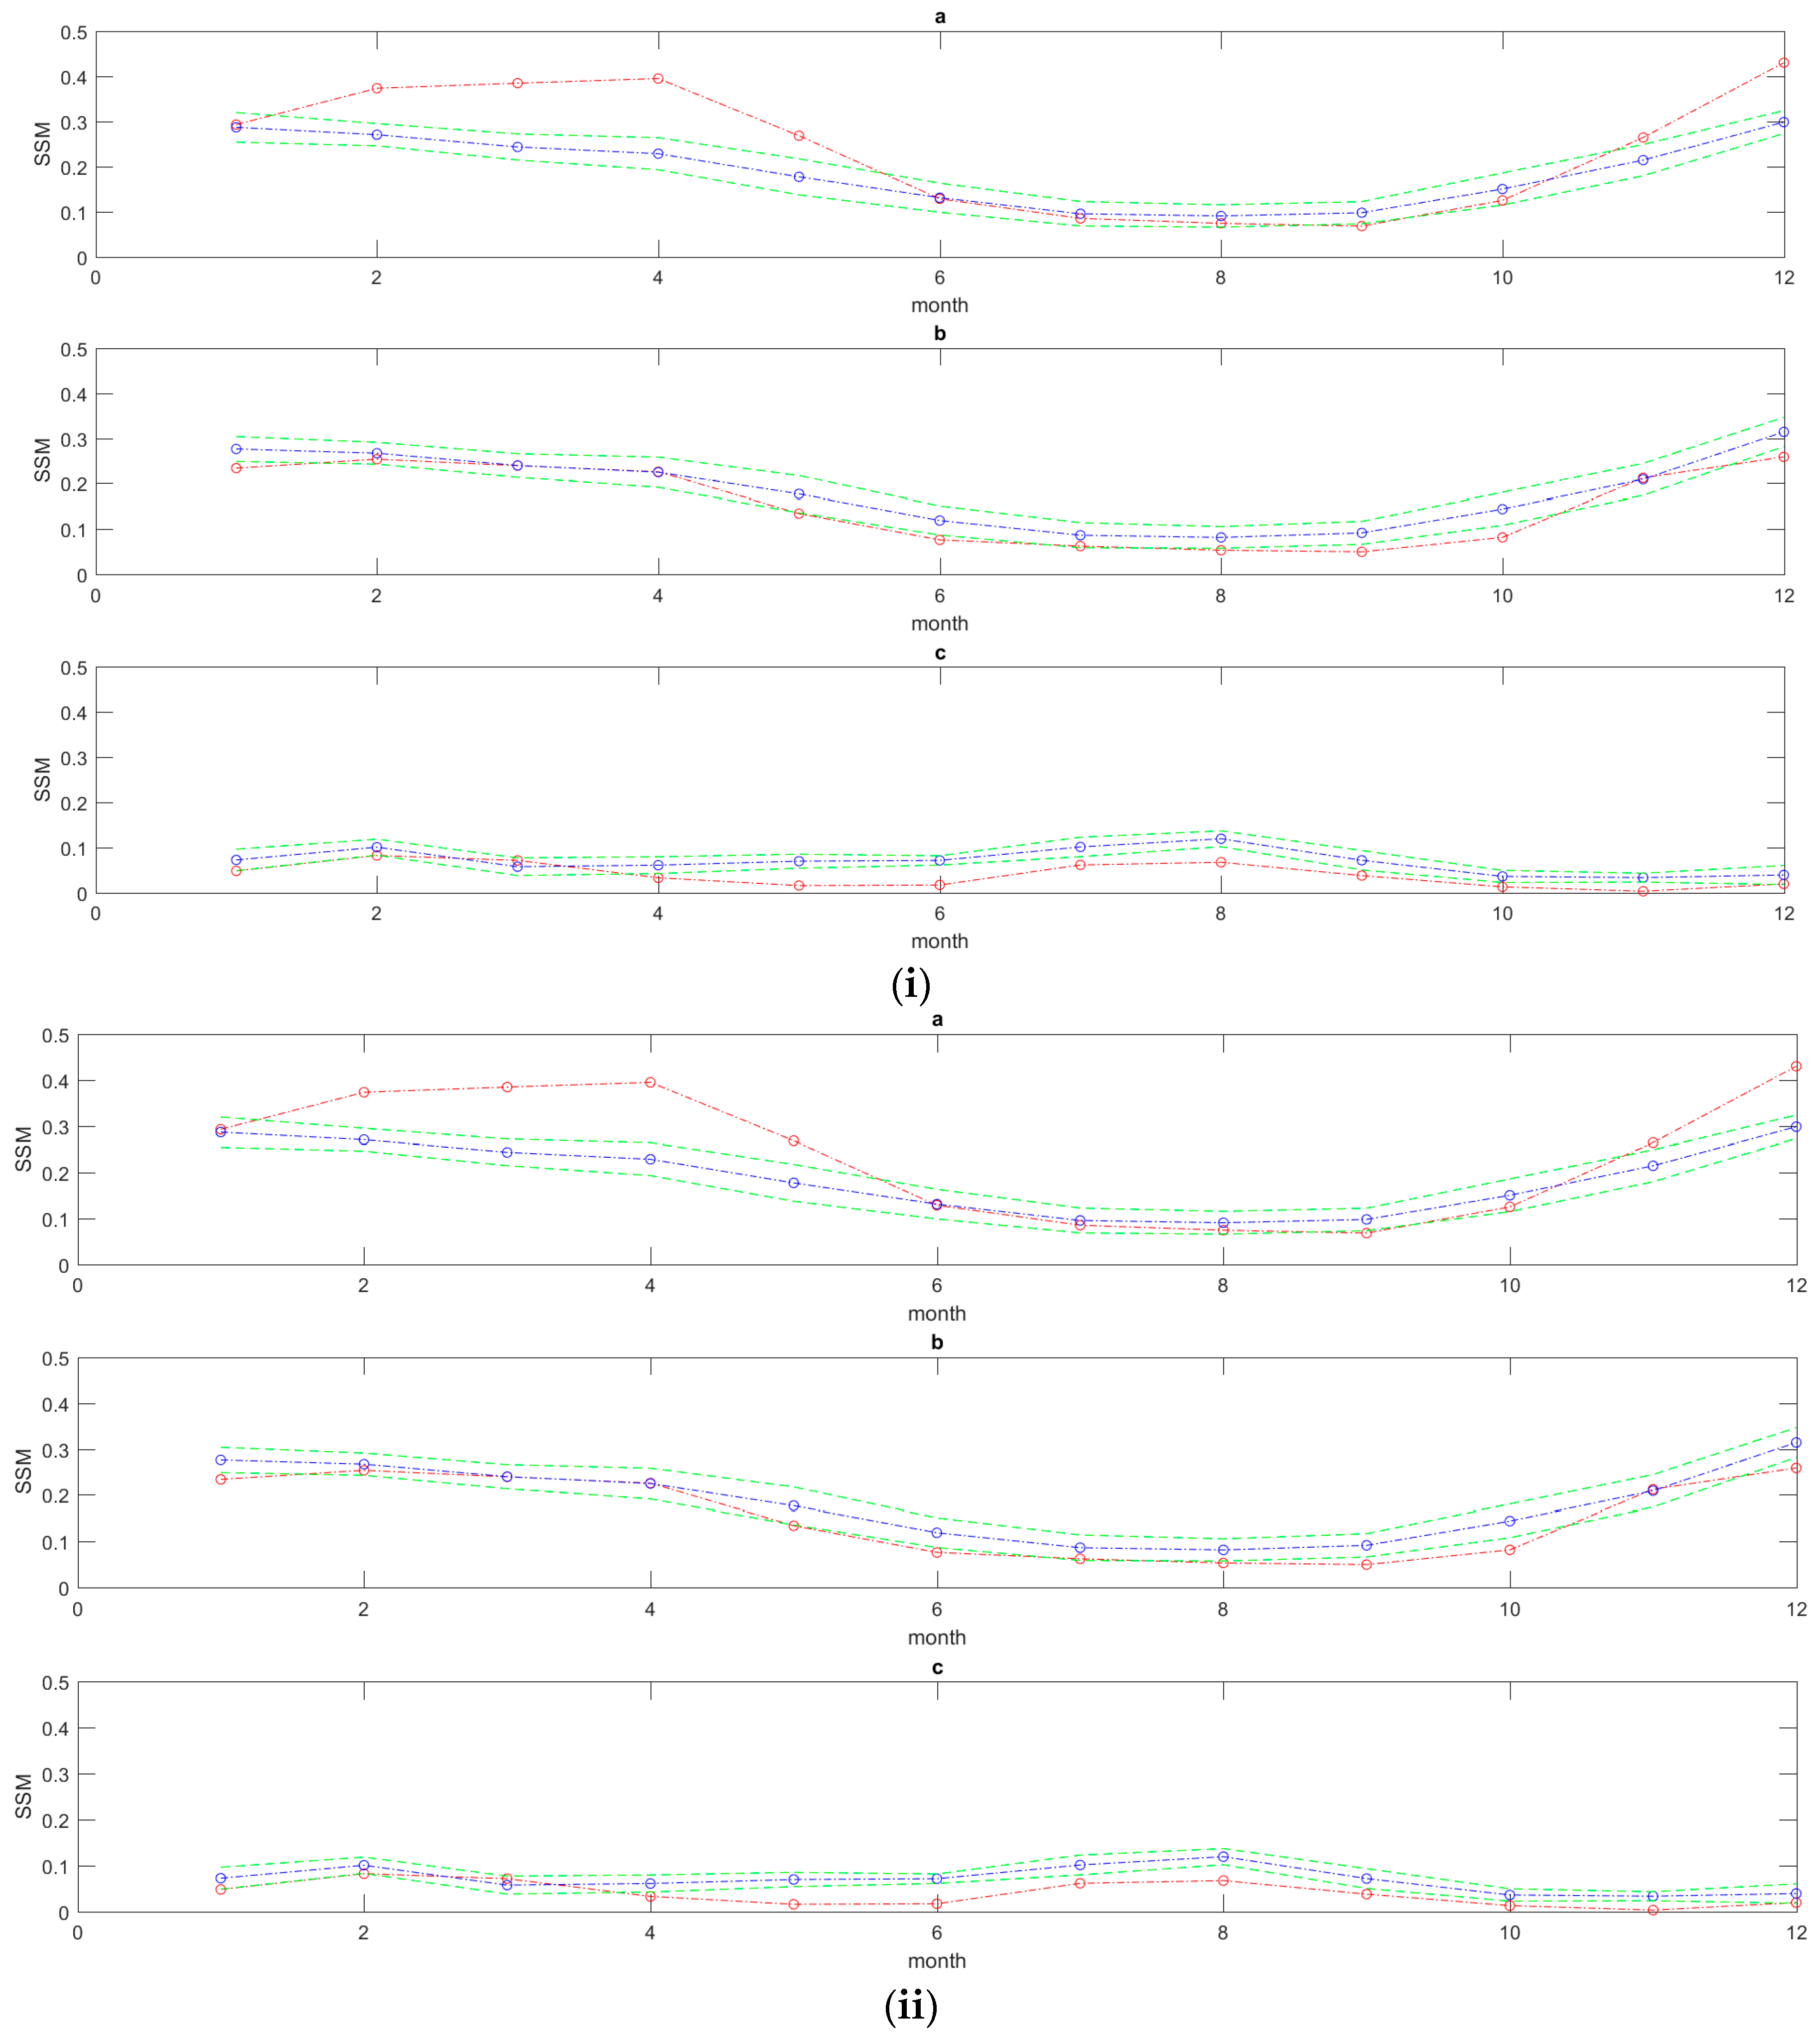
Table 3 and
Figure 3 and
Figure 4 show the temporal trends between in situ and ASCAT for different seasons during 2010 and 2011. In general, the plots in
Figure 3 and
Figure 4 exhibit a good agreement in terms of seasonal trends. Overall, soil moisture values are highly responsive to seasonality, as indicated by marked fluctuations over the entire period and the rapid response to changes in weather (
Figure 4). However, the ASCAT product overestimates the in situ observations of January to February and it underestimates the in situ observations from May to September, while it is consistent with the in situ trends from October to December over ES_AGU and ES_LJU. In contrast, it underestimates the in situ observations in January–February and from June to September over IT_REN (
Figure 4). The same trends were observed in the year 2011 as well.
Table 3 summarizes the seasonal comparisons for all the sites in 2010 and 2011.
Figure 4 shows the agreement between predicted and observed SSM for the different seasons separately for 2010 and 2011. The RMSE is higher during 2011. The weakest correlations are evidenced in spring and winter of the year 2010.
4.2. USA
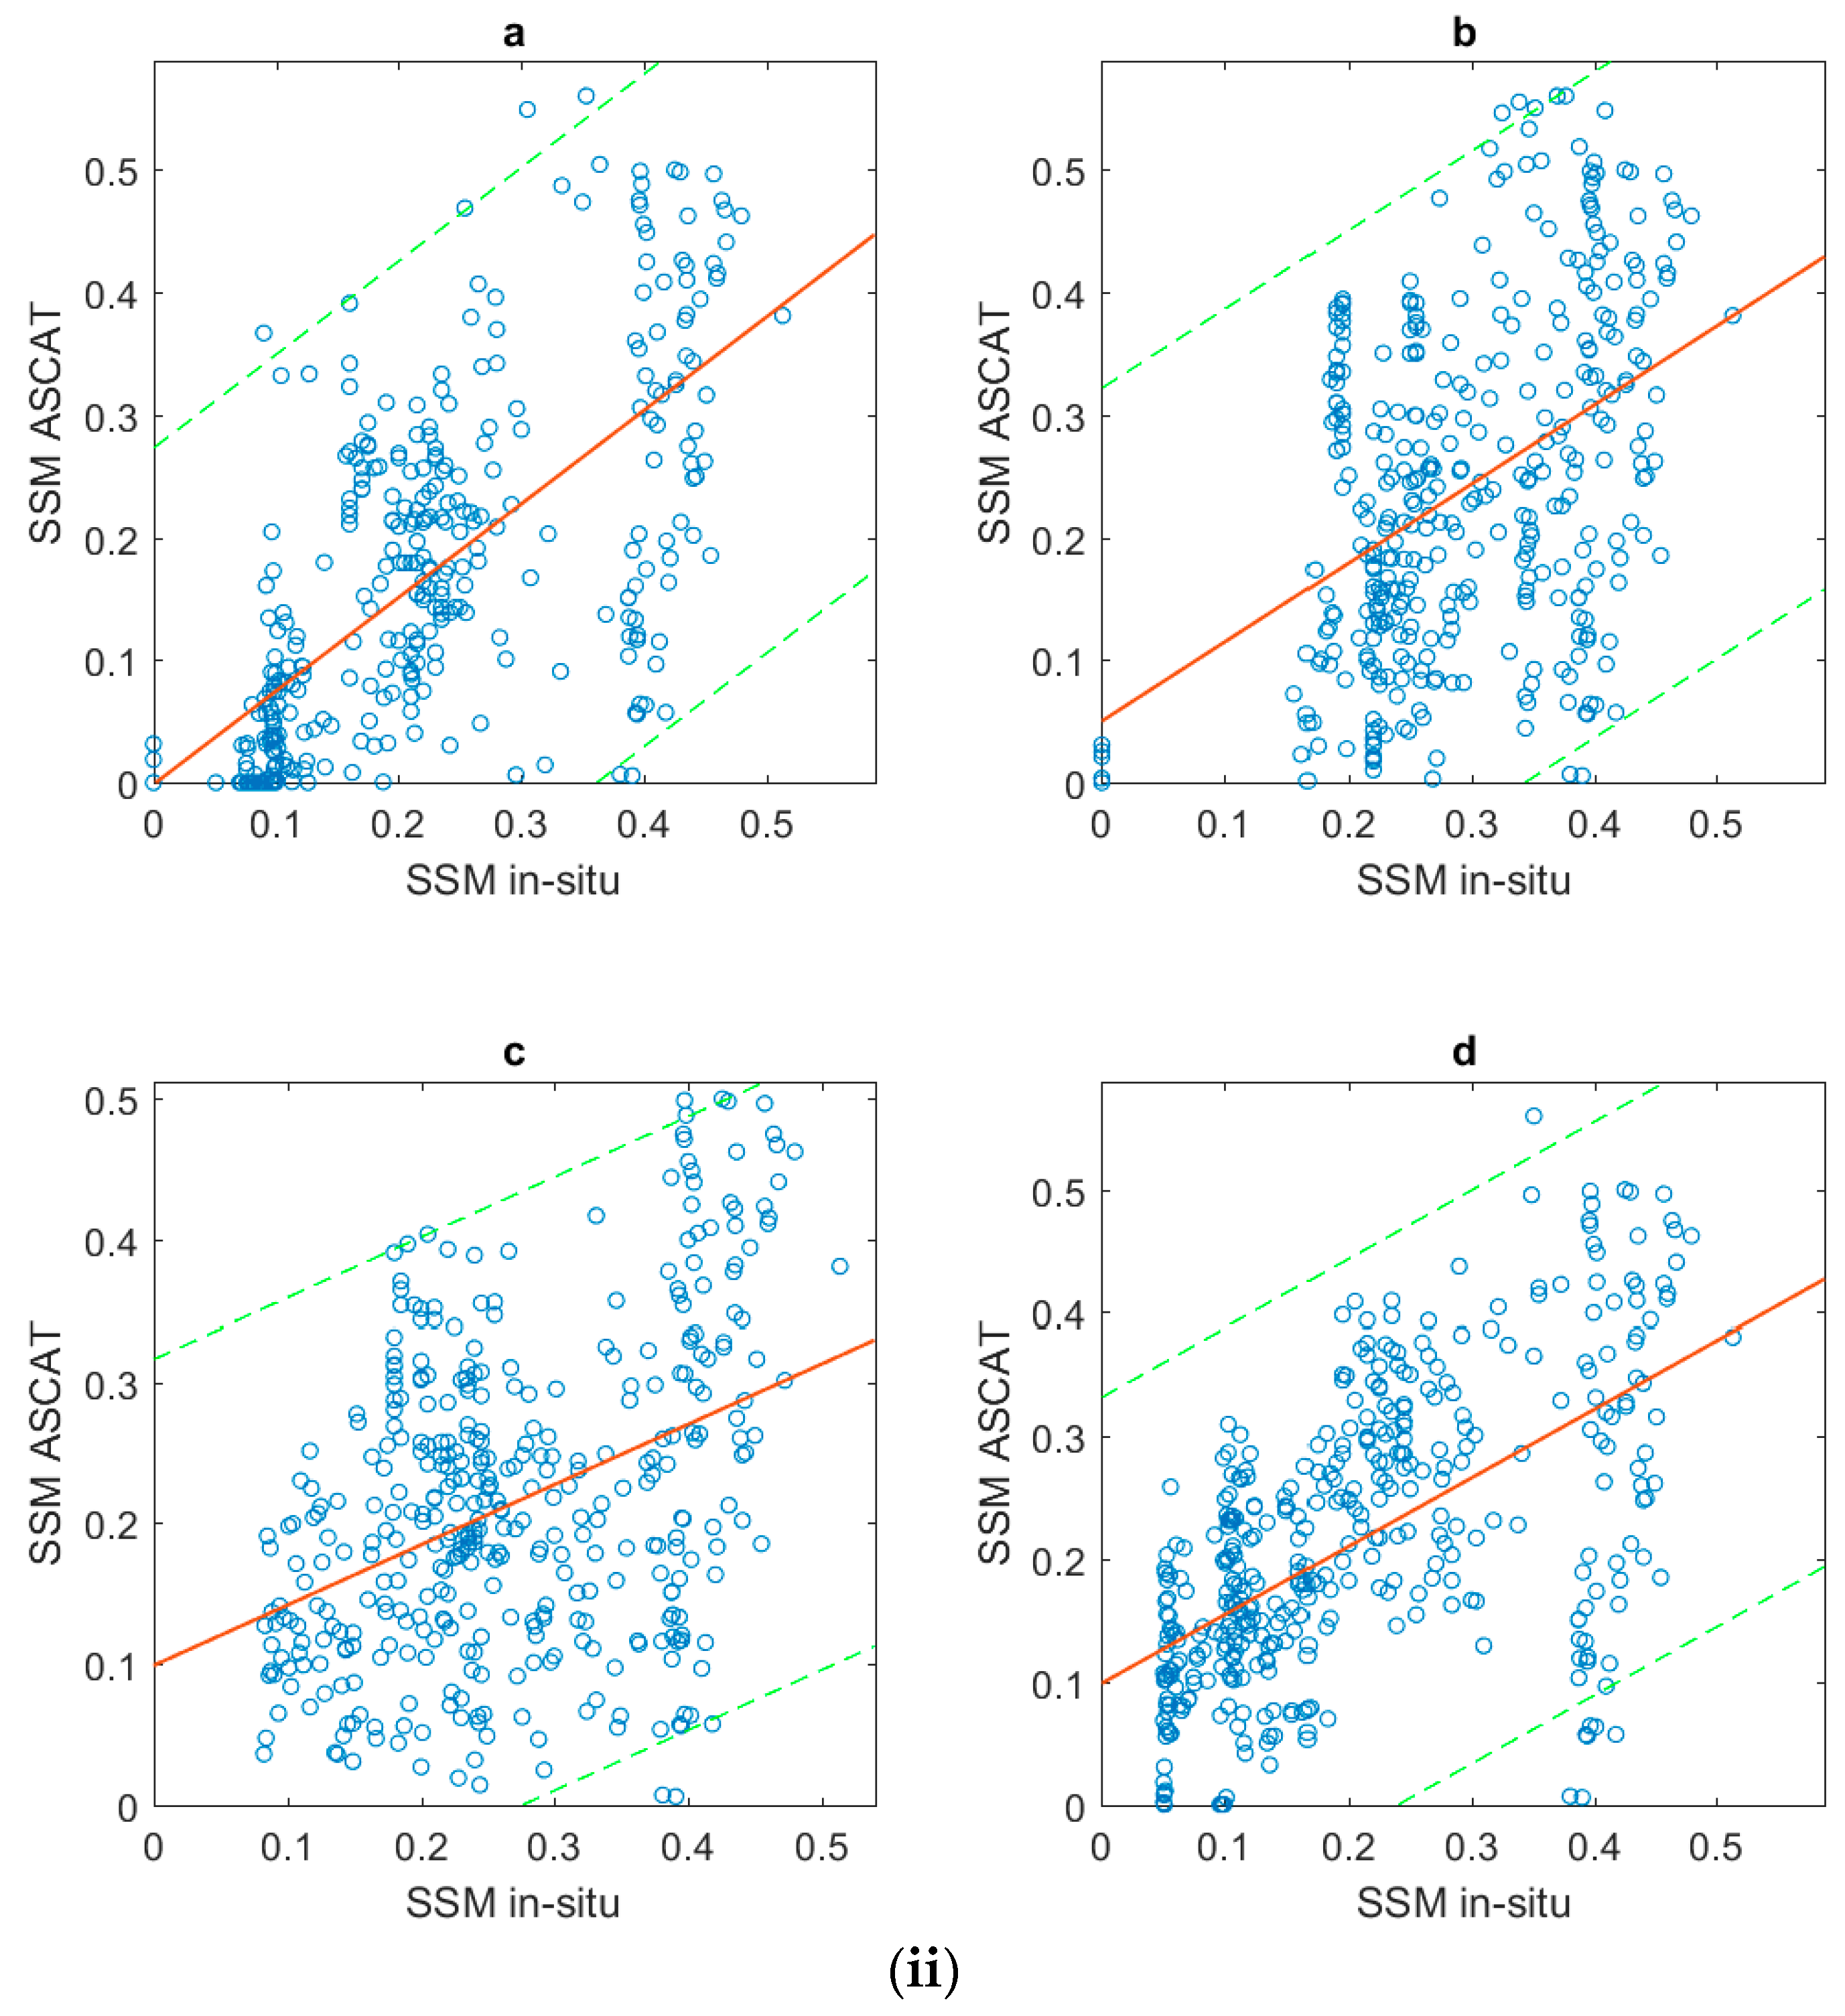
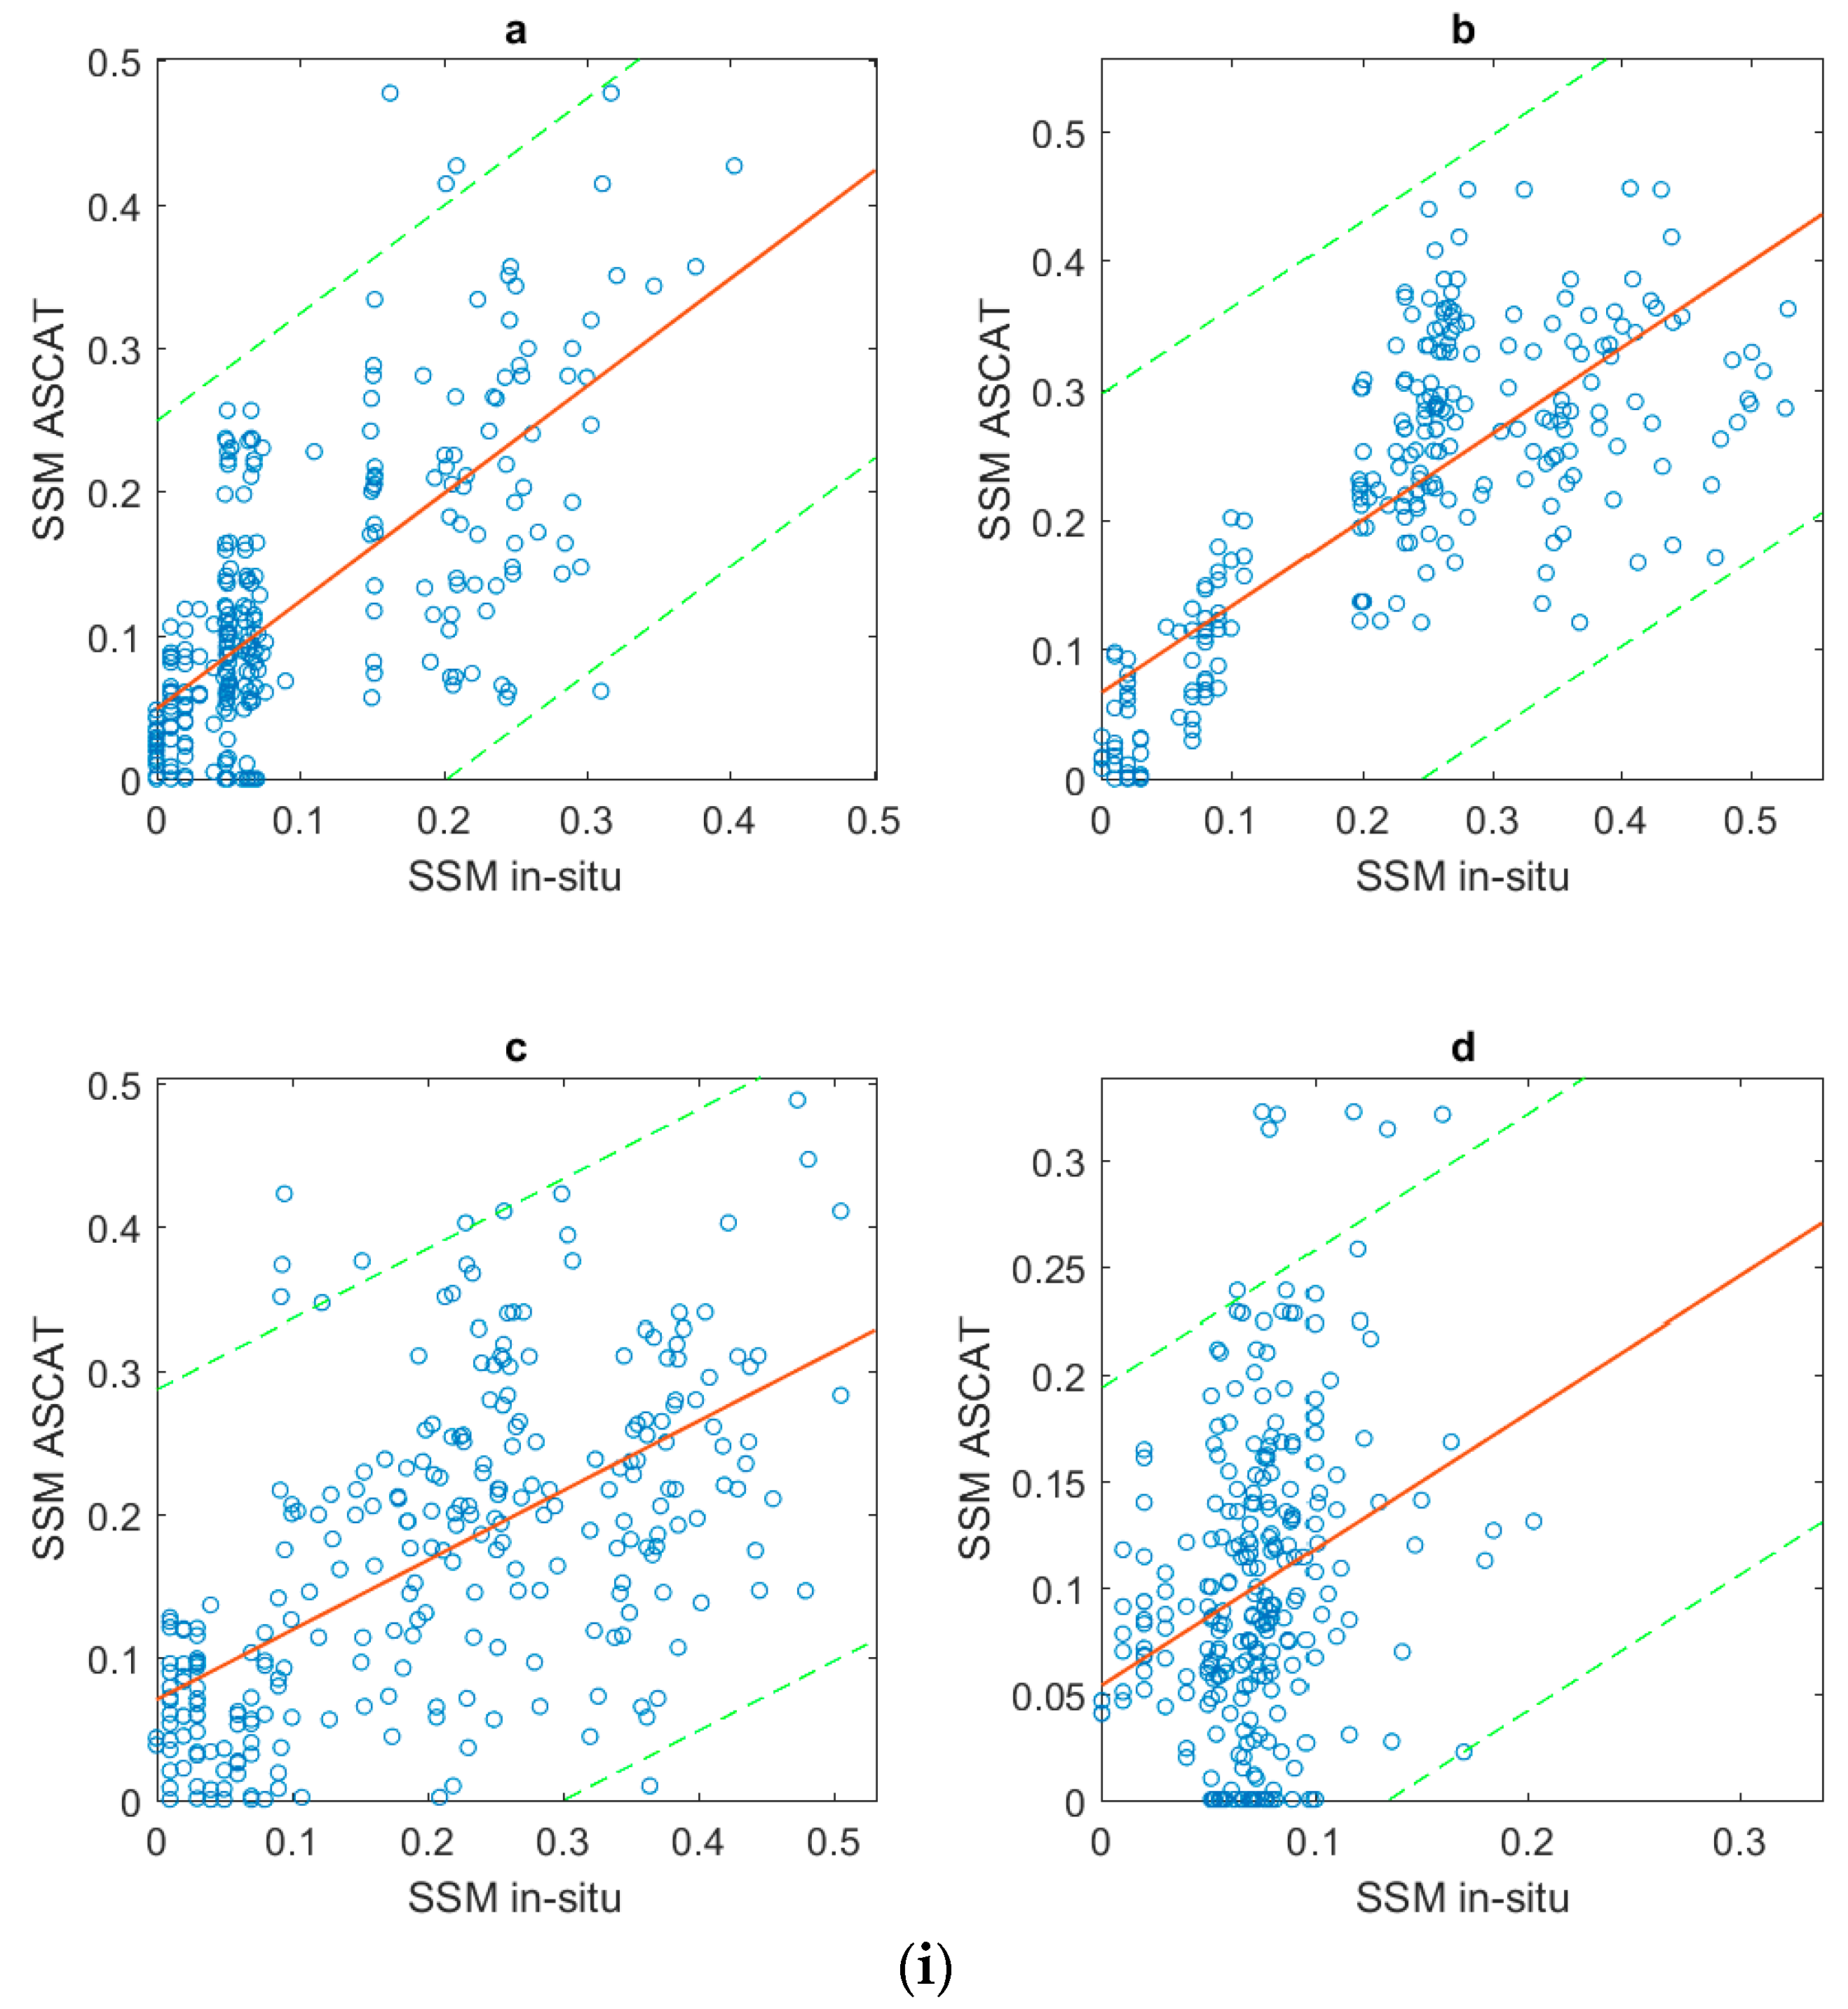
Statistical scores for evaluating the agreement between the ASCAT and the in situ reference soil moisture measurements from FLUXNET validated observational networks in the USA were used. The selected sites are mainly covered by grassland, open shrubland, and woody savanna. As shown in
Table 4 and
Figure 5 and
Figure 6, all of the days were determined and the main results are presented. Generally, as indicated from the statistical metrics computed for the case of comparison for all days, a relatively a good agreement between the two data sets was reported.
4.2.1. Land Use and Land Cover Comparisons
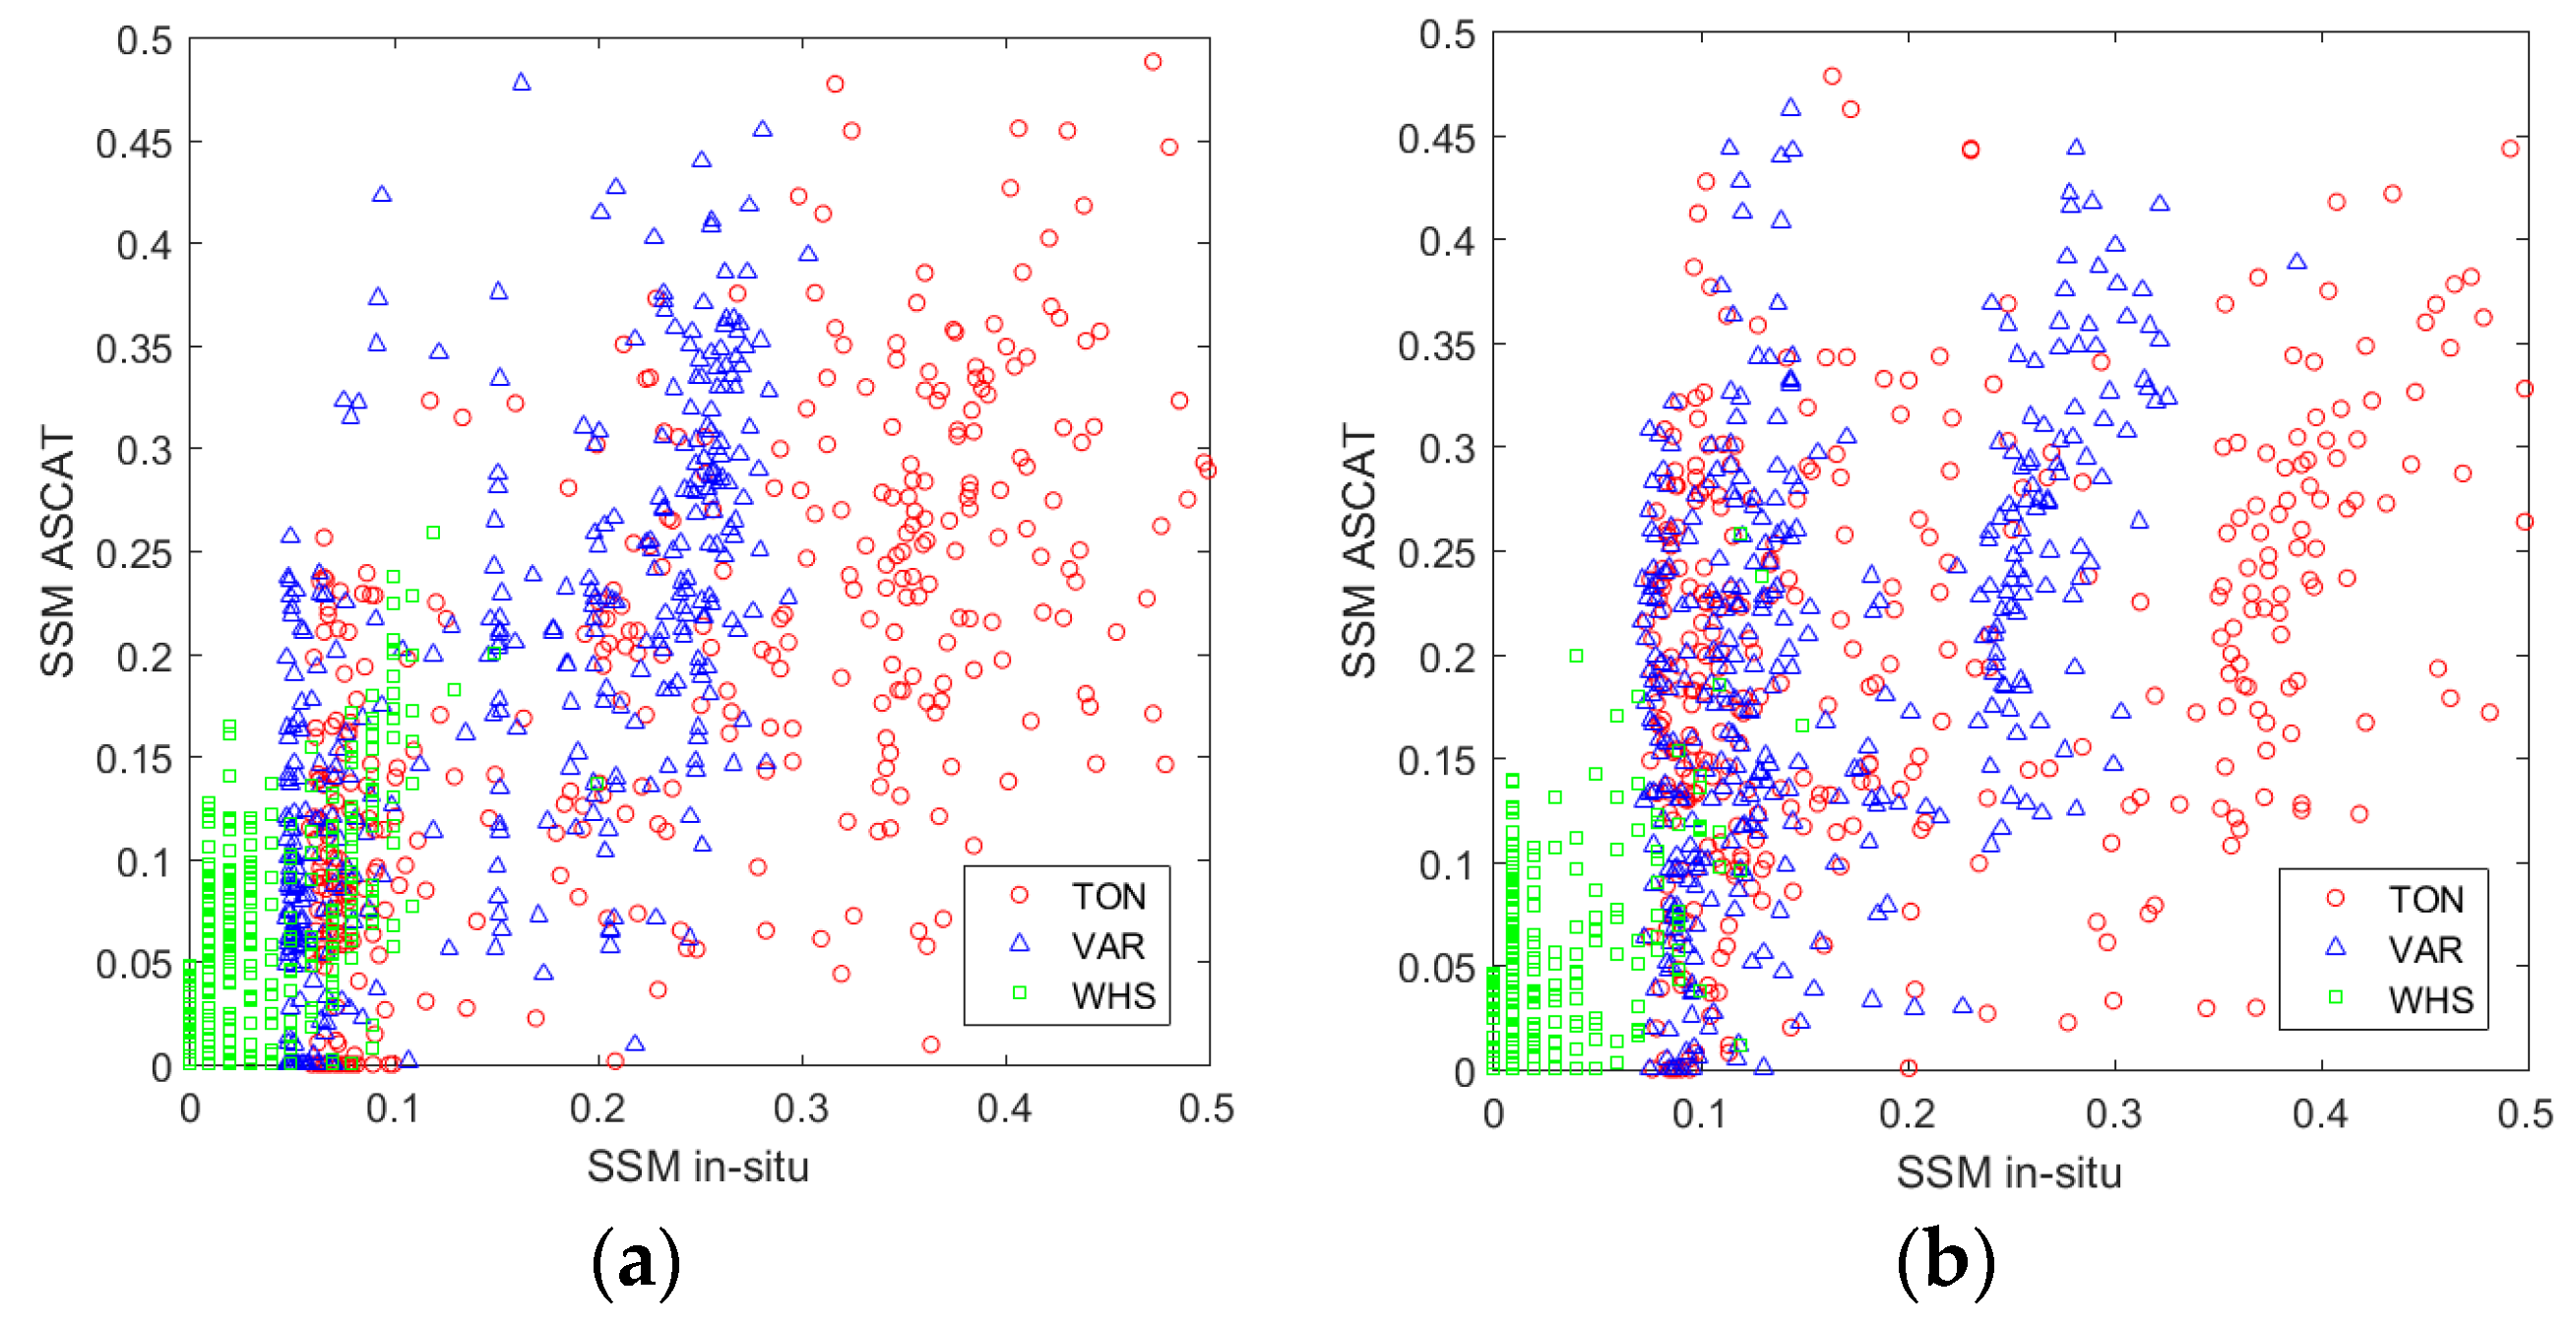
Table 4 and
Figure 5 and
Figure 6 present the agreement between satellite−derived and in situ SSM for the different land cover types for the three USA sites. The product performed well in the year 2010 (R is 58%, 66% and 68%) on open shrubland, woody savanna, and grassland, respectively. It displayed minimum correlation in 2011 (R is 39%, 46% and 50%) on woody savanna, grassland, and open shrubland, respectively. Similarly to other continents, the correlation decreases in all sites in 2011. The RMSE for the woody savanna is consistently higher than other sites and it is the lowest for shrublands. The bias in the grasslands and the open shrubland was in all cases between 0.018 to 0.040 m
3 m
−3; however for the woody savanna the bias showed an underestimation with dry bias of (−0.048, −0.011 m
3 m
−3) in 2010 and 2011, respectively.
4.2.2. Seasonality
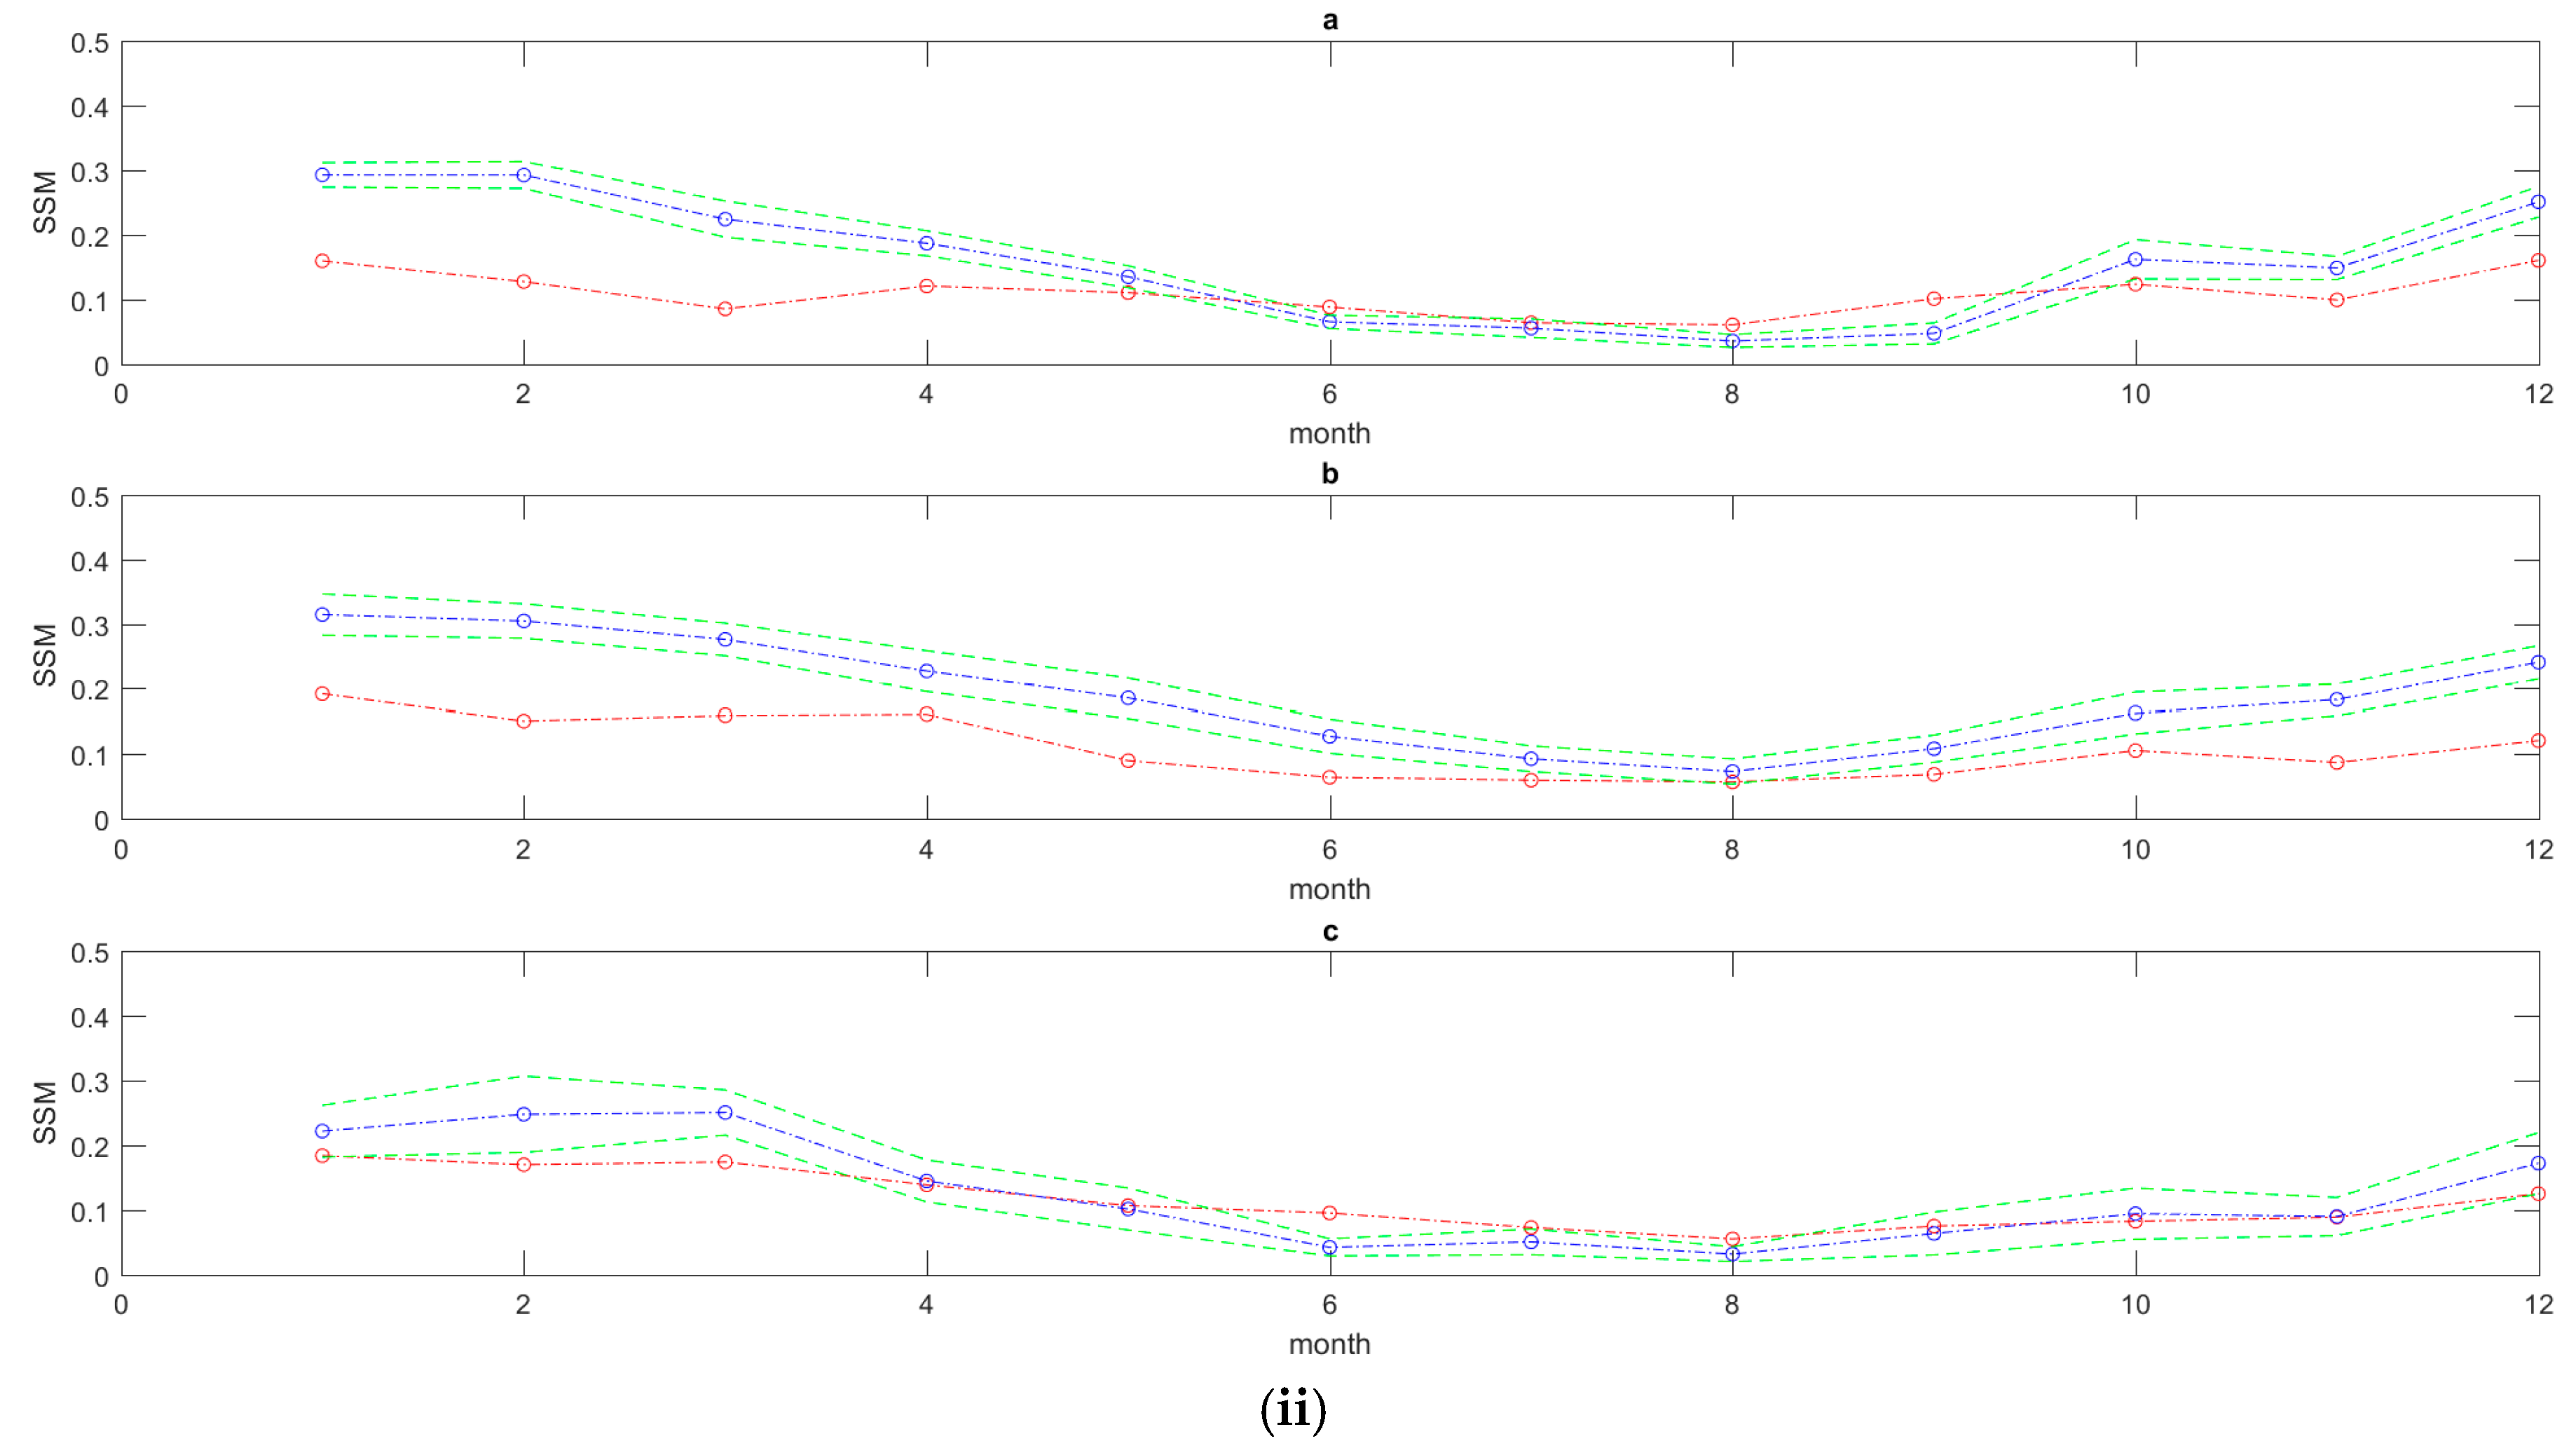
A further analysis was conducted while examining the agreement between the compared data set by seasons during 2010 and 2011 are shown in time series on
Figure 7 for all three sites. In general, comparisons between the in situ and ASCAT products time series exhibit high temporal variability with seasons and they depict a strong seasonal cycle. In general, soil moisture values are highly responsive with the seasonality indicated by marked fluctuations over the entire period with rapid and sharp responses, even changes in weather, as shown in
Figure 7. Except for the WHS (woody savanna) from February to April, the pattern showed an overestimation to the in situ measurements during these months in both years 2010−2011.
In
Table 5 and
Figure 7, representing the seasonality of all the stations, the correlation values are high (all between 60% to 77%), except for summer the correlation is low. The ASCAT products evaluated soil moisture in short term seasonal variability better in winter and autumn than in spring and summer.
4.3. Australia
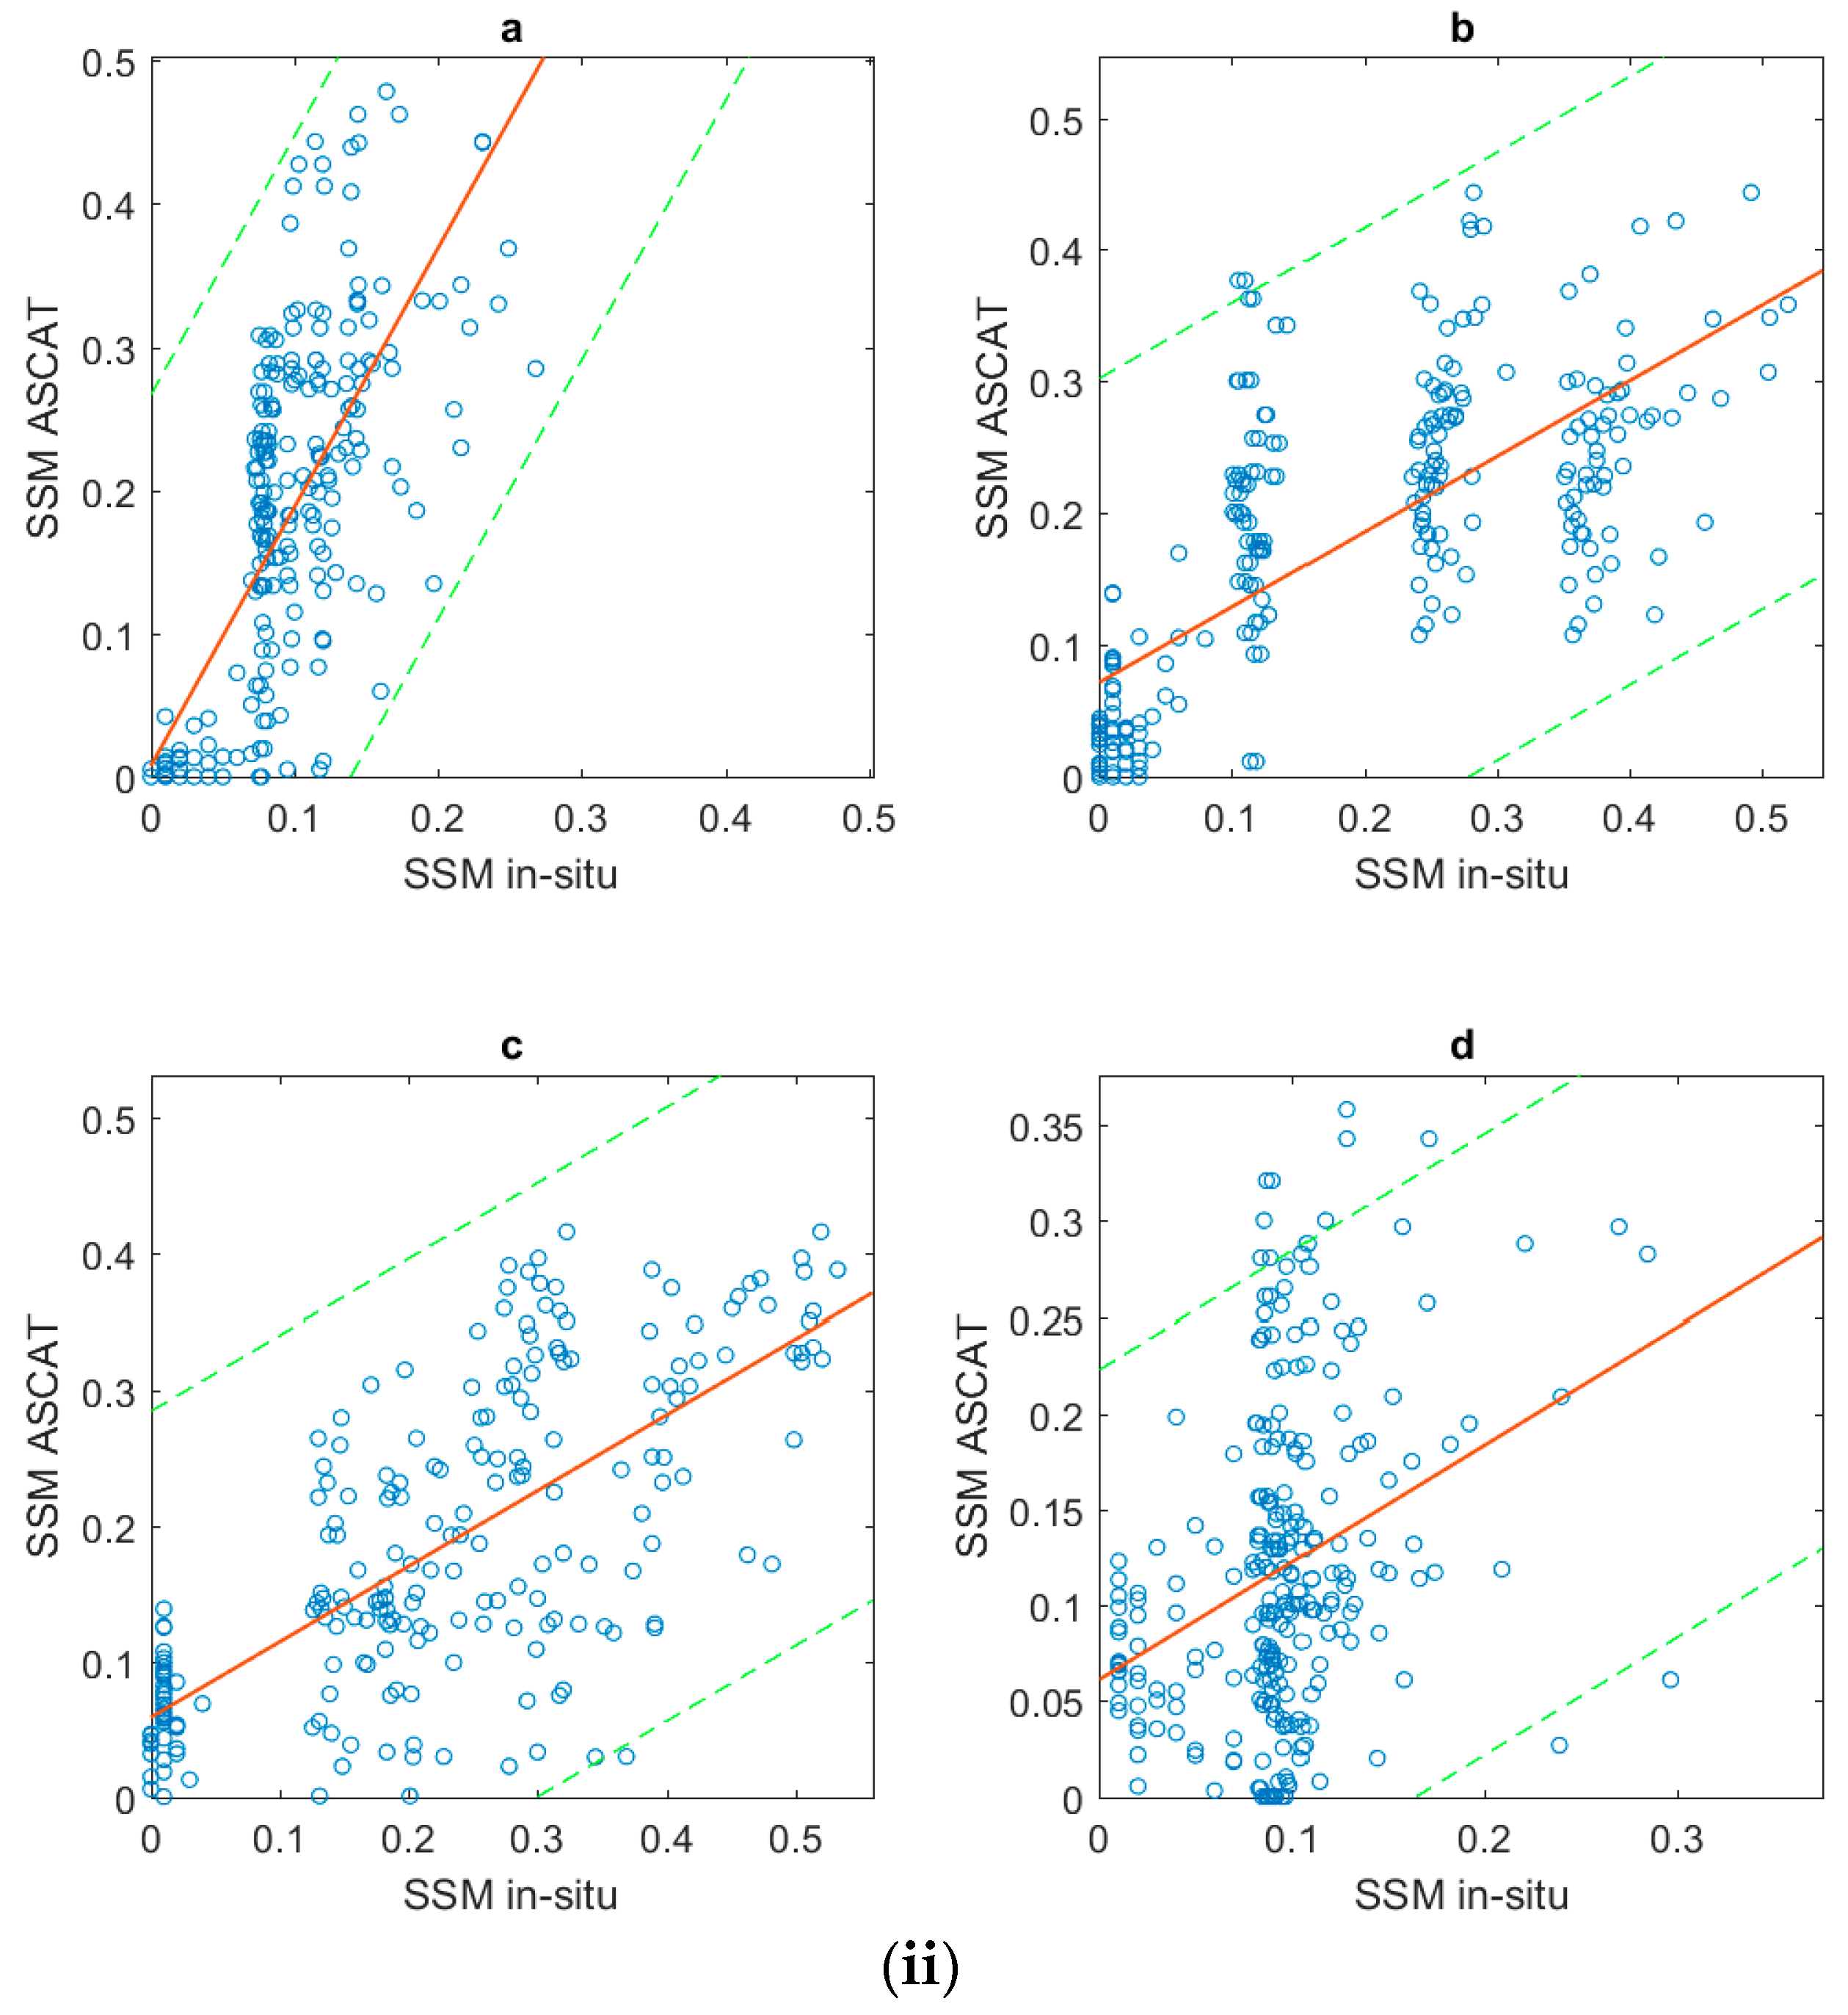
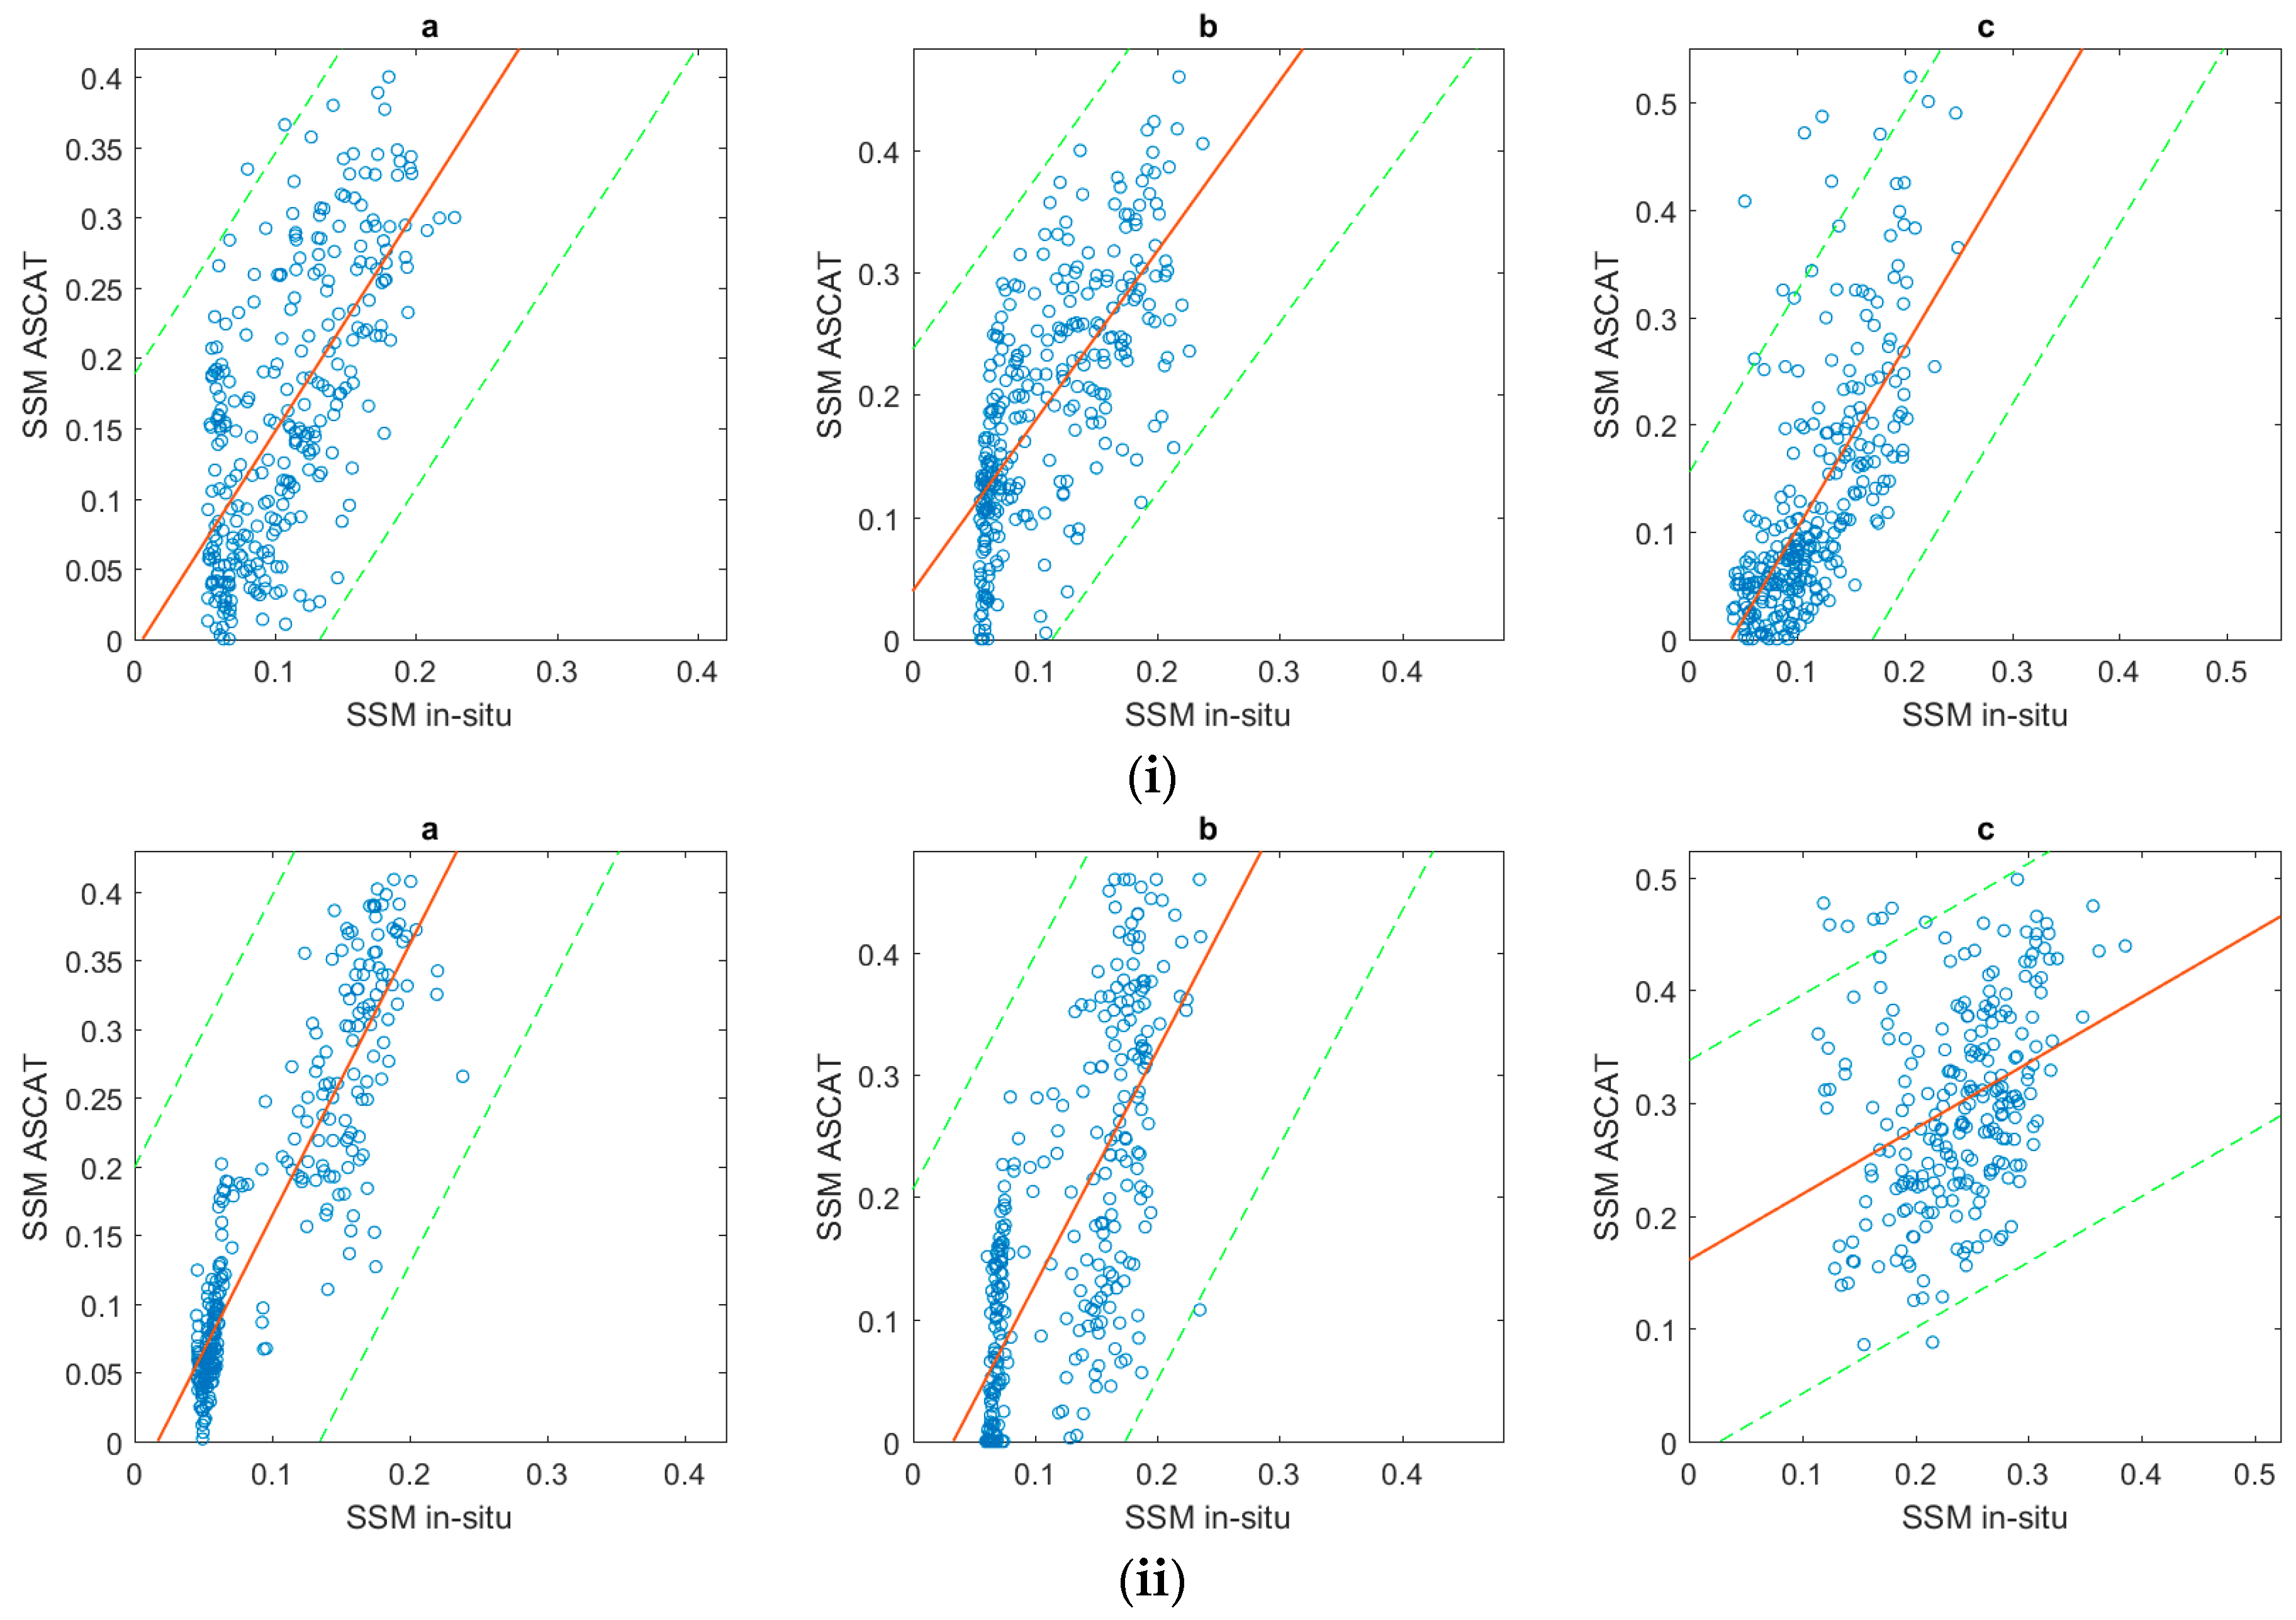
The ASCAT product performed very satisfactory in Australia with relatively higher Pearson and Spearman coefficients (see
Table 6 and
Figure 9 and
Figure 10). In general, ASCAT showed an overestimation, as shown in
Figure 11. The bias is always positive and of significant value. The bias over the different vegetation cover types, the values generally range between (0.012 to 0.66 m
3 m
−3), but the higher bias of 0.083 m
3 m
−3 was indicated over HS (woody savanna). Overall, the bias that is shown in Australia is the higher bias of the other continents. RMSE is generally between 0.088 to 0.12 m
3 m
−3 in Australia.
4.3.1. Land Use and Land Cover Comparisons
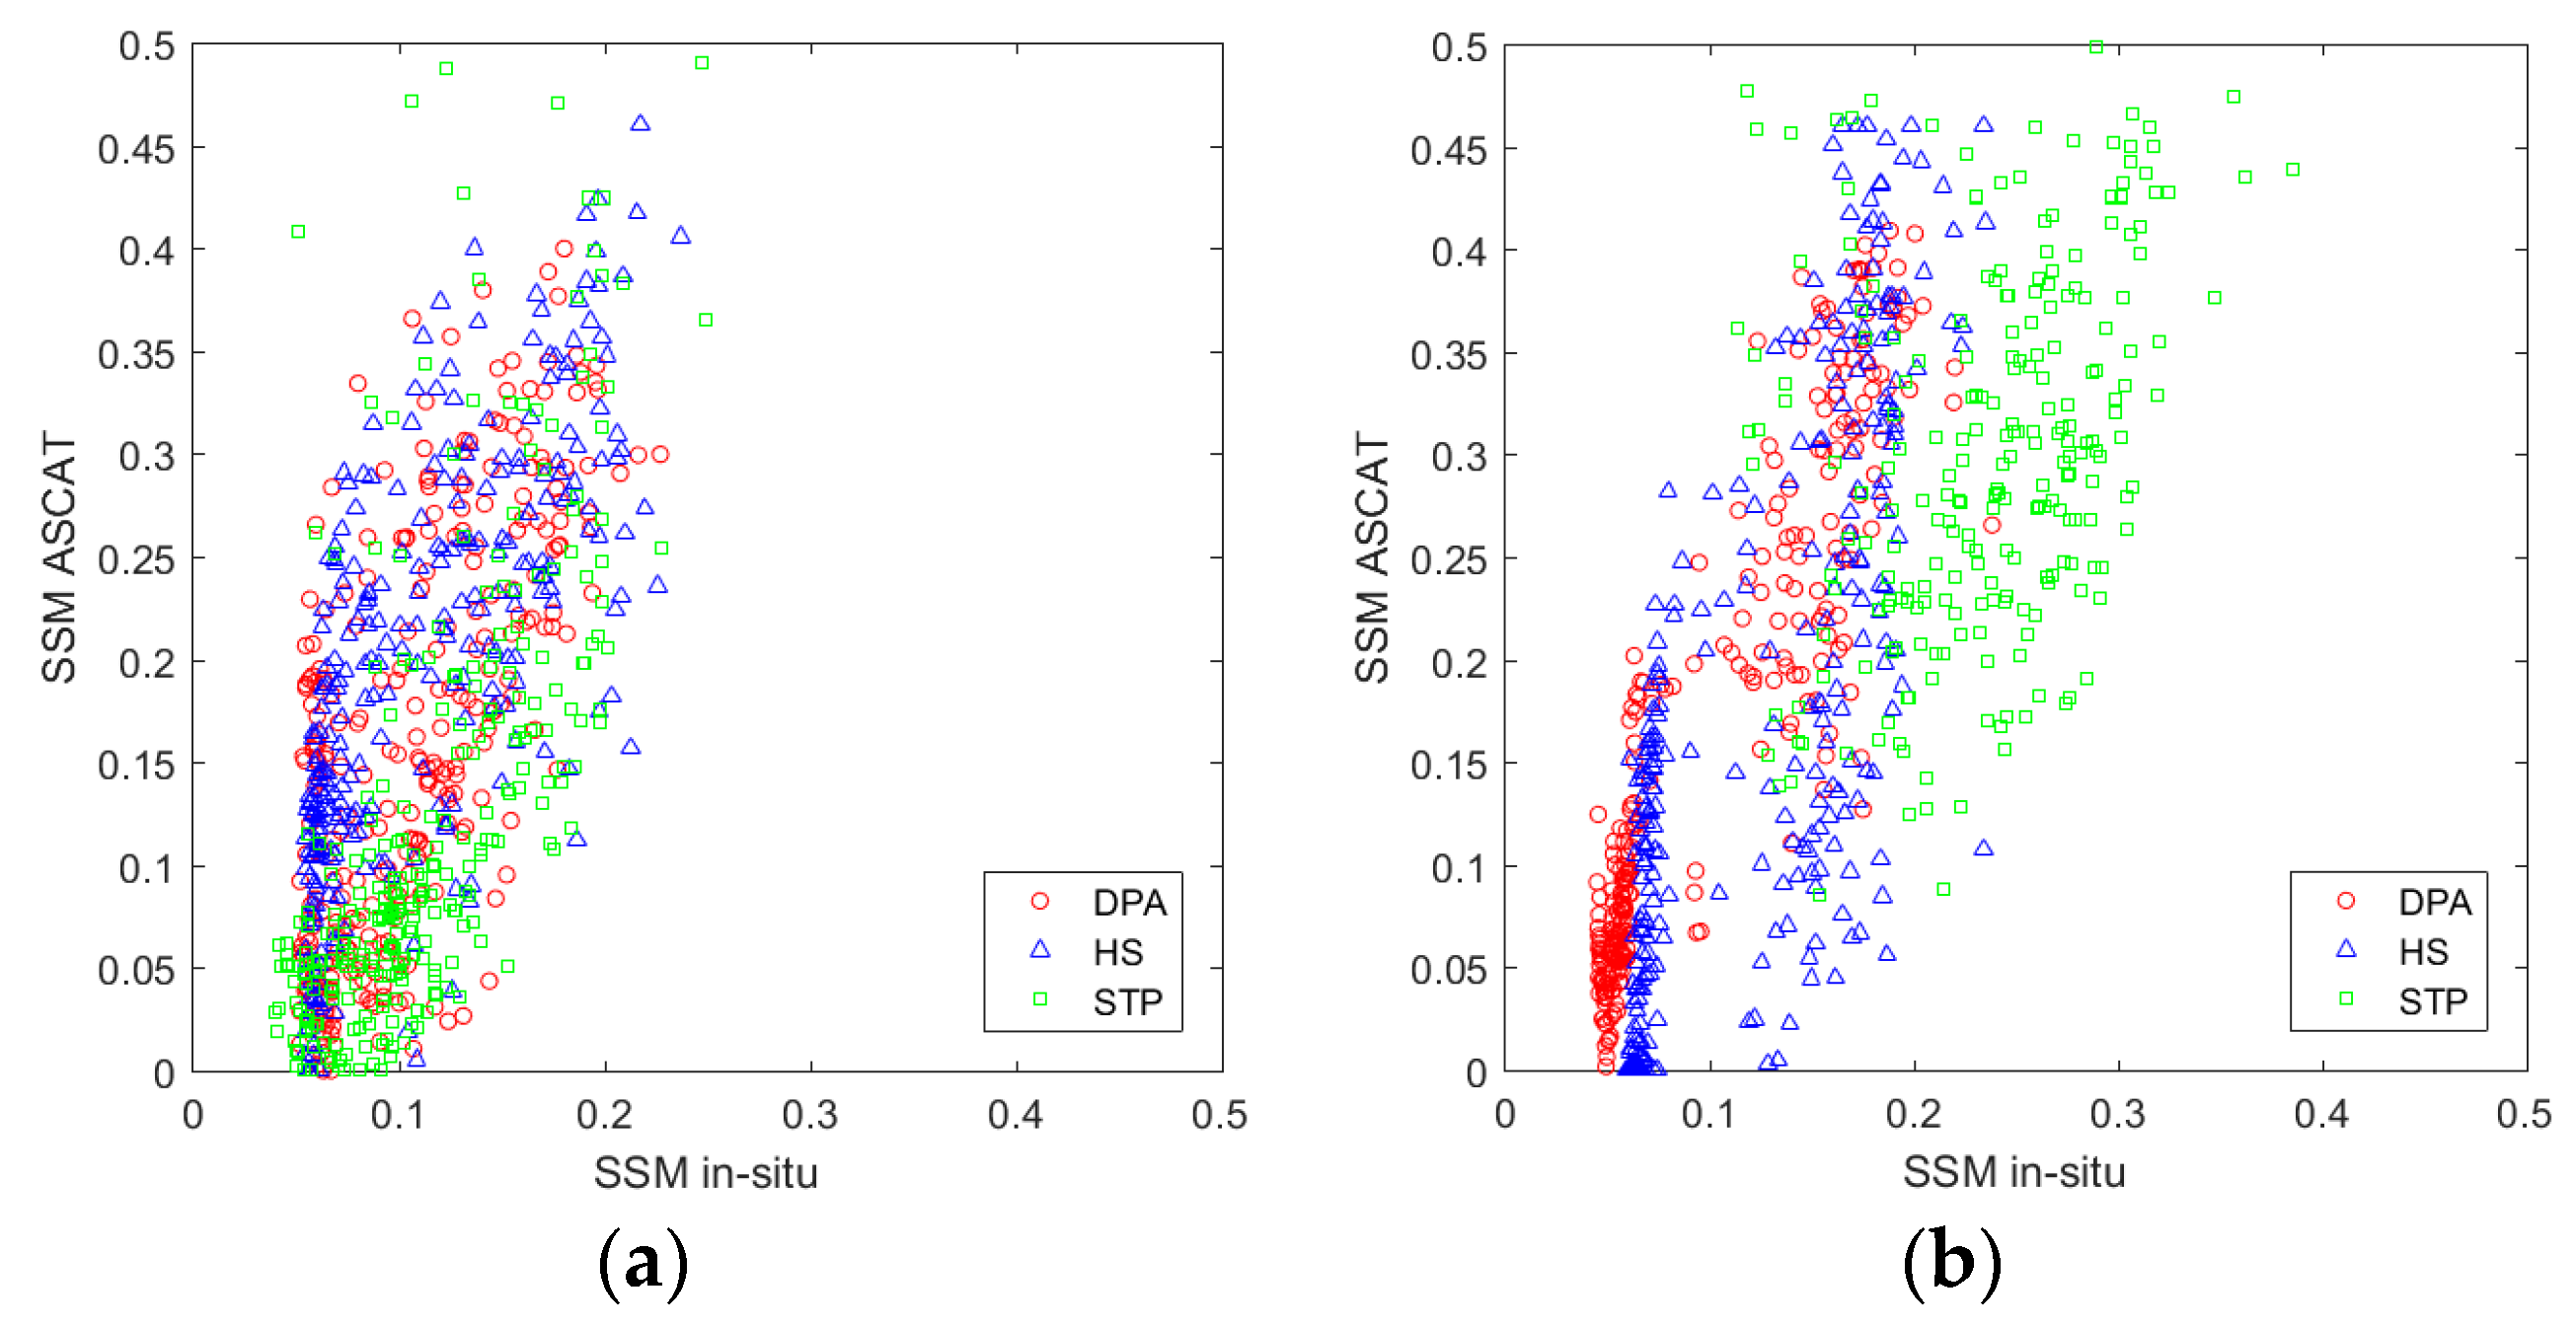
Table 6 summarizes the comparison of the predicted ASCAT product and the observed soil moisture at the three experimental sites of varying land use and land cover in 2010 and 2011. The grassland (DPA) and woody savanna (HS) exhibited the closer agreement than STP (also grasslands). Strong bias and slope is displayed in all sites.
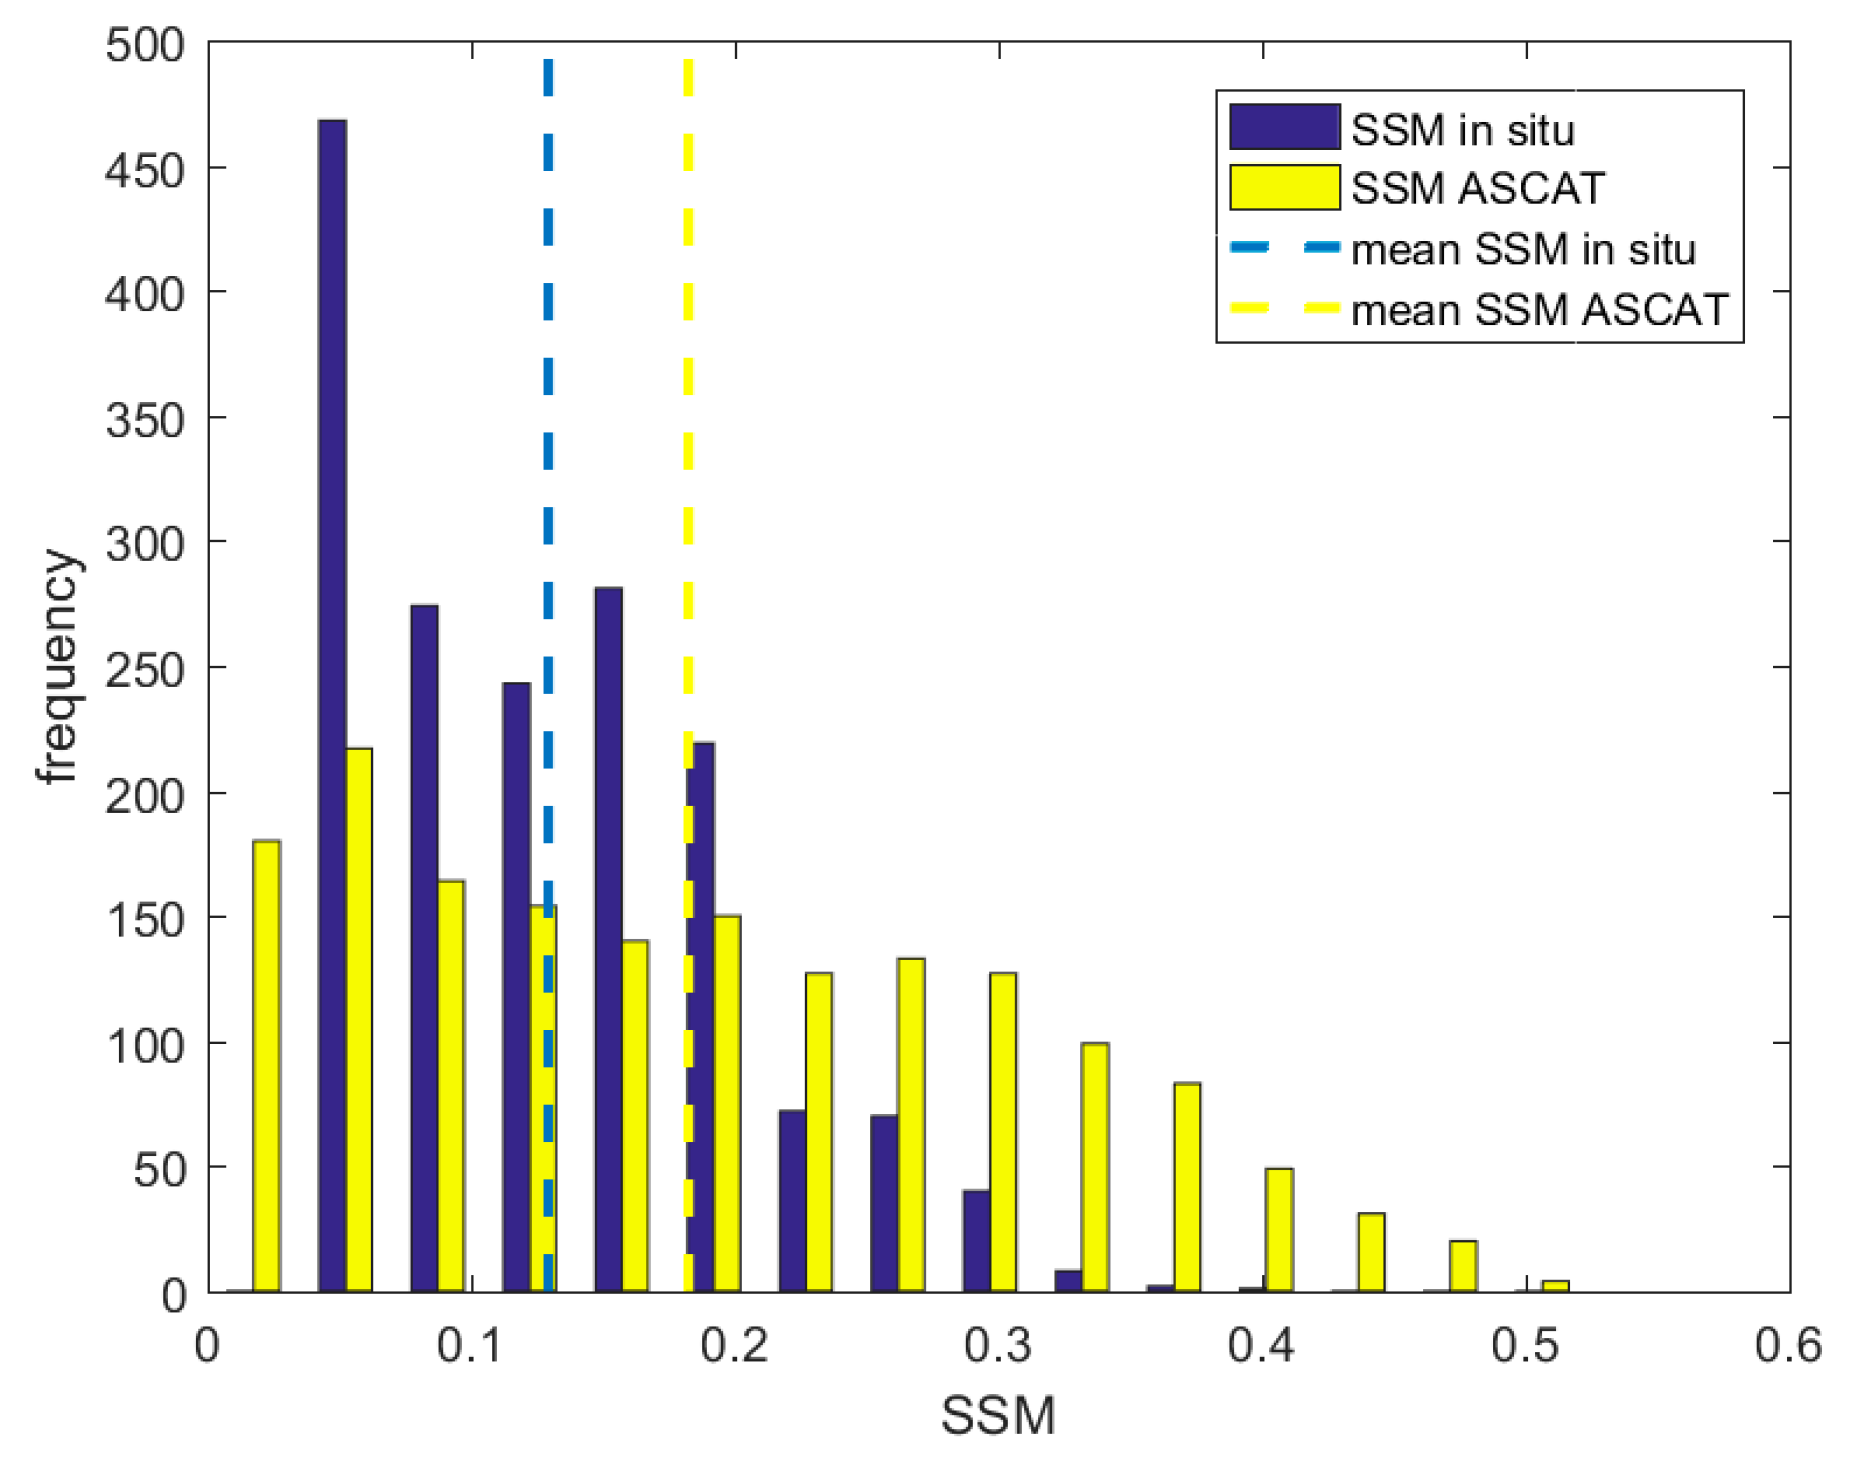
Figure 11 presents the histogram of SSM in situ and ASCAT for all sites and the mean SSM (in situ and ASCAT).
Figure 11, in combination with
Figure 9, make evident that ASCAT measurements generally overestimate the soil moisture. Conclusions that are based on land type cannot be drawn without further investigation, except to note that RMSE for woody savannas seems to be slightly higher than for grasslands.
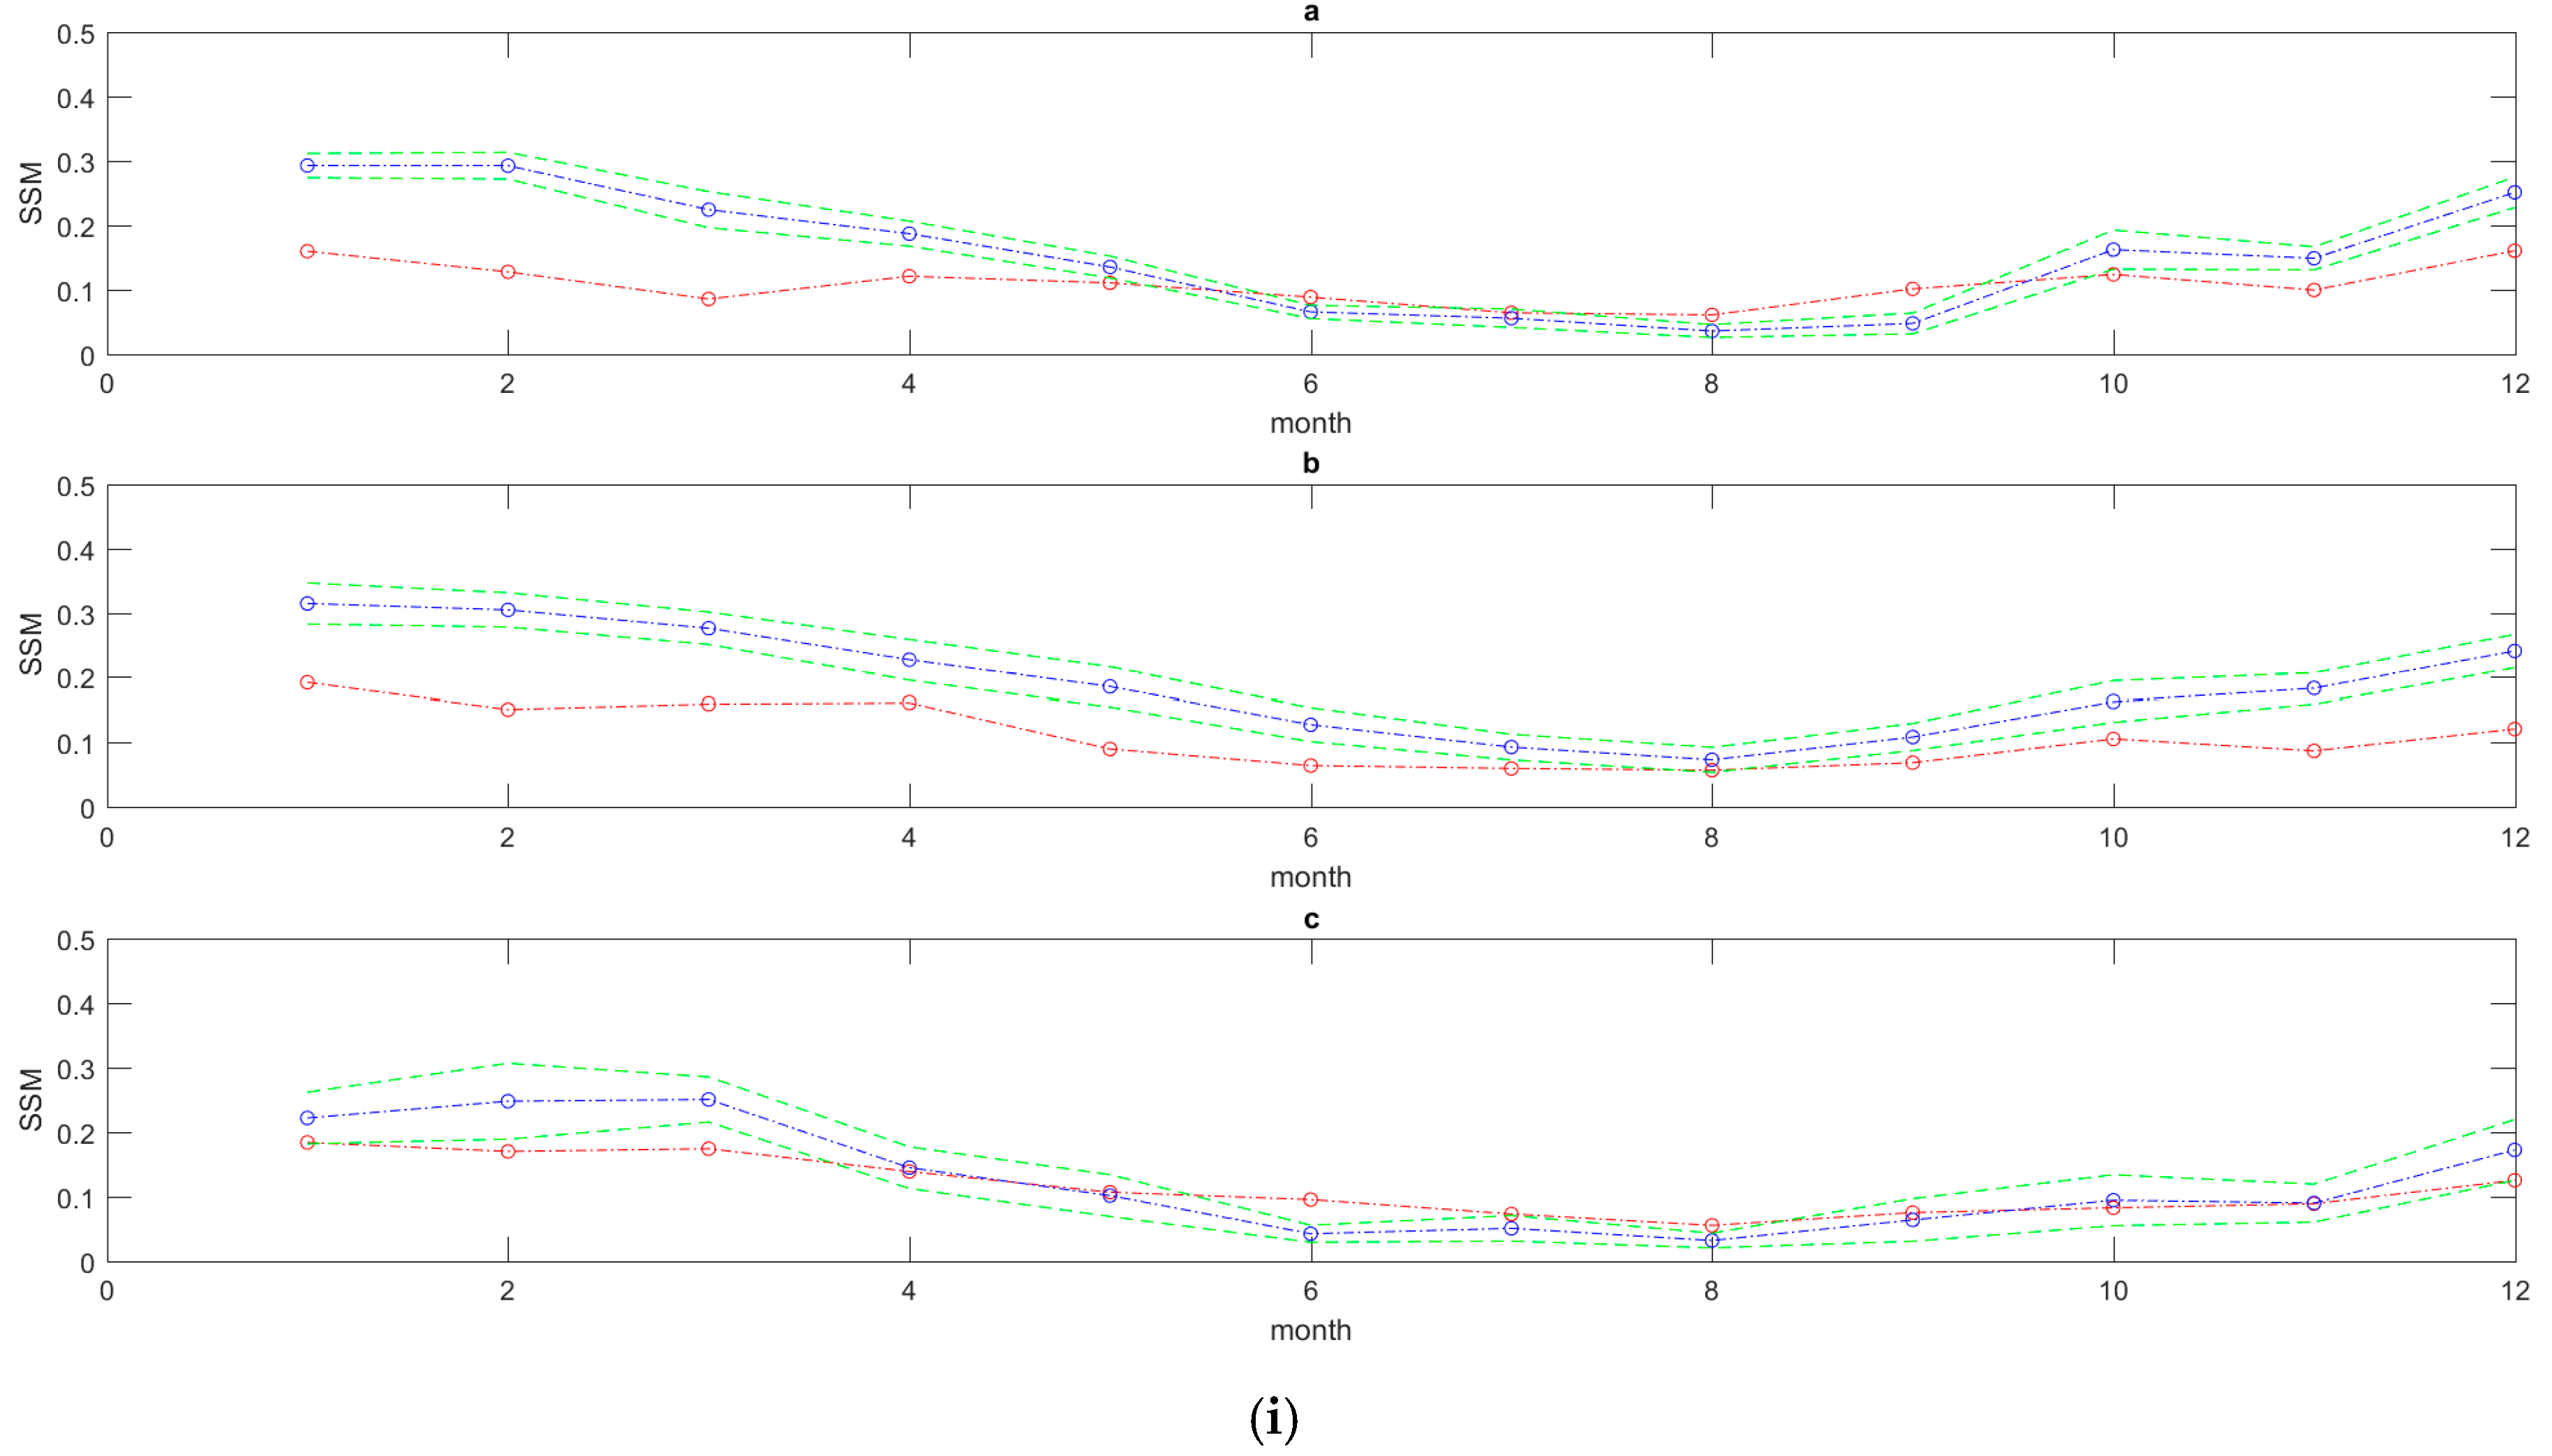
4.3.2. Seasonality
Figure 12 shows the temporal trends between in situ and predicted ASCAT predicted soil moisture for different seasons during 2010 and 2011 for the selected sites. Overall, the predicted SSM for ASCAT product well reflects the actual soil moisture from May to October and satisfactorily captures the trend of the changes in SSM, even though they provide overestimations from December to March. In addition, soil moisture values fluctuations of soil moisture over the entire period are marked with rapid and sharp responses over the AU_STP, which can be seen in
Figure 12.
Table 7 summarizes the comparisons between the seasons and
Figure 13 shows the agreement between the predicted and observed soil moisture for the different seasons separately for 2010 and 2011. In general, the data display the highest bias during summer and autumn, especially in 2011. RMSE has high values in autumn and summer (between 0.1 to 0.16 m
3 m
−3). However, winter and spring showed the highest Pearson’s coefficient in both years, respectively. Spearman’s rank correlation coefficient, which investigates the correlation between the ranks of each value, shows high divergence from the Pearson’s coefficient for winter 2010. The latter suggests that the two variables (ASCAT SSM and in situ SSM) can be considered to have only a moderately satisfactory monotonic relation.
5. Discussion
This study provided the results of a systematic and robust evaluation of the ASCAT soil moisture operational product at a range of selected ecosystems in Europe, USA, and Australia for 2010 and 2011. The accuracy of the ASCAT soil moisture product was analyzed to evaluate the effect of varying land use land cover and seasonality. Overall, ASCAT was able to adequately reflect the trends, seasonal variation of ground soil moisture recorded, with high R and relatively low bias and good RMSE generally. Additionally, the Spearman’s rank correlation coefficient, which investigates the correlation between the ranks of each value, generally showed suitable divergence from the Pearson’s coefficient, meaning that the two variables (ASCAT and in situ SSM) can be considered to have only a satisfactory monotonic relation. This result is coincident with previous studies that compared the performance of ASCAT SSM product based on observation networks in Europe [
45,
46,
47]. As shown in
Table 1,
Table 2,
Table 3,
Table 4,
Table 5,
Table 6 and
Table 7, the metrics generally showed very good accuracies over all the selected sites. Based on the different land cover types, ASCAT has shown reasonable R values and low RMSE over grasslands and shrublands for both years. The product performed moderately on the woody savannas and poorly on needleleaf forest where the RMSE was relatively very high.
Overall, possible explanations for the errors can be as follows: (1) Topographic complexity, high vegetation density (e.g., taller and/or denser), frozen soils, snow cover, and volume scattering in dry soils are very critical for soil moisture operational products retrieval accuracy [
48]. With regards to vegetation, vegetation structure and water content, if not accounted for properly, could strongly affect the quality of soil moisture retrievals. Recent studies suggested that the vegetation water content variation during daytime may have a stronger impact on backscatter than previously thought [
49,
50]. Previous works (e.g., [
51,
52]) have stated that the vegetation is more transparent during the daytime when the temperature is high. The latter is resulting in less effect of vegetation on emission attenuation from soil given the fact that the TU Wien soil moisture retrieval model currently does not account for the diurnal vegetation effects. Therefore, research is needed to quantify these effects and to correct them as far as possible [
48,
53]. Further research also needs to be focused on impact of growing and non−growing season impact on soil moisture assessment and accuracy. Other researchers indicated that, because of crops in the growing season, high attenuation takes place, which impacts soil moisture retrievals, and hence less agreement with the in situ measurements is displayed [
54]. (2) The sensing depth of ASCAT is very shallow. In our study, the surface ground measurements used for the evaluation are at 5 cm. The sampling depth of the effective soil moisture at C-band is 0−3 cm [
35]. This could also be achieved when the TU Wien soil moisture retrieval model account for the nighttime since near−surface soil moisture profile could be more uniform and it could be captured at the (~0.5−2) layer sampled by ASCAT. (3) Different spatial observation scale. The differences in spatial resolution can introduce some deviation. Since the exact scale of the satellite observation could not be represented by ground observation, the average point−based measurement is used as a “reference”. However, it is also argued in many studies that it is difficult to characterize the spatial soil moisture patterns by using in situ measurement. It can be only reproduce the temporal dynamic of soil moisture but not the absolute value [
24,
31]. This can be achieved by upscaling the coarse scale of the point soil moisture measurement using recently proposed methods for this purpose (e.g., [
55,
56]). Sometimes, if the in situ sensors are not dense enough, it causes mismatch in scales and hence poor accuracy in comparison. The solution to this is to use downscaled or spatially disaggregated data for a better comparison with the in situ datasets [
57]. (4) Errors that are caused by measurements accuracy of the sensors. It has been found that the land surface factors, such as topography, season, and land cover types (particularly at the presence of forests) have been pointed out as elements that affect the product accuracy and consistency, in addition to that they affect the quality of the product that can be expected by the final user [
44,
46,
58].
The topographic complexity is highlighted as the main reason that leads to different performance of ASCAT products over the different land use land cover regions. When the results are stratified by land cover type, clear inter−site variability in retrieval accuracy becomes evident. As shown in
Table 1,
Table 2,
Table 3,
Table 4,
Table 5,
Table 6 and
Table 7, the open shrubland sites and the grassland exhibit very low RMSE and perform very well in term of the correlation coefficient. On the other hand, woody savanna and Evergreen needleleaf Forest (IT_REN) have the highest RMSE among the land cover types that are studied herein. The absence of correlation can be mainly described by the lack of spatial sampling between predicted and observed comparison [
59]. The weakest correlations are seen in spring and winter in Europe. This can be relatively attributed to the possibility of lesser fractional vegetation cover than other seasons and/or it could be associated with the smaller size than other seasons. The high RMSE can be explained, since it is well−known that over vegetated/forest areas and the presence of snow/ice, soil moisture retrievals are very problematic for the operational products retrieval accuracy. In addition, it could be due to the difference in the content of soil moisture that can be measured at the thin soil layer that was sampled by ASCAT (∼0.5–2 cm) and the amount of soil moisture in the deeper layer (5 cm) observed at the ground stations. This is in agreement with the results of Wigneron et al. [
60] & Wagner et al. [
61]. Moreover, in vegetated areas (especially forest), there is an issue with the proper roughness characterization, which influences the accuracy of satellite soil moisture retrievals [
62]. Additionally, in terms of attenuation, it is observed more in the case of forest than crop, because of large volume of scattering in the case of the former than the latter [
63]. That could be the reason for the high RMSE (ENF, WAS). Overall, trends in product accuracy that are dependent on land cover are clearly evident. Furthermore, the error for most sites is largely as a result of scatter rather than the bias.
The results from this study, although perhaps limited by the relatively small sample size, suggest that agreement of the soil moisture estimates are driven to a certain extent by the seasonal cycle. The latter can be potentially ascribed to the phenological changes of vegetation throughout the year [
64]. Changes in vegetation type or growth cause a change in vegetation canopy and hence increase the microwave attenuation, which reduce the overall accuracy in soil moisture retrieval. Theoretically, spring and summer have denser plant canopies when compared to autumn and thus higher signal attenuation hampers satellite sensing, resulting in poorer soil moisture retrieval. Furthermore, dew has a significant effect on passive microwave observations by increasing horizontal brightness, and it is most prominent during summer, spring, and autumn, respectively [
65]. On the temporal series comparisons, the ASCAT has shown the temporal characteristics of in situ measurements very well. However, the product underestimated the in situ observation during January to February and overestimates the in situ observations from May to June or August (
Figure 5 and
Figure 7). One possible cause for the high ASCAT soil moisture predictions during summertime might be that the parameterization of ASCAT retrieval is not an optimal term in the vegetation correction (the seasonal behavior of the vegetation correction term could be reasonable, but the magnitude may not be large enough) over this area [
53]. The integration of numerical weather models, meteorological variables, local hydrological models, and information on land cover could also be utilized to more accurately analyze the effect of seasonality on soil moisture estimation [
54]. Such an investigation could help in improving the soil moisture retrieval algorithms.


 ,
, 


