Aggregated Deep Local Features for Remote Sensing Image Retrieval


Abstract
:
1. Introduction
- A novel RSIR pipeline that extracts attentive, multi-scale convolutional descriptors, leading to state-of-the-art or competitive results on various RSIR datasets. These descriptors automatically capture salient, semantic features at various scales.
- We demonstrate the generalization power of our system and show how features learned for landmark retrieval can successfully be re-used for RSIR and result in competitive performance.
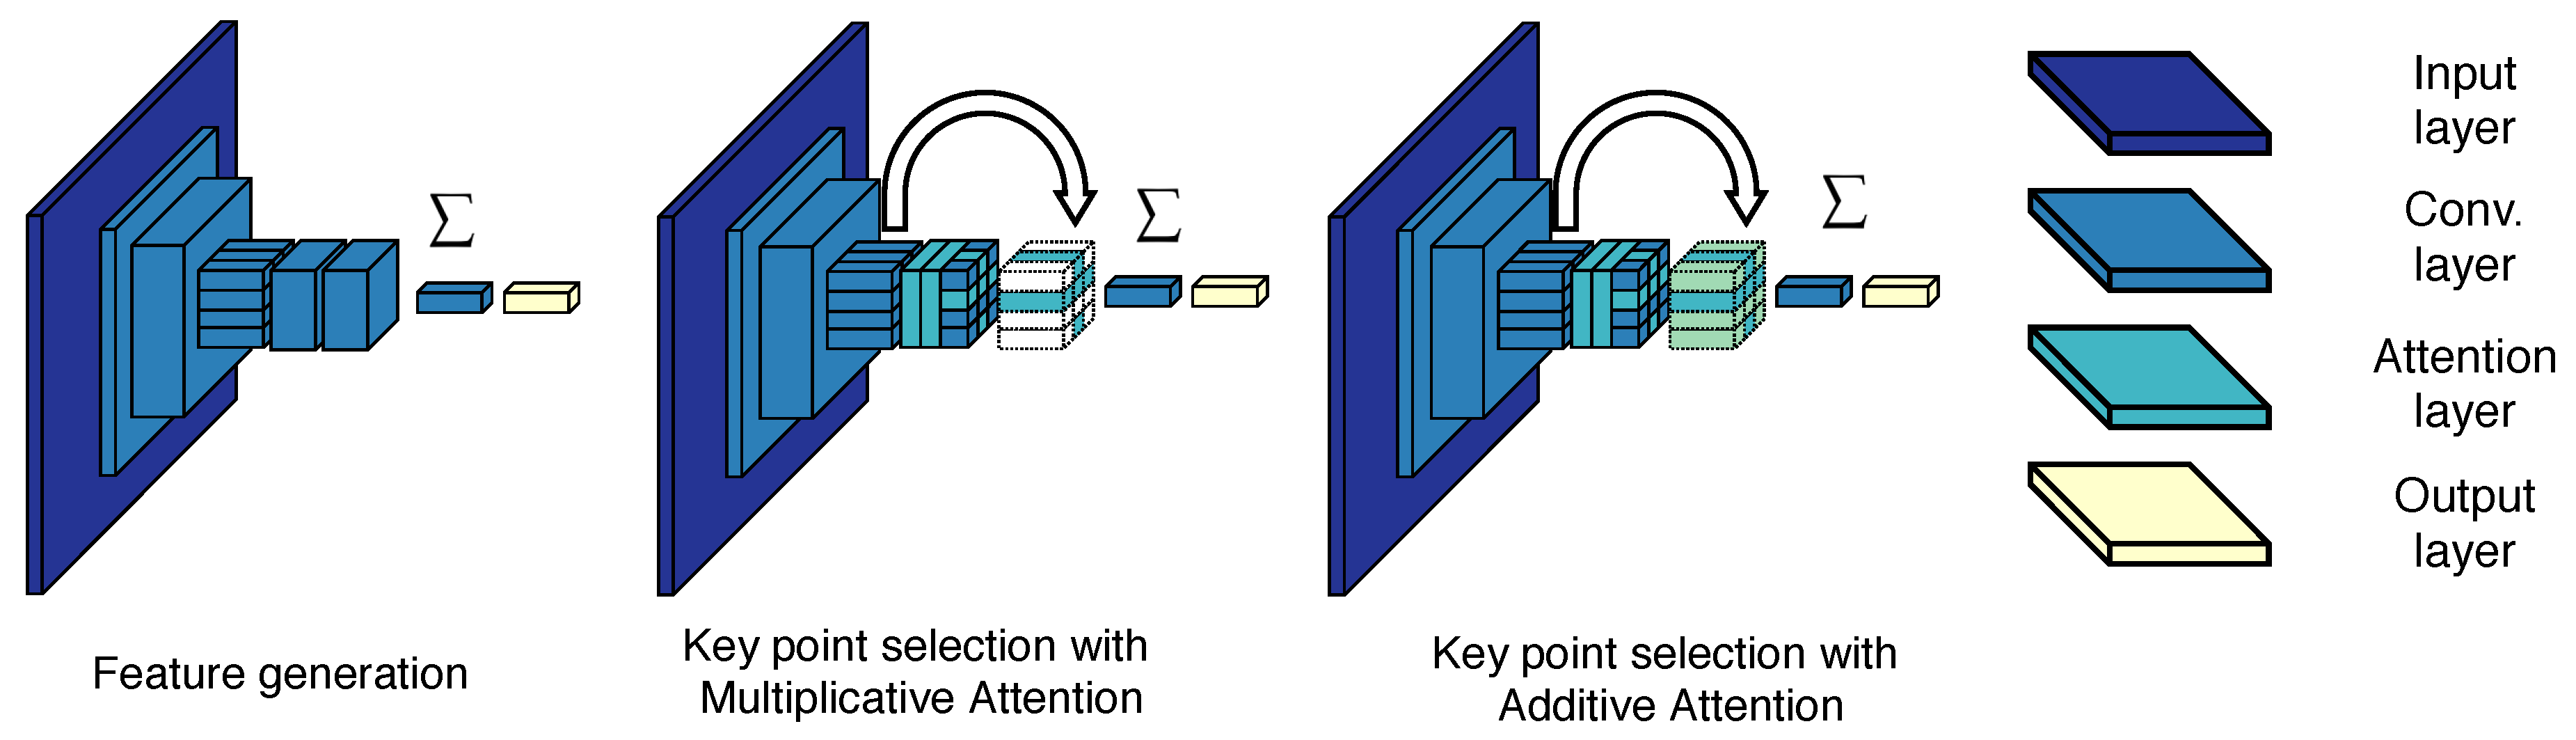
- We experiment with different attention mechanisms for feature extraction and evaluate whether context of the local convolutional features is useful for the RSIR task.
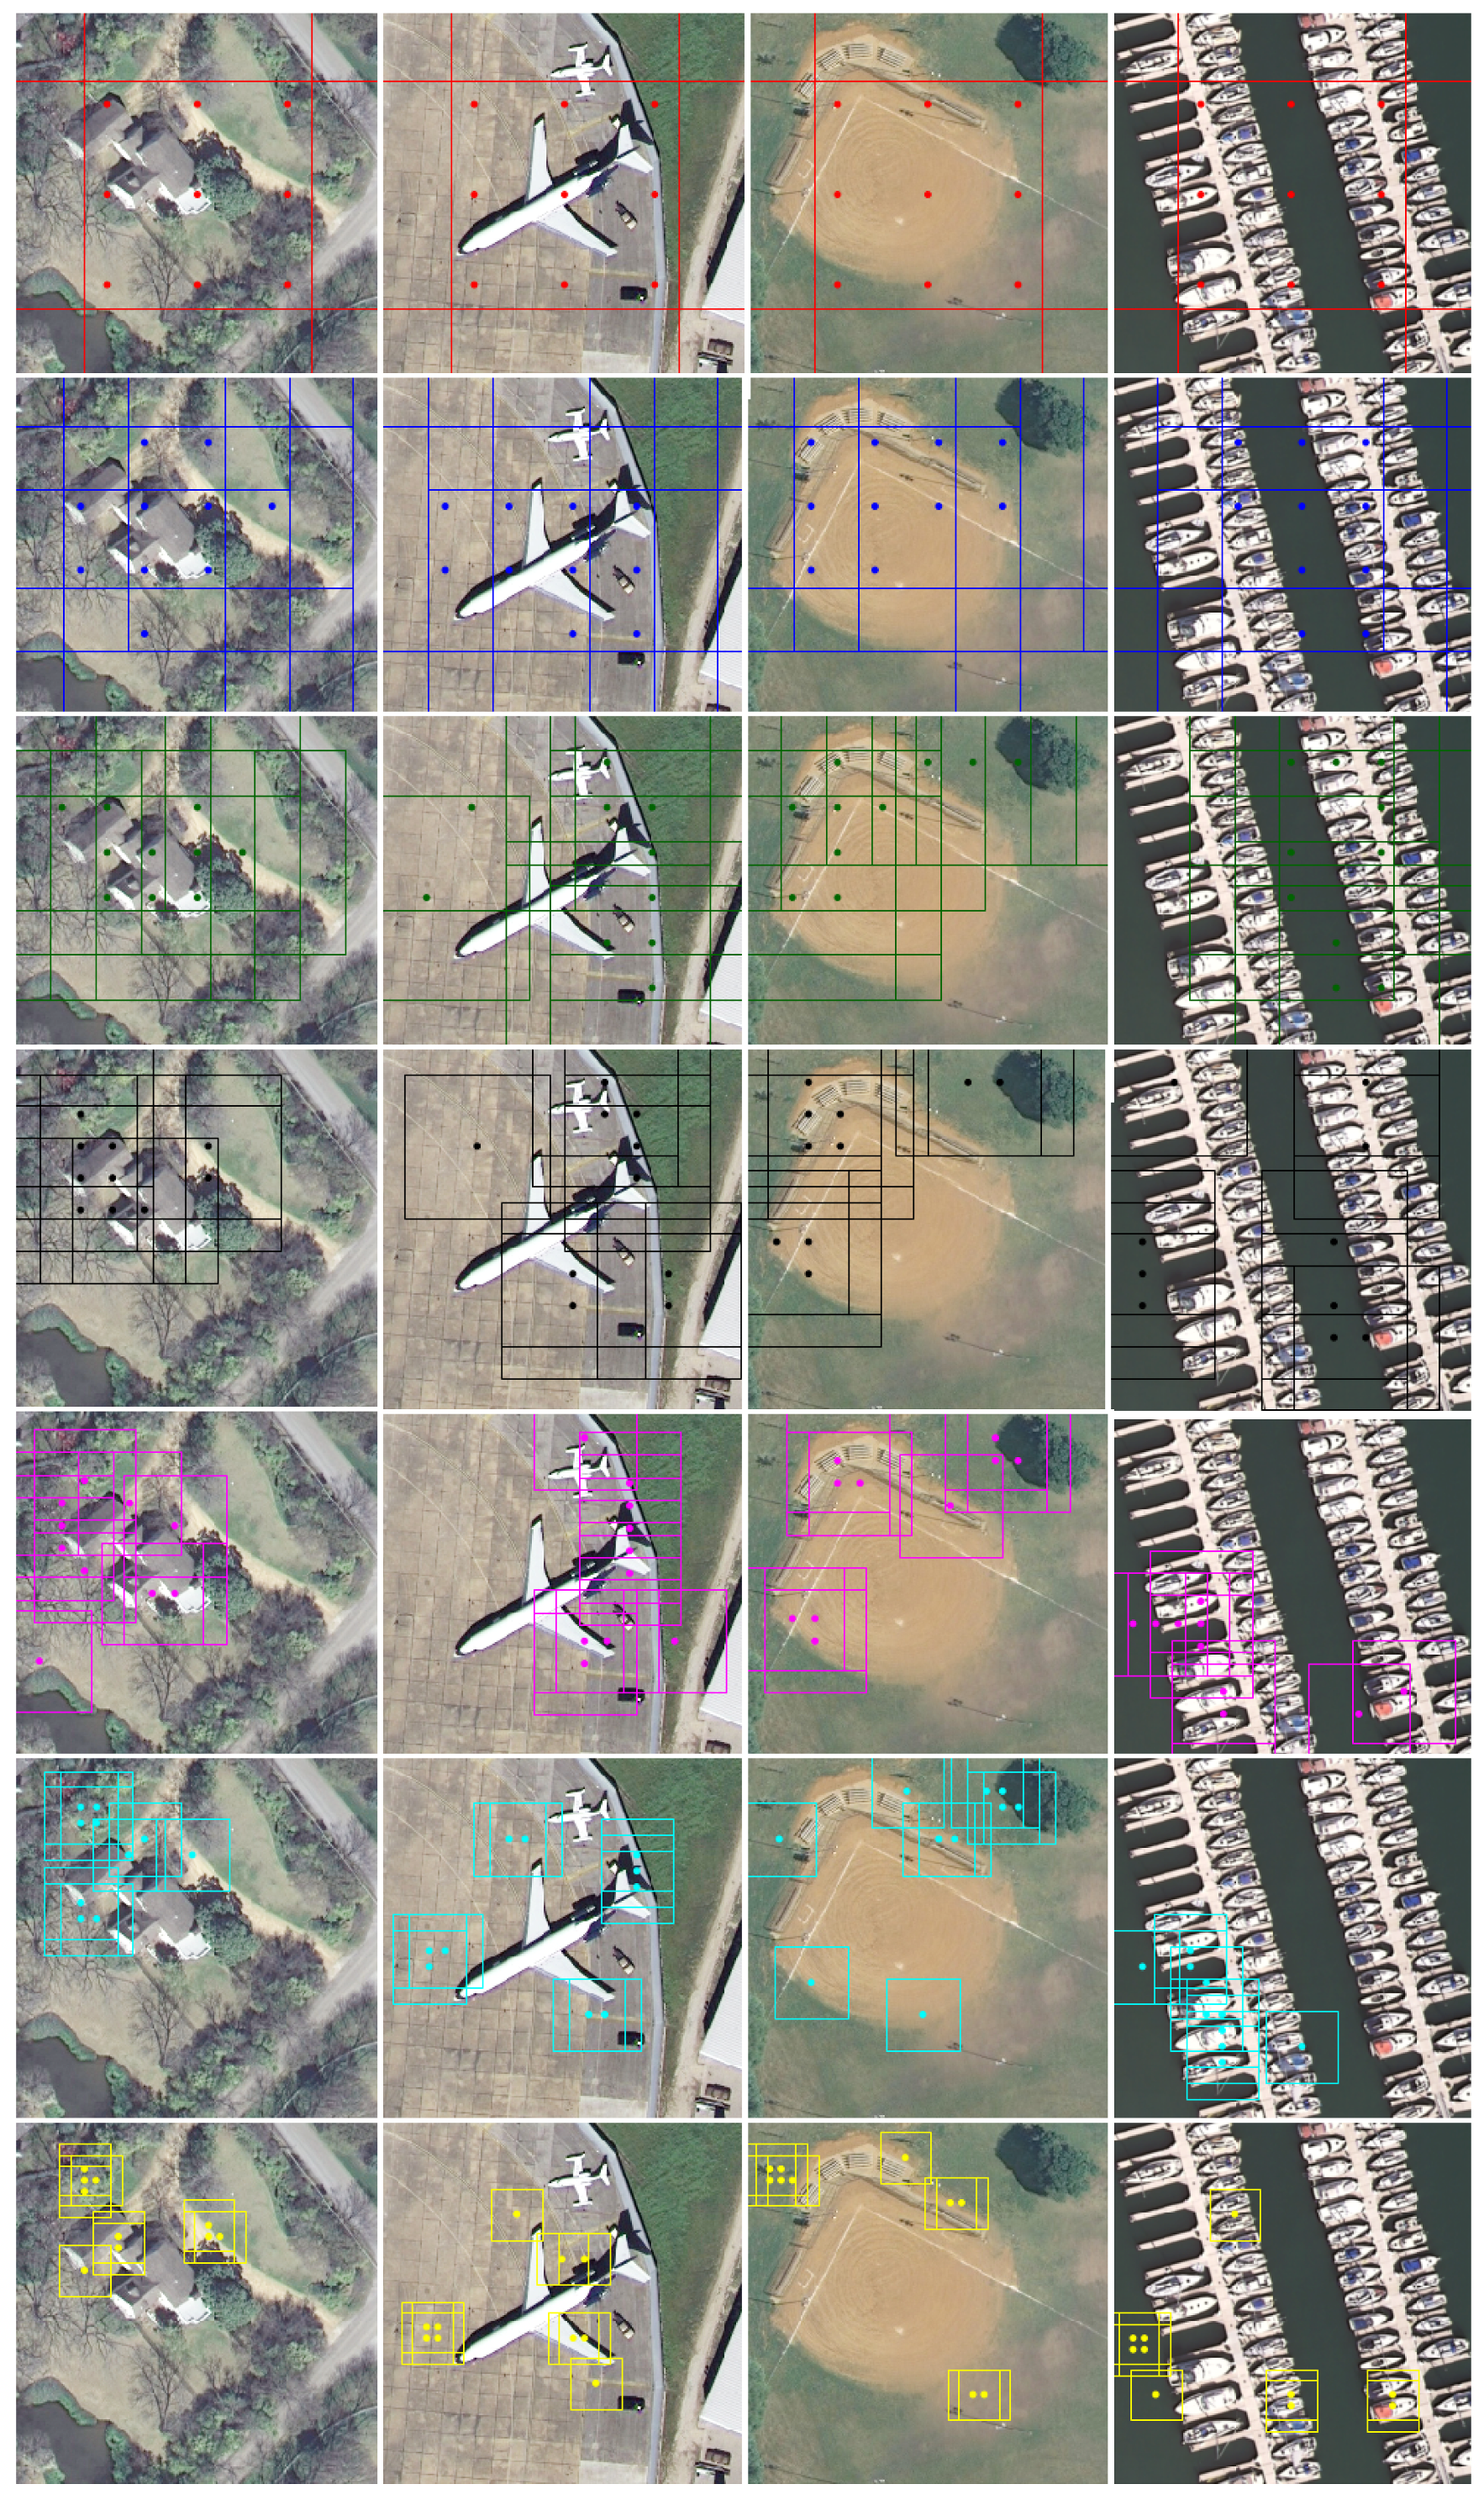
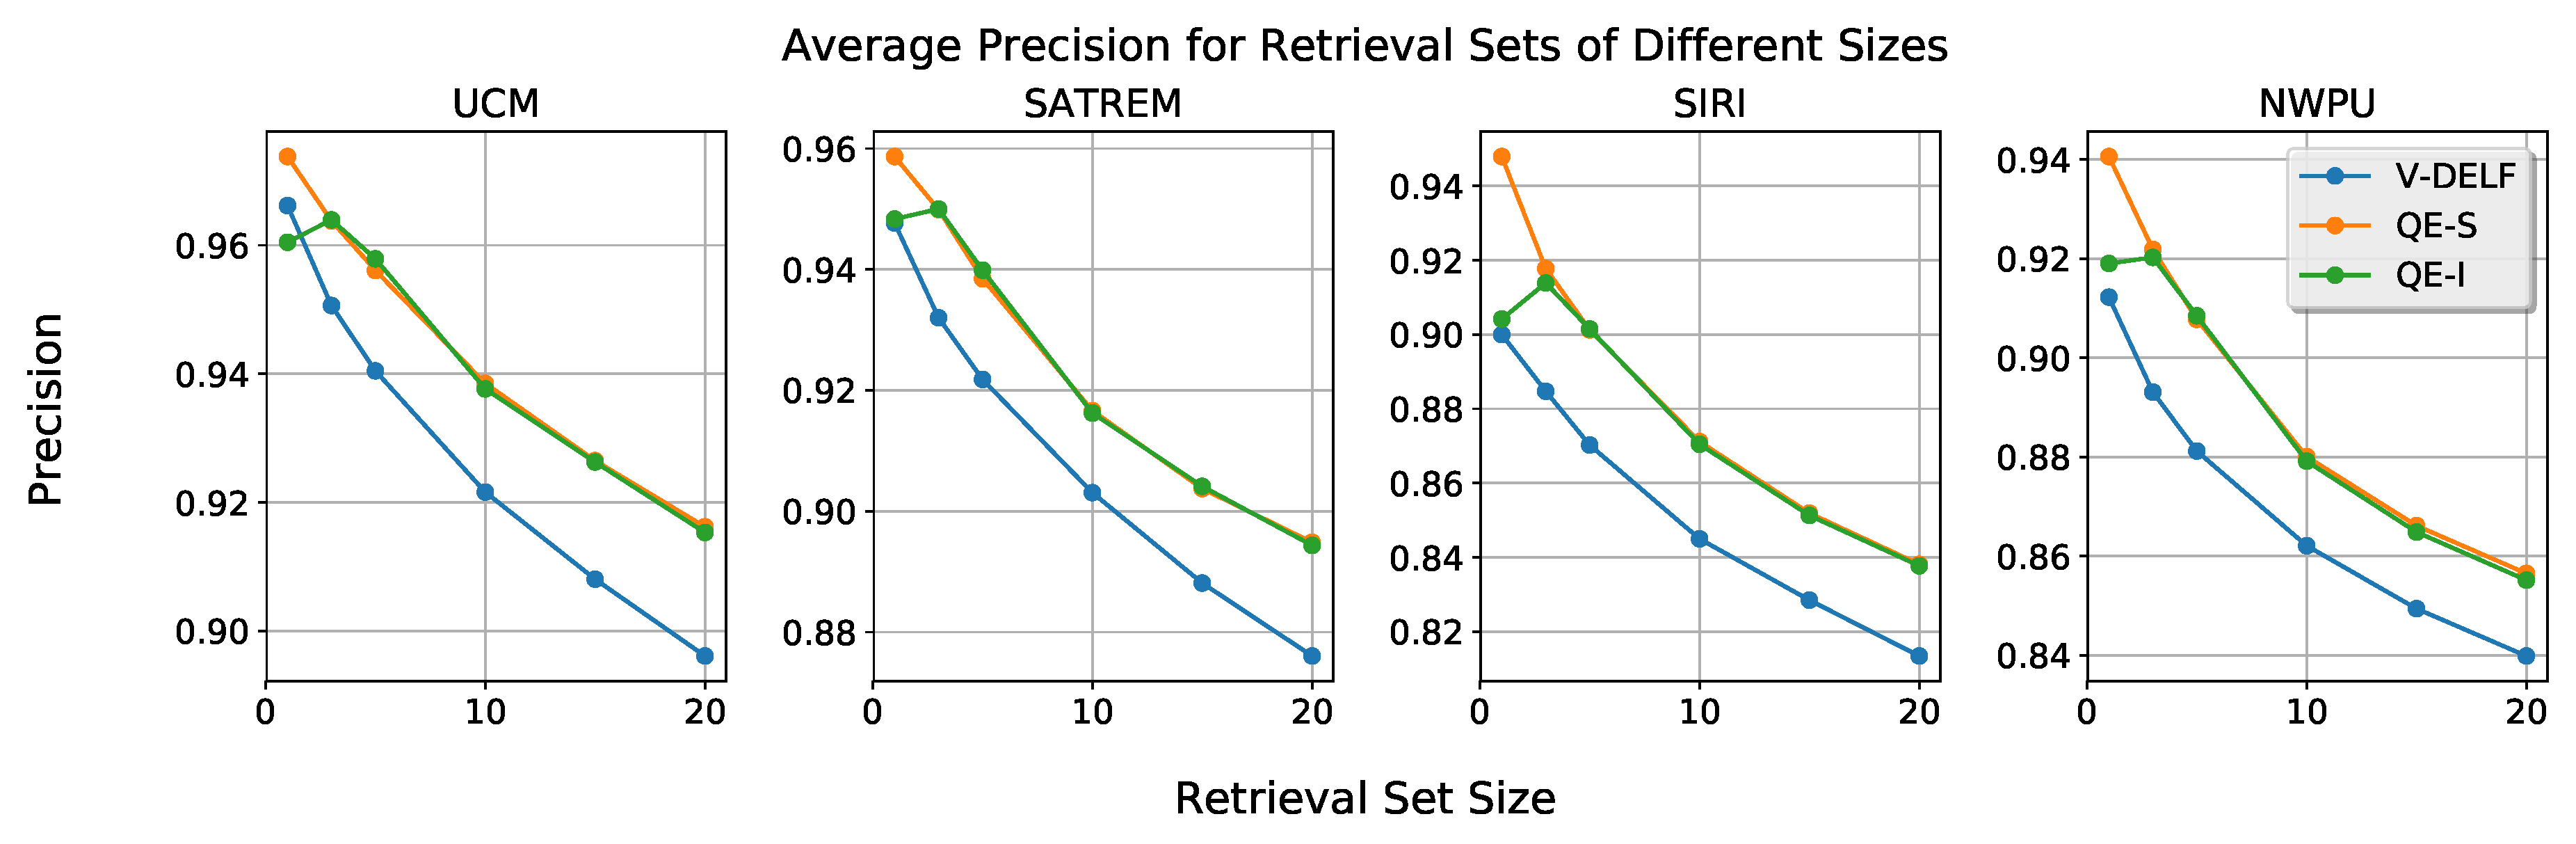
- We introduce a query expansion method that requires no user input. This method provides an average performance increase of approximately 3%, with low complexity.
- RSIR with lower dimensionality descriptors is evaluated. Reduction of the descriptor size yields better retrieval performance and results in a significant reduction of the matching time.
2. Related Work
2.1. Image Retrieval
2.1.1. Descriptor Aggregation
2.1.2. Convolutional Descriptors
2.2. Remote Sensing Image Retrieval
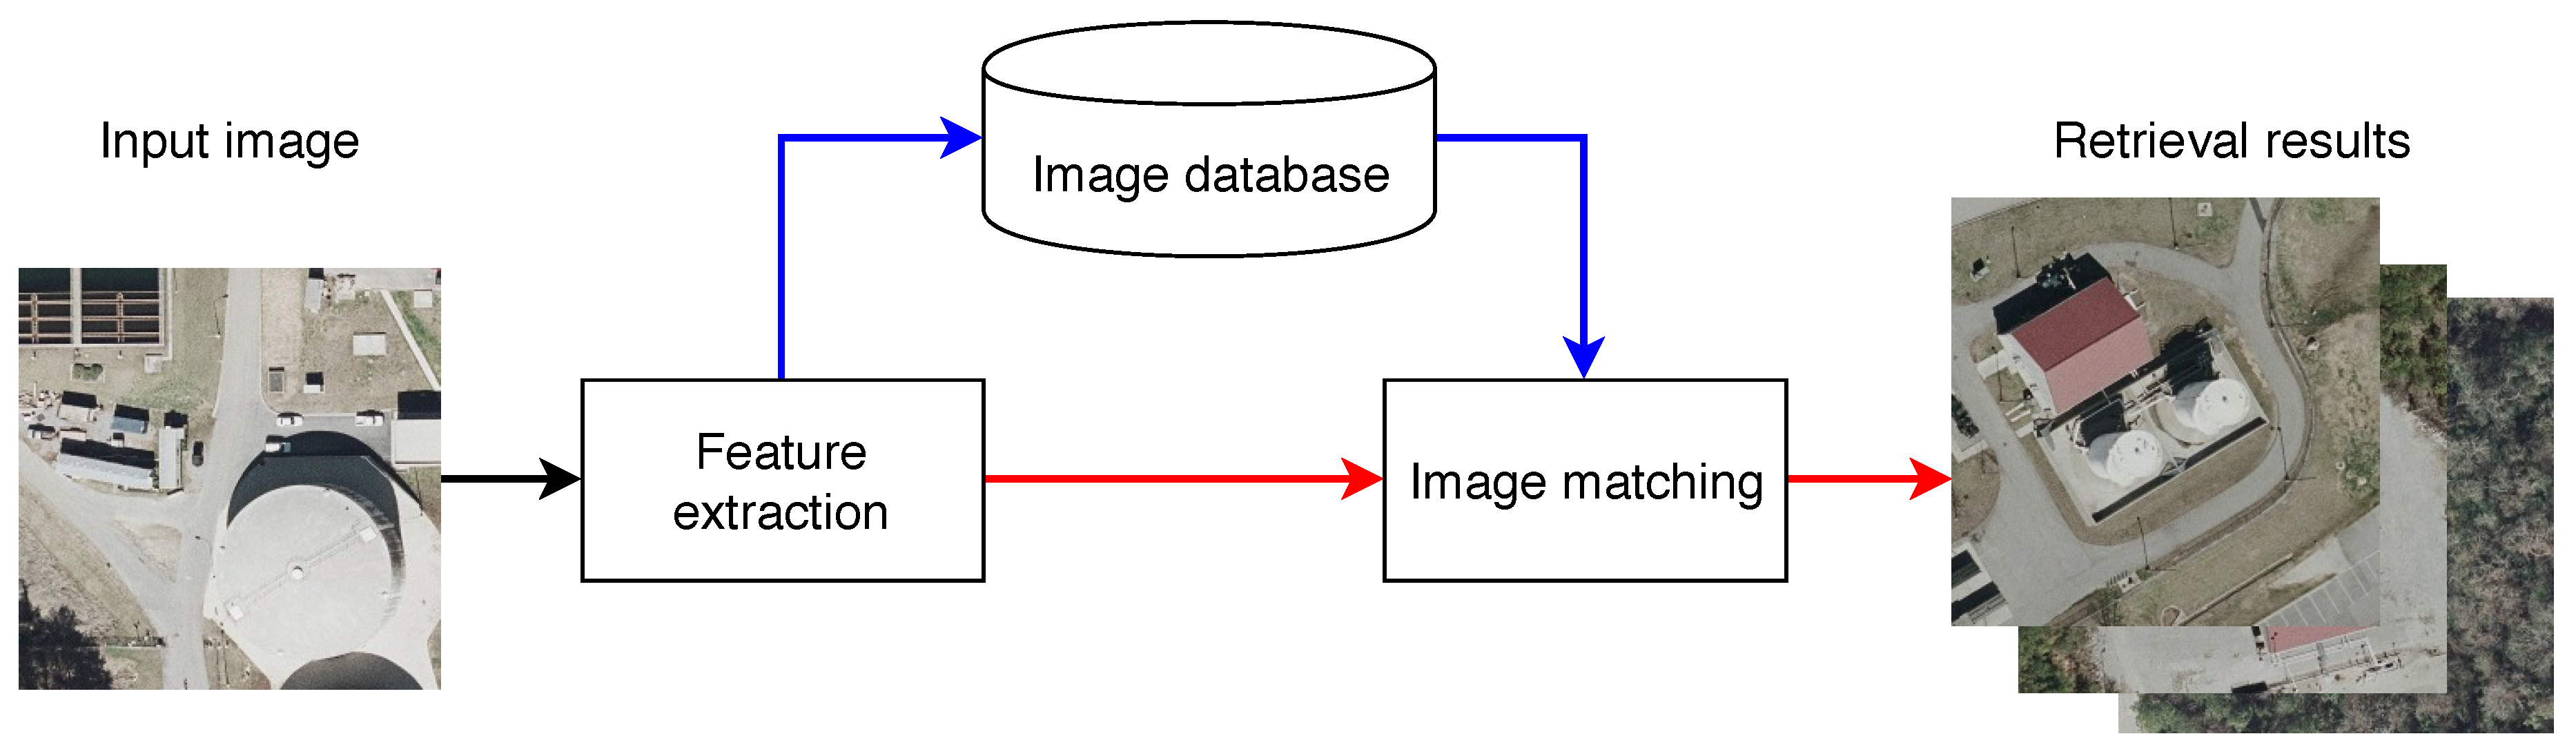
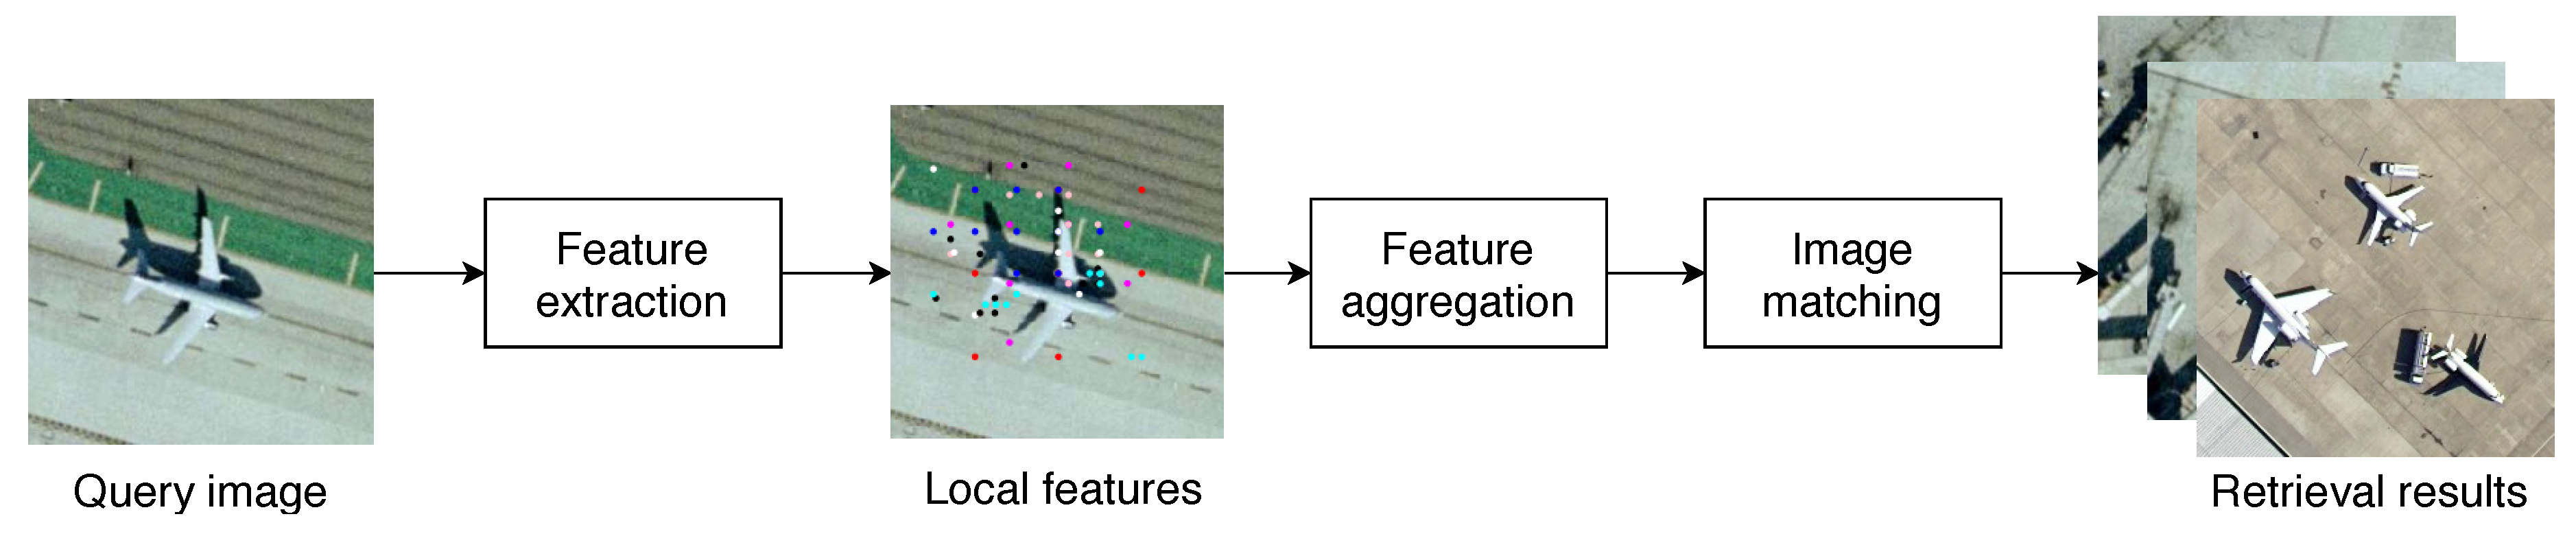
3. Architectural Pipeline
3.1. Feature Extraction
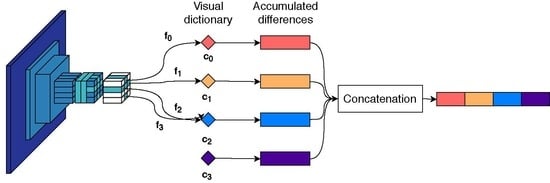
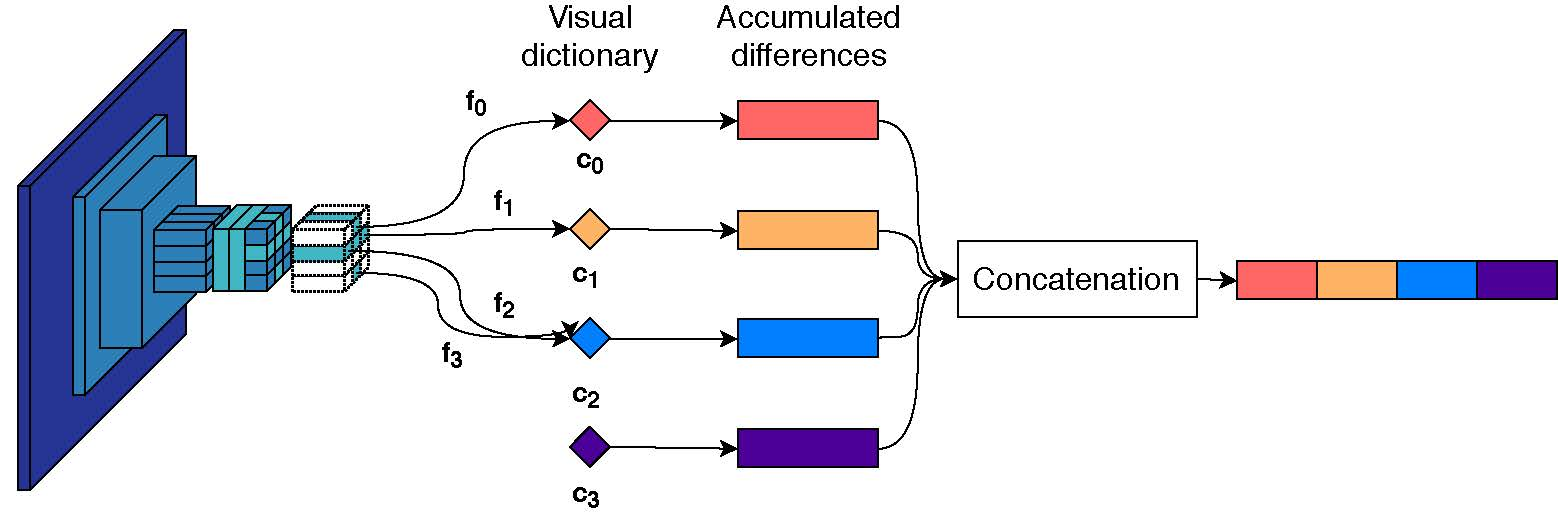
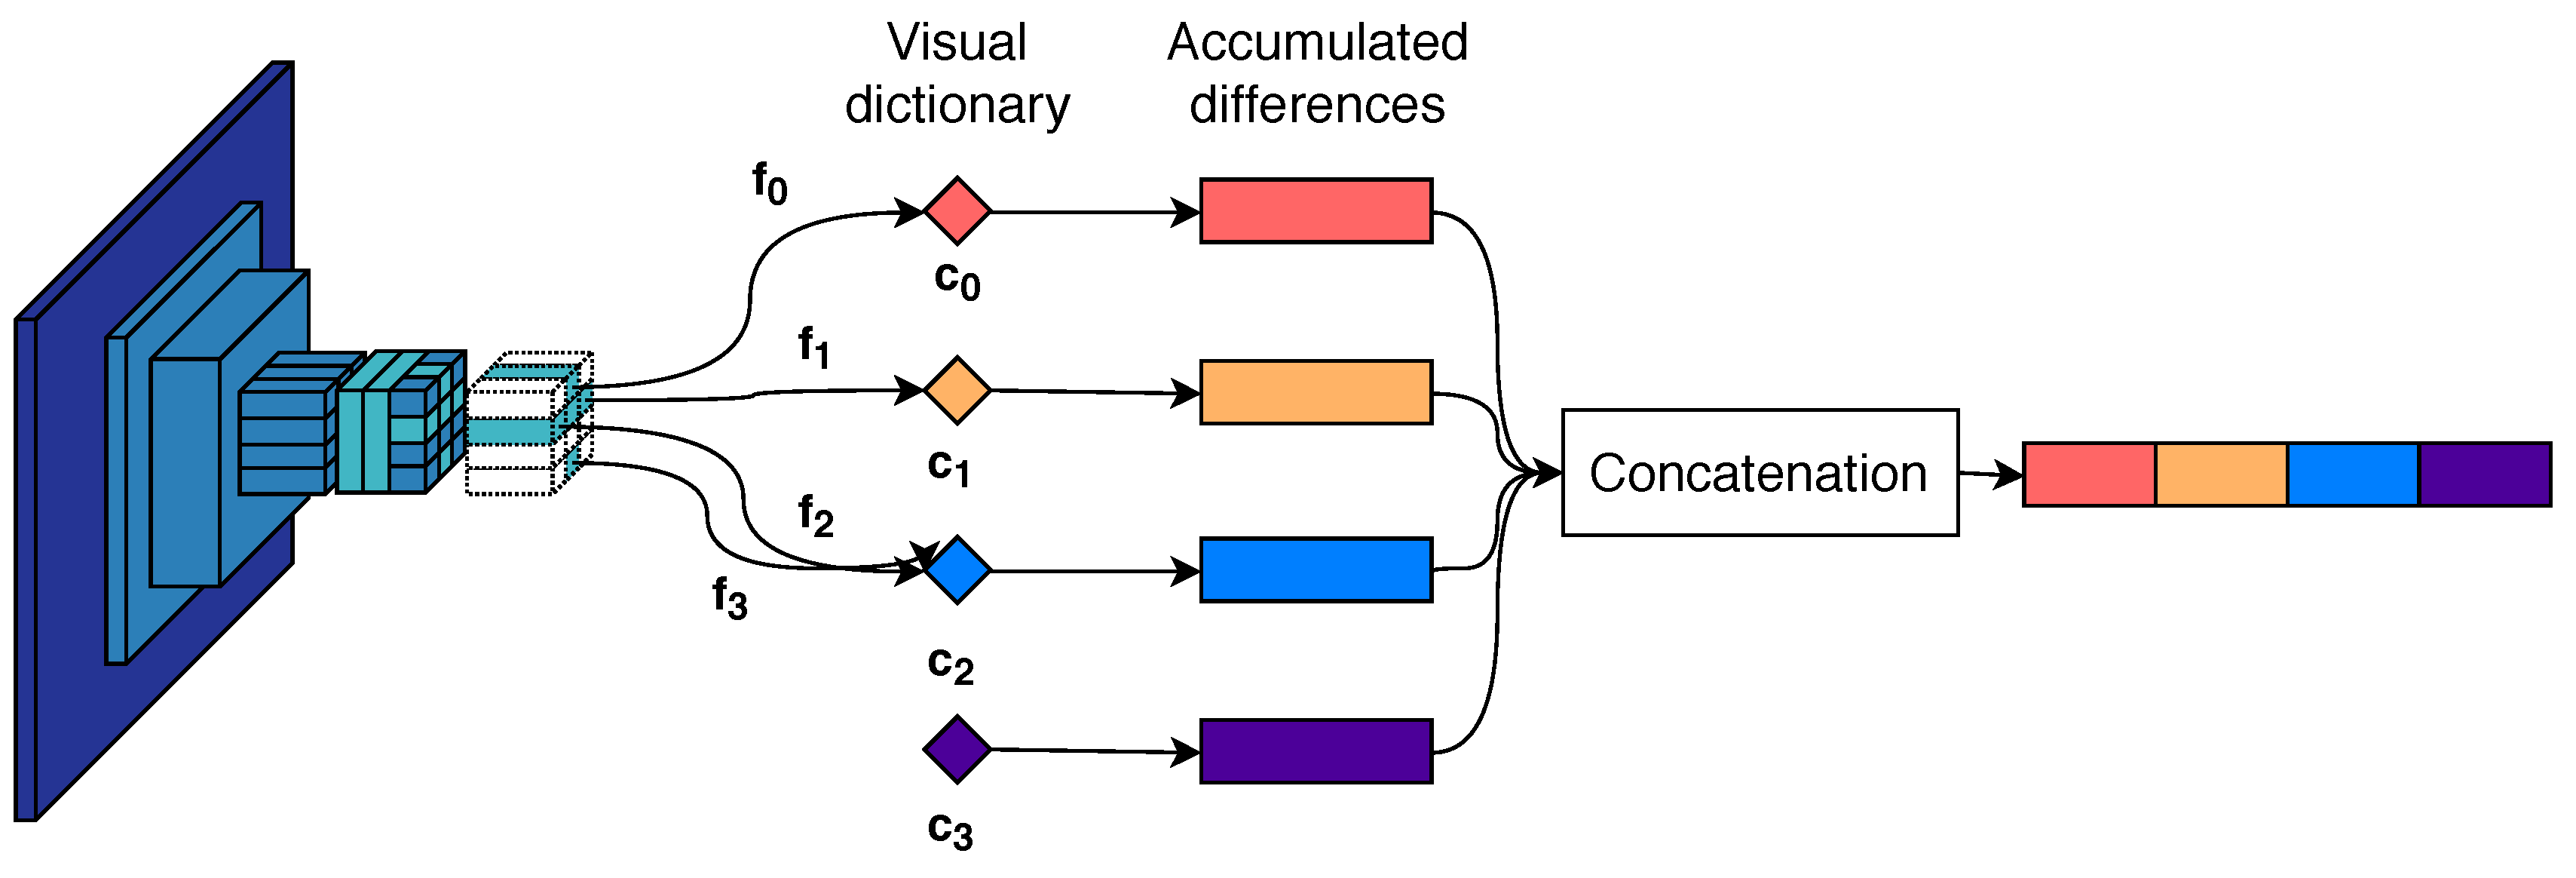
3.2. Descriptor Aggregation
3.3. Image Matching and Query Expansion
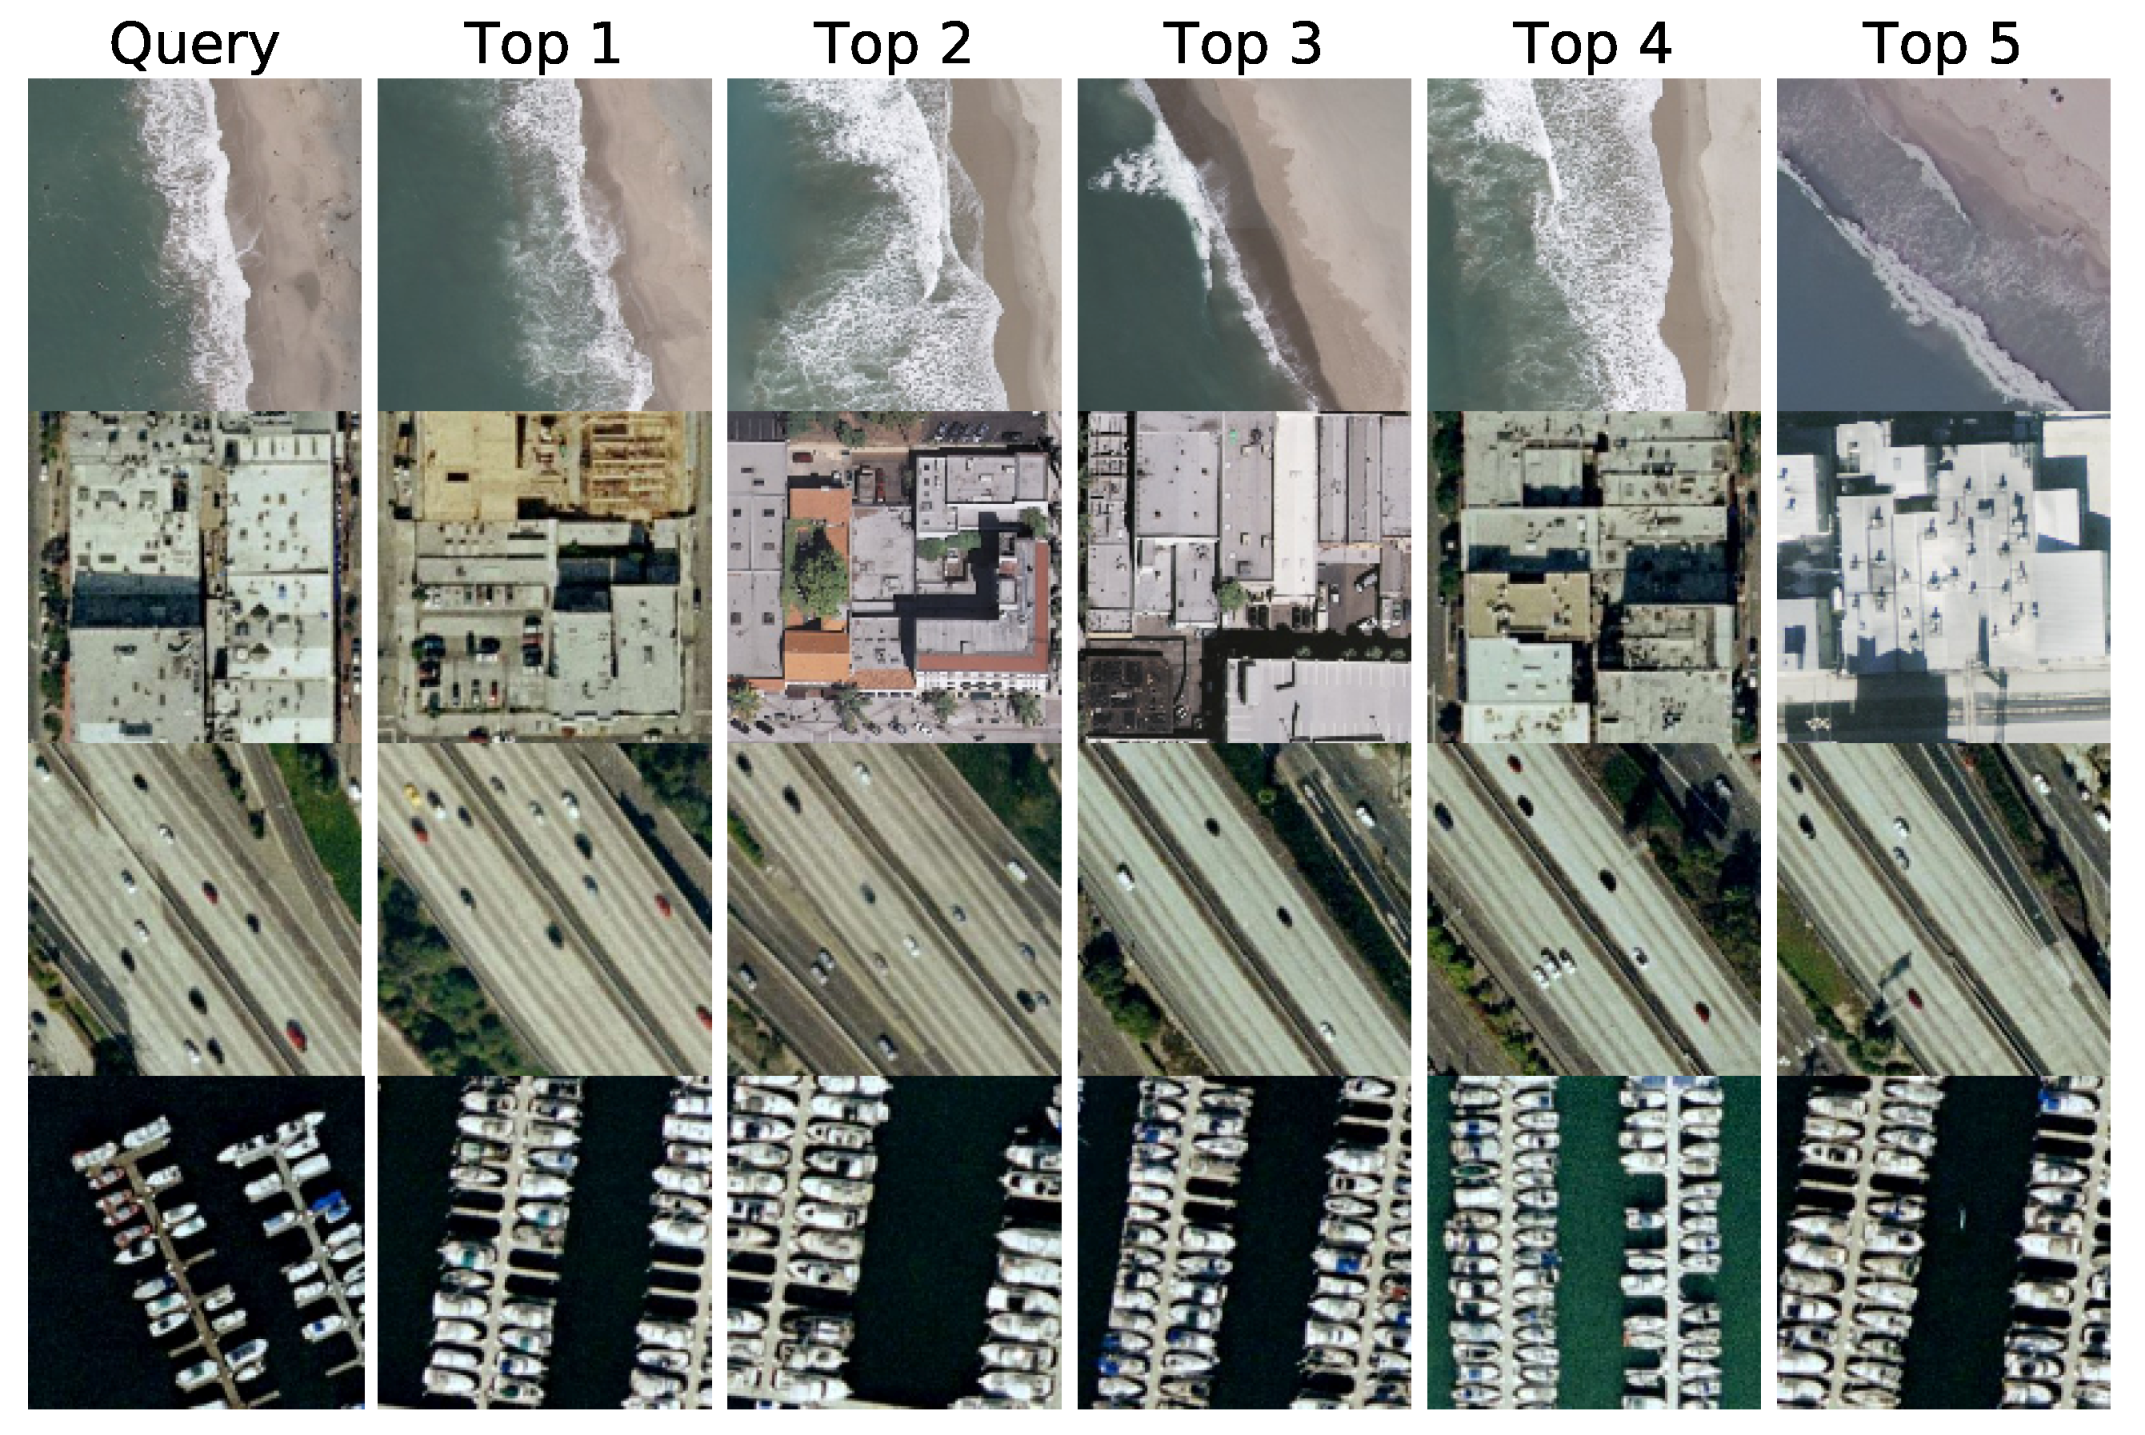
4. Experiments and Discussion
4.1. Experiment Parameters
4.1.1. Datasets and Training
4.1.2. Assessment Criteria
4.1.3. Comparison to Other RSIR Systems
4.2. RSIR Using the Pre-Trained DELF Network for Feature Extraction
4.3. RSIR with Trained Features
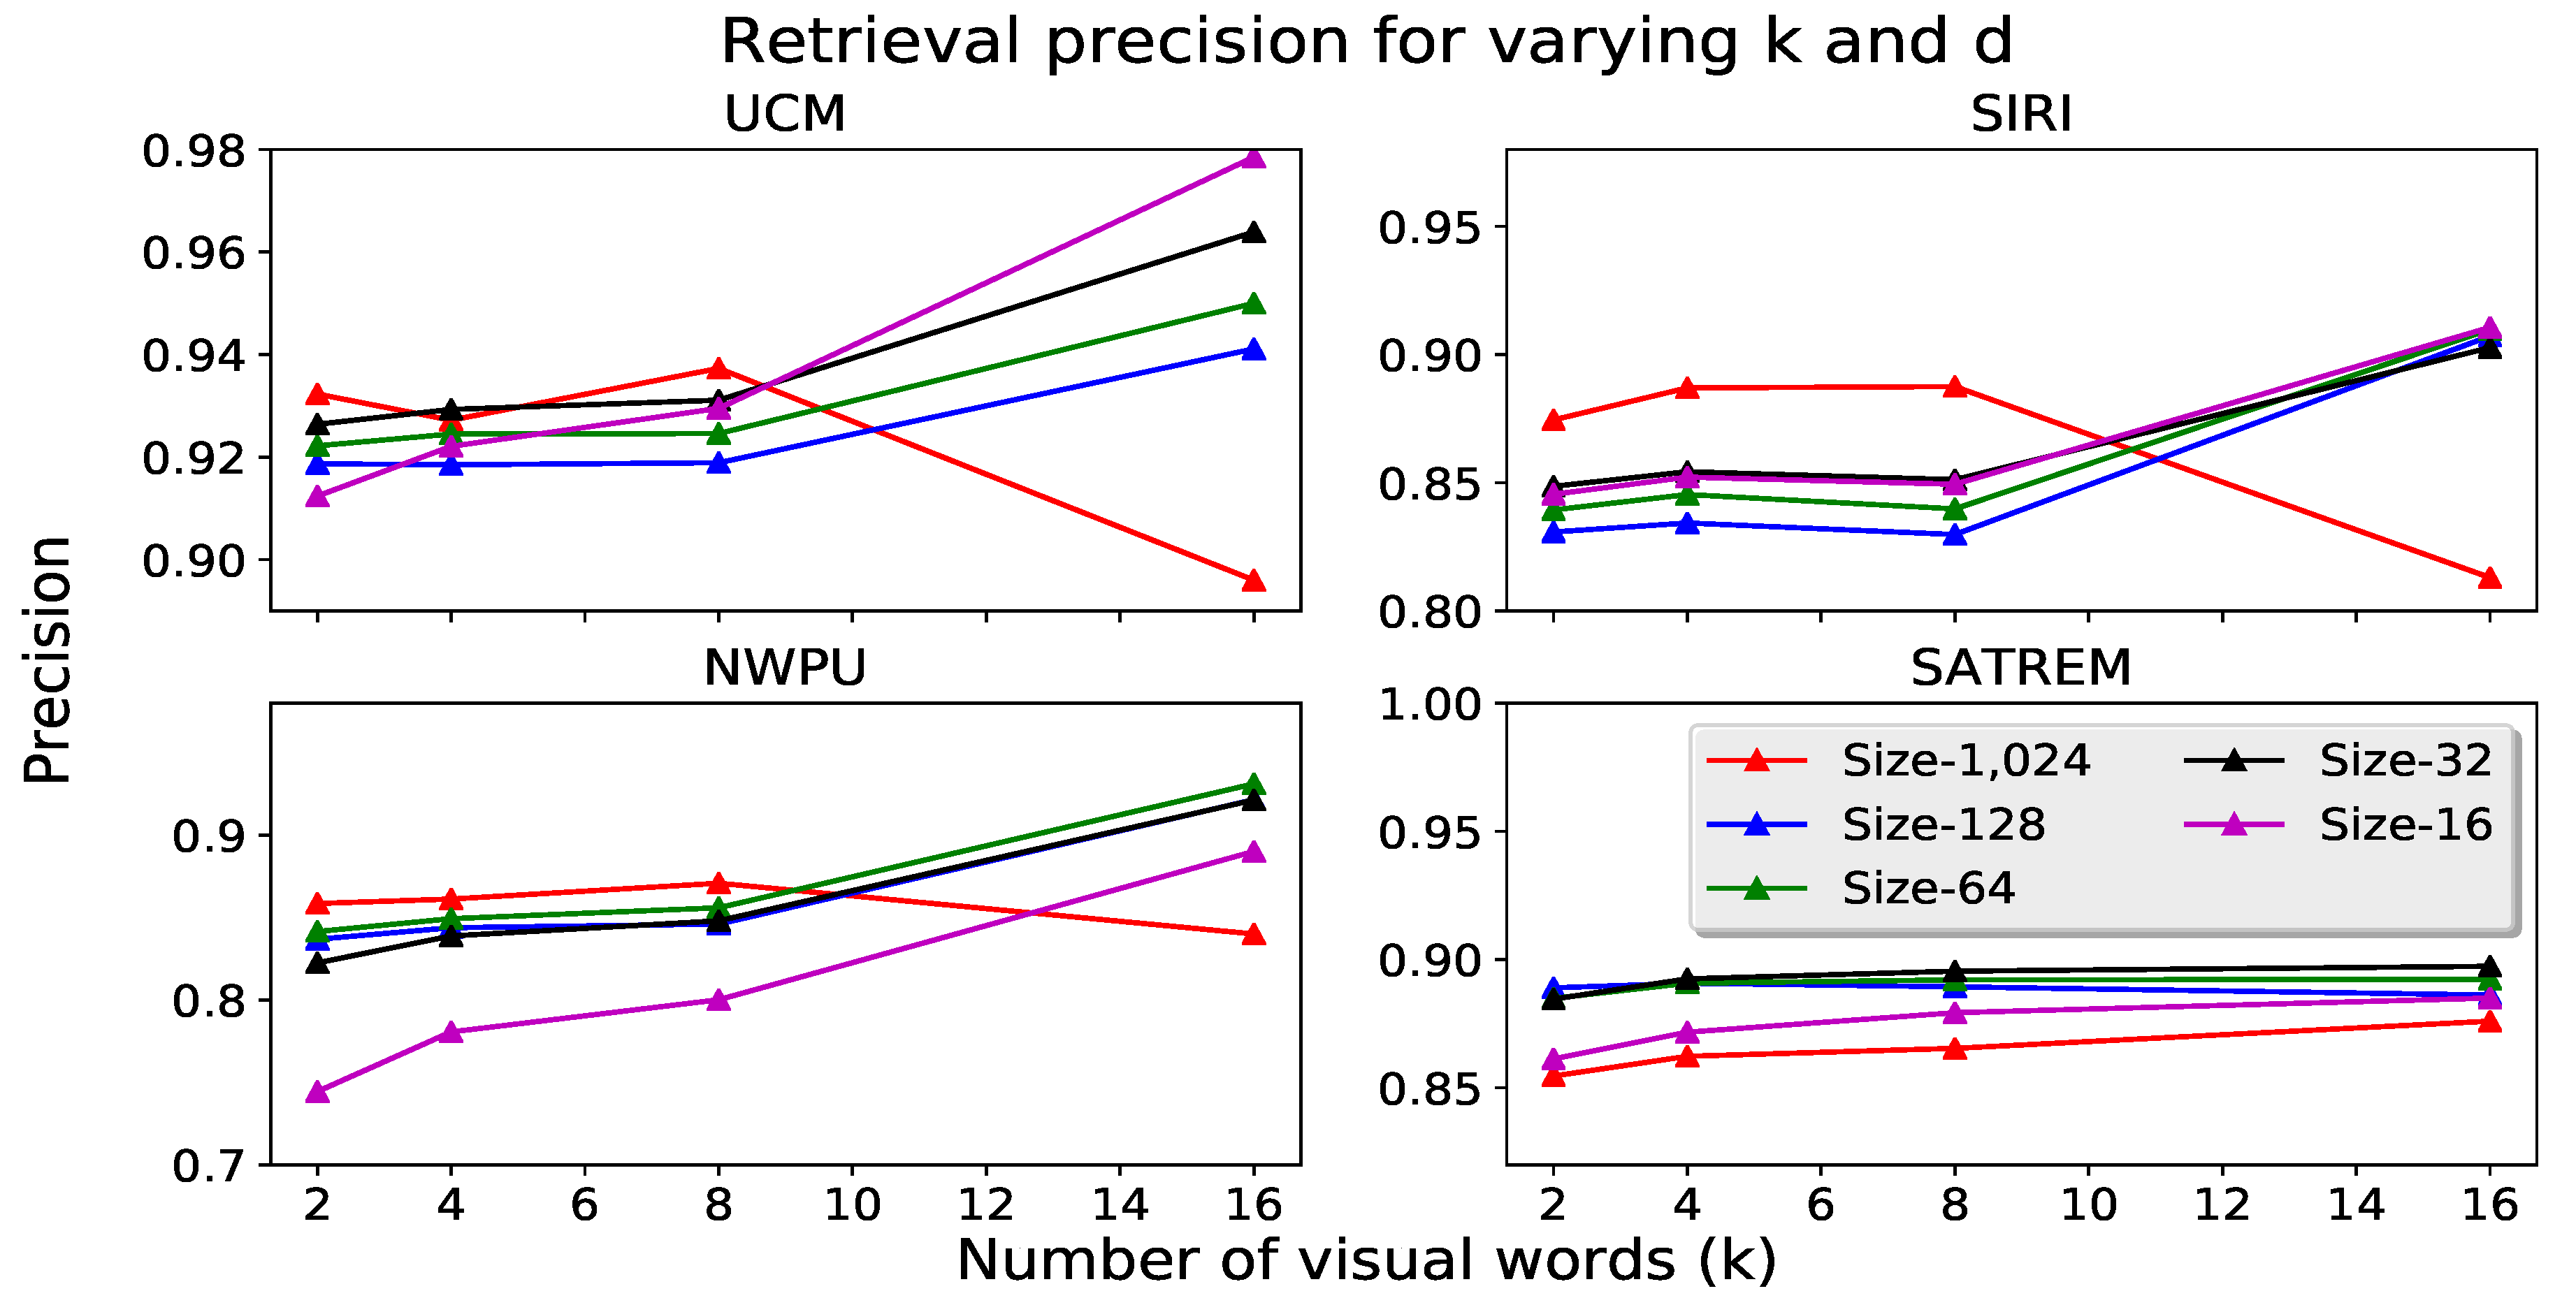
4.4. Dimensionality Reduction
5. Conclusions
Author Contributions
Funding
Conflicts of Interest
References
- Lowe, D.G. Object recognition from local scale-invariant features. In Proceedings of the Seventh IEEE International Conference on Computer Vision, Kerkyra, Greece, 20–27 September 1999; pp. 1150–1157. [Google Scholar]
- Babenko, A.; Slesarev, A.; Chigorin, A.; Lempitsky, V. Neural codes for image retrieval. In Proceedings of the European Conference on Computer Vision, Zurich, Switzerland, 6–12 September 2014; Springer: Cham, Switzerland, 2014; pp. 584–599. [Google Scholar]
- Sünderhauf, N.; Shirazi, S.; Jacobson, A.; Dayoub, F.; Pepperell, E.; Upcroft, B.; Milford, M. Place recognition with convnet landmarks: Viewpoint-robust, condition-robust, training-free. In Proceedings of the Robotics: Science and Systems XII, Rome, Italy, 13–17 July 2015. [Google Scholar] [CrossRef]
- Noh, H.; Araujo, A.; Sim, J.; Weyand, T.; Han, B. Large-Scale Image Retrieval with Attentive Deep Local Features. In Proceedings of the IEEE Conference on Computer Vision and Pattern Recognition, Honolulu, HI, USA, 21–26 July 2017; pp. 3456–3465. [Google Scholar]
- Sivic, J.; Zisserman, A. Video Google: A text retrieval approach to object matching in videos. In Proceedings of the Ninth IEEE International Conference on Computer Vision, Nice, France, 13–16 October 2003; p. 1470. [Google Scholar]
- Jégou, H.; Douze, M.; Schmid, C.; Pérez, P. Aggregating local descriptors into a compact image representation. In Proceedings of the 2010 IEEE Conference on Computer Vision and Pattern Recognition (CVPR), San Francisco, CA, USA, 13–18 June 2010; pp. 3304–3311. [Google Scholar]
- Perronnin, F.; Dance, C. Fisher kernels on visual vocabularies for image categorization. In Proceedings of the 2007 IEEE Conference on Computer Vision and Pattern Recognition, Minneapolis, MN, USA, 17–22 June 2007; pp. 1–8. [Google Scholar]
- Iscen, A.; Furon, T.; Gripon, V.; Rabbat, M.; Jégou, H. Memory vectors for similarity search in high-dimensional spaces. IEEE Trans. Big Data 2018, 4, 65–77. [Google Scholar] [CrossRef]
- Bai, Y.; Yu, W.; Xiao, T.; Xu, C.; Yang, K.; Ma, W.Y.; Zhao, T. Bag-of-words based deep neural network for image retrieval. In Proceedings of the 22nd ACM International Conference on Multimedia, Orlando, FL, USA, 3–7 November 2014; pp. 229–232. [Google Scholar]
- Yang, Y.; Newsam, S. Geographic image retrieval using local invariant features. IEEE Trans. Geosci. Remote Sens. 2013, 51, 818–832. [Google Scholar] [CrossRef]
- Penatti, O.A.; Nogueira, K.; dos Santos, J.A. Do deep features generalize from everyday objects to remote sensing and aerial scenes domains? In Proceedings of the IEEE Conference on Computer Vision and Pattern Recognition Workshops, Boston, MA, USA, 7–12 June 2015; pp. 44–51. [Google Scholar]
- Tang, X.; Zhang, X.; Liu, F.; Jiao, L. Unsupervised deep feature learning for remote sensing image retrieval. Remote Sens. 2018, 10, 1243. [Google Scholar] [CrossRef]
- Manjunath, B.S.; Ma, W.Y. Texture features for browsing and retrieval of image data. IEEE Trans. Pattern Anal. Mach. Intell. 1996, 18, 837–842. [Google Scholar] [CrossRef]
- Risojevic, V.; Babic, Z. Fusion of global and local descriptors for remote sensing image classification. IEEE Geosci. Remote Sens. Lett. 2013, 10, 836–840. [Google Scholar] [CrossRef]
- Shyu, C.R.; Klaric, M.; Scott, G.J.; Barb, A.S.; Davis, C.H.; Palaniappan, K. GeoIRIS: Geospatial information retrieval and indexing system—Content mining, semantics modeling, and complex queries. IEEE Trans. Geosci. Remote Sens. 2007, 45, 839–852. [Google Scholar] [CrossRef] [PubMed]
- Babenko, A.; Lempitsky, V. Aggregating local deep features for image retrieval. In Proceedings of the IEEE International Conference on Computer Vision, Santiago, Chile, 7–13 Decmeber 2015; pp. 1269–1277. [Google Scholar]
- Hou, Y.; Zhang, H.; Zhou, S. Evaluation of Object Proposals and ConvNet Features for Landmark-based Visual Place Recognition. J. Intell. Robot. Syst. 2018, 92, 505–520. [Google Scholar] [CrossRef]
- Arandjelovic, R.; Gronat, P.; Torii, A.; Pajdla, T.; Sivic, J. NetVLAD: CNN architecture for weakly supervised place recognition. In Proceedings of the IEEE International Conference on Computer Vision and Pattern Recognition, Las Vegas, NV, USA, 27–30 June 2016. [Google Scholar]
- Jegou, H.; Douze, M.; Schmid, C. Hamming embedding and weak geometric consistency for large scale image search. In Proceedings of the European Conference on Computer Vision, Marseille, France, 12–18 October 2008; Springer: New York, NY, USA, 2008; pp. 304–317. [Google Scholar]
- Lowe, D.G. Distinctive image features from scale-invariant keypoints. Int. J. Comput. Vis. 2004, 60, 91–110. [Google Scholar] [CrossRef]
- Philbin, J.; Chum, O.; Isard, M.; Sivic, J.; Zisserman, A. Object retrieval with large vocabularies and fast spatial matching. In Proceedings of the IEEE Conference on Computer Vision and Pattern Recognition CVPR’07, Minneapolis, MN, USA, 17–22 June 2007; pp. 1–8. [Google Scholar]
- Voorhees, E.M. Query Expansion Using Lexical-semantic Relations. In Proceedings of the 17th Annual International ACM SIGIR Conference on Research and Development in Information Retrieval (SIGIR ’94), Dublin, Ireland, 3–6 July 1994; Springer: New York, NY, USA, 1994; pp. 61–69. [Google Scholar]
- Chum, O.; Philbin, J.; Sivic, J.; Isard, M.; Zisserman, A. Total recall: Automatic query expansion with a generative feature model for object retrieval. In Proceedings of the IEEE 11th International Conference on Computer Vision, Rio de Janeiro, Brazil, 14–21 October 2007; pp. 1–8. [Google Scholar]
- Chum, O.; Mikulik, A.; Perdoch, M.; Matas, J. Total recall II: Query expansion revisited. In Proceedings of the 2011 IEEE Conference on IEEE Computer Vision and Pattern Recognition (CVPR), Colorado Springs, CO, USA, 20–25 June 2011; pp. 889–896. [Google Scholar]
- Arandjelovic, R.; Zisserman, A. Three things everyone should know to improve object retrieval. In Proceedings of the 2012 IEEE Conference on Computer Vision and Pattern Recognition, Providence, RI, USA, 16–21 June 2012; pp. 2911–2918. [Google Scholar]
- Fischler, M.A.; Bolles, R.C. Random sample consensus: A paradigm for model fitting with applications to image analysis and automated cartography. Commun. ACM 1981, 24, 381–395. [Google Scholar] [CrossRef]
- Jain, M.; Jégou, H.; Gros, P. Asymmetric hamming embedding: Taking the best of our bits for large scale image search. In Proceedings of the 19th ACM international conference on Multimedia, Scottsdale, AZ, USA, 28 November–1 Decmeber 2011; pp. 1441–1444. [Google Scholar]
- Oliva, A.; Torralba, A. Modeling the shape of the scene: A holistic representation of the spatial envelope. Int. J. Comput. Vis. 2001, 42, 145–175. [Google Scholar] [CrossRef]
- Radenovic, F.; Iscen, A.; Tolias, G.; Avrithis, Y.; Chum, O. Revisiting oxford and paris: Large-scale image retrieval benchmarking. In Proceedings of the IEEE Computer Vision and Pattern Recognition Conference, Salt Lake City, UT, USA, 18–22 June 2018. [Google Scholar]
- Azizpour, H.; Sharif Razavian, A.; Sullivan, J.; Maki, A.; Carlsson, S. From generic to specific deep representations for visual recognition. In Proceedings of the IEEE Conference on Computer Vision and Pattern Recognition Workshops (CVPRW), Boston, MA, USA, 7–12 June 2015; pp. 36–45. [Google Scholar]
- Tolias, G.; Sicre, R.; Jégou, H. Particular object retrieval with integral max-pooling of CNN activations. arXiv, 2015; arXiv:1511.05879. [Google Scholar]
- Haralick, R.M.; Shanmugam, K. Textural features for image classification. IEEE Trans. Syst. Man Cybern. 1973, SMC-3, 610–621. [Google Scholar] [CrossRef]
- Datcu, M.; Seidel, K.; Walessa, M. Spatial information retrieval from remote-sensing images-Part I: Information theoretical perspective. IEEE Trans. Geosci. Remote Sens. 1998, 36, 1431–1445. [Google Scholar] [CrossRef]
- Schroder, M.; Rehrauer, H.; Seidel, K.; Datcu, M. Spatial information retrieval from remote-sensing images. II. Gibbs-Markov random fields. IEEE Trans. Geosci. Remote Sens. 1998, 36, 1446–1455. [Google Scholar] [CrossRef]
- Bao, Q.; Guo, P. Comparative studies on similarity measures for remote sensing image retrieval. In Proceedings of the 2004 IEEE International Conference on Systems, Man and Cybernetics, The Hague, The Netherlands, 10–13 October 2004; Volume 1, pp. 1112–1116. [Google Scholar]
- Ferecatu, M.; Boujemaa, N. Interactive remote-sensing image retrieval using active relevance feedback. IEEE Trans. Geosci. Remote Sens. 2007, 45, 818–826. [Google Scholar] [CrossRef]
- Demir, B.; Bruzzone, L. A novel active learning method in relevance feedback for content-based remote sensing image retrieval. IEEE Trans. Geosci. Remote Sens. 2015, 53, 2323–2334. [Google Scholar] [CrossRef]
- Sun, H.; Sun, X.; Wang, H.; Li, Y.; Li, X. Automatic target detection in high-resolution remote sensing images using spatial sparse coding bag-of-words model. IEEE Geosci. Remote Sens. Lett. 2012, 9, 109–113. [Google Scholar] [CrossRef]
- Harris, C.; Stephens, M. A combined corner and edge detector. In Proceedings of the Alvey Vision Conference, Manchester, UK, 31 August–2 September 1988; Volume 15, pp. 10–5244. [Google Scholar]
- Vidal-Naquet, M.; Ullman, S. Object Recognition with Informative Features and Linear Classification. In Proceedings of the ICCV, Nice, France, 13–16 October 2003; Volume 3, p. 281. [Google Scholar]
- Demir, B.; Bruzzone, L. Hashing-based scalable remote sensing image search and retrieval in large archives. IEEE Trans. Geosci. Remote Sens. 2016, 54, 892–904. [Google Scholar] [CrossRef]
- Wang, M.; Song, T. Remote sensing image retrieval by scene semantic matching. IEEE Trans. Geosci. Remote Sens. 2013, 51, 2874–2886. [Google Scholar] [CrossRef]
- Bruns, T.; Egenhofer, M. Similarity of spatial scenes. In Proceedings of the Seventh International Symposium on Spatial Data Handling, Delft, The Netherlands, 12–16 August 1996; pp. 31–42. [Google Scholar]
- Marmanis, D.; Datcu, M.; Esch, T.; Stilla, U. Deep learning earth observation classification using ImageNet pretrained networks. IEEE Geosci. Remote Sens. Lett. 2016, 13, 105–109. [Google Scholar] [CrossRef]
- Zhou, W.; Newsam, S.D.; Li, C.; Shao, Z. Learning low dimensional convolutional neural networks for high-resolution remote sensing image retrieval. Remote Sens. 2017, 9, 489. [Google Scholar] [CrossRef]
- Li, Y.; Zhang, Y.; Huang, X.; Ma, J. Learning source-invariant deep hashing convolutional neural networks for cross-source remote sensing image retrieval. IEEE Trans. Geosci. Remote Sens. 2018, 56, 6521–6536. [Google Scholar] [CrossRef]
- Roy, S.; Sangineto, E.; Demir, B.; Sebe, N. Deep metric and hash-code learning for content-based retrieval of remote sensing images. Proceedings of IGARSS 2018—2018 IEEE International Geoscience and Remote Sensing Symposium, Valencia, Spain, 22–27 July 2018. [Google Scholar]
- Li, Y.; Zhang, Y.; Huang, X.; Zhu, H.; Ma, J. Large-scale remote sensing image retrieval by deep hashing neural networks. IEEE Trans. Geosci. Remote Sens. 2018, 56, 950–965. [Google Scholar] [CrossRef]
- Abdi, H.; Williams, L.J. Principal component analysis. In Encyclopedia of Biometrics; Li, S.Z., Jain, A., Eds.; Springer: Boston, MA, USA, 2012. [Google Scholar]
- Jegou, H.; Perronnin, F.; Douze, M.; Sánchez, J.; Perez, P.; Schmid, C. Aggregating local image descriptors into compact codes. IEEE Trans. Pattern Analysis Mach.Intell. 2012, 34, 1704–1716. [Google Scholar] [CrossRef] [PubMed]
- He, K.; Zhang, X.; Ren, S.; Sun, J. Deep Residual Learning for Image Recognition. In Proceedings of the IEEE Conference on Computer Vision and Pattern Recognition (CVPR), Las Vegas, NV, USA, 27–30 June 2016. [Google Scholar]
- Dugas, C.; Bengio, Y.; Bélisle, F.; Nadeau, C.; Garcia, R. Incorporating second-order functional knowledge for better option pricing. In Proceedings of the Advances in Neural Information Processing Systems, Denver, CO, USA, 27 November–2 December 2000; pp. 472–478. [Google Scholar]
- Tolias, G.; Avrithis, Y.; Jégou, H. To aggregate or not to aggregate: Selective match kernels for image search. In Proceedings of the IEEE International Conference on Computer Vision, Sydney, Australia, 1–8 December 2013; pp. 1401–1408. [Google Scholar]
- Rao, C.R.; Mitra, S.K. Generalized inverse of a matrix and its applications. In Proceedings of the Sixth Berkeley Symposium on Mathematical Statistics and Probability, Volume 1: Theory of Statistics; The Regents of the University of California: Berkeley, CA, USA, 1972. [Google Scholar]
- Yang, Y.; Newsam, S. Bag-of-visual-words and spatial extensions for land-use classification. In Proceedings of the 18th SIGSPATIAL ACM International Conference on Advances in Geographic Information Systems, San Jose, CA, USA, 2–5 November 2010; pp. 270–279. [Google Scholar]
- Tang, X.; Jiao, L.; Emery, W.J.; Liu, F.; Zhang, D. Two-stage reranking for remote sensing image retrieval. IEEE Trans. Geosci. Remote Sens. 2017, 55, 5798–5817. [Google Scholar] [CrossRef]
- Zhao, B.; Zhong, Y.; Xia, G.S.; Zhang, L. Dirichlet-derived multiple topic scene classification model for high spatial resolution remote sensing imagery. IEEE Trans. Geosci. Remote Sens. 2016, 54, 2108–2123. [Google Scholar] [CrossRef]
- Zhao, B.; Zhong, Y.; Zhang, L.; Huang, B. The Fisher kernel coding framework for high spatial resolution scene classification. Remote Sens. 2016, 8, 157. [Google Scholar] [CrossRef]
- Zhu, Q.; Zhong, Y.; Zhao, B.; Xia, G.S.; Zhang, L. Bag-of-visual-words scene classifier with local and global features for high spatial resolution remote sensing imagery. IEEE Geosci. Remote Sens. Lett. 2016, 13, 747–751. [Google Scholar] [CrossRef]
- Cheng, G.; Han, J.; Lu, X. Remote sensing image scene classification: Benchmark and state of the art. Proc. IEEE 2017, 105, 1865–1883. [Google Scholar] [CrossRef]
- Cheng, G.; Li, Z.; Yao, X.; Guo, L.; Wei, Z. Remote Sensing Image Scene Classification Using Bag of Convolutional Features. IEEE Geosci. Remote Sens. Lett. 2017, 14, 1735–1739. [Google Scholar] [CrossRef]
- Cheng, G.; Yang, C.; Yao, X.; Guo, L.; Han, J. When deep learning meets metric learning: remote sensing image scene classification via learning discriminative CNNs. IEEE Trans. Geosci. Remote Sens. 2018, 56, 2811–2821. [Google Scholar] [CrossRef]
- Tang, X.; Jiao, L.; Emery, W.J. SAR image content retrieval based on fuzzy similarity and relevance feedback. IEEE J. Sel. Top. Appl. Earth Observ. Remote Sens. 2017, 10, 1824–1842. [Google Scholar] [CrossRef]


| Dataset | Abbreviation | # of Images | # of Classes | Image Resolution | Spatial Resolution |
|---|---|---|---|---|---|
| UCMerced [55] | UCM | 2100 | 21 | pix. | 0.3 m |
| Satellite Remote [56] | SATREM | 3000 | 20 | pix. | 0.5 m |
| SIRI-WHU [57,58,59] | SIRI | 2400 | 12 | pix. | 2.0 m |
| NWPU-RESISC45 [60] | NWPU | 31,500 | 45 | pix. | 30–0.2 m |
| Abbreviation | Features | Descriptor Size | Similarity Metric |
|---|---|---|---|
| RFM [63] | Edges and texture | - | Fuzzy similarity |
| SBOW [10] | SIFT + BoW | 1500 | norm |
| Hash [41] | SIFT + BoW | 16 | Hamming dist. |
| DN7 [44] | Convolutional | 4096 | norm |
| DN8 [44] | Convolutional | 4096 | norm |
| DBOW [12] | Convolutional + BoW | 1500 | norm |
| BoCF [61] | Convolutional + BoW | 5000 | norm |
| DCNN [62] | Convolutional | 25,088 | norm |
| ResNet-50 [51] | Convolutional + VLAD | 16,384 | |
| V-DELF (Ours) | Convolutional + VLAD | 16,384 | norm |
| Dataset | RFM | SBOW | Hash | DN7 | DN8 | BoCF | DBOW | V-DELF | QE-S | QE-I |
|---|---|---|---|---|---|---|---|---|---|---|
| [63] | [10] | [41] | [44] | [44] | [61] | [12] | ||||
| UCM | 0.391 | 0.532 | 0.536 | 0.704 | 0.705 | 0.243 | 0.830 | 0.746 | 0.780 | 0.780 |
| SATREM | 0.434 | 0.642 | 0.644 | 0.740 | 0.740 | 0.218 | 0.933 | 0.839 | 0.865 | 0.865 |
| SIRI | 0.407 | 0.533 | 0.524 | 0.700 | 0.700 | 0.200 | 0.926 | 0.826 | 0.869 | 0.869 |
| NWPU | 0.256 | 0.370 | 0.345 | 0.605 | 0.595 | 0.097 | 0.822 | 0.724 | 0.759 | 0.757 |
| Method | UCM | SATREM | SIRI | NWPU |
|---|---|---|---|---|
| DN7 [44] | 0.704 | 0.740 | 0.700 | 0.605 |
| DN8 [44] | 0.705 | 0.740 | 0.696 | 0.595 |
| DBOW [12] | 0.830 | 0.933 | 0.926 | 0.821 |
| D-CNN [62] | 0.874 | 0.852 | 0.893 | 0.736 |
| ResNet50 [51] | 0.816 | 0.764 | 0.862 | 0.798 |
| V-DELF (MA) | 0.896 | 0.876 | 0.813 | 0.840 |
| QE-S (MA) | 0.916 | 0.895 | 0.838 | 0.857 |
| QE-I (MA) | 0.915 | 0.894 | 0.838 | 0.855 |
| V-DELF (AA) | 0.883 | 0.866 | 0.791 | 0.838 |
| QE-S (AA) | 0.854 | 0.840 | 0.818 | 0.856 |
| QE-I (AA) | 0.904 | 0.894 | 0.817 | 0.855 |
| DBOW | ResNet-50 | BoCF | DCNN | Multiplicative Attention | Additive Attention | |||||
|---|---|---|---|---|---|---|---|---|---|---|
| [12] | [51] | [61] | [62] | V-DELF | QE-S | QE-I | V-DELF | QE-S | QE-I | |
| Agriculture | 0.92 | 0.85 | 0.88 | 0.99 | 0.75 | 0.80 | 0.80 | 0.78 | 0.78 | 0.83 |
| Airplane | 0.95 | 0.93 | 0.11 | 0.98 | 0.98 | 0.97 | 0.97 | 0.98 | 0.94 | 0.99 |
| Baseball | 0.87 | 0.73 | 0.13 | 0.82 | 0.74 | 0.77 | 0.77 | 0.71 | 0.70 | 0.75 |
| Beach | 0.88 | 0.99 | 0.17 | 0.99 | 0.93 | 0.94 | 0.94 | 0.90 | 0.89 | 0.95 |
| Buildings | 0.93 | 0.74 | 0.10 | 0.80 | 0.83 | 0.85 | 0.85 | 0.81 | 0.80 | 0.85 |
| Chaparral | 0.94 | 0.95 | 0.93 | 1.00 | 1.00 | 1.00 | 1.00 | 0.98 | 0.94 | 0.99 |
| Dense | 0.96 | 0.62 | 0.07 | 0.65 | 0.89 | 0.90 | 0.90 | 0.87 | 0.84 | 0.89 |
| Forest | 0.99 | 0.87 | 0.78 | 0.99 | 0.97 | 0.98 | 0.98 | 0.98 | 0.94 | 0.99 |
| Freeway | 0.78 | 0.69 | 0.09 | 0.92 | 0.98 | 0.99 | 0.99 | 0.97 | 0.93 | 0.98 |
| Golf | 0.85 | 0.73 | 0.08 | 0.93 | 0.80 | 0.83 | 0.83 | 0.81 | 0.79 | 0.85 |
| Harbor | 0.95 | 0.97 | 0.20 | 1.00 | 1.00 | 1.00 | 1.00 | 1.00 | 0.95 | 1.00 |
| Intersection | 0.77 | 0.81 | 0.16 | 0.79 | 0.83 | 0.86 | 0.85 | 0.81 | 0.79 | 0.84 |
| Medium-density | 0.74 | 0.80 | 0.07 | 0.69 | 0.88 | 0.92 | 0.91 | 0.88 | 0.86 | 0.91 |
| Mobile | 0.76 | 0.74 | 0.09 | 0.89 | 0.92 | 0.94 | 0.94 | 0.86 | 0.83 | 0.89 |
| Overpass | 0.86 | 0.97 | 0.09 | 0.82 | 0.99 | 0.99 | 0.99 | 1.00 | 0.95 | 1.00 |
| Parking | 0.67 | 0.92 | 0.58 | 0.99 | 0.99 | 0.99 | 0.99 | 0.99 | 0.95 | 1.00 |
| River | 0.74 | 0.66 | 0.06 | 0.88 | 0.83 | 0.87 | 0.87 | 0.83 | 0.84 | 0.89 |
| Runway | 0.66 | 0.93 | 0.20 | 0.98 | 0.98 | 0.99 | 0.99 | 0.97 | 0.93 | 0.98 |
| Sparse | 0.79 | 0.69 | 0.11 | 0.83 | 0.76 | 0.79 | 0.78 | 0.70 | 0.65 | 0.69 |
| Storage | 0.50 | 0.86 | 0.12 | 0.60 | 0.89 | 0.93 | 0.93 | 0.78 | 0.74 | 0.80 |
| Tennis | 0.94 | 0.70 | 0.08 | 0.83 | 0.89 | 0.94 | 0.93 | 0.91 | 0.89 | 0.94 |
| Average | 0.830 | 0.816 | 0.243 | 0.874 | 0.896 | 0.916 | 0.915 | 0.883 | 0.854 | 0.904 |
| DBOW | ResNet-50 | BoCF | DCNN | Multiplicative Attention | Additive Attention | |||||
|---|---|---|---|---|---|---|---|---|---|---|
| [12] | [51] | [61] | [62] | V-DELF | QE-S | QE-I | V-DELF | QE-S | QE-I | |
| Agricultural | 0.97 | 0.86 | 0.33 | 0.96 | 0.87 | 0.90 | 0.90 | 0.84 | 0.81 | 0.86 |
| Airplane | 0.96 | 0.86 | 0.12 | 0.64 | 0.84 | 0.88 | 0.88 | 0.89 | 0.85 | 0.89 |
| Artificial | 0.97 | 0.93 | 0.11 | 0.92 | 0.82 | 0.81 | 0.81 | 0.90 | 0.86 | 0.91 |
| Beach | 0.95 | 0.86 | 0.07 | 0.85 | 0.84 | 0.87 | 0.87 | 0.81 | 0.78 | 0.83 |
| Building | 0.97 | 0.92 | 0.14 | 0.83 | 0.92 | 0.94 | 0.94 | 0.82 | 0.79 | 0.83 |
| Chaparral | 0.96 | 0.79 | 0.13 | 0.88 | 0.86 | 0.89 | 0.90 | 0.93 | 0.90 | 0.95 |
| Cloud | 0.99 | 0.97 | 0.80 | 1.00 | 0.96 | 0.97 | 0.97 | 0.88 | 0.85 | 0.90 |
| Container | 0.96 | 0.97 | 0.08 | 0.88 | 0.99 | 1.00 | 1.00 | 0.84 | 0.81 | 0.86 |
| Dense | 1.00 | 0.89 | 0.17 | 0.90 | 0.94 | 0.94 | 0.94 | 0.95 | 0.93 | 0.98 |
| Factory | 0.91 | 0.69 | 0.09 | 0.76 | 0.72 | 0.74 | 0.74 | 0.98 | 0.94 | 0.99 |
| Forest | 0.96 | 0.89 | 0.70 | 0.96 | 0.94 | 0.95 | 0.95 | 0.98 | 0.95 | 1.00 |
| Harbor | 0.98 | 0.80 | 0.11 | 0.77 | 0.95 | 0.96 | 0.96 | 0.91 | 0.87 | 0.92 |
| Medium-Density | 1.00 | 0.67 | 0.08 | 0.63 | 0.67 | 0.67 | 0.67 | 0.83 | 0.80 | 0.85 |
| Ocean | 0.92 | 0.91 | 0.85 | 0.98 | 0.91 | 0.92 | 0.92 | 0.76 | 0.74 | 0.79 |
| Parking | 0.95 | 0.87 | 0.10 | 0.87 | 0.94 | 0.96 | 0.96 | 0.88 | 0.85 | 0.90 |
| River | 0.71 | 0.83 | 0.07 | 0.80 | 0.70 | 0.74 | 0.74 | 0.99 | 0.95 | 1.00 |
| Road | 0.82 | 0.85 | 0.10 | 0.89 | 0.90 | 0.93 | 0.92 | 0.96 | 0.95 | 0.99 |
| Runway | 0.86 | 0.96 | 0.09 | 0.96 | 0.95 | 0.97 | 0.97 | 0.81 | 0.79 | 0.84 |
| Sparse | 0.92 | 0.75 | 0.09 | 0.67 | 0.84 | 0.85 | 0.84 | 0.61 | 0.58 | 0.63 |
| Storage | 0.91 | 0.98 | 0.12 | 0.89 | 0.99 | 1.00 | 1.00 | 0.95 | 0.91 | 0.96 |
| Average | 0.933 | 0.862 | 0.218 | 0.852 | 0.876 | 0.895 | 0.894 | 0.866 | 0.840 | 0.894 |
| DBOW | ResNet-50 | BoCF | DCNN | Multiplicative Attention | Additive Attention | |||||
|---|---|---|---|---|---|---|---|---|---|---|
| [12] | [51] | [61] | [62] | V-DELF | QE-S | QE-I | V-DELF | QE-S | QE-I | |
| Agriculture | 0.99 | 0.95 | 0.17 | 1.00 | 0.92 | 0.94 | 0.94 | 0.90 | 0.93 | 0.93 |
| Commercial | 0.99 | 0.90 | 0.17 | 0.99 | 0.95 | 0.97 | 0.97 | 0.95 | 0.97 | 0.96 |
| Harbor | 0.89 | 0.63 | 0.12 | 0.79 | 0.71 | 0.74 | 0.74 | 0.75 | 0.78 | 0.78 |
| Idle | 0.97 | 0.63 | 0.11 | 0.89 | 0.77 | 0.80 | 0.80 | 0.79 | 0.83 | 0.84 |
| Industrial | 0.90 | 0.88 | 0.14 | 0.96 | 0.92 | 0.96 | 0.96 | 0.93 | 0.96 | 0.96 |
| Meadow | 0.93 | 0.77 | 0.29 | 0.86 | 0.78 | 0.82 | 0.82 | 0.79 | 0.81 | 0.81 |
| Overpass | 0.89 | 0.80 | 0.21 | 0.95 | 0.92 | 0.94 | 0.94 | 0.92 | 0.95 | 0.95 |
| Park | 0.87 | 0.82 | 0.11 | 0.91 | 0.85 | 0.90 | 0.90 | 0.88 | 0.92 | 0.92 |
| Pond | 0.97 | 0.57 | 0.12 | 0.81 | 0.71 | 0.74 | 0.74 | 0.74 | 0.77 | 0.76 |
| Residential | 0.97 | 0.84 | 0.11 | 0.96 | 0.91 | 0.94 | 0.94 | 0.90 | 0.93 | 0.93 |
| River | 0.89 | 0.44 | 0.12 | 0.60 | 0.66 | 0.69 | 0.69 | 0.69 | 0.72 | 0.71 |
| Water | 0.86 | 0.94 | 0.72 | 1.00 | 0.98 | 0.99 | 0.99 | 0.98 | 0.99 | 0.99 |
| Average | 0.926 | 0.764 | 0.200 | 0.893 | 0.840 | 0.869 | 0.867 | 0.851 | 0.880 | 0.879 |
| DBOW | ResNet-50 | BoCF | DCNN | Multiplicative Attention | Additive Attention | |||||
|---|---|---|---|---|---|---|---|---|---|---|
| [12] | [51] | [61] | [62] | V-DELF | QE-S | QE-I | V-DELF | QE-S | QE-I | |
| Airplane | 0.98 | 0.88 | 0.04 | 0.82 | 0.92 | 0.93 | 0.93 | 0.95 | 0.96 | 0.96 |
| Airport | 0.95 | 0.72 | 0.03 | 0.64 | 0.79 | 0.81 | 0.81 | 0.80 | 0.82 | 0.82 |
| Baseball Diamond | 0.86 | 0.69 | 0.04 | 0.61 | 0.65 | 0.64 | 0.64 | 0.64 | 0.61 | 0.61 |
| Basketball Court | 0.83 | 0.61 | 0.03 | 0.59 | 0.70 | 0.71 | 0.71 | 0.72 | 0.73 | 0.73 |
| Beach | 0.85 | 0.77 | 0.03 | 0.78 | 0.81 | 0.83 | 0.83 | 0.84 | 0.86 | 0.86 |
| Bridge | 0.95 | 0.73 | 0.04 | 0.79 | 0.77 | 0.81 | 0.81 | 0.78 | 0.82 | 0.82 |
| Chaparral | 0.96 | 0.98 | 0.62 | 0.99 | 0.99 | 0.99 | 0.99 | 0.98 | 0.99 | 0.99 |
| Church | 0.80 | 0.56 | 0.05 | 0.39 | 0.64 | 0.64 | 0.64 | 0.57 | 0.56 | 0.56 |
| Circular Farmland | 0.94 | 0.97 | 0.03 | 0.88 | 0.98 | 0.99 | 0.99 | 0.97 | 0.98 | 0.98 |
| Cloud | 0.98 | 0.92 | 0.06 | 0.93 | 0.97 | 0.98 | 0.98 | 0.96 | 0.97 | 0.97 |
| Commercial Area | 0.79 | 0.82 | 0.04 | 0.59 | 0.84 | 0.88 | 0.88 | 0.84 | 0.88 | 0.88 |
| Dense Residential | 0.90 | 0.89 | 0.06 | 0.76 | 0.91 | 0.95 | 0.94 | 0.87 | 0.90 | 0.90 |
| Desert | 0.97 | 0.87 | 0.30 | 0.89 | 0.91 | 0.92 | 0.92 | 0.89 | 0.91 | 0.91 |
| Forest | 0.95 | 0.95 | 0.60 | 0.94 | 0.96 | 0.97 | 0.97 | 0.96 | 0.97 | 0.97 |
| Freeway | 0.64 | 0.65 | 0.04 | 0.64 | 0.81 | 0.86 | 0.86 | 0.82 | 0.85 | 0.85 |
| Golf Course | 0.82 | 0.96 | 0.03 | 0.86 | 0.96 | 0.97 | 0.97 | 0.96 | 0.97 | 0.97 |
| Ground Track Field | 0.80 | 0.63 | 0.05 | 0.62 | 0.76 | 0.77 | 0.77 | 0.74 | 0.76 | 0.75 |
| Harbor | 0.88 | 0.93 | 0.06 | 0.90 | 0.96 | 0.97 | 0.97 | 0.97 | 0.98 | 0.98 |
| Industrial Area | 0.85 | 0.75 | 0.03 | 0.65 | 0.85 | 0.88 | 0.88 | 0.86 | 0.89 | 0.89 |
| Intersection | 0.80 | 0.64 | 0.06 | 0.58 | 0.73 | 0.72 | 0.72 | 0.83 | 0.86 | 0.86 |
| Island | 0.88 | 0.88 | 0.17 | 0.90 | 0.93 | 0.94 | 0.95 | 0.92 | 0.94 | 0.94 |
| Lake | 0.85 | 0.80 | 0.03 | 0.75 | 0.83 | 0.85 | 0.85 | 0.78 | 0.79 | 0.79 |
| Meadow | 0.90 | 0.84 | 0.63 | 0.88 | 0.91 | 0.93 | 0.93 | 0.90 | 0.92 | 0.92 |
| Medium Residential | 0.94 | 0.78 | 0.03 | 0.64 | 0.77 | 0.77 | 0.77 | 0.80 | 0.81 | 0.81 |
| Mobile Home Park | 0.83 | 0.93 | 0.04 | 0.85 | 0.96 | 0.97 | 0.97 | 0.93 | 0.95 | 0.95 |
| Mountain | 0.95 | 0.88 | 0.07 | 0.85 | 0.95 | 0.96 | 0.96 | 0.92 | 0.94 | 0.94 |
| Overpass | 0.74 | 0.87 | 0.04 | 0.67 | 0.88 | 0.90 | 0.90 | 0.88 | 0.91 | 0.91 |
| Palace | 0.80 | 0.41 | 0.04 | 0.30 | 0.53 | 0.56 | 0.56 | 0.48 | 0.48 | 0.48 |
| Parking Lot | 0.70 | 0.95 | 0.09 | 0.90 | 0.95 | 0.97 | 0.97 | 0.94 | 0.96 | 0.96 |
| Railway | 0.84 | 0.88 | 0.07 | 0.81 | 0.87 | 0.89 | 0.89 | 0.87 | 0.90 | 0.90 |
| Railway Station | 0.86 | 0.62 | 0.03 | 0.55 | 0.71 | 0.73 | 0.73 | 0.72 | 0.75 | 0.75 |
| Rectangular Farmland | 0.66 | 0.82 | 0.06 | 0.79 | 0.86 | 0.88 | 0.88 | 0.87 | 0.88 | 0.88 |
| River | 0.76 | 0.70 | 0.03 | 0.59 | 0.73 | 0.75 | 0.75 | 0.75 | 0.77 | 0.77 |
| Roundabout | 0.83 | 0.72 | 0.11 | 0.75 | 0.88 | 0.90 | 0.90 | 0.89 | 0.91 | 0.91 |
| Runway | 0.78 | 0.80 | 0.04 | 0.81 | 0.87 | 0.89 | 0.89 | 0.85 | 0.87 | 0.87 |
| Sea Ice | 0.90 | 0.98 | 0.12 | 0.97 | 0.98 | 0.99 | 0.99 | 0.99 | 0.99 | 0.99 |
| Ship | 0.65 | 0.61 | 0.06 | 0.73 | 0.65 | 0.69 | 0.69 | 0.77 | 0.79 | 0.79 |
| Snowberg | 0.83 | 0.97 | 0.04 | 0.96 | 0.97 | 0.98 | 0.98 | 0.97 | 0.98 | 0.98 |
| Sparse Residential | 0.84 | 0.69 | 0.05 | 0.71 | 0.69 | 0.70 | 0.70 | 0.76 | 0.78 | 0.78 |
| Stadium | 0.57 | 0.81 | 0.08 | 0.62 | 0.85 | 0.86 | 0.86 | 0.78 | 0.80 | 0.80 |
| Storage Tank | 0.48 | 0.88 | 0.07 | 0.86 | 0.92 | 0.94 | 0.93 | 0.89 | 0.91 | 0.91 |
| Tennis Court | 0.72 | 0.80 | 0.03 | 0.38 | 0.77 | 0.78 | 0.78 | 0.70 | 0.69 | 0.68 |
| Terrace | 0.76 | 0.88 | 0.03 | 0.83 | 0.88 | 0.90 | 0.89 | 0.89 | 0.91 | 0.91 |
| Thermal Power Station | 0.72 | 0.68 | 0.04 | 0.47 | 0.78 | 0.78 | 0.78 | 0.74 | 0.76 | 0.76 |
| Wetland | 0.70 | 0.82 | 0.08 | 0.71 | 0.77 | 0.80 | 0.79 | 0.81 | 0.83 | 0.83 |
| Average | 0.821 | 0.798 | 0.097 | 0.736 | 0.840 | 0.857 | 0.855 | 0.838 | 0.856 | 0.855 |
| Dataset | # of Descriptors Used for Codebook | # of Descriptors Used for VLAD Computation | |||||||
|---|---|---|---|---|---|---|---|---|---|
| 50 | 100 | 150 | 300 | 50 | 100 | 200 | 300 | 400 | |
| UCM | 0.893 | 0.896 | 0.897 | 0.861 | 0.588 | 0.691 | 0.826 | 0.896 | 0.906 |
| SATREM | 0.880 | 0.876 | 0.879 | 0.884 | 0.710 | 0.794 | 0.844 | 0.876 | 0.878 |
| SIRI | 0.807 | 0.813 | 0.812 | 0.792 | 0.645 | 0.714 | 0.767 | 0.813 | 0.812 |
| NWPU | 0.838 | 0.840 | 0.851 | 0.858 | 0.798 | 0.832 | 0.842 | 0.840 | 0.842 |
| Dataset | , | , | , | |||||||
|---|---|---|---|---|---|---|---|---|---|---|
| DBOW | V-DELF | QE-S | QE-I | V-DELF | QE-S | QE-I | V-DELF | QE-S | QE-I | |
| UCM | 0.830 | 0.896 | 0.916 | 0.915 | 0.925 | 0.943 | 0.943 | 0.931 | 0.949 | 0.949 |
| SATREM | 0.933 | 0.876 | 0.895 | 0.894 | 0.892 | 0.910 | 0.910 | 0.897 | 0.913 | 0.913 |
| SIRI | 0.926 | 0.813 | 0.838 | 0.838 | 0.840 | 0.869 | 0.867 | 0.851 | 0.880 | 0.879 |
| NWPU | 0.821 | 0.840 | 0.857 | 0.855 | 0.856 | 0.878 | 0.876 | 0.848 | 0.873 | 0.871 |
| Dataset | VLAD Descriptor Size | ||||||
|---|---|---|---|---|---|---|---|
| 16,384 | 1024 | 512 | 256 | 128 | 64 | 32 | |
| UCM | 0.896 | 0.894 | 0.898 | 0.903 | 0.907 | 0.912 | 0.907 |
| SATREM | 0.876 | 0.876 | 0.880 | 0.884 | 0.887 | 0.889 | 0.885 |
| SIRI | 0.813 | 0.811 | 0.816 | 0.822 | 0.827 | 0.830 | 0.819 |
| NWPU | 0.840 | 0.858 | 0.862 | 0.865 | 0.866 | 0.859 | 0.818 |
| DB Size (# of Images) | RFM [63] | SBOW [10] | Hash [41] | DN7 [44] | DN8 [44] | DBOW [12] | V-DELF (16K) | V-DELF (1K) | V-DELF (512) | V-DELF (256) |
|---|---|---|---|---|---|---|---|---|---|---|
| 50 | 63.10 | 2.20 | 0.92 | 5.80 | 5.70 | 2.30 | 14.09 | 1.07 | 0.97 | 0.61 |
| 100 | 81.90 | 6.30 | 2.20 | 17.10 | 17.30 | 6.10 | 54.62 | 3.31 | 3.43 | 1.85 |
| 200 | 118.10 | 21.60 | 6.20 | 58.70 | 58.40 | 21.40 | 234.07 | 11.54 | 11.13 | 6.43 |
| 300 | 356.60 | 46.00 | 13.30 | 127.40 | 127.80 | 45.90 | 612.52 | 28.18 | 16.56 | 10.72 |
| 400 | 396.30 | 79.60 | 19.60 | 223.10 | 224.30 | 79.60 | 1032.22 | 49.01 | 29.72 | 14.87 |
| 500 | 440.50 | 124.20 | 29.90 | 346.00 | 344.90 | 123.90 | 1683.54 | 77.83 | 44.90 | 22.98 |
© 2019 by the authors. Licensee MDPI, Basel, Switzerland. This article is an open access article distributed under the terms and conditions of the Creative Commons Attribution (CC BY) license (http://creativecommons.org/licenses/by/4.0/).
Share and Cite
Imbriaco, R.; Sebastian, C.; Bondarev, E.; de With, P.H.N. Aggregated Deep Local Features for Remote Sensing Image Retrieval. Remote Sens. 2019, 11, 493. https://doi.org/10.3390/rs11050493
Imbriaco R, Sebastian C, Bondarev E, de With PHN. Aggregated Deep Local Features for Remote Sensing Image Retrieval. Remote Sensing. 2019; 11(5):493. https://doi.org/10.3390/rs11050493
Chicago/Turabian StyleImbriaco, Raffaele, Clint Sebastian, Egor Bondarev, and Peter H. N. de With. 2019. "Aggregated Deep Local Features for Remote Sensing Image Retrieval" Remote Sensing 11, no. 5: 493. https://doi.org/10.3390/rs11050493
APA StyleImbriaco, R., Sebastian, C., Bondarev, E., & de With, P. H. N. (2019). Aggregated Deep Local Features for Remote Sensing Image Retrieval. Remote Sensing, 11(5), 493. https://doi.org/10.3390/rs11050493