Article

Assessing the Uncertainties of Four Precipitation Products for Swat Modeling in Mekong River Basin

1
Nanjing Hydraulic Research Institute, Nanjing 210029, China
2
Ministry of Water Resources, Research Center for Climate Change, Nanjing 210029, China
3
College of Hydrology and Water Resources, Hohai University, Nanjing 210098, China
4
Institute of Hydrology and Water Resources, College of Civil Engineering and Architecture, Zhejiang University, Hangzhou 310058, China
*
Author to whom correspondence should be addressed.
Remote Sens. 2019, 11(3), 304; https://doi.org/10.3390/rs11030304
Submission received: 13 January 2019 / Revised: 30 January 2019 / Accepted: 30 January 2019 / Published: 2 February 2019
(This article belongs to the Section Remote Sensing in Geology, Geomorphology and Hydrology)

Abstract

:
Using hydrological simulation to evaluate the accuracy of satellite-based and reanalysis precipitation products always suffer from a large uncertainty. This study evaluates four widely used global precipitation products with high spatial and temporal resolutions [i.e., AgMERRA (AgMIP modern-Era Retrospective Analysis for Research and Applications), MSWEP (Multi-Source Weighted-Ensemble Precipitation), PERSIANN-CDR (Precipitation Estimation from Remotely Sensed Information using Artificial Neural Networks-Climate Data Record), and TMPA (Tropical Rainfall Measuring Mission 3B42 Version7)] against gauge observations with six statistical metrics over Mekong River Basin (MRB). Furthermore, the Soil and Water Assessment Tool (SWAT), a widely used semi-distributed hydrological model, is calibrated using different precipitation inputs. Both model performance and uncertainties of parameters and prediction have been quantified. The following findings were obtained: (1) The MSWEP and TMPA precipitation products have good accuracy with higher CC, POD, and lower ME and RMSE, and the AgMERRA precipitation estimates perform better than PERSIANN-CDR in this rank; and (2) out of the six different climate regions of MRB, all six metrics are worse than that in the whole MRB. The AgMERRA can better reproduce the occurrence and contributions at different precipitation densities, and the MSWEP has the best performance in Cwb, Cwa, Aw, and Am regions that belong to the low latitudes. (3) Daily streamflow predictions obtained using MSWEP precipitation estimates are better than those simulated by other three products in term of both the model performance and parameter uncertainties; and (4) although MSWEP better captures the precipitation at different intensities in different climatic regions, the performance can still be improved, especially in the regions with higher altitude.

Graphical Abstract

1. Introduction

Hydrological models are vital tools for water resources management and allocation policy development, and to assess the impact of climate change and human activities (e.g., land use change and dam construction) on water yield [1,2,3]. With the development of computer technology, more and more hydrological models have been developed and applied in various river basins all over the world [4,5]. In general, these models can be divided into two types, namely the lumped model and distributed hydrological model. Unlike the lumped models, which treat the entire basin as a homogeneous, requiring input basin average precipitation, temperature, and evaporation, distributed hydrological models often divide the study area into multiple sub-basins based on soil, land use, and topographic data that can better reflect the spatial distribution of precipitation and water cycle in different sub-basins [6]. Among these developed distributed models, SWAT (Soil Water Assessment Tool) has become the most widely used model in the hydrology department [7,8]. In the past few decades, different modules have been developed and coupled into SWAT to continuously improve this open sourced model, which have derived many different versions of model, and it has been successfully applied to the research of climate change [9], formulation of water resources management policies [10], and non-point source pollution [11] in various river basins around the world. It has also been selected by Mekong River Commission as one of the simulation tools in their model library since 2010 [12].
Precipitation is one of the main elements of the hydrological cycle, and therefore reliable and accuracy precipitation data plays a very important role in local water resources management, agricultural irrigation, urban water use and hydrological modeling [13,14]. Unfortunately, the measurement of precipitation is subject to greater uncertainty due to its high spatial and temporal variability [15,16,17]. Rain gauge is a traditional means of obtaining ground precipitation information, however, the traditional rainfall station network is sparse, and its point observation is also difficult to reflect the spatial distribution of precipitation [15,18,19,20]. For transnational rivers, collecting gauge observations is also very difficult from the management departments of different countries (e.g., Mekong River Basin which flows through six countries) [21]. The sparse and poor spatial representation of rain gauges can lead to inaccurate precipitation inputs to hydrological models, especially for a larger study area with complex topography and climate like Mekong River Basin [22]. Fortunately, satellite remote sensing provides a large amount of observation data (e.g., precipitation, soil moisture, evapotranspiration, and temperature), which have finer resolutions both at spatial and temporal to support hydrological simulation of large-scale study areas around the world [23,24,25]. In recent years, satellite observation-based and reanalysis precipitation have made great progress, and many of them have been used as a supplement to gauge observation data for hydrology and water resources research [15]. More and more satellite-based and reanalysis precipitation estimates have been developed, which are freely downloaded for researchers online at finer spatial and temporal resolutions, such as Tropical Rainfall Measuring Mission (TMPA, [26]), Precipitation Estimate from Remotely Sensed Information using Artificial Neural Networks-Climate Data Records (PERSIANN-CDR, [13]) and Multi-Source Weighted-Ensemble Precipitation (MSWEP, [27]). However, these precipitation products are inevitably subject to significant uncertainties due to insufficient gauge adjustment, complex climate and topographic features, sampling errors and algorithm defects [13,15,26,28]. Furthermore, as pointed out by Yong et al. [29], error components of satellite-based precipitation estimates vary in different climate zones and topographic areas. Therefore, evaluating the accuracy of these precipitation estimates in different climatic regions, and their uncertainties for hydrological simulation are crucial for obtaining reliable results, which is important for data developers.
Numerous studies have been conducted to evaluate satellite-based and reanalysis precipitation products in the Mekong River Basin (MRB) by using statistical and hydrological simulation approaches. Several studies directly compared the satellite-based and reanalysis precipitation estimates (i.e., APHRODITE, CMORPH, TRMM, and CRU) with gauge observations, and they found that the APHRODITE product, which provides daily precipitation from 1951 to 2007, has the highest correlations and highest probability of detections with the daily gauge observations [21,30]. In terms of evaluating the capacity of precipitation products to reconstruct the streamflow process using hydrological model, Lauri et al. [31] and Chen et al. [30] found that APHRODITE can reproduce the daily streamflow process of main stream of the MRB, while CMORPH and TRMM may need further corrections.
However, there are several necessary factors worth further analyzing. Firstly, these preexisting studies often evaluate the performance of precipitation products by treating the study area as a whole or simply dividing the study area into several sub-regions according to the location of hydrological stations. Few studies have analyzed the performance of satellite/reanalysis precipitation estimates in different climatic zones over the Mekong River Basin. Secondly, previous studies mainly focus on the capacities of precipitation products to reconstruct the streamflow process compared with gauge observations, such as calibrating the model using each precipitation product or use parameters calibrated by gauge observations with different precipitation inputs. Moreover, questions remain as to the analysis of the uncertainty of model parameter with different precipitation inputs. Thirdly, most of the previous studies have found that precipitation estimates of APHRODITE, which was developed by the Japan Meteorological Agency (JMA) and it can well represent the temporal and spatial characteristics of precipitation in the Mekong River Basin. However, APHRODITE only provides precipitation estimates until 2007, which will hinder the analysis of the temporal and spatial evolution of precipitation over the past 10 years in the Mekong River Basin. Furthermore, considering that the Mekong River flows through six countries and it has complex climate and topographical features, a long sequence of more accurate precipitation estimates is urgently needed.
Therefore, the objectives of this study are as follows: (1) To evaluate the accuracy of satellite/reanalysis precipitation products over the whole MRB and different climatic zones using multiple statistical metrics; (2) to investigate the impact of different precipitation inputs on SWAT modeling over StungTreng station, and (3) to estimate parameter and streamflow simulation uncertainties using the four precipitation inputs.

2. Study Area and Datasets
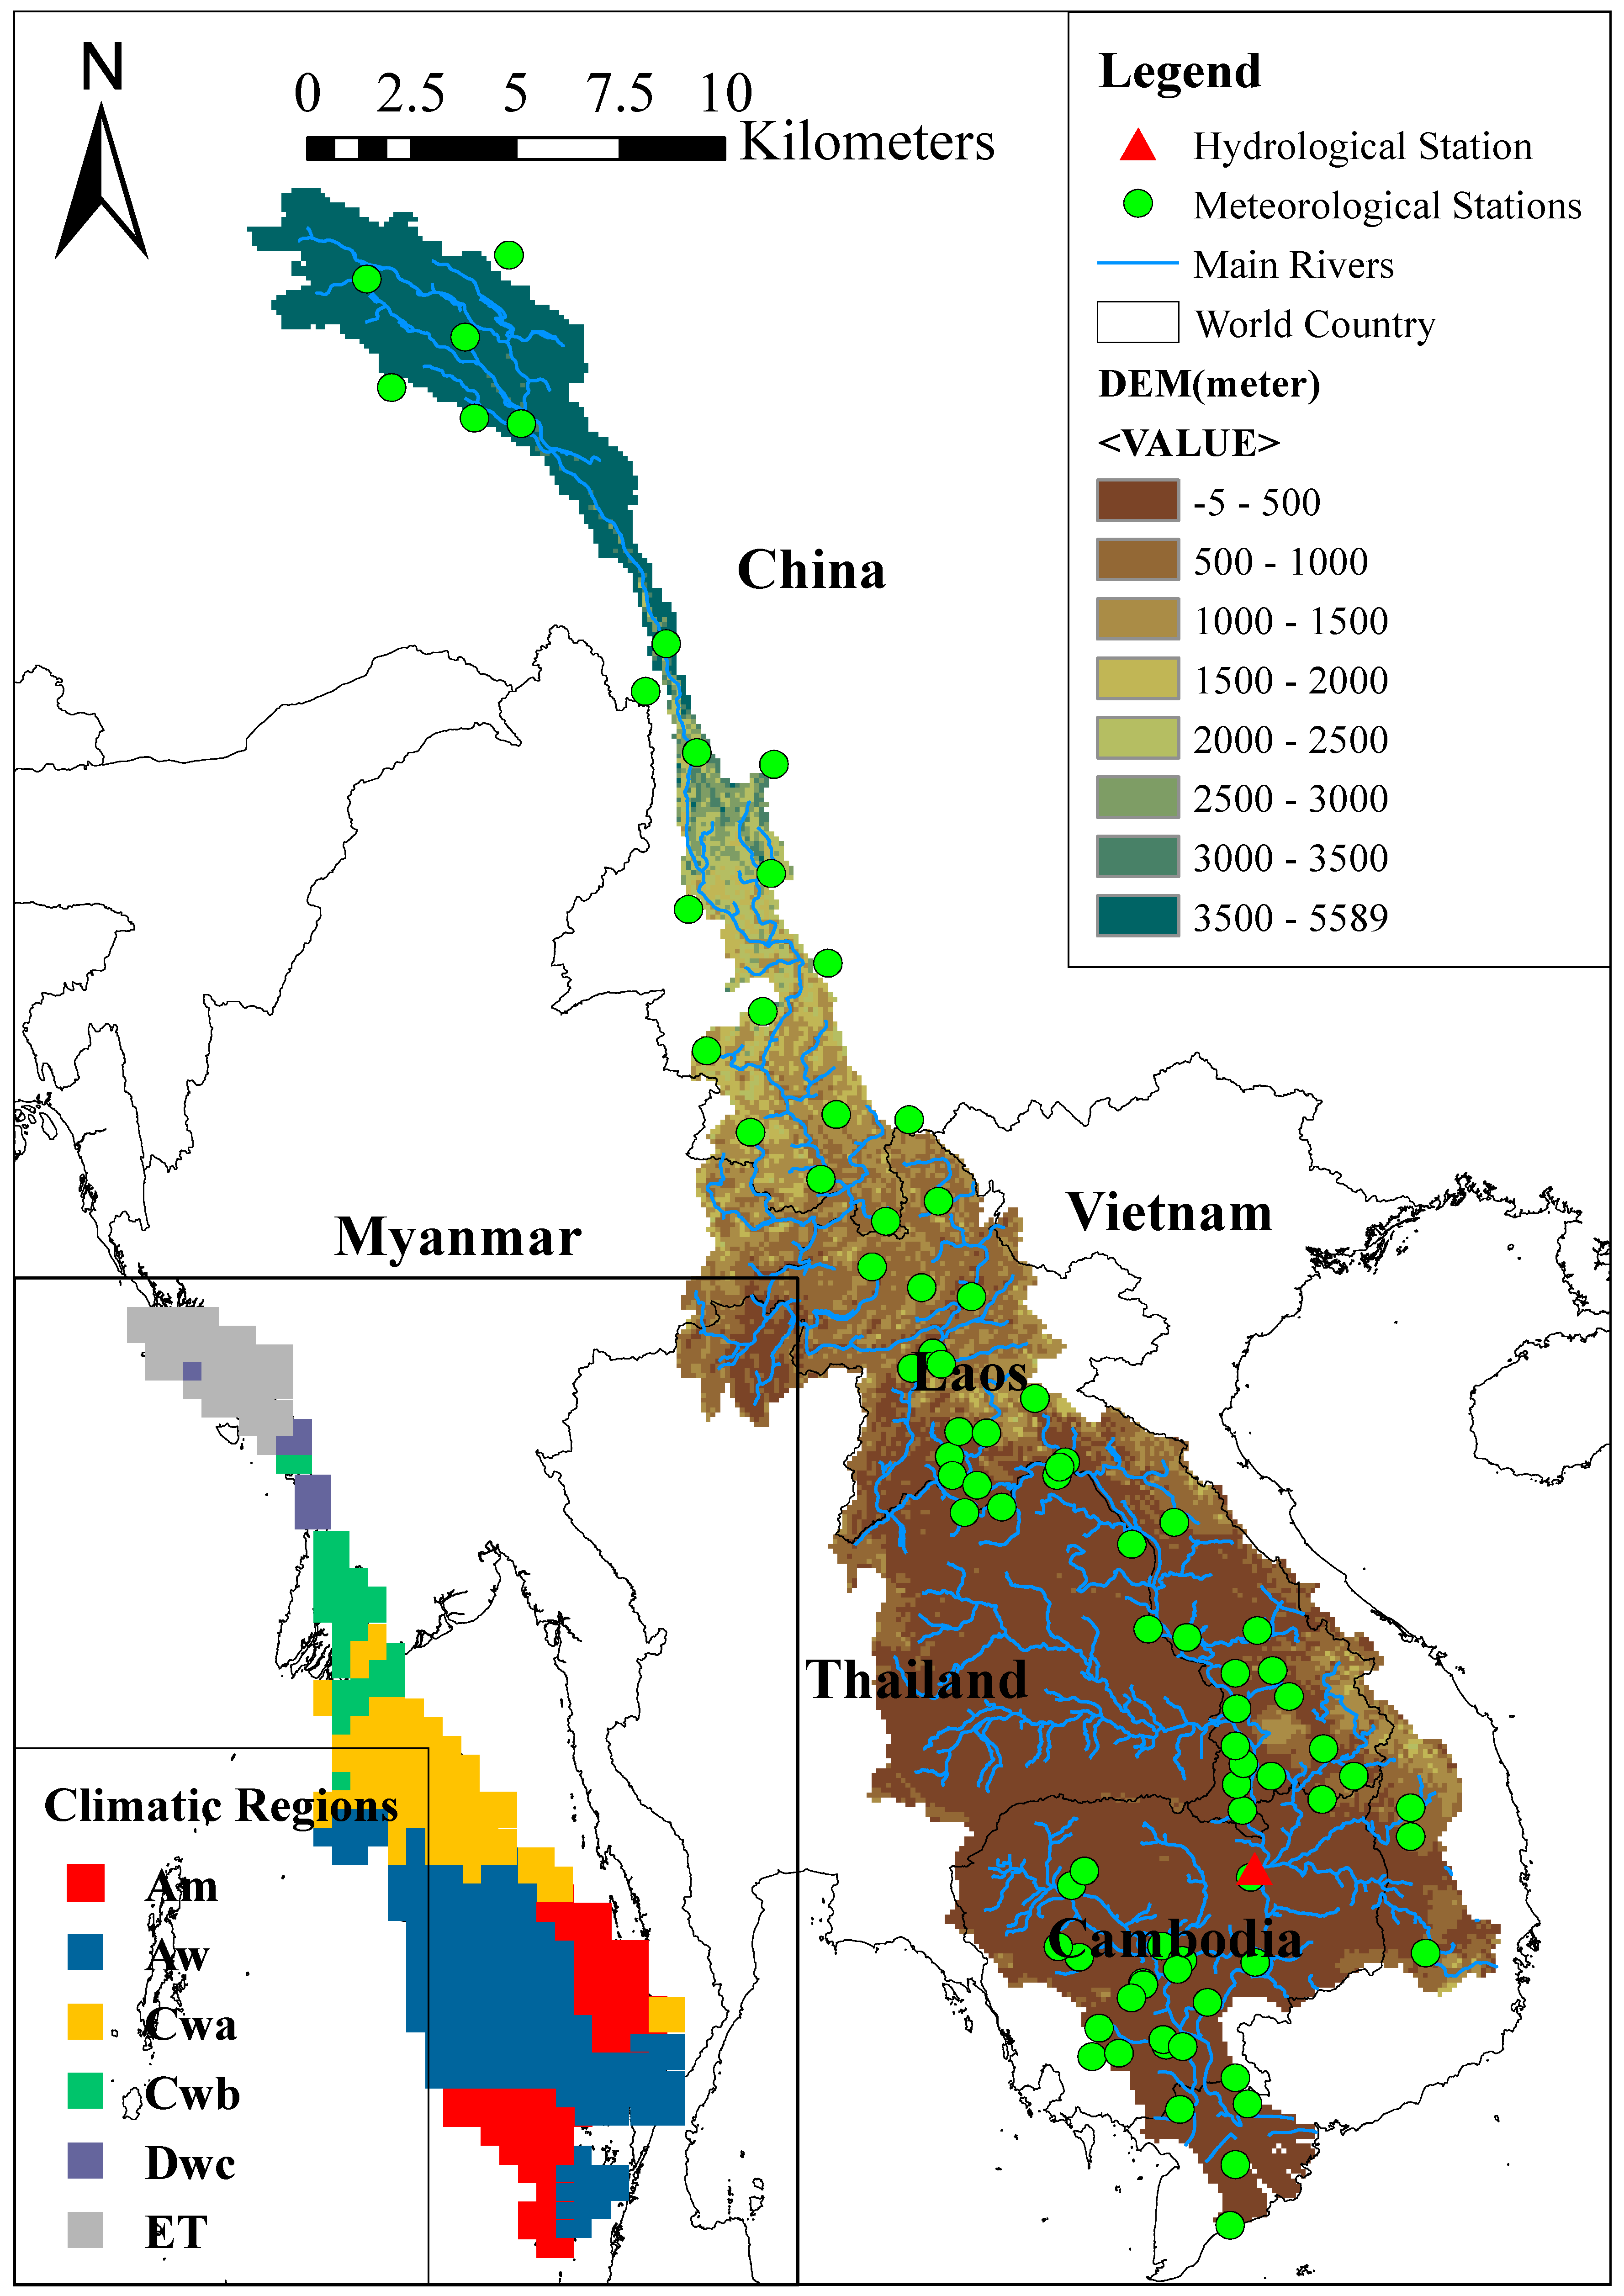
2.1. Study Area

The Mekong River Basin (MRB) is located in the South-East Asia and has a drainage area of 795,000 km2 (Figure 1). It is the tenth longest river in the world and largest cross-border river in Asia. The MRB originated in the Qinghai-Tibet Plateau of China, and flows through six countries from North to South (i.e., China, Laos, Myanmar, Thailand, Vietnam, and Cambodia), then finally flowing into the South China Sea in the Southernmost city of Ho Chi Minh City, Vietnam [32,33]. The upper reaches of MRB (UMB), also known as the LanCang River located in China, with a river length of ~2139 km, flows through Qinghai Province, Tibet Autonomous Region and Yunnan Province, and it has a drainage area of ~195,000 km2 (~ accounts for 24% of the entire MRB). The lower reaches of MRB (LRB), flows through other five countries, with a river length of ~2770 km, and it has a drainage area of ~600,000 km2 (~ accounts for 76% of the entire MRB). The MRB contains seven broad physiographic regions featuring diverse topography, drainage patterns, and geomorphology: The UMB contains the Qinghai-Tibetan Plateau, Three Rivers Areas, and LanCang River Basin, and the Northern Highlands, Khorat Plateau, Tonle Sap Lake, and Mekong Delta make up the LRB.
The climate of the MRB ranges from temperate to tropical. Some of the high mountains are covered by permanent glaciers and snow in the URB, flow in the dry season of MRB is mainly fed by snow and glacier melt water, especially for the middle reaches. The climate of the LRB is often tropical with more precipitation and higher temperature. Average annual precipitation of the MRB ranges from as little as 600 mm in the URB to more than 3000 mm in the LRB. Influenced primarily by southeast monsoons, streamflow of the MRB has significant flood and dry season periods, in which flood season extending from June to November accounts for 80% to 90% of the annual flow, while the dry season only accounts for the rest of the 10~20 percent. Average annual streamflow of the MRB is 13,300 m3/s (over Stung Treng station from 1910 to 2012). The sub-figure in the lower left corner of Figure 1 is climate classification of the MRB, which was downloaded from http://koeppen-geiger.vu-wien.ac.at/present.htm. This climate classification method is based on recent data from the Climatic Research Unit (CRU) of the University of East Anglia and the Global Precipitation Climatology Centre (GPCC), and this method has been widely used in the field of climate change and hydrology [34]. According to this climate classification method, the climate of MRB is divided into six types, which is shown in Figure 1 (i.e., Am, Aw, Cwa, Cwb, Dwc, and ET).

2.2. Geographical Data

The DEM (digital elevation model) data with 90 m spatial resolution was collected from National Aeronautics and Space Administration Shuttle Radar Topographic Mission (NASA-SRTM) at http://srtm.csi.cgiar.org/SELECTION/inputCoord.asp. The soil data used in this study is Harmonized World Soil Database v 1.2 with 1 km spatial resolution, which was downloaded from Food and Agriculture Organization of the United Nations, and this soil dataset contains two layers, namely top soil and subsoil [35]. The land use data with 1 km spatial resolution was downloaded from Global Land Cover 2000 (http://bioval.jrc.ec.europa.euproducts/glc2000/products.php).

2.3. Precipitation Products

In this study, five precipitation datasets from 1998–2007 were used for SWAT modeling (Table 1). These precipitation data can be divided into three categories based on their sources: (1) Observed precipitation data from gauges observations which were downloaded from China Meteorological Data Sharing Service System (CMDSS; http://data.cma.cn/) and Mekong River Commission (MRC; http://www.mrcmekong.org/); and (2) One reanalysis precipitation products: AgMRRA [36], which provides all meteorological datasets for SWAT modeling other than precipitation. This reanalysis precipitation product has been selected because it consists of daily wind speed, maximum/minimum temperature, relative humidity, and solar radiation. (3) Three satellite precipitation products: MSWEP [27], which represents one of the latest remote sensing fusion datasets; PERSIANN-CDR [37], which has been widely proven to have better accuracy in multiple watersheds around world [13,15]; and TMPA satellite precipitation, which has derived many other precipitation products [38].

2.3.1. In Situ Gauge Data

The situ gauge precipitation data for the URB was collected from China Meteorological Data Sharing Service System (CMDSS), which includes daily precipitation with the period of 1998 to 2007. Furthermore, the other daily precipitation were obtained from MRC historical observation dataset. We have deleted those stations that continuously missing 1-year data and inverse distance weighted interpolation method have been used to fill in missing data. Finally, as shown in Figure 1, 82 precipitation stations data were used as a baseline to evaluate the other four reanalysis/satellite-based precipitation products. Daily streamflow data were obtained from one station on the main stream of MRB, namely Stung Treng. The control area of Stung Treng station is 635,000 km2 [39]. The reason we chose this station is that the streamflow at downstream of Stung Treng is significantly affected by storm surges, tides, and sea levels rise, and the complex flood propagation due to the delta system and reserved flow of the Tonle Sap lake [40].

2.3.2. AgMERRA Dataset

The AgMERRA climate forcing datasets were developed as part of the Agricultural Model Intercomparison and Improvement Project (AgMIP) to provide daily time series with the period of 1980–2010 at the global scale [41]. The AgMERRA products provide daily precipitation, maximum/minimum temperature, relative humidity, and solar radiation at the spatial resolution of 0.25°, which are additional meteorological data that are useful for SWAT model in MRB. MERRA-Land product has been incorporated into AgMERRA, which has substantially improved the resolution of the daily precipitation distribution and extreme precipitation over other datasets, and it also utilizes the NASA/GEWEX solar radiation budget data to improve the solar radiation values. More details about AgMERRA algorithms can be found in Reference [42] and Ruane, Goldberg and Chryssanthacopoulos [41]. The AgMERRA daily precipitation, maximum/minimum temperature, relative humidity, wind speed, and solar radiation were obtained from National Aeronautics and Space Administration at https://data.giss.nasa.gov/impacts/agmipcf/agmerra/. In the later model evaluation and uncertainty analysis, we only changed the precipitation input, while other meteorological data remained unchanged.

2.3.3. MSWEP Dataset

The Multi-Source Weighted-Ensemble Precipitation (MSWEP) is a new precipitation product that merges gauge observations and satellite/reanalysis precipitation which developed by Beck et al. [27] in European Commission (Italy), at the spatial resolution of 0.1°/0.25° for the global coverage from 1979 to present. The latest product version is MSWEP 2.1, which based on the recently released CHPclim dataset (Climate Hazards Groups Precipitation Climatology) but instead of more accurate regional datasets where available [27,43]. A correction method has been conducted which considered inferring catchment-average precipitation from mean streamflow observations at 13,762 stations to eliminate the gauge under-catch and orographic effects. The variability of MSWEP precipitation was determined by weighted average of seven precipitation products; two based on atmospheric model reanalysis precipitation products (JRA-55 and ERA-Interim), three of them are satellite-based precipitation products (CMORPH, GSMaP-MVK, and TMPA), the other two are solely based on interpolation of gauge-based observations [27]. Finally, the MSWEP precipitation product was adjusted against four state-of-the-art gauge-based datasets that contain GPCP-1DD, WFDEI-CRU, CPC Unified, and TMPA 3B42.

2.3.4. PERSIANN-CDR Dataset

The Precipitation Estimate from Remotely Sensed Information using Artificial Neural Networks-Climate Data Records (hereafter abbreviated as PERSIANN-CDR) is a multi-satellites high spatial and temporal resolution precipitation product developed by using PERSIANN algorithm based on GridSat-B1 infrared satellite data, and the stage IV hourly precipitation data of NCEP was used to train the artificial neural network [15,37]. The PERSIANN-CDR provides long-term (from 1983 to delayed present) daily precipitation estimates at 0.25 degrees spatial resolution. The precipitation finally corrected by using 2.5 degrees monthly products of GPCP (Global Precipitation Climatology Center) that contains gauge information from GPCP, as the result, the precipitation estimates of PERSIANN-CDR that are consistent with GPCP 2.5 degrees monthly data [37].

2.3.5. TMPA Dataset

The Tropical Rainfall Measuring Mission Multi-Satellite Precipitation Analysis Products 3B42 Research Version 7 (hereafter abbreviated to TMPA in this paper) was used as the last satellite precipitation in this study. TMPA dataset was originally developed by National Aeronautics and Space Administration (NASA) and the Japan Aerospace Exploratory Agency (JAXA) at high spatial (0.25 degree) and temporal resolution (3 h). On a global scale, this dataset provides precipitation estimates between 50°S to 50°N from 1998 to October 2014, which combined satellite remote sensing data from various sensors and Global Precipitation Climatology Center (GPCC) monthly gauge observations. Numerous published papers have evaluated the performance of TMPA by directly comparing with gauge observations or using hydrological modeling [15,43,44]. However, there are relatively few studies that consider the uncertainty of TMPA in hydrological modeling [45].

3. Methodology

As described in Section 2.1, the MRB flows through six climatic zones, and precipitation has different temporal and spatial characteristics in different climatic regions [46]. Therefore, the evaluation of precipitation products was conducted in six different climatic zones. Firstly, 82 pixels that contain at least one gauge were used to evaluate the performance of the four precipitation products. The daily gauge observations in the pixel were considered as the baseline for comparing with precipitation products. Comparison was conducted by using statistical methods and SWAT modeling that considers the parameters uncertainties [47,48].

3.1. Statistical Methods

To quantitatively evaluate the accuracy of the four precipitation products (i.e., AgMERRA, MSWEP, PERSIANN-CDR, and TMPA) compared with the gauge observations, the Correlation Coefficient (CC), Root Mean Square Error (RMSE), and Relative Error (RE) were used in this study. The detailed meaning and calculation formula of these three indicators can be found in Table 2 and other literature [15,18,49]. In order to evaluate the accuracy of precipitation products for different levels, we divided the daily precipitation into seven classes (i.e., 0, 0~1, 1~5, 5~10, 10~15, 15~20, >20 mm/day). It should be noted that the assessment of precipitation in different climatic regions was based on the average of gauge observations and each precipitation products in each region.

3.2. SWAT Model

3.2.1. Model Description

The Soil and Water Assessment Tool (SWAT) is used in this study because it has been successfully applied all over the world. This model is a comprehensive, continuous-time, process-based, and semi-distributed macroscale model that has a large number of parameters to be calibrated [50]. It was proposed by Agricultural Research Service of the United States Department of Agriculture (USDA-ARS) to evaluate the effects of water management policies and non-point source pollution [6,45], which also has been improved by scholars from all over the world, resulting in many versions of the SWAT model. It can be used to simulate the variability of hydrological processes, vegetation growth, erosion, agricultural non-point source pollution, and water resources management [1,15]. It discretizes the study basin into several sub-basins based on the DEM and slope data, and subsequently, each of sub-basins will be divided into more than one HRU (Hydrologic Response Units) according to land use, soil characteristic, and topography data. The calculation of the internal hydrological cycle of the model is based on water and energy balance, which are determined by meteorological inputs such as precipitation, maximum/minimum temperature, solar radiation, wind speed, and relative humidity at different time steps. The quantity of water, contaminants, and sediment are calculated at each sub-basin based on the daily/sub-daily inputs, and then these loads are routed into the main stream and reservoirs within the study basin by using Muskingum method. More theories about this model can be found in other literature [15,45,51] and the official model manual [8].

3.2.2. Model Setup

The version SWAT2012 (developed by USDA-ARS located in Maryland, United States) coupled with ArcGIS Version 10.2 (developed by Environmental Systems Research Institute located in California of United States) was used to set up the model for the one selected hydrometric station, namely Stung Treng. The MRB over the Stung Treng has been divided into 397 sub-basins and further divided into 1499 HRUs based on the soil and land used datasets. The categories of slope used in the HRU definition are: 0~5%, 5~10%, 10~15%, and >15%. The soil data used in this study is reclassified into 16 types, and the land use data was reclassified into five types according to the database provided by the SWAT model. The detailed input data of the model are shown in Table 1. Daily gauge-based precipitation data obtained from 82 rain gauges (18 rain gauges located in China and the others located in Laos, Myanmar, Thailand, Cambodia, and Vietnam; see Figure 1) for the period of 1998 to 2007. In this study, consider the impact of altitude on the rainfall and temperature in the upper alpine region, five elevation bands have been applied in the modeling that can modify the regional precipitation and temperature by weighting the difference of elevation bands [50]. More information about the elevation bands in SWAT model can be found in other literature [45,51] and the SWAT model’s official document [8].

3.2.3. Model Calibration and Uncertainty Analysis

In this study, the first two years (1998 to 1999) were used as the warm-up period to reduce the impact of the initial state of the model. For each model simulation, daily-simulated streamflow of the selected hydrometric station has been calibrated individually using the period of 2000 to 2003 and then validated in the time period 2004 to 2007, based on the daily observed streamflow of Stung Treng (Figure 1). In this study, the model is calibrated by using a separate software named SWAT-CUP (SWAT Calibration and Uncertainty Program) [50]. Five uncertainty methods are provided in SWAT-CUP (i.e., SUFI-2, GLUE, Parameter Solution, MCMC and PSO) [52]. The SWAT model was calibrated by using SUFI-2 in this study because of its efficiency in calculation and simplicity in data preparation. It was also found to be suited for global optimization and uncertainty analysis [53]. Before calibration, parameter sensitivity analysis has been conducted by using the one-at-a-time and global sensitivity analysis (500 times) methods coupled in SWAT-CUP for 24 common sensitive parameters according to the other literatures [15,50]. After the parameter sensitivity analysis, the SWAT model was started with the initial ranges of more sensitive parameters, which is shown in Table 3, and the model was calibrated with three iterations. The upper and lower bounds of the parameters are qualified to be physically reasonable based on literature [45,52] and the SWAT model official documentation [8]. Two thousand simulations were run in each iteration, after each iteration, a set of new parameters ranges was given by SUFI-2 (normally narrowed down). The next iteration was executed based on the new parameter ranges. Detailed information about SUFI-2 and the protocol to calibrate SWAT can be found in Abbaspour et al. [1] and Tuo et al. [45].
There are multiple metrics in SWAT-CUP to evaluate the model performance. This study followed the approach suggested by Abbaspour et al. [1]. The 95PPU has been used to evaluate the performance of SWAT, which accounts for the parameter uncertainty and 95PPU (95% prediction uncertainty) of the outputs. The Nash Sutcliffe coefficient (NSE) [54], the coefficient of determination (R2) and percent bias (PBIAS) have been used as the indicators for the best simulation within the 2000 simulations. The NSE was used to measure the quantity difference between the observed streamflow and simulated values, with NSE=1 means the best simulation result, while the R2 represents the change trends similarity between the simulated streamflow and observed ones, with R2=1 meaning the better simulation result. The PBIAS is used to estimate the average tendency of simulated streamflow, and its optimum value is 0, where positive values mean model underestimation and vice versa. The formulas of NSE, R2, and PBIAS are listed in Table 2.
As stated in Abbaspour et al. [1] and Tuo et al. [45], parameter uncertainties are described as the final ranges of the sensitive parameters with which the SWAT model achieve a satisfactory result [55,56]. Thus, these output uncertainties can be calculated at 2.5% and 97.5% levels of the distribution for a specific variable, which propagated from the parameters uncertainties by using Latin hypercube sampling method. In this study, the uncertainty analysis of SUFI-2 is based on a Bayesian framework through the sequential and fitting process, which is represented by an envelope of good simulations decided by 95PPU. To quantify the degree of the prediction uncertainties, two indices are used in this study, namely P-factor and R-factor [57]. The P-factor is used to represent the percentage of observed variable bracketed by 95PPU, and its range is zero to one, where one is the best result that represents 100% of the observed variables are surrounded by the model simulation uncertainty. The R-factor is equal to the ratio of the mean thickness of 95PPU and the standard deviation of the observed variable, and it ranges from zero to infinity in which zero is the optimal value. Generally, a P-factor of 1 and R-factor of zero means a perfect simulation that matches the observed variable, which is difficult to achieve due to the uncertainties from multiple sources and measurement errors [52]. As suggested by Abbaspour et al. [1], P-factor > 0.7 and R-factor < 1.5 are considered as acceptable simulation results for streamflow. The P-factor and R-factor can be calculated as follows:
P = n i n N × 100 %
R = 1 N i = 1 N ( q u q l ) i σ q
where N is the total number of observed variables, n i n is the observed data bracketed by 95PPU, q u and q l are the upper and lower of the simulated data, and σ q is the standard deviation of the observed variable q .

4. Results

4.1. Evaluation of the Performance of Four Precipitation Products

4.1.1. Evaluation in the Whole Mrb

Figure 2 shows scatterplots of precipitation estimates’ comparisons for MRB at a daily scale between AgMERRA, MSWEP, PERSIANN-CDR, TMPA, and gauge observations. As shown in Figure 2, daily MSWEP and TMPA agree well with gauge observed precipitation over the whole MRB, and the other products are slightly inferior. A summary list of six metrics for four precipitation products at daily resolution over the whole MRB is shown in the upper left corner of Figure 2. These indices were calculated based on the arithmetic mean of gauge observations and pixel estimates over the whole MRB. Generally, PERSIANN-CDR overestimated daily precipitation slightly (with the positive ME = 0.25) while the other three products have an underestimated trend. TMPA has the lowest ME and RMSE and the highest CC, and the POD, FAR and CSI (0.93, 0.05 and 0.89, respectively), indicating that TMPA can capture most precipitation events over the whole MRB. Among these four precipitation products, PERSIANN-CDR has the lowest CC but has the highest POD, which means that PERSIANN-CDR estimates the occurrence of rain events in MRB is the best.
The intensity distributions of daily precipitation at different magnitudes have been used in many articles to evaluate the performance of satellite/reanalysis precipitation products with gauge observations [18,58]. This method is suitable for evaluating the ability of satellite/reanalysis precipitation products to detect light and high precipitation in different climatic zones. The occurrence and contribution of daily precipitation with different intensities (i.e., 0~0.1, 0.1~1, 1~5, 5~10, 10~20, and >20 mm/day) were calculated over one pixel with at least one gauge from 1998 to 2007 (Figure 3). For the whole MRB, the highest occurrence of rainfall is 1~5 mm/day, which accounted for 15.5% of total rainfall, and the AgMERRA showed a little overestimation in this intensity both at the occurrence and contribution, while the other three precipitation products are opposite (except for the contribution of MSWEP has a slight overestimation). For the daily precipitation with the range of 0~0.1 mm, the PERSIANN-CDR has the best performance to estimate the occurrence, the MSWEP showed an obvious overestimation. For daily precipitation ranging from 0.1 to 1 mm, the four precipitation products are all good for rainfall estimates both at occurrence and contribution. For the bin of daily precipitation ranging from 5 to 10 mm, the PERSIANN-CDR is basically consistent with the gauge observations (have almost equal indicator value). For daily precipitation larger than 20 mm, all four precipitation products tend to overestimate the occurrence and contribution, of which the AgMERRA had the largest overestimation. In conclusion, the daily PERSIANN-CDR can reproduce the occurrence and contribution structures of various precipitation intensities, particularly for the slight (0~0.1 mm/day) and heavy (10~20 mm/day) precipitation, which performs better than the other three products. For the occurrence of daily precipitation ranging from 0 to 0.1 mm, the latest product MSWEP has a great overestimation, which should be noted by the dataset developer.

4.1.2. Evaluation in Different Climatic Zones

Regional comparison over six different climatic zones was also conducted to show the error characteristics of AgMERRA, MSWEP, PERSIANN-CDR, and TMPA over the MRB comprehensively. In general, all six metrics of four precipitation products in six different climatic zones were worse than those for the whole MRB (Table 4) which means that different precipitation products may have different performances in different climate zones, as using more site aggregates to assess precipitation may neutralize certain errors. The MSWEP has the best metrics in ET, DWC, AW, and AM, corresponding to the upstream and downstream of the MRB, where have relatively dry and wet climates. The CC in the above climatic zones for MSWEP was greater than 0.6, and POD was greater than 0.79. For CWB, and CWA, AgMERRA has the best performance with the higher CC, POD, and CSI. Most metrics of the four precipitation products are worst in DWC compared with other climatic regions, the possible reason is the special geographical location of the region, and the assessment of snowfall by these products may be inaccurate, another reason may be that there is only one rainfall gauge located in this climatic zone. ET and DWC correspond to the drier and colder among the six climatic zones, in which the four precipitation products overestimated precipitation with positive ME except for AgMERRA in ET, while in other four relatively humid areas most of the precipitation products have different overestimation with negative ME and RMSE. For the POD and CSI, it becomes larger when the climate becomes humid, which means that the precipitation products are more accurate for detecting the occurrence of precipitation in wetland areas. PERSIANN-CDR and TMPA have poorer performance in ET, DWC, CWB, and CWA compared with the other two climatic zones.
Like the assessment over the whole MRB, the intensity distribution of daily precipitation at different thresholds as well as their relative contributions to the total precipitation in the six different climatic regions were also conducted to reveal the error characteristic of AgMERRA, MSWEP, PERSIANN-CDR, and TMPA (Figure 4). As shown in Figure 4, different precipitation products have different optimal performances in each climate region due to the unique data sources and their deviation correction algorithms. For the daily precipitation ranges from 0~0.1 mm, the AgMERRA product showed the best performance over the six climate regions both at the occurrence and contributions compared with the gauge observations. In the ET region representing cold climate, the AgMERRA product has a more accurate estimation of each intensity precipitation compared with the other three products, the MSWEP and PERSIANN-CDR underestimated the occurrence of 0.1~1 mm/day, but greatly overestimated the contributions of larger precipitation (10~20 mm/day, >20 mm/day), the TMPA product had a slight underestimation and overestimation for the occurrences of 0.1~1 mm/day and the contributions of >25 mm/day, respectively. For the region Dwc, all four precipitation products have an underestimation for the occurrence of 0~0.1 mm/day, for the density of greater than 20 mm/day, the MSWEP has a great overestimation at the occurrence and contributions compared with the gauge observations. It should be noted that, although PERSIANN-CDR and TMPA are more accurate in estimating the occurrence and contribution rate of precipitation of different intensities, it has a relatively low correlation coefficient with gauge observations (Table 4), which may be related to its erroneous evaluation of the occurrence time of precipitation. For the region Cwb, in addition to the overestimation of the occurrence of 0.1~1 mm/day, other products are relatively accurate in estimating daily precipitation at different densities. For the region Cwa, four precipitation products have relatively good estimates, both for the occurrence and contributions at different intensities. For the region Aw and Am, which also mean humid areas, the four precipitation all have larger contributions than gauge observation in the density of greater than 20 mm/day except PERSIANN-CDR in Aw, for the intensity of 10~20 mm/day, the AgMERRA, MSWEP, and TMPA slightly underestimate the occurrence and contributions, while the PERSIANN-CDR performs better.

4.2. Model Calibration and Validation

SWAT model was calibrated using the gauge observations, AgMERRA, MSWEP, PERSIANN-CDR, and TMPA and the daily streamflow from 1998 to 2003 with the first two years for warming-up the model [57]. The NSE, R2, and PBIAS were used to evaluate the model performance, which has been calculated in Table 5. From the Table 5, we can see that all the five precipitation inputs can reconstruct the daily streamflow in MRB both at calibration and validation periods, in which the performance of TMPA in the calibration period and Gauge observations in the validation period are the best with the NSE and R2 = 0.94. For the gauge observations simulation results, we can see that its Nash coefficient reaches 0.92 and 0.94 in calibration and validation period respectively. The result indicates that SWAT model has a good capacity to simulate the daily streamflow of the MRB, which also provides a basis for our subsequent research. For the values of PBIAS, it is easy to find that the PBIAS values of four precipitation products simulation results are greater than gauge observations simulated, which means that there is a large uncertainty in the simulated streamflow of the four precipitation products, among which the AgMERRA has the largest PBIAS (14.1%).
The simulation results of five precipitation inputs including gauge observation for different percentile streamflow processes are also analyzed. Figure 5 shows box plots of daily observed and simulated streamflow during the calibration and validation periods. From the left panel of Figure 5, we can see that gauge observations precipitation can best simulate the large streamflow, while the other four precipitation products have a greatly underestimation trend. For the low-streamflow process, the simulated results by using gauge observations are slightly large while the AgMERRA and TMPA simulation values are significantly lower compared with the gauge observed streamflow. Considering the simulated results of precipitation products on different percentile streamflow, the MSWEP showed the best performance compared with the other precipitation products. In the validation period, the streamflow simulated by AgMERRA and TMPA also underestimate the low streamflow, while the gauge precipitation simulated was overestimated.

4.3. Parameters and Prediction Uncertainties

Table 6 shows the P and R values, which represent the uncertainty of multiple simulations. For the value of P, streamflow simulated by the four precipitation products can all reach good results, in which MSWEP has the best performance with the P equal to 0.99 that means 99% of observed streamflow data were enveloped by 95PPU. Considering the thickness of 95PPU (R values), PERSIANN-CDR performs best compared with the other three products. In general, all four precipitation can achieve good results considering the prediction uncertainty following the criteria suggested by Abbaspour et al. [1].
It can be seen from the above studies that, although the model simulation has achieved good results, different rainfall products have different performances in different climate regions, which means that there are large uncertainties in the parameters of the model simulation process. Figure 6 shows 6 of the 10 parameters we calibrated which are more sensitive, among these parameters, CN2 has been confirmed by many studies as the most sensitive parameter in different study areas and it mainly controls the production of surface runoff [1,9,51]. Different precipitation inputs result in different CN2 ranges, among which the most similar ranges compared with gauge simulations is MSWEP (0.03 to 0.09 vs 0.01 to 0.17), while the greatest difference can be observed in AgMERRA (−0.44 to 0.12). ALPAH_BNK is the baseflow alpha factor for bank storage, and it displays a larger variability compared with CN2 in both the best simulation values and parameter ranges for four different precipitation inputs. Sol BD, responsible for the moist bulk density of the two soil layers, shows a smaller variability compared with CN2 and ALPHA_BNK except for AgMERRA. Therefore, SOL_BD of simulations of MSWEP, PERSIANN-CDR, and TMPA are less impacted by changes of precipitation input, while for AgMERRA product, its soil runoff process is quite different from the gauge simulations. CH_K2 is a very important parameter related to the effective hydraulic conductivity in main channel alluvium. Different precipitation products result in different best CH_K2 values and ranges (67.8, 121.0, 142.3, 164.9, and 236.5 for gauge, AgMERRA, MSWEP, PERSIANN-CDR, and TMPA, respectively). GW_REVAP is responsible for water exchange between shallow aquifers and vegetation roots. The GW_REVAP of AgMERRA and MSWEP are closest to the gauge calibrated value in terms of the parameter’s optimal values and ranges. ESCO is the soil evaporation compensation factor, which accounts for the evapotranspiration process from soil moisture to atmosphere. The optimal ESCO value of PERSIANN-CDR is much lower than Gauge simulation results, which means that simulated evapotranspiration is greater (Table 3).
In conclusion, considering the uncertainty of the model parameters, the runoff simulation of MSWEP is the best, because the optimal parameters and parameter range determined by it are the closest to the gauge observations simulated results. The results also show that different precipitation inputs have an impact both on the parameter ranges and the best calibrated value of them. However, in order to make the simulated streamflow more in line with the observed streamflow process, the internal algorithm of SWAT-CUP will adjust parameters, which control different components of hydrological processes (e.g., potential evapotranspiration and surface runoff). Table 7 shows the different components of the hydrological process calibrated by five precipitation inputs (including the gauge observations). From Table 7, we can see that, although the precipitation inputs and parameter values are very different, similar main hydrological variables are adjusted based on the observed streamflow using SWAT-CUP [1,45]. Therefore, when using the observed streamflow data to calibrate hydrological model, more other datasets (e.g., glacier data, soil moist data, potential evapotranspiration data) should be used to validate it [45,51].

4.4. Simulation with Fixed Parameters Set Using Different Precipitation Products

In the previous studies, we analyzed the effects of different precipitation products on the calibrated parameters of SWAT model in MRB. We found that, although different precipitation products can achieve better simulation results, the parameters for achieving the best simulation are significantly different, which means that precipitation input is the crucial sources of model simulation uncertainty.
In this section, we define a fixed set of parameters by averaging the parameter values calibrated for the five simulations (i.e., calibrated by Gauge observations, AgMERRA, MSWEP, PERSIANN-CDR, and TMPA) that maximized NSE value. The purpose of this test is to find a compromise parameter set in different optimal parameter sets to evaluate the impact of different precipitation inputs. The values of fixed parameter set are listed in Table 8, and the simulated results using fixed parameter set are shown in Figure 7 and Table 9.
In general, the simulation results obtained using the fixed parameter set are inferior to those obtained by the automatic simulation using the respective precipitation data. From Figure 7 and Table 9, we can see that the results simulated using gauge observations have the best performance in terms of NSE, R2, RMSE, and PBIAS. Concerning the four satellite and reanalysis precipitation products, TMPA and PERSIANN-CDR have achieved good simulation results, although both are overestimated for low flow processes. For AgMERRA and MSWEP, they both achieved a smaller NSE, which greatly underestimated the high-flow process.

5. Discussion and Conclusions

5.1. Discussion

Comparing CC, RMSE, ME, POD, FAR, and CSI between daily gauge precipitation and AgMERRA, MSWEP, PERSIANN-CDR, and TMPA at the whole MRB, it is shown that the agreement between MSWEP and the gauge observations is better than the remaining three products (with the highest CC and lowest RMSE), which are mainly because MSWEP product was developed by taking full advantage of satellite-based and reanalysis precipitation data (e.g., CPC United and GPCC, CMORPH, GsMAP-MVK, TMPA, ERA-Interim, and JRA-55), many of these precipitation products were gauge-ajusted [27]. While the TMPA precipitation estimates outperforms the other three precipitation products with the lowest ME, which are mainly due to its poor sampling [15]. This finding is consistent with the results of Chen et al. [21]. Based on the three categorical statistical indices (POD, FAR, CSI), this study shows that all the four precipitation products have the capacity of detecting the precipitation events with relative high POD and CSI. Among the preexisting studies, these studies show that the APHRODITE has a good performance compared with TMPA, CMORPH, CRU, and ERA-Interim and CFSR [21,30,31,39]. To our best knowledge, MSWEP has been applied for the first time to the MRB, and we found that this product outperforms the APHRODITE during the period of 1951–2007. This conclusion may be a supplement to the lack of recent meteorological data in the Mekong River Basin.
The Mekong River flows through six different climate regions, precipitation has different characteristics in different climate zones. First of all, all six metrics of four precipitation products in six different climatic zones were worse than those for the whole MRB, which was caused by the cancelation of positive and negative values [58]. By comparing statistical indices (CC, RMSE, ME, POD, FAR, and CSI) and the intensity distributions at a daily scale to evaluate the accuracy of four precipitation products over the six different climate regions, it is demonstrated that the PERSIANN-CDR and TMPA precipitation products have a low CC with the gauge observations in region ET where it represents a cold plateau area, and it also underestimated the occurrence of 0~0.1 mm/day, but overestimated the occurrence and contributions at the greater than 20 mm/day threshold, this phenomenon is consistent with what was discovered by Tong et al. [59] and Xu et al. [60], which conducted the evaluation in Tibet with similar topographical climatic conditions to region ET. For the region Dwc, Figure 4 and Table 4 clearly showed that the four precipitation products have poor performances with the gauge observations, the first reason is that there are more snowfall events in this climate zone, and these precipitation products are relatively poor in predicting snowfall [45], the second possible reason is that there is only one rainfall gauge in this climate zone, which may bring a larger random error for the assessment of precipitation products [61]. For the regions Cwb and Cwa, all precipitation products have relatively good performance with gauge observations except PERSIANN-CDR product, in which PERSIANN-CDR has a lowest CC and POD compared with other three products that means it can hardly detect the occurrence of rainfall events, this finding agrees well with what was found by Jiang et al. [62], which conducted their study in a Cwa area. In the Aw and Am areas representing humid region, this study shows that the MSWEP product has the largest CC (0.82, 0.73) followed by TMPA (0.82, 0.72) and PERSIANN-CDR (0.77, 0.70), and this finding is consistent with what was found out by Alijanian et al. [43]. The evaluation also shows that the daily precipitation estimates from AgMERRA and MSWEP have a relatively better performance than PERSIANN-CDR and TMPA over the whole MRB and each different climatic zone. Considering that AgMERRA provides data limited to 1980–2010, MSWEP is more suitable for meteorological research in MRB.
Tuo et al. [45] and the references therein showed that the NSE cannot be used as the only indicator to evaluate the pros and cons of a hydrological model with different precipitation inputs. Therefore, P and R instead of NSE are used in this study to compare the accuracy of streamflow reconstruction based on the four precipitation estimates over Stung Treng station. In addition, parameter and prediction uncertainties were analyzed to investigate the influence of different precipitation inputs on calibrated parameter ranges in each iteration and best model performance. Daily streamflow simulations using MSWEP precipitation estimates behave a little better than other three products, which are consistent with daily precipitation derived from MSWEP have higher CC and lower RMSE over MRB. When considering the uncertainty of the model simulation (P and R), the daily precipitation estimates derived from four products all show relative good simulation results (with P > 0.7 and R < 1.5, [1]). However, when we evaluated the precipitation products in different climate zones, some daily precipitation products did not perform well in some climatic zones. This means that even if we consider the uncertainty of the model through multiple simulations, it is difficult to determine which precipitation product performs better due to the uncertainties of the internal calculation of the model and the parameters, and this finding also pointed out by Tuo et al. [45]. These findings also highlighted the importance of precipitation assessment for a relatively large study area that must be divided into different sub-regions. When looking to the parameter uncertainties for different precipitation inputs, we found that the ranges of 10 sensitive parameters of MSWEP are closer to the gauge precipitation data, we can carefully draw a conclusion that MSWEP has a good simulation effect when considering parameter uncertainty. In general, the results of this study are expected to provide valuable recommendations for hydrometeorological users when studying the climate change in the Mekong Basin by using the four precipitation products here. As pointed out by World Meteorological Organization (WMO), studying climate change requires at least 30 years of meteorological data. While the MSWEP and AgMERRA precipitation estimates have shown good accuracy in different climate zones and hydrological simulations, which considered the parameter and prediction uncertainties, MSWEP provides data for more than 30 years (1979 to near present), but AgMERRA only has daily precipitation data from 1980 to 2010. Therefore, compared with the other three products, we prefer MSWEP product for hydrometeorological research in the Mekong River Basin.

5.2. Conclusions

In this study, we evaluated the accuracy of daily AgMERRA, MSWEP, PERSIANN-CDR, and TMPA precipitation products in the whole MRB and six sub-regions, which have different climate characteristics, using daily gauge precipitation observation data from 82 gauges across the MRB as reference. Then SWAT model was used to evaluate the accuracy of different precipitation products to reconstruct the daily streamflow over the Stung Treng station. Furthermore, we have analyzed parameter uncertainties, prediction uncertainties with fixed parameter set and potential relevance between the different parts mentioned above. The main findings of this study are as follows:
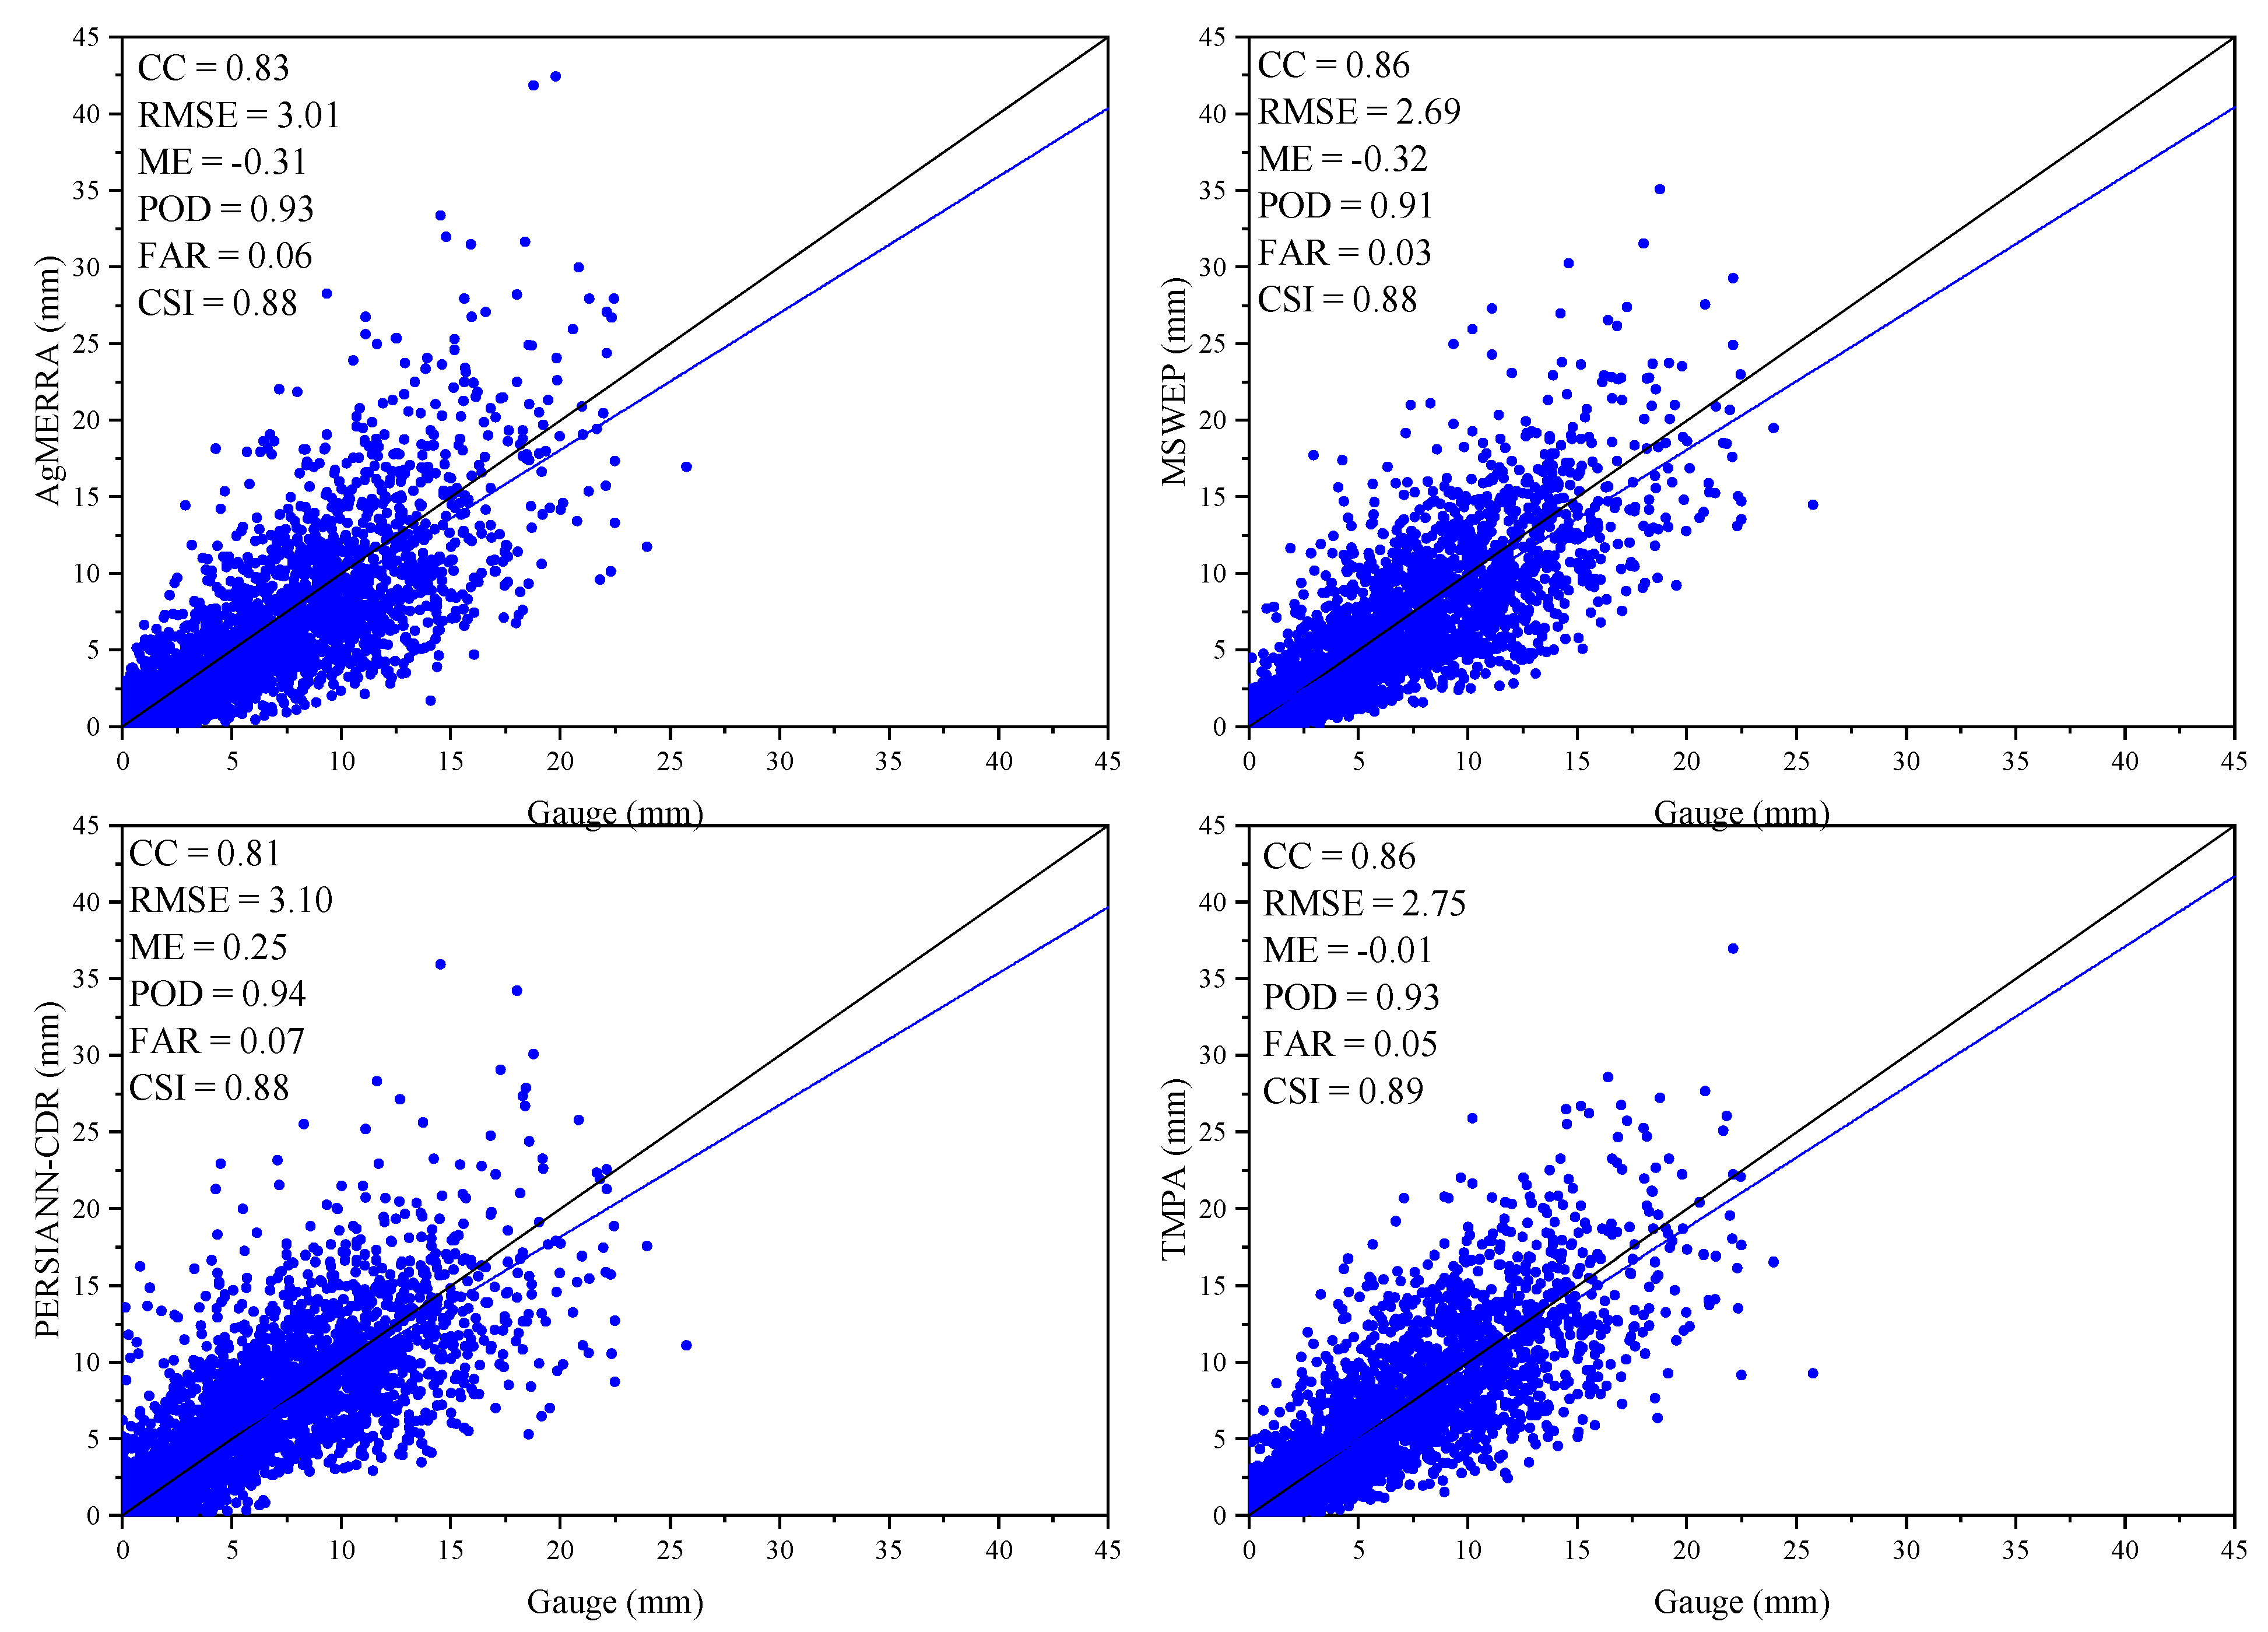
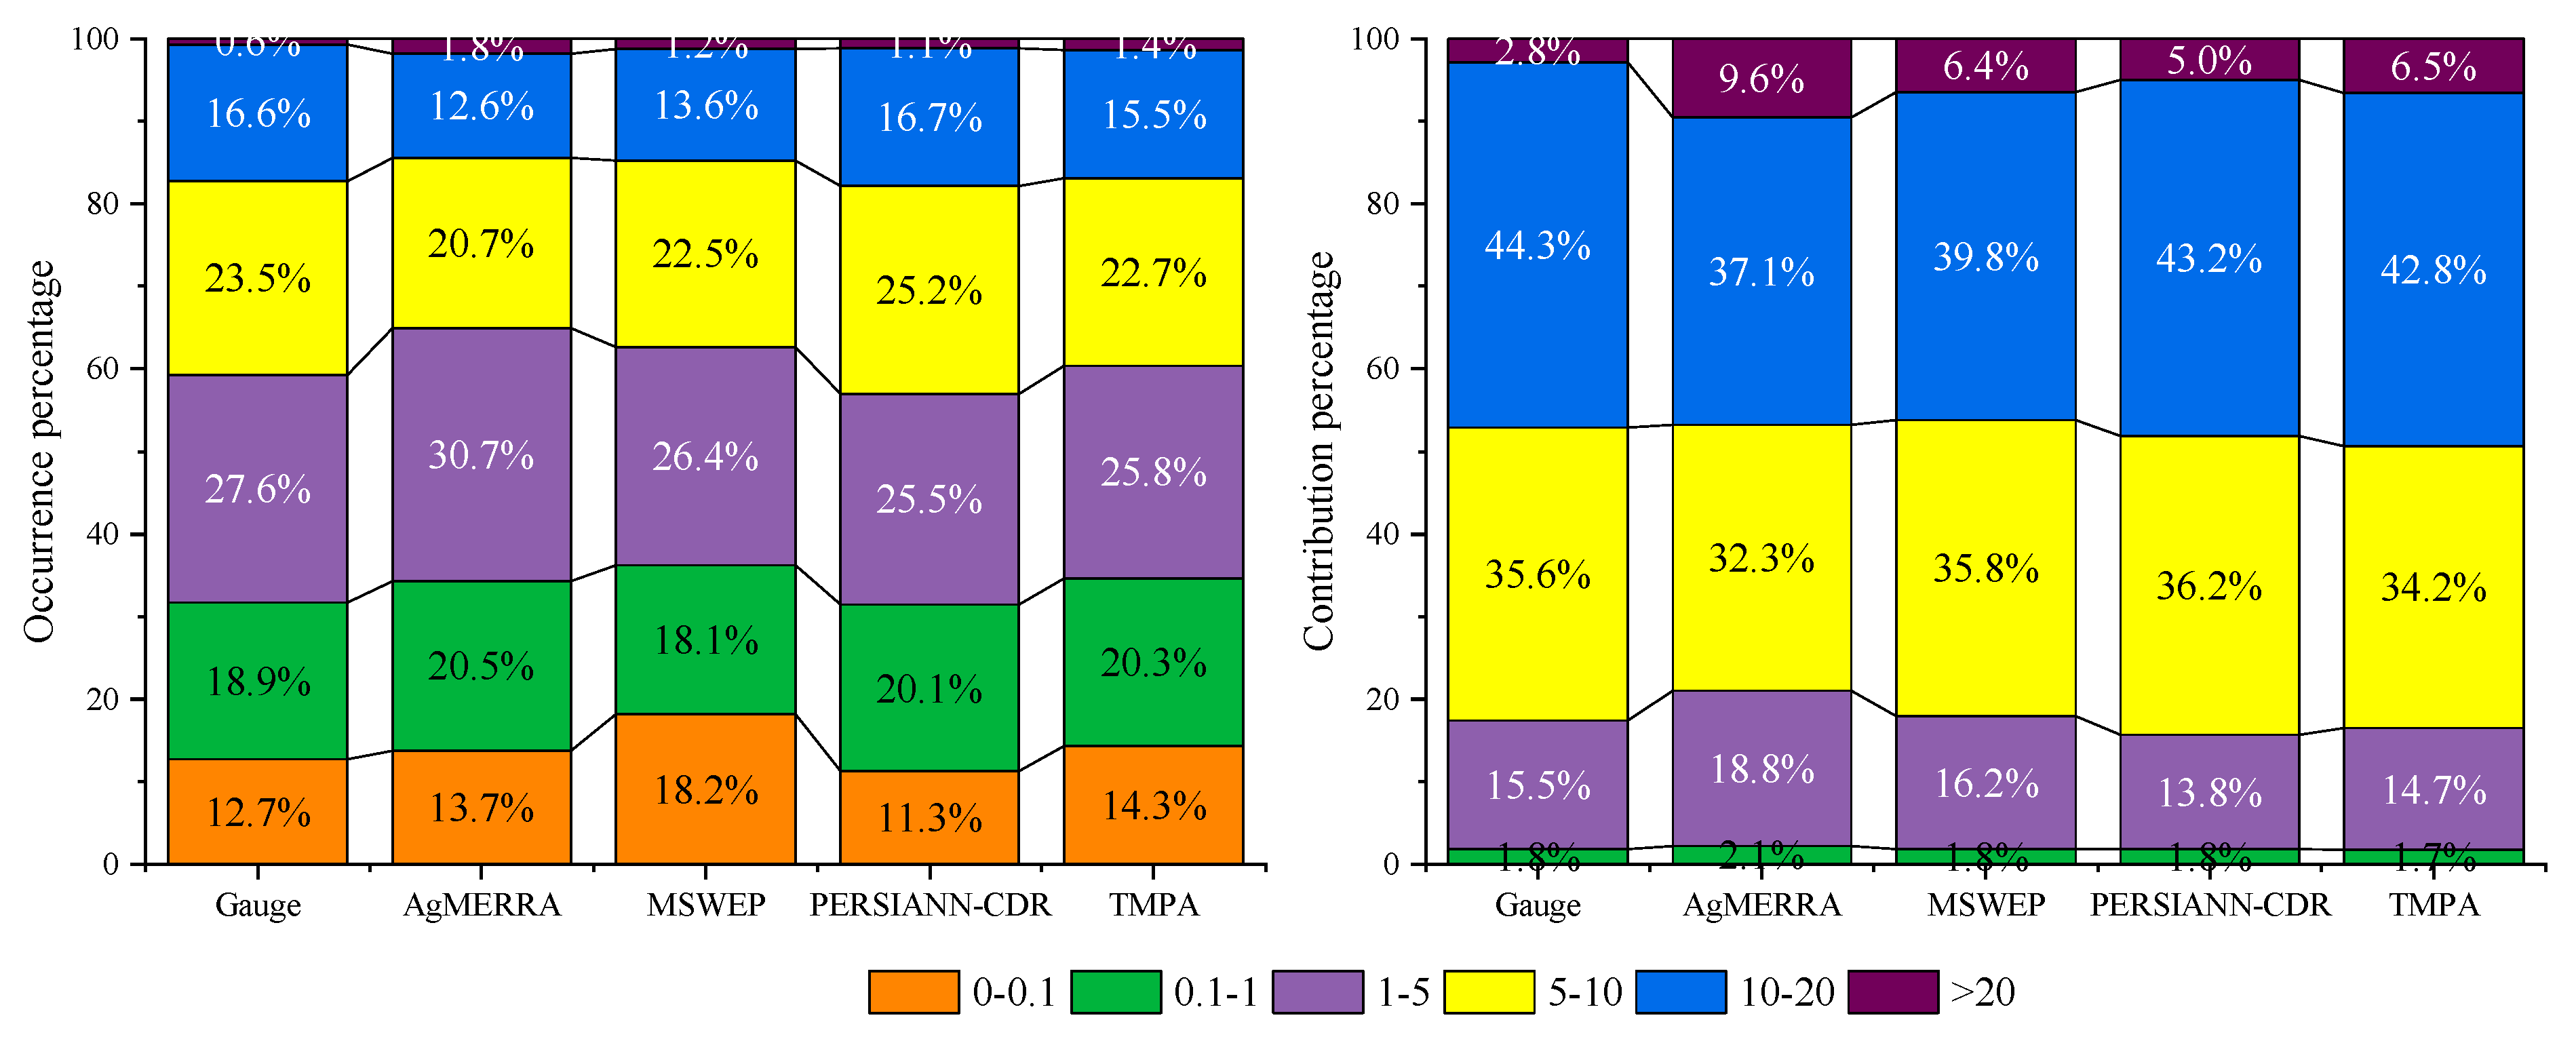
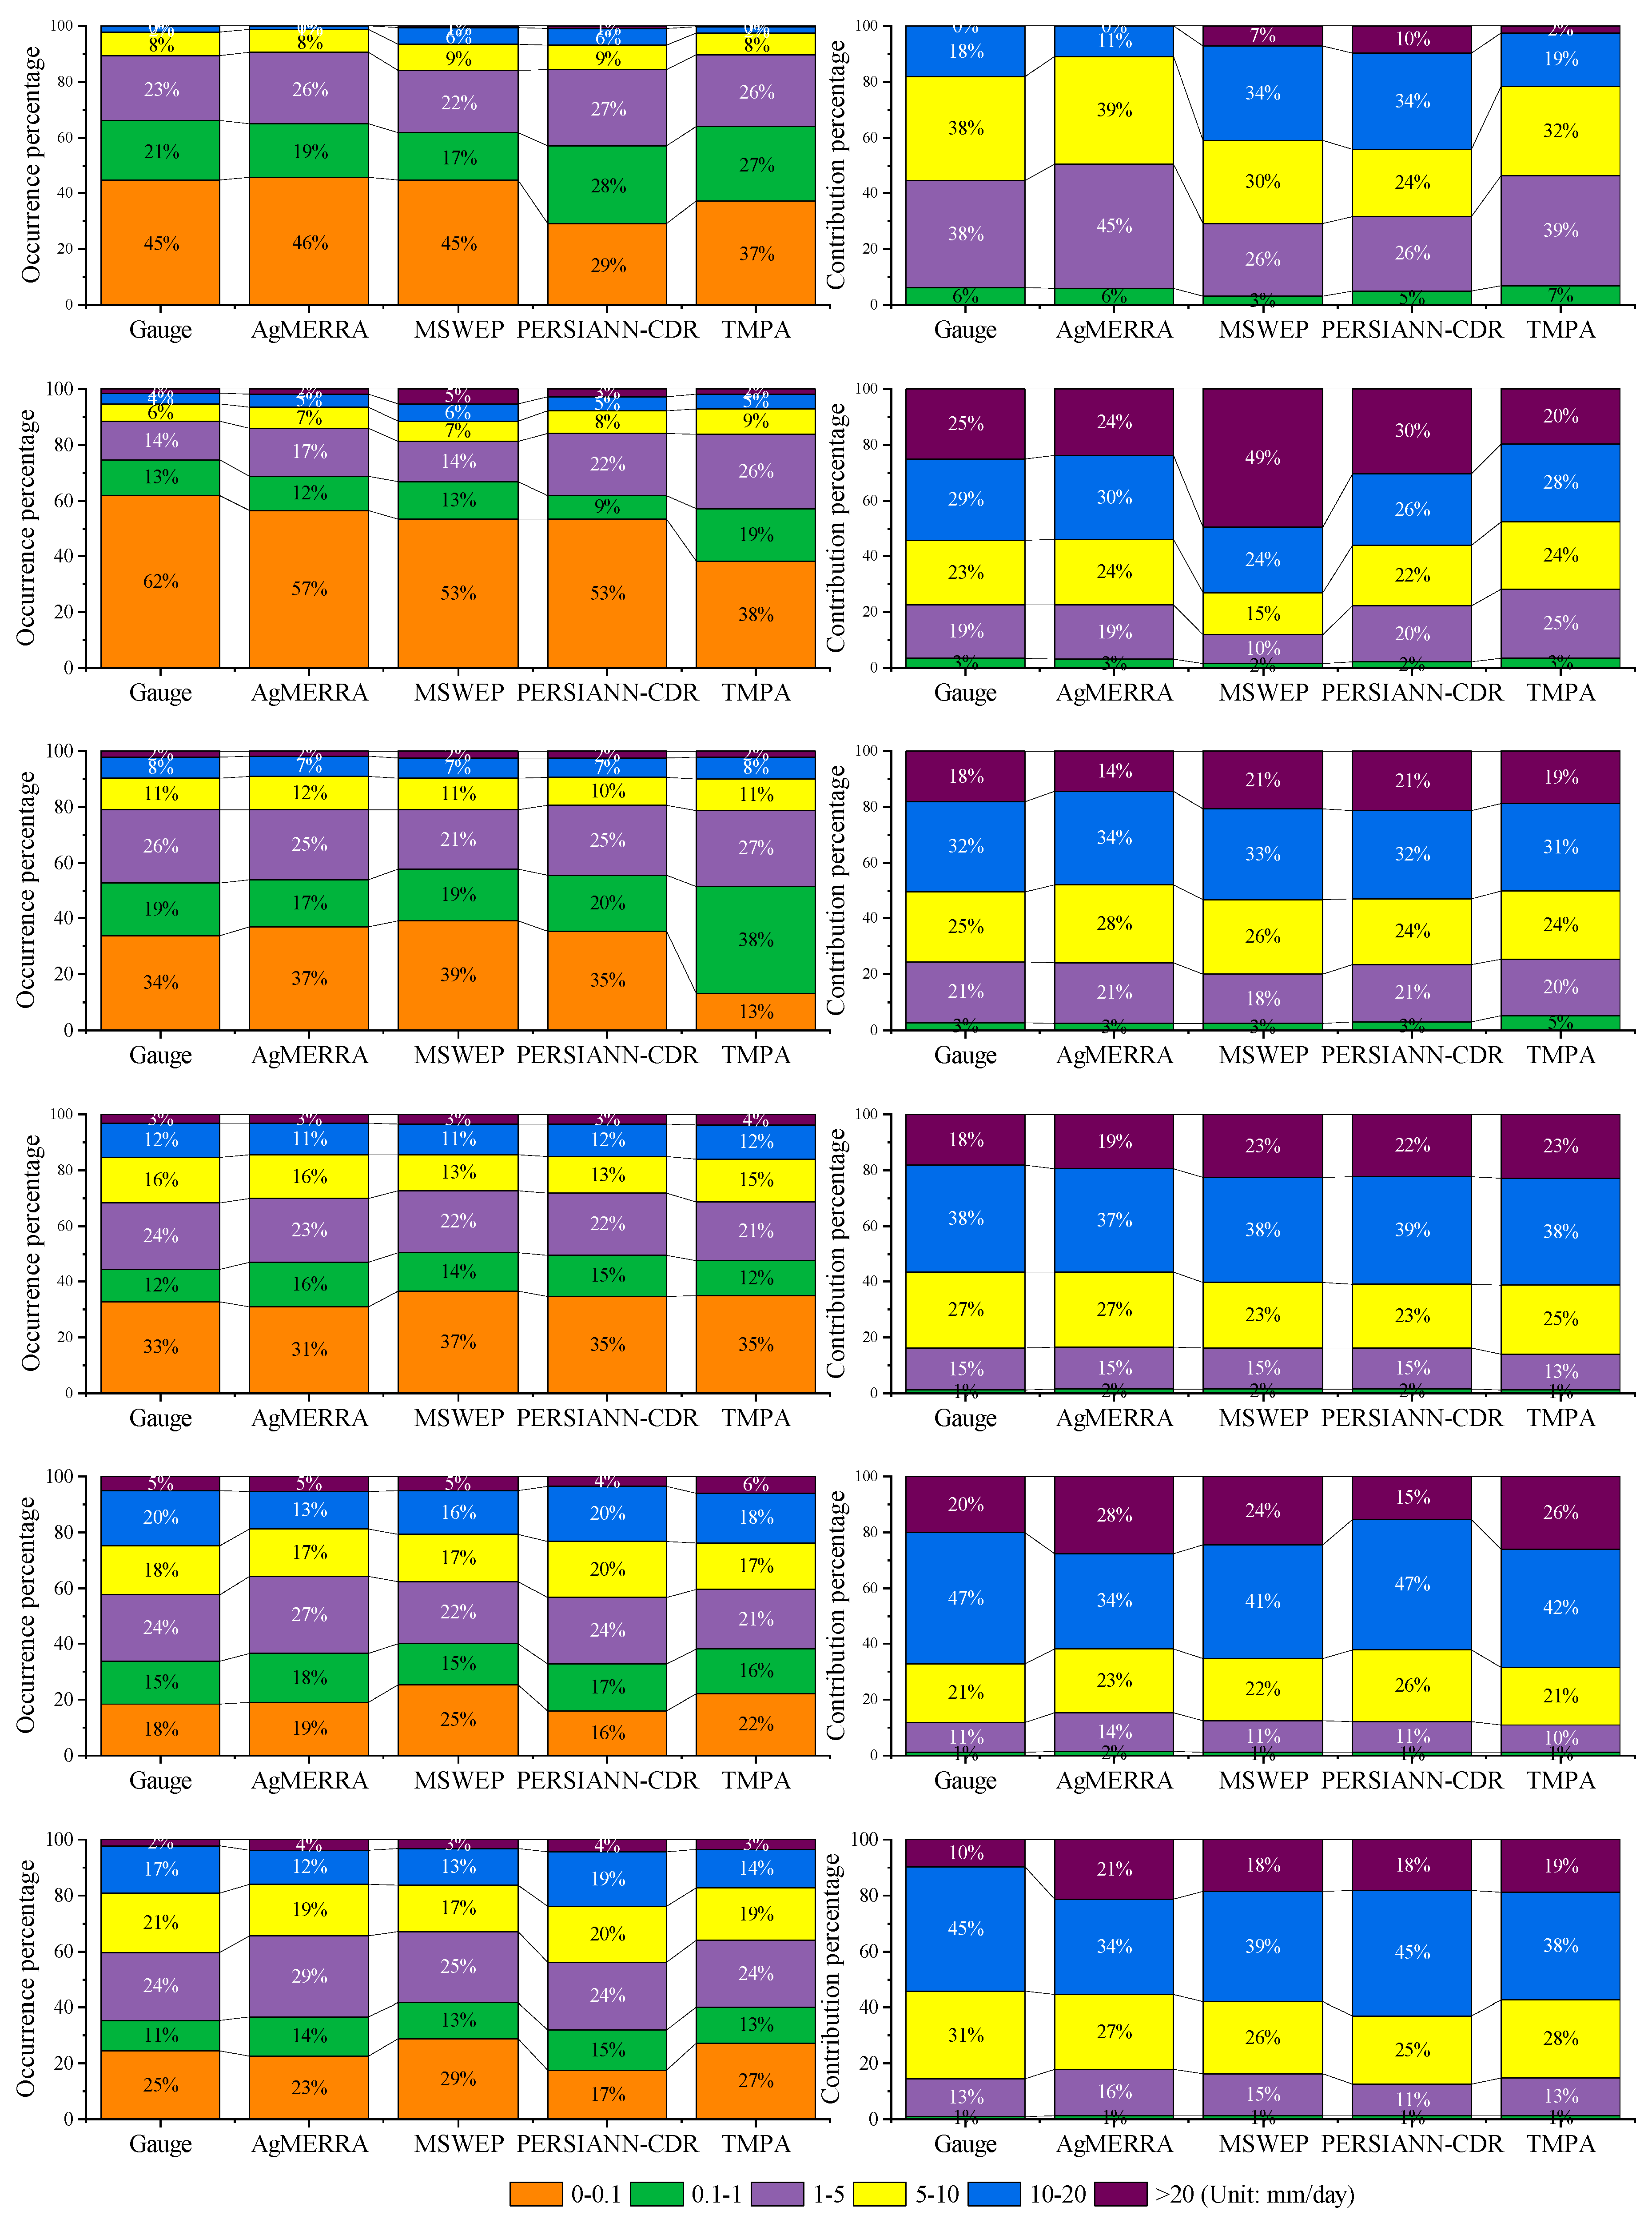
  • The daily precipitation of MSWEP and TMPA have nearly the same good performance with the highest CC and POD and lowest RMSE over the whole MRB, and the AgMERRA performs better than PERSIANN-CDR in this rank. However, all metrics of four precipitations in six different climate regions were worse than those for the whole MRB. Specifically, the TMPA and PERSIANN-CDR products have a large downward trend, especially in the ET and Dwc regions, while the AgMERRA and MSWEP have relatively good performance in six different climate regions. The AgMERRA has a good performance for each climate zone, while MSWEP and PERSIANN-CDR have obvious overestimation in ET and Dwc areas (for heavy rain with daily precipitation greater than 20 mm/day). In the Am, Aw, Cwa, and Cwb regions, MSWEP has the best performance, and other products perform differently in different intensities.
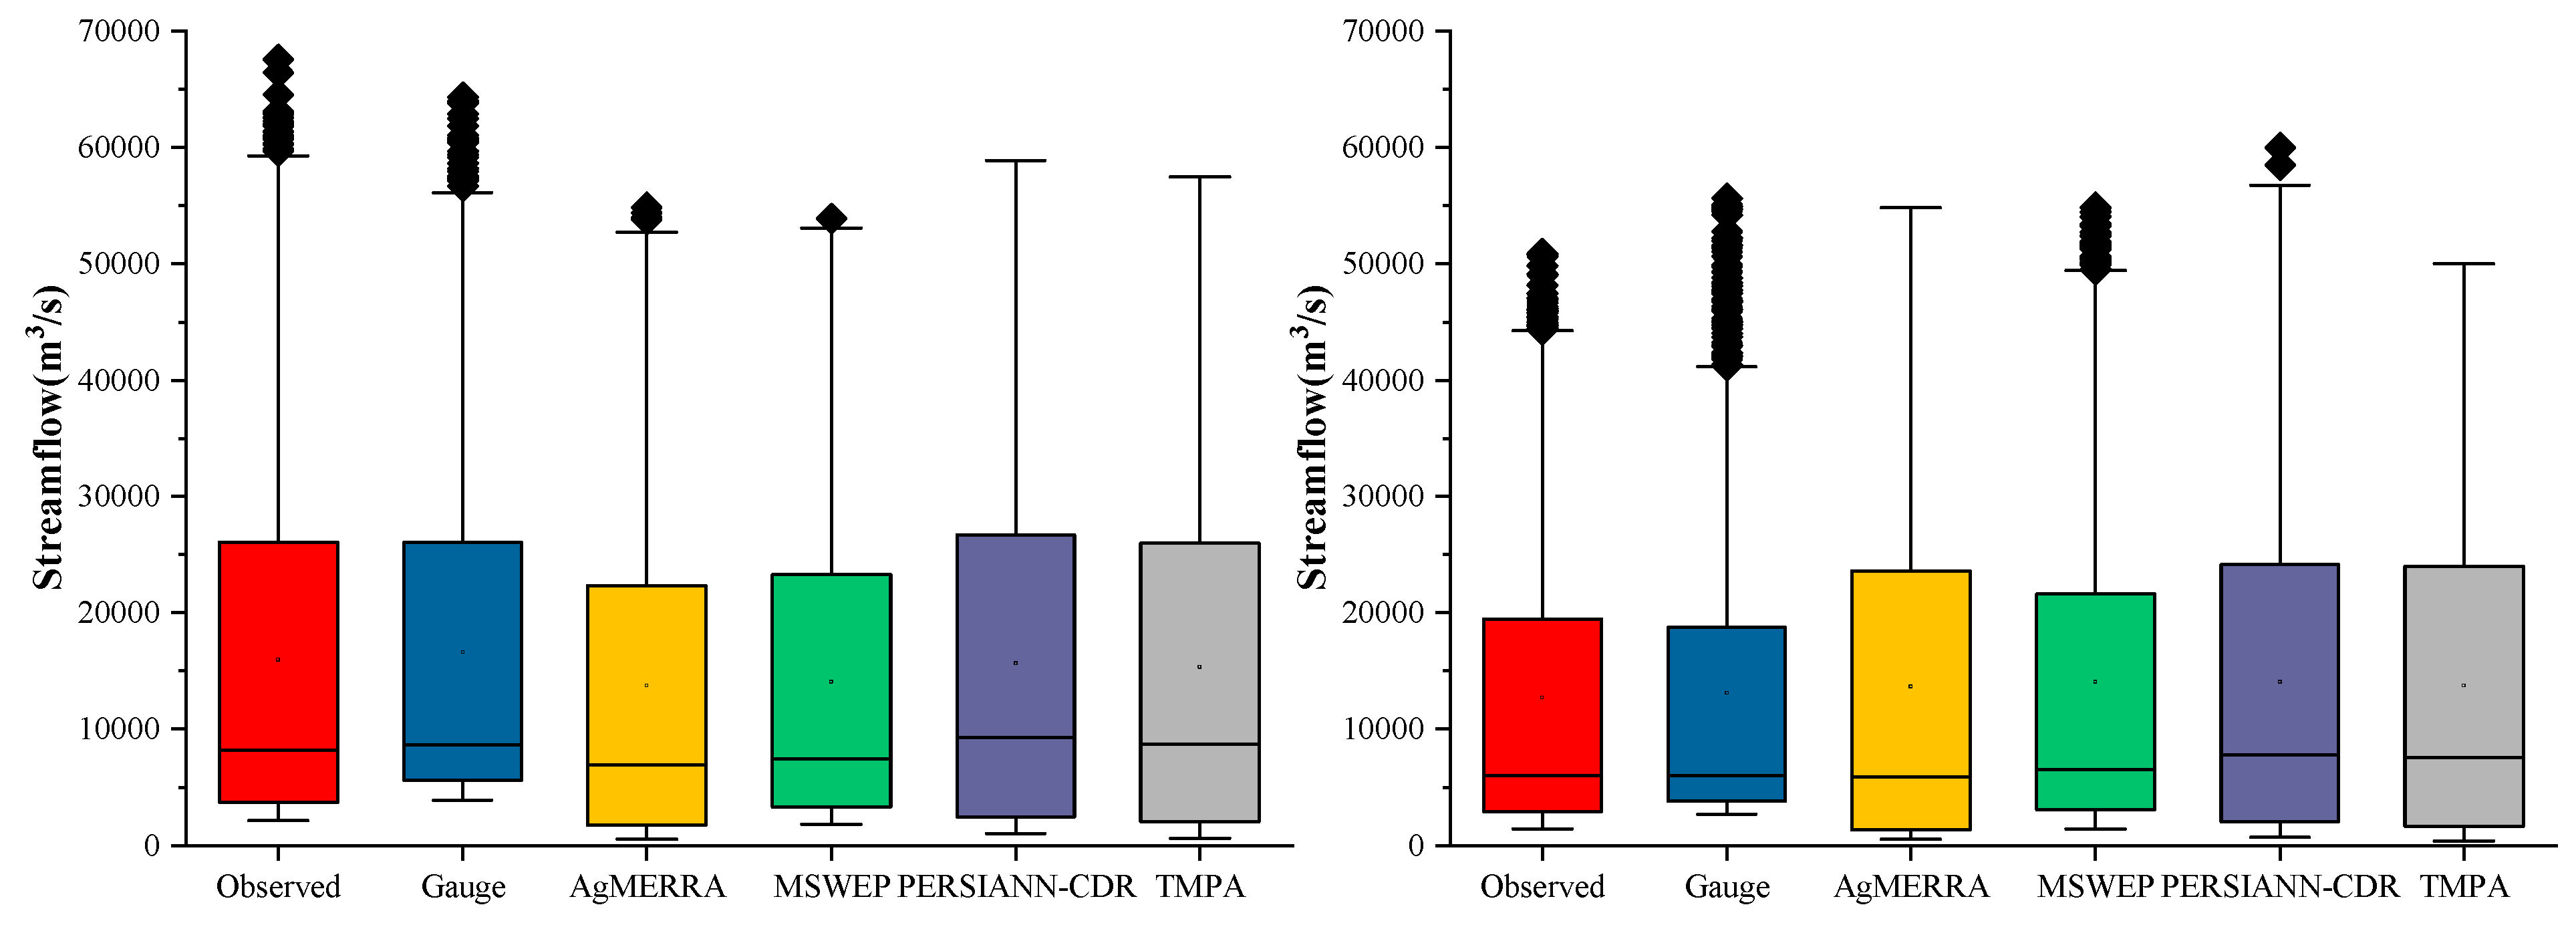
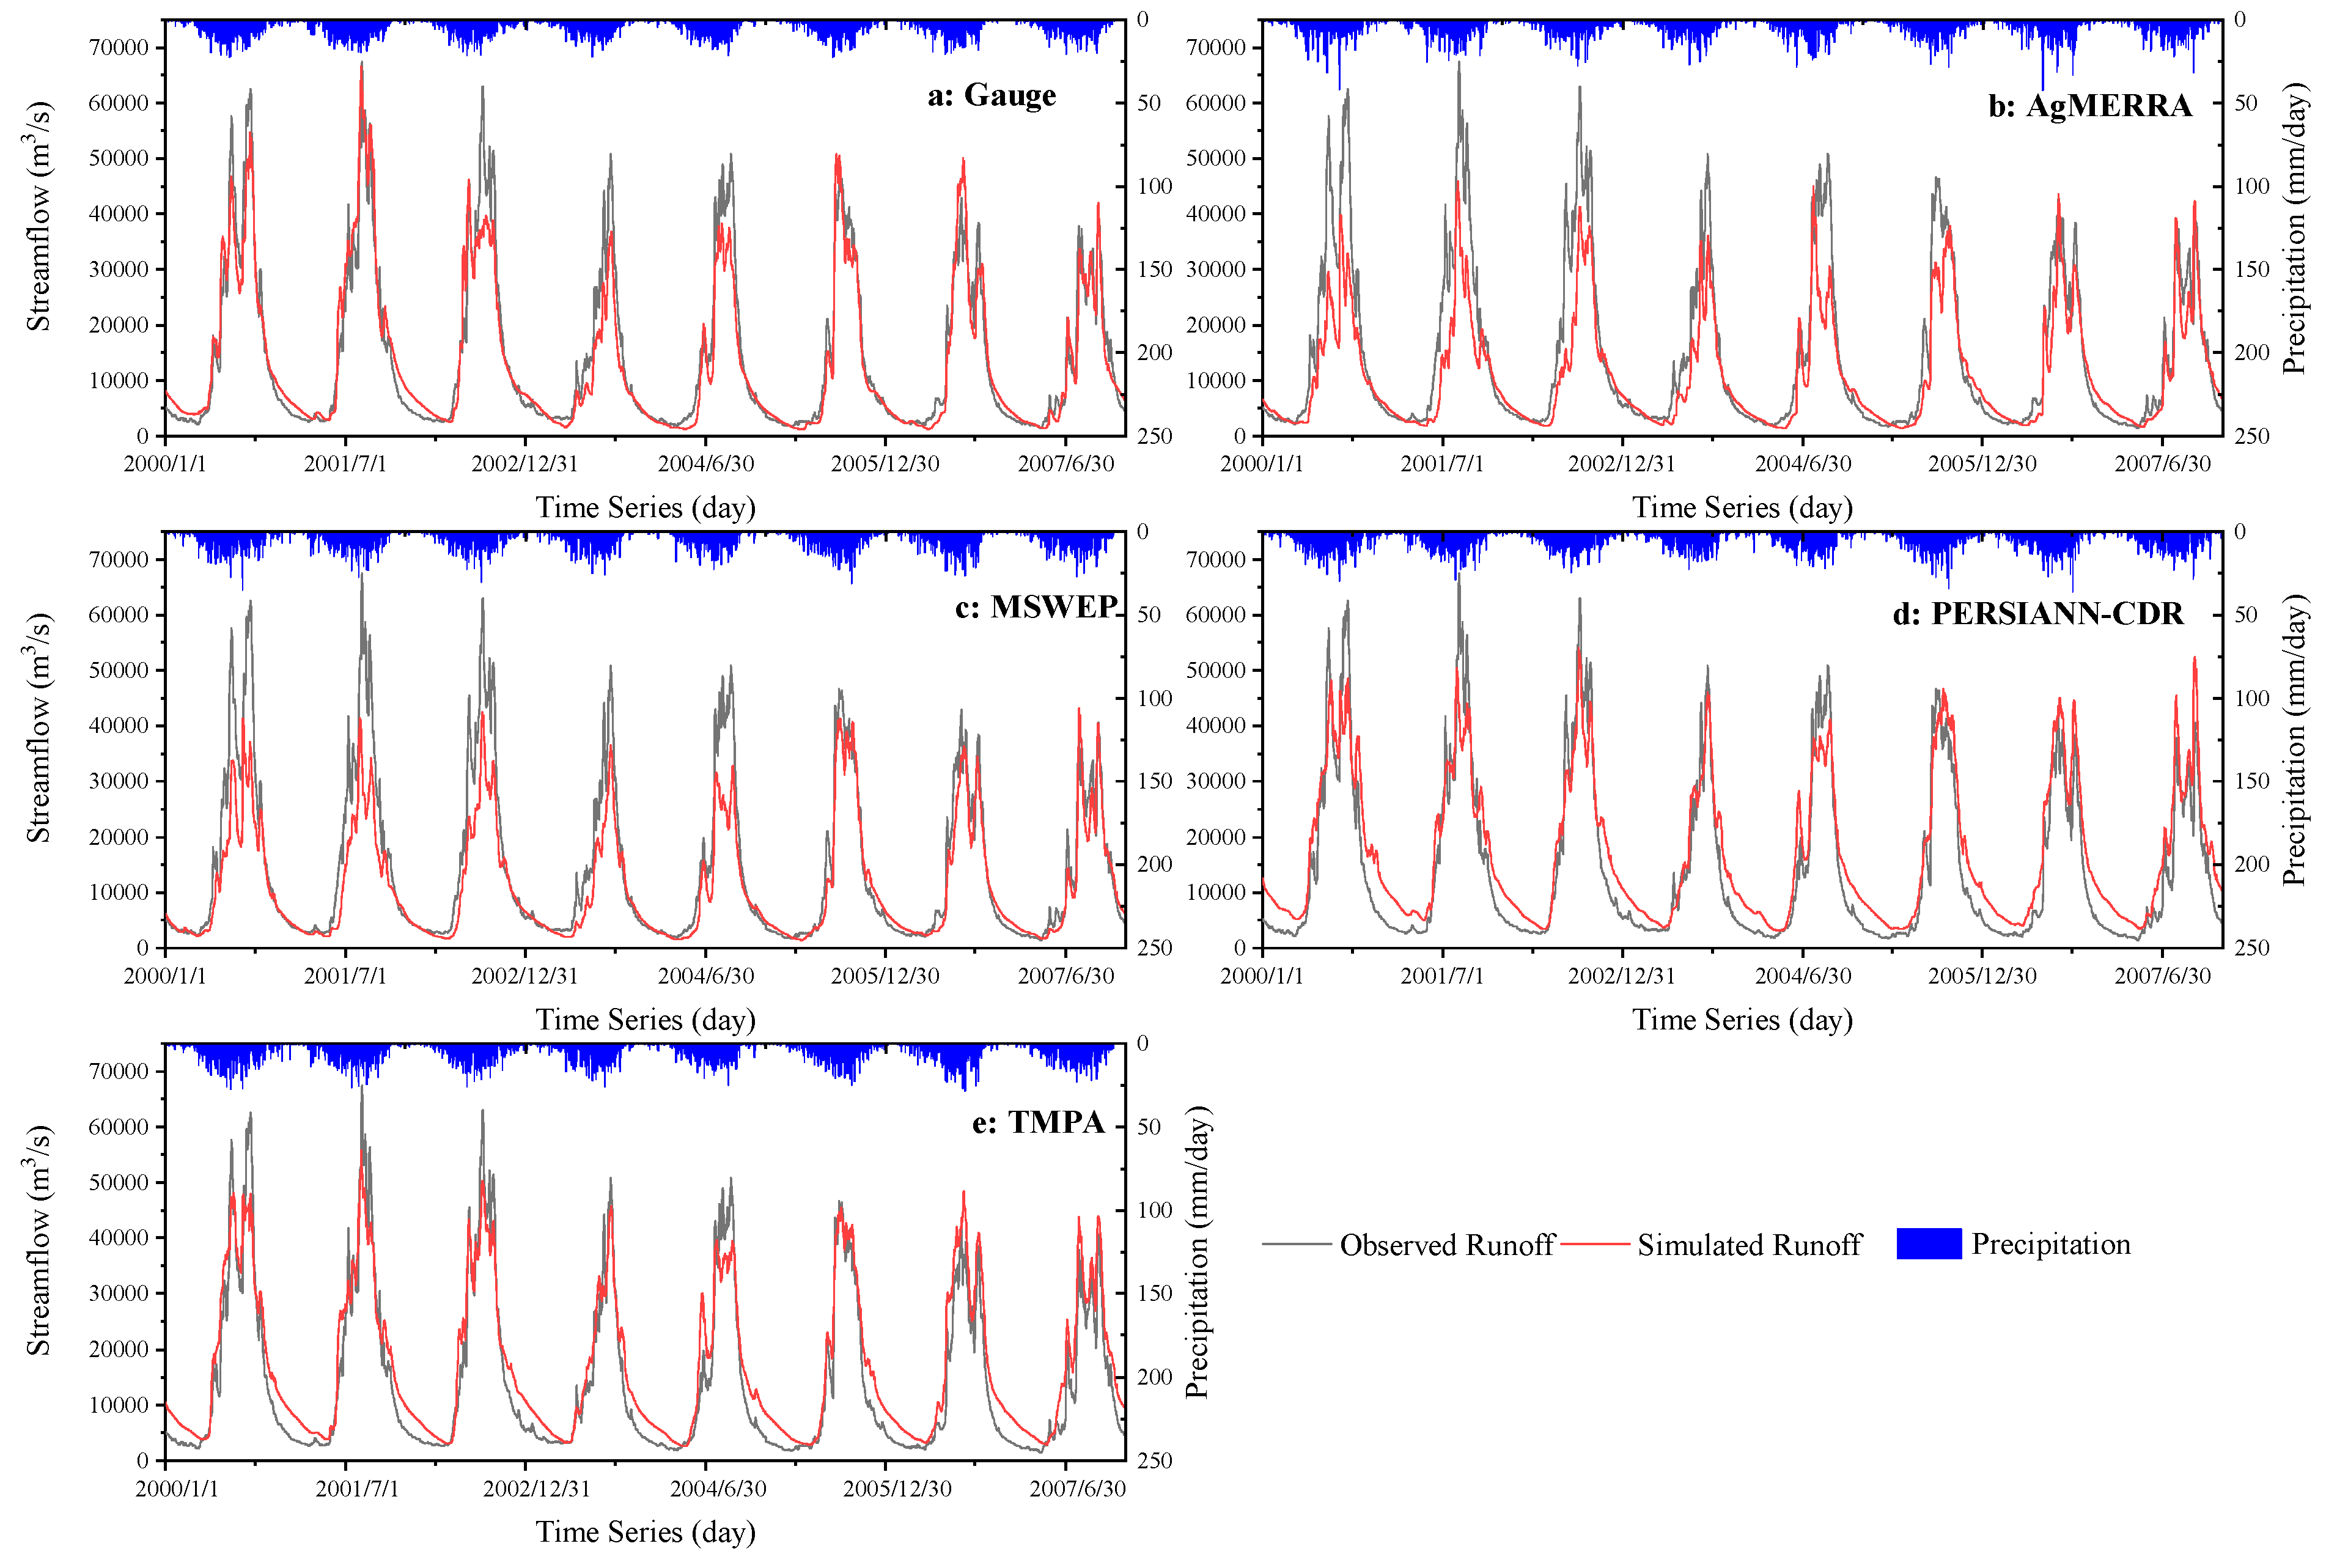
  • The MSWEP precipitation estimates have achieved the best simulation results by considering the model’s simulation effects for low-flow and high-flow processes (Figure 5), followed by the PERSIANN-CDR, TMPA, and AgMERRA. Considering the uncertainty of the model’s multiple simulations, MSWEP and PERSIANN-CDR precipitation products have obtained good simulation results with higher P and lower R values, the TMPA simulation result was better than AgMERRA in this rank.
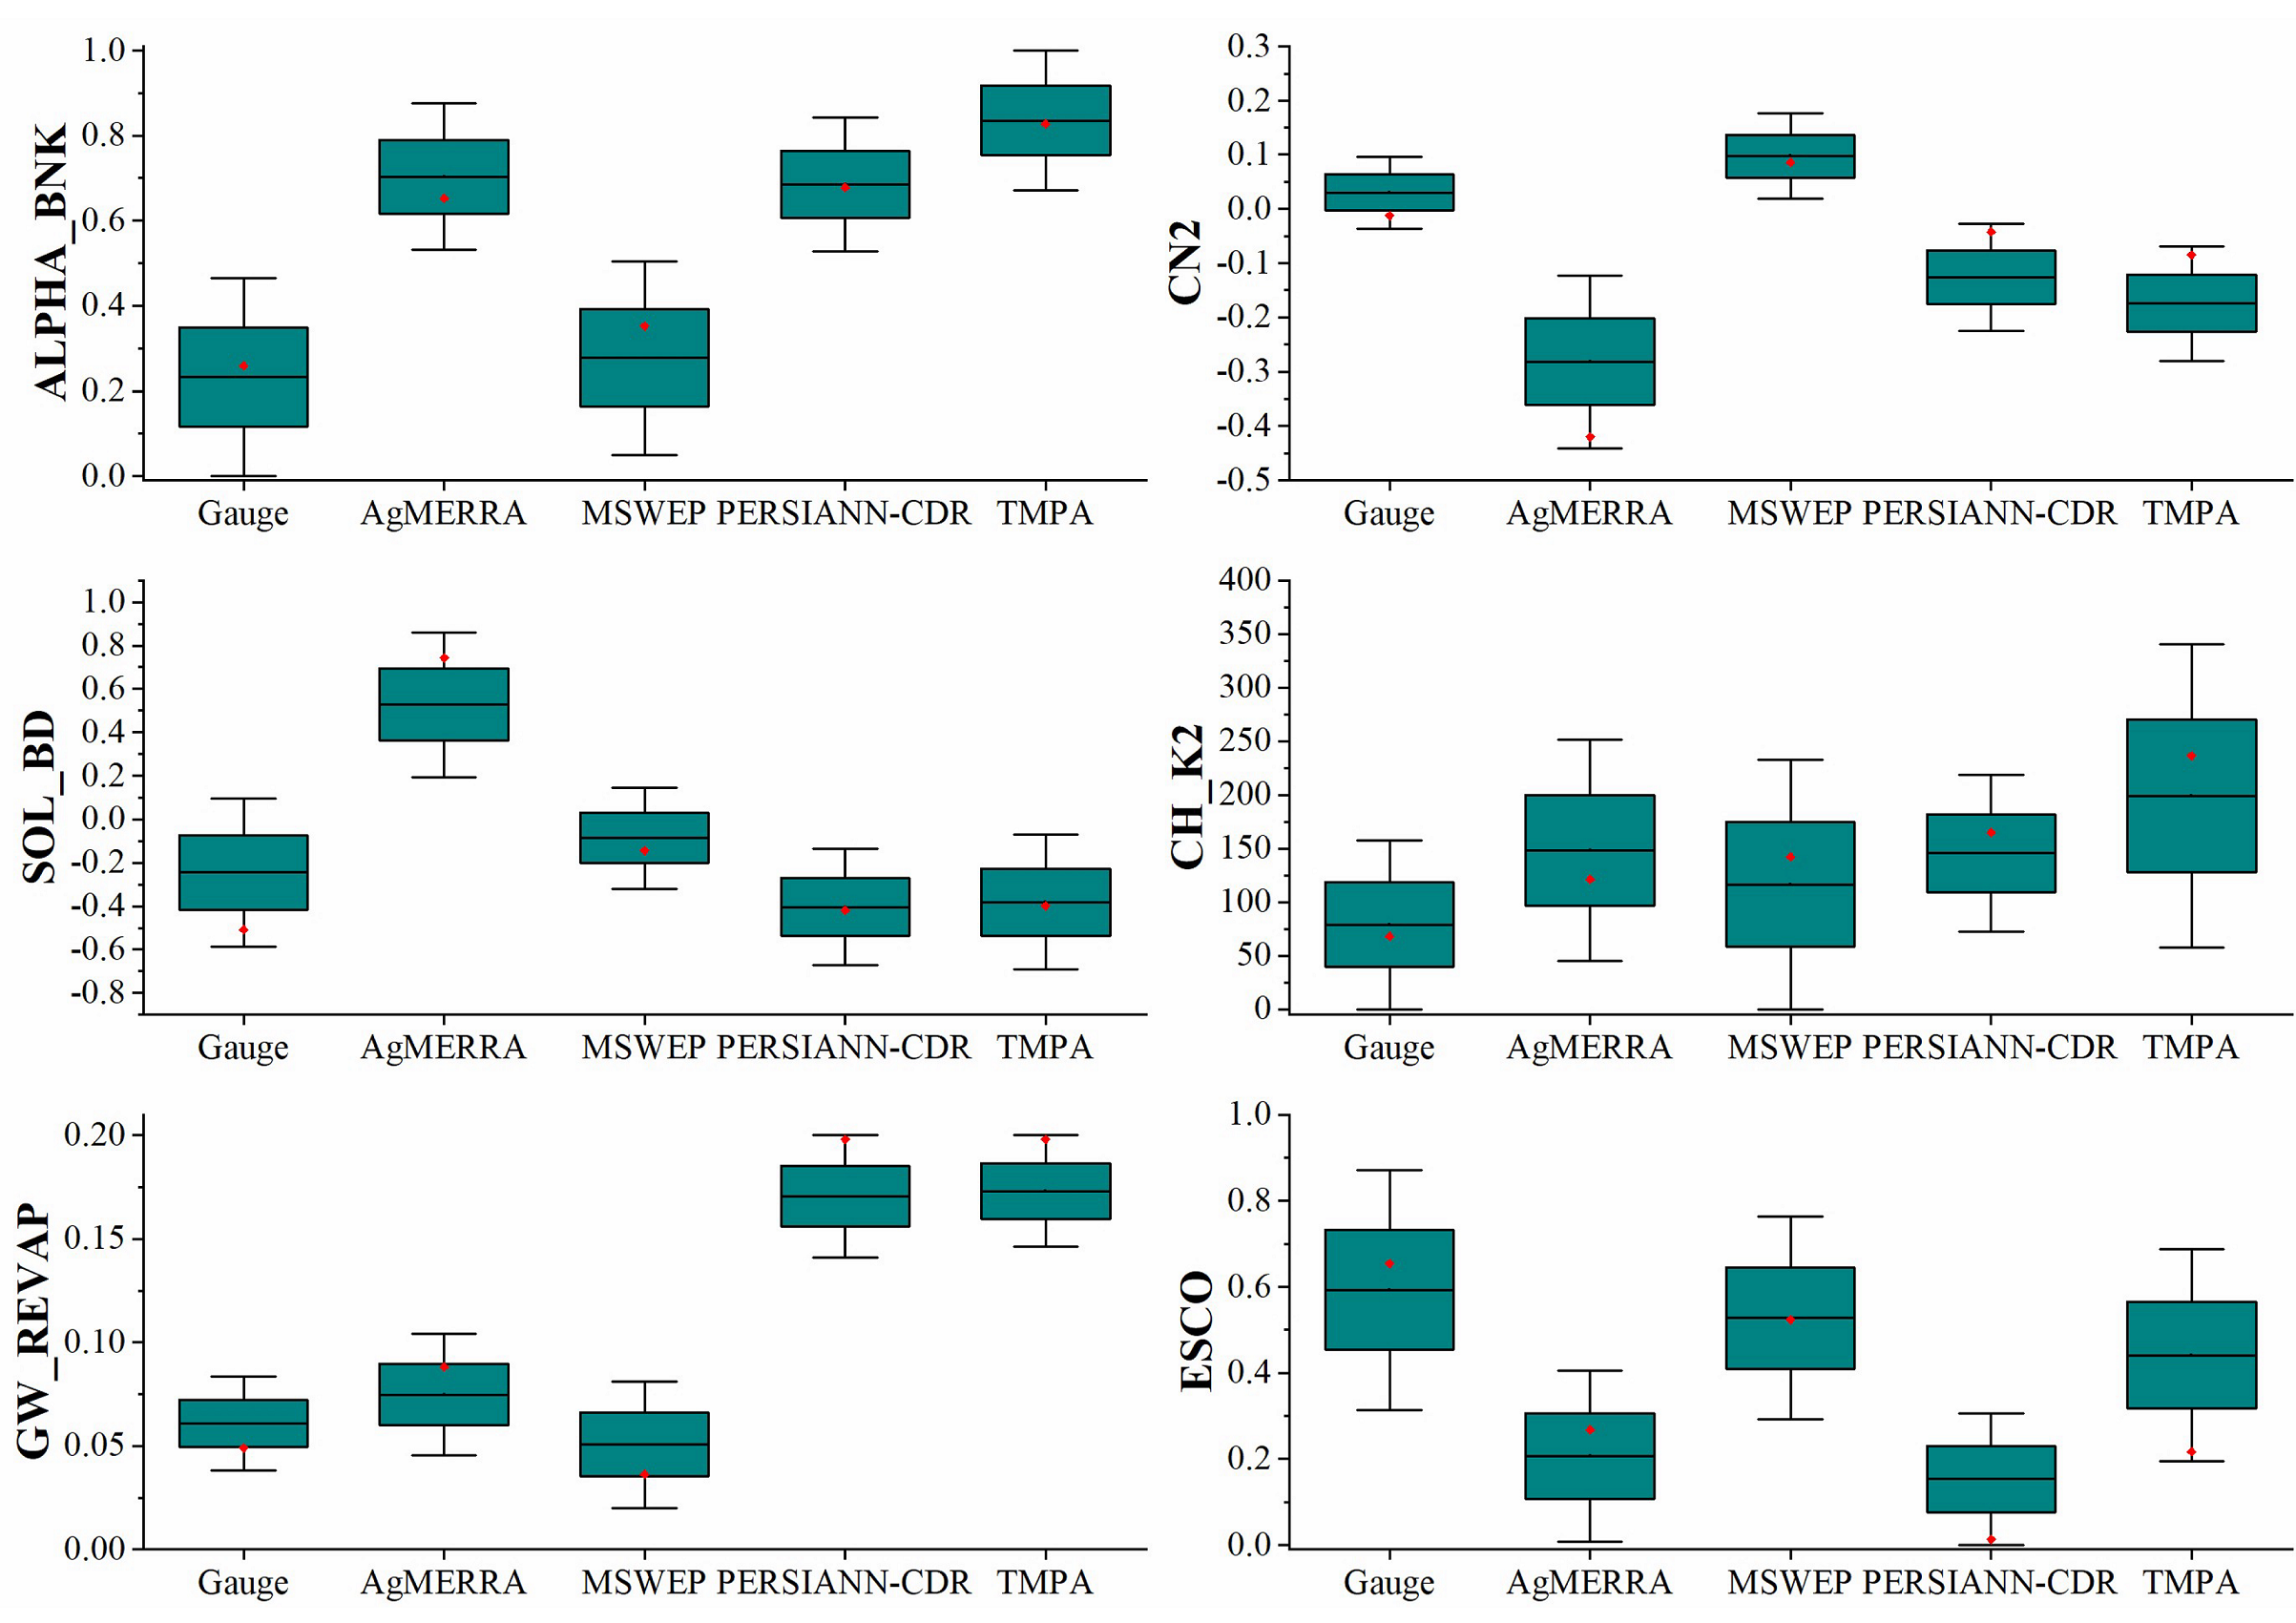
  • By analyzing the uncertainty of the calibrated parameters with different precipitation inputs, the parameter ranges determined by the gauge precipitation data were used as a benchmark to analyze the parameter ranges and optimal parameter values for different precipitation inputs. We found that MSWEP products have a better performance while the other three precipitation products had larger uncertainties.
  • We also evaluated the impact of different precipitation input on model performance with a fixed parameter set. We have found that PERSIANN-CDR and TMPA products were less sensitive to changes in parameters, and these two products have higher NSE and R2 values but poorer simulation for low-streamflow processes, while MSWEP product has a relatively smaller NSE value, but better for low-streamflow simulations. This conclusion is only a test we have done in the specific study area of the Mekong River Basin, and it needs to be verified in other watersheds.
In general, by evaluating the accuracy of the four precipitation products in different climate zones and the whole MRB, we recommend that daily precipitation derived from MSWEP can be used for hydrometeorological studies in the Mekong River Basin. Using different precipitation products to calibrate the model based on streamflow data will affect other hydrological processes such as evapotranspiration and baseflow, and this uncertainty would eventually affect the formulation of water management policies. Therefore, when using hydrological model simulation to evaluate the pros and cons of precipitation products, the uncertainty of different precipitation inputs should also be considered.

Author Contributions

X.T. and G.W. jointly proposed the original idea of this study; X.T. completed the calculation and writing of this manuscript; G.B.R., C.G. and J.Z. contributed to the manuscript revision.

Funding

This study has been financially supported by the National Key Research and Development Program of China (Nos. 2016YFA0601501, Nos. 2016YFA0601601), the National Natural Science Foundation of China (Grant Nos. 41830863) and the fund of State Key Laboratory of Hydrology – Water Resources and Hydraulic Engineering (No. 2015490411). We appreciate the anonymous reviewers and editors for their valuable comments.

Conflicts of Interest

The authors declare no conflict of interest.

References

  1. Abbaspour, K.C.; Rouholahnejad, E.; Vaghefi, S.; Srinivasan, R.; Yang, H.; Kløve, B. A continental-scale hydrology and water quality model for Europe: Calibration and uncertainty of a high-resolution large-scale SWAT model. J. Hydrol. 2015, 524, 733–752. [Google Scholar] [CrossRef] [Green Version]
  2. Bao, Z.X.; Zhang, J.Y.; Wang, G.Q.; Fu, G.B.; He, R.M.; Yan, X.L.; Jin, J.L.; Liu, Y.L.; Zhang, A.J. Attribution for decreasing streamflow of the Haihe River basin, northern China: Climate variability or human activities? J. Hydrol. 2012, 460, 117–129. [Google Scholar] [CrossRef]
  3. Wang, G.Q.; Zhang, J.Y.; Yang, Q.L. Attribution of Runoff Change for the Xinshui River Catchment on the Loess Plateau of China in a Changing Environment. Water 2016, 8, 267. [Google Scholar] [CrossRef]
  4. Bergström, S. The HBV Model—Its Structure and Applications; Swedish Meteorological and Hydrological Institute: Norrköping, Sweden, 1992. [Google Scholar]
  5. Wang, G.Q.; Zhang, J.Y.; Jin, J.L.; Pagano, T.C. Assessing water resources in China using PRECIS projections and VIC model. Hydrol. Earth Syst. Sci. 2012, 16, 231–240. [Google Scholar] [CrossRef]
  6. Arnold, J.G.; Srinivasan, R.; Muttiah, R.S.; Williams, J.R. Large area hydrologic modeling and assessment part I: Model development. Jawra J. Am. Water Resour. Assoc. 1998, 34, 73–89. [Google Scholar] [CrossRef]
  7. Grusson, Y.; Sun, X.; Gascoin, S.; Sauvage, S.; Raghavan, S.; Anctil, F.; Pérez, J.M.S. Assessing the capability of the SWAT model to simulate snow, snow melt and streamflow dynamics over an alpine watershed. J. Hydrol. 2015, 531, 574–588. [Google Scholar] [CrossRef]
  8. Arnold, J.G.; Kiniry, J.R.; Srinivasan, R.; Williams, J.R.; Haney, E.B.; Neitsch, S.L. Soil & Water Assessment Tool: Input/Output Documentation; Version 2012; Texas Water Resources Institute: College Station, TX, USA, 2012; pp. 1–650. [Google Scholar]
  9. Ouyang, F.; Zhu, Y.; Fu, G.; Lü, H.; Zhang, A.; Yu, Z.; Chen, X. Impacts of climate change under CMIP5 RCP scenarios on streamflow in the Huangnizhuang catchment. Stoch. Environ. Res. Risk Assess. 2015, 29, 1781–1795. [Google Scholar] [CrossRef]
  10. Li, L.; Zhang, L.; Xia, J.; Gippel, C.J.; Wang, R.; Zeng, S. Implications of Modelled Climate and Land Cover Changes on Runoff in the Middle Route of the South to North Water Transfer Project in China. Water Resour. Manag. 2015, 29, 1–17. [Google Scholar] [CrossRef]
  11. Xu, F.; Dong, G.; Wang, Q.; Liu, L.; Yu, W.; Men, C.; Liu, R. Impacts of DEM uncertainties on critical source areas identification for non-point source pollution control based on SWAT model. J. Hydrol. 2016, 540, 355–367. [Google Scholar] [CrossRef]
  12. MRC. Stage 2 Development of MRC Toolbox: Final Report (WP016); Information and Knowledge Management Programme; Mekong River Commission (MRC): Phnom Penh, Cambodia, 2010. [Google Scholar]
  13. Faridzad, M.; Yang, T.; Hsu, K.; Sorooshian, S.; Xiao, C. Rainfall Frequency Analysis for Ungauged Regions using Remotely Sensed Precipitation Information. J. Hydrol. 2018, 563, 123–142. [Google Scholar] [CrossRef]
  14. Poméon, T.; Jackisch, D.; Diekkrüger, B. Evaluating the Performance of Remotely Sensed and Reanalysed Precipitation Data over West Africa using HBV light. J. Hydrol. 2017, 547, 222–235. [Google Scholar] [CrossRef]
  15. Zhu, Q.; Xuan, W.; Liu, L.; Xu, Y.P. Evaluation and hydrological application of precipitation estimates derived from PERSIANN-CDR, TRMM 3B42V7, and NCEP-CFSR over humid regions in China. Hydrol. Process. 2016, 30, 3061–3083. [Google Scholar] [CrossRef]
  16. Wagener, T.; Montanari, A. Convergence of approaches toward reducing uncertainty in predictions in ungauged basins. Water Resour. Res. 2011, 47. [Google Scholar] [CrossRef] [Green Version]
  17. Serrat-Capdevila, A.; Valdes, J.B.; Stakhiv, E.Z. Water Management Applications for Satellite Precipitation Products: Synthesis and Recommendations. Jawra J. Am. Water Resour. Assoc. 2014, 50, 509–525. [Google Scholar] [CrossRef]
  18. Alazzy, A.A.; Lü, H.; Chen, R.; Ali, A.B.; Zhu, Y.; Su, J. Evaluation of satellite precipitation products and their potential influence on hydrological modeling over the Ganzi river basin of the Tibetan plateau. Adv. Meteorol. 2017, 2017, 1687–1709. [Google Scholar] [CrossRef]
  19. Maggioni, V.; Meyers, P.C.; Robinson, M.D. A Review of Merged High Resolution Satellite Precipitation Product Accuracy During the Tropical Rainfall Measuring Mission (TRMM)—Era. J. Hydrometeorol. 2016, 17, 1101–1117. [Google Scholar] [CrossRef]
  20. Levizzani, V.; Kidd, C.; Aonashi, K.; Bennartz, R.; Ferraro, R.; Huffman, G.J.; Roca, R.; Turk, F.J.; Wang, N.Y. The activities of the International Precipitation Working Group. Q. J. R. Meteorol. Soc. 2017, 144, 3–15. [Google Scholar] [CrossRef]
  21. Chen, C.J.; Senarath, S.U.S.; Dima-West, I.M.; Marcella, M.P. Evaluation and restructuring of gridded precipitation data over the Greater Mekong Subregion. Int. J. Climatol. 2016, 37, 180–196. [Google Scholar] [CrossRef] [Green Version]
  22. Wang, W.; Lu, H. Evaluation and hydrological applications of TRMM rainfall products over the Mekong River basin with a distributied model. In Proceedings of the IEEE International Geoscience and Remote Sensing Symposium, Milan, Italy, 26–31 July 2015; pp. 2511–2514. [Google Scholar]
  23. Chaudhary, S.; Dhanya, C.T.; Vinnarasi, R. Dry and wet spell variability during monsoon in gauge-based gridded daily precipitation datasets over India. J. Hydrol. 2017, 546, 204–218. [Google Scholar] [CrossRef]
  24. Liu, X.; Yang, T.; Hsu, K.; Liu, C.; Sorooshian, S. Evaluating the streamflow simulation capability of PERSIANN-CDR daily rainfall products in two river basins on the Tibetan Plateau. Hydrol. Earth Syst. Sci. 2017, 21, 169–181. [Google Scholar] [CrossRef] [Green Version]
  25. Maggioni, V.; Massari, C. On the performance of satellite precipitation products in riverine flood modeling: A review. J. Hydrol. 2018, 558, 214–224. [Google Scholar] [CrossRef]
  26. Tan, M.L.; Santo, H. Comparison of GPM IMERG, TMPA 3B42 and PERSIANN-CDR satellite precipitation products over Malaysia. Atmos. Res. 2018, 202, 63–76. [Google Scholar] [CrossRef]
  27. Beck, H.E.; Van Dijk, A.I.J.M.; Levizzani, V.; Schellekens, J.; Miralles, D.G.; Martens, B.; De Roo, A. MSWEP: 3-hourly 0.25° global gridded precipitation (1979–2015) by merging gauge, satellite, and reanalysis data. Hydrol. Earth Syst. Sci. 2016, 21, 1–38. [Google Scholar] [CrossRef]
  28. Tang, G.; Long, D.; Hong, Y.; Gao, J.; Wan, W. Documentation of multifactorial relationships between precipitation and topography of the Tibetan Plateau using spaceborne precipitation radars. Remote Sens. Environ. 2018, 208, 82–96. [Google Scholar] [CrossRef]
  29. Yong, B.; Chen, B.; Tian, Y.; Yu, Z.; Hong, Y. Error-Component Analysis of TRMM-Based Multi-Satellite Precipitation Estimates over Mainland China. Remote Sens. 2016, 8, 440. [Google Scholar] [CrossRef]
  30. Chen, C.; Jayasekera, D.; Senarath, S. Assessing Uncertainty in Precipitation and Hydrological Modeling in the Mekong. In Proceedings of the World Environmental and Water Resources Congress, Austin, TX, USA, 17–21 May 2015; pp. 2510–2519. [Google Scholar]
  31. Lauri, H.; Räsänen, T.A.; Kummu, M. Using Reanalysis and Remotely Sensed Temperature and Precipitation Data for Hydrological Modeling in Monsoon Climate: Mekong River Case Study. J. Hydrometeorol. 2014, 15, 1532–1545. [Google Scholar] [CrossRef]
  32. Delgado, J.M.; Apel, H.; Merz, B. Flood trends and variability in the Mekong river. Hydrol. Earth Syst. Sci. 2010, 14, 407–418. [Google Scholar] [CrossRef] [Green Version]
  33. Li, D.; Long, D.; Zhao, J.; Lu, H.; Hong, Y. Observed changes in flow regimes in the Mekong River basin. J. Hydrol. 2017, 551, 217–232. [Google Scholar] [CrossRef]
  34. Kottek, M.; Grieser, J.; Beck, C.; Rudolf, B.; Rubel, F. World Map of the Köppen-Geiger climate classification updated. Meteorol. Z. 2006, 15, 259–263. [Google Scholar] [CrossRef]
  35. Nachtergaele, F.; Velthuizen, H.V.; Verelst, L.; Batjes, N.; Dijkshoorn, K.; Engelen, V.V.; Fischer, G.; Jones, A.; Montanarella, L.; Petri, M. The Harmonized World Soil Database; DVD; Food and Agriculture Organization: Rome, Italy, 2009; pp. 34–37. [Google Scholar]
  36. Rienecker, M.M.; Suarez, M.J.; Gelaro, R.; Todling, R.; Bacmeister, J.; Liu, E.; Bosilovich, M.G.; Schubert, S.D.; Takacs, L.; Kim, G.K. MERRA: NASA’s Modern-Era Retrospective Analysis for Research and Applications. J. Clim. 2011, 24, 3624–3648. [Google Scholar] [CrossRef]
  37. Ashouri, H.; Hsu, K.L.; Sorooshian, S.; Braithwaite, D.K.; Knapp, K.R.; Cecil, L.D.; Nelson, B.R.; Prat, O.P. PERSIANN-CDR: Daily Precipitation Climate Data Record from Multisatellite Observations for Hydrological and Climate Studies. Bull. Am. Meteorol. Soc. 2014, 96, 197–210. [Google Scholar] [CrossRef]
  38. Sun, Q.; Miao, C.; Duan, Q.; Ashouri, H.; Sorooshian, S.; Hsu, K.L. A review of global precipitation datasets: Data sources, estimation, and intercomparisons. Rev. Geophys. 2018, 56, 79–107. [Google Scholar] [CrossRef]
  39. Wei, W.; Hui, L.; Yang, D.; Khem, S.; Yang, J.; Gao, B.; Peng, X.; Pang, Z. Modelling Hydrologic Processes in the Mekong River Basin Using a Distributed Model Driven by Satellite Precipitation and Rain Gauge Observations. PLoS ONE 2016, 11, e0152229. [Google Scholar] [CrossRef]
  40. Delgado, J.M.; Merz, B.; Apel, H. A climate-flood link for the lower Mekong River. Hydrol. Earth Syst. Sci. 2012, 16, 1533–1541. [Google Scholar] [CrossRef] [Green Version]
  41. Ruane, A.C.; Goldberg, R.; Chryssanthacopoulos, J. Climate forcing datasets for agricultural modeling: Merged products for gap-filling and historical climate series estimation. Agric. For. Meteorol. 2015, 200, 233–248. [Google Scholar] [CrossRef]
  42. Reichle, R.H.; Koster, R.D.; De Lannoy, G.J.M.; Forman, B.A.; Liu, Q.; Mahanama, S.P.P.; Touré, A. Assessment and Enhancement of MERRA Land Surface Hydrology Estimates. J. Clim. 2011, 24, 6322–6338. [Google Scholar] [CrossRef] [Green Version]
  43. Alijanian, M.; Rakhshandehroo, G.R.; Mishra, A.K.; Dehghani, M. Evaluation of satellite rainfall climatology using CMORPH, PERSIANN-CDR, PERSIANN, TRMM, MSWEP over Iran. Int. J. Climatol. 2017, 37, 4896–4914. [Google Scholar] [CrossRef]
  44. Worqlul, A.W.; Maathuis, B.; Adem, A.A.; Demissie, S.S.; Langan, S.; Steenhuis, T.S. Comparison of rainfall estimations by TRMM 3B42, MPEG and CFSR with ground-observed data for the Lake Tana basin in Ethiopia. Hydrol. Earth Syst. Sci. 2014, 18, 4871–4881. [Google Scholar] [CrossRef] [Green Version]
  45. Tuo, Y.; Duan, Z.; Disse, M.; Chiogna, G. Evaluation of precipitation input for SWAT modeling in Alpine catchment: A case study in the Adige river basin (Italy). Sci. Total Environ. 2016, 573, 66–82. [Google Scholar] [CrossRef] [Green Version]
  46. Yong, B.; Chen, B.; Gourley, J.J.; Ren, L.; Hong, Y.; Chen, X.; Wang, W.; Chen, S.; Gong, L. Intercomparison of the Version-6 and Version-7 TMPA precipitation products over high and low latitudes basins with independent gauge networks: Is the newer version better in both real-time and post-real-time analysis for water resources and hydrologic extremes? J. Hydrol. 2014, 508, 77–87. [Google Scholar] [CrossRef]
  47. Krzysztofowicz, R. Integrator of uncertainties for probabilistic river stage forecasting: Precipitation-dependent model. J. Hydrol. 2001, 249, 69–85. [Google Scholar] [CrossRef]
  48. Ajami, N.K.; Duan, Q.; Sorooshian, S. An integrated hydrologic Bayesian multimodel combination framework: Confronting input, parameter, and model structural uncertainty in hydrologic prediction. Water Resour. Res. 2007, 43. [Google Scholar] [CrossRef] [Green Version]
  49. Gebremichael, M.; Bitew, M.M.; Hirpa, F.A.; Tesfay, G.N. Accuracy of satellite rainfall estimates in the Blue Nile Basin: Lowland plain versus highland mountain. Water Resour. Res. 2015, 50, 8775–8790. [Google Scholar] [CrossRef]
  50. Arnold, J.G.; Moriasi, D.N.; Gassman, P.W.; Abbaspour, K.C.; White, M.J.; Srinivasan, R.; Santhi, C.; Harmel, R.; Van Griensven, A.; Van Liew, M.W. SWAT: Model use, calibration, and validation. Trans. Asabe 2012, 55, 1491–1508. [Google Scholar] [CrossRef]
  51. Gan, R.; Luo, Y.; Zuo, Q.T.; Sun, L. Effects of projected climate change on the glacier and runoff generation in the Naryn River Basin, Central Asia. J. Hydrol. 2015, 523, 240–251. [Google Scholar] [CrossRef] [Green Version]
  52. Wu, H.; Chen, B. Evaluating uncertainty estimates in distributed hydrological modeling for the Wenjing River watershed in China by GLUE, SUFI-2, and ParaSol methods. Ecol. Eng. 2015, 76, 110–121. [Google Scholar] [CrossRef]
  53. Abbaspour, K.C.; Genuchten, M.T.V.; Schulin, R.; Schläppi, E. A sequential uncertainty domain inverse procedure for estimating subsurface flow and transport parameters. Water Resour. Res. 1997, 33, 1879–1892. [Google Scholar] [CrossRef] [Green Version]
  54. Nash, J.E.; Sutcliffe, J.V. River flow forecasting through conceptual models part I—A discussion of principles. J. Hydrol. 1970, 10, 282–290. [Google Scholar] [CrossRef]
  55. Blazkova, S.; Beven, K. A limits of acceptability approach to model evaluation and uncertainty estimation in flood frequency estimation by continuous simulation: Skalka catchment, Czech Republic. Water Resour. Res. 2009, 45. [Google Scholar] [CrossRef] [Green Version]
  56. Biondi, D.; De Luca, D.L. Rainfall-runoff model parameter conditioning on regional hydrological signatures: Application to ungauged basins in southern Italy. Hydrol. Res. 2017, 48, 714–725. [Google Scholar] [CrossRef]
  57. Abbaspour, K.C.; Johnson, C.A.; Genuchten, M.T.V. Estimating Uncertain Flow and Transport Parameters Using a Sequential Uncertainty Fitting Procedure. Vadose Zone J. 2004, 3, 1340–1352. [Google Scholar] [CrossRef]
  58. Tang, G.; Ma, Y.; Long, D.; Zhong, L.; Hong, Y. Evaluation of GPM Day-1 IMERG and TMPA Version-7 legacy products over Mainland China at multiple spatiotemporal scales. J. Hydrol. 2016, 533, 152–167. [Google Scholar] [CrossRef]
  59. Tong, K.; Su, F.; Yang, D.; Hao, Z. Evaluation of satellite precipitation retrievals and their potential utilities in hydrologic modeling over the Tibetan Plateau. J. Hydrol. 2014, 519, 423–437. [Google Scholar] [CrossRef]
  60. Xu, R.; Tian, F.; Yang, L.; Hu, H.; Lu, H.; Hou, A. Ground Validation of GPM IMERG and TRMM 3B42V7 Rainfall Products over Southern Tibetan Plateau Based on a High-Density Rain-Gauge Network. J. Geophys. Res. Atmos. 2017, 122, 910–924. [Google Scholar] [CrossRef]
  61. Tang, G.; Behrangi, A.; Long, D.; Li, C.; Hong, Y. Accounting for spatiotemporal errors of gauges: A critical step to evaluate gridded precipitation products. J. Hydrol. 2018, 559, 294–306. [Google Scholar] [CrossRef]
  62. Jiang, S.; Liu, S.; Ren, L.; Yong, B.; Zhang, L.; Wang, M.; Lu, Y.; He, Y. Hydrologic Evaluation of Six High Resolution Satellite Precipitation Products in Capturing Extreme Precipitation and Streamflow over a Medium-Sized Basin in China. Water 2018, 10, 25. [Google Scholar] [CrossRef]
Figure 1. Locations of the Mekong River Basin (MRB) and the meteorological and hydrological stations, the sub-figure at the bottom left is the climate region classification of MRB from World Maps of Koppen-Geiger Climate Classification (Notation: A, C, D, E mean equatorial, warm temperature, snow, and polar climates, respectively; m and w mean monsoonal and desert precipitation regimes; a, b, c, and T mean hot summer, warm summer, cool summer, and polar tundra temperature features).
Remotesensing 11 00304 g001
Figure 2. Scatterplots of precipitation comparison for Mekong River basin at daily scale between satellite/reanalysis precipitation products and gauge. The black line is diagonal line, and the best-fit line, which used the least squares method, is blue.
Remotesensing 11 00304 g002
Figure 3. The intensity distribution of daily precipitation in different ranges (0~0.1, 0.1~1, 1~5, 5~10, 10~20, and >20 mm/day), and their relative contribution to the total precipitation amounts during the period 1998 to 2007 (Notation: the intensity of 0~0.1 contributed less rainfall (<1%), so it is not shown in the right corner of Figure 3).
Remotesensing 11 00304 g003
Figure 4. The intensity distribution of daily precipitation in different ranges (0~0.1, 0.1~1, 1~5, 5~10, 10~20, and >20 mm/day), and their relative contribution to the total precipitation amounts during the period 1998 to 2007 in six climatic zones (Line 1: ET, Line 2: Dwc, Line 3: Cwb, Line 4: Cwa, Line 5: Aw, and Line 6: Am).
Remotesensing 11 00304 g004
Figure 5. Box plots of observed and simulated streamflow data during the calibration (left panel, 2000 to 2003) and validation (right panel, 2004 to 2007) periods (Notation: The upper and lower bounds are determined by the 75th percentile and 25th percentile; the black dots represent the average of observed or simulated streamflow; the outliers represent large streamflow values observed or simulated; and the horizontal lines inside the box represent the median of the variable).
Remotesensing 11 00304 g005
Figure 6. Parameter distributions of six more sensitive hydrological parameters for the four precipitation products: red points represent the best-suited parameter.
Remotesensing 11 00304 g006
Figure 7. Comparison of SWAT-simulated streamflow with fixed parameters and observed streamflow in MRB in the calibration and validation periods (January 2000 to December 2007) at daily scale. (a: Gauge, b: AgMERRA, c: MSWEP, d: PERSIANN-CDR, and e: TMPA).
Remotesensing 11 00304 g007
Table 1. Background information for selected global precipitation products used in this study.
DatasetCoveragePeriodSpatial ResolutionTemporal ResolutionData Source
AgMERRAGlobal1980–20100.25°Dailyhttps://data.giss.nasa.gov/impacts/agmipcf/agmerra/
MSWEP60°S-N1979–present0.1°3-Hourly/Dailyhttp://www.gloh2o.org/
PERSIANN-CDR60°S-N1983–present0.25°Dailyhttp://chrsdata.eng.uci.edu/
TMPA50°S-N1998–present0.25°Dailyhttps://trmm.gsfc.nasa.gov/
Gauge observationsMRB1998–2007PointDailyChina Meteorological Administration; MRC
Table 2. List of statistical metrics used in statistical evaluation and SWAT simulation and their perfect values.
Statistic MetricEquationPerfect Value
Correlation coefficient (CC) CC = 1 N n = 1 N ( S n S ¯ ) ( G n G ¯ ) σ S σ G 1
Root mean square error (RMSE) RMSE = 1 N n = 1 N ( S n G n ) 2 0
Mean error (ME) ME = 1 N n = 1 N ( S n G n ) 0
Probability of detection (POD) POD = n 11 n 11 + n 01 1
False alarm ratio (FAR) FAR = n 10 n 11 + n 10 0
Critical success index (CSI) CSI = n 11 n 11 + n 01 + n 10 1
Nash-Sutcliffe coefficient efficiency (NSE) NSE = 1 n = 1 N ( S n G n ) 2 n = 1 N ( G n G ¯ ) 2 1
Percent bias measures (PBIAS) PBIAS = 100 % × n = 1 N ( G n S n ) n = 1 N G n 0
(Notation: N represents the number of variables; S n represents the satellite/reanalysis precipitation estimate or simulated streamflow; G n represents the gauge observed precipitation or streamflow; σ S represents standard deviations of satellite/reanalysis precipitation or simulated streamflow; σ G represents standard deviations of gauge observed precipitation or streamflow; n 11 represents precipitation detected both by gauge and satellite product; n 01 represents precipitation detected by gauge but not detected by satellite precipitation product; n 10 is contrary to n 01 ; S ¯ represents the mean value of satellite/reanalysis precipitation estimates or simulated streamflow; and G ¯ represents the mean value of gauge observed precipitation or streamflow).
Table 3. Initial ranges of 10 more sensitive calibrated parameters and their final optimal values for five precipitation inputs (Gauge, AgMERRA, MSWEP, PERSIANN-CDR, and TMPA).
ParametersDescriptionCalibration RangeBest Value
V_ALPHA_BNKBase flow factor for bank storage0~10.26/0.65/0.35/0.68/0.83
R_CN2SCS runoff curve number−0.2~0.2−0.01/−0.42/0.09/−0.04/−0.08
V_CH_K2Effective hydraulic conductivity in main channel alluvium0~50067.8/121/142.3/164.9/236.5
V_CH_N2Effective hydraulic conductivity in main channel alluvium0~0.30.15/0.14/0.12/0.19/0.27
R_SOL_BDMoist bulk density−0.5~0.6−0.5/0.74/−0.14/−0.42/−0.4
V_ESCOSoil evaporation compensation factor0~10.65/0.27/0.52/0.01/0.22
V_GW_REVAPGroundwater “revap” coefficient0.02~0.20.05/0.09/0.04/0.20/0.19
V_GW_DELAYGroundwater delay (days)0~500334/24.1/224.2/63.6/64.5
R_HRU_SLPAverage slope steepness−0.5~0.5−0.26/−0.09/0.32/0.18/0.06
V_TLAPSTemperature lapse rate−10~103.9/0.32/4.9/3.1/9.1
(Notation: “V_” and “R_” mean a replacement and a relative change based on the initial parameter values, respectively).
Table 4. List of evaluation metrics for AgMRRA, MSWEP, PERSIANN-CDR, and TMPA with gauge observations at daily resolution over six different climatic zones in MRB. The threshold for the occurrence of rainfall events is daily precipitation greater than 0.1 mm.
Climatic ZonesProductsCCRMSE (mm)ME (mm)PODFARCSI
ETAgMERRA0.692.04 *−0.110.840.14 *0.74 *
MSWEP0.70 *2.970.710.820.160.70
PERSIANN-CDR0.474.000.920.89 *0.290.65
TMPA0.492.780.06 *0.820.260.64
DwcAgMERRA0.594.56 *0.37 *0.760.27 *0.59 *
MSWEP0.63 *6.841.720.79 *0.300.59 *
PERSIANN-CDR0.306.430.770.690.380.48
TMPA0.385.940.850.730.510.42
CwbAgMERRA0.68 *4.20 *−0.160.850.10 *0.78 *
MSWEP0.68 *4.42−0.12 *0.820.10 *0.75
PERSIANN-CDR0.435.89−0.12 *0.820.150.72
TMPA0.604.890.12 *0.93 *0.290.68
CwaAgMERRA0.77 *4.12 *−0.130.93 *0.100.84 *
MSWEP0.754.41−0.340.880.07 *0.82
PERSIANN-CDR0.595.67−0.190.860.110.77
TMPA0.744.610.08 *0.890.080.82
AwAgMERRA0.784.82−0.630.910.080.84
MSWEP0.82 *4.27 *−0.610.880.04 *0.85
PERSIANN-CDR0.774.59−0.190.93 *0.090.85
TMPA0.82 *4.31−0.08 *0.900.050.86 *
AmAgMERRA0.665.11−0.160.900.120.80
MSWEP0.73 *4.54 *−0.410.890.05 *0.85 *
PERSIANN-CDR0.705.020.960.95 *0.130.83
TMPA0.724.61−0.14 *0.900.060.85 *
(Notation: the best metric values in each climatic region are marked with ”*”)
Table 5. Indexes for the performance of SWAT model both in calibration and validation periods.
PeriodGaugeAgMERRAPERSIANN-CDR
NSER2PBIAS (%)NSER2PBIAS (%)NSER2PBIAS (%)
Calibration0.920.92−4.00.910.9314.10.920.922.0
Validation0.940.94−2.80.890.93−7.70.890.92−10.1
PeriodMSWEPTMPA
NSER2PBIAS (%)NSER2PBIAS (%)
Calibration0.910.9411.80.940.944.2
Validation0.900.94−10.80.920.94−8.1
(Notation: all indexes here are calculated based on the optimal simulated flow in the third iteration)
Table 6. P and R values of the third iteration.
IterationAgMERRAMSWEPPERSIANN-CDRTMPA
PRPRPRPR
Third iteration0.950.740.991.120.940.680.970.70
Table 7. Optimal simulation value of the main hydrological cycle variables over the calibration and validation period (from 2000 to 2007, Unit: mm).
ProductsPCPTWSRBFETPC
Gauge1602.8812.7512.6271.3740.6260.7
AgMERRA1521.3725.242.1499.6690.0500.5
MSWEP1505.0747.7550.9103.5718.4104.0
PERSIANN-CDR1698.8793.3352.9466.1944.0465.6
TMPA1631.6773.2398.9485.6893.9485.6
(PCP: precipitation; TW: total water yield; SR: surface runoff; BF: baseflow; ET: evapotranspiration; and PC: percolation).
Table 8. Values of the fixed parameter set used for each precipitation input.
Parameterv_ALPHA_BNKr_CN2v_CH_K2v_CH_N2r_SOL_BD
Value0.55−0.09146.520.17−0.15
Parameterv_ESCOv_GW_REVAPv_GW_DELAYr_HRU_SLPv_TLAPS
Value0.340.11142.20.044.28
Table 9. Comparison of daily-observed streamflow and simulated streamflow with fixed hydrological parameters for MRB.
Precipitation ProductNSER2RMSE (m3/s)PBIAS (%)
Gauge0.910.924324.65.1
AgMERRA0.740.857426.622.5
MSWEP0.790.896741.321.4
PERSIANN-CDR0.860.905500.7−19.2
TMPA0.890.934762.5−17.4

