Article

Fusion of Multiscale Convolutional Neural Networks for Building Extraction in Very High-Resolution Images

1
School of Geosciences, China University of Petroleum (East China), Qingdao 266580, China
2
Laboratory for Marine Mineral Resources, Qingdao National Laboratory for Marine Science and Technology, Qingdao 266071, China
3
Key Laboratory of Deep Oil and Gas, Qingdao 266580, China
4
Shandong Provincial Climate Center, Jinan 250000, China
5
School of Computer Sciences, Guangdong Polytechnic Normal University, Guangzhou 510000, China
*
Authors to whom correspondence should be addressed.
Remote Sens. 2019, 11(3), 227; https://doi.org/10.3390/rs11030227
Submission received: 29 December 2018 / Revised: 20 January 2019 / Accepted: 21 January 2019 / Published: 22 January 2019

Abstract

:
Extracting buildings from very high resolution (VHR) images has attracted much attention but is still challenging due to their large varieties in appearance and scale. Convolutional neural networks (CNNs) have shown effective and superior performance in automatically learning high-level and discriminative features in extracting buildings. However, the fixed receptive fields make conventional CNNs insufficient to tolerate large scale changes. Multiscale CNN (MCNN) is a promising structure to meet this challenge. Unfortunately, the multiscale features extracted by MCNN are always stacked and fed into one classifier, which make it difficult to recognize objects with different scales. Besides, the repeated sub-sampling processes lead to a blurred boundary of the extracted features. In this study, we proposed a novel parallel support vector mechanism (SVM)-based fusion strategy to take full use of deep features at different scales as extracted by the MCNN structure. We firstly designed a MCNN structure with different sizes of input patches and kernels, to learn multiscale deep features. After that, features at different scales were individually fed into different support vector machine (SVM) classifiers to produce rule images for pre-classification. A decision fusion strategy is then applied on the pre-classification results based on another SVM classifier. Finally, superpixels are applied to refine the boundary of the fused results using region-based maximum voting. For performance evaluation, the well-known International Society for Photogrammetry and Remote Sensing (ISPRS) Potsdam dataset was used in comparison with several state-of-the-art algorithms. Experimental results have demonstrated the superior performance of the proposed methodology in extracting complex buildings in urban districts.

Graphical Abstract

1. Introduction

With the acceleration of urbanization, building extraction becomes increasingly essential for urban planning, change monitoring, population estimation, and disaster assessment [1,2]. As remote sensed techniques improved, high resolution images even very high resolution (VHR) images provided by satellites, spaceborne, and airborne are more and more popular [3,4,5]. The availability of these images makes it possible to distinguish buildings from background objects [6]. However, completely extracting buildings from VHR images with high accuracy is still a challenge. For one thing, the shape and scale of buildings are various, which makes it difficult to detect buildings with all scales using a uniform scale model. For another, due to the increasing spatial resolution and different roofing materials, structures and designs, the buildings will have a large-variety in appearance. Therefore, it is challenge to extract robust and discriminative representations of buildings in VHR images.
Over the last two decades, many related research has been conducted on building extraction [7,8,9,10,11]. Based on the remotely used sensed data, the building extraction can be divided into two categories: One is just based on optical satellite data [12,13,14], and the other one is based on multi-sensor data such as Light Detection and Ranging (LIDAR), light data and Synthetic Aperture Radar (SAR) [15,16,17,18]. In the first category, buildings are often extracted based on some low-level spectral and spatial features, such as shape index [14], texture features [13], canny edge detection [19], scale invariant feature transform [20], and nearby shadows [12]. As for the second sort of method, the auxiliary data can give detailed features such as height information and is reported to obtain more reliable results. However, these data are more difficult and expensive to acquire [1]. Although these methods have been reported effectively in building extraction, they are all based on hand-crafted features, which significantly requires the experience and knowledge of end-users [21]. Besides, due to the strong inter-class variety of buildings in VHR images, these traditional features still show much mixture. To this end, in order to accurately extract complex buildings in urban areas, it is urgent to develop more effective and efficient feature extraction methods in VHR images.
Instead of conventional hand-crafted feature design, deep learning recently has shown great potential in designing discriminative features [22,23,24]. The use of deep learning in remotely sensed images processing is also rapidly growing, mainly because of its superiority in extracting high-level features without any data preprocessing and the end-to-end feature learning ability [25,26]. Unlike low-level features, the features generated by deep learning are more robust and representative [27,28]. There are sorts of deep learning-based networks have been developed, such as Deep Belief Neural Network (DBN) [29], Convolutional Neural Network (CNN) [30], Long Short-term Memory (LSTM) [31], and Generative Adversarial Network (GAN) [32]. Among these deep learning-based networks, CNN is the most popular one in the remote sensing field [33,34]. This network generates the promising performance relying on its national ability to extract hierarchical and discriminative features automatically, ranging from low-level features such as corners and edges, to high-level features such as whole objects [26]. Besides, CNN can effectively combine spectral and spatial information simultaneously just rely on original data itself, which also contribute its capability in image processing [35].
Inspired by the success of CNN in remote sensing, more and more studies take use of CNN to extract buildings especially in VHR images [19,33,35,36,37,38,39]. And based on CNN architecture, many novel networks have also been constructed for building extraction, such as the deep CNN (DCNN) [40], the deep deconvolutional neural network (DeCNN) [41], the deep convolutional encoder-decoder (DECD) network [42], the fully convolutional network (FCN) [35] and the object-based CNN (OCNN) [39]. These methods have been reported the effectiveness of CNN in building extraction. However, it is still need to be argued to use CNN model directly for building extraction of VHR images. The first problem lies in the fixed receptive fields of CNN, which will result in its poor ability to recognize objects with varied scales [43]. Unfortunately, buildings in VHR images are often appear at various observation scales. Using multiscale CNN models is considered as a promising technique to address this issue. Several studies have developed multiscale CNN models to extract multiscale features in building extraction [44,45,46]. Generally, these models are always conducted by multiscale inputs and different kernel sizes in CNN architecture to extract multiscale deep features. However, these features are always stacked together and then fed into one classifier. In this way, features at each source are treated equally, and it is difficult for single classifier to match different features together, which lead to the poor performance in recognizing objects at different scales simultaneously. Besides, CNN is insensitive to the object boundary, leading to its poor ability to localize objects [47,48]. This is mainly caused by the down-sampling pooling processes in CNN, which make CNN extract more abstract features but at the cost of reduced feature resolution.
To meet these challenges, in this paper, support vector machine (SVM)-based fusion strategy of the multiscale CNN features is proposed for building extraction in VHR images. The multiscale deep features are firstly produced by multiscale CNN models with inputs and kernels at three scales. These features are then separately fed into different SVMs to derive rule images at different scales. Rule images are referred to the primary images of SVM, which contain the distance of each pixel to the hyperplane of the binary classification problem [49]. After that, these rule images are fused with another SVM to derive a building classification result. Finally, a region-based max voting scheme is conducted using superpixels generated by a mean-shift (MS) algorithm. The main contributions of this study lie in the following two aspects: (1) Extended deep features at single scale to multiscale for extracting of buildings; (2) proposed a parallel SVM-based strategy to fuse multiscale CNN results at decision level. The experimental results conducted in the three study areas indicate that the proposed algorithm is outperformed to other popular algorithms.
The remainder of this paper is organized as follows. Section 2 presents the detailed structure of the proposed method for building extraction in VHR images. Section 3 describes the experimental results and the comparisons with other machine learning algorithms. Discussions and conclusions are given in Section 4 and Section 5, respectively.

2. Methodology

In this study, an effective building extraction from VHR images framework is proposed, which combines the discriminative features of objects provided by MCNN and the decision fusion strategy based on SVMs. The overall workflow of the proposed method is illustrated in Figure 1. As we can see, there are three major steps with the proposed algorithm: (A) Multiscale deep features extraction: By learning multiscale features using MCNN models with different inputs and kernel sizes; (B) SVM-based fusion of MCNN: Generating rule images based on different SVM models and fused them using another SVM classifier at decision level; (C) boundary refinement: Using superpixels to provide building boundary by region-based max voting to produce the ultimate building maps.

2.1. Basic Theory of CNN

Compared with traditional building extraction algorithms, CNN is a more effective one since it can extract hierarchical representative features of buildings [25]. Traditionally, a classic CNN is a fed-back multilayer network which contains two sorts of typical layers, named convolutional layers and pooling layers [30]. The convolutional layers can generate various convoluted features by different filters, and the pooling layers are used to make the feature maps extracted by convolutional layers more abstract and robust via sub-sampling operation.
Generally, at l t h convolutional layer, the feature maps of ( l 1 ) t h layer are firstly convolved with learnable filters k , and then the output feature maps of l t h will be produced through a nonlinear activation function g ( · ) . The activation function g ( · ) here is commonly specified to be the sigmoid function, or the hyperbolic tangent function and rectified linear units [50]. Therefore, the l t h convolutional layer C l can be summarized as
C l = g ( k l h l 1 + b l )
where h l 1 refers to the hidden layer in which h 0 is the raw input. b l is the bias term of the l t h layer feature map. When the convolutional layer works, each filter k will slide over the entire image and produces feature maps. One superiority of the convolutional layer in CNN is that it can learn and choose the best filter for the entire network [43].
The pooling layers are always followed by convolutional layers, which offers to generalize the features produced by convolutional layers more robust and further can reduce the computational complexity by using a sub-sampling operation. Pooling layers P l are defined as
P l = g ( d o w n ( h l 1 ) + b l )
where d o w n ( · ) represents a sub-sampling function. Typically, it will sum over each distinct n-by-n block in the input map thus that the output feature maps are n-times smaller than previous ones. Each output map is given its own additive bias parameter b l , which is similar to convolutional layers.

2.2. Multiscale Deep Features Extraction

To extract deep features at different scales to describe complex buildings, we constructed a multiscale CNN structure in this paper. We used image patches at three different sizes as inputs to feed into three corresponding CNN models with three different kernel sizes, respectively. Specifically, the small scale will contain the inner spatial information, and the medium scale will contain the edges and corners, while the large scale will contain the neighboring and context information, therefore we can get more complete features to extract buildings.
The architecture of the MCNN in this paper is illustrated in Figure 2. As we can see, in order to extract multiscale features of buildings, we used three input patches centered on one pixel at sizes of 14 × 14, 24 × 24 and 34 × 34, respectively. The corresponding CNN models are named CNN14, CNN24, and CNN34. Two convolution and sub-sampling layers are set in CNN models at each scale. Besides, to increase the performance of extracting multiscale features, the kernel sizes of different CNN models are also different. The specific parameters of CNN models at different scales are listed in Table 1. Using different CNN models, there are 192, 108, and 42 feature maps produced, respectively. To this end, the patch at small scale with small convolutional kernel size is focusing on the inner information of buildings, and the patch at medium scale with medium convolutional kernel size may contain the corners and edges information of buildings, while the patch at large scale with large convolutional kernel size will contain the neighboring objects and context information of buildings. Accordingly, this MCNN model can learn and extract multiscale spatial features of buildings.

2.3. SVM-Based Fusion of MCNN

In some existing studies, deep features from different sources are always stacked together and fed into one classifier for further classification. However, in this way, features at each source are treated equally, and it is difficult for a single classifier to match different features together, which lead to the poor performance in recognizing complex objects. Therefore, in this paper, deep features at three scales were fed into three support vector machines (SVM) individually. SVM is a successfully introduced machine learning algorithm in the remote sensing context and reported effective in classification [51,52,53,54]. Considering the land covers in experimental datasets, we set four land-cover classes: Buildings, road, vegetation, and shadow. Five hundred samples of each class were selected randomly, and again using a random sampling strategy, 800 hundred samples of each class were generated as an independent validation set.
Corresponding to input features at three different scales, we used three SVM models. The SVM was trained individually at each scale to estimate the kernel parameter γ and the regularization parameter C. In order to solve the multiclass problems, two main strategies have been proposed to extend original SVM, which is developed as binary classifiers. One is a one-against-one (OAO) strategy and the other is a one-against-all (OAA) strategy [55]. The rule images derived from the OAO strategy has been demonstrated better suited in a multiple classifier system than those from the OAA strategy [49]. Therefore, in this paper, we used the OAO strategy to produce rule images.
In the configuration of SVM, due to the superiority in handling complex nonlinear class distributions and comparatively simple computational complexity, a Gaussian kernel was selected [56]. The training of SVM with the Gaussian kernel and the generation of the rule images were performed using image SVM [57], which is freely available in Enmap-Box and using the LIBSVM approach for training. The best combinations for kernel parameters of γ and C are determined by a grid search using a tenfold cross validation. As shown in Figure 1, after the first three SVM classifiers, there are 18 rule images produced (six rule images of each individual SVM), given the four land-cover classes.
The rule images were then used for the decision fusion to decide the final label of each pixel. In traditional SVM classifications, the decision fusion is conducted using a simple majority voting based on these rule images. In this paper, we used a second SVM for the decision fusion process to take full use of feature information. Specifically, all the rule images derived from the first SVM is firstly combined into one data set. An additional SVM is then applied to these data set consisting of rule images focused on different scales to determine the building classification result, which is demonstrated to outperform the simple majority voting strategy in studies [49,58]. It is noted that the training and validation samples of both the first SVM and the second SVM are sharing.

2.4. Boundary Refinement

By using the SVM-based fusion strategy, the proposed algorithm can predict the position of buildings with different scales. However, due to that the classification and decision fusion processes are based on deep features extracted by CNN, the repeated sub-sampling operations in CNN will make the boundary of buildings blurred, which tends to amplify the building mapping uncertainty. Therefore, further refinement of the extracted results is needed. Combining superpixels is considered as a promising process to address this issue. Superpixels are defined as patches of pixels in which the texture, color, brightness, etc. are similar [59]. The boundary offered by superpixels are clear and the pixels in superpixels are homogeneous, which can be utilized to optimize the MCNN classification maps by a simple voting algorithm.
Over the past years, over 30 sorts of superpixel were developed to the public [60]. These algorithms can be generally divided into two categories: One is based on gradient ascent and the other one is based on graph theory [61]. Gradient ascent methods mainly cover the mean-shift (MS) algorithm [62], the simple linear iterative clustering (SLIC) algorithm [63] and the watershed transform algorithm [64]; while graph theory based methods mainly cover efficient graph-based image segmentation (EGB) [65] and the normalized cuts algorithm [66]. Among these algorithms, the MS algorithm has a good performance in segmenting VHR images with the advantage of a simple parameter and no need for prior knowledge. In addition, the MS algorithm is able to maintain the saliency and edge information, which contributed its wide applications in complex images [62,67,68]. Therefore, the MS algorithm is applied in this paper to generate superpixels.
To integrate the SVM-based classification maps with superpixels into final buildings maps, a simple max voting scheme is employed in this paper. The max voting scheme contains three steps. Firstly, the MCNN classification result is mapped to each superpixel to assign classification labels for all pixels. Then, the classification unit is defined as a superpixel instead of individual pixels in the post-processing. Finally, in the voting process, the mostly frequently appeared label in a superpixel is considered as the final label of this superpixel. For a superpixel r, the label SPr is defined as
S P r = arg max n = 1 N s i g n ( f r ( i , j ) = n )
where (i,j) is the coordinate of the pixel r(i,j), and fr(i,j) is the label of the pixel r(i,j) in superpixel r from the initial MCNN classification result. N is the total number of the expected classes. For all superpixels, the same voting scheme is applied and the ultimate result is obtained.

3. Experimental Results

3.1. Introduction of Datasets

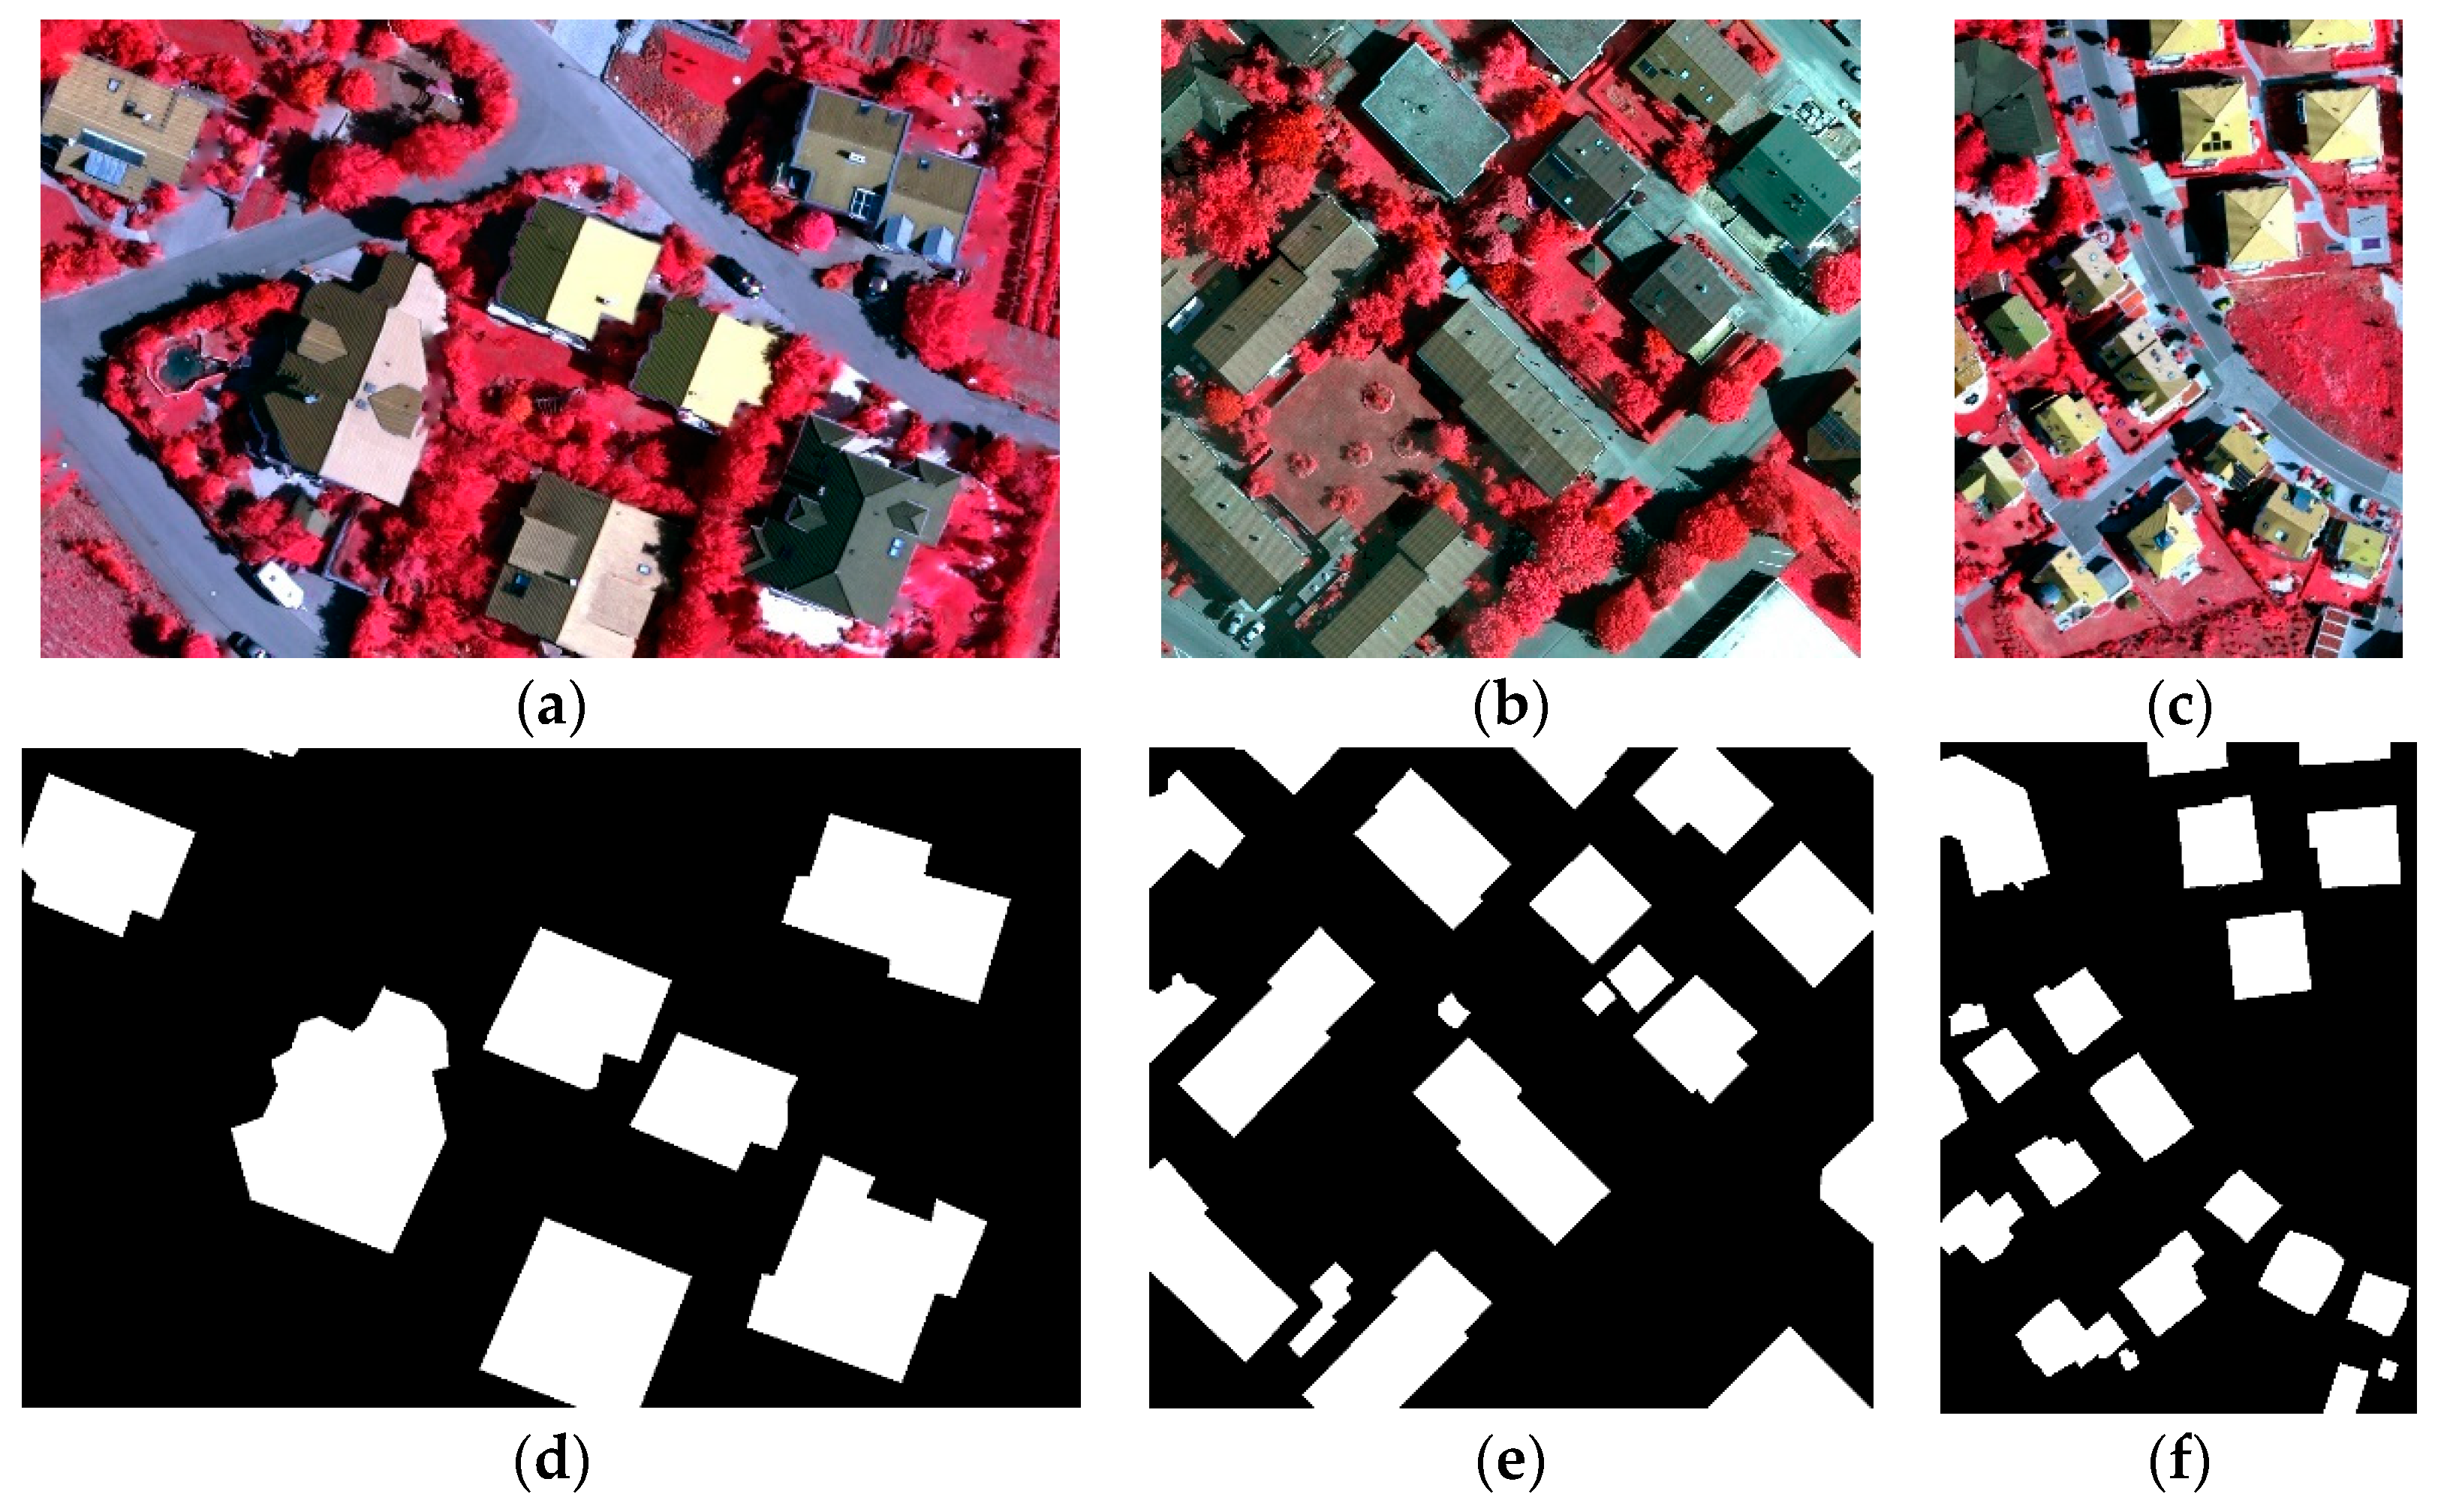
The VHR images used in our experiments consists of three orthophotos from a well-known dataset, named the ISPRS Potsdam 2D semantic VHR remote sensing (Germany) datasets, which are open datasets provided online at http://www2.isprs.org/commissions/comm3/wg4/2d-sem-label-potsdam.html. They contain two sorts of optical images, including near-inferred, red, green bands (NIR-RG) and red, green, blue bands (RGB), respectively. Besides, the Potsdam dataset also contains a digital surface models (DSM) map and a manually annotated ground truth image. In our experiment, we just used the Potsdam NIR-RG image. In order to test the effectiveness of the proposed algorithm under different building environments, we used three images from Potsdam, which contain dense and complex buildings, and the original images and corresponding reference images are illustrated in Figure 3. Experimental images in three study areas are named as Image 1, Image 2, and Image 3, respectively. Additionally, the spatial resolution of images from Potsdam is approximately 0.09 m.

3.2. Experimental Setups

There are several parameters in the experiment that need to be set. Firstly, when using MCNN to extract multiscale features, the input patches centered on a pixel are set to 14 × 14, 24 × 24, 34 × 34, respectively. The kernel sizes of two convolutional layers of the corresponding CNN models are set to 3 × 3, 5 × 5, 7 × 7, respectively. Secondly, when using the MS algorithm to produce superpixels, each image needs to set three scale parameters, named the window widths of color, spatial domain, and the minimum area size. Focusing on different environments of images, the three parameters of image (a), (b), and (c) are all set to 30/12.5/150, and 30/12.5/150 pixels.
To verify the superiority of the proposed algorithm, three algorithms are adopted as the compared algorithms. The compared algorithms and the reasons to configure these compared algorithms are as follows. Firstly, in order to demonstrate the superiority of deep features, we used the original spectral bands instead of deep features as inputs, and the rest processes remains the same, hereafter named comparison 1 algorithm (C1). Secondly, in order to demonstrate the superiority of multiscale deep features, we used the single scale deep features instead of multiscale deep features, and the rest of the processes remain the same, hereafter named comparison 2 algorithm (C2). Thirdly, to verity the effectiveness of separately using the deep features at each scale, the deep features were stacked as one feature set and then fed into one SVM classifier, while the rest of the processes are the same, hereafter named comparison 3 algorithm (C3).

3.3. Precision Evaluation Criteria

In this paper, we used three popular criteria, named Recall, Precision, and F-measure to evaluate the performance of the proposed algorithm [38,69,70]. They are defined as follows.
Recall = T P T P + F P
Precision = T P T P + F N
F - measure = 2 × Precision × Recall Precision + Recall
where TP (true positive) represents the total number of building pixels correctly classified in the reference maps; FP (false positive) represents the number of background pixels misclassified as buildings; FN (false negative) represents the number of true building pixels misclassified as background pixels. Overall, Recall and Precision can draw the building extraction accuracy, and F-measure is a synthetic measurement of Recall and Precision.

3.4. Qualitative Evaluation

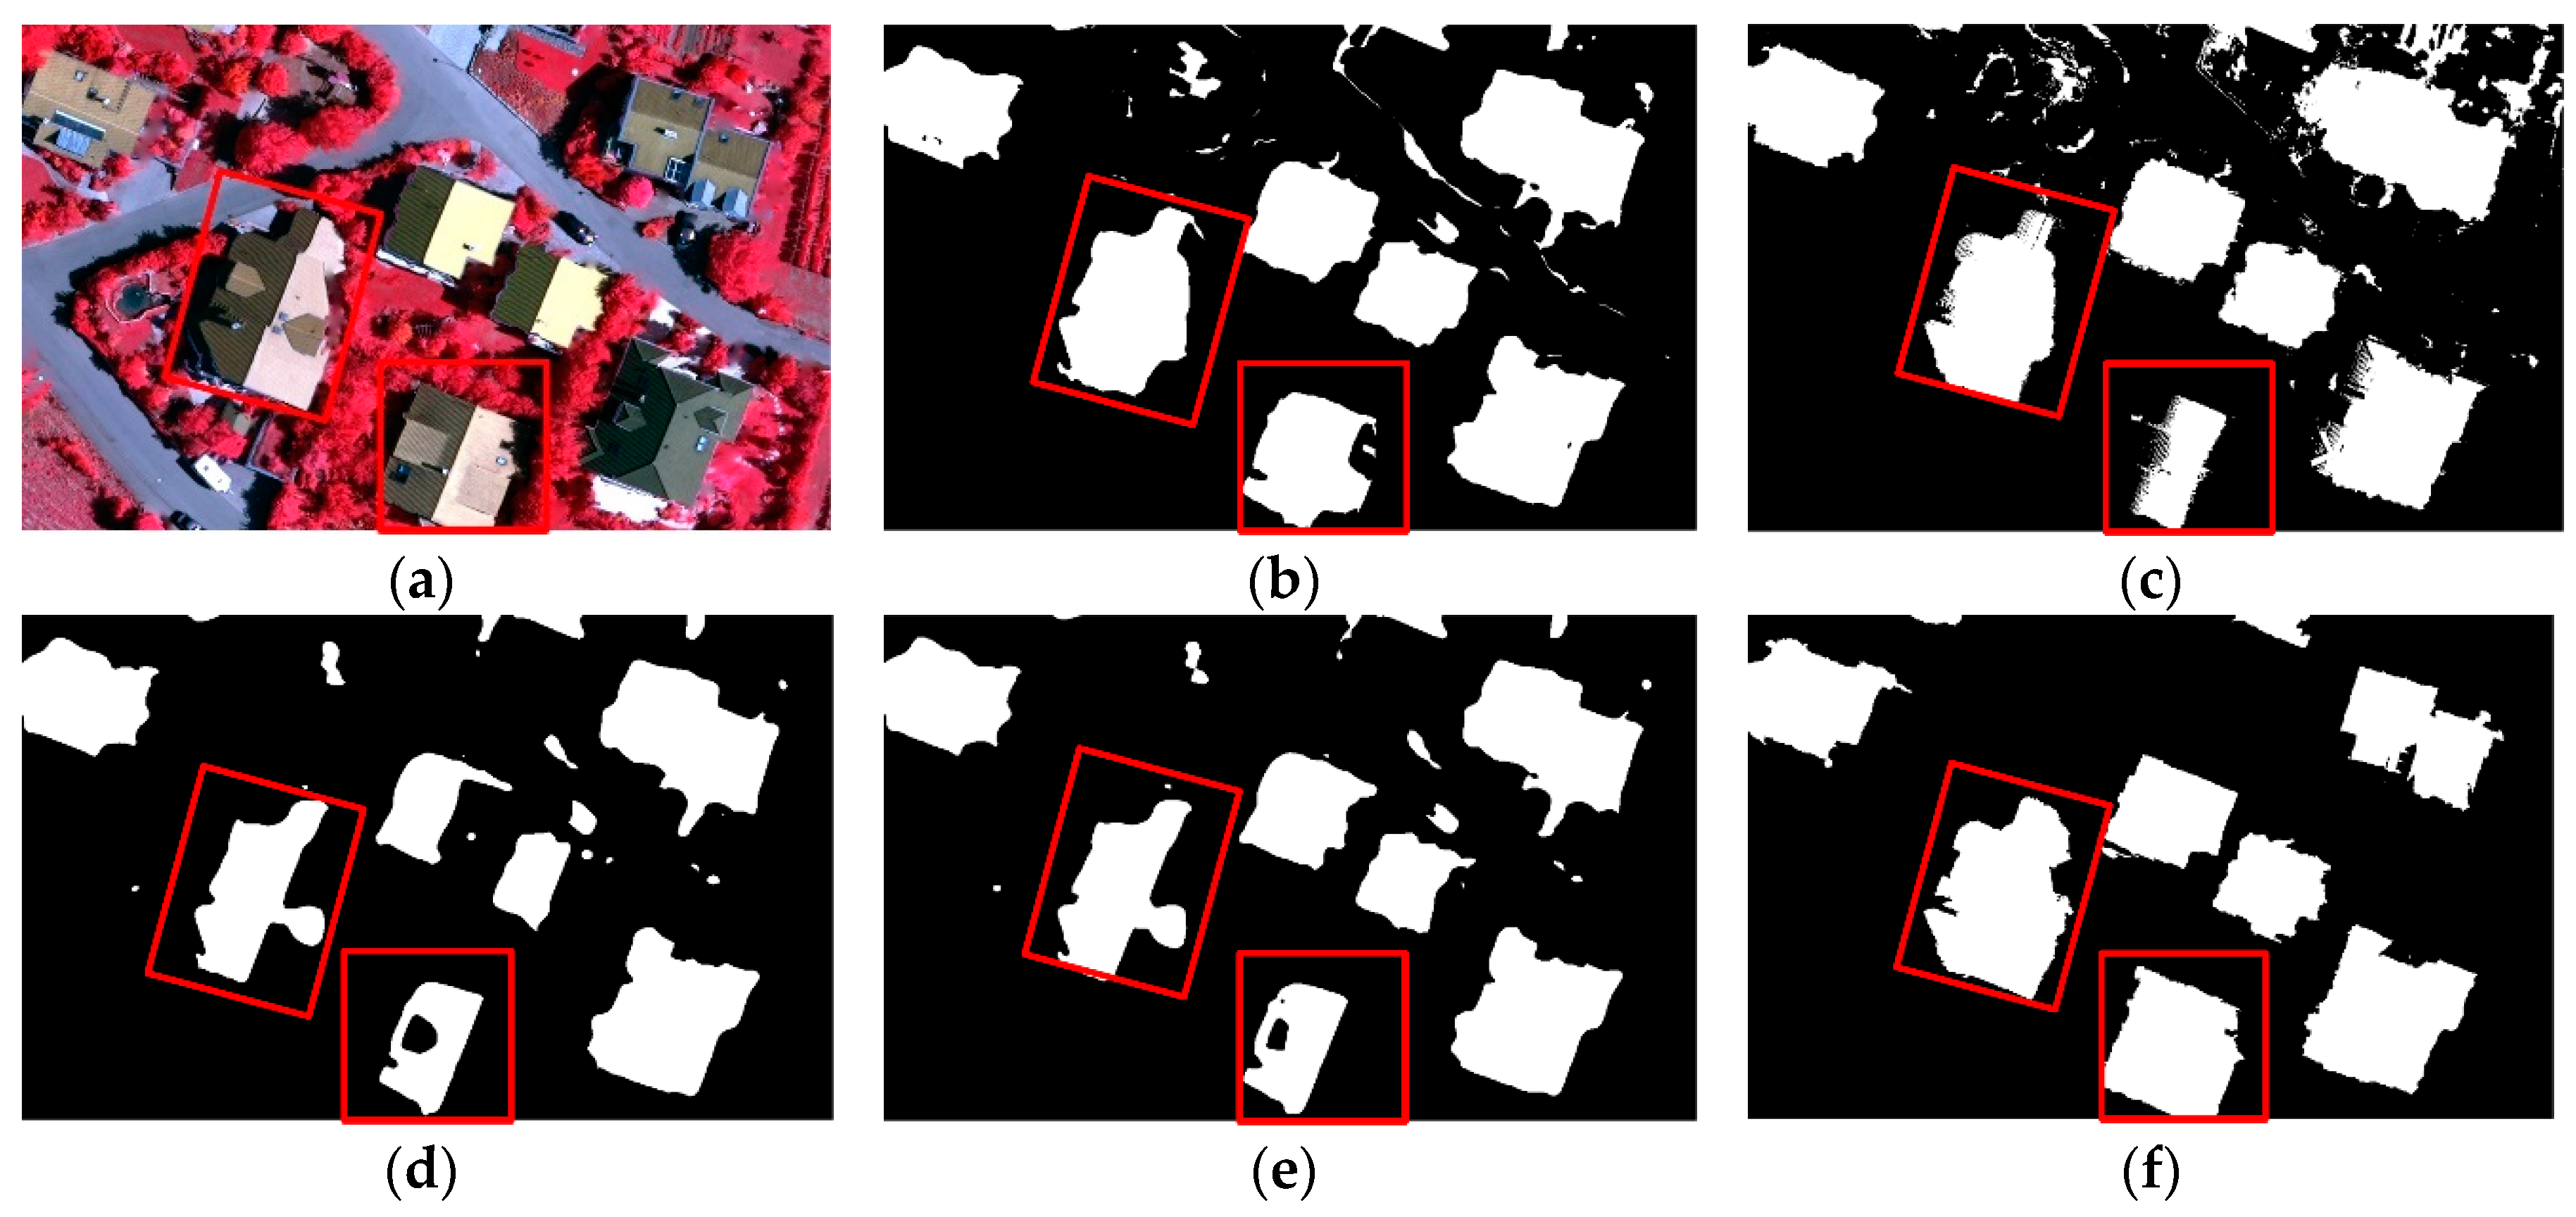
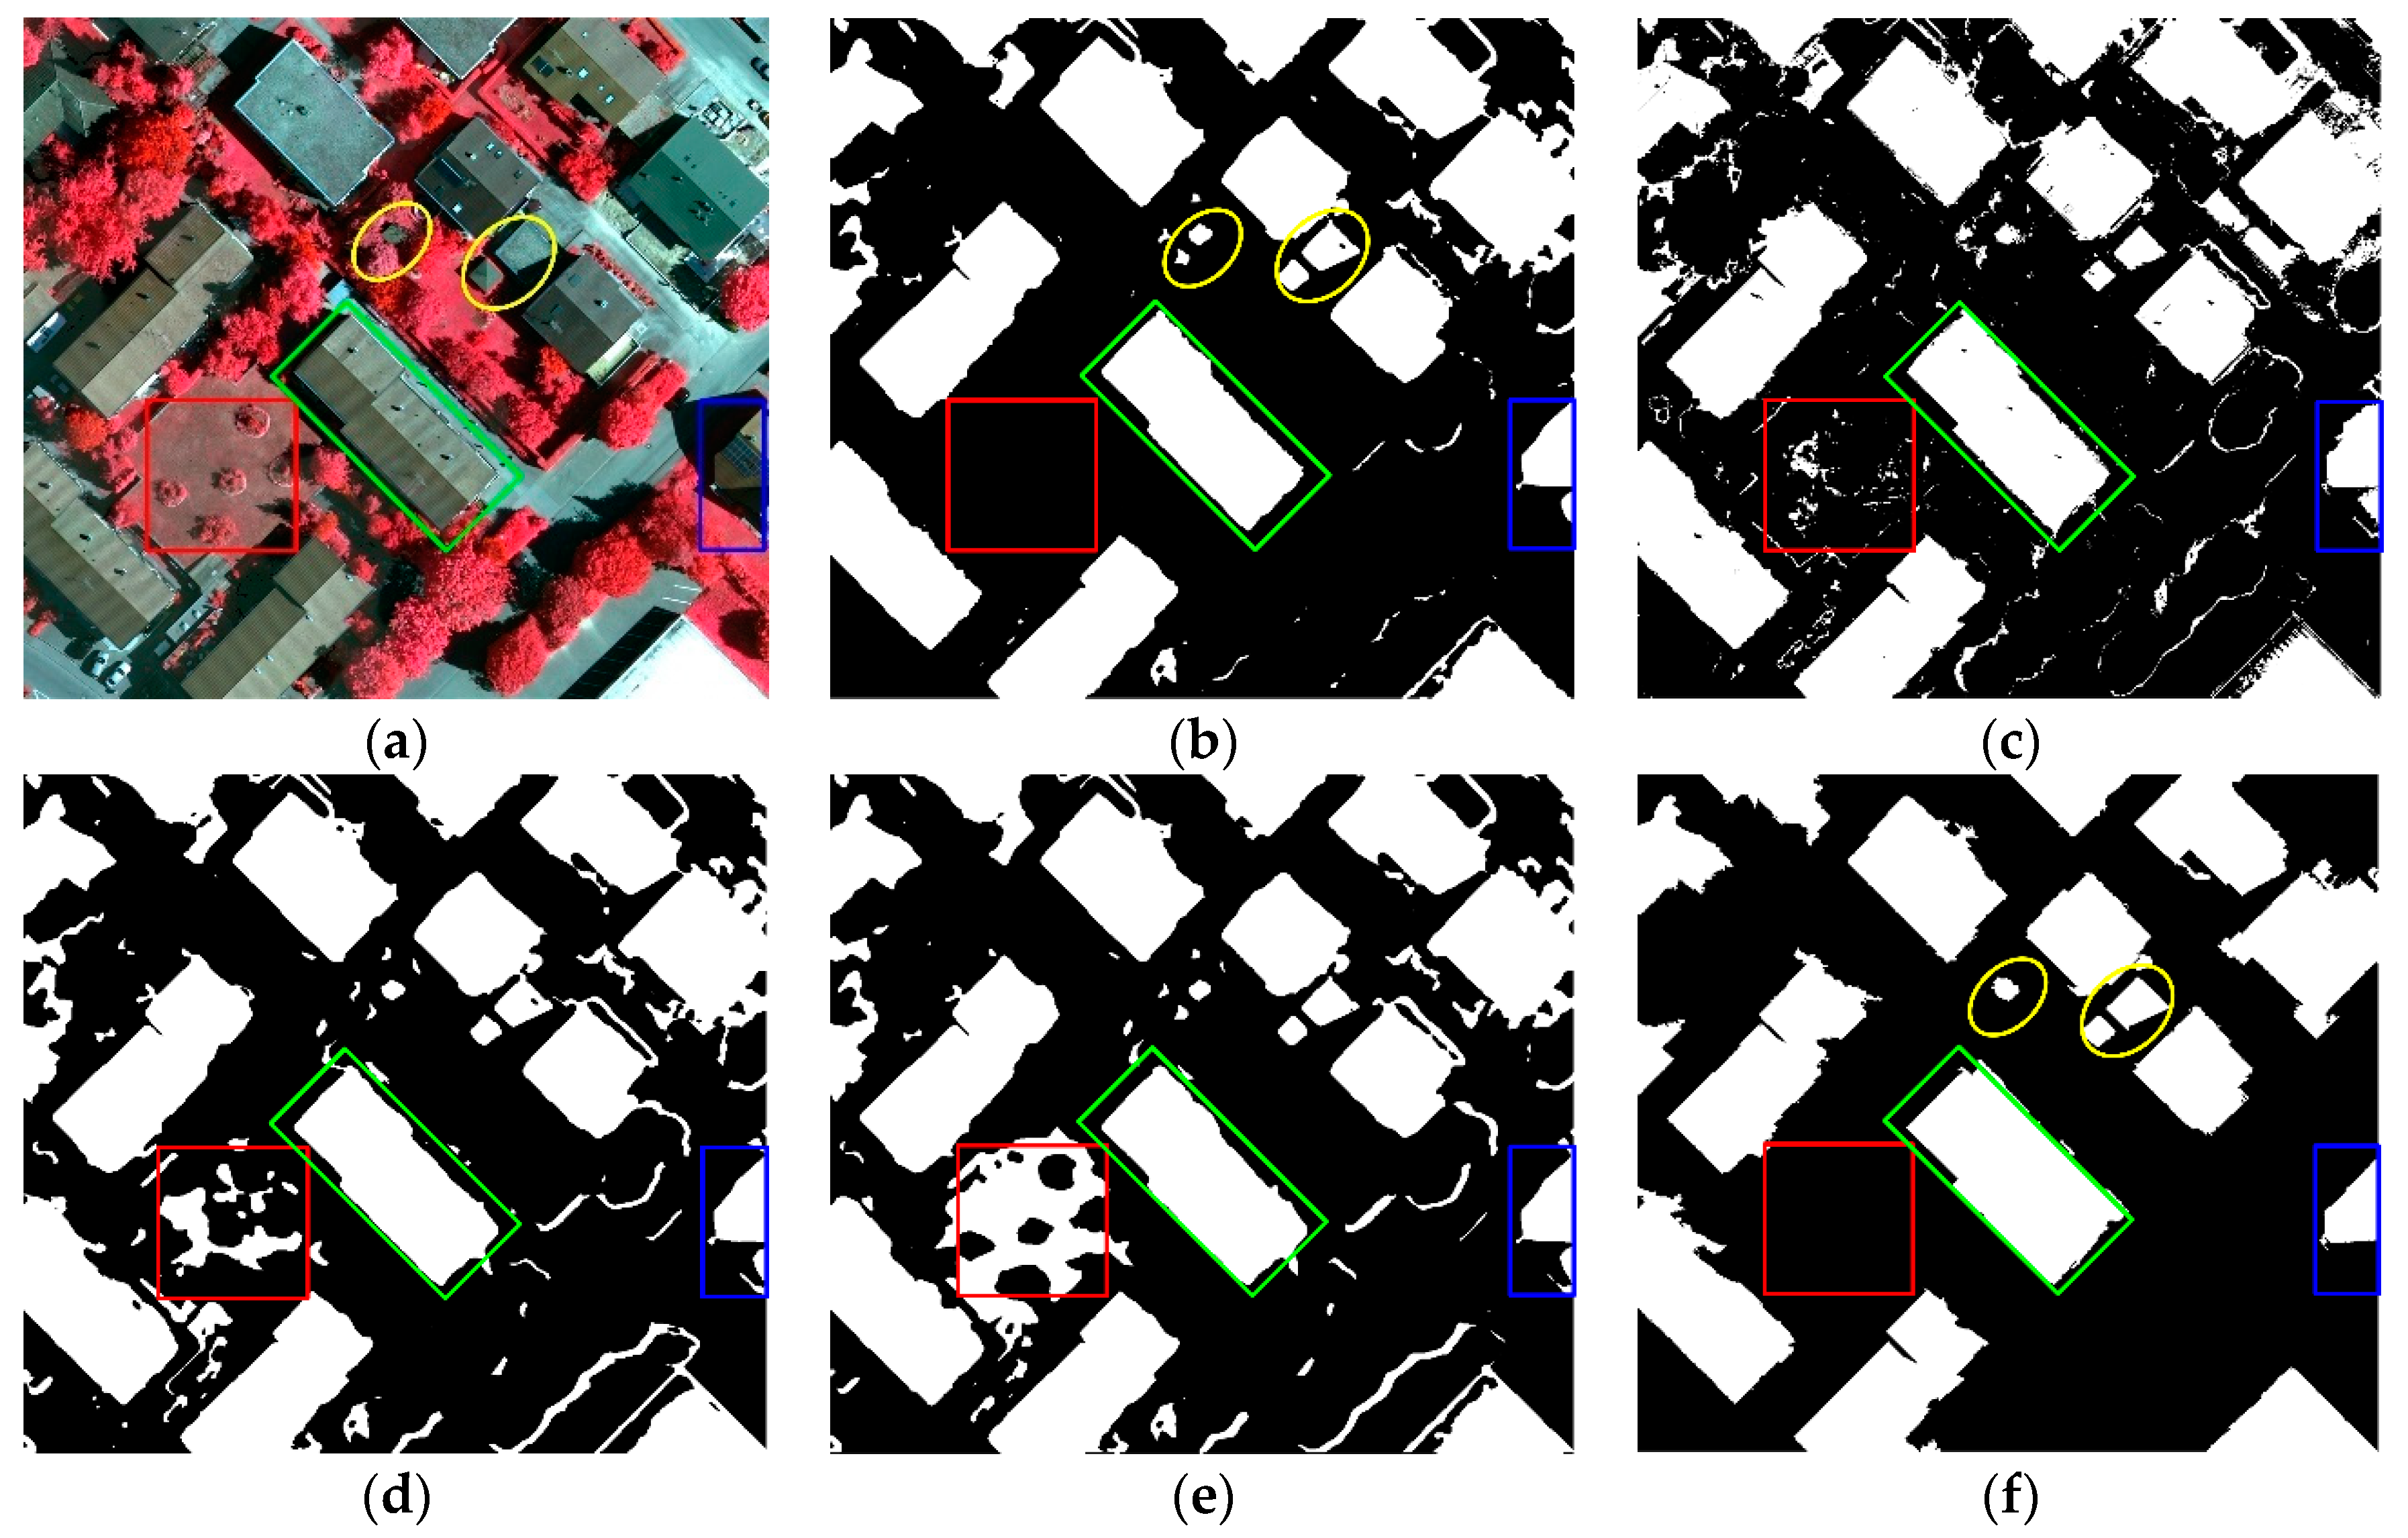
Figure 4, Figure 5 and Figure 6 show the building extraction results by the proposed algorithm and the three compared algorithms. It is noted that the final sub-image of each figure is the ultimate building result of our proposed algorithm which is refined by superpixels. Overall, the better performance of our proposed algorithm is clearly perceivable in all three images. The proposed algorithm can extract buildings with various scales and the extracted buildings are complete and continuous under complex building environments (Figure 4, Figure 5 and Figure 6). Especially, as illustrated in the red rectangles corresponding to Figure 4a, the proposed algorithm can detect buildings completely, while the others performed poorly in detecting buildings on the dark side, which indicates the superiority of our proposed algorithm in extracting buildings with different appearances. Besides, thanks to the multiscale deep features, the proposed algorithm can recognize buildings at both small and large scales, as shown in the labeled yellow ellipses in Figure 5. Finally, as shown in Figure 4, Figure 5 and Figure 6f, the use of superpixels makes the ultimate building maps with few speckles and noises. However, the buildings covered by shadows are difficult to be extracted using the proposed algorithm. For example, as shown in the blue rectangles in Figure 5, there are part of buildings that are covered in shadows, and all the algorithms cannot effectively detect it. Shadows lead to the distortion of information, which makes the recognition of objects a challenge.
Compared with our proposed algorithm, the other three compared algorithms have unsatisfied performance at different objects. Firstly, as shown in Figure 4, Figure 5 and Figure 6c, the buildings extracted from C1 are not complete. For example, the extracted building labeled in the green rectangle in Figure 5c has some small holes, while in Figure 5b,d,f, this building is comparatively more complete. Besides, the overall building map extracted by C1 are with much noises, such as the labeled objects in green rectangles corresponding to Figure 6. This is because that C1 is based only on spectral features, which indicates the superiority of CNN model in extracting both spectral and spatial features. Besides, comparing the proposed algorithm with C2, we can find that there are some misclassifications of the latter algorithm, such as shown in the red squares in Figure 5d. This is mainly because the features at a single scale cannot provide sufficient information for accurate recognition under a very complex urban environment. Finally, by the comparison between the proposed algorithm and C3 algorithm, we can easily find that the feature stacking strategy generated poorer performance than separate classification of different features. As illustrated in the Figure 4 and Figure 5e, there are some misclassifications, which mainly indicates that treating features at different scales has some limitations.

3.5. Quantitative Evaluation

Table 2 shows the quantitative evaluation results of buildings extracted by the proposed algorithm and three other algorithms, respectively. By the comparisons of the F-measure values, we can draw a conclusion that the proposed algorithm has the best performance in extracting complex buildings. Overall, the F-measure is comparatively high for the proposed algorithm in three study areas. Compared with the proposed algorithm, the F-measure of the other three compared algorithms are much lower, which demonstrate the effectiveness of deep features, multiscale CNN strategy, and separate fusion of features strategies adopted in our proposed algorithm.
By analyzing the criteria of recall, we can find that the Recall values of C2 and C3 are lower than the Precision values in Image 1, which is mainly because there were more buildings that were omitted, as shown in Figure 4d,e. This can also demonstrate that there are some limitations of compared algorithms in extracting buildings in some degree. Moreover, the Recall of C1 is generally lower in all the three images, mainly due to some of the buildings extracted by C1 not being complete, and with fine structures. Compared with them, the proposed algorithm has a good performance in both Recall and Precision, which means that it can better extract buildings in VHR images.

4. Discussions

This paper proposed a novel algorithm to extract buildings in VHR images by fusion of multiscale deep features at decision level. This algorithm can extract buildings with different spatial scales and with fine structures and few noises by using three strategies, including a multiscale CNN structure to extract multiscale features, an SVM-based fusion strategy, and superpixels, respectively. The contributions of these three strategies are discussed as follows.

4.1. The Effectiveness of Deep Learning Strategy

To distinguish buildings from the background, a popular deep learning algorithm CNN was applied to explore the features. Besides, considering that buildings in VHR images are large-variety scales, a multiscale strategy was further utilized to improve the traditional CNN architecture. Specifically, we used image patches at three different sizes to feed into three corresponding CNN models with three different kernel sizes. In this way, we can get more complete features for extracted buildings. In order to verify the superiority of multiscale deep features to original spectral bands, we set C1 as the comparison algorithm, and the results are shown and compared in Figure 4, Figure 5 and Figure 6c. According to the comparison analysis, we can easily find that buildings extracted by MCNN are more complete, while the roofs extracted by SVM often contain some holes. This is mainly because that CNN algorithm can automatically extract high-level, abstract, as well as spatial-related features from the original data directly. However, the classification of SVM is based on spectral characteristics, which means it cannot detect some inhomogeneous pixels on buildings roofs. Accordingly, it is effective to use deep learning algorithms to extract buildings especially under complex urban environments.

4.2. The Effectiveness of Seperately Using Deep Features at Each Scale

In most existing studies, features from multisource are always stacked together and then fed into one classifier to produce the final classification maps. However, in this way, features at each source are treated equally, and it is difficult for a single classifier to match different features together, which lead to the poor performance in recognizing objects. Therefore, in this paper, we designed a parallel SVM-based fusion strategy to separately use deep features at different scales. In order to verify the effectiveness of this strategy, we set the C3 algorithms of each images. As we can see from Figure 3b,e, Figure 4b,e and Figure 5b,e, the parallel usage of features at different scale outperformed the traditional features stacking strategy. It is an interesting and meaningful finding for the application of deep features.

4.3. The Effectiveness of Superpixels

Due to the repeated pooling operations in the CNN algorithm, the deep features extracted from the CNN are always with blurred boundary. Therefore, we finally improved the classification results by using the fine boundary information. Specifically, we used a simple region-based max voting for classification based on superpixels instead of individual pixels. In order to verify the effectiveness of combining superpixels, the classification results and the refinement building maps are both illustrated in Figure 4, Figure 5 and Figure 6. As illustrated in Figure 4, Figure 5 and Figure 6, the buildings refined by superpixels contain better structures and fewer speckles and noises. Therefore, it is effective to improve the blurred boundary of the CNN results by the use of superpixels.

4.4. A Word on Data Quality

In our experiments, we repeatedly noticed the inaccurate ground truth maps in the Potsdam dataset, as shown in Figure 7. As shown in the blue rectangles in Figure 7, the ground truth image obviously missed a small building, while in Figure 7c, the proposed algorithm can extract this small building accurately. On the other hand, we also found that there were some building boundaries also missed in the provided ground truth data, which was also an indicator to make the quantitative evaluations of the proposed algorithm lower. In future work, we will use more accurate datasets for effective assessment.

5. Conclusions

Buildings extraction from VHR images has been a popular topic in the last two decades. However, the large varieties in scales and appearances of buildings make the task very challenging, especially from VHR images. In this paper, we proposed a novel SVM-based fusion algorithm based on multiscale deep features to extract buildings in VHR images. The experimental results have validated the effectiveness of the proposed algorithm. Thanks to the multiscale deep features, SVM-based fusion strategy and the superpixels refinement, the proposed approach has achieved: (1) Accurately buildings extraction with different scales, and (2) the completeness and well-structured extraction of buildings with fewer speckles and noise. Specifically, the deep features extracted by multiscale CNN instead of traditional single-scale CNN contributed to the satisfied performance in recognizing different spatial scales of buildings. Besides, instead of stacking features into one classifier, the proposed parallel SVM-based fusion strategy takes deep features at each scale together. Meanwhile, the superpixels also helped to improve the MCNN results, where region-based max voting had refined the boundary and reduced the noise. However, extracting buildings covered by other objects such as umbrellas and trees is still challenging. This is mainly due to the fact that the spectral characteristics of covered buildings and uncovered buildings are totally different, and spectral bands of optical VHR images cannot penetrate these coverings. To meet this challenge, in the future, we will consider fusing different datasets such as SAR or design more effective classifiers by incorporating context and shape features of buildings.

Author Contributions

Conceptualization, G.S. and H.H.; methodology, H.H.; software, H.H. and F.L.; validation, G.S., H.H. and A.Z.; formal analysis, H.Z.; writing—original draft preparation, H.H.; writing—review and editing, G.S., A.Z. and H.Z.; funding acquisition, G.S. and A.Z.

Funding

This work was supported by the National Natural Science Foundation of China (41801275), the Shandong Provincial Natural Science Foundation, China (ZR2018BD007), the Fundamental Research Funds for the Central Universities (18CX05030A, 18CX02179A). Guangdong Provincial Application oriented Technical Research and Development Special Fund Project (2016B010127006).

Acknowledgments

The authors greatly acknowledge the study material providers. The Potsdam data were produced by International Society for Photogrammetry and Remote Sensing: http://www2.isprs.org/ commissions/comm3/wg4/2d-sem-label-potsdam.html. We also wish to thank the anonymous reviewers for their constructive comments.

Conflicts of Interest

The authors declare no conflict of interest.

References

  1. Yuan, J. Automatic Building Extraction in Aerial Scenes Using Convolutional Networks. arXiv, 2016; arXiv:1602.06564. [Google Scholar]
  2. Chen, R.; Li, X.; Li, J. Object-Based Features for House Detection from RGB High-Resolution Images. Remote Sens. 2018, 10, 451. [Google Scholar] [CrossRef]
  3. Moser, G.; Serpico, S.B.; Benediktsson, J.A. Land-Cover Mapping by Markov Modeling of Spatial–Contextual Information in Very-High-Resolution Remote Sensing Images. Proc. IEEE 2013, 101, 631–651. [Google Scholar] [CrossRef]
  4. Longbotham, N.; Chaapel, C.; Bleiler, L.; Padwick, C.; Emery, W.J.; Pacifici, F. Very High Resolution Multiangle Urban Classification Analysis. IEEE Trans. Geosci. Remote Sens. 2012, 50, 1155–1170. [Google Scholar] [CrossRef]
  5. Mnih, V.; Hinton, G.E. Learning to detect roads in high-resolution aerial images. In Proceedings of the 11th European Conference on Computer Vision: Part VI, Heraklion, Crete, Greece, 5–11 September 2010; pp. 210–223. [Google Scholar]
  6. Ma, L.; Li, M.; Ma, X.; Cheng, L.; Du, P.; Liu, Y. A review of supervised object-based land-cover image classification. ISPRS J. Photogramm. Remote Sens. 2017, 130, 277–293. [Google Scholar] [CrossRef]
  7. Kim, T.; Muller, J.-P. Development of a graph-based approach for building detection. Image Vis. Comput. 1999, 17, 3–14. [Google Scholar] [CrossRef]
  8. Cote, M.; Saeedi, P. Automatic Rooftop Extraction in Nadir Aerial Imagery of Suburban Regions Using Corners and Variational Level Set Evolution. IEEE Trans. Geosci. Remote Sens. 2013, 51, 313–328. [Google Scholar] [CrossRef]
  9. Li, E.; Femiani, J.; Xu, S.; Zhang, X.; Wonka, P. Robust Rooftop Extraction From Visible Band Images Using Higher Order CRF. IEEE Trans. Geosci. Remote Sens. 2015, 53, 4483–4495. [Google Scholar] [CrossRef]
  10. Inglada, J. Automatic recognition of man-made objects in high resolution optical remote sensing images by SVM classification of geometric image features. ISPRS J. Photogramm. Remote Sens. 2007, 62, 236–248. [Google Scholar] [CrossRef]
  11. Xu, R.; Zhang, H.; Wang, T.; Lin, H. Using pan-sharpened high resolution satellite data to improve impervious surfaces estimation. Int. J. Appl. Earth Obs. Geoinf. 2017, 57, 177–189. [Google Scholar] [CrossRef]
  12. Peng, J.; Liu, Y.C. Model and context-driven building extraction in dense urban aerial images. Int. J. Remote Sens. 2005, 26, 1289–1307. [Google Scholar] [CrossRef]
  13. Levitt, S.; Aghdasi, F. An investigation into the use of wavelets and scaling for the extraction of buildings in aerial images. In Proceedings of the 1998 South African Symposium on Communications and Signal Processing-COMSIG 98 (Cat. No. 98EX214), Rondebosch, South Africa, 8 September 1998; pp. 133–138. [Google Scholar]
  14. Huertas, A.; Nevatia, R. Detecting buildings in aerial images. Comput. Vis. Graph. Image Process. 1988, 41, 131–152. [Google Scholar] [CrossRef]
  15. Gilani, A.S.; Awrangjeb, M.; Lu, G. An Automatic Building Extraction and Regularisation Technique Using LiDAR Point Cloud Data and Orthoimage. Remote Sens. 2016, 8, 258. [Google Scholar] [CrossRef]
  16. Niemeyer, J.; Rottensteiner, F.; Soergel, U. Contextual classification of lidar data and building object detection in urban areas. ISPRS J. Photogramm. Remote Sens. 2014, 87, 152–165. [Google Scholar] [CrossRef]
  17. Sohn, G.; Dowman, I. Data fusion of high-resolution satellite imagery and LiDAR data for automatic building extraction. ISPRS J. Photogramm. Remote Sens. 2007, 62, 43–63. [Google Scholar] [CrossRef]
  18. Zhang, H.; Lin, H.; Li, Y.; Zhang, Y.; Fang, C. Mapping urban impervious surface with dual-polarimetric SAR data: An improved method. Landsc. Urban Plan. 2016, 151, 55–63. [Google Scholar] [CrossRef]
  19. Turker, M.; Koc-San, D. Building extraction from high-resolution optical spaceborne images using the integration of support vector machine (SVM) classification, Hough transformation and perceptual grouping. Int. J. Appl. Earth Obs. Geoinf. 2015, 34, 58–69. [Google Scholar] [CrossRef]
  20. Sirmacek, B.; Unsalan, C. Urban-Area and Building Detection Using SIFT Keypoints and Graph Theory. IEEE Trans. Geosci. Remote Sens. 2009, 47, 1156–1167. [Google Scholar] [CrossRef]
  21. Zhao, W.; Du, S.; Emery, W.J. Object-Based Convolutional Neural Network for High-Resolution Imagery Classification. IEEE J. Sel. Top. Appl. Earth Obs. Remote Sens. 2017, 10, 3386–3396. [Google Scholar] [CrossRef]
  22. Wang, Z.; Ren, J.; Zhang, D.; Sun, M.; Jiang, J. A deep-learning based feature hybrid framework for spatiotemporal saliency detection inside videos. Neurocomputing 2018, 287, 68–83. [Google Scholar] [CrossRef]
  23. Cao, F.; Yang, Z.; Ren, J.; Jiang, M.; Ling, W.-K. Linear vs. Nonlinear Extreme Learning Machine for Spectral-Spatial Classification of Hyperspectral Images. Sensors 2017, 17, 2603. [Google Scholar] [CrossRef]
  24. Md Noor, S.S.; Ren, J.; Marshall, S.; Michael, K. Hyperspectral Image Enhancement and Mixture Deep-Learning Classification of Corneal Epithelium Injuries. Sensors 2017, 17, 2644. [Google Scholar] [CrossRef] [PubMed]
  25. Gu, J.; Wang, Z.; Kuen, J.; Ma, L.; Shahroudy, A.; Shuai, B.; Liu, T.; Wang, X.; Wang, G. Recent Advances in Convolutional Neural Networks. Pattern Recognit. 2015, 77, 354–377. [Google Scholar] [CrossRef]
  26. Nogueira, K.; Penatti, O.A.B.; dos Santos, J.A. Towards better exploiting convolutional neural networks for remote sensing scene classification. Pattern Recognit. 2017, 61, 539–556. [Google Scholar] [CrossRef] [Green Version]
  27. Le, Q.V. Building high-level features using large scale unsupervised learning. In Proceedings of the 2013 IEEE International Conference on Acoustics, Speech and Signal Processing, Vancouver, BC, Canada, 26–31 May 2013; pp. 8595–8598. [Google Scholar]
  28. Krizhevsky, A.; Sutskever, I.; Hinton, G.E. ImageNet classification with deep convolutional neural networks. In Proceedings of the 25th International Conference on Neural Information Processing Systems, Volume 1, Lake Tahoe, Nevada, 3–6 December 2012; pp. 1097–1105. [Google Scholar]
  29. Hinton, G.E.; Osindero, S.; Teh, Y.-W. A Fast Learning Algorithm for Deep Belief Nets. Neural Comput. 2006, 18, 1527–1554. [Google Scholar] [CrossRef] [PubMed] [Green Version]
  30. Lecun, Y.; Bottou, L.; Bengio, Y.; Haffner, P. Gradient-based learning applied to document recognition. Proc. IEEE 1998, 86, 2278–2324. [Google Scholar] [CrossRef] [Green Version]
  31. Hochreiter, S.; Schmidhuber, J. Long Short-Term Memory. Neural Comput. 1997, 9, 1735–1780. [Google Scholar] [CrossRef]
  32. Ledig, C.; Theis, L.; Huszár, F.; Caballero, J.; Cunningham, A.; Acosta, A.; Aitken, A.; Tejani, A.; Totz, J.; Wang, Z.; et al. Photo-Realistic Single Image Super-Resolution Using a Generative Adversarial Network. In Proceedings of the 2017 IEEE Conference on Computer Vision and Pattern Recognition (CVPR), Honolulu, HI, USA, 21–26 July 2017; pp. 105–114. [Google Scholar]
  33. Alshehhi, R.; Marpu, P.R.; Woon, W.L.; Mura, M.D. Simultaneous extraction of roads and buildings in remote sensing imagery with convolutional neural networks. ISPRS J. Photogramm. Remote Sens. 2017, 130, 139–149. [Google Scholar] [CrossRef]
  34. Huang, H.; Sun, G.; Ren, J.; Rang, J.; Zhang, A.; Hao, Y. Spectral-Spatial Topographic Shadow Detection from Sentinel-2A MSI Imagery Via Convolutional Neural Networks. In Proceedings of the IGARSS 2018 IEEE International Geoscience and Remote Sensing Symposium, Valencia, Spain, 22–27 July 2018; pp. 661–664. [Google Scholar]
  35. Shrestha, S.; Vanneschi, L. Improved Fully Convolutional Network with Conditional Random Fields for Building Extraction. Remote Sens. 2018, 10, 1135. [Google Scholar] [CrossRef]
  36. Sun, Y.; Zhang, X.; Zhao, X.; Xin, Q. Extracting Building Boundaries from High Resolution Optical Images and LiDAR Data by Integrating the Convolutional Neural Network and the Active Contour Model. Remote Sens. 2018, 10, 1459. [Google Scholar] [CrossRef]
  37. Xiao, J.; Gerke, M.; Vosselman, G. Building extraction from oblique airborne imagery based on robust façade detection. ISPRS J. Photogramm. Remote Sens. 2012, 68, 56–68. [Google Scholar] [CrossRef]
  38. Xu, Y.; Wu, L.; Xie, Z.; Chen, Z. Building Extraction in Very High Resolution Remote Sensing Imagery Using Deep Learning and Guided Filters. Remote Sens. 2018, 10, 144. [Google Scholar] [CrossRef]
  39. Zhang, C.; Sargent, I.; Pan, X.; Li, H.; Gardiner, A.; Hare, J.; Atkinson, P.M. An object-based convolutional neural network (OCNN) for urban land use classification. Remote Sens. Environ. 2018, 216, 57–70. [Google Scholar] [CrossRef]
  40. Maltezos, E.; Doulamis, N.; Doulamis, A.; Ioannidis, C. Deep convolutional neural networks for building extraction from orthoimages and dense image matching point clouds. J. Appl. Remote Sens. 2017, 11, 042620. [Google Scholar] [CrossRef]
  41. Men, K.; Chen, X.; Zhang, Y.; Zhang, T.; Dai, J.; Yi, J.; Li, Y. Deep Deconvolutional Neural Network for Target Segmentation of Nasopharyngeal Cancer in Planning Computed Tomography Images. Front. Oncol. 2017, 7, 315. [Google Scholar] [CrossRef]
  42. Badrinarayanan, V.; Kendall, A.; Cipolla, R. SegNet: A Deep Convolutional Encoder-Decoder Architecture for Image Segmentation. IEEE Trans. Pattern Anal. Mach. Intell. 2017, 39, 2481–2495. [Google Scholar] [CrossRef] [PubMed]
  43. Zhao, W.; Du, S. Learning multiscale and deep representations for classifying remotely sensed imagery. ISPRS J. Photogramm. Remote Sens. 2016, 113, 155–165. [Google Scholar] [CrossRef]
  44. Chen, X.; Xiang, S.; Liu, C.; Pan, C. Vehicle Detection in Satellite Images by Hybrid Deep Convolutional Neural Networks. IEEE Geosci. Remote Sens. Lett. 2014, 11, 1797–1801. [Google Scholar] [CrossRef]
  45. Li, J.; Zhang, R.; Li, Y. Multiscale convolutional neural network for the detection of built-up areas in high-resolution SAR images. In Proceedings of the 2016 IEEE International Geoscience and Remote Sensing Symposium (IGARSS), Beijing, China, 10–15 July 2016; pp. 910–913. [Google Scholar]
  46. Deng, Z.; Sun, H.; Zhou, S.; Zhao, J.; Lei, L.; Zou, H. Multi-scale object detection in remote sensing imagery with convolutional neural networks. ISPRS J. Photogramm. Remote Sens. 2018, 145, 3–22. [Google Scholar] [CrossRef]
  47. Gidaris, S.; Komodakis, N. Object Detection via a Multi-region and Semantic Segmentation-Aware CNN Model. In Proceedings of the 2015 IEEE International Conference on Computer Vision (ICCV), Santiago, Chile, 7–13 December 2015; pp. 1134–1142. [Google Scholar]
  48. Chen, L.; Papandreou, G.; Kokkinos, I.; Murphy, K.; Yuille, A.L. DeepLab: Semantic Image Segmentation with Deep Convolutional Nets, Atrous Convolution, and Fully Connected CRFs. IEEE Trans. Pattern Anal. Mach. Intell. 2018, 40, 834–848. [Google Scholar] [CrossRef] [PubMed] [Green Version]
  49. Waske, B.; van der Linden, S. Classifying Multilevel Imagery From SAR and Optical Sensors by Decision Fusion. IEEE Trans. Geosci. Remote Sens. 2008, 46, 1457–1466. [Google Scholar] [CrossRef]
  50. Strigl, D.; Kofler, K.; Podlipnig, S. Performance and Scalability of GPU-Based Convolutional Neural Networks. In Proceedings of the 2010 18th Euromicro Conference on Parallel, Distributed and Network-based Processing, Pisa, Italy, 17–19 Feburary 2010; pp. 317–324. [Google Scholar]
  51. Fauvel, M.; Chanussot, J.; Benediktsson, J.A. Decision Fusion for the Classification of Urban Remote Sensing Images. IEEE Trans. Geosci. Remote Sens. 2006, 44, 2828–2838. [Google Scholar] [CrossRef] [Green Version]
  52. Pal, M. Ensemble of support vector machines for land cover classification. Int. J. Remote Sens. 2008, 29, 3043–3049. [Google Scholar] [CrossRef] [Green Version]
  53. Foody, G.M.; Mathur, A. A relative evaluation of multiclass image classification by support vector machines. IEEE Trans. Geosci. Remote Sens. 2004, 42, 1335–1343. [Google Scholar] [CrossRef] [Green Version]
  54. Melgani, F.; Bruzzone, L. Classification of hyperspectral remote sensing images with support vector machines. IEEE Trans. Geosci. Remote Sens. 2004, 42, 1778–1790. [Google Scholar] [CrossRef] [Green Version]
  55. Kivinen, J.; Smola, A.J.; Williamson, R.C. Online learning with kernels. IEEE Trans. Signal Process. 2004, 52, 2165–2176. [Google Scholar] [CrossRef]
  56. Keerthi, S.S.; Lin, C. Asymptotic Behaviors of Support Vector Machines with Gaussian Kernel. Neural Comput. 2003, 15, 1667–1689. [Google Scholar] [CrossRef] [PubMed] [Green Version]
  57. Janz, A.; Van Der Linden, S.; Waske, B.; Hostert, P. imageSVM—A useroriented tool for advanced classification of hyperspectral data using support vector machines. In Proceedings of the EARSeL SIG Imaging Spectroscopy, Bruges, Belgium, 23 April 2007. [Google Scholar]
  58. Waske, B.; Benediktsson, J.A. Fusion of Support Vector Machines for Classification of Multisensor Data. IEEE Trans. Geosci. Remote Sens. 2007, 45, 3858–3866. [Google Scholar] [CrossRef]
  59. Ren, X.; Malik, J. Learning a classification model for segmentation. In Proceedings of the Ninth IEEE International Conference on Computer Vision, 13–16 October 2003; Volume 11, pp. 10–17. [Google Scholar]
  60. Stutz, D.; Hermans, A.; Leibe, B. Superpixels: An evaluation of the state-of-the-art. Comput. Vis. Image Underst. 2018, 166, 1–27. [Google Scholar] [CrossRef] [Green Version]
  61. Fu, Z.; Sun, Y.; Fan, L.; Han, Y. Multiscale and Multifeature Segmentation of High-Spatial Resolution Remote Sensing Images Using Superpixels with Mutual Optimal Strategy. Remote Sens. 2018, 10, 1289. [Google Scholar] [CrossRef]
  62. Comaniciu, D.; Meer, P. Mean shift: A robust approach toward feature space analysis. IEEE Trans. Pattern Anal. Mach. Intell. 2002, 24, 603–619. [Google Scholar] [CrossRef]
  63. Achanta, R.; Shaji, A.; Smith, K.; Lucchi, A.; Fua, P.; Süsstrunk, S. SLIC Superpixels Compared to State-of-the-Art Superpixel Methods. IEEE Trans. Pattern Anal. Mach. Intell. 2012, 34, 2274–2282. [Google Scholar] [CrossRef] [PubMed] [Green Version]
  64. Haris, K.; Efstratiadis, S.N.; Maglaveras, N. Watershed-based image segmentation with fast region merging. In Proceedings of the 1998 International Conference on Image Processing, ICIP98 (Cat. No.98CB36269), Chicago, IL, USA, 7 October 1998; Volume 333, pp. 338–342. [Google Scholar]
  65. Felzenszwalb, P.F.; Huttenlocher, D.P. Efficient Graph-Based Image Segmentation. Int. J. Comput. Vis. 2004, 59, 167–181. [Google Scholar] [CrossRef] [Green Version]
  66. Shi, J.; Malik, J. Normalized Cuts and Image Segmentation. IEEE Trans. Pattern Anal. Mach. Intell. 2000, 22, 888–905. [Google Scholar]
  67. Su, T.; Li, H.; Zhang, S.; Li, Y. Image segmentation using mean shift for extracting croplands from high-resolution remote sensing imagery. Remote Sens. Lett. 2015, 6, 952–961. [Google Scholar] [CrossRef]
  68. Sun, G.; Hao, Y.; Chen, X.; Ren, J.; Zhang, A.; Huang, B.; Zhang, Y.; Jia, X. Dynamic Post-Earthquake Image Segmentation with an Adaptive Spectral-Spatial Descriptor. Remote Sens. 2017, 9, 899. [Google Scholar] [CrossRef]
  69. Lu, T.; Ming, D.; Lin, X.; Hong, Z.; Bai, X.; Fang, J. Detecting Building Edges from High Spatial Resolution Remote Sensing Imagery Using Richer Convolution Features Network. Remote Sens. 2018, 10, 1496. [Google Scholar] [CrossRef]
  70. Hermosilla, T.; Ruiz, L.A.; Recio, J.A.; Estornell, J. Evaluation of Automatic Building Detection Approaches Combining High Resolution Images and LiDAR Data. Remote Sens. 2011, 3, 1188–1210. [Google Scholar] [CrossRef] [Green Version]
Figure 1. Framework of the proposed algorithm, which composed of three major steps: (A) Multiscale deep features extraction; (B) Support vector mechanism (SVM)-based fusion of multiscale convolutional neural network (MCNN); (C) boundary refinement. CNN14, CNN24, and CNN34 represents three CNN models with different kernel sizes.
Remotesensing 11 00227 g001
Figure 2. MCNN structures for multiscale features extraction, in which C1, S1, C2, and S2 represent the first and the second convolutional layer and subsampling (pooling) layer, respectively.
Remotesensing 11 00227 g002
Figure 3. The illustrations of Image 1, Image 2, and Image 3 and corresponding reference images from the Potsdam dataset. (ac) The original images. (df) The reference images.
Remotesensing 11 00227 g003
Figure 4. The building extraction maps of Image 1. (a) Original image. (b) The classification result of our proposed algorithm. (c) Building map of C1. (d) Building map of the C2. (e) Building map of C3. (f) The final building map of our proposed algorithm.
Remotesensing 11 00227 g004
Figure 5. The building extraction maps of Image 2. (a) Original image. (b) The classification result of our proposed algorithm. (c) Building map of C1. (d) Building map of C2. (e) Building map of C3. (f) The final building map of our proposed algorithm.
Remotesensing 11 00227 g005
Figure 6. The building extraction maps of Image 3. (a) Original image. (b) The classification result of our proposed algorithm. (c) Building map of C1. (d) Building map of C2. (e) Building map of C3. (f) The final building map of our proposed algorithm.
Remotesensing 11 00227 g006
Figure 7. Examples of the ground truth labeling errors. (a) Near-inferred, red, green bands (NIR-RG) image. (b) Ground truth image. (c) Result by the proposed algorithm.
Remotesensing 11 00227 g007
Table 1. CNN architecture at each scale.
LayerKernel ParametersCNN14CNN24CNN34
Convolution 1Kernel size3 × 35 × 57 × 7
Kernel number666
Pooling 1Kernel size2 × 22 × 22 × 2
Kernel number666
Convolution 1Kernel size3 × 35 × 57 × 7
Kernel number121212
Pooling 2Kernel size2 × 22 × 22 × 2
Kernel number121212
Table 2. Accuracy measures of the three algorithms for the building extraction results using Recall, Precision, and F-measure in the three study areas.
ApproachCriteriaImage 1Image 2Image 3
ProposedRecall 0.920.880.92
Precision0.910.930.96
F-measure 0.910.900.94
C1Recall0.800.800.83
Precision0.810.930.94
F-measure0.800.860.88
C2Recall0.890.740.86
Precision0.760.950.96
F-measure0.820.830.91
C3Recall0.870.770.86
Precision0.710.940.96
F-measure0.780.850.91