Article

Identification of Hydrothermal Alteration Minerals for Exploring Gold Deposits Based on SVM and PCA Using ASTER Data: A Case Study of Gulong

1
School of Computer, China University of Geosciences, Wuhan 430074, China
2
Innovation Center of Mineral Resources Exploration Engineering Technology in Bedrock Area, Ministry of Natural Resources, Guiyang 550081, China
3
Key Laboratory of Tectonics and Petroleum Resources (China University of Geosciences), Ministry of Education, Wuhan 430074, China
4
National-Local Joint Engineering Laboratory on Digital Preservation and Innovative Technologies for the Culture of Traditional Villages and Towns, Hengyang 421000, China
*
Author to whom correspondence should be addressed.
Remote Sens. 2019, 11(24), 3003; https://doi.org/10.3390/rs11243003
Submission received: 3 December 2019 / Accepted: 11 December 2019 / Published: 13 December 2019

Abstract

:
Dayaoshan, as an important metal ore-producing area in China, is faced with the dilemma of resource depletion due to long-term exploitation. In this paper, remote sensing methods are used to circle the favorable metallogenic areas and find new ore points for Gulong. Firstly, vegetation interference was removed by using mixed pixel decomposition method with hyperplane and genetic algorithm (GA) optimization; then, altered mineral distribution information was extracted based on principal component analysis (PCA) and support vector machine (SVM) methods; thirdly, the favorable areas of gold mining in Gulong was delineated by using the ant colony algorithm (ACA) optimization SVM model to remove false altered minerals; and lastly, field surveys verified that the extracted alteration mineralization information is correct and effective. The results show that the mineral alteration extraction method proposed in this paper has certain guiding significance for metallogenic prediction by remote sensing.

Graphical Abstract

1. Introduction

Surrounding rock alteration is one of the important interpretation markers of mineral exploration using remote sensing technology [1,2]. The metasomatism of hydrothermal mineralization can cause the minerals to alter and generate groups or ions such as Fe3+, magnesium hydroxyl group and aluminum hydroxyl group, which show different hue and spectral characteristics compared to the non-altered rock in remote sensing images [3,4,5]. In the process of mineral exploration, according to the different hue and reflectance spectra of altered minerals, the composition and spatial distribution of altered minerals can be analyzed using remote sensing technology, and the favorable metallogenic areas can be found out.
With the development of remote sensing technology, most scholars have focused on the mechanism of the mineral spectral [6,7,8,9]. Others have studied extraction method of altered mineral [10,11,12]. Still, some have researched the identification of hydrothermal alteration minerals using multi- and hyper-spectral images [13,14,15,16]. In recent years, altered mineral identification has been investigated by using different methods in different locations for mineral exploration, including alteration mineral mapping in the Northwestern Junggar basin using Landsat thematic mapper (TM) data and principal component analysis (PCA) [17], predictive mineral prospectivity modeling for Cu deposits in Varzaghan district, NW Iran based on the support vector machine (SVM) [18], as well as predictive models for Rodalquilar mining district mineral prospectivity in the southeast of Spain with machine learning [19]. All of these studies contribute to the development of metallogenic prognosis in arid and semi-arid areas. However, research on altered mineral extraction in high vegetation-covered areas is still limited, particularly in a specific region as an important metal mineral area [20,21], where many old mines are facing resource depletion after long-term exploitation, such as Gulong, China.
In response to the above problems, the objectives of this paper are to: (1) select the image identification marks of altered minerals according to the distribution of gold deposits and the ore-bearing strata in Dayaoshan; (2) remove vegetation interference by using mixed pixel decomposition method with hyperplane and genetic algorithm (GA) optimization; (3) extract altered mineral information based on PCA and SVM methods by the Advanced Spaceborne Thermal Emission and Reflection Radiometer (ASTER) data; and (4) verify the altered mineral extraction result using field survey method. Lastly, the research results not only delineate the favorable metallogenic area of gold deposits, but also provide reasonable suggestions for mineral exploration with remote sensing data.

2. Study Area and Materials

The study area, located at the junction of the Yangtze paleo-plate and Cathaysia paleo-plate, is part of the Guangxi Dayaoshan Au ore belt, dotted with gold deposits [22,23,24,25] (Figure 1). It belongs to the subtropical monsoon climate region, where the annual average temperature is 21°C, the frost-free days are about 320 days, and the average annual rainfall is 1600 mm. There are a lot of pristine forests and all kinds of herbaceous plants, and forest cover can reach more than 90%.
The study area is strongly influenced by multistage structural evolution, such as sedimentation, uplift, and folds and faults in different directions in a long process of geological evolution, which makes the structures of the research area very complex. It is located in the anticline axis of the Gulong-Ligang Indochina period. The north-south anticline strikes and superimposes on the Caledonian near-east-west fold, which has a length of 28 km and width of about 2–5 km. There are two circular structures in the study area, which are distributed in the Dacun and Gulong. The single ring is approximately circular and about 2-5km in diameter. There are fault structures in the study area, which are near the south-north direction of the Limu-Majiang fault, with a total length of more than 200 km. The southern section of the Limu-Majiang fault plays an important role in controlling gold deposits. The northeast direction of Pingxiang-Dali fault, which passes through study area, plays an important role in controlling altered rock type and volcanic type gold deposit. The strata exposed are mainly Cambrian, Cretaceous, Devonian and a spot of Quaternary. The main intrusive rocks are mainly Caledonian granitic porphyry veins and granodiorite veins; Yanshanian granite-porphyry, granodiorite, quartz diorite, and monzonitic granite; and Indosinian gabbro diorite, which plays a vital role in formation of porphyry deposits of the whole study area (Figure 1b).
At present, the endophytic metal deposits found in the study area can be divided into porphyry deposits, broken zone altered rock deposits, and quartz vein deposits. Those three kinds of deposits are often associated with each other, that is to say, there are altered rock deposits and quartz vein deposits of different scales in the outer part of the porphyry deposits (Figure 1b).
The ASTER images adopted in this paper are from the Remote Sensing Center of Guangxi, acquired in September 2001, and the RGB band combination of ASTER image is as follows: R is B2, G is B1, and B is (3*b1 + b3)/4 (Figure 1a). Before identifying the altered mineral, the images were pretreated, such as atmospheric correction by the Fast Line-of-sight Atmospheric Analysis of Spectral Hypercubes (FLAASH) [26,27], crosstalk correction [28], water disturbance removed by using a water index. The flow chart of ASTER image preprocessing is shown in Figure 2.

3. Methods

The extraction of altered mineral information is usually based on the spectral characteristics of minerals [9,29,30,31]. Although minerals have their own spectral characteristics, rocks are usually formed by various mineral assemblages, so the spectral information of rocks on remote sensing images is very complex. In addition, due to the influence of other surface features, such as soil and vegetation, the altered mineral information is very weak in the remote sensing images [32,33,34]. Therefore, this paper firstly focuses on eliminating vegetation interference, extracting mineralized information samples with remote sensing images, and then establishing PCA and SVM methods to improve the accuracy of altered mineral information extraction.

3.1. Mixed Pixel Decomposition with Hyperplane Optimized by GA

In areas with high vegetation coverage, the spectral characteristics of pixels in remote sensing images are not a single ground object, but a mixed reflection of the several objects. The altered mineral information is seriously hided by high vegetation coverage, so it is very difficult to extract the information which is needed. For mixed pixels, an unmixed pixel decomposition method with hyperplane and an optimized genetic algorithm [35,36,37,38,39], which is established in this paper, will eliminate the influence of vegetation, and obtain altered mineral information from the sub-pixel level.
In the feature space of a remote sensing image, the same kind of mineral is assembled in one region because of its similar spectral characteristics, while other similar minerals are gathered in another region. By calculating the hyperplane, these kinds of features can be separated, and the proportion of the objects contained in each pixel can be obtained, that is, the decomposition result of the mixed pixels, which can be expressed as Equation (1):
f ( x ) = M X > 0 ,   f ( x ) = M X 0
where M = m1, m2, ..., mn, X = (x1, x2, …, xn), n is the dimension of feature space.
The position of hyperplane in multidimensional remote sensing data space can be well represented by iterative recursive mode, and the equation is expressed as Equation (2):
d = α N cos α N 1 + β N 1 sin α N 1 β N 1 = α N 1 cos α N 2 + β N 2 sin α N 2 β N 2 = α N 2 cos α N 3 + β N 3 sin α N 3 β 1 = α 1 cos α 0 + β 0 sin α 0
where α N 1 is the angle between the hyperplane unit normal and the X N , α N 2 is the angle between the normal projection in the X 1 ,   X 2 ,   ,   X N 1 space and the X N 1 axis, α N 3 is the angle between the normal projection in the X 1 ,   X 2 ,   ,   X N 2 space and the X N 2 axis, α 1 and α 0 is the angle between the normal projection of 2D space and the 2nd feature axis, and 1D space and the 1st feature axis, respectively. If α 0 = 0 , d is the vertical distance between the hyperplane and the origin, in this way, a hyperplane of N-dimensional space can be determined by N 1 angle α 1 ,   α 2 ,   ,   α N 1 and a vertical distance d [40].
It can be seen in Equation (2) that if hyperplane is used to classify the feature space composed of multi-band remote sensing images, the first problem that needs to be solved is how to determine the N parameters of the hyperplane equation, which can best achieve the classification effect. In this paper, to establish a hyperplane classification model optimized by the genetic algorithm for classification, firstly, the pattern description and pattern matching of the samples in the training sample set are carried out; secondly, comparison and selection of different pattern schemes with evolution are performed, and the best pattern classification scheme is chosen; and finally, this is extended to the whole image to achieve the purpose of pattern classification. This process is shown in Figure 3.

3.2. Mineral Altered Samples Collection with Ratio Analysis and PCA

By using the ratio of reflection and absorption band, the spectral difference among various geological information can be enhanced, and the influence of topography can be reduced [41,42,43,44]. Therefore, according to the characteristics of the spectrum, the selection of appropriate ASTER band for ratio operation can enhance the weak altered mineral.
Because of high correlation among the bands of images, some of the data are redundant and repetitive [13,45,46,47]. In this paper, PCA of images is described, and the independent quantities obtained in order to reduce the correlation influence in the process of alteration information extraction are recorded.
PCA combines the original n features linearly and establishes m principal components, which are not correlated with each other, and the variance decreases gradually. The expression of the transformation is as follow Equation (3):
Y = AX = i = 1 n A i X i
Transformation is to reduce the dimension of the original data, using m-dimensional vector can cover the original n-dimensional information, and make its standard deviation within the allowable range, then there is Equation (4):
Y = AX = i = 1 m A i X i + i = m + 1 n A i X i
where X i is denoted as b i , then the Equation (4) becomes Equation (5):
Y ( m ) = i = 1 m A i X + i = m + 1 n A i b i
Let the error is ε between Y and Y(m),
ε = i = m + 1 n A ( X i b i )

3.3. Altered Mineral Extraction Using SVM and ACA

To improve the extraction accuracy of mineral alteration information, the SVM model, an excellent remote sensing image classification technology [48,49,50,51,52], was trained using alteration sample data by PCA. SVM firstly maps samples to high-dimensional spaces by nonlinear transformation; and then finds out the optimal classification hyperplane in high-dimensional space; and finally, classifies the sample data.
The samples are set (Xi, Yi), i = 1, 2, 3, …, n, Y i { 1 ,   1 } , ω X + b = 0 is the classified hyperplane of the sample, so construct discriminant function (7):
g ( x ) = ω X + b
where ω represents the normal vector, b represents the displacement, which determines the distance between the hyperplane and the origin. For the optimal classification hyperplane, the SVM is:
min ω , b 1 2 | | ω | | 2 s . t . y i · ( ω T · x i + b ) 1 , i = 1 , 2 , , l
For nonlinear data samples, relaxation variables ( ξ i ) and penalty factors ( C ) are introduced to deal with the error problem, Equation (8) becomes Equation (9).
min ω , b 1 2 | | ω | | 2 + C i = 1 l ξ i s . t . y i · ( ω T · x i + b ) 1 ξ i ,     i = 1 , 2 , , l
In order to map the sample to the higher dimensional feature space, and to avoid the difficulty of calculation, the Gaussian kernel function is introduced.
k ( x i , x j ) = exp ( γ | | x i , x j | | 2 )
where γ = 1 2 σ 2
Classification decision function of optimal classification hyperplane is Equation (11).
h ( x ) = s g n ( j = 1 l a i y i k ( x i , x j ) + b )
In summary, determining the parameters C and γ of SVM is the key to improve the classification accuracy. So the ACA is introduced to solve the problem of SVM parameter optimization [53,54,55,56,57]. ACA, as a heuristic algorithm based on global optimization, can solve the parameter optimization problem very well. The optimization operation steps are as follows: (1) parameter search interval, C [ 0 ,   10 ] , γ [ 0 ,   1 ] is determined; (2) the process is initialized, each ant carries on the random allocation operation, named { C ,   γ } , the grid point on each space corresponds to one state, and each state corresponds to a solution on the space, the movement trajectory of ants in the grid is recorded, and the pheromone is arranged according to the objective function value between each grid point, so that the ant can search according to the size of the pheromone on the grid point; and (3) the root mean square error is set as the objective function, and then the best combination is selected among the many parameter combinations. The optimization algorithm flow of ACA is shown in Figure 4.
To sum up, the steps of remote sensing altered mineral information extraction with PCA and SVM methods are as follows:
(1)
The remote sensing images in the study area are preprocessed, including radiometric calibration, atmospheric correction and descrambling, and eliminate the influence of vegetation with mixed pixel decomposition method.
(2)
The threshold density segmentation of pyrite, sericite and chlorite principal components is carried out with ratio analysis and PCA, and the training samples are collected according to the known deposits.
(3)
The kernel parameters and penalty factors of SVM with ACA are optimized.
(4)
The SVM classifier trained by training samples is used to process the remote sensing image to obtain the abnormal information of altered minerals.

4. Results and Discussion

4.1. Vegetation Disturbance Elimination

In the study area, there are three main land cover types, which are vegetation, rock and water. The selection of training samples was based on the field survey, remote sensing image, and topographic map. According to the results of the field survey, 52 field rock sampling regions in the image were used as sampling region of rock, and 50–200 pixels were selected as rock samples in each region, which have a total of 6320 rock samples. Then in the vegetation coverage region surrounding the 52 rock sampling regions, and 50–500 pixels were selected as vegetation samples in each region, which have a total of 8460 vegetation samples. Finally, 50–100 pixels of water samples were selected for each of the 50 water regions on the image, which have a total of 4210 water samples. The training samples and reference samples were carried out in ENVI4.8, with 80% of them used as training samples and the remaining 20% as test samples. The details are shown in Table 1.
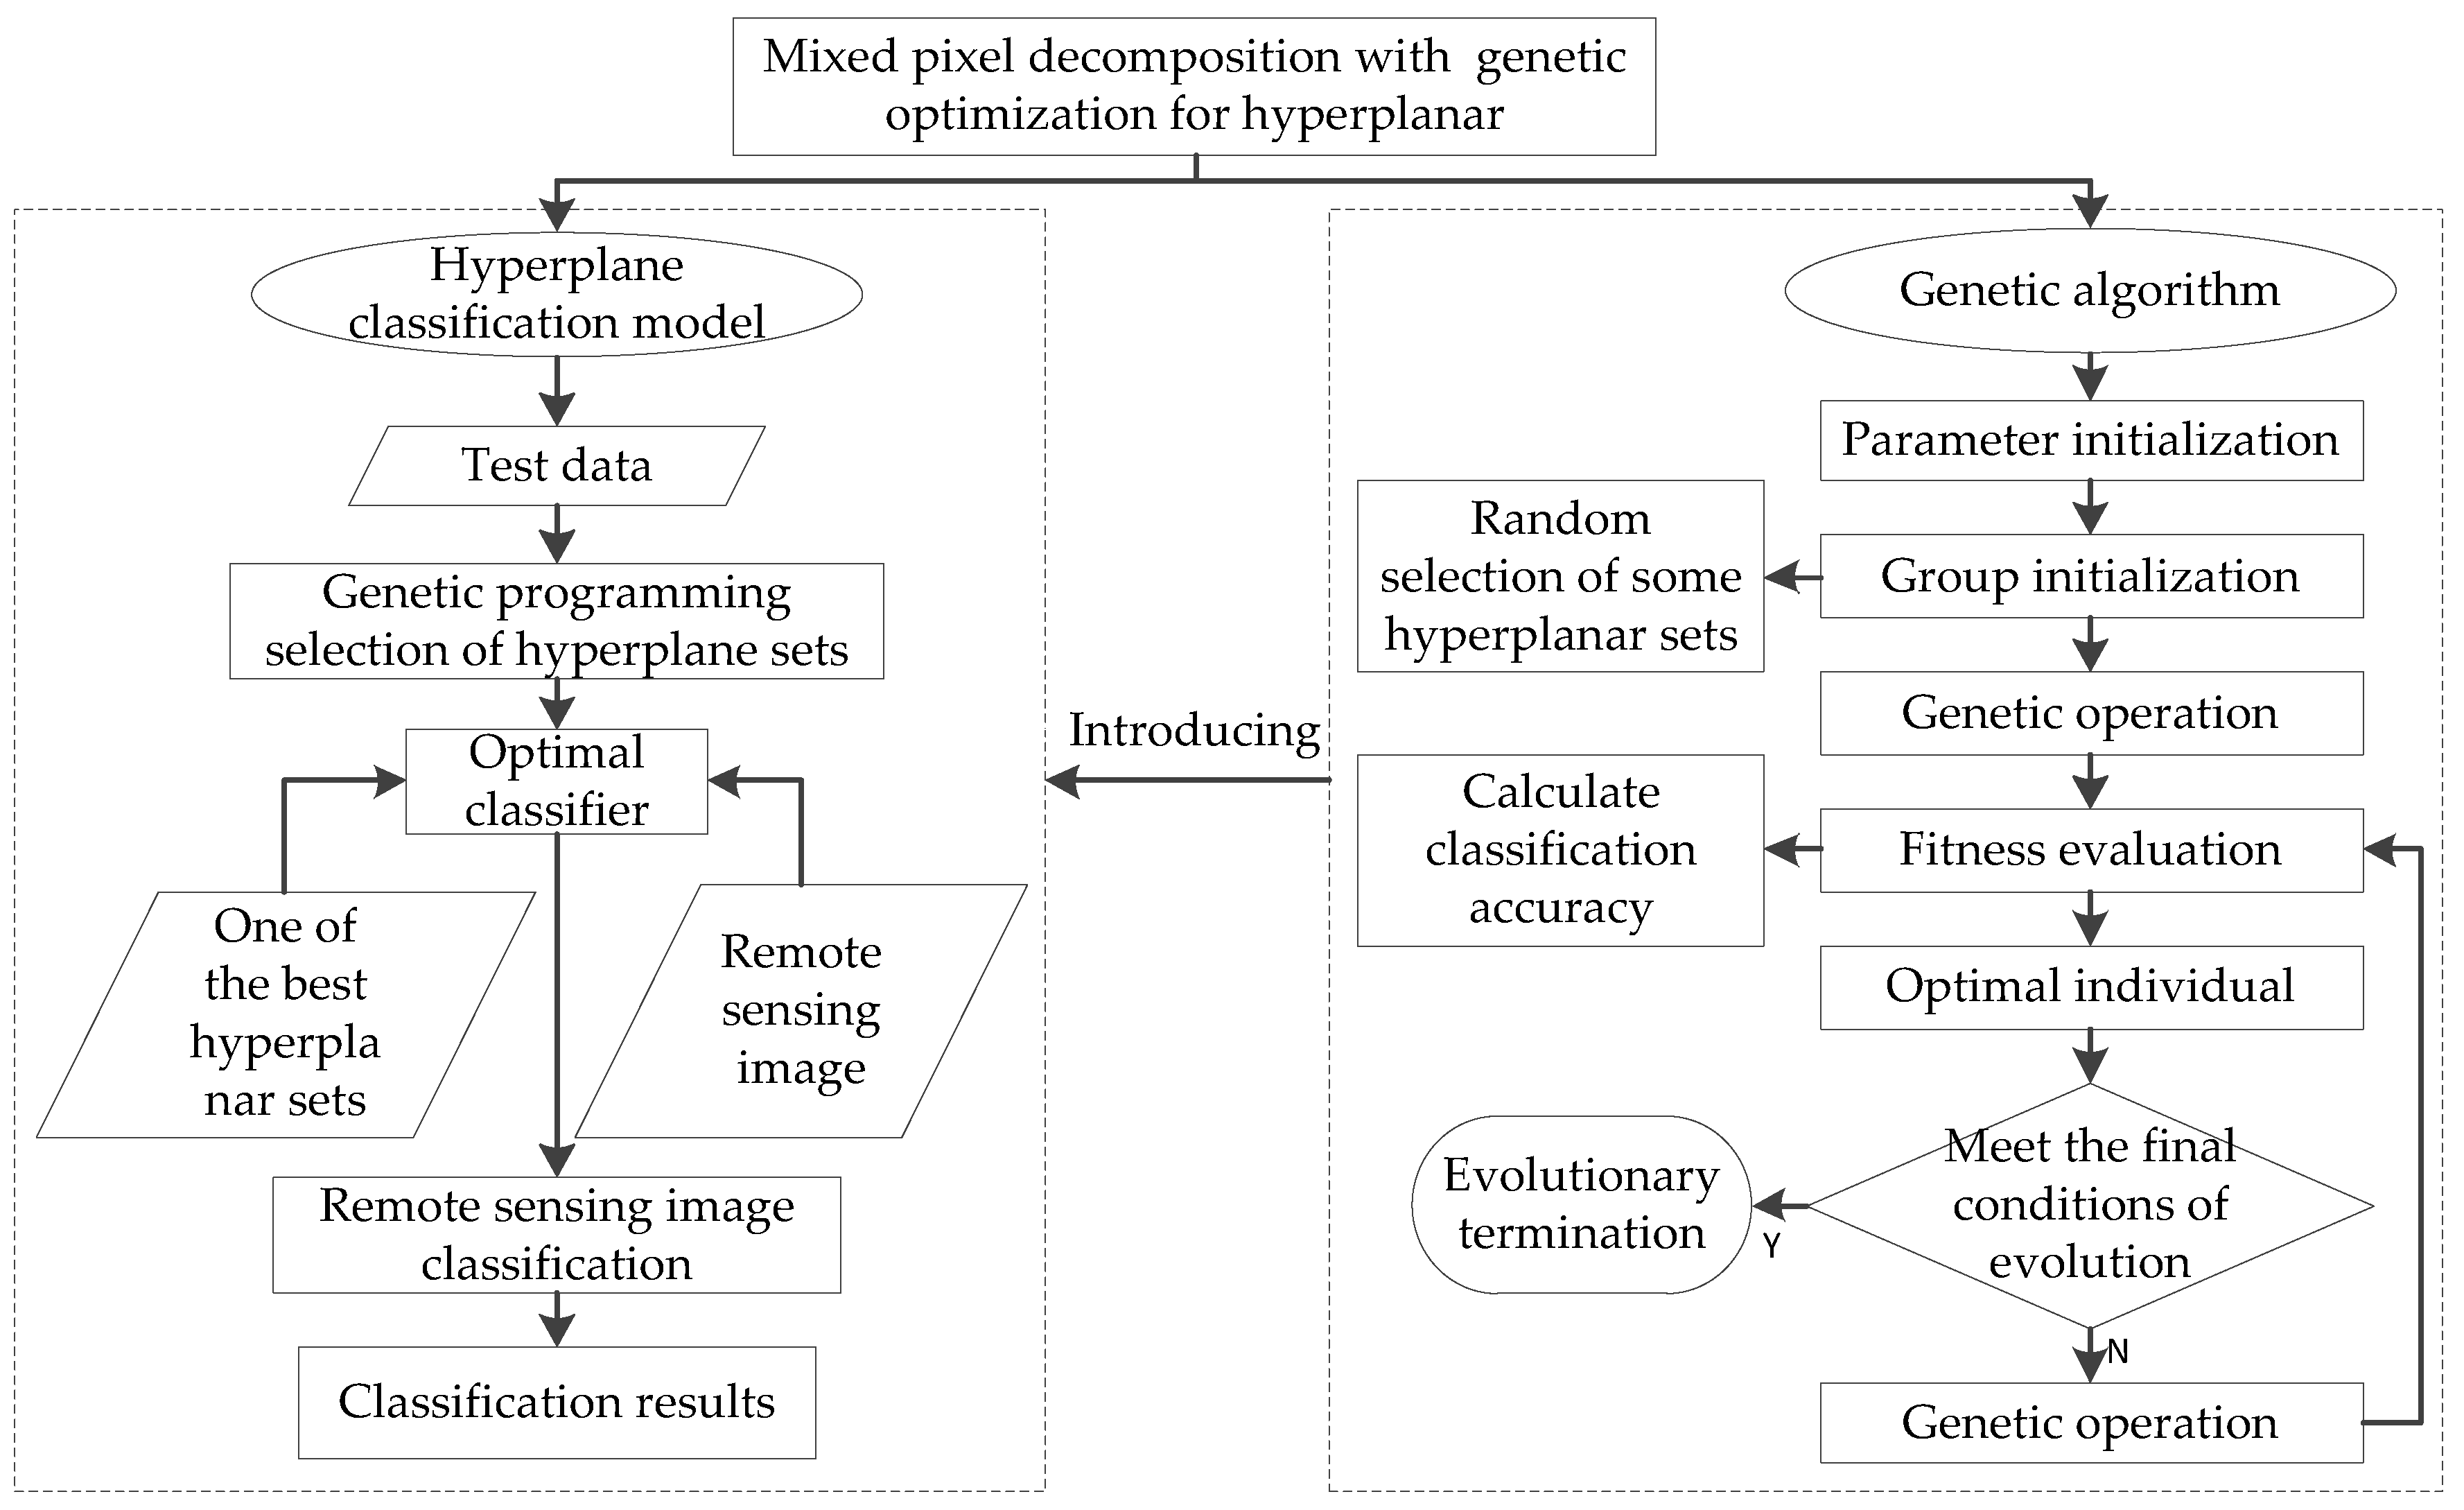
Three bands of remote sensing image were selected, and three kinds of training samples were classified by using two-dimensional feature space. According to Equation (2), the hyperplane equation can be simplified to:
d = X 2 × cos α + X 1 × sin α
Because a chromosome represents a set of hyperplane sets, and there are three kinds of objects to be classified, a group of hyperplanes has three chromosomes. A hyperplane consists of an angle α and a distance d , and there are 30 chromosomes in the genetic initialization population in this paper.
The parameter setting of GA is very important to the result accuracy and time efficiency of hybrid pixel decomposition. In this study, appropriate parameters were determined through the following three tables (Table 2, Table 3 and Table 4).
When the variation probability is less than 0.1, the training accuracy is high. When the variation probability is set to 0.02, the relationship between the cross rate and the training accuracy and training time is shown in the following table when the other parameters remain unchanged (Table 3).
When the cross rate is 0.3, the training time is the least and the training accuracy is high. When the cross rate is equal to 0.3 and the variation rate is equal to 0.02, the relationship between the number of training points and the training accuracy & time is shown in the following Table 4.
When the cross rate is equal to 0.3 and the variation rate is equal to 0.02, the increase of training points will not lead to the increase of training time in a certain range.
In this paper, the genetic algorithm uses binary coding. The initial population is randomly selected, and then according to the above research, cross rate is equal to 0.3, and variation rate is equal to 0.02.
After 212 generations of genetic evolution, 18,250 training samples were successfully classified, and the training success rate was 96.1%. The three hyperplane equations and angles acquired by genetic training were as in Table 5:
The mixed pixel decomposition with hyperplane and GA was used to process the remote sensing images, the categories were determined according to the final assignment, the vegetation interference were removed, and results are as in Figure 5.
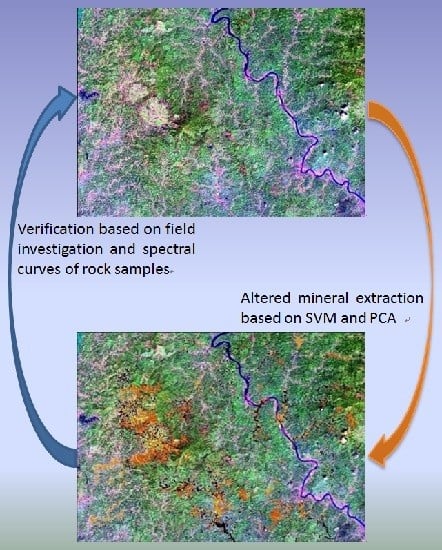
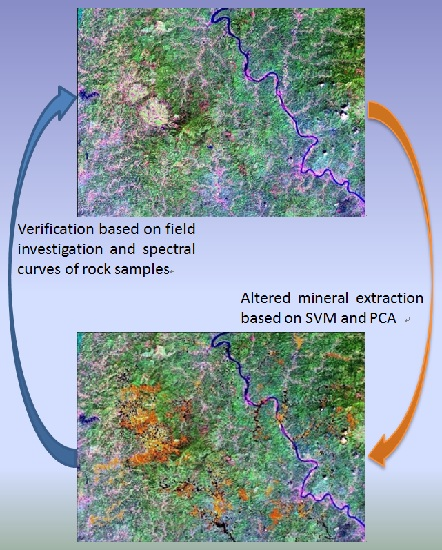
Because vegetation is the main disturbance factor in extracting mineral alteration information in a high vegetation area, removing or weakening vegetation will greatly improve the accuracy of extracting alteration information. The spectral profiles of the study image before and after vegetation removal were as in Figure 6.
Figure 6 indicates the image has basically no vegetation spectral information after vegetation removal treatment.
Figure 5 and Figure 6 certify the image of the rock is highlighted in place of the original green part of the vegetation cover area after vegetation removal by unmixing with hyperplane optimized by GA.

4.2. Collection of Altered Mineral Samples

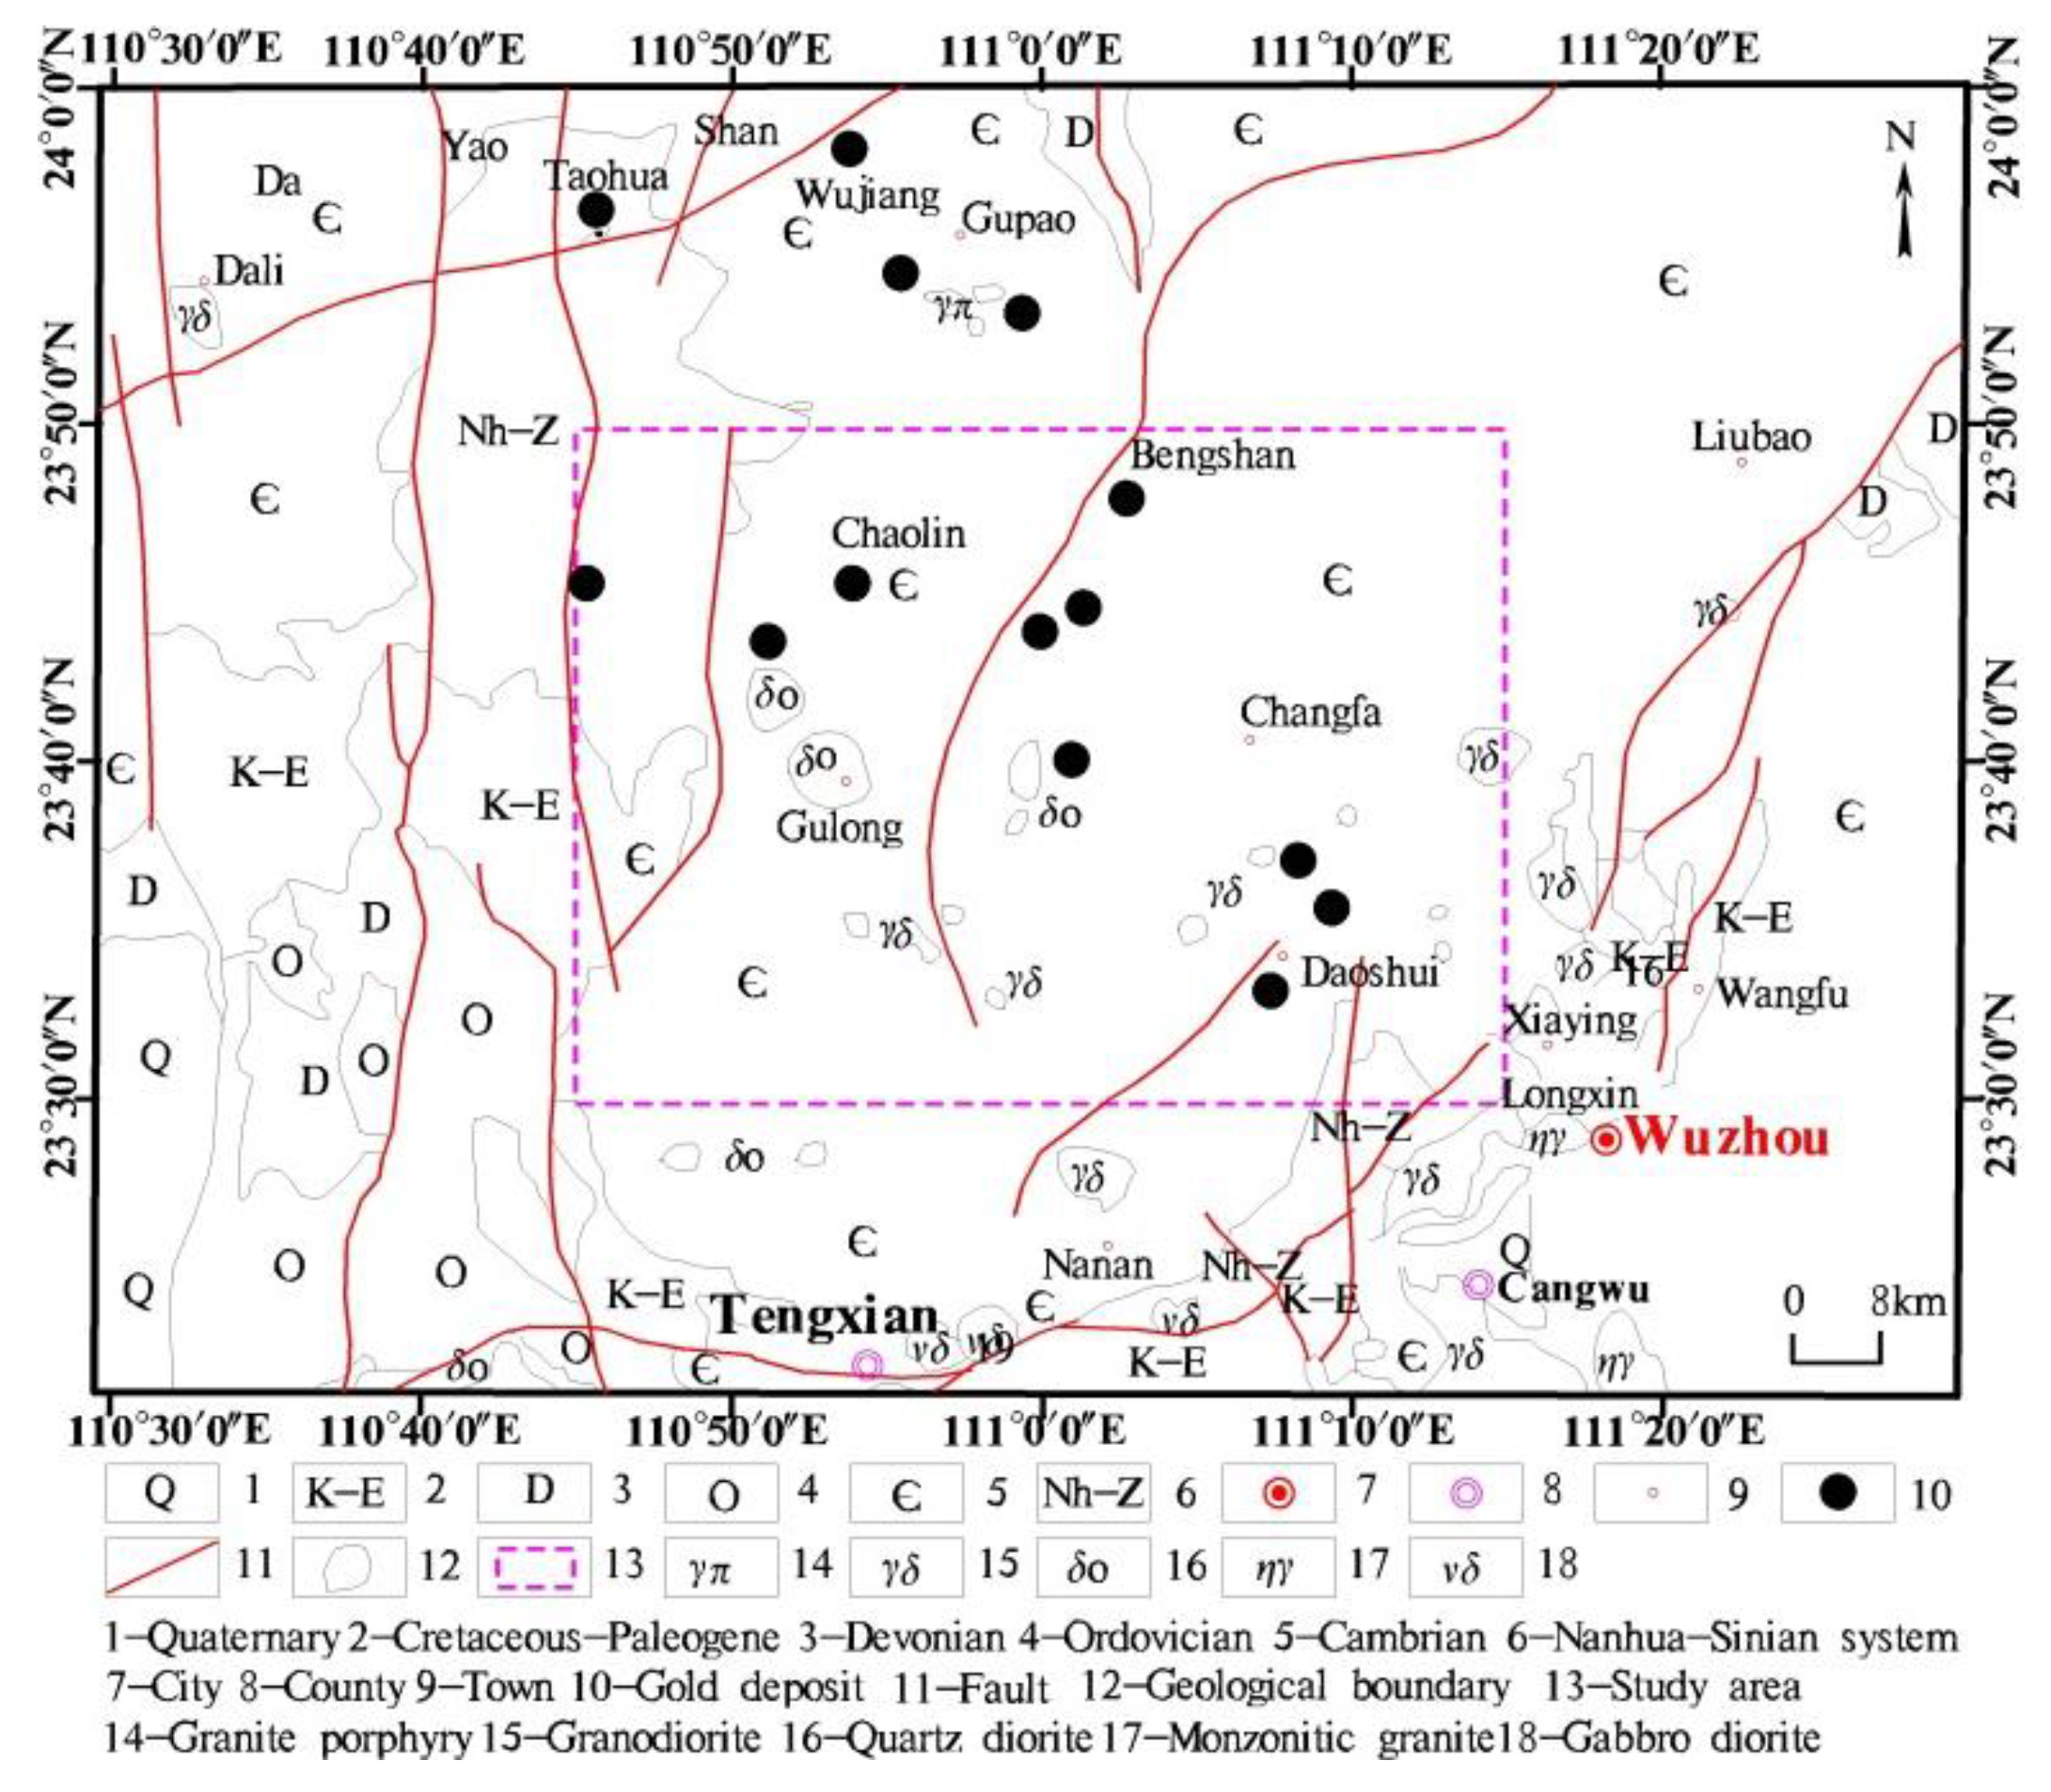
Through the analysis of the distribution of gold deposits and the ore-bearing strata of the study area, the pyrite, sericite and chlorite are the most closely related to altered mineral of surrounding rock, which is a good prospecting indicator of gold ore [58,59,60].
The main basis for the selection of bands was based on the characteristic spectrum of minerals to select the two bands with the largest reflectivity difference in ASTER image for ratio operation and to generate the ratio image, which can enhance the spectral difference among minerals and eliminate the interference of topography and shadow.
In the light of the minerals reflectance spectra of pyrite, B1, B2, B5/B3, and B4 of ASTER image were selected as input bands for PCA. The eigenvector of principal component was as shown in Table 6.
According to the spectral curve characteristics of pyrite, the spectral curve at B1 of ASTER image is absorption valley, and the coefficient symbol should be negative in the eigenvector matrix. The spectral curve at B2 and B4 of ASTER image are reflection peak, and the coefficient symbol should be positive in the eigenvector matrix. The PC4 in Table 6 satisfies the above conditions, so the PC4 reflects the alteration information of iron mineralization and was selected as the extraction layer of pyrite mineralization.
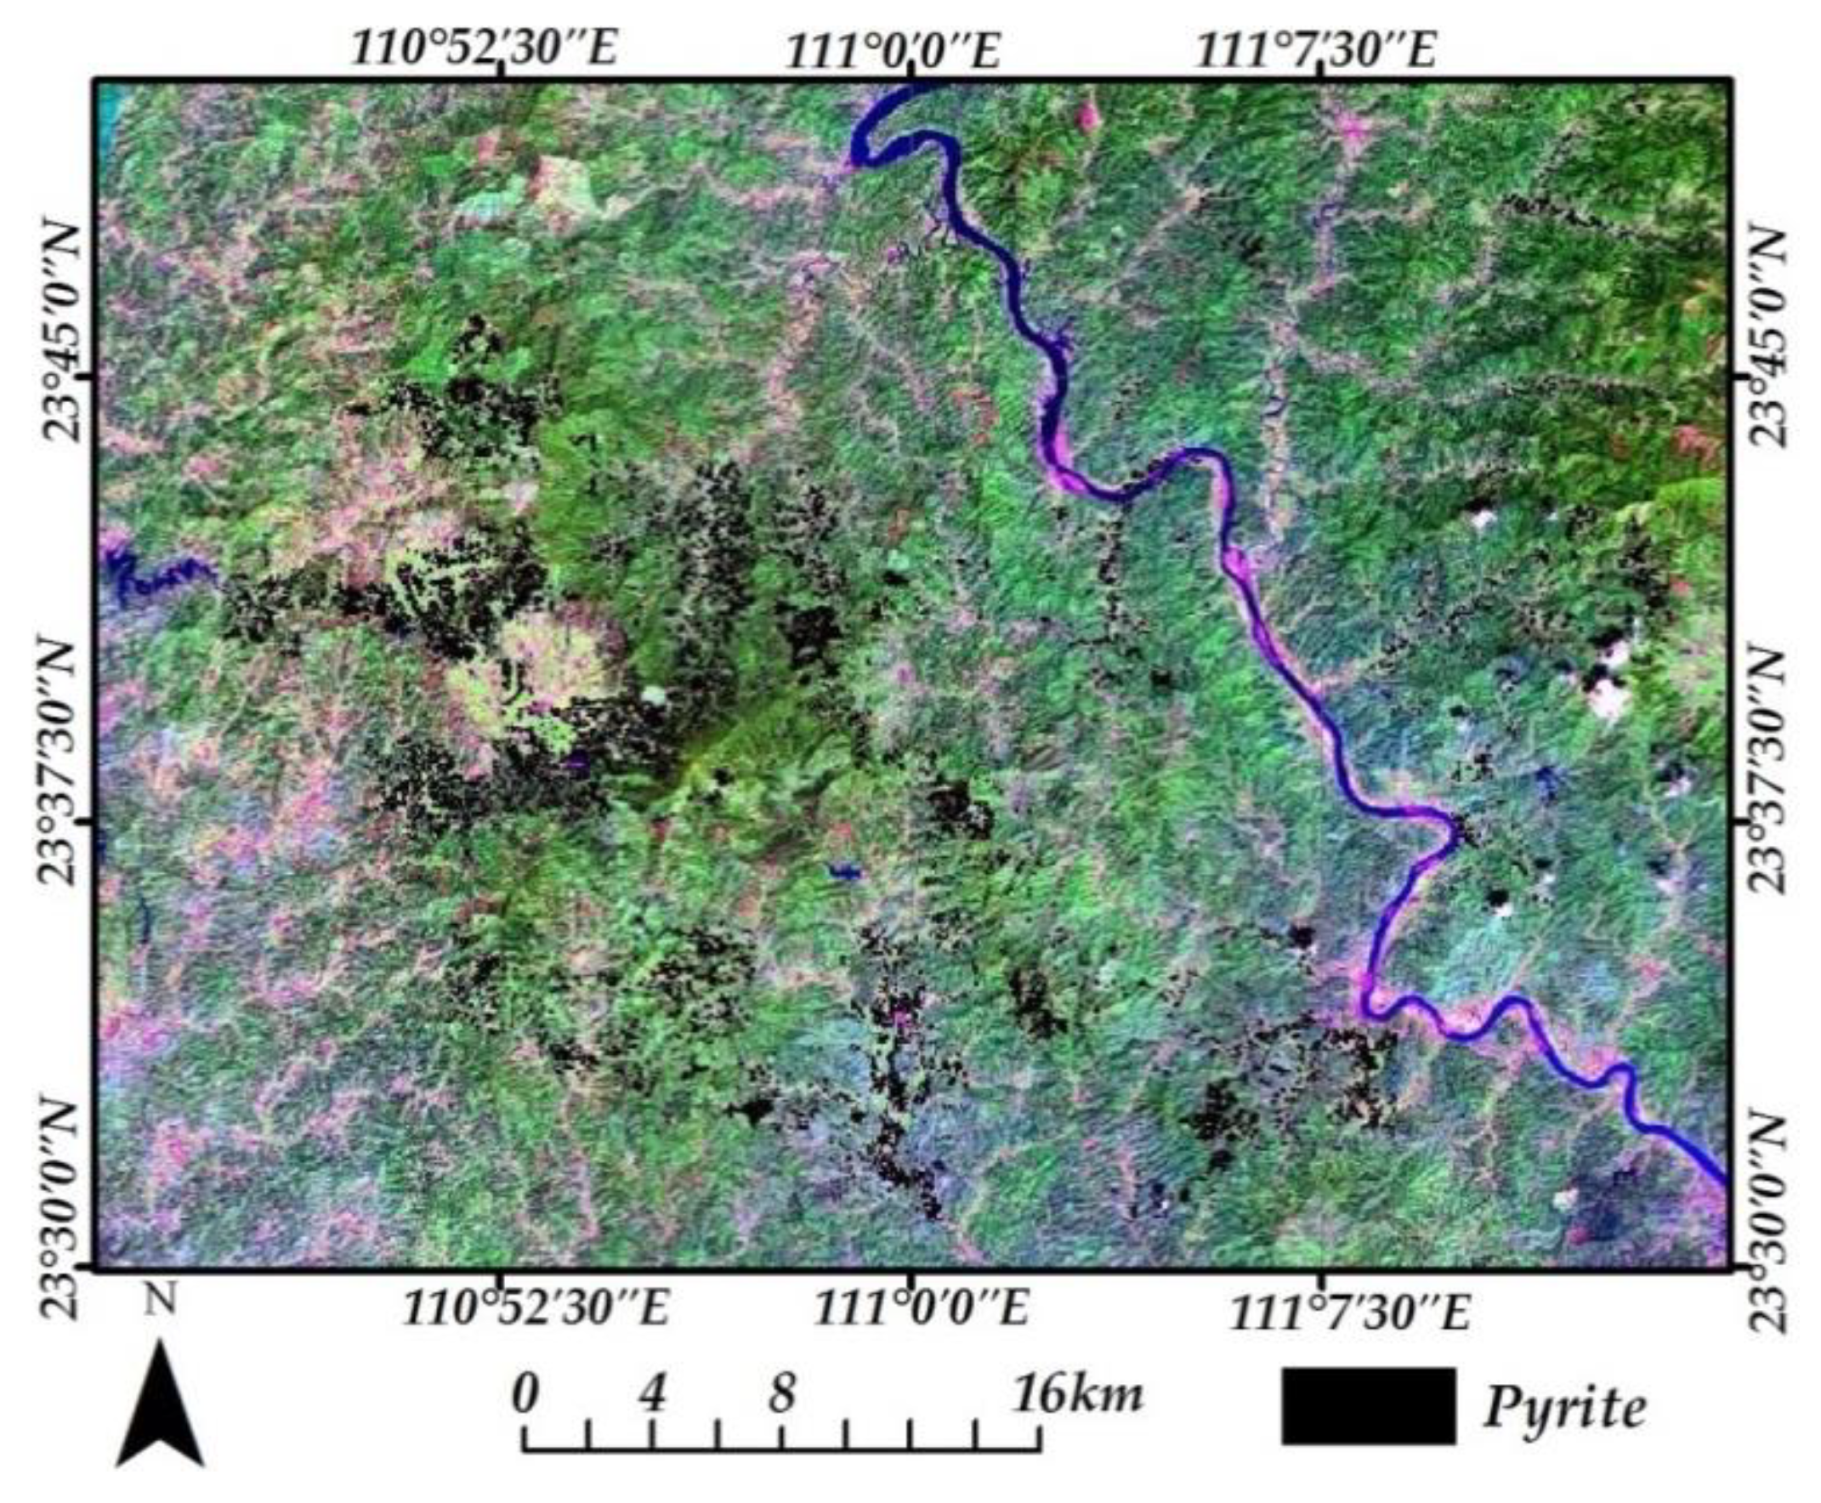
In order to get pyrite mineralization, PC4 needs to be further processed. Firstly, the PC4 was filtered by using 3 × 3 median filter to eliminate the noise. Then, the result of the filter was stretched linearly by using 0–255 grey value. Finally, the mineralization information was segmented by using the average value plus standard deviation of 3.0 times as the threshold, and the segmentation result was as shown in Figure 7:
Figure 7 shows that the altered zone of pyrite has obvious ribbon and planar distribution characteristics, which are mainly distributed in the western of the study area, and a small amount scattered in the northeast of the study area, forming a fourth-step ladder spatial distribution pattern along the northwest-southeast direction. Along the northwest-southeast direction are the alteration belts formed in the northeast, southeast and southwest of Dacun rock mass; in the east and south of Gulong rock mass; in the surrounding of Pingtoubei, Sitai, Shedong, Dapo rock mass; as well as in the surrounding of Wujie, Ludong, Fenghuang, Fuqing, and Siwei rock mass (Figure 7).
In the same way, in the light of the minerals reflectance spectra of sericite, B1, B4/B6, B7, and B9 of the ASTER image were selected as input bands for PCA. The eigenvector of principal component was as shown in Table 7.
According to the spectral curve characteristics of sericite, the spectral curve at B1 and B9 of ASTER image are an absorption valley, and the coefficient symbol should be negative in the eigenvector matrix. The spectral curve at B7 of the ASTER image is a reflection peak, and the coefficient symbol should be positive in the eigenvector matrix. The PC4 in Table 7 satisfied the above conditions, so the PC4 was selected as the extraction layer of sericite mineralization.
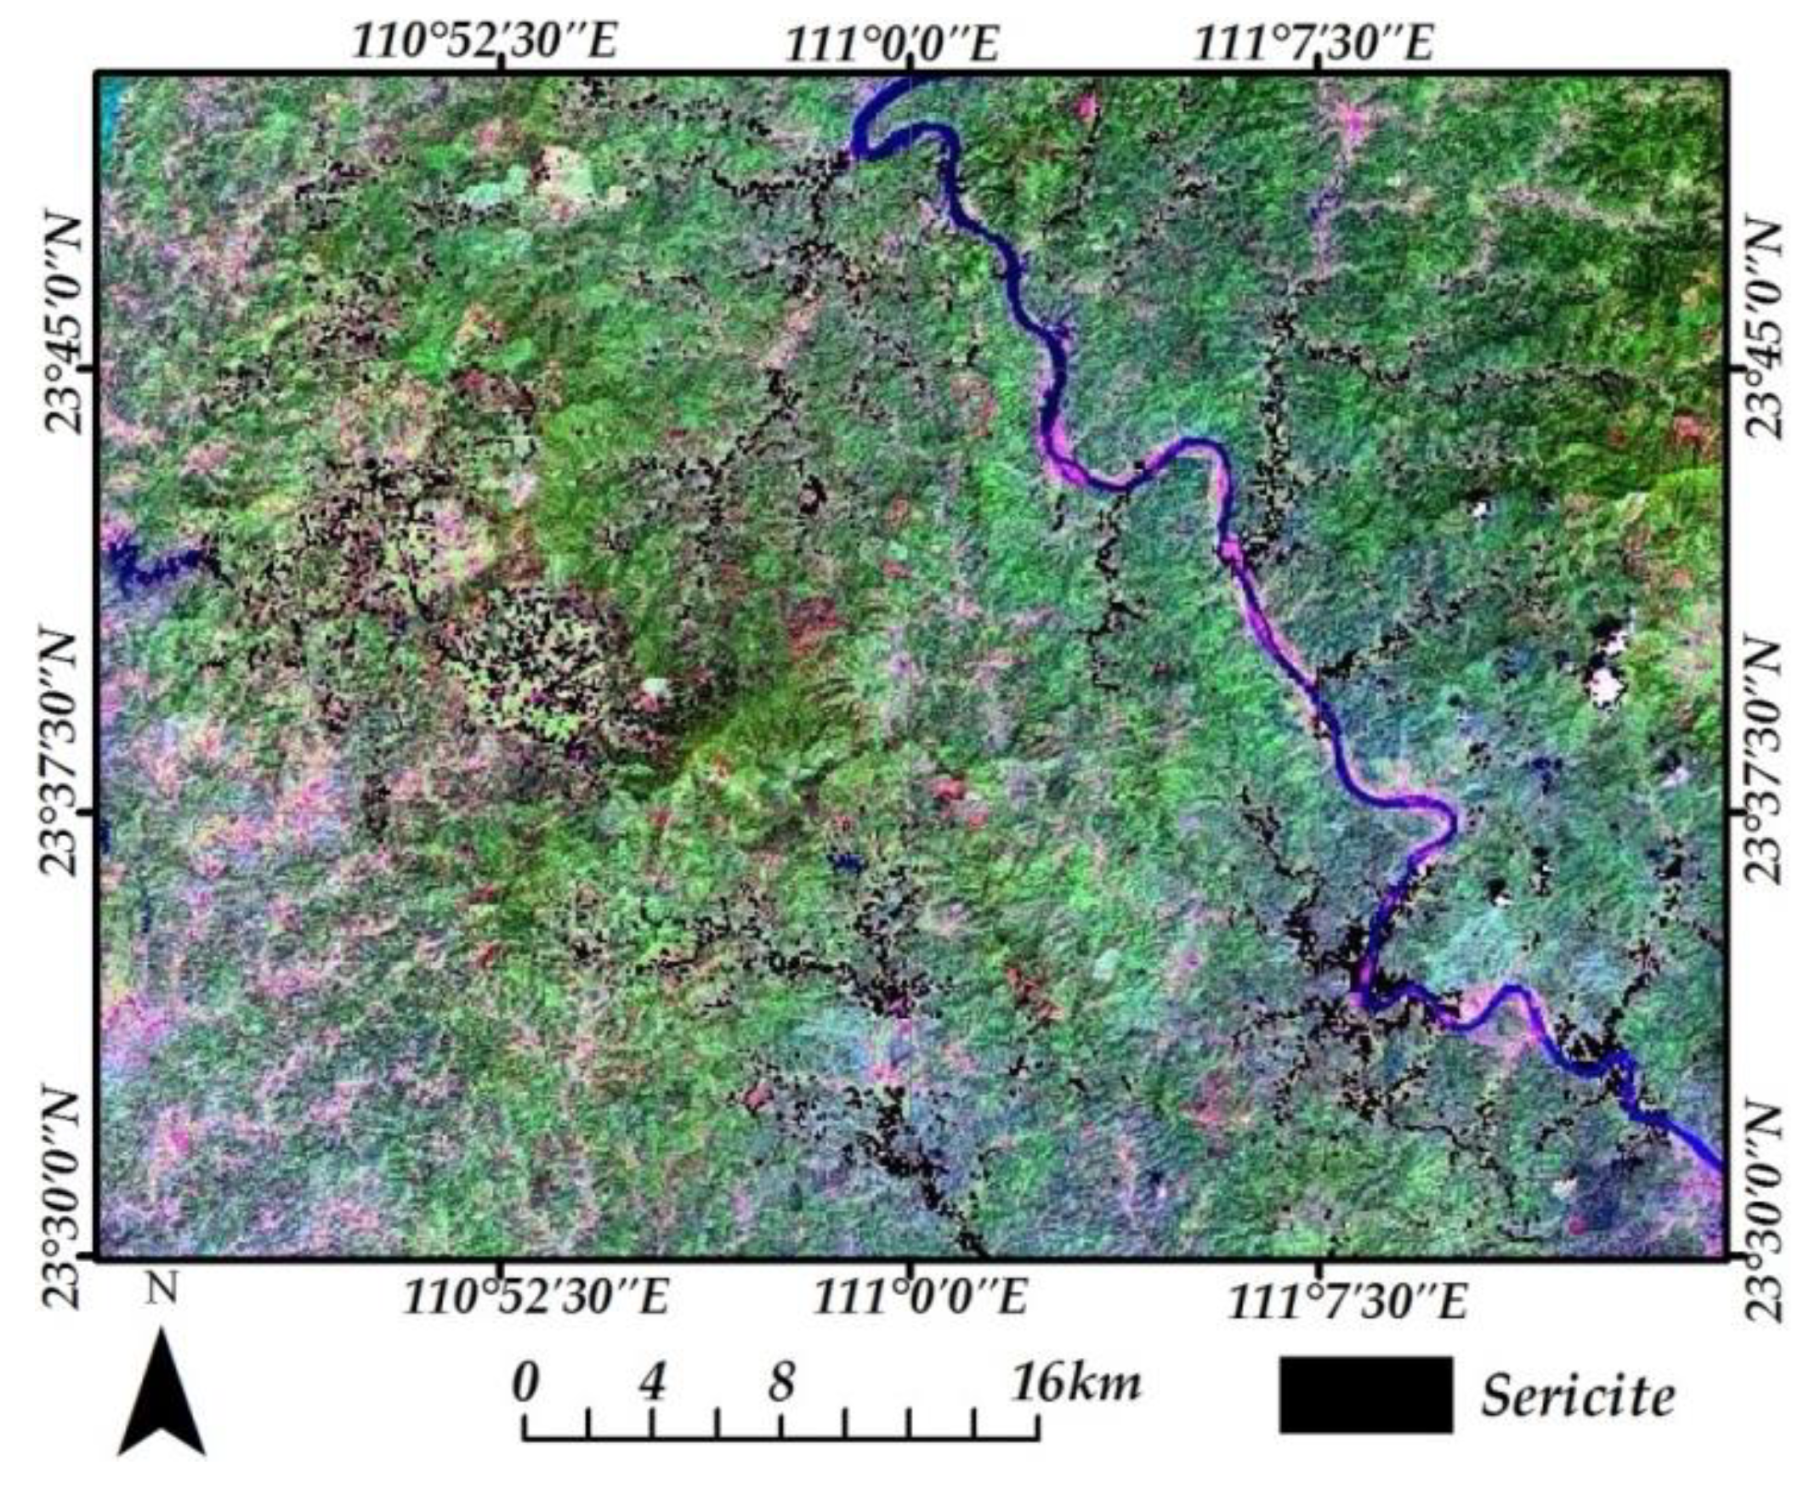
In order to get sericite mineralization, the PC4 needed to be further processed in the same way as pyrite, and the segmentation result was as shown in Figure 8:
Figure 8 indicates the altered zone of sericite has obvious ribbon and planar distribution characteristics, which are mainly distributed in the western of the study area, forming a fourth-step ladder spatial distribution pattern along the northwest-southeast direction. Along the northwest-southeast direction are the alteration belts formed in the northeast of Dacun rock mass; in the interior of Gulong rock mass; in the surrounding of Pingtoubei, Sitai, Shedong, Dapo rock mass; as well as in the surrounding of Wujie, Ludong, Fenghuang, Fuqing, and Siwei rock mass (Figure 8).
Similarly, in the light of the minerals reflectance spectra of chlorite, B1, B2, B5/B8 and B9 of ASTER image were selected as input bands for PCA. The eigenvector of the principal component was as shown in Table 8.
According to the spectral curve characteristics of chlorite, the spectral curve at B2 of the ASTER image is an absorption valley, and the coefficient symbol should be negative in the eigenvector matrix. The spectral curve at B1 and B9 of the ASTER image are reflection peaks, and the coefficient symbol should be positive in the eigenvector matrix. The PC4 in Table 8 satisfies the above conditions, so the PC4 is selected as the extraction layer of chlorite mineralization.
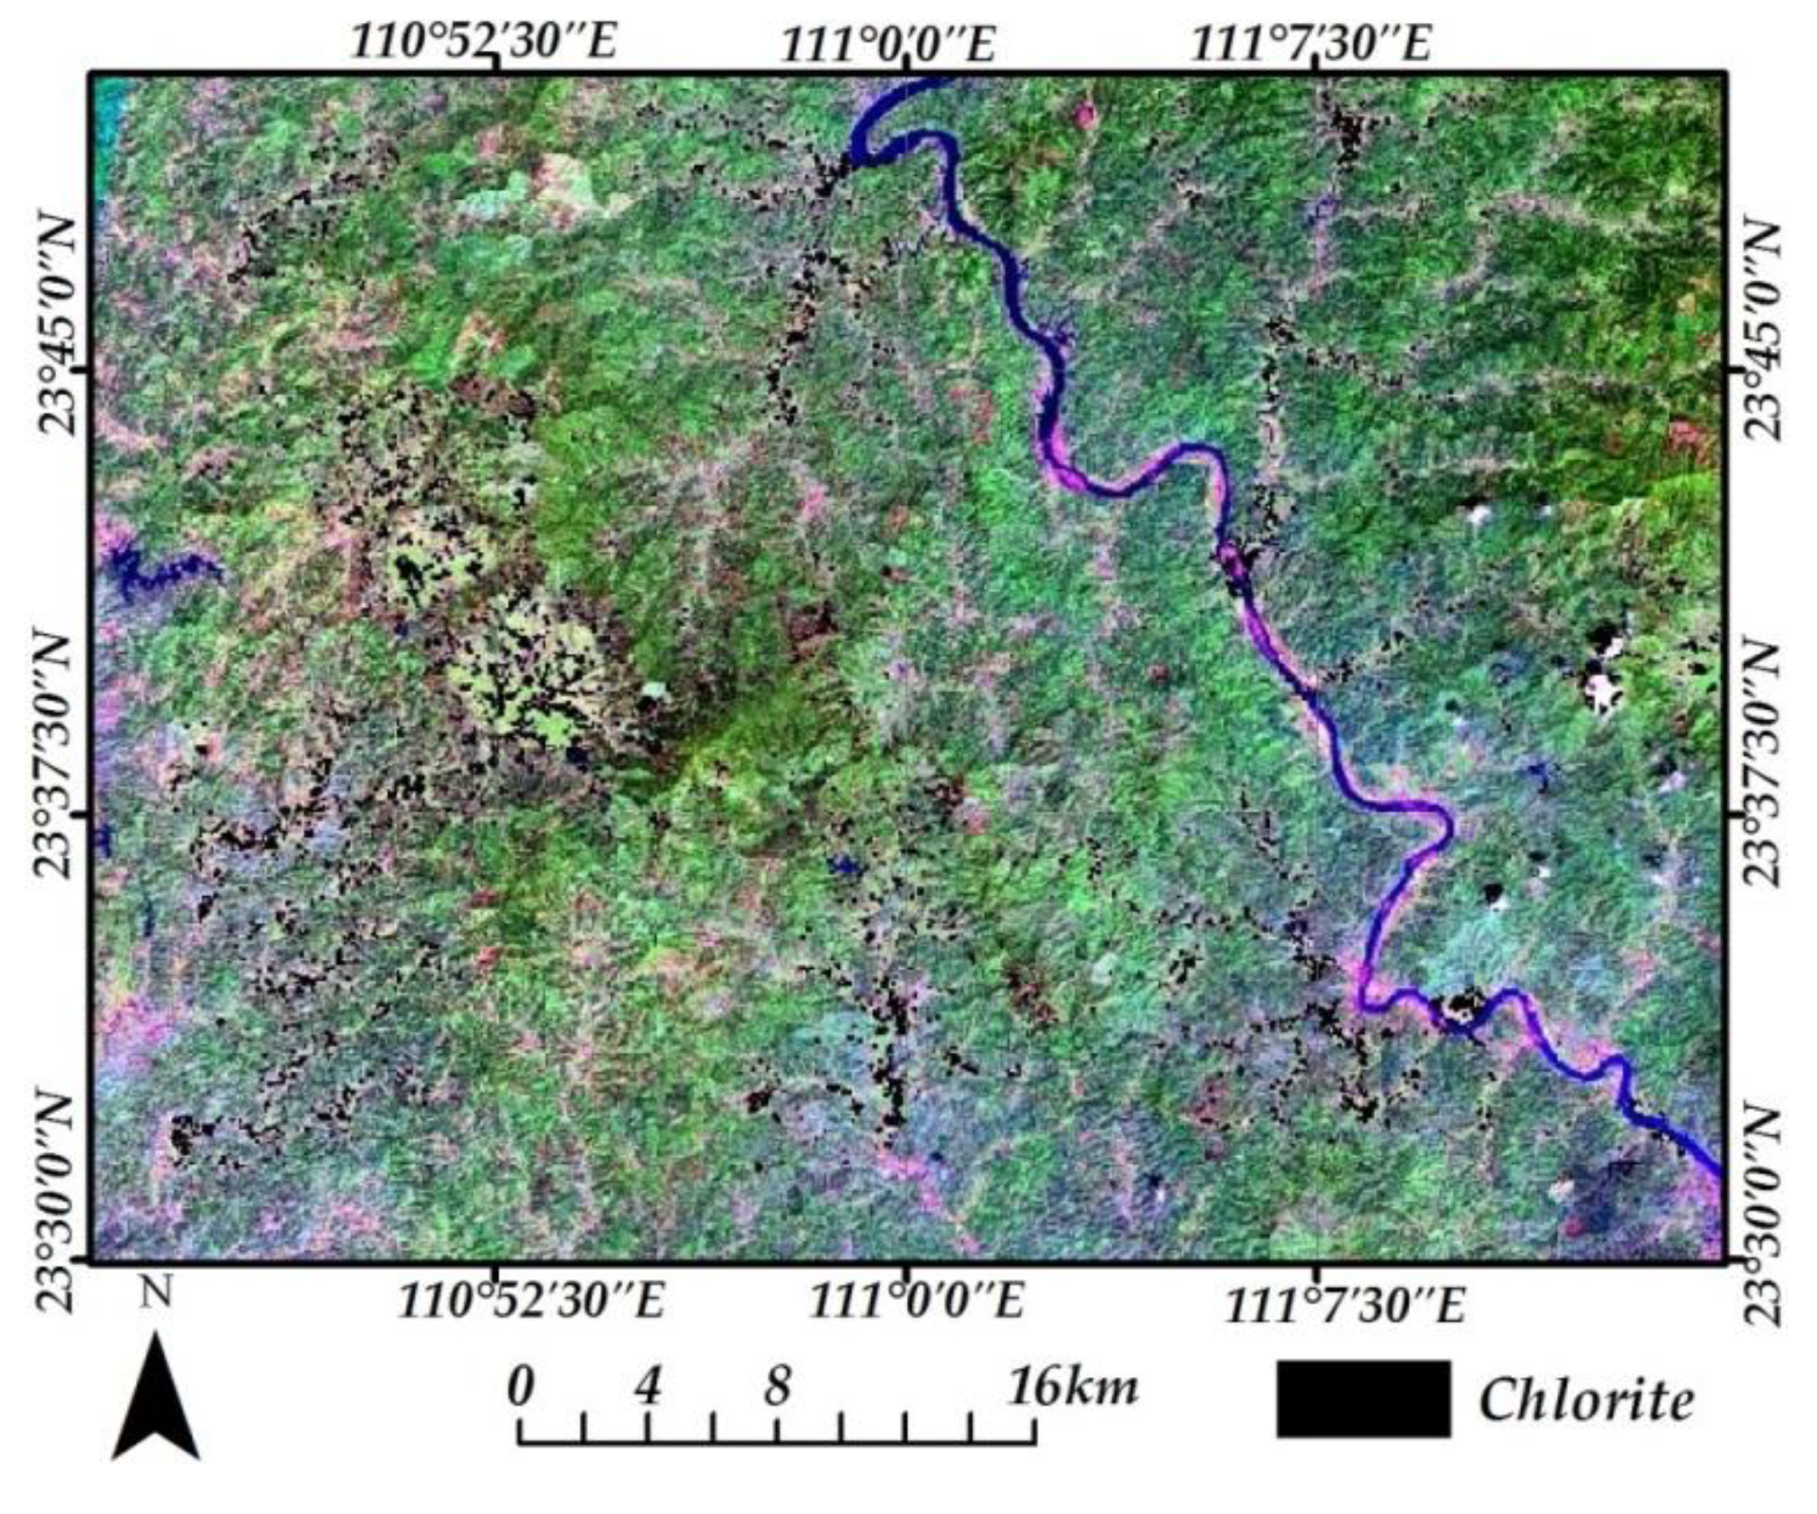
In order to get chlorite mineralization, the PC4 needs to be further processed in the same way as pyrite and sericite, and the segmentation result are as shown in Figure 9:
Figure 9 illustrates that the altered zone of chlorite has obvious ribbon distribution characteristics in Figure 8, which are mainly distributed in the western of the study area, and a small amount scattered in the northeast. Specifically they are distributed in the Dacun rock mass; in the interior of Gulong rock mass; in the surrounding of Pingtoubei, Sitai, Shedong, Dapo rock mass; as well as in Ludong, Fenghuang, Fuqing, and Siwei rock mass (Figure 9).
In general, the altered mineral formation of pyrite, sericite and chlorite are closely related to the hydrothermal alteration, so the altered zone has the characteristics surrounding rock mass distribution [60,61]. In addition, the alteration area is distributed both sides of the Limu-Majiang fault near the north-south direction, and in the south of the Pingxiang-Dali fault near the northeast direction, so the spatial distribution of the altered zone is closely related to the intrusive rocks and faults.

4.3. Altered Mineral Information Extraction

In order to obtain a mineralization alteration sample, the mineralization alteration information of pyrite, sericite, and chlorite were loaded into the previous survey results map (Figure 10).
The selection of training samples was based on the field survey, remote sensing image and topographic map. According to the results of the field survey and 14 gold deposits in Figure 10, 300 pixels each altered minerals were selected from the image where 14 gold mining areas overlap with altered minerals. At the same time, 900 pixels were selected in the non-mining area and the non-alteration mineral area, with a total of 1800 pixels as the training and test samples to train the SVM model. Among them, 80% of the samples (half of them were mineralization alteration, 1/3 of per mineralization alteration) were randomly selected as training samples, and the remaining 20% were used as the test samples.
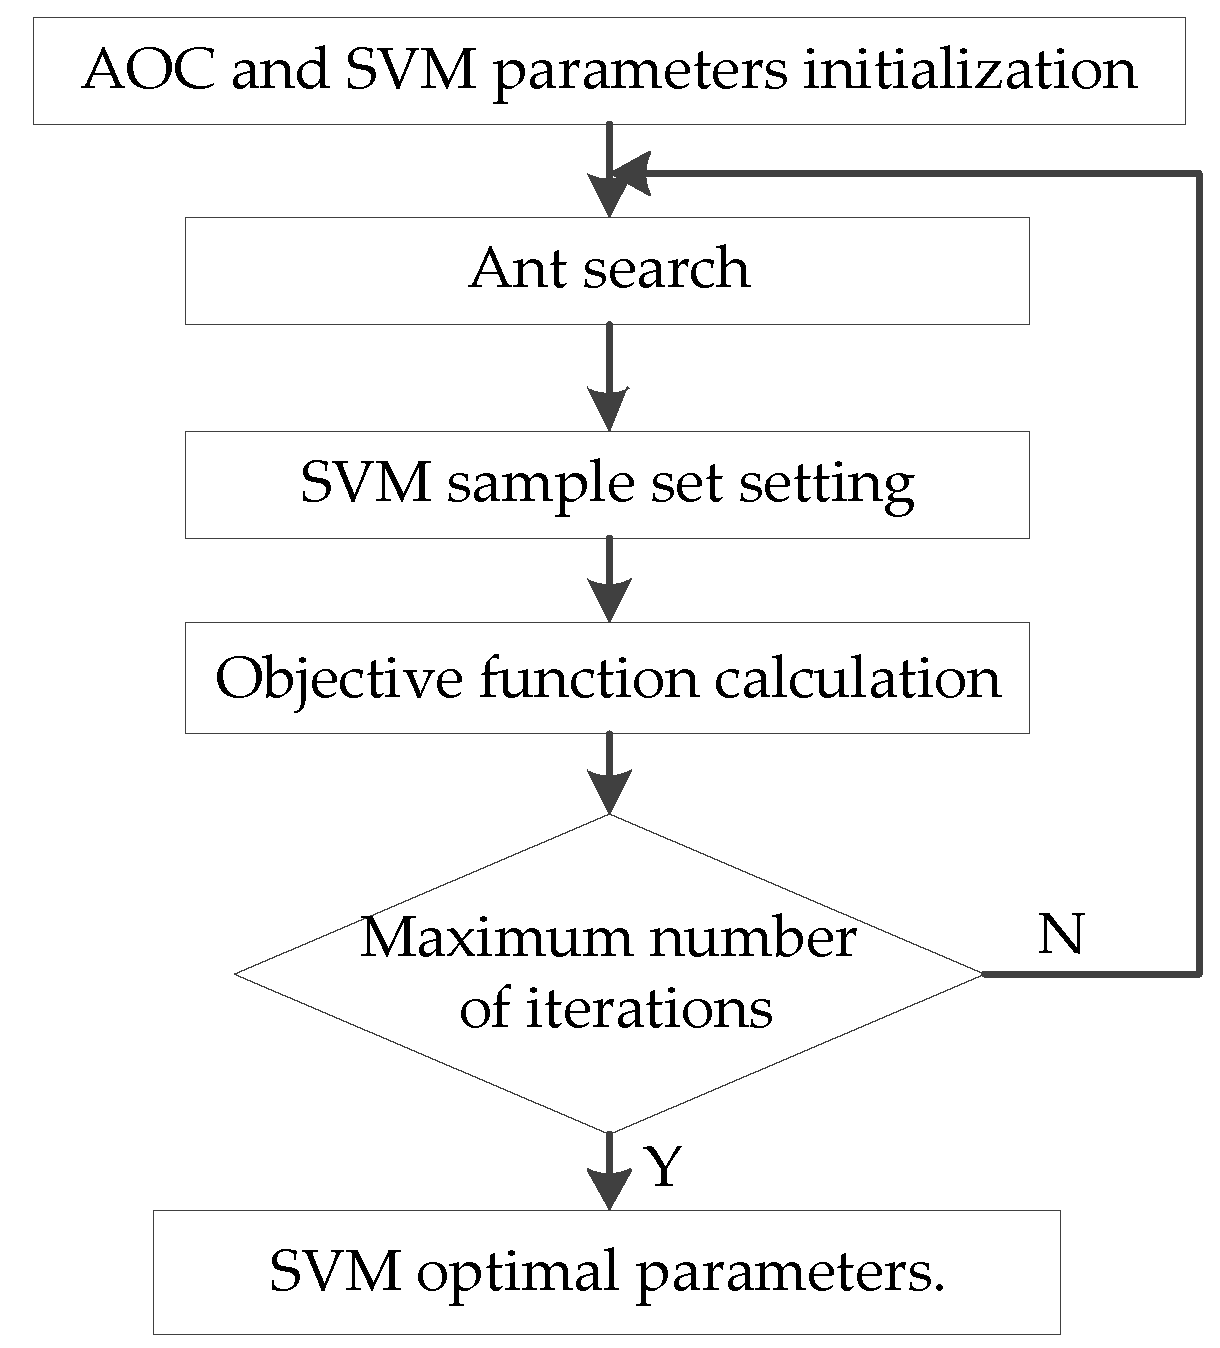
On the basis of selecting SVM kernel function, the SVM was trained by the above sample data, and at the same time, the SVM was optimized by the ACA, in which the maximum number of iterations K = 10, ant colony size N = 20, pheromone evaporation coefficient Rho = 0.8, pheromone increasing intensity Q = 0.9, ant crawling speed Lambda = 0.3.
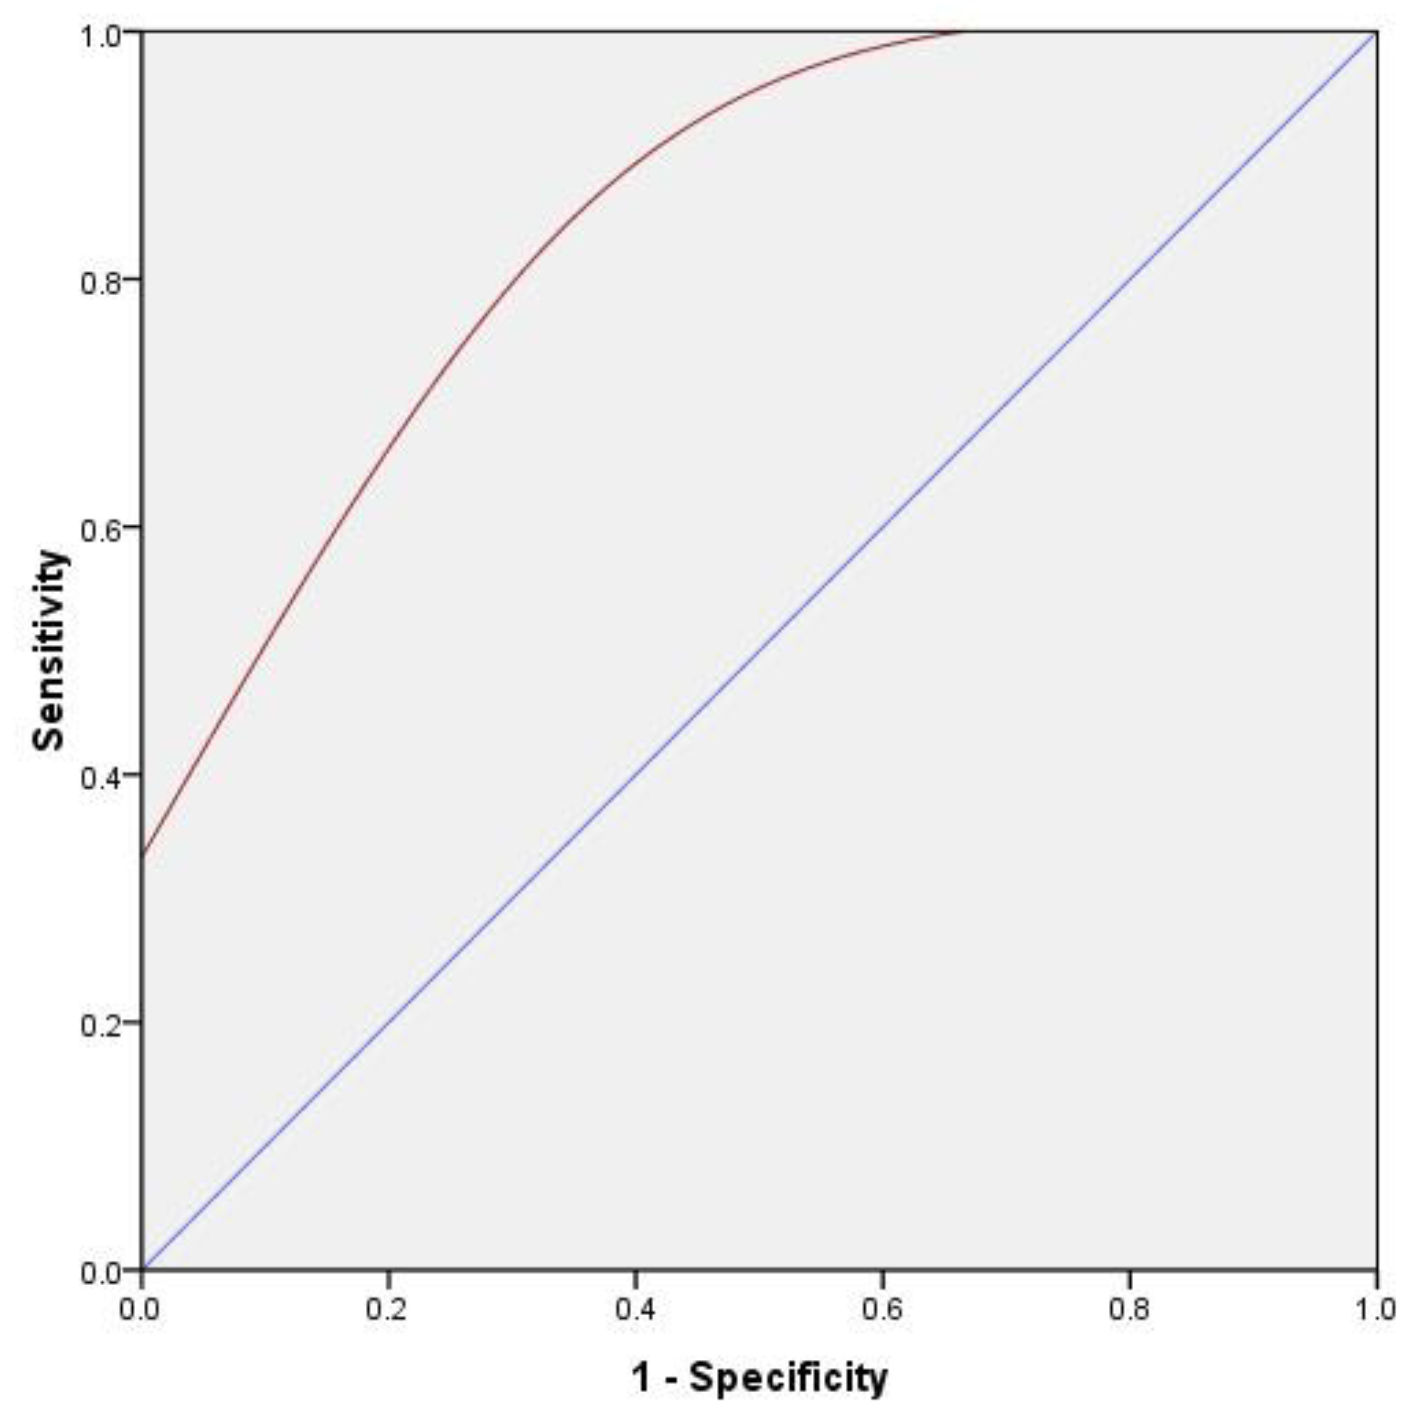
In order to verify the correctness of the SVM model, the area under curve (AUC) of the receiver operating characteristic (ROC) curve was introduced in this research (Figure 11). Figure 11 indicates that the AUC was 0.889 and the forecast accuracy was 88.9%. This result indicates that the SVM has higher prediction accuracy. Therefore, the model built in this paper can be used to extract the altered mineral.
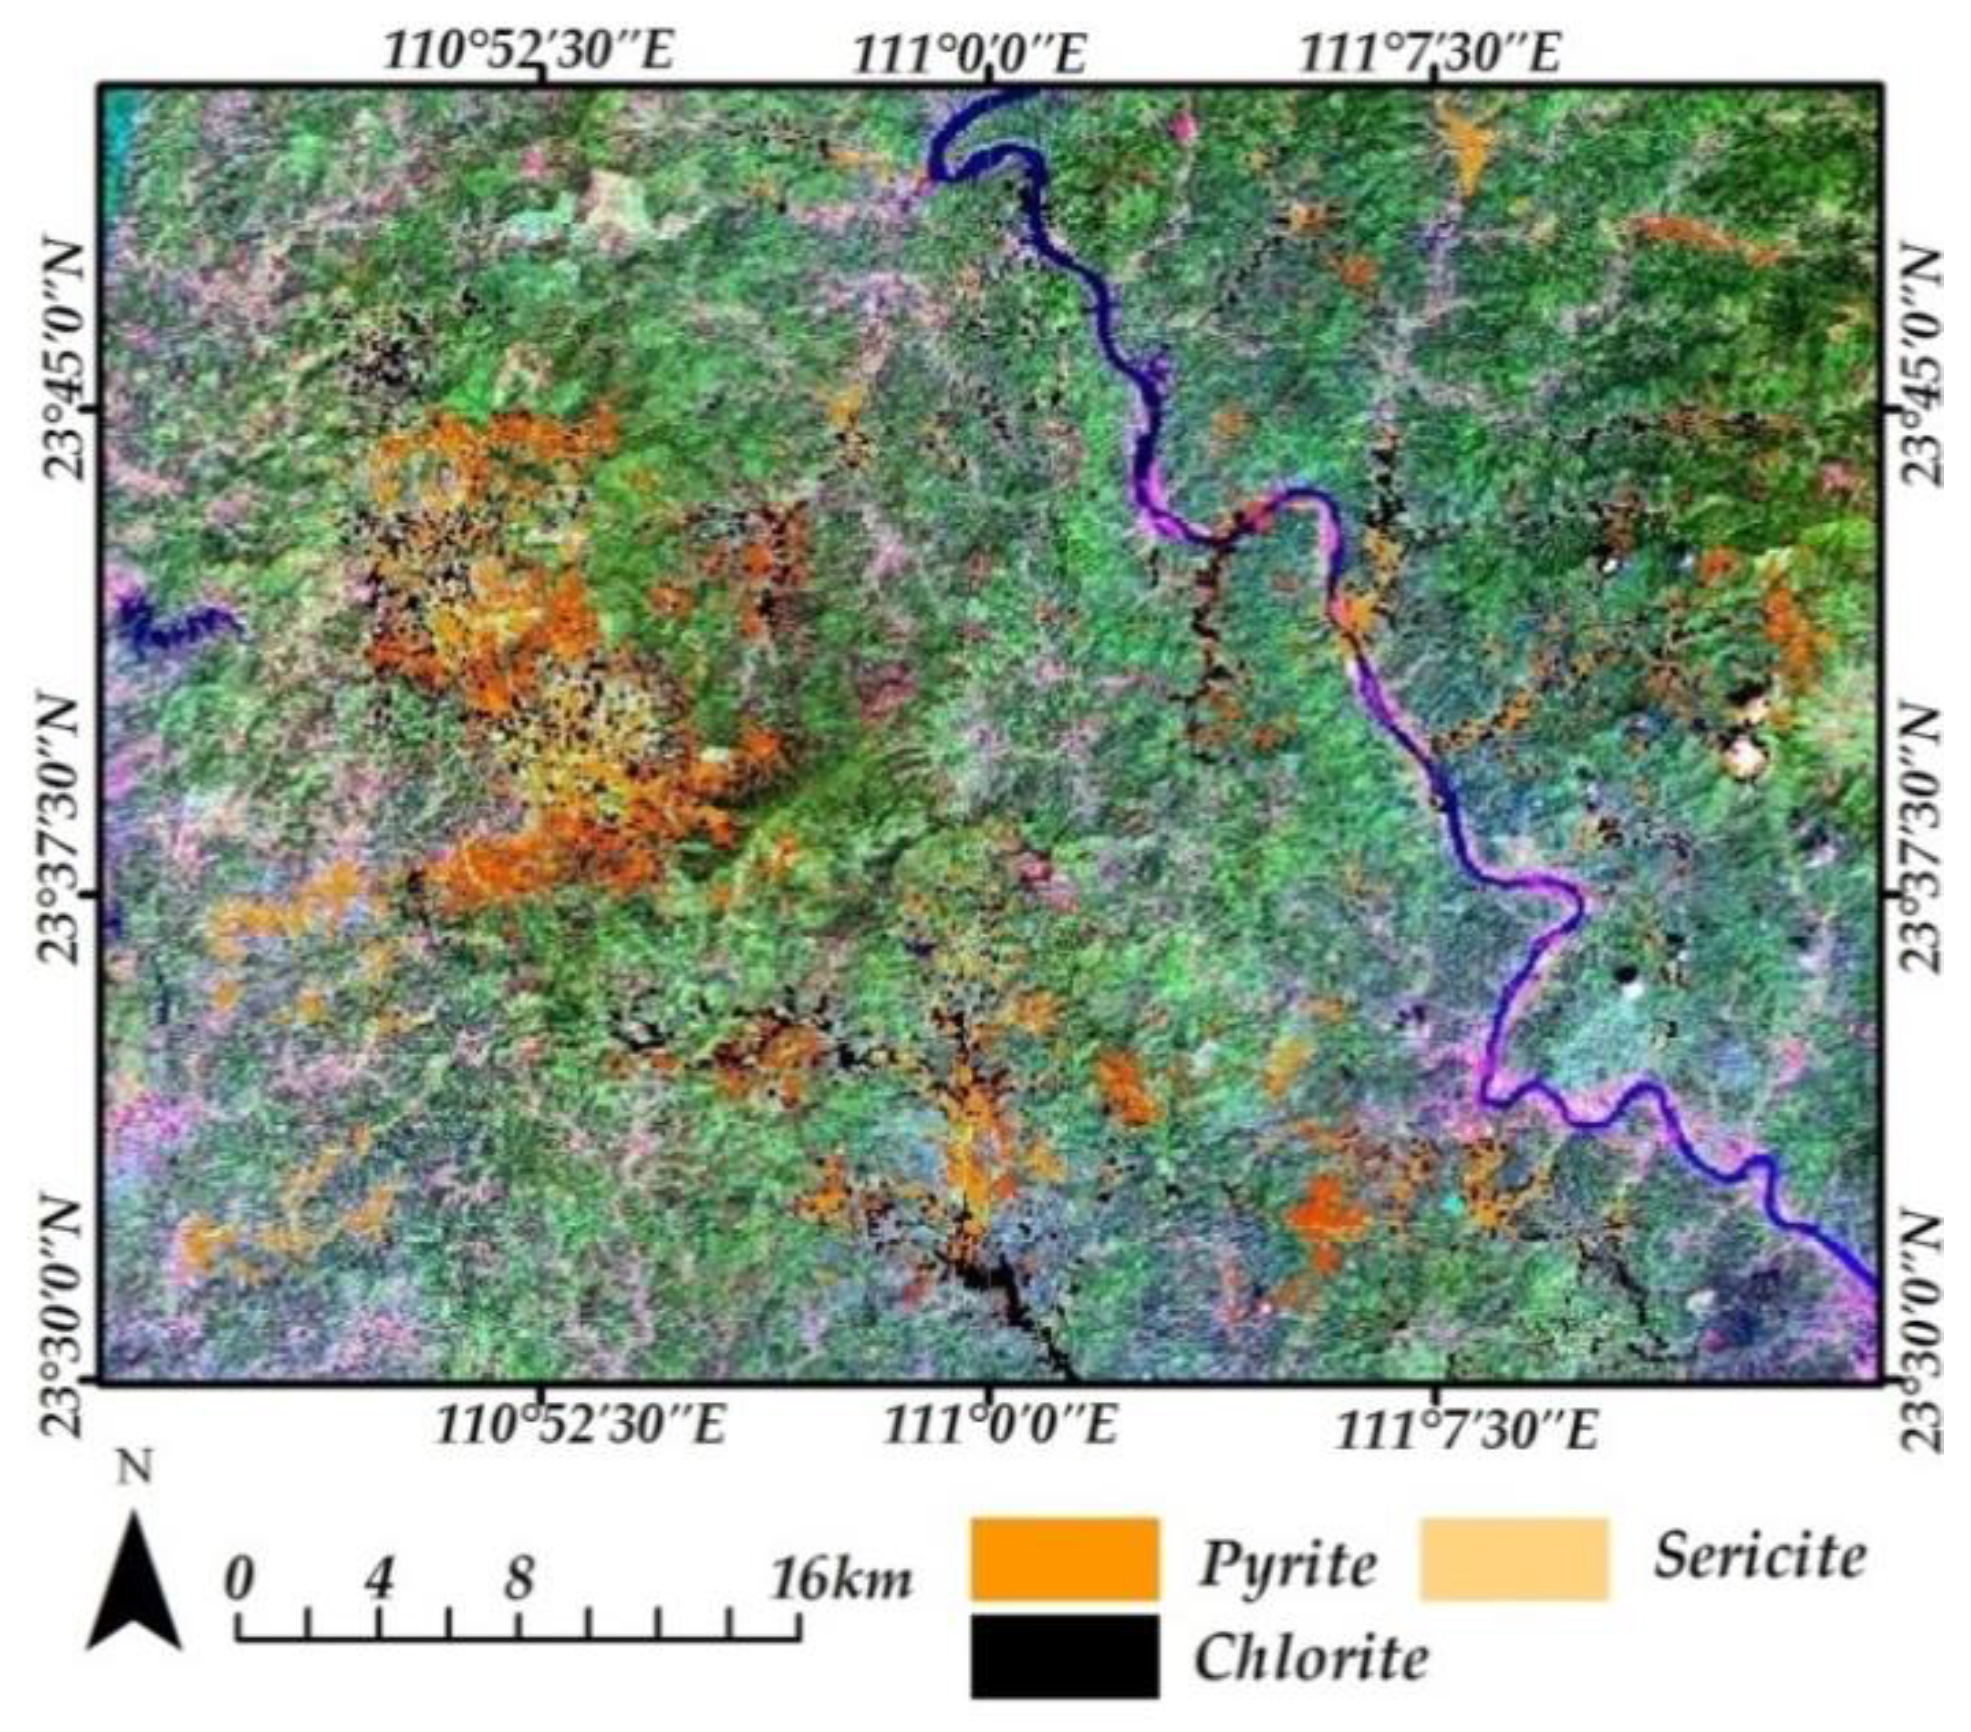
The altered mineral obtained using the PCA method in the study area were input into the trained SVM, the false information was removed, and the mineralization alteration results were obtained, as shown in Figure 12.
Figure 12 indicates that the mineral alteration zone has obvious ribbon and planar distribution characteristics, and forming three regions in space: located in the area of Dacun and Gulong rock mass; located surrounding Pingtoubei, Sitai, Shedong, and Dapo rock mass, as well as located surrounding Fenghuang, Fuqing, and Siwei rock mass. Compared with Figure 7, Figure 8 and Figure 9, it can be seen that the range of the alteration area is smaller, which is due to the removal of some false anomalies. Figure 12 also indicates that mineral alteration does not exist alone, but is associated with each other, which is a good prospecting indicator for gold deposits.
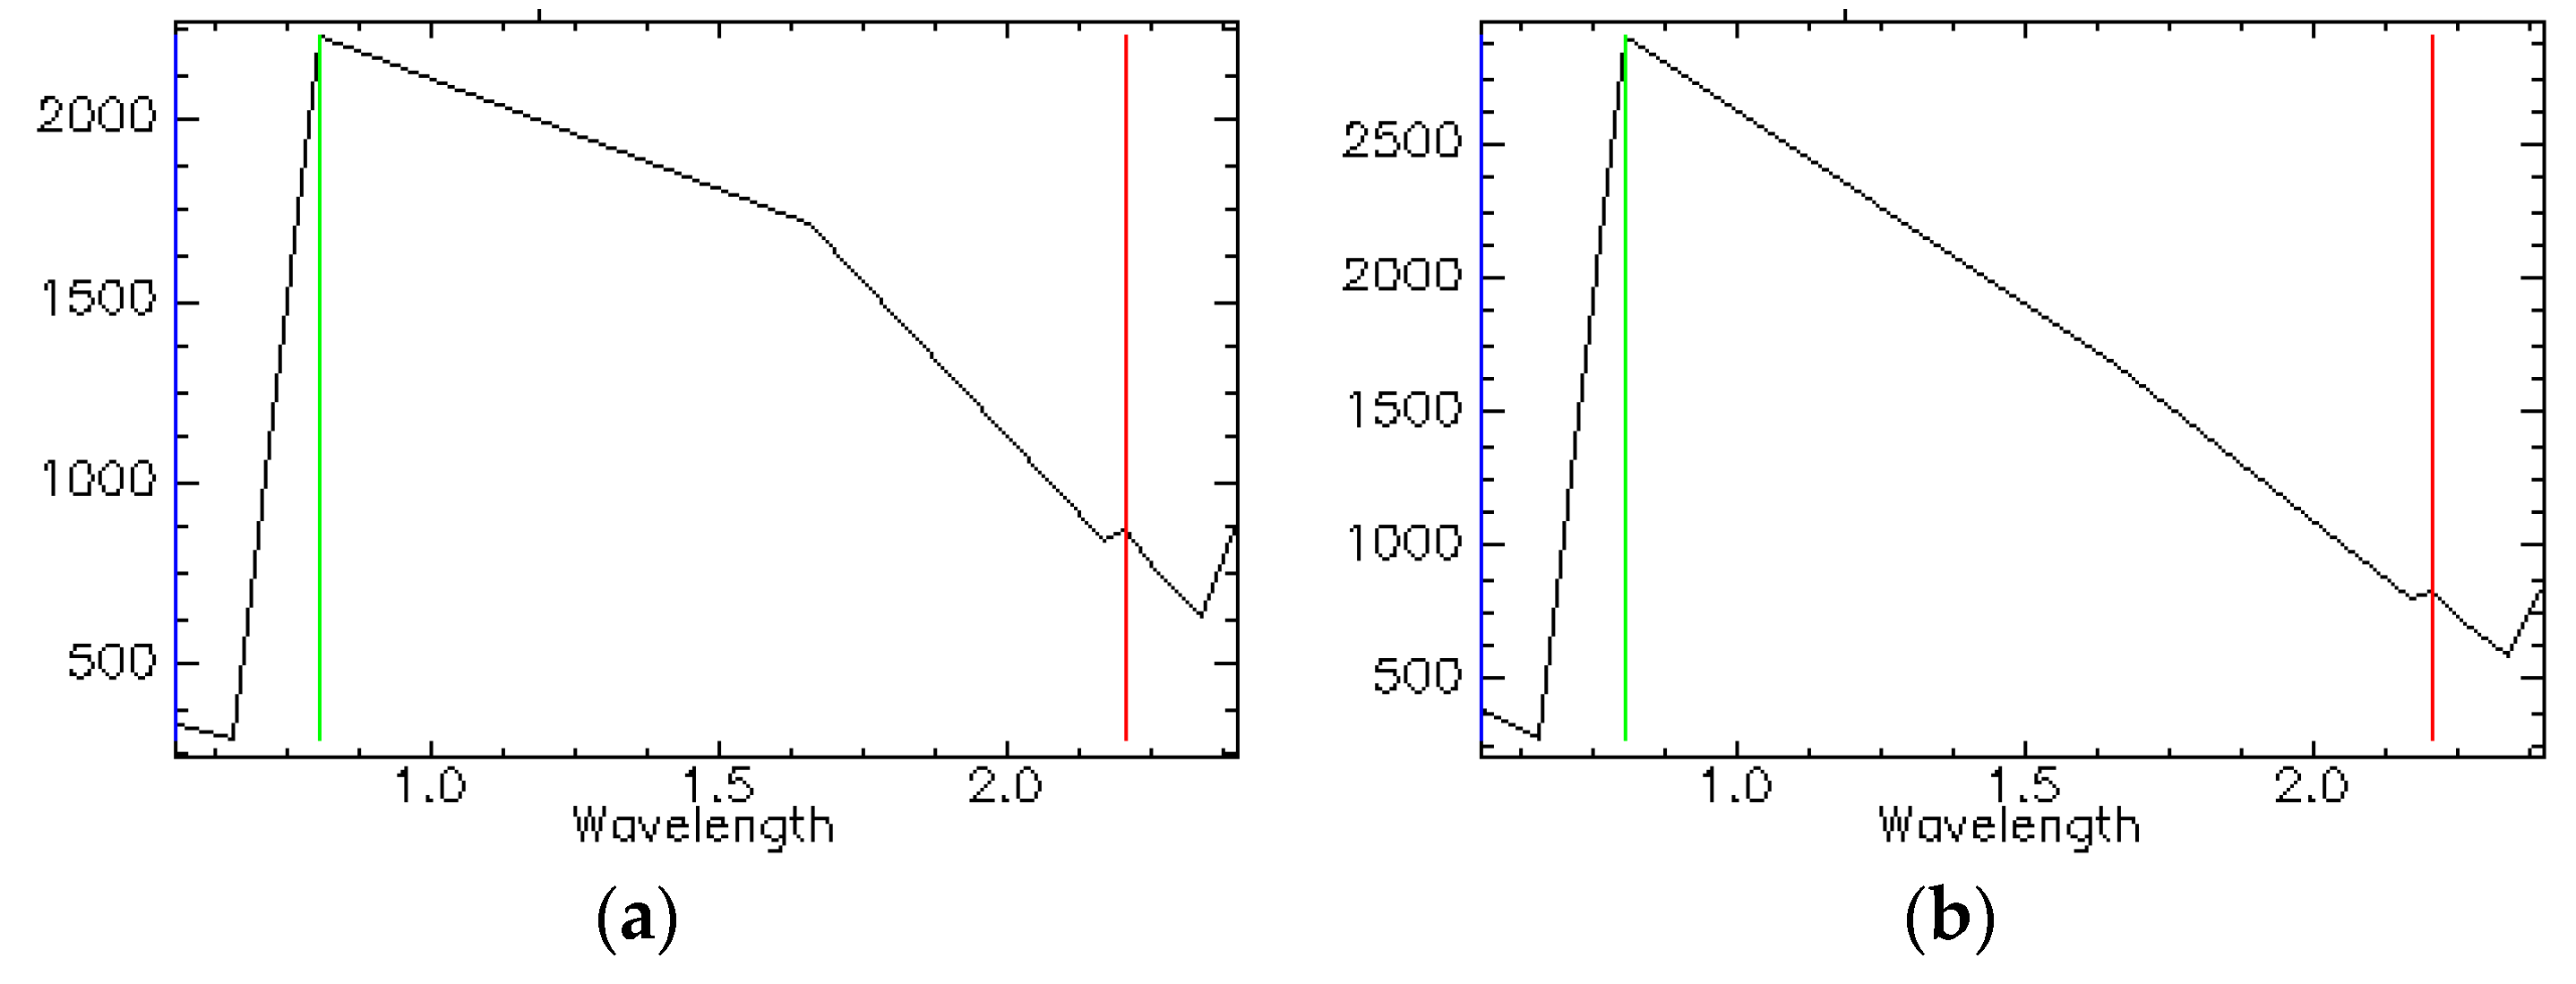
In summary, there are obvious reflection characteristics near 0.67 μm and an absorption valley near 0.81 μm for pyrite, and absorption characteristics at 2.17 μm for sericite, as well as absorption characteristics at 2.35 μm for chlorite. Those characteristics in combination can be used to identify the alteration zone and support mineral prediction. At present, many scholars have used multi-spectral data to identify the alteration zone based on above combination of characteristics [60,62,63].

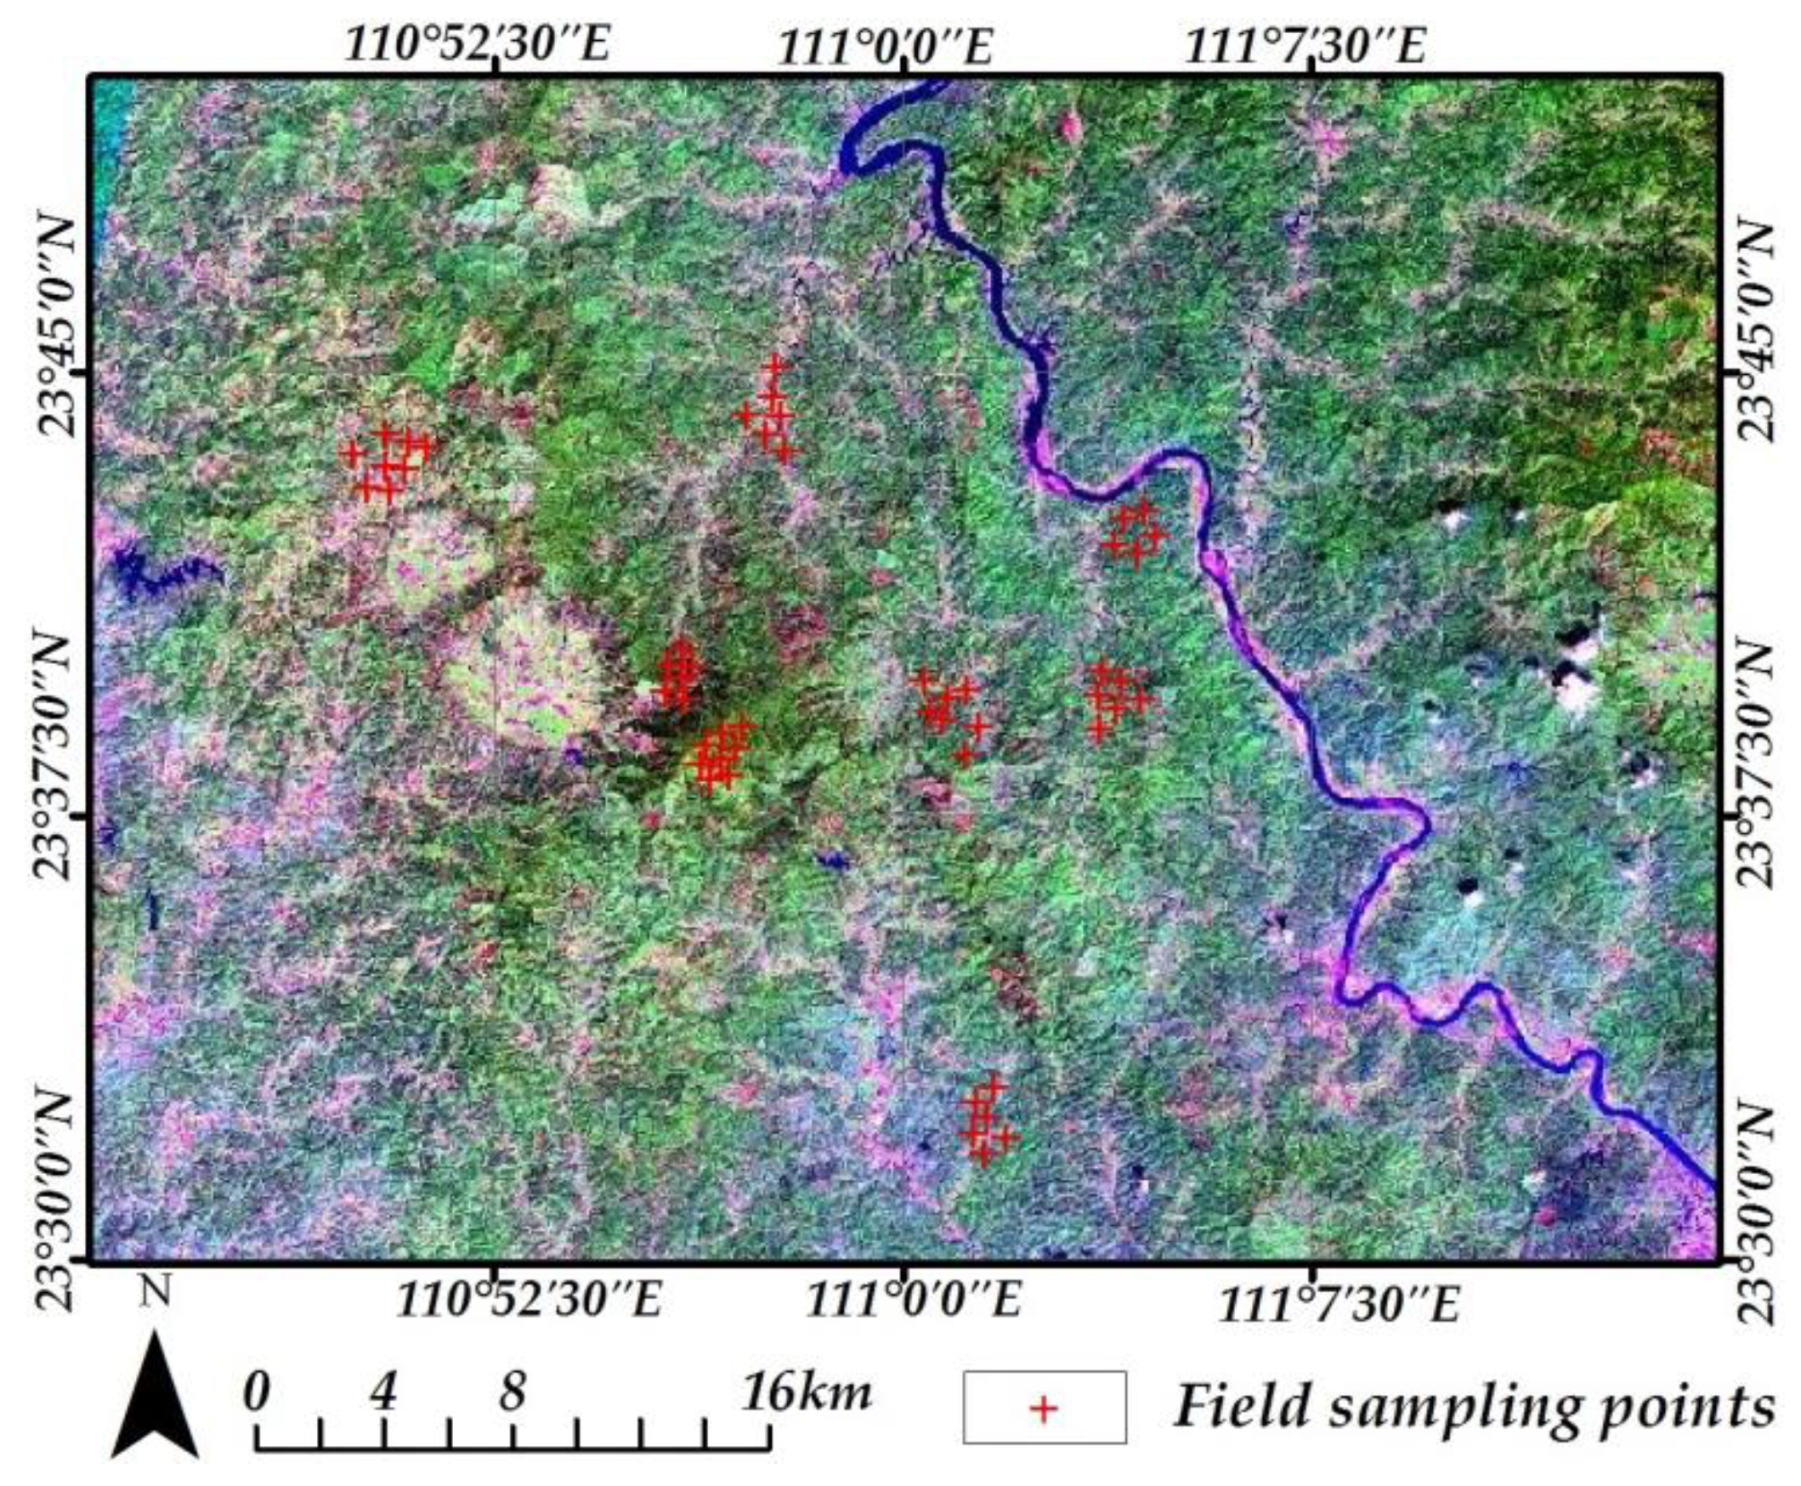
4.4. Verification of Altered Mineral Information Extraction Results

In order to verify the accuracy of the mineral alteration information extracted, a special field investigation was carried out. First of all, the working scope of field verification was determined according to the spatial distribution of remote sensing alteration information. Then, the field survey route was planned according to the regional geological characteristics. Finally, the rock specimens with alteration anomalies were collected in different locations. After 15 days of field sampling and verification in Gulong of Dayao Mountain, 116 rock samples were collected at 52 sampling points (Figure 13), and the rock sample verification analysis was as follows (Figure 14, Figure 15 and Figure 16).
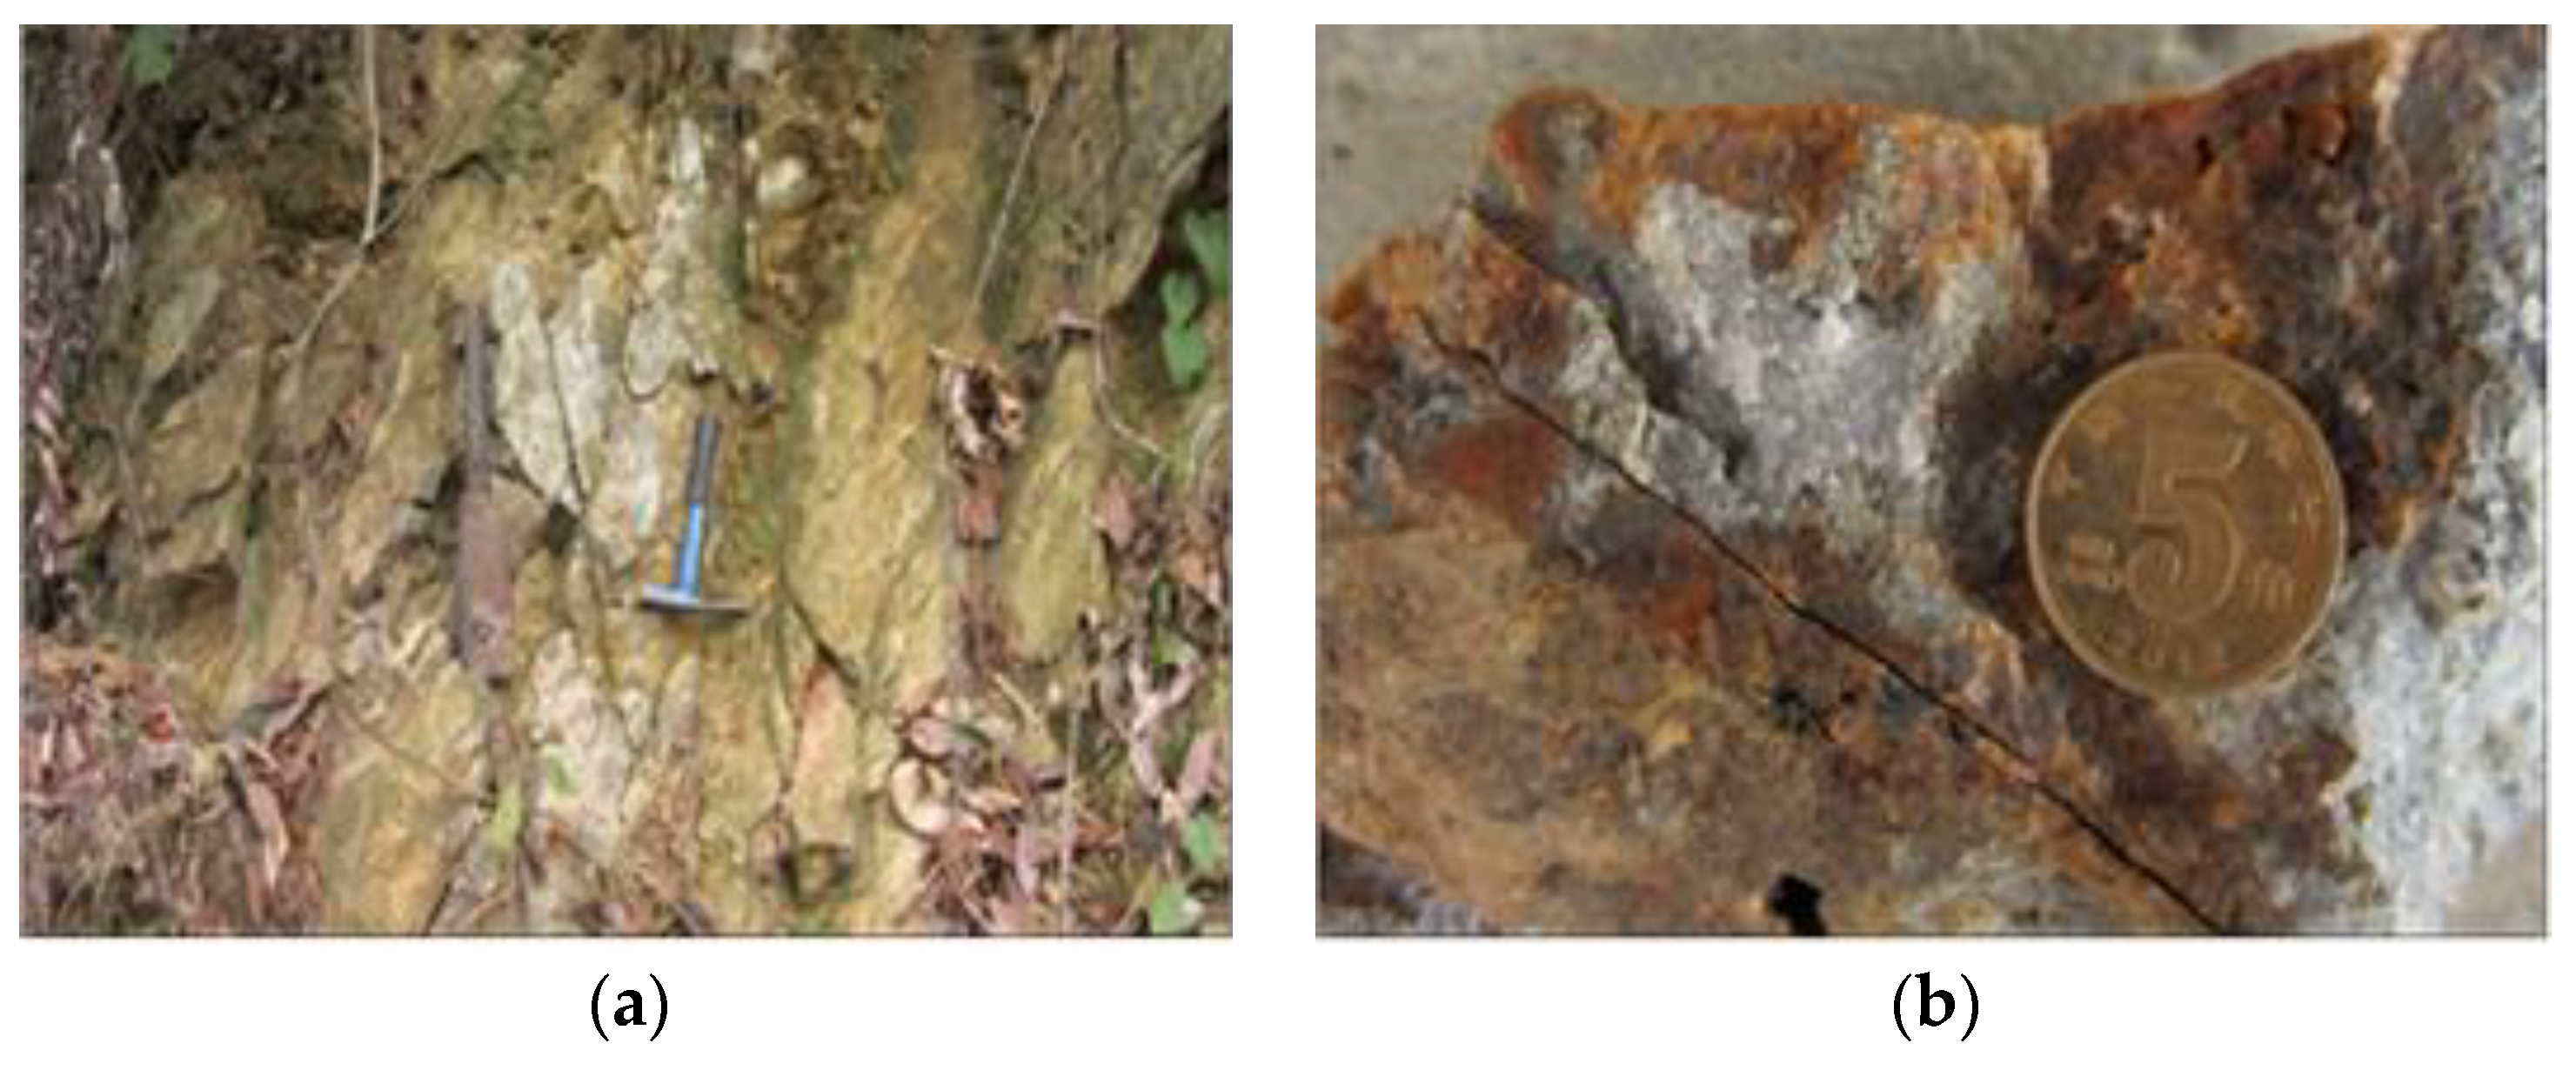
(1) The exposed rocks in Sanxianding have obvious pyritization with a light brass color and bright metallic luster, which shows that the altered minerals contained in the outcrop rocks in the field are consistent with the results extracted using ASTER images (Figure 14). In hydrothermal deposits, pyrite is symbiotic with other sulfides, oxides, quartz and so on. This phenomenon indicates that such rock composition often contains gold, silver and other elements.
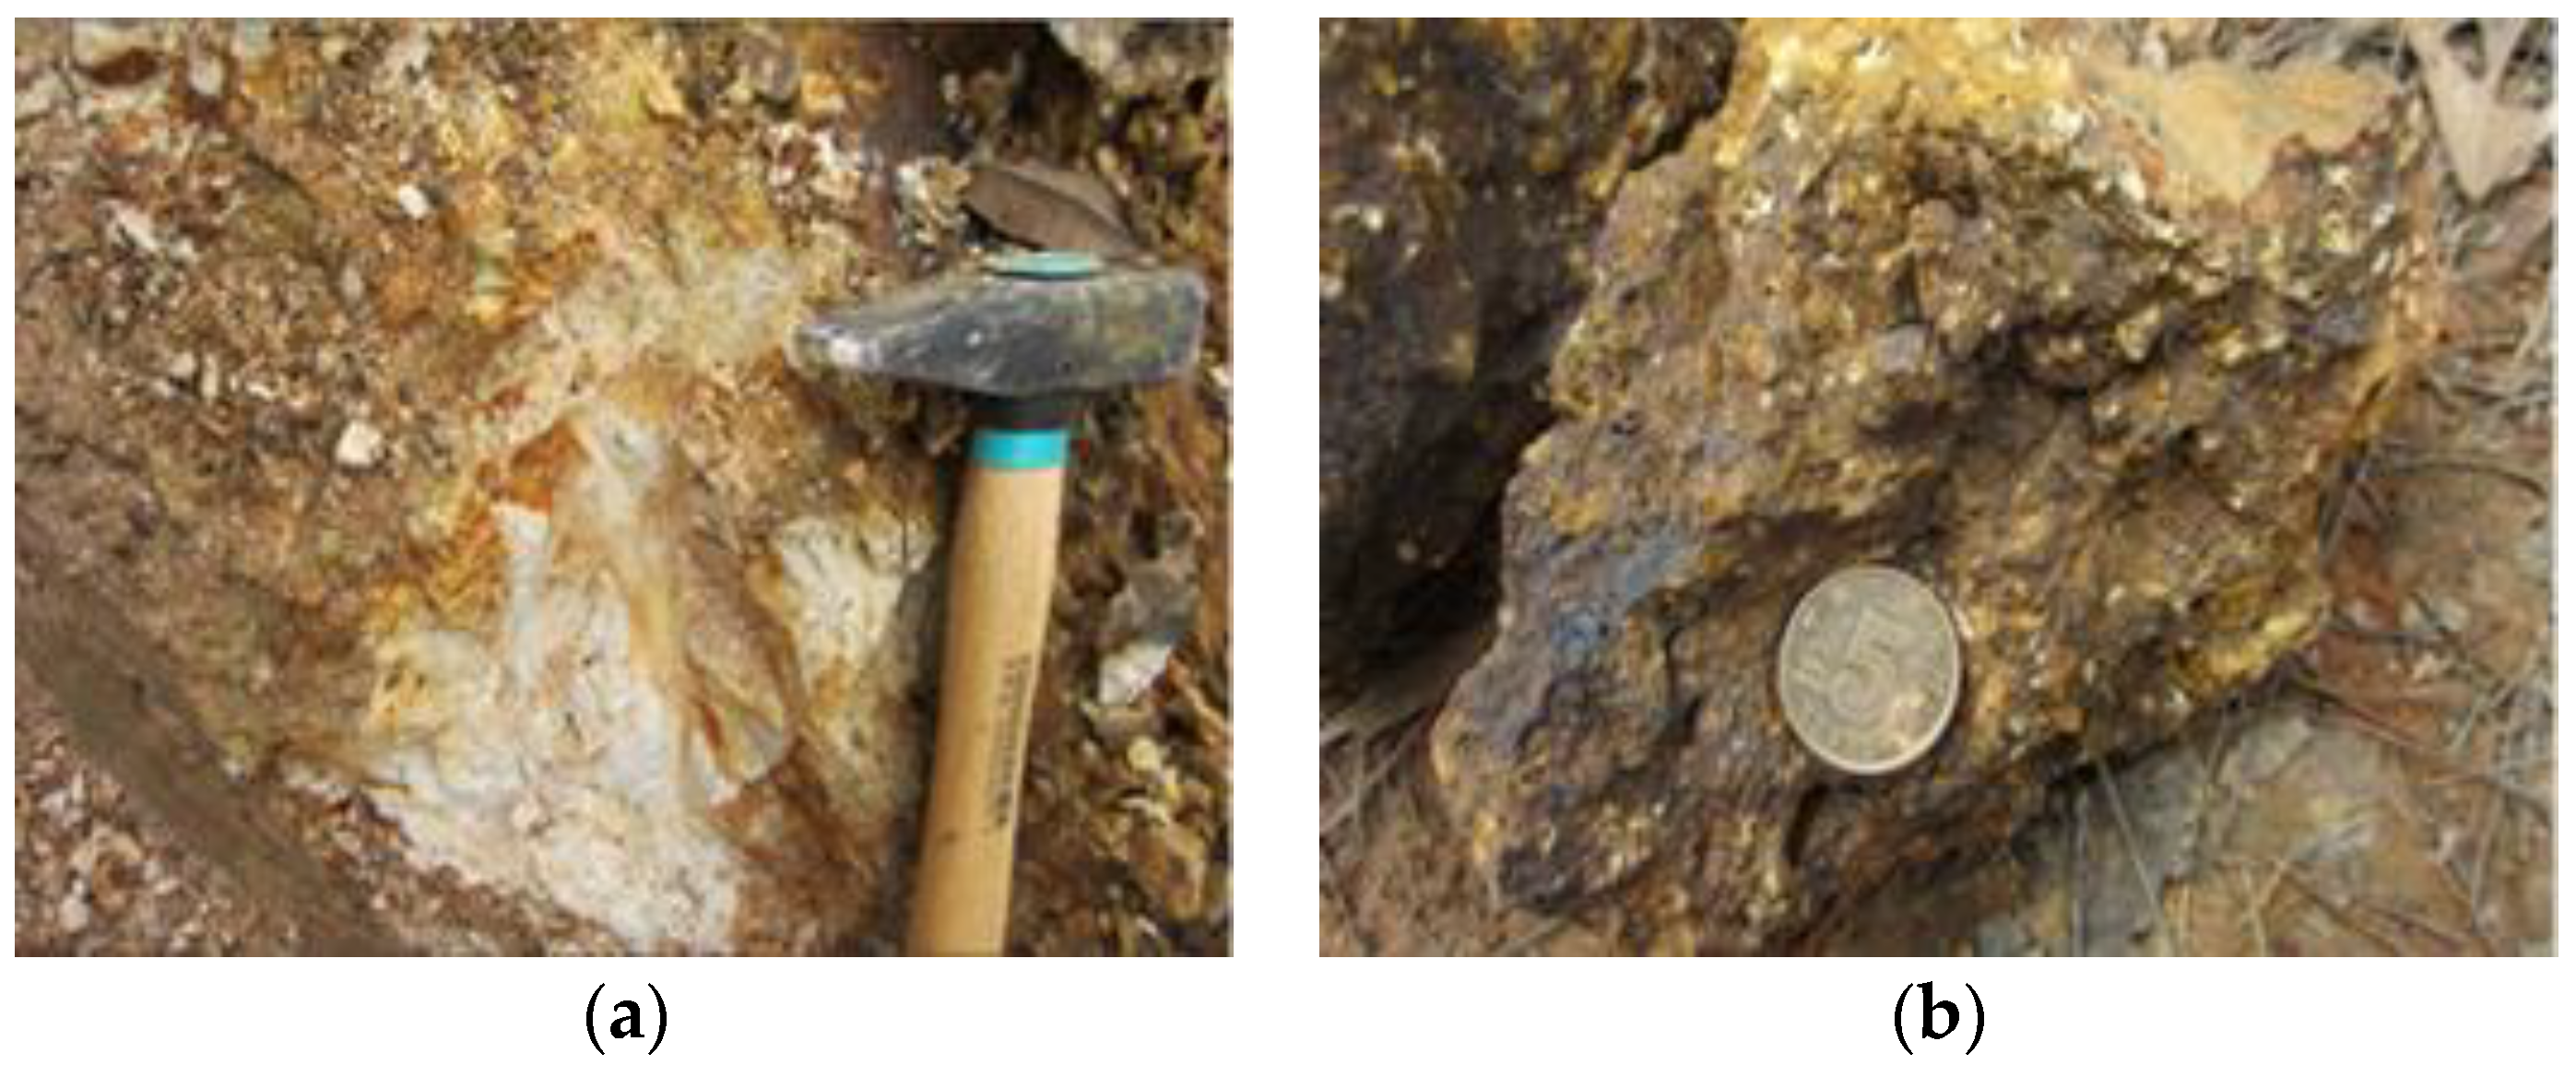
(2) The rocks in Hecun sampling area are mainly granite porphyry with 15–20% phenocryst, the main rock components are quartz and feldspar, and sometimes biotite and hornblende. Quartz phenocrysts usually to be hexagonal bipyramid, and biotite and hornblende sometimes were existed darkening edges (Figure 12). This phenomenon indicates that there are intrusive rocks in the sampling area, which directly proves the existence of mineral alteration in surrounding rock (Figure 15). Metallic minerals related to granitic porphyry are gold, silver, copper, and so on.
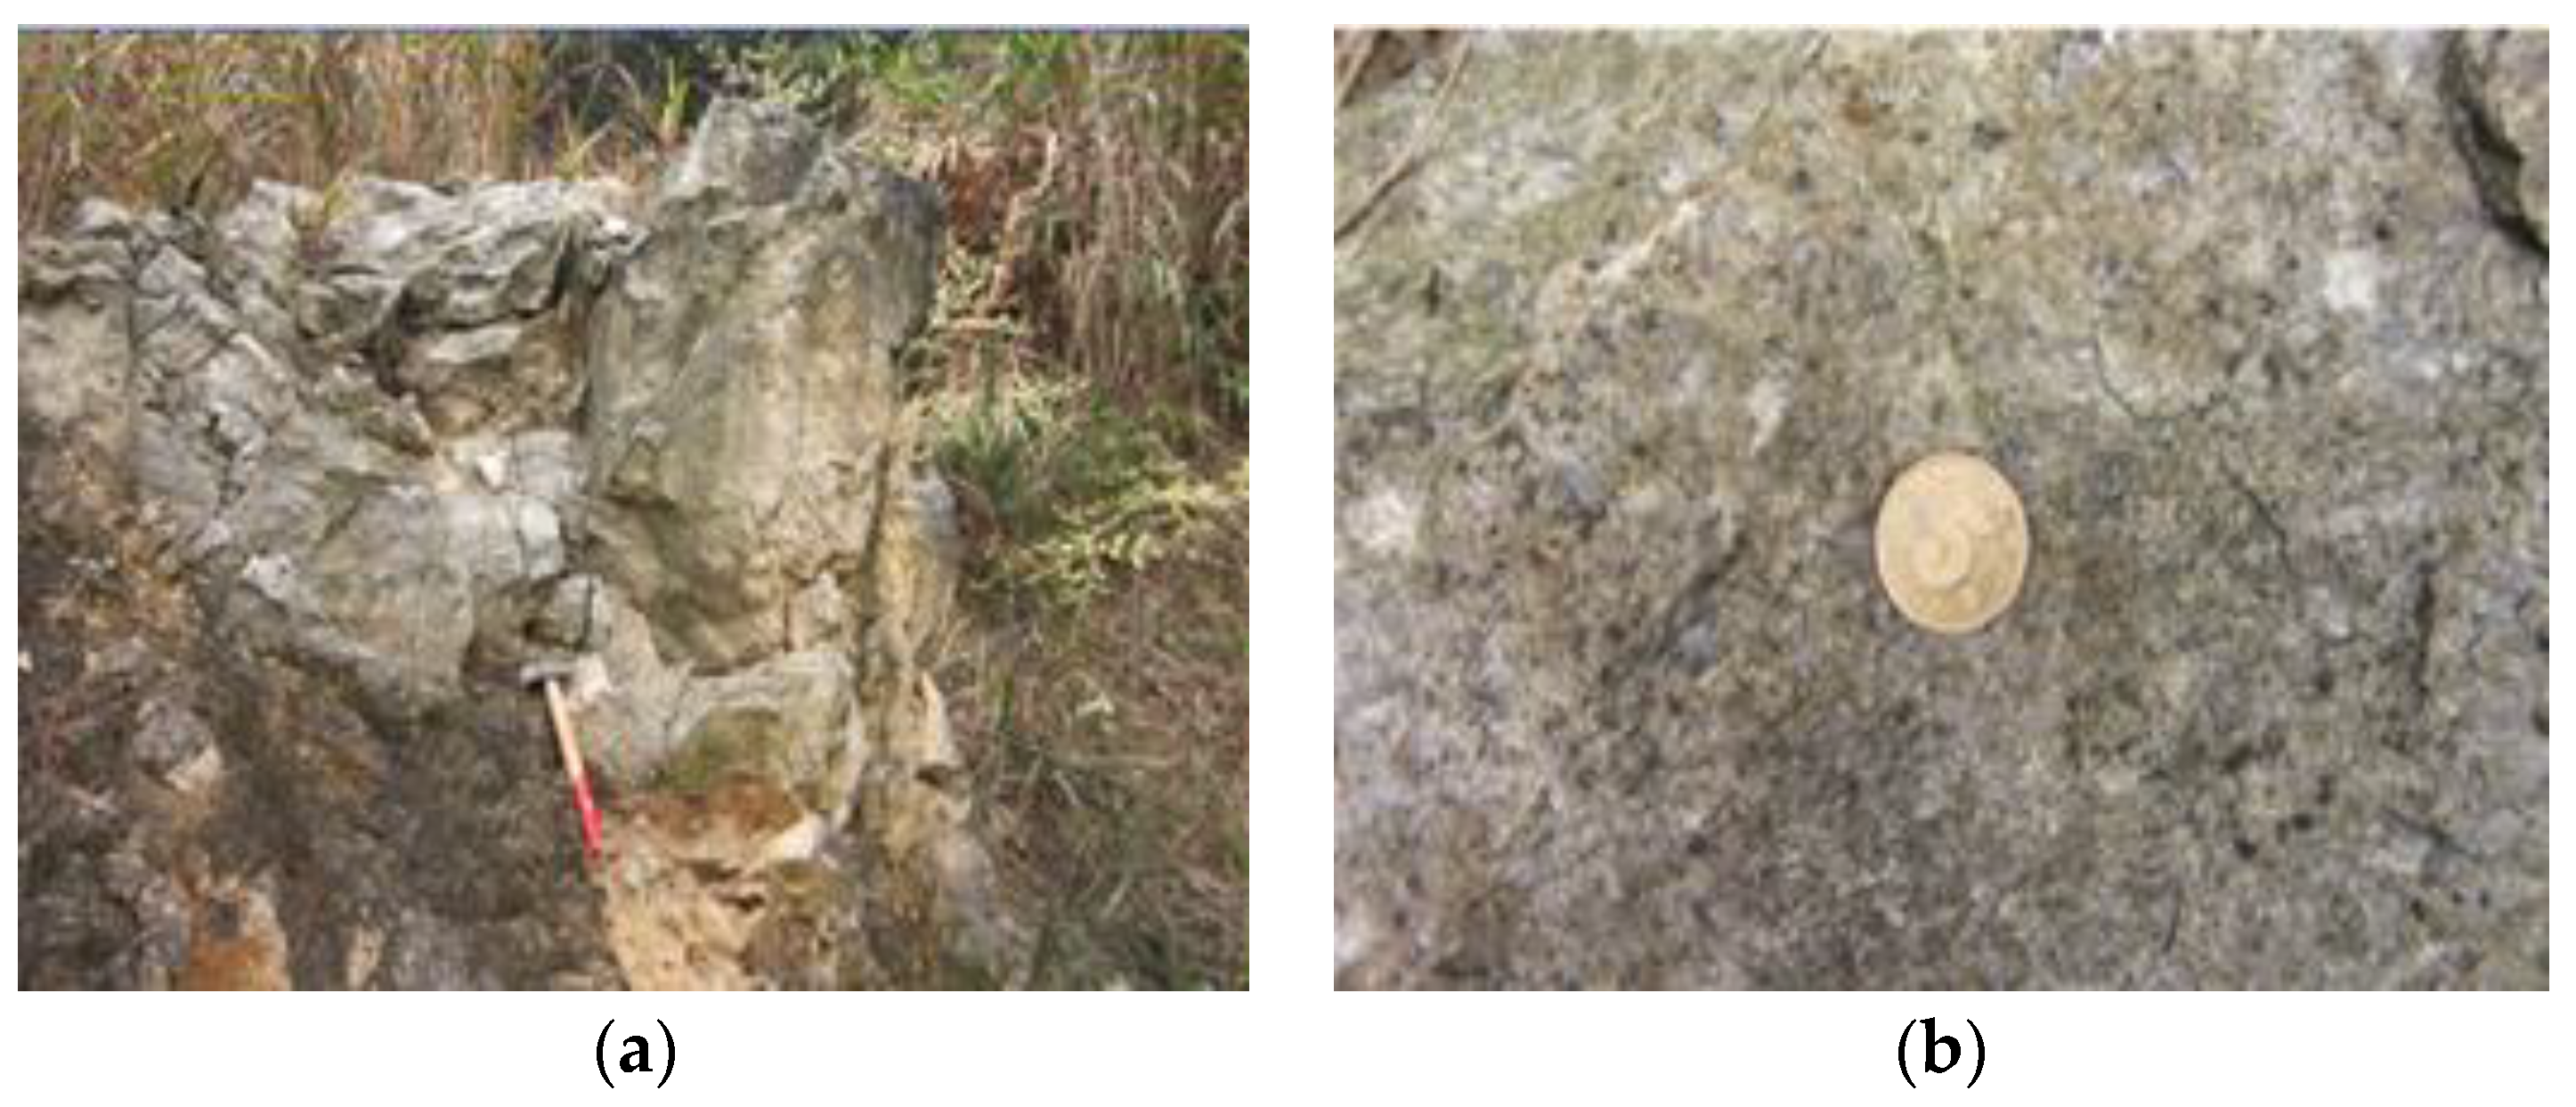
(3) The sampling point is mainly meso-basic igneous rock and metasomatic rock, which is the surrounding rock related to chloritization (Figure 16). Chloritization rarely occurs alone, often accompanied by pyritized, sericitization, propylitization, and carbonate and so on.
The results of field verification certified that at 40 of the 52 sampling sites rocks containing pyrite, sericite and chlorite can be collected, which is consistent with the results of mineralization and alteration extraction using remote sensing image.
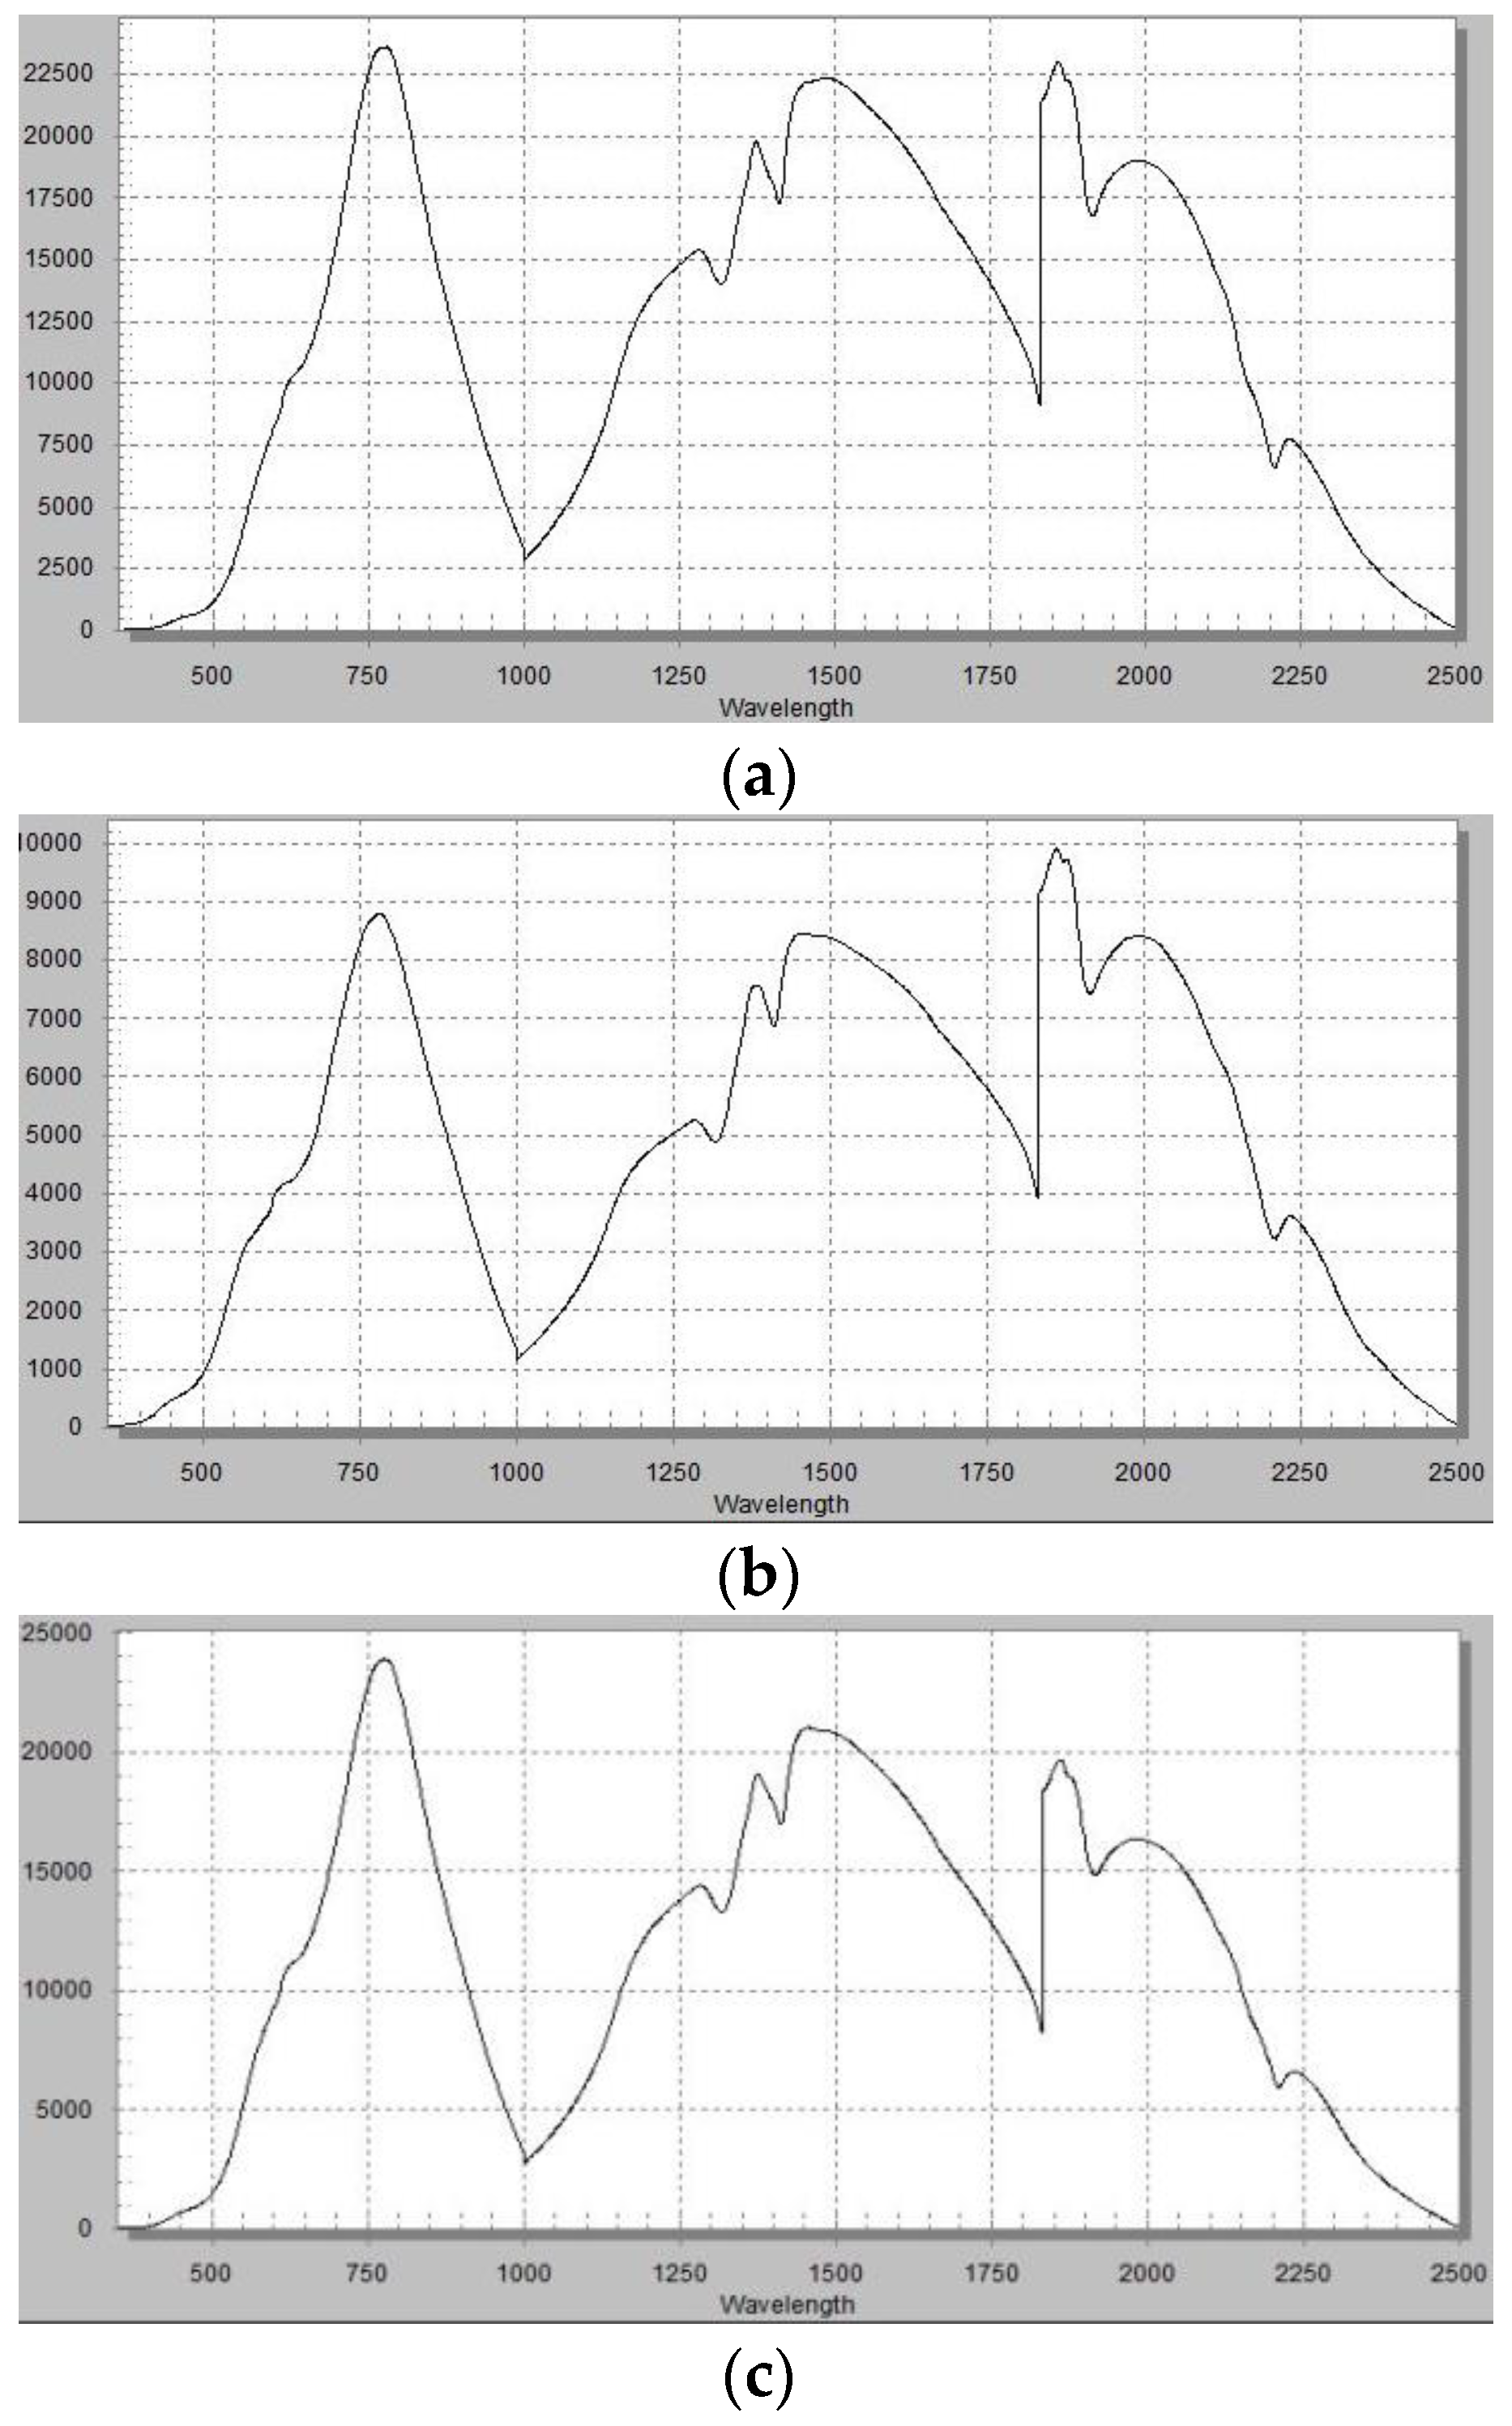
In order to further verify the reliability of the proposed method, the spectral curves of rock samples collected in the field were measured and analyzed in laboratory, and the results were as shown in Figure 17.
By comparing spectral curves between Figure 17 and Spectroscopy Lab of the United States Geological Survey (USGS) [64], the results show that the rock samples collected in the field have altered mineral characteristic of pyrite, sericite, and chlorite, respectively, which are the main signs for gold prospecting.
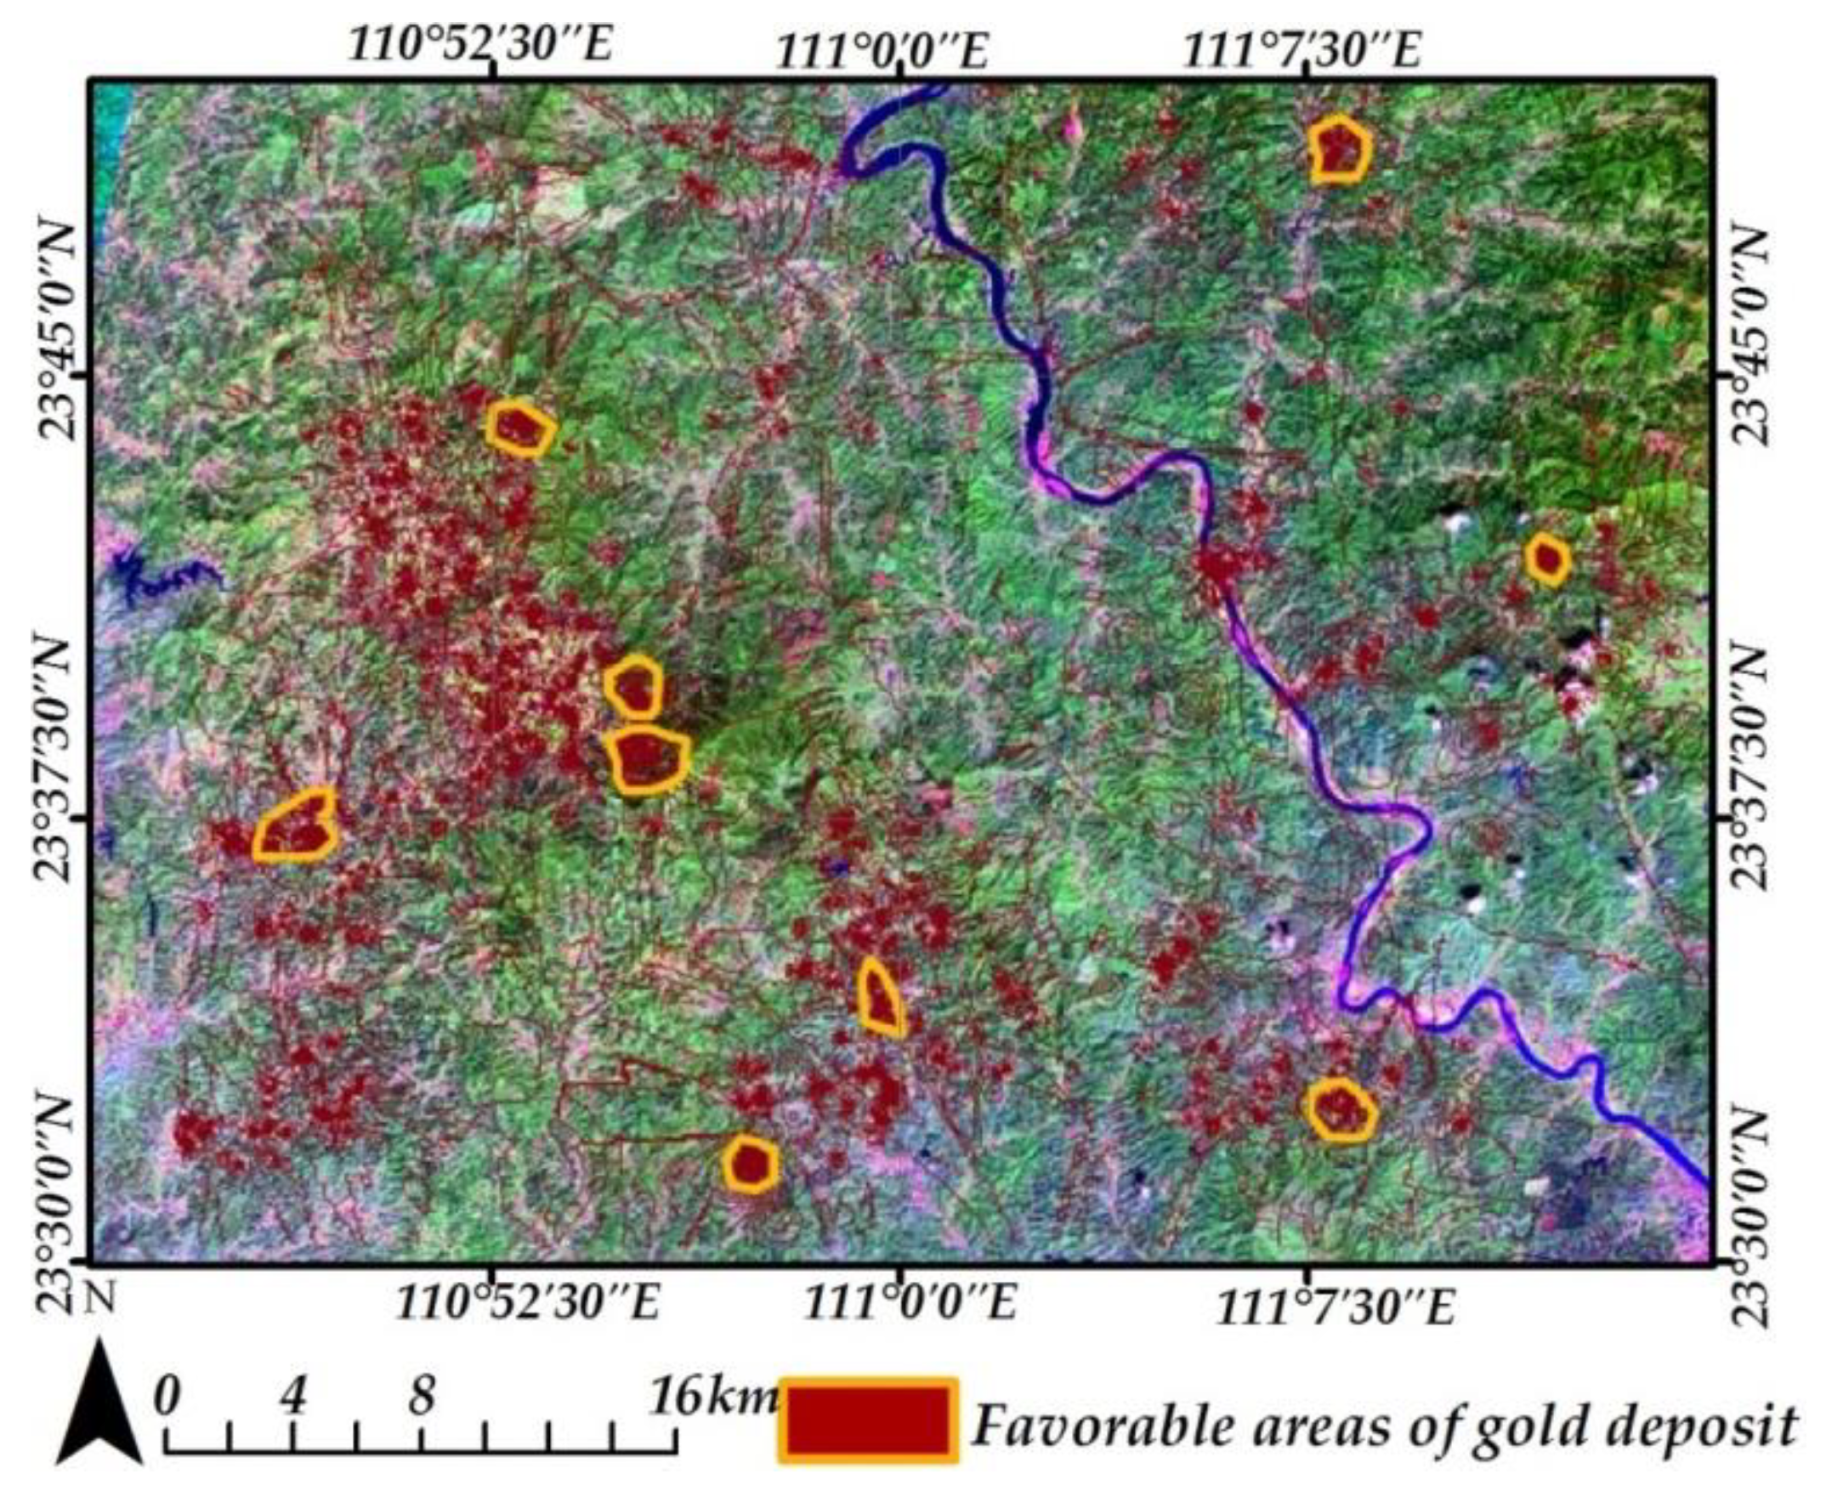
The results indicate that the extraction results of alteration information in this paper have very high accuracy and could play a vital role in the exploration of metal minerals in the study area. According to the extracted mineralization alteration and the results of field verification, the favorable areas of gold deposit can be delineated (Figure 18).

5. Conclusions

This study describes a methodology for gold ore deposit identification based on ASTER data using SVM and PCA in areas of high vegetation. Gulong in the Dayaoshan metallogenic belt of Guangxi was taken as the study area for field verification. The results show that the mineral alteration regions of the Gulong can be mapped well with field investigations. At the same time, the results also show that the mineral alteration extraction method proposed in this paper has certain guiding significance for metallogenic prediction by remote sensing, especially in areas with high vegetation cover. This study results in the following three main conclusions:
(1)
Altered mineral is the weak information in the image, which is very vulnerable to inundation in the background. At the same time, the study area is located in the gold ore-forming zone of the southern margin of the Dayaoshan-Daguishan, where exposed intrusive rocks and surrounding rock alteration can be found on the surface by field exploration. That altered mineral information can be disturbed by high coverage of vegetation. The mixed pixel decomposition method with hyperplane optimized using the genetic algorithm is used to remove the influence of vegetation interference information and highlight altered mineral [65] (Figure 5). Thus, it provides a methodological reference for areas with high vegetation coverage and strong disturbance information.
(2)
The extraction model of altered mineral information was constructed based on PCA and SVM optimized by ACA [66], and successfully extracted the altered mineral in the study area, by comprehensively processing the multi-source heterogeneous data, such as remote sensing ground object spectral data, laboratory mineral spectrum data, rock mineral distribution data, and so on. On this basis, the favorable metallogenic areas were mapped in the study area (Figure 18).
(3)
By comparing spectral curves between field rock samples and Spectroscopy Lab of USGS [64], the results show that the rock samples collected in the field have altered mineral characteristic of pyrite, sericite, and chlorite, respectively, which are the main signs for gold prospecting. Simultaneously, field investigations verified that the distribution of extracting alteration areas from ASTER display a good correlation with the alteration regions, which further demonstrates that the method of extracting alteration mineralization information adopted in the study is feasible.
In general, the results can provide technical support for multi-source heterogeneous data fusion and geological big data metallogenic prediction, especially in areas of high vegetation cover.

Author Contributions

All the authors made significant contributions to the work. K.X., X.W., R.F., and C.K. designed the research, analyzed the results, and accomplished the validation work. K.X., and X.W. completed field investigation, sampling, analysis, and validation; G.L., and C.W. provided advice for the revision of the paper.

Funding

This research received no external funding.

Acknowledgments

The authors would like to thank the Remote Sensing Center of Guangxi for providing the various data sets used in this paper. This work has been supported by the National Natural Science Foundation of China (No: 41201193); the Research on evaluation method of Oil and Gas Resources investigation (prediction) in "Belt and Road Initiative" Spatial Information Corridor; Guizhou Science and Technology Planning Project: Research and development application of big data Management and Intelligent processing system for Mine Exploration ([2017]2951); the Open research project of key laboratory of Tectonics and Petroleum Resources (China University of Geosciences), Ministry of Education (No: TPR-2019-11); and the Open fund project of National-Local Joint Engineering Laboratory on Digital Preservation and Innovative Technologies for the Culture of Traditional Villages and Towns (CTCZ19K01). The authors would like to thank the anonymous reviewers for providing valuable comments on the manuscript.

Conflicts of Interest

The authors declare no conflict of interest. The founding sponsors had no role in the design of the study; in the collection, analyses, or interpretation of data; in the writing of the manuscript; or in the decision to publish the results.

References

  1. Sabins, F.F. Remote sensing for mineral exploration. Ore Geol. Rev. 1999, 14, 157–183. [Google Scholar] [CrossRef]
  2. Tommaso, I.D.; Rubinstein, N. Hydrothermal alteration mapping using ASTER data in the Infiernillo porphyry deposit, Argentina. Ore Geol. Rev. 2007, 32, 275–290. [Google Scholar] [CrossRef]
  3. Dilles, J.H.; Einaudi, M.T. Wall-rock alteration and hydrothermal flow paths about the Ann-Mason porphyry copper deposit, Nevada–a 6-km vertical reconstruction. Econ. Geol. 1992, 87, 1963–2001. [Google Scholar] [CrossRef]
  4. Hubbard, B.E.; Crowley, J.K. Mineral mapping on the Chilean–Bolivian Altiplano using co-orbital ALI, ASTER and Hyperion imagery: Data dimensionality issues e solutions. Remote Sens. Environ. 2005, 99, 173–186. [Google Scholar] [CrossRef]
  5. Ducart, D.F.; Crosta, A.P.; Filio, C.R.S. Alteration mineralogy at the Cerro La Mina epithermal prospect, Patagonia, Argentina: Field mapping, short-wave infrared spectroscopy, and ASTER images. Econ. Geol. 2006, 101, 981–996. [Google Scholar] [CrossRef]
  6. Mars, J.C.; Rowan, L.C. Spectral assessment of new ASTER SWIR surface reflectance data products for spectroscopic mapping of rocks and minerals. Remote Sens. Environ. 2010, 114, 2011–2025. [Google Scholar] [CrossRef]
  7. Molan, Y.E.; Refahi, D.; Tarashti, A. Mineral mapping in the Maherabad area, eastern Iran, using the HyMap remote sensing data. Int. J. Appl. Earth Obs. Geoinf. 2014, 27, 117–127. [Google Scholar] [CrossRef]
  8. Zadeh, M.H.; Tangestani, M.H.; Roldan, F.V.; Yusta, I. Spectral characteristics of minerals in alteration zones associated with porphyry copper deposits in the middle part of Kerman copper belt, SE Iran. Ore Geol. Rev. 2014, 66, 191–198. [Google Scholar] [CrossRef]
  9. Rajendran, R.; Nasir, S. Characterization of ASTER spectral bands for mapping of alteration zones of volcanogenic massive sulphide deposits. Ore Geol. Rev. 2017, 88, 317–335. [Google Scholar] [CrossRef]
  10. Inzana, J.; Kusky, T.; Higgs, G.; Tucker, R. Supervised classifications of Landsat TM band ratio images and Landsat TM band ratio image with radar for geological interpretations of central Madagascar. J. Afr. Earth Sci. 2003, 37, 59–72. [Google Scholar] [CrossRef]
  11. Abedi, M.; Norouzi, G.H.; Bahroudi, A. Support vector machine for multi-classification of mineral prospectivity areas. Comput. Geosci. 2012, 46, 272–283. [Google Scholar] [CrossRef]
  12. Zadeh, M.H.; Tangestani, M.H.; Roldan, F.V.; Yusta, I. Mineral exploration and alteration zone mapping using mixture tuned matched filtering approach on ASTER data at the central part of Dehaj-Sarduiyeh Copper Belt, SE Iran. IEEE J. Sel. Top. Appl. Earth Obs. Remote Sens. 2014, 7, 284–289. [Google Scholar] [CrossRef]
  13. Zhang, X.F.; Pamer, M.; Duke, N. Lithologic and mineral information extraction for gold exploration using ASTER data in the south Chocolate Mountains (California). ISPRS J. Photogramm. Remote Sens. 2007, 62, 271–282. [Google Scholar] [CrossRef]
  14. Bedini, E. Mineral mapping in the Kap Simpson complex, central East Greenland, using HyMap and ASTER remote sensing data. Adv. Space Res. 2011, 47, 60–73. [Google Scholar] [CrossRef]
  15. Zheng, S.; Fu, B.H. Lithological mapping of granitoids in the western Junggar from ASTER SWIR-TIR multispectral data: Case study in Karamay pluton, Xinjiang. Acta Petrol. Sin. 2013, 29, 2936–2948. [Google Scholar]
  16. Alimohammadi, M.; Alirezaei, S.; Kontak, D.J. Application of ASTER data for exploration of porphyry copper deposits: A case study of Daraloo-Sarmeshk area, southern part of the Kerman copper belt, Iran. Ore Geol. Rev. 2015, 70, 290–304. [Google Scholar] [CrossRef]
  17. Dai, J.J.; Qu, X.M.; Xin, H.B. Extraction of mineral information using ASTER remote sensing data in Duolong area, Tibet, China. Geol. Bull. China 2010, 29, 752–759. [Google Scholar]
  18. Ghezelbash, R.; Maghsoudi, A.; Carranza, E.J.M. Performance evaluation of RBF- and SVM-based machine learning algorithms for predictive mineral prospectivity modeling: Integration of S-A multifractal model and mineralization controls. Earth Sci. Inform. 2019, 1–17. [Google Scholar] [CrossRef]
  19. Rodriguez-Galiano, V.; Sanchez-Castillo, M.; Chica-Olmo, M. Machine learning predictive models for mineral prospectivity: An evaluation of neural networks, random forest, regression trees and support vector machines. Ore Geol. Rev. 2015, 71, 804–818. [Google Scholar] [CrossRef]
  20. Shao, C.K.; Xue, Y.G.; Zhang, P.; Tian, H.; Wan, J.Y.; Zhou, Y.; Zhao, Z.N. Comprehensibe anomaly characteristics and metallogenic law of Tongmu sub-Cu-polymetallic ore belt in the west side of Dayaoshan mountain. Contrib. Geol. Miner. Resour. Res. 2019, 34, 445–452. [Google Scholar]
  21. Li, Z.Y.; Dang, Y.; Wei, Z.R.; Ye, Y.L.; Chen, M.H. Molybdenite Re-Os dating for the Dali porphyry Mo-Cu deposit of Dayaoshan area and its geological implications. J. Guilin Univ. Technol. 2019, 39, 249–257. [Google Scholar]
  22. Xu, Z.X.; Liu, L.M.; Sun, T. Specific features of the porphyry-related gold deposits in the middle of the Dayaoshan Caledonian orogenic belt and constraints of tectonic setting: An example from the Dawangding gold deposit. Geol. Explor. 2012, 48, 305–312. [Google Scholar]
  23. Zhou, G.F.; Liang, B.Z.; Wu, X.K.; Zhou, W.J.; Wang, X.Y.; Wei, A.W.; Liang, G.K.; Kang, Z.Q. Metallogenic mechanism of porphyry copper-tungsten-molybdenum-gold deposits in Dayaoshan area. J. Guilin Univ. Technol. 2015, 35, 649–659. [Google Scholar]
  24. Wang, Q.; Yang, Y.Q. Geological characteristics, ore genesis and prospecting direction of Renhou gold deposit in Guangxi province. Gold Sci.Technol. 2016, 24, 41–45. [Google Scholar]
  25. Nong, J.N.; Huang, X.Q.; Guo, S.Y.; Sun, M.H.; Deng, B.; Zou, Y. Discovery of Caledonoan basic rocks in Dayaoshan region Eastern Guangxi and its geological significance. Geol. Sci. Technol. Inform. 2017, 36, 113–121. [Google Scholar]
  26. Thome, K.; Palluconi, F.; Takashima, T.; Masuda, K. Atmospheric correction of ASTER. IEEE Trans. Geosci. Remote Sens. 1998, 36, 1119–1211. [Google Scholar] [CrossRef]
  27. Ayoobi, I.; Tangestani, M.H. Evaluation of relative atmospheric correction methods on ASTER VNIR–SWIR data in playa environment. Carbonates Evaporites 2017, 32, 539–546. [Google Scholar] [CrossRef]
  28. Iwasaki, A.; Tonooka, H. Validation of a crosstalk correction algorithm for ASTER/SWIR. IEEE Trans. Geosci. Remote Sens. 2005, 43, 2747–2751. [Google Scholar] [CrossRef]
  29. Hunt, G.R. Spectral signatures of particulate minerals in the visible and near infrared. Geophysics 1977, 42, 501–513. [Google Scholar] [CrossRef] [Green Version]
  30. Cooper, B.L.; Salisbury, J.W.; Killen, R.M.; Potter, A.E. Midinfrared spectral features of rocks and their powders. J. Geophys. Res. Planets 2002, 107. [Google Scholar] [CrossRef]
  31. Son, Y.S.; Kang, M.K.; Yoon, W.J. Lithological and mineralogical survey of the Oyu Tolgoi region, Southeastern Gobi, Mongolia using ASTER reflectance and emissivity data. Int. J. Appl. Earth Obs. Geoinf. 2014, 26, 205–216. [Google Scholar] [CrossRef]
  32. Bedini, E.; Van Der Meer, F.; Van Ruitenbeek, F. Use of HyMap imaging spectrometer data to map mineralogy in the Rodalquilar caldera, southeast Spain. Int. J. Remote Sens. 2009, 30, 327–348. [Google Scholar] [CrossRef]
  33. Ines, A.V.M.; Mohanty, B.P.; Shin, Y. An unmixing algorithm for remotely sensed soil moisture. Water Resour. Res. 2013, 49, 408–425. [Google Scholar] [CrossRef]
  34. Xu, H.; Sun, Y.; Li, X. Unmixing of remote sensing images based on weighted posterior probability support vector machines. J. Geo-Inf. Sci. 2013, 15, 249–254. [Google Scholar]
  35. You, X.; Wang, R.; Tao, D. Diverse expected gradient active learning for relative attributes. IEEE Trans. Image Process. 2014, 23, 3203–3217. [Google Scholar] [CrossRef]
  36. Arabasadi, Z.; Alizadehsani, R.; Roshanzamir, M.; Moosaei, H.; Yarifard, A.A. Computer aided decision making for heart disease detection using hybrid neural network-Genetic algorithm. Comput. Meth. Prog. Biomed. 2017, 141, 19–26. [Google Scholar] [CrossRef]
  37. Crisman, K.D.; Park, J. Zero-cycles with modulus associated to hyperplane arrangements on affine spaces. Manuscr. Math. 2017, 155, 1–31. [Google Scholar] [CrossRef]
  38. Gong, D.; Sun, J.; Miao, Z. A set-based genetic algorithm for interval many-objective optimization problems. IEEE Trans. Evol. Comput. 2018, 22, 47–60. [Google Scholar] [CrossRef]
  39. Bai, X.; Yan, W.; Ge, S.S.; Cao, M. An integrated multi-population genetic algorithm for multi-vehicle task assignment in a drift field. Inf. Sci. 2018, 453, 209–255. [Google Scholar] [CrossRef]
  40. Bandyopadhyay, S.; Pal, S.K. Classification and Learning Using Genetic Algorithms: Applications in Bioinformatics and Web Intelligence (Natural Computing Series); Springer: Berlin/Heidelberg, Germany, 2007. [Google Scholar]
  41. Gad, S.; Kusky, T. Lithological mapping in the Eastern Desert of Egypt, the Barramiya area using Landsat thematic mapper (TM). J. Afr. Earth Sci. 2006, 44, 196–202. [Google Scholar] [CrossRef]
  42. Aydal, D.; Ardal, E.; Dumanlilar, O. Application of the Crosta technique for alteration mapping of granitoidic rocks using ETM+ data: Case study from eastern Tauride belt (SE Turkey). Int. J. Remote Sens. 2007, 28, 3895–3913. [Google Scholar] [CrossRef]
  43. Massironi, M.L.; Bertoldi, P.; Calafa, D.; Visona, D.; Bistacchi, A.; Giardino, C.; Schiavo, A. Interpretation and processing of ASTER data for geological mapping and granitoids detection in the Saghro massif (eastern Anti-Atlas, Morocco). Geosphere 2008, 4, 736–759. [Google Scholar] [CrossRef] [Green Version]
  44. Wei, L.F.; Wang, H.B. Change detection from high-resolution remote sensing image based on MSE model. Spectrosc. Spectr. Anal. 2013, 33, 728. [Google Scholar]
  45. Schorr, K.; Da, C.F. Quantitative determination of enhydrin in leaf rinse extracts and in glandular trichomes of Smallanthus sonchifolius (Asteraceae) by reversed-phase high-performance liquid chromatography. Phytochem. Analysis 2010, 16, 161–165. [Google Scholar]
  46. Bertoldi, L.; Massironi, M.; Visona, D.; Carosi, R.; Montomoli, C.; Gubert, F.; Nalettoc, G.; Pelizzo, M.G. Mapping the Buraburi granite in the Himalaya of Western Nepal: Remote sensing analysis in a collisional belt with vegetation cover and extreme variation of topography. Remote Sens. Environ. 2011, 115, 1129–1144. [Google Scholar] [CrossRef]
  47. Pour, A.B.; Hashim, M. The application of ASTER remote sensing data to porphyry copper and epithermal gold deposits. Ore Geol. Rev. 2012, 44, 1–9. [Google Scholar] [CrossRef] [Green Version]
  48. Zhu, G.; Dan, G.B. Classification using ASTER data and SVM algorithms: The case study of Beer Sheva, Israel. Remote Sens. Environ. 2002, 80, 233–240. [Google Scholar] [CrossRef]
  49. Cristianini, N.; Shawe-Taylor, J. An Introduction to Support Vector Machines and Other Kernel-Based Learning Methods; Cambridge University Press: Cambridge, UK, 2004. [Google Scholar]
  50. Jin, X.; Song, K.; Du, J.; Liu, H.; Wen, Z. Comparison of different satellite bands and vegetation indices for estimation of soil organic matter based on simulated spectral configuration. Agric. For. Meteorol. 2017, 244–245, 57–71. [Google Scholar] [CrossRef]
  51. Hochreiter, S.; Obermayer, K. Support Vector Machines for Dyadic Data. Neural Comput. 2014, 18, 1472–1510. [Google Scholar] [CrossRef]
  52. Feng, R.; Wang, L.; Zhong, Y. Joint local block grouping with noise-adjusted principal component analysis for hyperspectral remote-sensing imagery sparse unmixing. Remote Sens. 2019, 11, 1223. [Google Scholar] [CrossRef] [Green Version]
  53. Samadzadegan, F.; Hasani, H.; Schenk, T. Simultaneous feature selection and SVM parameter determination in classification of hyperspectral imagery using Ant Colony Optimization. Can. J. Remote Sens. 2012, 38, 139–156. [Google Scholar] [CrossRef]
  54. Liang, S. Classification of hyperspectral imagery based on ant colony compositely optimizing SVM in spatial and spectral features. Spectrosc. Spectr. Anal. 2013, 33, 2192. [Google Scholar]
  55. Dolques, X.; Ber, F.L.; Huchard, M.; Grac, C. Performance-friendly rule extraction in large water data-sets with AOC posets and relational concept analysis. Int. J. Gen. Syst. 2016, 45, 1–24. [Google Scholar] [CrossRef]
  56. Alsaeedan, W.; Menai, M.E.B.; Al-Ahmadi, S. A Hybrid genetic-ant colony optimization algorithm for the word sense disambiguation problem. Inf. Sci. 2017, 417, 20–38. [Google Scholar] [CrossRef]
  57. Wang, M.; Wan, Y.; Ye, Z.; Lai, X. Remote sensing image classification based on the optimal support vector machine and modified binary coded ant colony optimization algorithm. Inf. Sci. 2017, 402, 50–68. [Google Scholar] [CrossRef]
  58. Liu, G.H. Extraction and Analysis of Information of Alteration with Multi-Source Remote Sensing Data in High Vegetation Coverage Area; Chengdu University of Technology: Chengdu, China, 2017. [Google Scholar]
  59. Zhang, N.; Zhou, K. Identification of hydrothermal alteration zones of the Baogutu porphyry copper deposits in northwest China using ASTER data. J. Appl. Remote Sens. 2017, 11, 015016. [Google Scholar] [CrossRef]
  60. Zhang, T.B.; Yi, G.H.; Wang, Z.Y.; Tang, J.X.; Zhong, K.H.; Li, Y.B.; Wang, Q.; Bie, X.J. Integrating data of ASTER and Landsat-8 OLI (AO) for hydrothermal alteration mineral mapping in Duolong porphyry Cu-Au deposit, Tibetan plateau, China. Remote Sens. 2016, 8, 890. [Google Scholar] [CrossRef] [Green Version]
  61. Wang, H.; Fan, Y.H.; Zhang, S.P.; Jin, M.S.; Cui, S.; Yang, C.; Kuang, J.S.; Guo, P.C. Delineation of Heiqia iron polymetallic mineralization zone in West Kunlun Region using high resolution remote sensing technology. Geol. Surv. China 2016, 3, 13–20. [Google Scholar]
  62. Azizi, H.; Tarverdi, M.A.; Akbarpour, A. Extraction of hydrothermal alterations from ASTER SWIR data from east Zanjan, northern Iran. Adv. Space Res. 2010, 46, 99–109. [Google Scholar] [CrossRef]
  63. Mars, J.C.; Rowan, L.C. Regional mapping of phyllic- and argillic-altered rocks in the Zagros magmatic arc, Iran, using Advanced Spaceborne Thermal Emission and Reflection Radiometer (ASTER) data and logical operator algorithms. Geosphere 2006, 2, 161–186. [Google Scholar] [CrossRef]
  64. USGS Spectroscopy Lab. Available online: http://speclab.cr.usgs.gov/12/6/2015 (accessed on 3 December 2019).
  65. Pour, A.B.; Hashim, M.; VanGenderen, J. Detection of hydrothermal alteration zones in a tropical region using satellite remote sensing data: Bau goldfield, Sarawak, Malaysia. Ore Geol. Rev. 2013, 54, 181–196. [Google Scholar] [CrossRef]
  66. Xia, H.D.; Xue, Y.; Deng, H.J.; Liu, F.J. Eliminating the disturbance of vegetation information by spectral mixture analysis based on ant colony algorithm. J. Geomech. 2012, 18, 72–78. [Google Scholar]
Figure 1. Advanced Spaceborne Thermal Emission and Reflection Radiometer (ASTER) image of the study area (a), regional geological sketch map (b) (from the Remote Sensing Center of Guangxi), located in Guangxi (c) and in China (d).
Remotesensing 11 03003 g001aRemotesensing 11 03003 g001b
Figure 2. Flow chart of ASTER image preprocessing.
Remotesensing 11 03003 g002
Figure 3. Mixed pixel decomposition with genetic-hyperplane flow chart.
Remotesensing 11 03003 g003
Figure 4. Flow chart of the support vector machine (SVM) parameters with the ant colony algorithm (ACA).
Remotesensing 11 03003 g004
Figure 5. Results of vegetation removal by mixed pixel decomposition.
Remotesensing 11 03003 g005
Figure 6. The spectral profile of the study image (a) before vegetation removal (b) after vegetation removal.
Remotesensing 11 03003 g006
Figure 7. Alteration distribution of pyrite mineralization.
Remotesensing 11 03003 g007
Figure 8. Alteration distribution of sericite mineralization.
Remotesensing 11 03003 g008
Figure 9. Alteration distribution of chlorite mineralization.
Remotesensing 11 03003 g009
Figure 10. Distribution map of gold deposits in Dayaoshan area (Remote Sensing Center of Guangxi).
Remotesensing 11 03003 g010
Figure 11. Receiver operating characteristic (ROC) curve of the SVM model.
Remotesensing 11 03003 g011
Figure 12. Extraction results of altered mineral information.
Remotesensing 11 03003 g012
Figure 13. Spatial distribution of 52 field sampling points.
Remotesensing 11 03003 g013
Figure 14. Samples at Sanxianding (110.945°E, 23.641°N; 7-2-2015) (a) View of the surrounding rock for pyritization, (b) The rock sample of the pyritization.
Remotesensing 11 03003 g014
Figure 15. Samples at Hecun (111.027°E, 23.540°N; 8-2-2015) (a) View of the granitic porphyry, (b) The rock sample of the granitic porphyry.
Remotesensing 11 03003 g015
Figure 16. Samples at Sunjialing (111.013°E, 23.652°N; 10-2-2015) (a) View of the surrounding rock related to chloritization, (b) The rock sample of the surrounding rock related to chloritization.
Remotesensing 11 03003 g016
Figure 17. The spectral curves of samples collected in the field (a-Feldspar quartz sandstone from Sanxianding), (b-Quartz porphyry from Sunjialing), (c-Granite-porphyry from Hecun).
Remotesensing 11 03003 g017
Figure 18. The favorable areas of gold deposit.
Remotesensing 11 03003 g018
Table 1. Training samples.
BandTypeNumber of SamplesTotal Number
C1vegetation846018,990
C2rock6320
C3water4210
Table 2. The relationship between variation rate and training accuracy & time.
Variation Rate0.010.020.050.070.090.10.20.3
Generations10601120200020001560200020002000
Correct Number of Classifications432456391416381372365371
Training Accuracy0.8640.9120.7820.8320.7620.7440.730.742
Training Time (s)261259302431462294309192
(Number of samples: 500; Type: 3; Crossing rate: 0.99).
Table 3. The relationship between Crossing rate and training accuracy & time.
Crossing Rate0.020.050.10.30.40.60.80.99
Generations71162365811011208124211128
Correct Number of Classifications457451451445453472465471
Training Accuracy0.9140.9020.9020.890.9060.9440.930.942
Training Time (s)14913814192245193121207
(Number of samples: 500; Type: 3; Variation rate: 0.02).
Table 4. The relationship between training points and training accuracy & time.
Number of Samples100200300500900120020004000
Generations63129227344668200020002000
Correct Number of Classifications9419227335946586411872739
Training Accuracy0.940.960.910.7180.5170.720.5940.685
Training Time (s)0.05480.0890.1320.1840.2310.7340.8911.632
(Type: 3; Variation rate: 0.02; Crossing rate: 0.3).
Table 5. Hyperplane set.
NumberDistanceAngleHyperplane Equations
H11.54620744.136729 1.546207 = x 2 × cos 44.136729 + x 1 × sin 44.136729
H20.760832161.892638 0.760832 = x 2 × cos 161.892638 + x 1 × sin 161.892638
H31.54620714.834792 1.546207 = x 2 × cos 14.834792 + x 1 × sin 44.14.834792
Table 6. Pyrite eigenvector matrix.
EigenvectorB1B2B5/B3B4
10.1667310.1206210.8225390.530171
20.1065070.233433−0.5624490.786013
30.5998490.7341710.024860−0.317107
4−0.7752670.6260620.0803920.023353
Table 7. Sericite eigenvector matrix.
EigenvectorB1B4/B6B7B9
10.1644430.8110450.523520−0.202710
20.070343−0.5699640.6908000.439304
30.8593940.038299−0.3530520.367872
4−0.4790120.1260170.352244−0.794098
Table 8. Chlorite eigenvector matrix.
EigenvectorB1B2B5/B8B9
1−0.1620740.7991860.5160970.262064
20.063939−0.5929360.6887790.412216
30.9090140.073300−0.309002−0.269885
40.378598−0.0659950.4046540.829797

