Article

VAT Method for Visualization of Mass Movement Features: An Alternative to Hillshaded DEM

1
Department of Geology, Faculty of Natural Sciences and Engineering, University of Ljubljana, Aškerčeva 12, SI-1000 Ljubljana, Slovenia
2
Arts Research Centre of the Slovenian Academy of Sciences and, Novi trg 2, SI-1000 Ljubljana, Slovenia
*
Author to whom correspondence should be addressed.
Remote Sens. 2019, 11(24), 2946; https://doi.org/10.3390/rs11242946
Submission received: 11 November 2019 / Revised: 3 December 2019 / Accepted: 5 December 2019 / Published: 9 December 2019
(This article belongs to the Special Issue Remote Sensing of Landslides II)

Abstract

:
Hillshaded digital elevation models are a well-known information layer used to determine the geomorphological properties of landslides. However, their use is limited because the results are dependent on a particular sun azimuth and elevation. Approaches proposed to overcome this bias include positive openness, sky-view factor, red relief image maps, and prismatic openness. We propose an upgrade to all these methods, a method named Visualization for Archaeological Topography (VAT). The method is based on a fusion of four information layers into a single image (hillshaded terrain, slope, positive openness, and sky-view factor). VAT can be used to enhance visibility of features of varied scale, height, orientation, and form that sit on terrain ranging from extremely flat to very steep. Besides this, the merits of VAT are that the results are comparable across diverse geographical areas. We have successfully tested the method for landslide recognition and analysis in five different areas in the Vipava Valley (SW Slovenia). Geomorphology of the area is very diverse and holds various types of mass movements. In contrast to classical hillshaded digital elevation models (DEMs), the geomorphological features of landslides obtained by the VAT method are very clearly seen in all studied mass movements.

Graphical Abstract

1. Introduction

A hillshaded digital elevation model (DEM) derived from airborne laser scanning is one of the basic modern tools for recognizing landslides, especially in vegetated areas or non-accessible areas. Together with geomorphological elements of a landslide, which are calculated from the raw elevation data, it is used to visually characterize the type and age of the mass movement, in conjunction with geological and geodetic observations and expert judgment. Hillshading algorithms are now included in most GIS software and are available to anyone. Most of this software has default values for the simulated sun azimuth and elevation, and these are usually set at 315° and 45°, respectively (in ESRI ArcGIS and QGIS). However, most users are not aware that changing these values hugely influences the results, as the result is a hillshaded map, which is different for each pair of values [1]. A known problem is that if a ravine, gully, or crest is oriented in the same direction as the illumination azimuth, there will be no shadow and, consequently, no morphological features visible on the hillshaded DEM.
Approaches have been introduced to avoid this bias, including the introduction of new parameters. The best known are Openness [2], Sky View Factor (SVF) [3], as well as others discussed below. We propose an upgrade to these methods, using Visualization for Archaeological Topography (VAT), which has been used successfully in this paper for landslide recognition and analysis. Several case studies of mass movements are presented to support this, based on mass movements in the Vipava Valley [4,5,6,7].

2. Materials and Methods

2.1. Geological Setting

The Vipava Valley lies in southwestern Slovenia, with an elevation ranging from less than 100 m to almost 1500 m above sea level (a.s.l.). The general topography of the Vipava Valley is defined by the thrust fronts of the Trnovo and Hrušica nappes. Steep northern and northeastern slopes of the valley are composed of Mesozoic carbonates, overthrusted onto lower, gentler slopes composed of folded and faulted Tertiary flysch deposits (Figure 1). In addition, the area is cut by large NW-SE striking, Neogene, dextral, strike-slip faults are characterized by up to 300 m wide fault zones [8]. In the thrust front, the structural contact is morphologically expressed as a sharp transition from steep to more gentle slopes. Because the carbonate rocks in the vicinity of the thrusts and faults are strongly fractured, thick scree deposits form talus slopes directly on the slopes below the thrust fronts. The thickness of the partly cemented carbonate scree deposits and carbonate breccia can reach up to 50 m [9,10]. The scree deposits are moderately sorted and composed of gravel to medium boulder-sized clasts. Very large individual boulders are also present. In the lower reaches of slopes, particularly in the Lokavec area, large carbonate megablocks (more than 100 m in diameter) were deposited by translational and rotational slope movements [11].

2.2. Studied Locations

The suitability of VAT for the recognition of mass movements was tested on five locations in the Vipava Valley (Figure 1). The locations were chosen because they represented different mass movement types with diverse geomorphological and erosional features. The locations are described in the subsections below.

2.2.1. Slano Blato Landslide

The Slano blato landslide is a viscous earthflow with occurrences of rapid mud flows to the northwest of Ajdovščina town in Vipava Valley. The movements were first recorded in the 18th century, and the first mitigation measures were taken at the end of the 19th century. The Slano blato landslide reactivated in 17–19 November 2000 due to an extreme precipitation event. It is more than 1290 m long, 60 to 200 m wide, and 3 to 11 m deep with a volume of approximately 700,000 m3 [17,18,19,20,21,22]. The main scarp of the landslide is located where the Mesozoic carbonates overthrust the Eocene flysch; the earthflow occurred in the flysch. From 2001 to 2004, some viscous earthflows and faster mudflows occasionally occurred. An estimated volume of the moving mass was 1.0 to 1.5 × 10⁶ m3, and the maximum velocity was up to 100 m/day. In the late 2000s, several mitigation measures were undertaken: Dewatering from 24 m deep shafts, sediment removal (200,000 m3), a small dam (5000 m3) was constructed in the lower part, and two retention walls were built. The first wall was 2 m high and built in the upper part; the lower wall was much bigger, forming a 13 m high concrete dam (Figure 2a). As a result of these measures, the landslide has largely been stopped and is only active in the scarp area (mostly through widening). However, the lower concrete wall has not been completely finished, and active erosion is taking place on the left and right banks of the wall (Figure 2a,b and Figure 5). It should be built sideways and anchored in the several meters thick calc-turbidite bed, occurring in flysch around the wall (in fact, this was the reason for the placement of the wall).

2.2.2. Breccia Block of the Podboršt Landslide

The area of the Podboršt landslide belongs to a broader area of Rebrnice, appearing on the SW slopes of the Nanos mountains. The Rebrnice area comprises numerous sedimentary bodies, corresponding to different transport mechanisms and depositional processes in the Quaternary slope deposits [14]. Part of the area in the hinterland of the Podboršt landslide represents a deep-seated rotational slide. The rotational slides mostly comprise carbonate breccia originating from the partial lithification of scree deposits. In the upper edge of the carbonate breccia block, there are steep and strait scarps formed of carbonate breccia (Figure 2c,d and Figure 6).

2.2.3. Marjančna Ravna Landslide

In morphological terms, the deformations and open fractures were easily visible on the DEM in the southern part (foot) of the landslide. We have confirmed the existence of the landslide in the field (Figure 2e,f, Figure 3 and Figure 7). In the lower part of the landslide, movements are very active due to the presence of several meter-deep fractures in the breccia and more loose carbonate scree sediment. We have named the Marjančna ravna landslide after the local name for this area.

2.2.4. Strešnice Carbonate Block

Between the Slano blato landslide and Stogovce landslides, several huge carbonate blocks occur on the flysch slopes. These comprise 10 Mesozoic limestone and dolomite blocks with sizes varying from 10 to 175 ha, which were detached from the source area of the Čaven Mountain and moved from between 80 m to approximately 2000 m from this hinterland. The blocks have moved both translationally and rotationally [8,11]. One of the biggest (23.5 ha) carbonate blocks is in Strešnice (named Križec in [18] and [19] and it is composed of Mesozoic dolomite (Figure 2g,h and Figure 8). Its travel distance was 850 m and the bedding planes rotated by 25 degrees in azimuth and 15 degrees in dip direction from the original bed position. The dolomite is heavily fractured and subject to chemical and physical weathering. On the southern slopes, the erosion has carved gullies in the steep slopes of the fractured dolomite.

2.2.5. Školj of St. Pavel Breccia Block

Školj Sv. Pavla (translated as ”the rock island of St. Pavel”) is an isolated area (block) of eroded carbonate breccia near the village of Vitovlje. The ”Školj” is approximately a plateau with an area of 54,000 m2 and an elevation above the surrounding flysch basement of 20 to 50 m. Several smaller blocks, “islands”, of breccia are visible in its southeastern part, which can be interpreted as being detached and eroded breccia blocks from the main part of the Školj (Figure 2i,j and Figure 9).

2.3. VAT Method

Kokalj and Somrak [23] designed the Visualization for Archaeological Topography (VAT) to enhance recognition of small-scale terrain variations. It uses various pixel-based image fusion techniques (blending modes) to combine information from different visualizations of aerial laser scanning-derived (lidar-derived) elevation models into a single image. Blending modes are relatively simple to comprehend and implement, do not require a multitude of adjustable parameters, and may be efficient and reliable. The visualizations used were selected for their complementary positive characteristics, and specific blending modes were chosen because they amplify these particular characteristics. They combine ”classical” hillshading (Figure 3d) or hillshading from three directions (Figure 3c, RGB VAT) to the slope, positive openness [12], and sky-view factor (SVF) [3] (Table 1). Hillshading and the RGB composite of hillshading from three directions were selected as a base layer because they give a sense of the general topography and are intuitive to read. Slope was added to provide a more plastic feel to the image, i.e., to give a more “three-dimensional” impression. Positive openness emphasizes the prominence of minute relief roughness and sky-view factor recovers some perception of the larger geomorphological forms as well as further enhancing the visibility of micro topography. The last two methods are also complementary in that they both show depressions as dark and exposed areas as bright and share the most demanding part of the computation code.
Even though the authors named the specific combination Visualization for Archaeological Topography, they argue that it can be used to explore small-scale topographic variations in other disciplines (e.g., geology, geomorphology, natural resource management), and we test this in our paper. The name of the method comes from its first application, in the field of archeology [23], but the method itself is not related solely to archeological data, as it uses the relief (elevation) data for calculations. Therefore, it can be used in any scientific field dealing with visual relief analysis. VAT can be used to enhance the visibility of features of a variety of scales, height, orientation, and form; they can be convex or concave and can sit on terrain that ranges from extremely flat to very steep. Besides this, the foremost merits of VAT are that:
  • The results are comparable across diverse geographical areas;
  • It does not introduce artificial artifacts;
  • The visual extent and shape of recorded features are not altered;
  • It shows small topographic features in the same way irrespective of their orientation or shape, allowing us to judge their height and amplitude;
  • The calculation is fast and does not slow down the mapping process.
For all elevation data and hillshaded maps, we used the Slovenian national airborne laser scanning (ALS) dataset (Table 1). Data were acquired from a helicopter with a LMS-Q780 scanner (produced by RIEGL, Horn, Austria), between February 2014 and January 2015. The average density of classified ground returns per m2 on a combined dataset was 3.8 points/m2, and the spatial resolution of the final elevation model was 0.5 by 0.5 m.
Kokalj and Somrak [23] proposed two sets of calculation settings, one for ”normal” or complex terrain types and another for flat terrain. Using the proposed settings ensures comparability of results with other surveys. Because mass movement occurs on rather steep terrain, we used the settings for normal terrain types in all our figures but Figure 4, which shows the usability of the VAT method for observation of minute detail on a very flat terrain.
Prismatic openness (Figure 3a) was proposed by Canuto et al. [24] in their study of ancient lowland Maya complexity, and it combines positive and negative openness with an RGB image of hillshading from three directions, using a vertically exaggerated terrain as a base layer (Table 1). Positive and negative openness add the detail of small-scale topography, while hillshading gives perception to the general topography. However, despite vertical exaggeration, this effect is strongly reduced because colors are subdued as a result of a normal blend mode being used to merge the base layer with the openness layers.
The red relief image map (RRIM) (Figure 3b) [25] is often used for mapping mass movement (e.g., [26]). It overlays a slope gradient image, colored in white to red tones, with the “ridge and valley index” computed from positive (Op) and negative openness (On) in a grayscale color map. Because it is patented in Japan, China, Taiwan, and the USA [27], researchers have devised ways to produce similar or better results by replacing the positive and negative openness index with other visualizations, for example sky-view factor [28], simple trend removal [24], or curvature [29]. Using various fusion techniques (blending modes) to combine layers that constitute specific visualization significantly improves their effectiveness to convey information, as can be seen from improved positive openness and red relief image map (Figure 3c,d). In comparison to other methods, VAT method (Figure 3f) provides the best visual recognition of geomorphological features of landslides while retaining the perception of the general topography.
We computed all of the visualizations presented in this paper with Relief Visualization Toolbox, open source software provided by ZRC SAZU [30].

3. Results and Discussion

3.1. Locations

3.1.1. Slano Blato Landslide

The studied area is located in the lower part of the landslides, in the vicinity of the lower concrete wall. As the wall has not yet been finished, erosion is taking place on both sides and material is accumulating on the concrete wall, as it is continuously being transported. This erosion is problematic because it actively removes the landslide sediments and deepens both channels. In the digital orthophoto (Figure 5a), these two channels cannot be distinguished from the central part of the landslide. In the usual hillshaded elevation model (Figure 5c), the left (northern) channel (red arrows) can be recognized. However, the VAT method (Figure 5d) provides the best recognition of erosion. Incised channels are clearly visible, appearing pronounced due to their very dark color, and represent closed depressions. Above the concrete wall, the method also recognizes the two artificial channels (blue arrows), and incised channels from Figure 5c are also more clearly recognizable. The hillshaded relief is prone to direction bias, but the VAT method is independent of that. The VAT method will recognize all of the closed depressions and narrow valleys and is, therefore, ideal for finding such features.

3.1.2. Breccia Block of the Podboršt Landslide

Podboršt is an active area of slow movement which can be classified as creep; however, no monitoring has been established to confirm the velocity. We estimate such movements due to two prominent features, which are visible in Figure 5. The first features are the large open fractures in the central part of the figure, which are visible on Figure 6c (red arrows), and the second is the wide depression in the terrain at the contact of the limestones and breccias. The area is dominated by carbonate breccia, and clasts can reach about a meter in size. Their origin is the steep carbonate slope in the NE, belonging to the overthrust of the carbonates over flysch. The production of carbonate scree is still active. The breccia has been cemented for a sufficient amount of time but is actively being eroded. Several smaller blocks of breccia have been detached from the main body (marked with a blue arrow). Again, the fractures are more visible in Figure 6d, as the contrast between the black areas, belonging to deeper open fractures (trenches), and brighter areas, belonging to flatter breccia, is much more pronounced in the classical hillshaded areas (Figure 6c). The fractures orientated in the direction of sun illumination are only poorly visible.
Our method also identifies the detached blocks much easier, and they can be more precisely delineated, which is a consequence of being direction-independent. Finally, the wide depression on the contact between the stable carbonate slopes and creeping breccia is easier to recognize in Figure 6c,d. We interpret this depression as being a large active scarp, which is opening due to slow movements and, possibly, deep rotation of the complete breccia body. The same type of transport is also found in some sedimentary bodies in the Rebrnice area of the Vipava Valley. Research suggests that the entire hinterland of the Šumljak sedimentary bodies forms part of a deep-seated rotational landslide, formed of carbonate breccia [31]. Steep scarps on the external parts of the planation surfaces represent the main cliff face, which is the source area for rock fall and rock topple processes. The production of scree due to the mechanical disintegration of fractured limestones and rock falls is prolific, and such depressions would be filled if no opening was taking place.

3.1.3. Marjančna Ravna Landslide

The area around the Marjančna ravna landslide is completely vegetated (Figure 7a) and has not been investigated before. The landslide can easily be delineated, and the scarp is clearly visible in both hillshaded and VAT figures (Figure 7c,d). However, the VAT method gives much better insight into the landslide foot, where it is possible to isolate the original surfaces, bounded by deep open and active fractures (marked with red arrows). Such delineation is not possible in the hillshaded relief map. Two scarps in the landslide head are also a lot more visible in Figure 7c,d.

3.1.4. Strešnice Carbonate Block

Strešnice carbonate block is one of the many huge carbonate blocks that detached from the area of Mala Gora [11]. It is composed of Triassic dolomite, which is intensively fractured and disintegrates into fine-grained particles, which are very easily eroded. Erosion is also taking place in the surrounding flysch, enabling the block to move towards the valley bottom. Such erosion is present on the southern slopes of the block (Figure 8), which is visible in the photograph (Figure 8a). The hillshaded map (Figure 8c), however, cannot be used for the investigation of this active erosional area, as illumination is from the NW direction, so the complete terrain is hidden in shadow. By using the VAT method (Figure 8d), erosion channels marked with arrows in Figure 8c are much more pronounced, and erosional features south of the dolomite block are also more visible and detailed.

3.1.5. Breccia Block of Školj of St. Pavel

Finally, the Školj of St. Pavel is a remnant of a large breccia body. The breccia is cemented and forms very steep, even vertical, unstable slopes which are now being eroded from all sides. Consequently, several smaller blocks have detached from the main body (Figure 9a), mainly in the southeastern side of the slope. Blocks on the eastern slopes are visible in the hillshaded map (Figure 9c), however, those on the western side seem to be aggregated to the main body. The VAT method (Figure 9d) is much more effective in recognizing these smaller blocks (marked with arrows in Figure 9c), as the fractures dividing them from the main body are visible. The main body of Školj of St. Pavel breccia block can also be more precisely delineated due to direction-independent lightning.

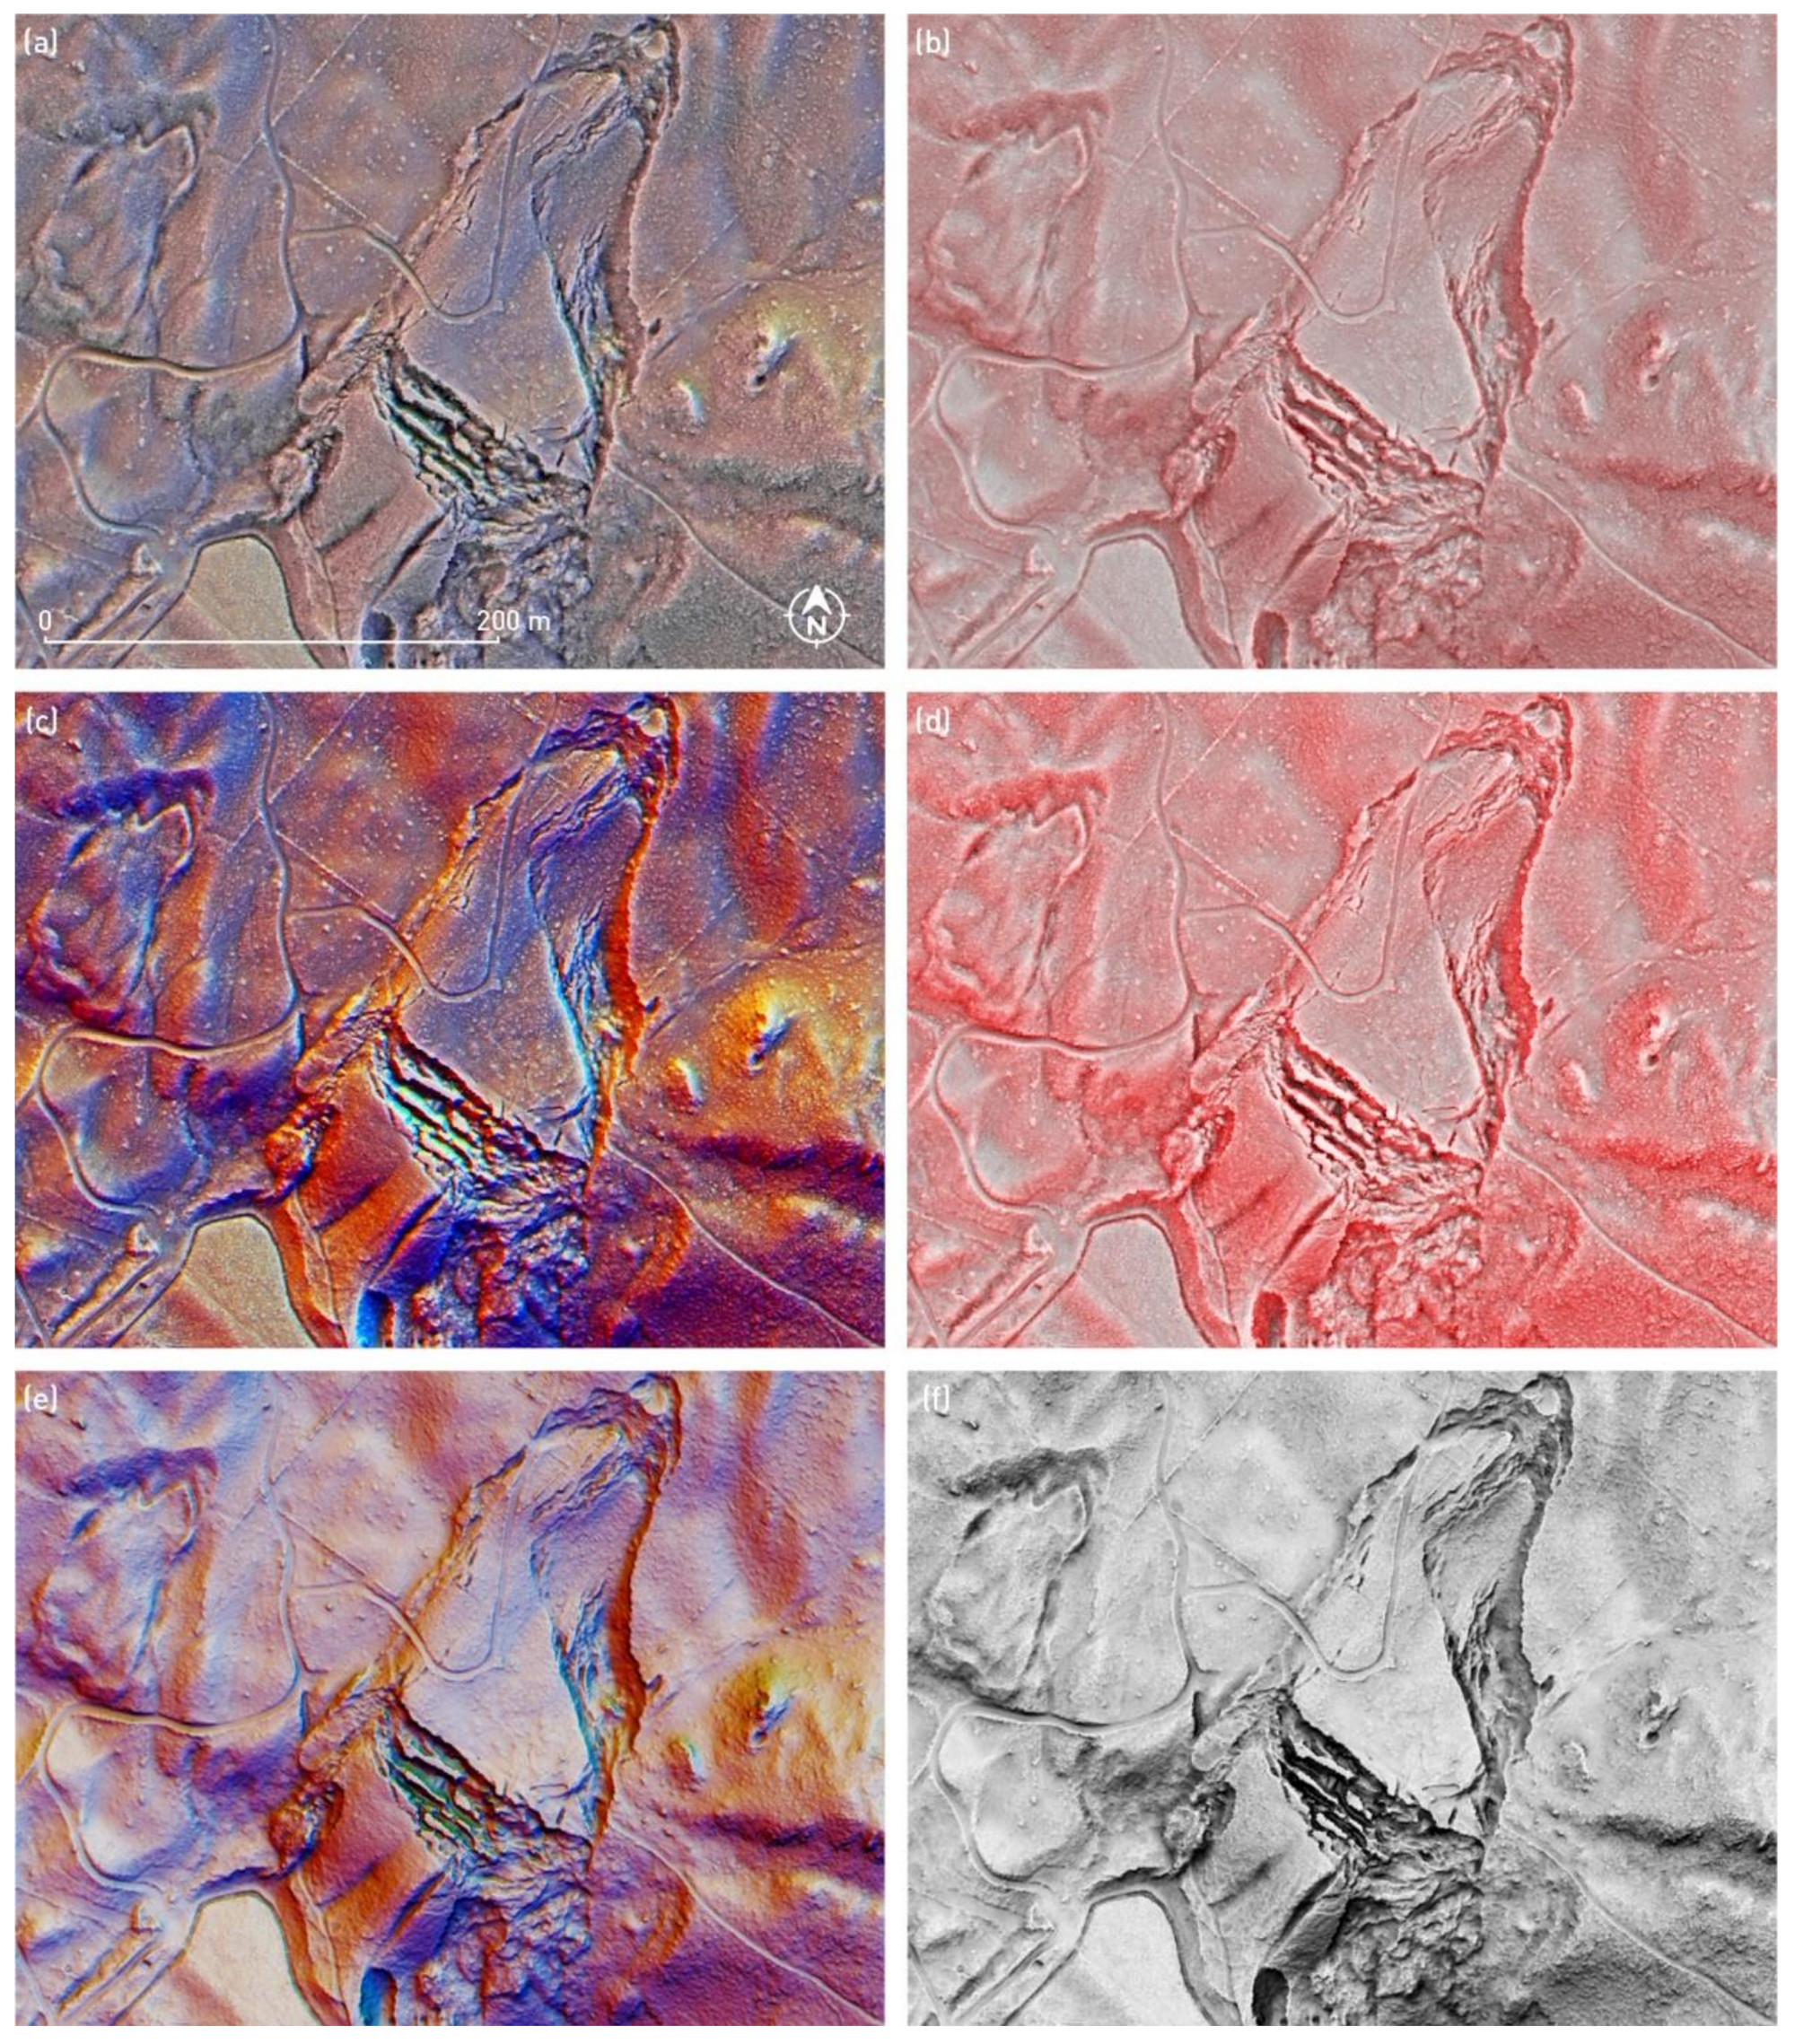
3.2. Comparison of the Methods

Prismatic openness, RRIM, RGB VAT, and VAT are all direction-independent and display small-scale features well, irrespective of their orientation. Because prismatic openness and RRIM heavily rely on openness, which is a trend removal technique, the sense of general topography is very subtle. VAT and RGB VAT preserve the perception of terrain plasticity with sky-view factor and hillshading. The characteristics of individual layers are better represented because VAT and RGB VAT use different fusion techniques to combine the layers. This can clearly be seen from the color comparison between prismatic openness (Figure 3a) and RGB VAT (Figure 3e), where color saturation and hue (representing slope orientation) are more obvious in the latter, even if they are computed from actual (unexaggerated) terrain.

4. Conclusions

A comparison of images obtained by classical analytical hillshading and the proposed VAT method clearly shows the advantage of the VAT method. The latter uses various pixel-based image fusion to combine information from different visualizations of aerial laser scanning-derived elevation models into a single image. The VAT method helps to effectively recognize the geomorphological features of presented mass movements in different areas. In addition, it does not introduce artificial artifacts, the visual extent and shape of recorded features are not altered, it shows small topographic features in the same way irrespective of their orientation or shape, and the calculation is fast and does not slow down the mapping process. Images obtained by VAT can be an indispensable tool for geological or geomorphological mapping and recognition of landslides and related erosional phenomena. Therefore, we encourage users to apply it to the analysis of terrain of different types of slope deposit.

Author Contributions

Conceptualization, T.V., Ž.K., T.P., Methodology, Ž.K., Writing—Original Draft Preparation, T.V., T.P., Ž.K., Writing—Review and Editing, T.V., T.P., Ž.K., Visualization, Ž.K, T.P., Funding Acquisition, Ž.K., T.V., T.P.

Funding

This research was partly funded by the Slovenian Research Agency core funding (No. P2-0406 and No. P1-0195), as well as a research project (No. J6-9395).

Acknowledgments

The work was carried out in the framework of the International Consortium on Landslides (ICL), project number IPL-216 (entitled Diversity and hydrogeology of mass movements in the Vipava Valley, SW Slovenia) and the ICL Adriatic-Balkan Network (ABN). We appreciate the constructive comments and suggestions made by the anonymous reviewers.

Conflicts of Interest

The authors declare no conflict of interest. The sponsors had no role in the design execution, interpretation, or writing of the study.

References

  1. Van Den Eeckhaut, M.; Poesen, J.; Verstraeten, G.; Vanacker, V.; Moeyersons, J.; Nyssen, J.; van Beek, L.P.H. The effectiveness of hillshade maps and expert knowledge in mapping old deep-seated landslides. Geomorphology 2005, 67, 351–363. [Google Scholar] [CrossRef]
  2. Yokoyama, R.; Shlrasawa, M.; Pike, R.J. Visualizing topography by openness: A new application of image processing to digital elevation models. Photogramm. Eng. Remote Sens. 2002, 68, 251–266. [Google Scholar]
  3. Zakšek, K.; Oštir, K.; Kokalj, Ž. Sky-view factor as a relief visualization technique. Remote Sens. 2011, 3, 398–415. [Google Scholar] [CrossRef] [Green Version]
  4. Jemec Auflič, M.; Jež, J.; Popit, T.; Košir, A.; Maček, M.; Logar, J.; Petkovšek, A.; Mikoš, M.; Calligaris, C.; Boccali, C.; et al. The variety of landslide forms in Slovenia and its immediate NW surroundings. Landslides 2017, 14, 1537–1546. [Google Scholar] [CrossRef]
  5. Popit, T.; Jež, J.; Verbovšek, T. Mass movement processes of Quaternary deposits in the Vipava Valley, SW Slovenia. In Advancing Culture of Living with Landslides; Mikoš, M., Casagli, N., Yueping, Y., Sassa, K., Eds.; Springer: Cham, Switzerland, 2017; Volume 4, pp. 571–580. [Google Scholar] [CrossRef]
  6. Verbovšek, T.; Košir, A.; Teran, M.; Zajc, M.; Popit, T. Volume determination of the Selo landslide complex (SW Slovenia): Integrating field mapping, ground penetrating radar and GIS approaches. Landslides 2017, 14, 1265–1274. [Google Scholar] [CrossRef]
  7. Verbovšek, T.; Popit, T. GIS-assisted classification of litho-geomorphological units using Maximum Likelihood Classification, Vipava Valley, SW Slovenia. Landslides 2018, 15, 1415–1424. [Google Scholar] [CrossRef]
  8. Placer, L.; Jež, J.; Atanackov, J. Structural aspect of the Slano blato landslide (Slovenia). Geologija 2008, 51, 229–234. [Google Scholar] [CrossRef]
  9. Jež, J. Reasons and mechanism for soil sliding processes in the Rebrnice area, Vipava Valley, SW Slovenia. Geologija 2007, 50, 55–63. [Google Scholar] [CrossRef]
  10. Popit, T.; Jernej, J.; Košir, A.; Fifer Bizjak, K.; Ribičič, M. Kvartarni pobočni sedimenti severnega in vzhodnega roba Vipavske doline (Quaternary slope sediments of northern and eastern border of the Vipava Valley). In Abstracts and Field Trips, Proceedings of the 4th Slovenian Geological Congress, Ankaran, Slovenia, 8–10 October 2014; Rožič, B., Verbovšek, T., Vrabec, M., Rožič, B., Verbovšek, T., Vrabec, M., Eds.; Faculty of Natural Sciences and Engineering: Ljubljana, Slovenia, 2014; pp. 98–103. [Google Scholar]
  11. Kocjančič, M.; Popit, T.; Verbovšek, T. Gravitational sliding of the carbonate megablocks in the Vipava Valley, SW Slovenia. Acta Geogr. Slov. 2019, 49, 7–22. [Google Scholar] [CrossRef] [Green Version]
  12. Buser, S. Basic Geological Map of SFRJ 1:100 000. Guide for Sheet Gorica; Federal Geological Survey: Belgrade, Yugoslavia, 1973; p. 50. [Google Scholar]
  13. Buser, S. Basic Geological Map of SFR Yugoslavia 1:100.000, Gorica Sheet; Federal Geological Survey: Belgrade, Yugoslavia, 1968. [Google Scholar]
  14. Placer, L. Geologic structure of south-western Slovenia. Geologija 1981, 24, 27–60. [Google Scholar]
  15. Janež, J.; Čar, J.; Habič, P.; Podobnik, R. Vodno Bogastvo Visokega Krasa: Ranljivost Kraške Podzemne vode Banjščic, Trnovskega Gozda, Nanosa in Hrušice; Geologija D.o.o: Idrija, Slovenia, 1997; p. 167. [Google Scholar]
  16. Popit, T.; Rožič, B.; Šmuc, A.; Kokalj, Ž.; Verbovšek, T.; Košir, A. A lidar, GIS and basic spatial statistic application for the study of ravine and palaeo-ravine evolution in the upper Vipava Valley, SW Slovenia. Geomorphology 2014, 204, 638–645. [Google Scholar] [CrossRef]
  17. Logar, J.; Fifer Bizjak, K.; Kočevar, M.; Mikoš, M.; Ribičič, M.; Majes, B. History and present state of the Slano blato landslide. Nat. Hazards Earth Syst. Sci. 2005, 5, 447–457. [Google Scholar] [CrossRef] [Green Version]
  18. Fifer Bizjak, K.; Zupančič-Valant, A. Site and laboratory investigation of the Slano blato landslide. Eng. Geol. 2009, 105, 171–185. [Google Scholar] [CrossRef]
  19. Kočevar, M.; Ribičič, M. Geological, hydrogeological and geomechanical investigation of Slano blato landslide. Geologija 2002, 45, 427–432. [Google Scholar] [CrossRef]
  20. Mikoš, M.; Petkovšek, A.; Majes, B. Mechanisms of landslides in over-consolidated clays and flysch. Activity scale and targeted region: National. Landslides 2009, 6, 367–371. [Google Scholar] [CrossRef]
  21. Maček, M.; Majes, B.; Petkovšek, A. Lessons learned from 6 years of suction monitoring of the Slano blato landslide. Riv. Ital. Geotech. 2016, 1, 21–33. [Google Scholar]
  22. Petkovšek, A.; Maček, M.; Mikoš, M.; Majes, B. Mechanisms of active landslides in Flysch. In Landslides Global Risk Preparedness; Sassa, K., Rouhban, B., Briceno, S., McSaveney, M., He, B., Eds.; Springer: Berlin/Heidelberg, Germany, 2013; pp. 149–165. [Google Scholar]
  23. Kokalj, Ž.; Somrak, M. Why Not a Single Image? Combining Visualizations to Facilitate Fieldwork and On-Screen Mapping. Remote Sens. 2019, 11, 747. [Google Scholar] [CrossRef] [Green Version]
  24. Canuto, M.A.; Estrada-Belli, F.; Garrison, T.G.; Houston, S.D.; Acuña, M.J.; Kováč, M.; Marken, D.; Nondédéo, P.; Auld-Thomas, L.; Castanet, C.; et al. Ancient lowland Maya complexity as revealed by airborne laser scanning of northern Guatemala. Science 2018, 361, eaau0137. [Google Scholar] [CrossRef] [Green Version]
  25. Chiba, T.; Kaneta, S.; Suzuki, Y. Red Relief Image Map: New Visualization Method for Three Dimension Data. ISPRS Arch. 2008, 37, 1071–1076. [Google Scholar]
  26. Görüm, T. Tectonic, topographic and rock-type influences on large landslides at the northern margin of the Anatolian Plateau. Landslides 2019, 16, 333–346. [Google Scholar] [CrossRef]
  27. Asia Air Survey Patents for RRIM. Available online: https://www.rrim.jp/en/patent/ (accessed on 25 April 2019).
  28. Lo, C.-M.; Lee, C.-F.; Keck, J. Application of sky view factor technique to the interpretation and reactivation assessment of landslide activity. Environ. Earth Sci. 2017, 76, 375. [Google Scholar] [CrossRef]
  29. Chudý, F.; Slámová, M.; Tomaštík, J.; Prokešová, R.; Mokroš, M. Identification of Micro-Scale Landforms of Landslides Using Precise Digital Elevation Models. Geosciences 2019, 9, 117. [Google Scholar] [CrossRef] [Green Version]
  30. Kokalj, Ž.; Zakšek, K.; Oštir, K.; Pehani, P.; Čotar, K.; Somrak, M. Relief Visualization Toolbox; ZRC SAZU: Ljubljana, Slovenia, 2019. [Google Scholar]
  31. Popit, T. Origin of planation surfaces in the hinterland of Šumljak sedimentary bodies in Rebrnice (Upper Vipava Valley, SW Slovenia). Geologija 2017, 60, 297–307. [Google Scholar] [CrossRef]
Figure 1. (a) Geological map of the extended area of the Vipava Valley; (b) cross section through the Trnovski Gozd and Vipava Valley (modified after [8,10,12,13,14,15,16]). Locations and WGS84 coordinates of the landslides: (1) Slano blato landslide: 45.909°N, 13.870°E, (2) Podboršt: 45.805°N, 13.990°E, (3) Marjančna ravna landslide: 45.884°N, 13.947°E, (4) Strešnice carbonate block: 45.919°N, 13.871°E, and (5) Školj of St. Pavel: 45.912°N, 13.809°E.
Remotesensing 11 02946 g001
Figure 2. Left column: Oblique photographs of the landslides, taken with an unmanned aerial system (UAS) and right column: Pedestrian photographs of details. (a) and (b) Slano blato landslide; (c) and (d) Breccia block of Podboršt landslide; (e) and (f) Marjančna ravna landslide; (g) and (h) Block Strešnice; (i) and (j) Školj of St. Pavel.
Remotesensing 11 02946 g002
Figure 3. Marjančna ravna landslide, methods: (a) prismatic openness; (b) red relief image map; (c) modified prismatic openness combined by 50% overlay for both openness layers; (d) modified red relief image map with ridge and valley index added twice, with 50% luminosity and 50% overlay. The colors are preserved to the extent that prismatic openness does not need to exaggerate terrain for hillshading; (e) RGB Visualization for Archaeological Topography (VAT); (f) VAT. 0.5 m resolution. Airborne laser scanning (ALS) data © ARSO, Ljubljana, Slovenia.
Remotesensing 11 02946 g003
Figure 4. The very flat area of Ajdovščina airfield demonstrates the effectiveness of VAT method with “flat terrain” settings to show minute topographic variations in level surfaces: (a) an aerial orthophoto image (© GURS, Ljubljana, Slovenia, 2017); (b) a contour map (only one contour is visible; the contour interval and the elevation colors in Figure 4, Figure 5, Figure 6, Figure 7, Figure 8 and Figure 9 are the same); (c) analytical hillshading; (d) flat terrain VAT. Resolution: 0.5 m, airborne laser scanning (ALS) data © ARSO.
Remotesensing 11 02946 g004
Figure 5. (a) Aerial orthophoto image of the Slano blato landslide (© GURS, 2017) and lidar terrain model visualizations: (b) contour map with the outline of the landslide; (c) analytical hillshading; (d) VAT. Resolution: 0.5 m, ALS data © ARSO. Red arrows in (c) mark two erosional channels near the concrete wall, and the blue arrows mark the two channels above the concrete wall, additionally recognized by VAT method (see text in Section 3.1.1).
Remotesensing 11 02946 g005
Figure 6. (a) Aerial orthophoto image of the Podboršt landslide (© GURS, 2017) and lidar terrain model visualizations: (b) contour map with the outline of the landslide; (c) analytical hillshading; (d) VAT. Resolution: 0.5 m, ALS data © ARSO. Red arrows in (c) mark the large open fractures and blue arrows mark the smaller blocks of breccia, detached from the main body (see text in Section 3.1.2).
Remotesensing 11 02946 g006
Figure 7. (a) Aerial orthophoto image of the Marjančna ravna landslide (© GURS, 2017) and lidar terrain model visualizations: (b) contour map with the outline of the landslide; (c) analytical hillshading; (d) VAT. Resolution: 0.5 m, ALS data © ARSO. Red arrow in (c) marks the large open fractures (see text in Section 3.1.3).
Remotesensing 11 02946 g007
Figure 8. (a) Aerial orthophoto image of the Strešnice carbonate block (© GURS, 2017) and lidar terrain model visualizations: (b) contour map with the outline of the landslide; (c) analytical hillshading; (d) VAT. Resolution: 0.5 m, ALS data © ARSO. Red arrows in (c) mark the erosional channels (see text in Section 3.1.4).
Remotesensing 11 02946 g008
Figure 9. (a) Aerial orthophoto image of the Školj of St. Pavel block (© GURS, 2017) and lidar terrain model visualizations: (b) contour map with the outline of the landslide; (c) analytical hillshading; (d) VAT. Resolution: 0.5 m, ALS data © ARSO. Red arrows in (c) mark the smaller blocks of breccia, detached from the main body (see text in Section 3.1.5).
Remotesensing 11 02946 g009
Table 1. Settings for raster visualization combinations created and used for feature identifications.
Terrain VisualizationComputation SettingsColor Ramp/Band ComboHistogram Stretch Type, min–maxBlending Mode and Opacity
VAT
sky-view factorradius 5 m, 16 directionsblack to whitelinear, 0.65–1.00multiply, 25%
positive opennessradius 5 m, 16 directionsblack to whitelinear, 68°–92°overlay, 50%
slope white to blacklinear, 0°–55°luminosity, 50%
hillshadingangle 35°, azimuth 315°black to whitelinear, 0–100normal, 100%
RGB VAT
sky-view factorradius 5 m, 16 directionsblack to whitelinear, 0.65–1.00multiply, 25%
positive opennessradius 5 m, 16 directionsblack to whitelinear, 68°–92°overlay, 50%
slope white to blacklinear, 0°–55°luminosity, 50%
hillshading from three directionsangle 35°, azimuth 315°Red 315°, Green 22.5°, Blue 90°linear, 0–100normal, 100%
Prismatic openness
positive openness (Op)radius 5 m, 16 directionsblack to whitelinear, 68°–92°normal, 50%
negative openness (On)radius 5 m, 16 directionswhite to blacklinear, 68°–92°normal, 50%
hillshading from three directionsvertical exaggeration 3, angle 35°, azimuth 315°Red 315°, Green 22.5°, Blue 90°linear, 0–100normal, 100%
Red relief image map
slope white to redlinear, 0°–55°normal, 50%
(Op–On)/2radius 5 m, 16 directionsblack to whitelinear, −15°–15°normal, 100%

