Article

Assessment of Leaf Area Index of Rice for a Growing Cycle Using Multi-Temporal C-Band PolSAR Datasets

1
School of Resources and Environment, University of Electronic Science and Technology of China, No. 2006, Xiyuan Ave, West Hi-Tech Zone, Chengdu 611731, China
2
Center for Information Geoscience, University of Electronic Science and Technology of China, No. 2006, Xiyuan Ave, West Hi-Tech Zone, Chengdu 611731, China
3
Department of Geography, Planning, and Environment, East Carolina University, Greenville, NC 27858, USA
4
Guangdong Province Key Laboratory for Land use and consolidation, South China Agricultural University, Guangzhou 501642, China
5
Guangdong Province Engineering Research Center for Land Information Technology, South China Agricultural University, Guangzhou 501642, China
*
Author to whom correspondence should be addressed.
Remote Sens. 2019, 11(22), 2640; https://doi.org/10.3390/rs11222640
Submission received: 4 September 2019 / Revised: 6 November 2019 / Accepted: 10 November 2019 / Published: 12 November 2019

Abstract

:
C-band polarimetric synthetic aperture radar (PolSAR) data has been previously explored for estimating the leaf area index (LAI) of rice. Although the rice-growing cycle was partially covered in most of the studies, details for each phenological phase need to be further characterized. Additionally, the selection and exploration of polarimetric parameters are not comprehensive. This study evaluates the potential of a set of polarimetric parameters derived from multi-temporal RADARSAT-2 datasets for rice LAI estimation. The relationships of rice LAI with backscattering coefficients and polarimetric decomposition parameters have been examined in a complete phenological cycle. Most polarimetric parameters had weak relationships (R2 < 0.30) with LAI at the transplanting, reproductive, and maturity phase. Stronger relationships (R2 > 0.50) were observed at the vegetative phase. HV/VV and RVI FD had significant relationships (R2 > 0.80) with rice LAI for the whole growth period. They were utilized to develop empirical models. The best LAI inversion performance (RMSE = 0.81) was obtained when RVI FD was used. The acceptable error demonstrated the possibility to use the decomposition parameters for rice LAI estimation. The HV/VV-based model had a slightly lower estimation accuracy (RMSE = 1.29) but can be a practical alternative considering the wide availability of dual-polarized datasets.

1. Introduction

The staple food for approximately one-half of the global population is rice [1]. The development and health status of the rice crop are of great significance. The leaf area index (LAI) of the crop is crucial in the quantitative description of the canopy structure and photosynthetic processes [2,3]. However, the ground LAI measurements using digital photography [4,5] or integrated sensors [6,7] are time-consuming and laborious, restricting their practical application over a large region. Spaceborne or airborne remote sensing techniques and datasets are a possible alternative for the LAI monitoring at a regional scale [8,9,10]. Several vegetation indices (VIs) are used to estimate the LAI base on the contrast in the reflectance among different spectral bands of optical data [11,12,13,14]. However, the rice cultivation period is typically within the humid and warm months of a year. The cloud cover can be pervasive, severely affecting the acquisition of cloud-free optical datasets [15,16]. Consequentially, the application of optical datasets to estimate the rice LAI becomes unpractical.
Synthetic aperture radar (SAR) has both day and night and nearly all-weather imaging capability. SAR backscatter is influenced by the biophysical characteristics of crops [17,18,19]. The penetration depth of microwave energy into the canopy is positively associated with the wavelength. The C-band microwave has a longer wavelength than X-band. Therefore, the C-band backscatter can provide more information on the rice subcanopy structure and stems than the X-band backscatter [20]. Interaction between polarized microwaves and vegetation canopy leads to different responses in different polarizations of polarimetric SAR (PolSAR) [21,22]. During the last decade, the RADARSAT-2 acquired a significant volume of C-band quad-pol (VH, VV, HH, and HV) PolSAR datasets. The backscattering coefficient ( σ 0 ) is the most basic SAR parameter that varies at different growing stages of the rice crop [23,24,25]. The coefficient is affected by plant moisture content and plant constituents [26,27,28]. Kumar et al. [29] estimated the LAI of lowland rice using RADARSAT-2 data with a semi-empirical model. The highest accuracy (RMSE = 0.63) was achieved for non-basmati rice from the tillering to harvested stages using HV backscatter. Inoue et al. [30] demonstrated that rice LAI had a strong relationship (R2 = 0.84) with RADARSAT-2 VH backscatter from vegetative to maturing growth periods. Yang et al. [31] analyzed the RADARSAT-2 backscattering coefficients at the vegetative phase and found that cross-polarization (VH and HV) data had better correlation with rice LAI than co-polarization (VV and HH) data. These studies have explored the relationship between C-band backscattering coefficients and rice LAI. However, their analyses partially covered the rice-growing cycle, and the details of parameter relationships for each phenological phase were not well characterized. The dynamic responses of quad-pol backscatter to rice LAI evolution remain to be systematically interpreted using particular scattering mechanism descriptors. In addition, the potential of polarization combinations for the rice LAI estimation needs further investigation.
Previous studies revealed that the radar echo from crops was a complicated combination of different scattering components [32,33,34] including the surface backscatter from the ground, volume backscatter from the plants, double-bounce backscatter between the underlying ground and plants, and multi-scattering mechanisms. The polarimetric decomposition technique is useful for interpreting the scattering mechanisms. The eigenvector-based Cloude–Pottier decomposition [35] and the model-based Freeman–Durden decomposition [36] are two widely used decomposition algorithms. Several polarimetric parameters are obtained to describe the specific scattering properties of the vegetation. The decomposition parameters have the potential to assess not only the LAI but also the development of the crop. Jiao et al. [21] examined the parameters derived from both decomposition algorithms using the RADARSAT-2 data collected over corn and soybean fields. The LAI of the two crops was highly correlated with entropy and volume scattering. Zhang et al. [37] found the scattering-type angle and double-bounce scattering were significantly correlated with maize LAI using simulated C-band PolSAR data. Although the dependence of decomposition parameters on the LAI of several crops (e.g., corn, soybean, and maize) has been investigated, few studies have focused on rice. The relationship between the polarimetric parameters and LAI is crop-type specific due to the different vertical and branching structures [38]. The interactions between the microwave energy and rice plants can be elucidated clearly by analyzing the temporal and spatial variations of decomposition components. The dynamic change of quad-pol backscattering coefficients can also be interpreted based on the decomposition parameters.
In this research, we study the quad-pol backscattering coefficients, Cloude–Pottier decomposition components, Freeman–Durden decomposition parameters, as well as their combinations. The relationship between polarimetric SAR variables and rice LAI at different phenological phases during the whole growing cycle is evaluated. The most suitable polarimetric index or indices for rice LAI estimation can be found to build empirical models. Four RADARSAT-2 datasets acquired during the 2016 rice-growing season in Meishan City, Sichuan, China are analyzed.

2. Materials and Methods

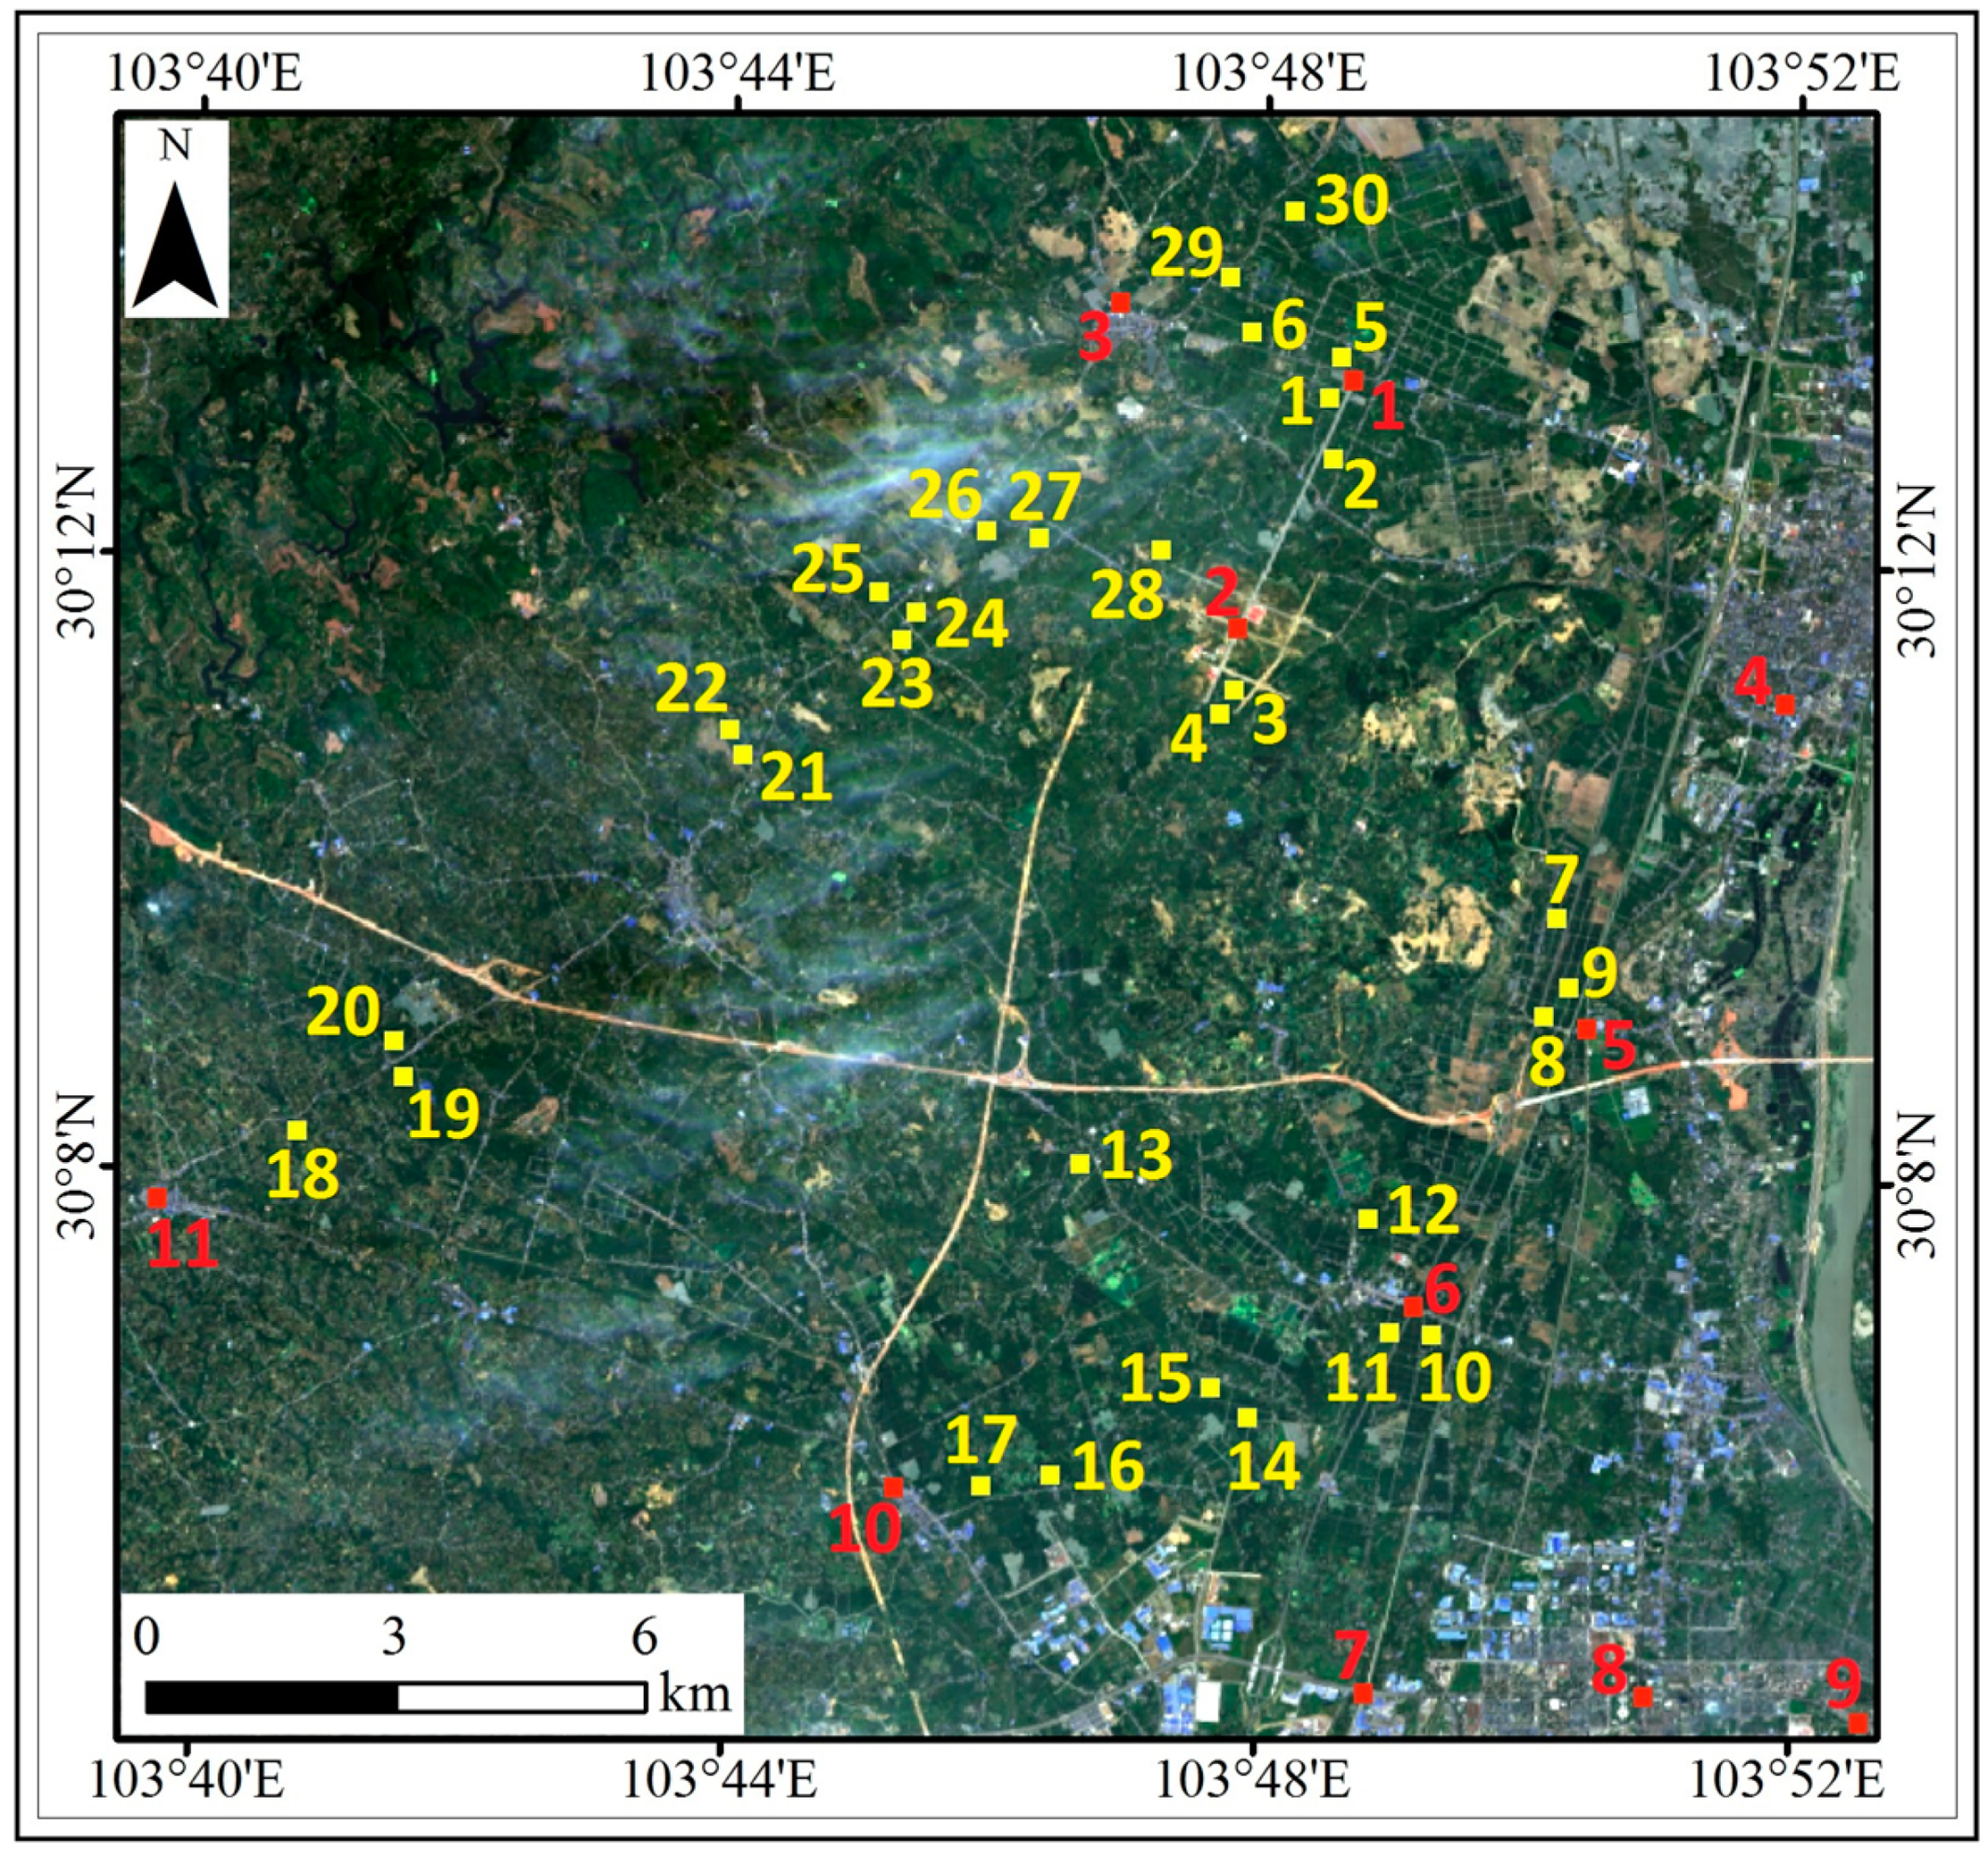
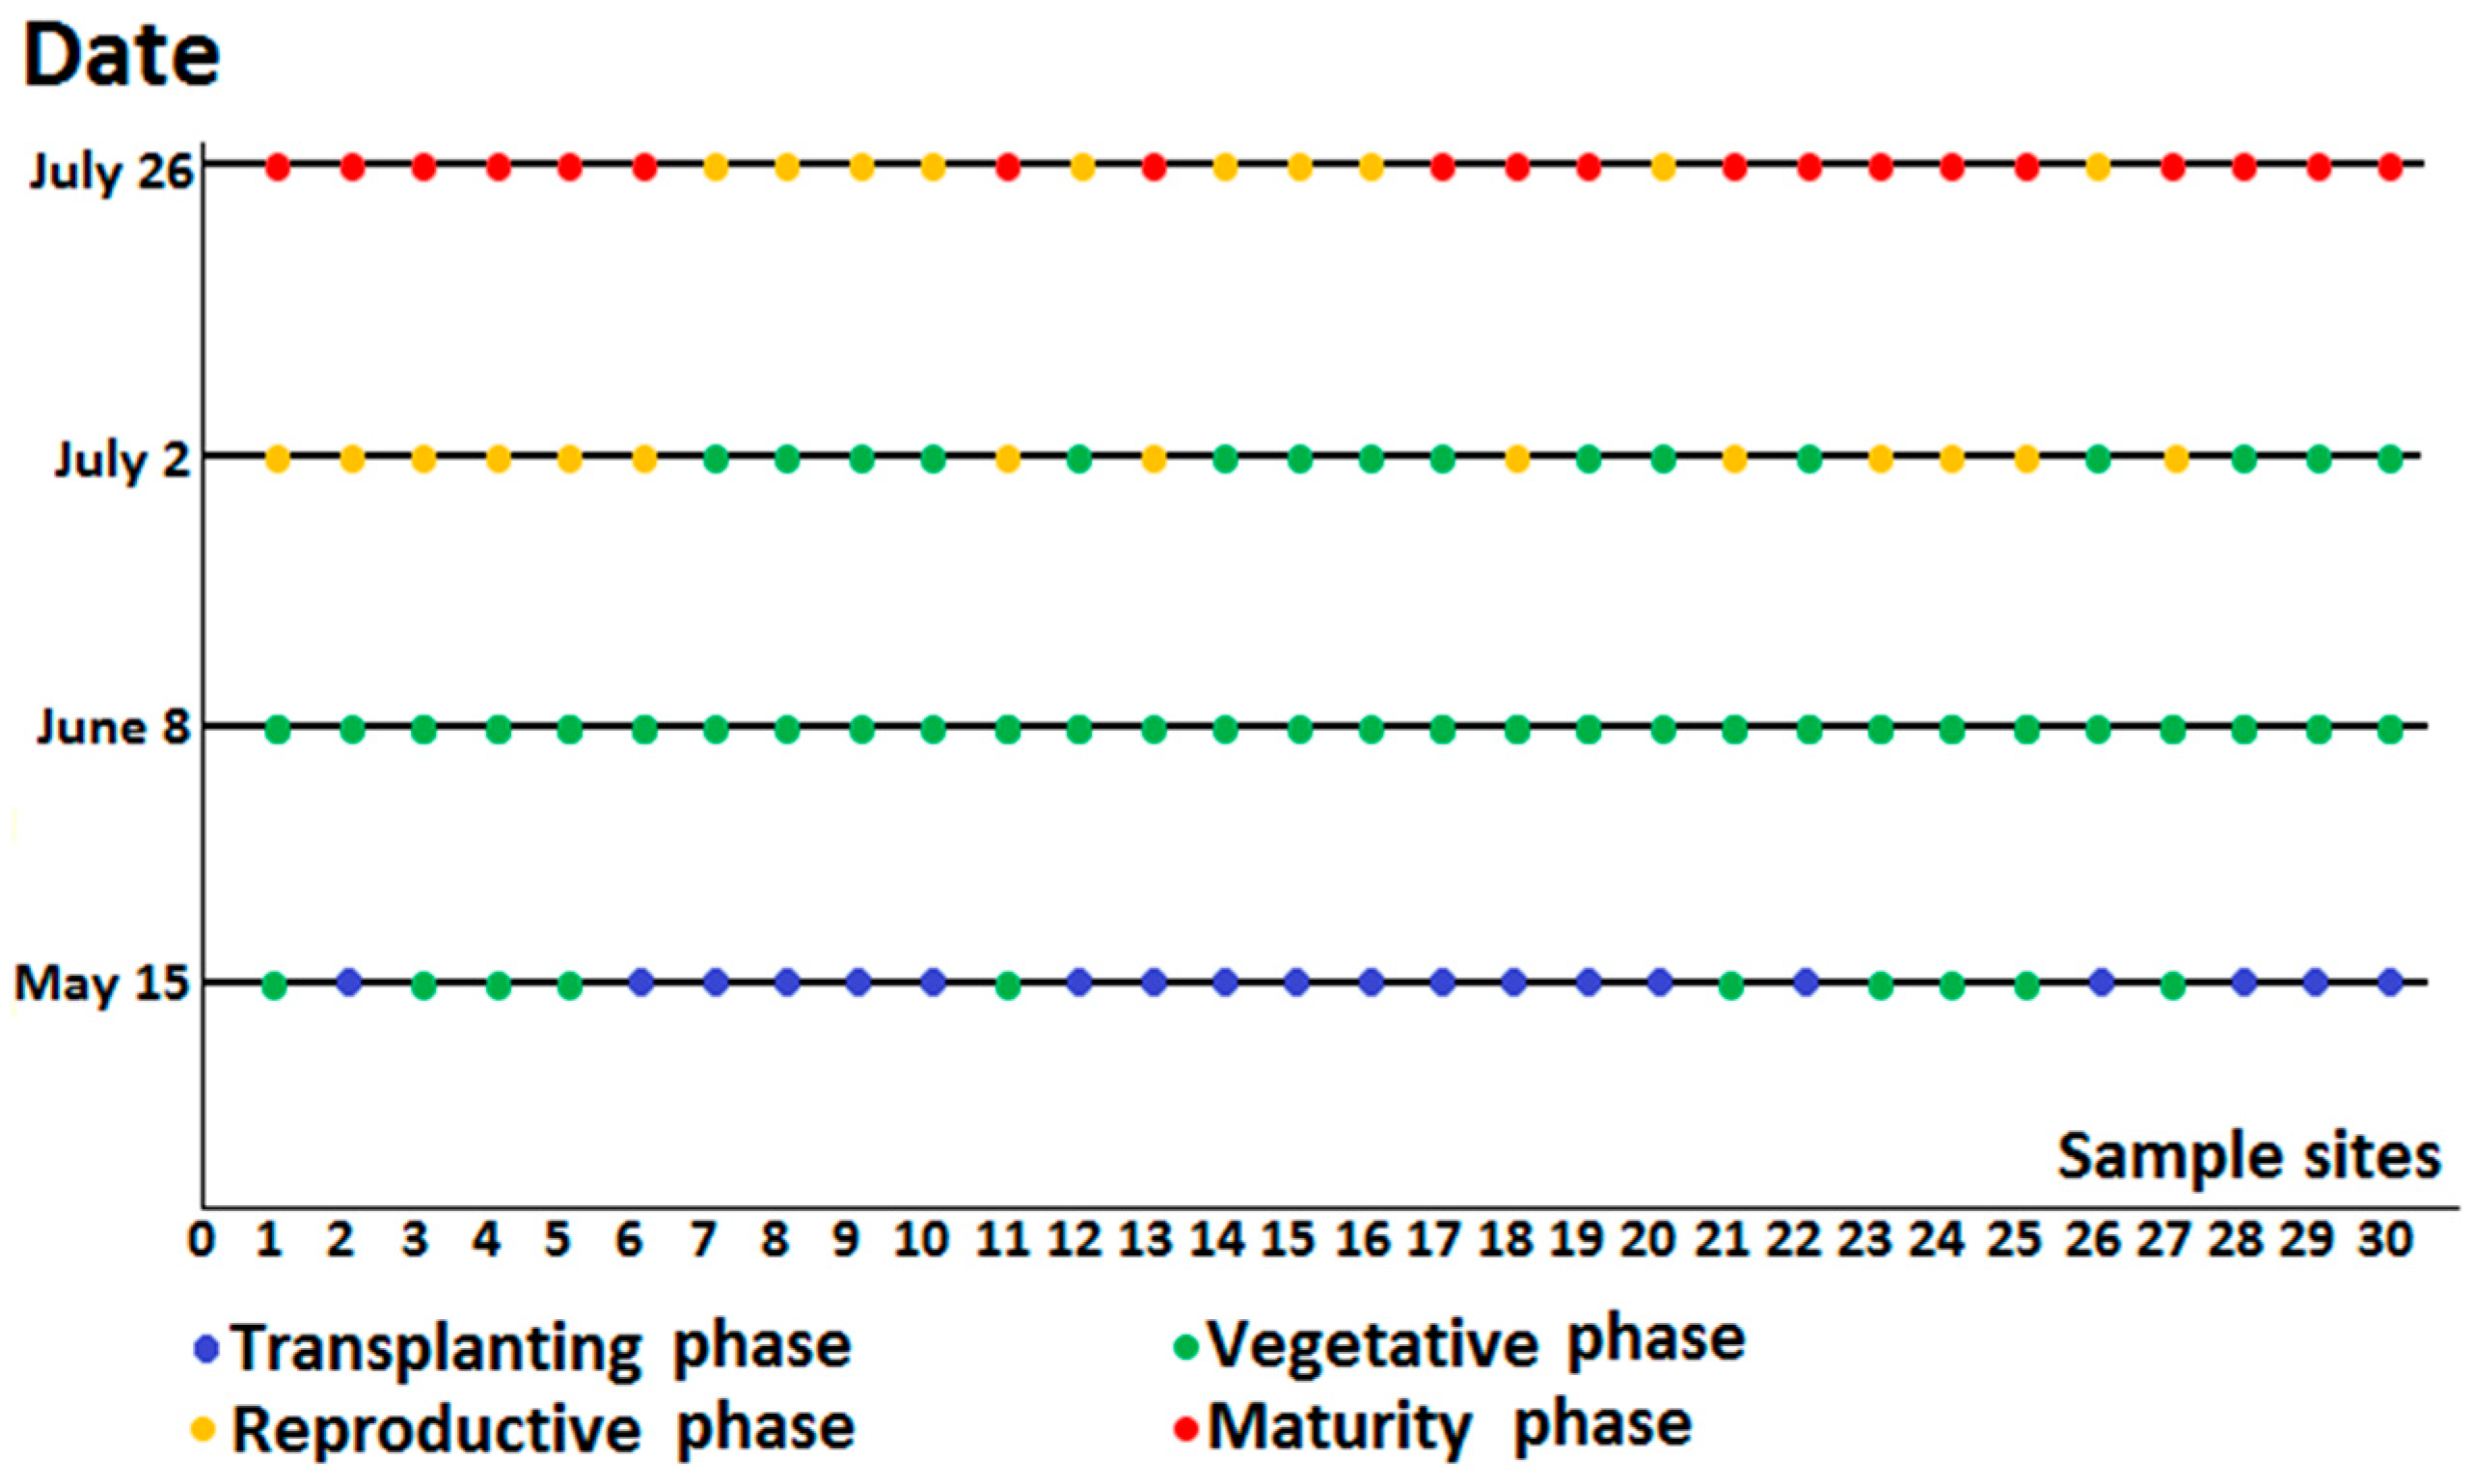
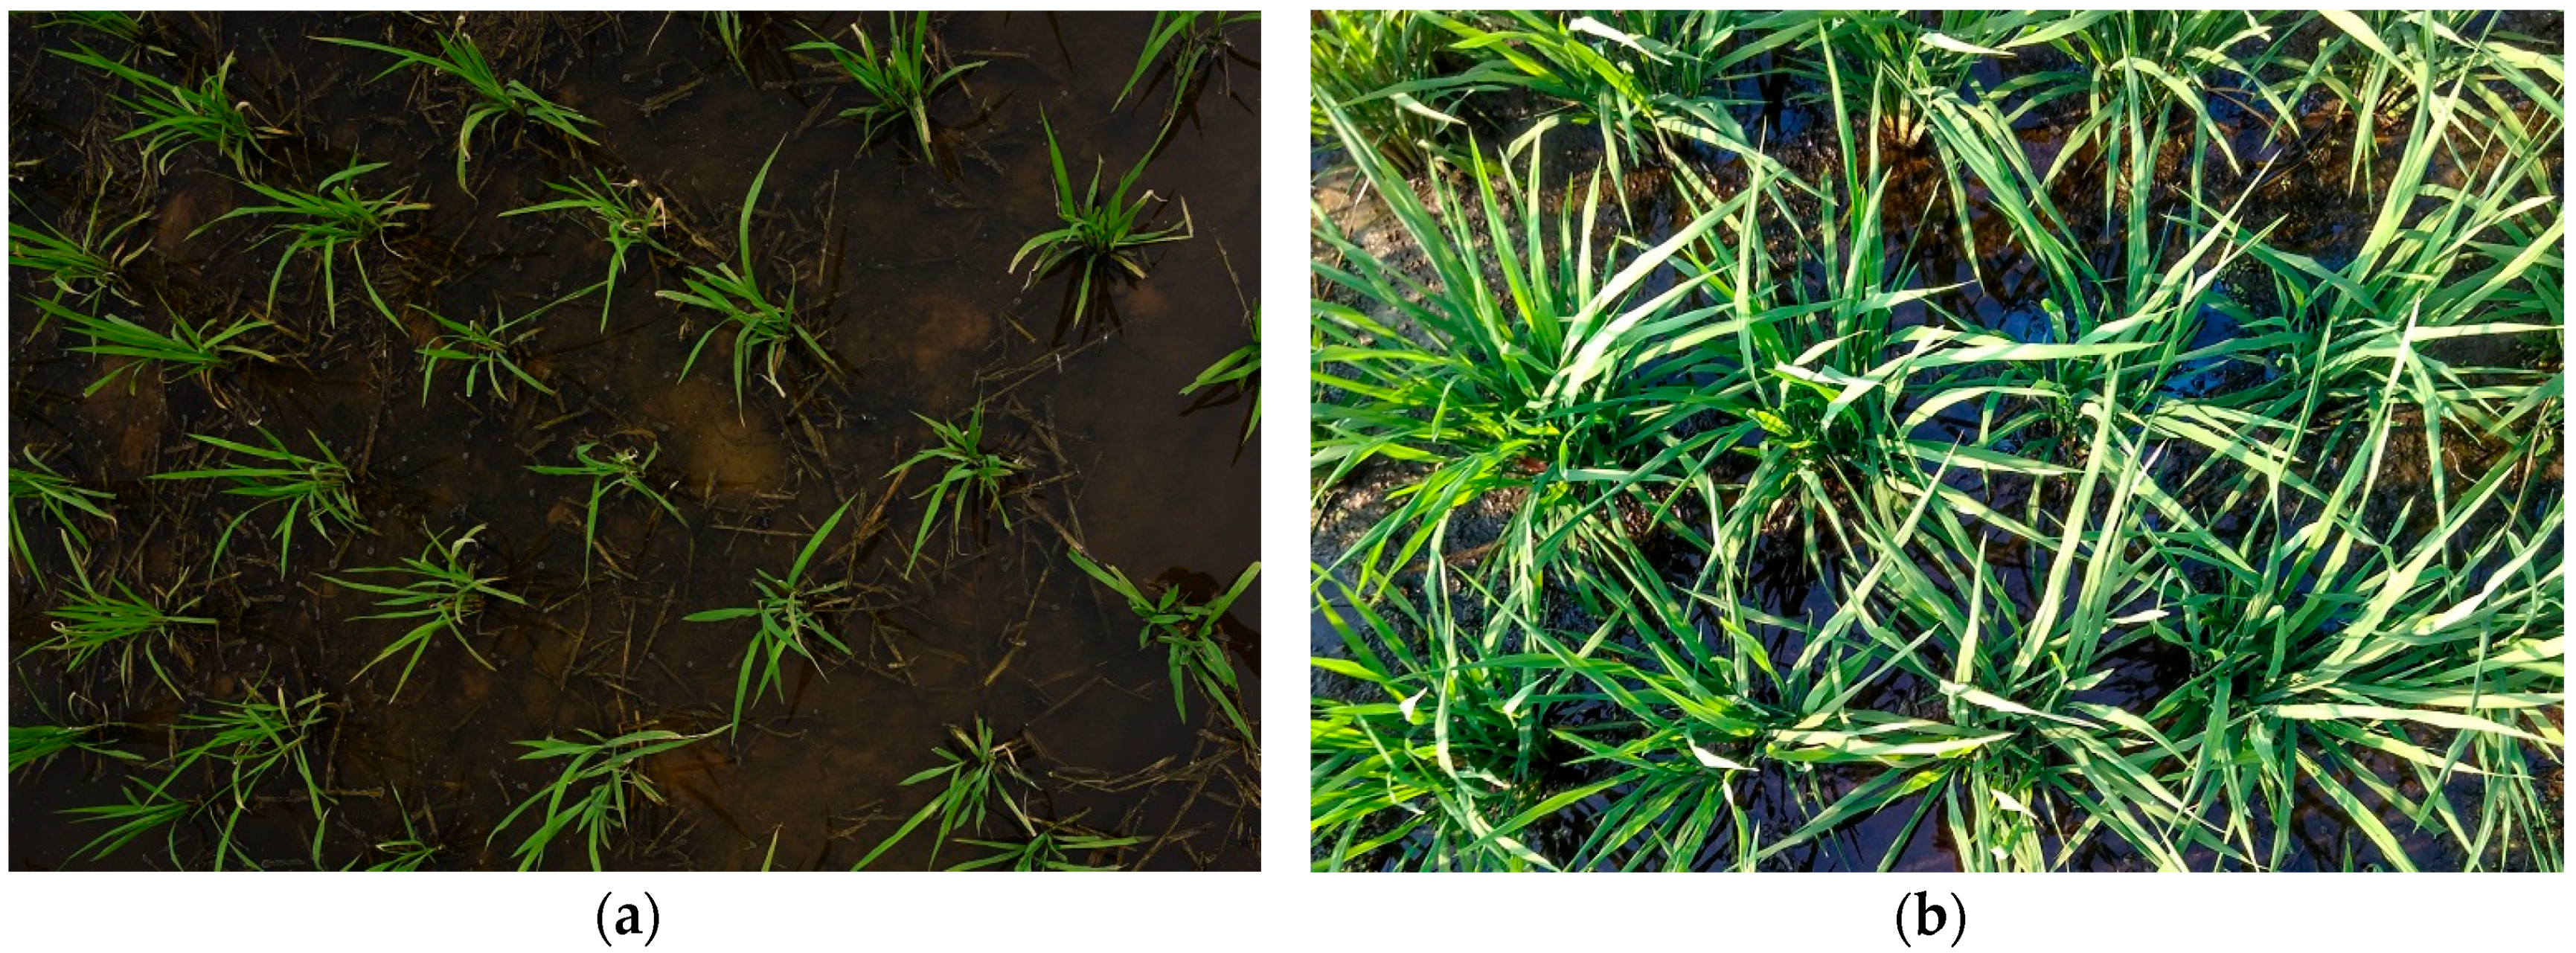
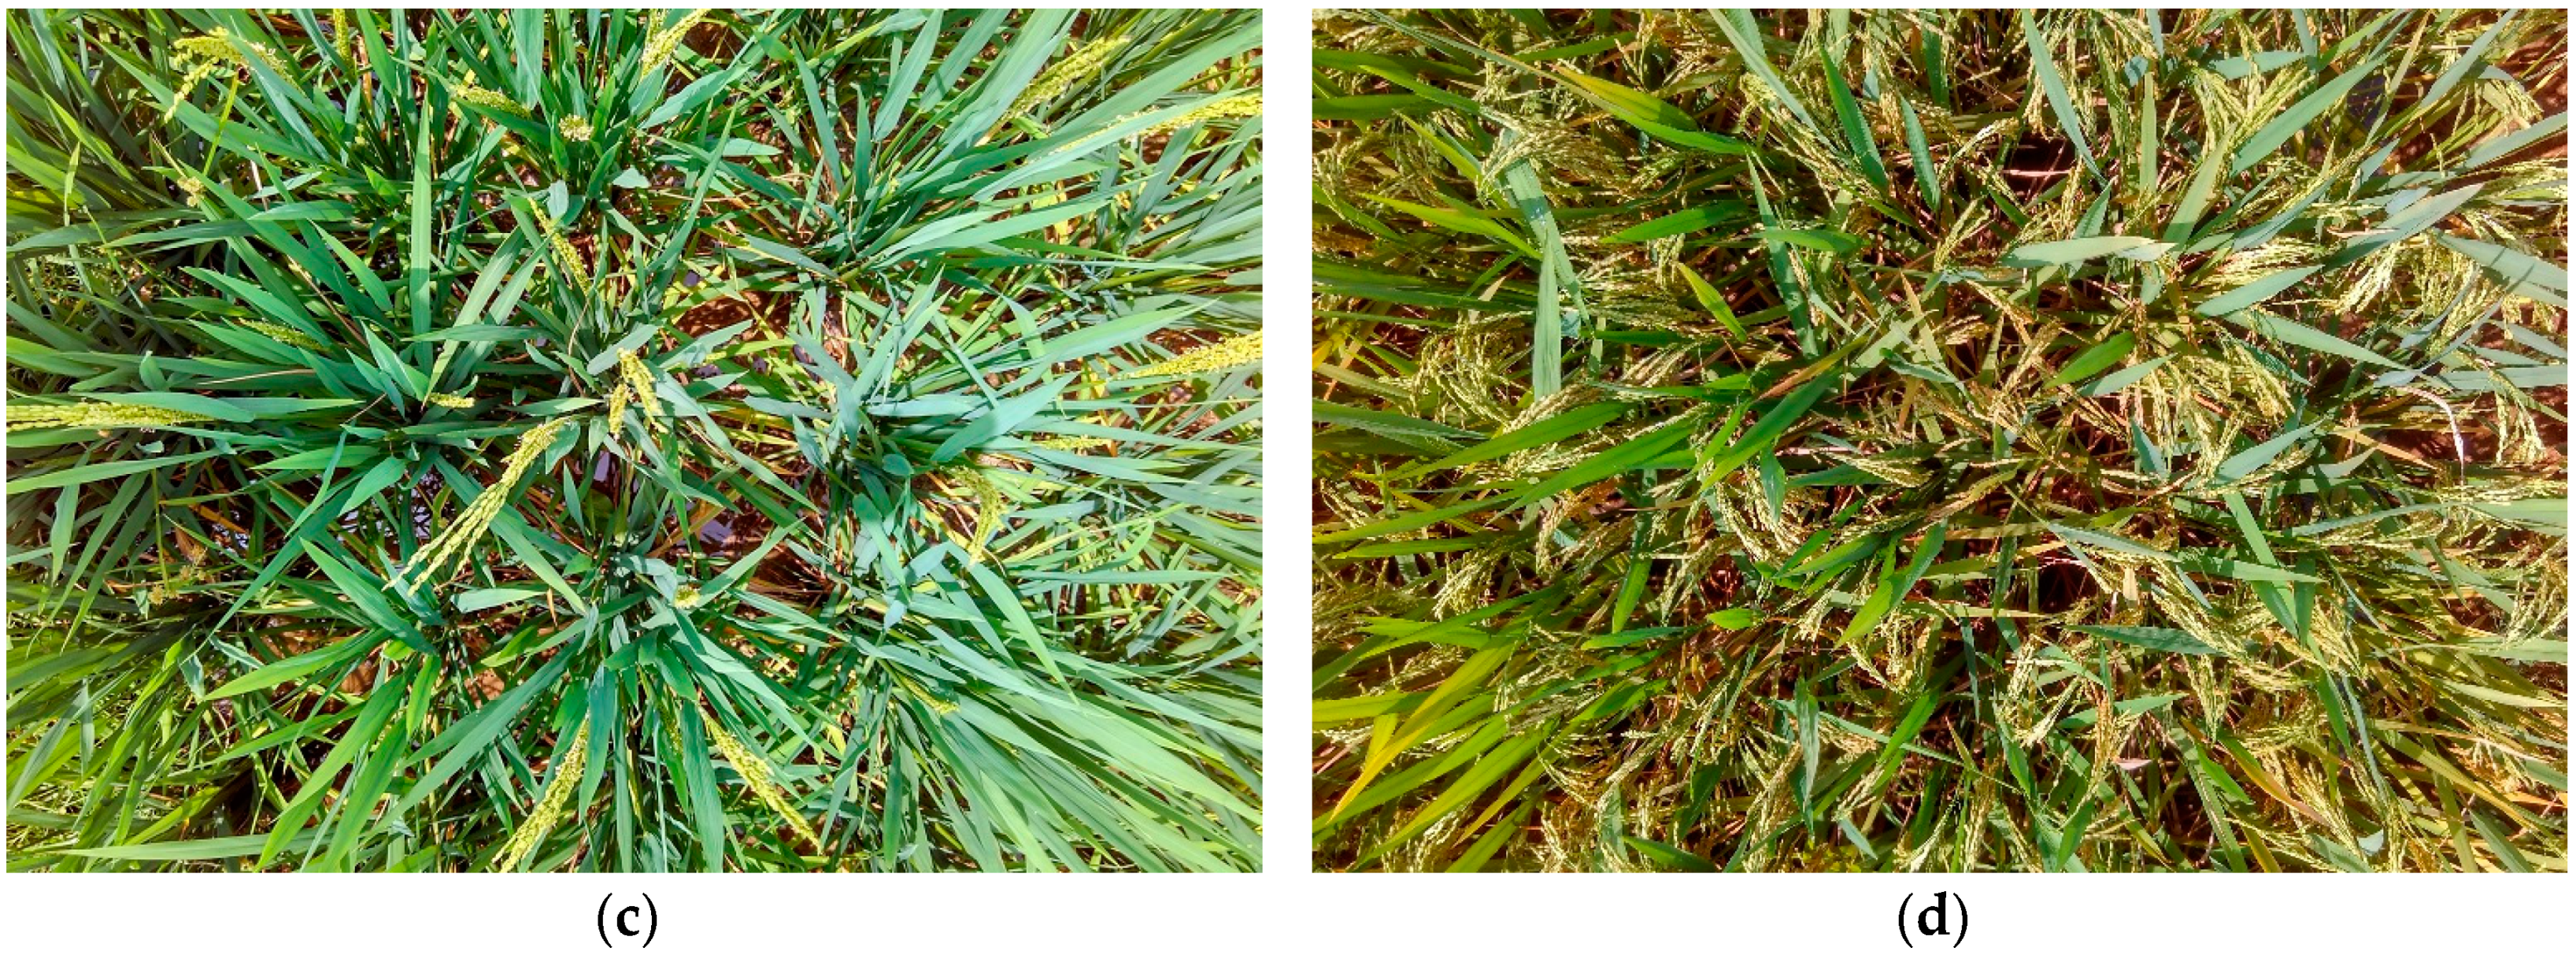
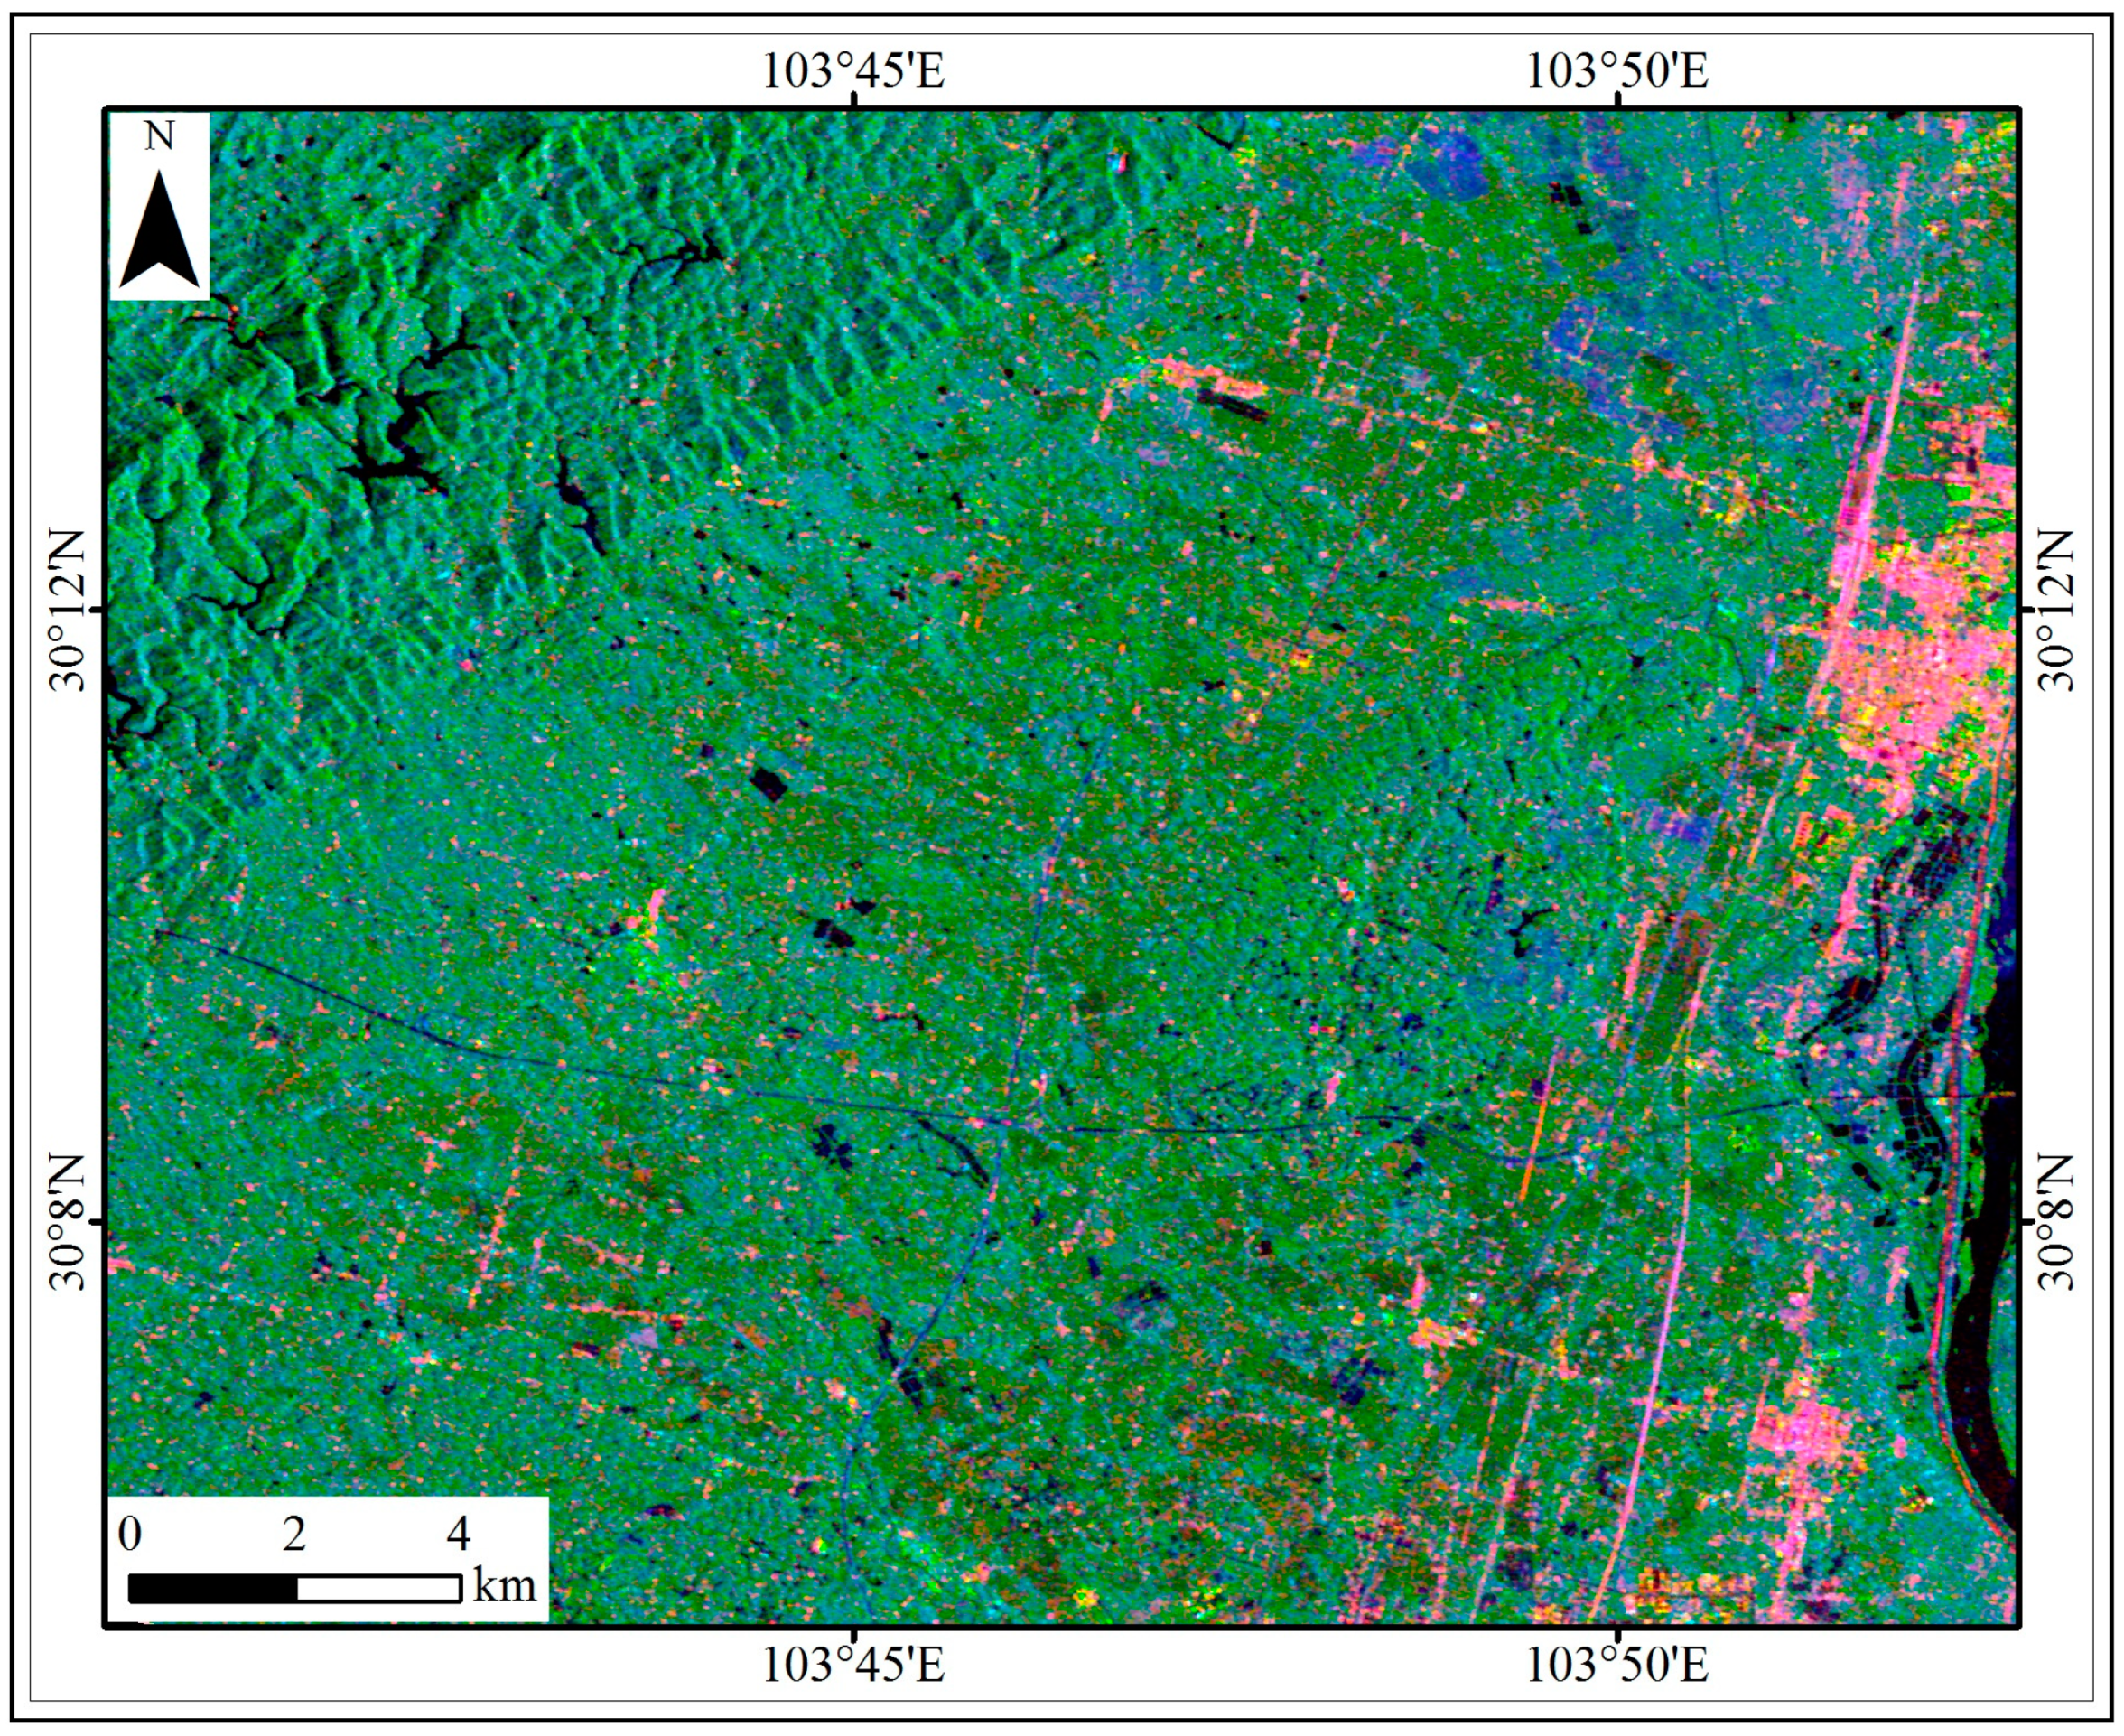
2.1. Study Area and In Situ Observation

Chengdu Plain is one of the major rice cultivation areas in China and is characterized by a subtropical monsoon climate and basin terrain, with cloudy and rainy weather from May to September. The study area is in the west of the plain, near Meishan City. Rice is usually farmed from May to August annually. Four field campaigns were completed simultaneously with the RADARSAT-2 observations from 15 May 2016 to 26 July 2016. The ground LAI measurements had the same time interval with the revisit period (24 days) of the RADARSAT-2. Thirty sample sites (50 m × 50 m each) within the study area were selected for in situ measurements, as seen in Figure 1.
The LI-COR LAI-2200 instrument was used to measure the LAI at each site. A 90° view-cap was used to mask the operator. All measured LAI values were called effective LAI, which computed LAI using the gap fraction of the canopy based on Beer’s law [39]. A hand-held Trimble GeoExplorer-2008 was used to record the GPS coordinates of the sample sites as well as 11 ground control points (GCPs). The GCPs were used to geo-reference the SAR images and in situ datasets. The cultivation management (transplanting time, planting density, and cultivar), field conditions (field water and weeds), and biophysical parameters (plant height, plant water content, size of leaves and stems, and number of tiller and ear) were recorded. Four principle phenological phases (i.e., transplanting, vegetative, reproductive, and maturity phases) were identified based on the BBCH scale [40] shown in Table 1.
Rice in the study area was grown under the transplanting procedure occurring mostly in early May and had about 19, 45, 16, and 30 days for the four principle phenological phases respectively. The four phases fell on the four dates of in situ observation, as shown in Figure 2.
Fields were under frequent weed control and inundated with water. The fields were then drained shortly before the harvest. Due to the differences in the timing of the transplanting, the rice varieties, and the selection and use of fertilization, the rice growth status varied at different sample sites. At the first fieldwork carried out on 15 May, rice fields in 67% of the sample sites were in the transplanting phase. On 8 June, all of the sites were in the vegetative phase. On 2 July, about 47% of the sample sites were in the reproductive phase. On the date of the final field trip (26 July), more than one-half of the fields were in the maturity phase.
The growth status of rice plants at the four phenological phases are shown in Figure 3. At the transplanting phase, rice plants were small and short. As rice entered the vegetative phase, the plant heights increased, and the number of leaves and stems accumulated. At the reproductive phase, new elements (tassels and ears) began to appear near the plant tops. With the grain ripeness and plant senescence, the geometry of the rice canopy became complicated at the maturity phase.

2.2. RADARSAT-2 Datasets and Polarimetric Parameters

Four RADARSAT-2 images were obtained on 15 May, 8 June, 2 July, and 26 July 2016. They are quad-polarized and single-look complex (SLC). The spatial resolution in the slant range and azimuth directions is 5.4 m × 7.9 m. The temporal resolution is 24 days. The four acquisition dates are coincidentally within the four principle phenology phases.
The RADARSAT-2 datasets were processed using the Sentinel Application Platform software (SNAP) (http://step.esa.int/main/download/). The analyses include radiometric correction, multi-looking, speckle filtering, and geometry reprojection. Multi-looking was implemented in the software with the ground range (GR) square pixel option selected, and the number of looks for azimuth and range direction is 2 and 1, respectively. A 3 × 3 Lee filter was utilized for speckle reduction. For geometry reprojection, Range-Doppler terrain correction was applied using Shuttle Radar Topography Mission (SRTM) 1 arcsec Digital Elevation Model (DEM), and the field measured GCPs were also used for precise geometry correction. The spatial resolution of the processed (ground) images is 10 m × 10 m. The monostatic antenna configuration of RADARSAT-2 gives approximately the same backscattering coefficients for HV and VH polarizations. Thus, only HH, HV, and VV data were used. The combinations of different polarized backscattering coefficients, such as ratios and radar vegetation index ( RVI σ , given by 8HV/(HH+VV+2HV)), were calculated because they were sensitive to the morphological structure change of rice plants [41,42].
The Cloude–Pottier and Freeman–Durden decomposition algorithms were performed using the polarimetric decomposition module of the SNAP software. The Cloude–Pottier algorithm decomposed the target coherence/covariance matrix of PolSAR data into eigenvectors and eigenvalues, from which the entropy (H), anisotropy (A), alpha (α), and radar vegetation index ( RVI CP ) were obtained [35]. H describes the dominance of the first-contributed scattering mechanism. A represents the power disparity between the second- and third-contributed scattering mechanisms. α is related to the type of the dominant scattering mechanism [43]. RVI CP measures the complexity and randomness of the vegetated area [10,29,44]. The Freeman–Durden algorithm modeled the coherence/covariance matrix as the contribution of three scattering components. The powers of the surface ( P S ), double-bounce ( P D ), and volume ( P V ) scatterings were obtained after the Freeman–Durden decomposition, as seen in Figure 4 [36], as well as the ratios of different scattering mechanism, and the radar vegetation index ( RVI FD , given by P V /( P S + P D + P V )) [45]. For vegetation area, surface scattering is the scatter from the ground. Double-bounce scattering describes the interaction between the plants and ground. Volume scattering comes from the plant canopy [37,46,47]. The derived images (backscatter and decomposition images) were registered and stacked. Because the processed images had a pixel size of 10 m × 10 m while each sample site was 50 m × 50 m, all pixels inside the sample site area were extracted and averaged.

2.3. Method of Data Analysis and Model Construction

The different transplanting dates of 30 rice sample sites resulted in various phenological phases on the SAR imaging dates. SAR variables obtained from the multi-temporal datasets associated with the ground measurements were regrouped into four collections corresponding to the four phenological phases. For each phase, the data were partitioned into the training dataset (3/4 of the total) and validation dataset (1/4). The training dataset was used in statistical analyses including data visualization, regression analysis, and model development. The validation dataset was used for the accuracy assessment of the model.
The multi-temporal polarimetric parameters and their combinations during the rice phenology succession were analyzed using boxplots. To better understand the time-varying responses of the polarimetric parameters to LAI, we conducted the regression analyses not only for the entire growth cycle but also under different phenological phases. For each phenological phase, the optimal relationship between rice LAI and each polarimetric parameter was identified according to the highest coefficient of determination (R2) of the linear, logarithmic, and exponential regression relationships. For the entire growth cycle, the polynomial (quadratic and cubic) regression fits were additionally performed considering the complicated variation of polarimetric parameters during the phenology sequence. The Statistical Product and Service Solutions (SPSS) software (https://www.ibm.com/analytics/spss-statistics-software) was used for the regression analyses. Regression models are expressed respectively as
L A I ( linear ) = b 0 + b 1 × S A R p a r a ,
L A I ( logarithmic ) = b 2 + b 3 × ln ( S A R p a r a ) ,
L A I ( exponential ) = b 4 × e ( b 5 × S A R p a r a ) ,
L A I ( polynomial-quadratic ) = b 6 + b 7 × S A R p a r a + b 8 × S A R p a r a 2 ,
L A I ( polynomial-cubic ) = b 9 + b 10 × S A R p a r a + b 11 × S A R p a r a 2 + b 12 × S A R p a r a 3 ,
where S A R p a r a is the polarimetric parameter. bi (i = 0, 1, …, 12) coefficients in the regression equations. Parameters with the strongest relationship of the rice LAI for the entire growth cycle were used to construct the inversion models. The difference between the modeled and measured LAI values was plotted and the linear regression analysis was conducted to quantify the relationship. The inversion accuracy was quantified by the Root Mean-Square Error (RMSE) using the validation dataset.

3. Results

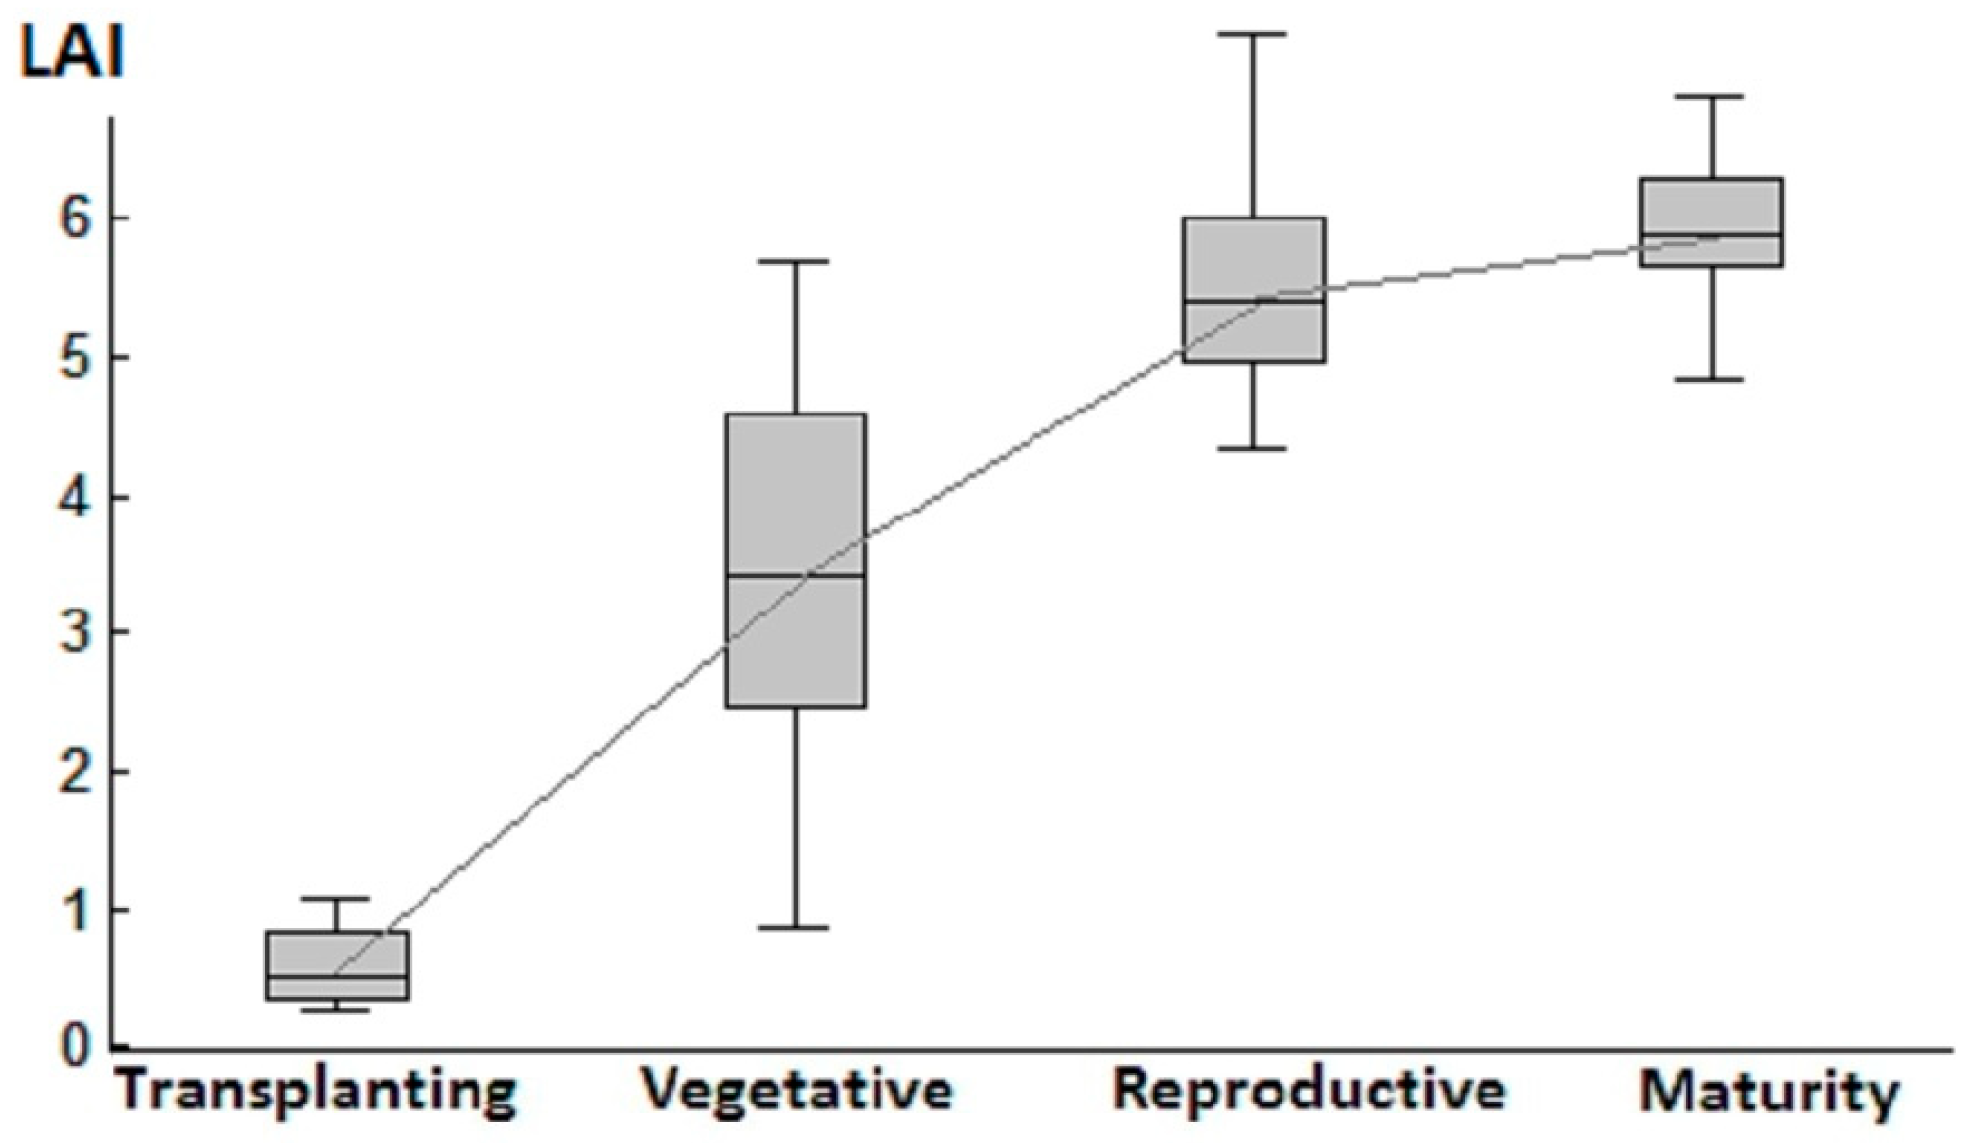
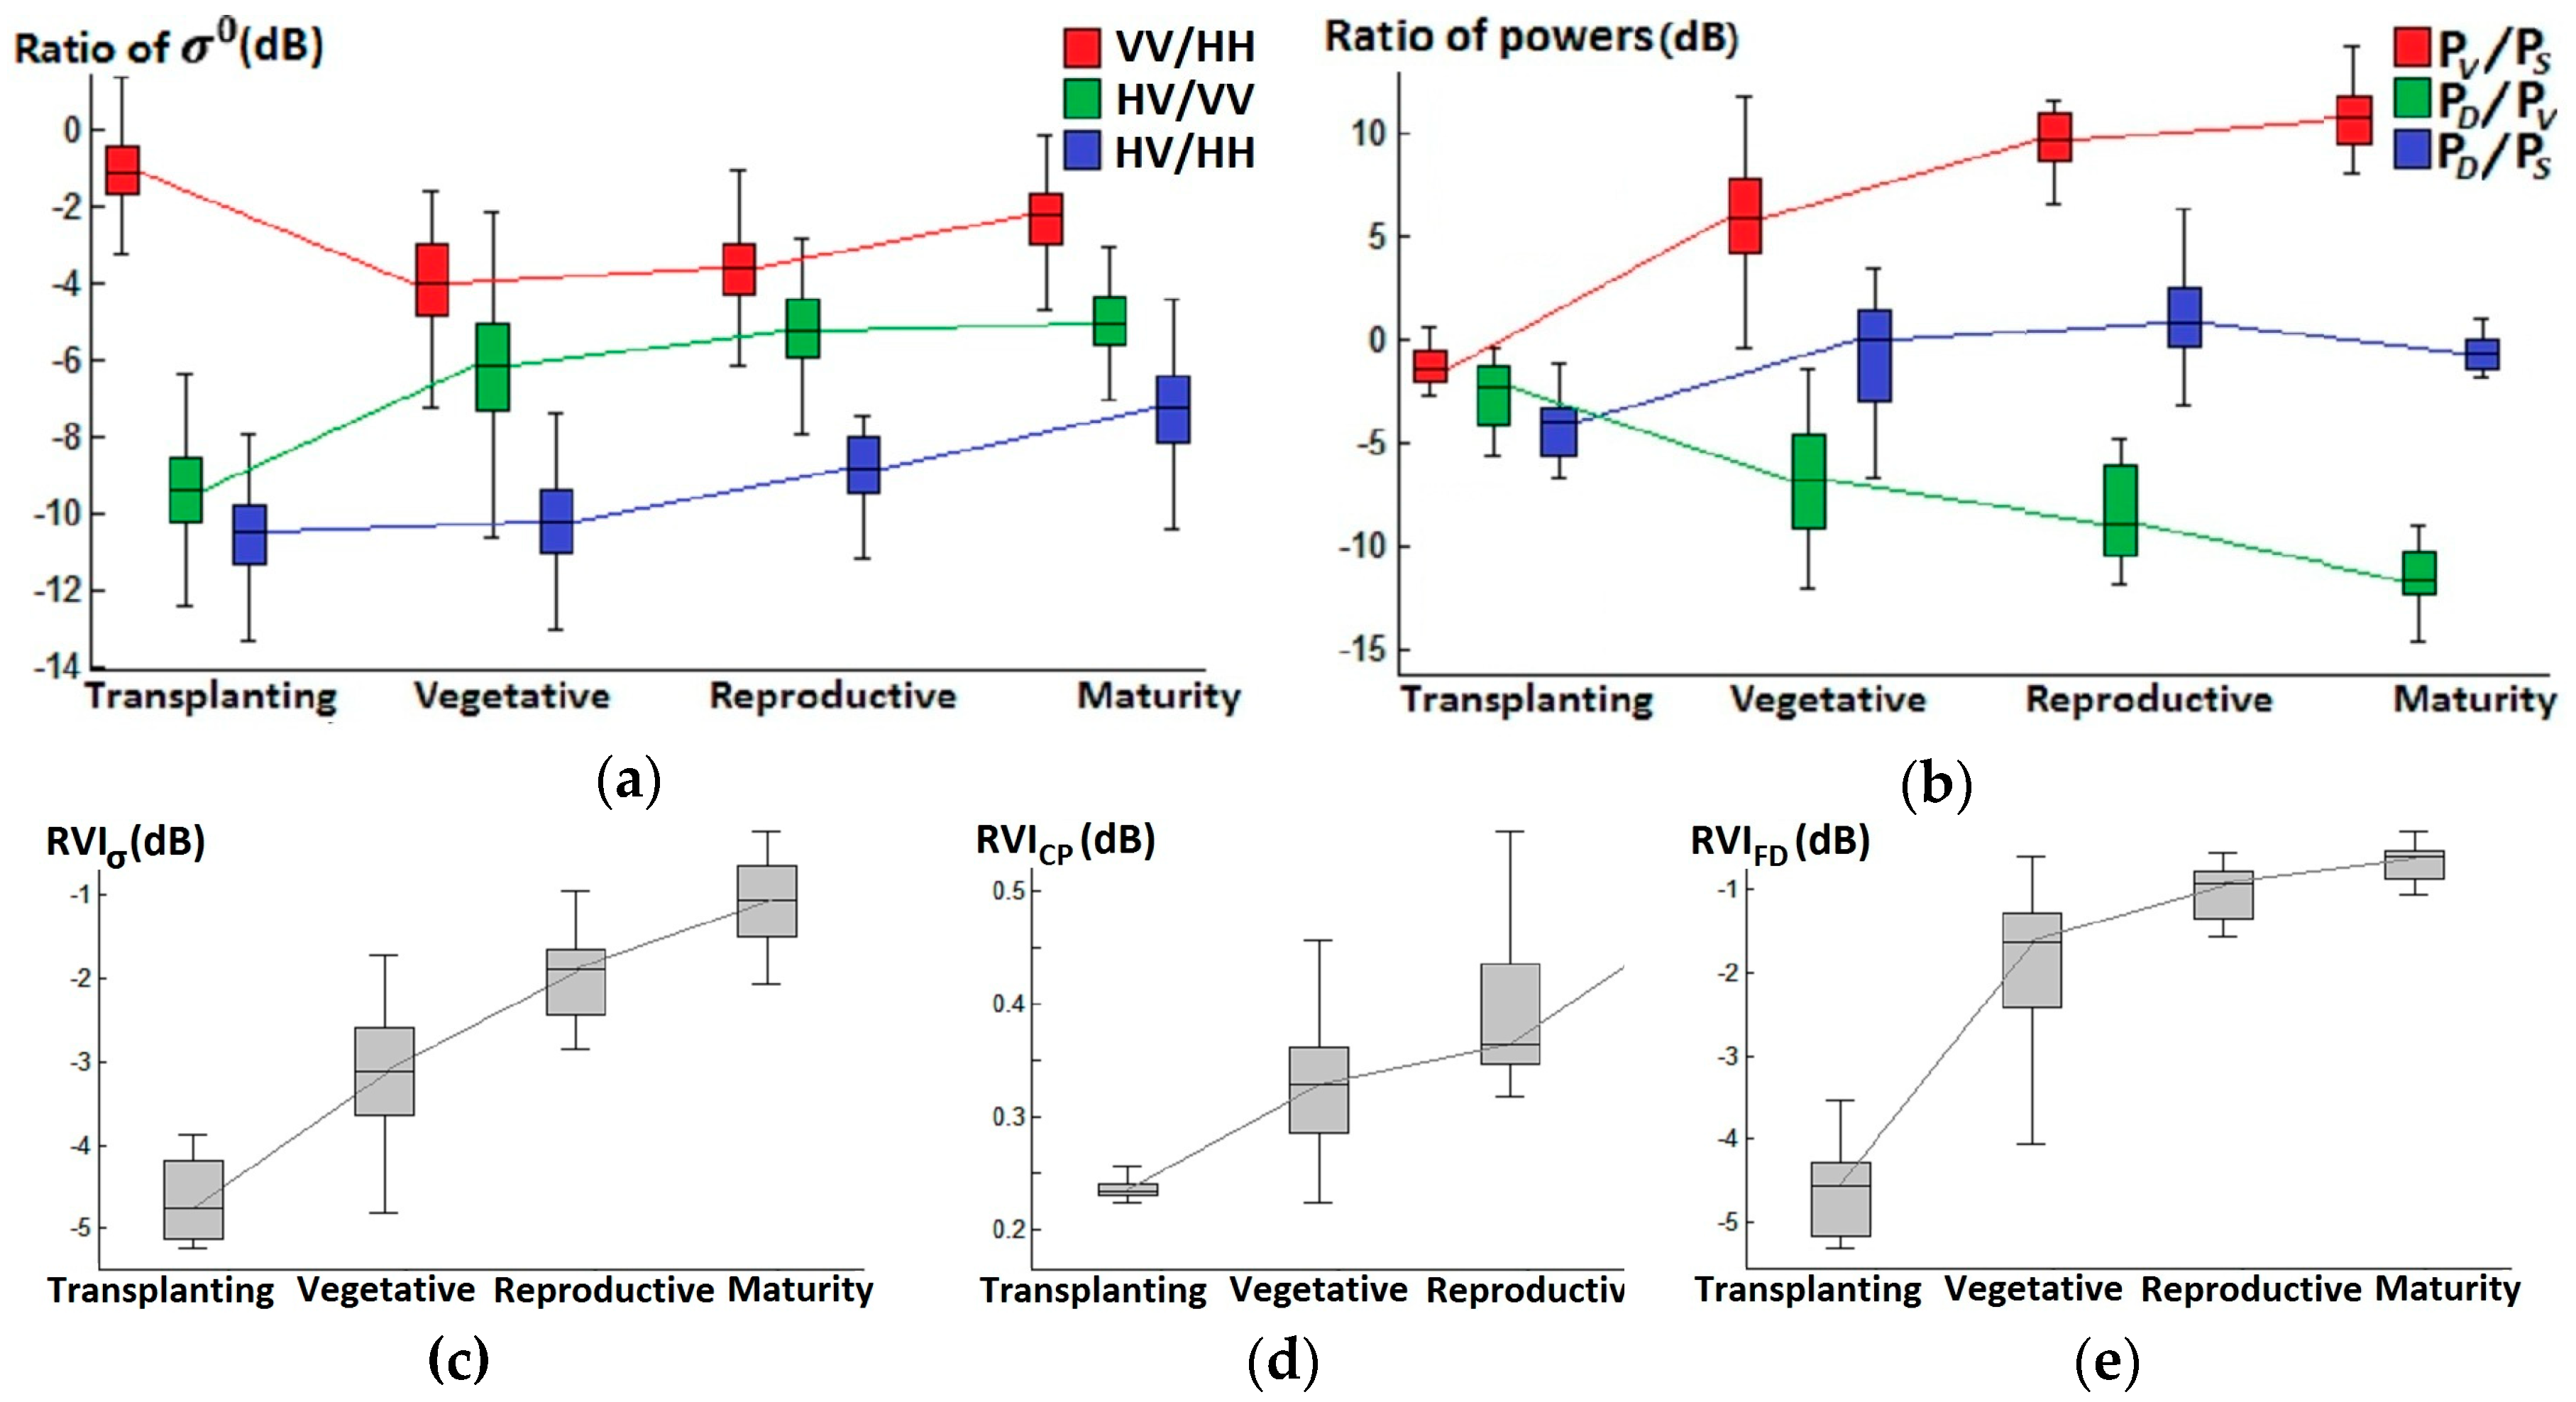
3.1. Phenological Variation of Ground Measured Rice LAI and Polarimetric SAR Variables

The succession of rice LAI (training dataset) of four phenological phases is shown in Figure 5. The ranges of LAI values at each phase were illustrated by the boxplots. The trend was illustrated with the connection of median values at four phases. The LAI increased monotonously during the growth cycle. In particular, from the transplanting to reproductive phases, a significant increase and narrow overlaps between phases were observed due to the rapid plant development and consequent increase of canopy density. As rice plants completed the vegetative growth and entered the reproductive phase, panicle (later rice heads) emerged from the flag leaf sheath then anthers appeared at the top of panicle. The basal leaves gradually turned yellow and withered when most of the spikelets completed flowering. The effect of canopy development on the LAI growth weakened since the growth of stems and leaves almost stopped. Thus, the increase rate significantly slowed after the reproductive phase.
Figure 6 shows the phenological variation of the basic polarimetric parameters (training dataset) obtained from the four SAR acquisitions. Different parameters should reflect the characteristics of plant morphological structure change. Some parameters were dominated by the same physical characteristics and consequently had similar phenological trends, such as HV and P V (increased monotonously), and HH and P D (peaked at vegetative phase then decreased). Among quad-polarized backscattering coefficients, HV backscatter had the lowest values (lower than −17 dB) and increased continuously with the phenology sequence. HH backscatter peaked at the vegetative phase (higher than −10 dB), then decreased gradually. VV backscatter had comparable amplitudes with HH backscatter and declined from the vegetative to reproductive phases. For the Cloude–Pottier decomposition parameters, the entropy (H) kept the values higher than 0.65 and consistently increased to 0.82, while the anisotropy (A) sharply dropped from 0.62 to 0.33. The alpha angle (α) climbed to the maximum (up to 55°) at the reproductive phase and was generally within an interval from 45° to 50° at the last three phases. As for the Freeman–Durden decomposition parameters, the volume scattering power ( P V ) rose from −11 to −6 dB during the growing cycle, while the surface scattering power ( P S ) fell significantly from −10 to −17 dB. The double-bounce scattering power ( P D ) increased slightly from the transplanting phase (−15.2 dB) to the vegetative phase (−14.8 dB) then slowly decreased to −18 dB at the maturity phase.
The ratios of the polarimetric parameters and radar vegetation indices ( RVI σ , RVI FD , and RVI CP ) are plotted in Figure 7. Monotonic trends were observed for most of the ratios, such as HV/HH and P D / P V . Radar vegetation indices derived from different algorithms responded positively to rice growth and showed similar trends.

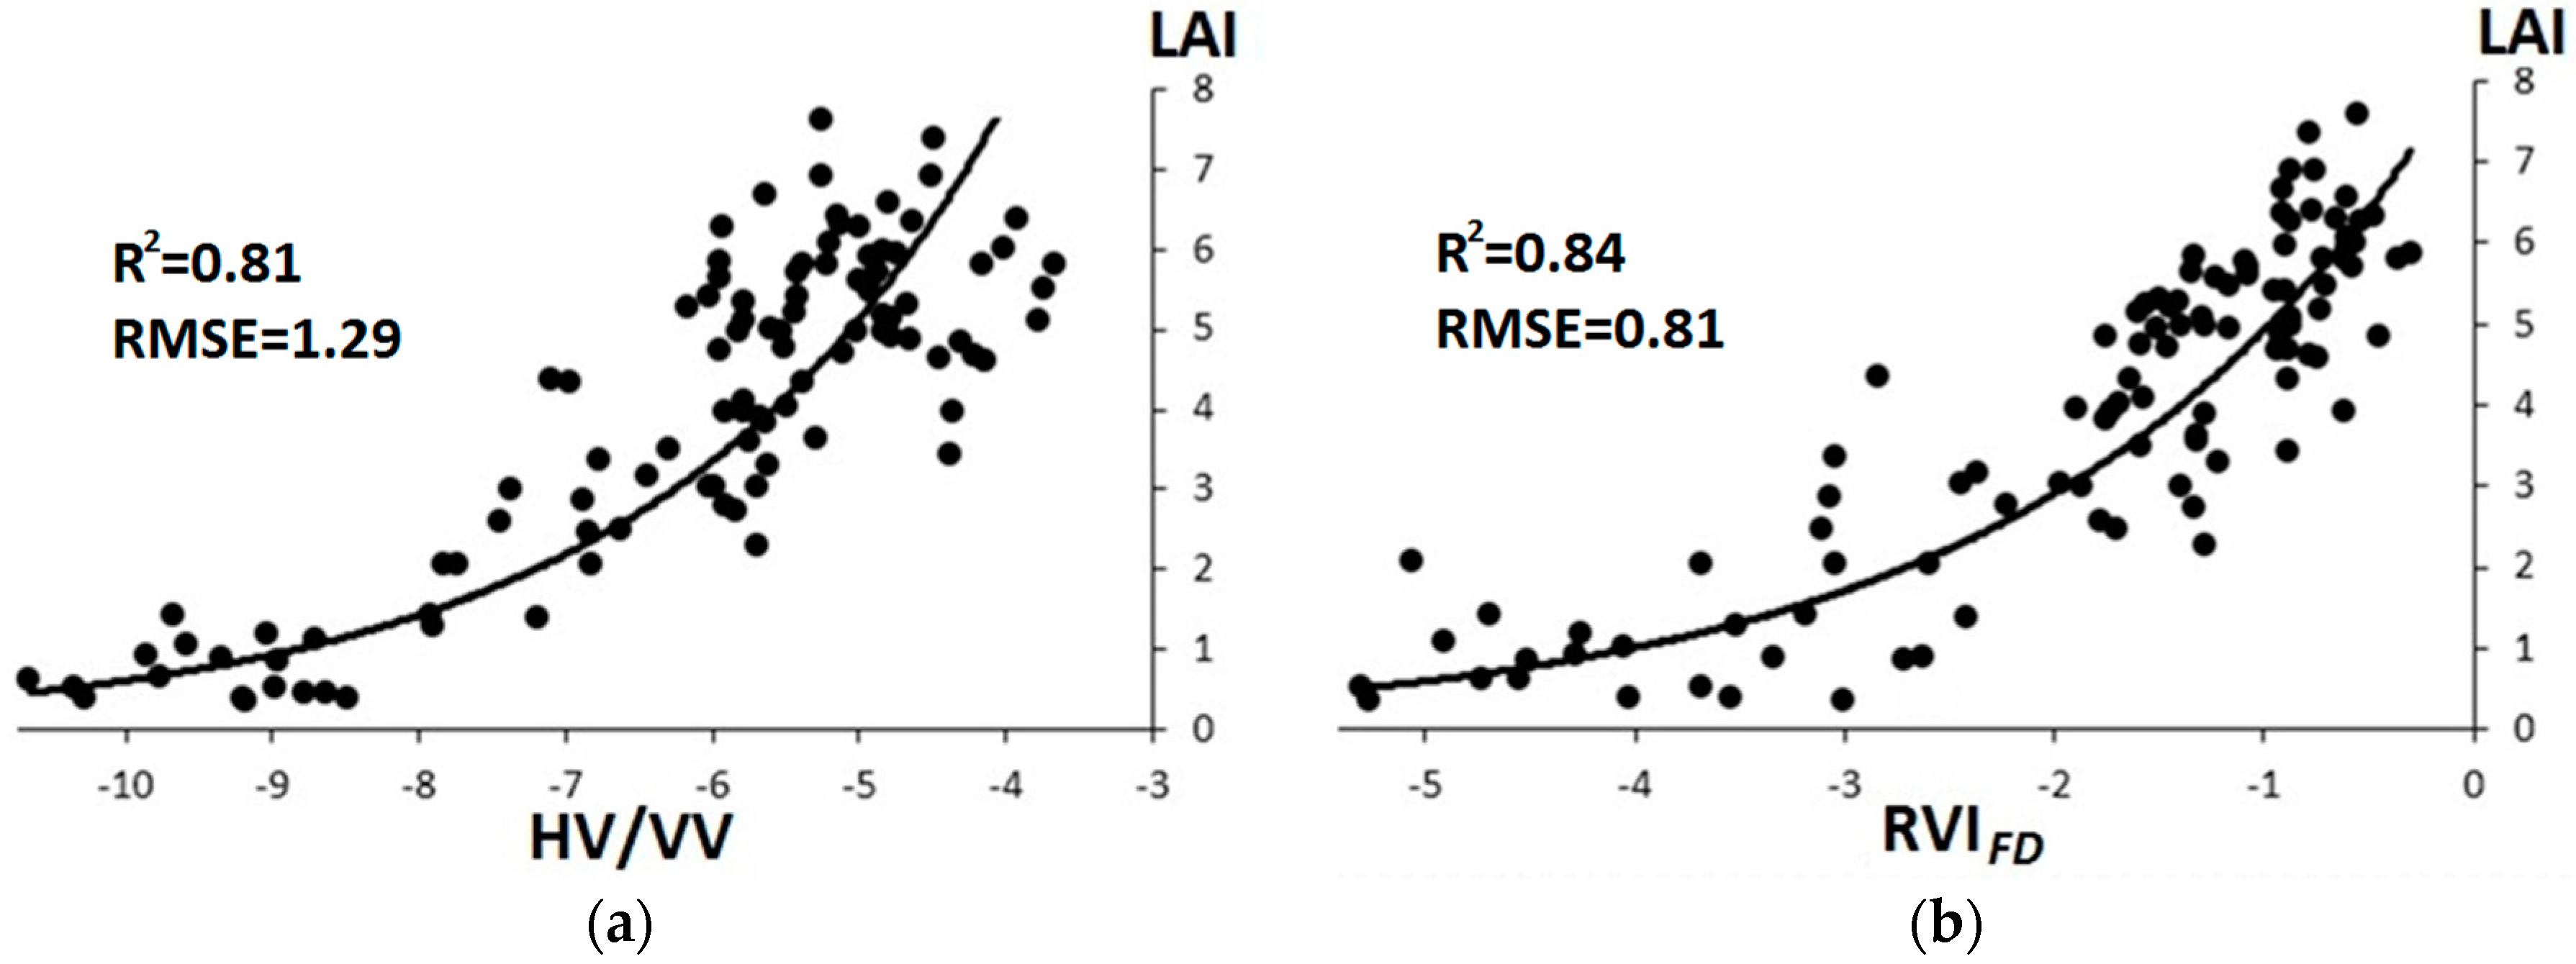
3.2. Regression Analyses between Rice LAI and Polarimetric Parameters

R2 values of regression analyses are summarized in Table 2. The numbers of samples (training dataset) used were 15, 42, 18, and 15, respectively, for the transplanting, vegetative, reproductive, and maturity phases. As shown in the table, for the entire growth cycle, several tested polarimetric parameters exhibited moderate relationships (R2 > 0.50) with the rice LAI, such as HV/VV, P V / P S , and RVIs. In comparison with the results obtained with the basic polarimetric parameters, the use of parameter combinations (ratios and radar vegetation indices) might achieve higher R2 values, suggesting that LAI was related to multiple scattering mechanisms produced by the complex physical structure of the scattering elements. Because rice LAI increased monotonously during the growth cycle, the ratios of two parameters that changed monotonously but moved inversely would enhance the sensitivity of SAR signatures to the biophysical development of rice plants, such as the P V / P S . Among all polarimetric descriptors, HV/VV and RVI FD data showed relatively strong relationships (R2 > 0.80).
For the four segmented phenological phases, the strongest relationships between polarimetric parameters and rice LAI were found at the vegetative phase, during which the HV/VV and RVI FD values were the most sensitive variables to the LAI variation, as evidenced by high R2 values (0.75 for the HV/VV data and 0.68 for RVI FD data). At the transplanting and reproductive phases, weak relationships (R2 < 0.30) were observed except for parameters such as HH and VV. At the maturity phase, polarimetric descriptors lost sensitivity for high LAI values having negligible relationships (R2 < 0.15).

3.3. Model Development and Validation

Because the HV/VV and RVI FD data were the most relevant to the rice LAI for the entire growth cycle, the scatterplots and trends of rice LAI (training dataset) as a function of these two parameters are shown in Figure 8. LAI increased exponentially as the HV/VV or RVI FD increased. In comparison with the RVI FD data, the HV/VV values were relatively dispersed for LAI higher than 5. Exponential equations of the best fits for the rice LAI and HV/VV or RVI FD were derived using the training dataset of all phenological phases and SPSS software. They were
L A I = 39.7 × e ( 0.41 × H V / V V ) ,   R 2 = 0.81
L A I = 8.8 × e ( 0.55 × R V I F D ) ,   R 2 = 0.84
On the basis of the validation dataset, the modeling RMSE was 1.29 for (6) and 0.81 for (7).
Modeled and measured rice LAIs are plotted (validation dataset) in Figure 9. Overestimates appeared using both models during the seedling period, when ground observed values ranged from 0 to 2. The heterogeneity of water depth and soil roughness could deteriorate the relationship between the rice LAI and polarimetric parameters [25]. Uncertainty might occur for the models when the ground observed LAI shows a saturation near 5. The leaf density of rice canopy peaked in this period. The plant moisture content, seed plumpness, and the randomness of plant canopy gradually changed and affected the SAR backscatter.
In a comparison of both models, the RVI FD -based model offered promising results with a small RMSE of 0.81 and the ability to estimate LAI at high values well. Intuitively, the RVI FD was the most suitable index for the rice LAI inversion. Possible causes for the best performance included that RVI FD was calculated as P V /( P S + P D + P V ). The development of rice canopy led to a continuous increase in P V while ( P S + P D + P V ) integrated the signal from all polarizations and reflected the total power scattered from the rice fields.
The HV/VV-based model had a slightly larger RMSE of 1.29 in the rice LAI estimation. The increase in error in comparison with the RMSE for the RVI FD -based model was probably due to the fact that only amplitude information of the SAR data was considered. Without the polarimetric phase difference information that relates to the physical structure and dielectric properties of the underlying surface and vegetation components, the complex microwave scattering process could not be adequately revealed by the amplitude data alone. Nevertheless, HV/VV is a suitable alternative to RVI FD for monitoring the rice LAI because dual-polarization SAR data such as the Sentinel-1 SAR are widely-accessible.

4. Discussion

The changes in quantity, geometry, and distribution of leaves, stems, and ears had significant effects on the SAR backscatter. The responses of backscattering coefficients and decomposition parameters to the rice plant growth were further interpreted. At the transplanting phase, rice plants were sparsely distributed in the fields, with the measured LAI ranged from 0.35 to 1.42. The water in the fields resulted in strong surface scattering, and the backscatter characteristics of rice fields were mainly affected by the water [48]. In this period, VV backscatter was moderate, with −13 dB on the average. HV backscatter was low and with −22 dB on the average. HH backscatter started at relatively low values, with an average of −11.5 dB as shown in Figure 6a. Moderate entropy (about 0.68) and anisotropy (about 0.62) are observed in Figure 6b, indicating two strong scattering components existed [49]. Due to the small rice plants, the amount of scattering attenuation was small. The median value of the alpha angle was ~38°, suggesting that the surface scattering contributed significantly to the total backscatter [49,50]. The strong surface scattering power (−10 dB on average) and weak double-bounce scattering (−15 dB on average) supported this assessment, as seen in Figure 6c. The sparse rice canopy also resulted in relatively weak volume scattering (−11 dB on average), which predicted low HV backscatter values [34]. Strong surface scattering contributed to moderate VV values [51]. Weak double-bounce scattering resulted in low HH values [49,50]. The weak relationship between polarimetric parameters and rice LAI at transplanting phase was mainly due to the disturbance caused by the diversity of field conditions such as field water depth and soil roughness.
At the vegetative phase, the measured rice LAI had a 0.87–5.81 range. The wide range of LAI values implied the marked temporal and spatial variation of rice vegetative growth. As the plants grew, HV backscatter increased by 3 dB, as seen in Figure 6a. HH backscatter increased by 3.5 dB due to the increase in the plant size. As a result, volume scattering and double-bounce scattering increased, as seen in Figure 6c. VV backscatter increased slightly by ~0.4 dB because it was attenuated by the strong extinction caused by the vertical orientated stems and leaves as well as possibly the Brewster angle effect [18,49,52]. The alpha angle was mostly within an interval from 44° to 48°, even reaching 52°, together with increased entropy and decreased anisotropy, as seen in Figure 6b. Lopez-Sanchez et al. [49,50] and Koppe et al. [52] attributed these to the presence of adequate double-bounce scattering, which was on par with the surface scattering. At the vegetative phase, the radar signal responded to the accumulation of leaves and stems, resulting in the moderate to high relationships (R2 > 0.50) for several parameters (e.g., HV/VV, P V / P S , and RVI FD ). For most of the polarimetric parameters, the R2 value at the vegetative phase had the dominant influence on the overall R2. One reason was that the radar signal responded clearly to the obvious biophysical changes of rice plants in this period. In addition, the vegetative phase not only went through from the tillering stage to the booting stage but also was the longest phenological phase (almost accounted for one-half of a growth cycle). Thus, there were a greater number of LAI measurements for the vegetative phase within a long time span.
At the reproductive phase, rice completed its vegetative growth, and the LAI ranged from 4.33 to 7.59. Emerged tassels and ears were new scatterers in the upper portion of the canopy. A slight increase (about 0.5 dB) was observed in the HV backscatter, as seen in Figure 6a. The dense canopy attenuated the microwave energy penetrated the plants and bounced off the ground, as seen in Figure 6c [53]. Accordingly, HH backscatter decreased by 1.5 dB. The predominantly vertical orientation of most of the stems and leaves led to the attenuation in the VV polarization. The alpha angle increased, to a maximum of 55°, and the median value of anisotropy fell to 0.35 (Figure 6b), indicating an enhancement of volume scattering along with the rice phenology advancement. The weak relationship between LAI and the polarimetric parameters this time mainly suffered from a saturation trend of LAI values. Rice ears and the changes in plant structure and moisture were attributed to the polarimetric parameter variation. The relationship between LAI and the polarimetric parameters was less straightforward.
At the maturity phase, the rice LAI ranged from 4.84 to 6.92. The augmentation of rice grain produced strong backscattering, which contributed to the increase (about 1 dB) in HV backscatter, as shown in Figure 6a. HH backscatter further decreased by almost 0.5 dB. The reduction was mainly due to a large amount of rice canopy attenuation. The orientation of the plants became random and the moisture content of the plants reduced. Therefore, less attenuation occurred in the VV polarization [52]. High entropy (0.82 on average) and low anisotropy (0.33 on average) denoted the almost random volume structure of the rice plants, as seen in Figure 6b. The dominant scattering mechanism transformed into volume scattering (Figure 6c). Despite the attenuation caused by the dense canopy, the C-band RADARSAT-2 microwave energy could still penetrate the rice plants and reveal the changing information, while the LAI reached saturation. Therefore, the dependence of the polarimetric parameters on the LAI was further weakened.
Although the relationships of the rice LAI to RVI FD and HV/VV were empirically established, uncertainty remained during the rice-growing cycle. The uncertainty could be attributed to the diversity of the cultivation management and field circumstances [54]. To improve the predictive accuracy, physical model should be used to elucidate the effects of plant and field properties on the polarimetric parameters [29,55].

5. Conclusions

We estimated the LAI of rice using the multi-temporal quad-polarized RADARSAT-2 datasets. Polarimetric parameters including backscattering coefficients, the Cloude–Pottier and Freeman–Durden decomposition parameters, and their combinations were analyzed. The relationship between the rice LAI and polarimetric parameters as well as the phenology evolution was explored. HV/VV and RVI FD showed strong relationships (R2 > 0.80) with the rice LAI for the entire growth cycle. Both were used to develop two empirical models, respectively. The strongest relationship (R2 = 0.84) and lowest error (RMSE = 0.81) were achieved when the RVI FD was used in the modeling. The model was simple but had satisfactory results in the rice LAI inversion. The HV/VV-based model had a slightly lower estimation accuracy (RMSE = 1.29) but could be a practical alternative considering that fully polarimetric data is expensive. Thus, it should be possible to assess rice LAI timely using multi-temporal C-band PolSAR datasets.

Author Contributions

Conceptualization, Z.H. and S.L.; methodology, Z.H. and S.L.; validation, Z.H., Y.H. and F.C.; formal analysis, Z.H.; investigation, Z.H. and S.L.; resources, S.L.; data curation, Z.H.; writing—original draft preparation, Z.H. and S.L.; writing—consulting, review, and editing and revision, Y.W.; visualization, Z.H.; supervision, S.L.; project administration, S.L.; funding acquisition, S.L.

Funding

This research was funded by the National Natural Science Foundation of China, grant number 41871247, and the National Key R&D Program of China, grant number 2018YFD0200301.

Conflicts of Interest

The authors declare no conflict of interest. The funders had no role in the design of the study; in the collection, analyses, or interpretation of data; in the writing of the manuscript, or in the decision to publish the results.

References

  1. Chen, C.; Son, N.T.; Chang, L. Monitoring of rice cropping intensity in the upper Mekong Delta, Vietnam using time-series MODIS data. Adv. Space Res. 2012, 49, 292–301. [Google Scholar] [CrossRef]
  2. Chen, J.M.; Black, T.A. Defining leaf area index for non-flat leaves. Plant Cell Environ. 1992, 15, 421–429. [Google Scholar] [CrossRef]
  3. Quan, X.; He, B.; Yebra, M.; Yin, C.; Liao, Z.; Zhang, X. A radiative transfer model-based method for the estimation of grassland aboveground biomass. Int. J. Appl. Earth Obs. Geoinf. 2017, 54, 159–168. [Google Scholar] [CrossRef]
  4. Demarez, V.; Duthoit, S.; Baret, F.; Weiss, M.; Dedieu, G. Estimation of leaf area and clumping indexes of crops with hemispherical photographs. Agric. Forest Meteorol. 2008, 148, 644–655. [Google Scholar] [CrossRef]
  5. Zeng, Y.; Li, J.; Liu, Q.; Hu, R.; Mu, X.; Fan, W.; Xu, B.; Yin, G.; Wu, S. Extracting Leaf Area Index by Sunlit Foliage Component from Downward-Looking Digital Photography under Clear-Sky Conditions. Remote Sens. 2015, 7, 13410. [Google Scholar] [CrossRef]
  6. Tang, H.; Brolly, M.; Zhao, F.; Strahler, A.H.; Schaaf, C.L.; Ganguly, S.; Dubayah, R. Deriving and validating Leaf Area Index (LAI) at multiple spatial scales through Lidar remote sensing: A case study in Sierra National Forest, CA. Remote Sens. Environ. 2014, 143, 131–141. [Google Scholar] [CrossRef]
  7. Zeng, Y.; Li, J.; Liu, Q.; Qu, Y.; Huete, A.R.; Xu, B.; Yin, G.; Zhao, J. An Optimal Sampling Design for Observing and Validating Long-Term Leaf Area Index with Temporal Variations in Spatial Heterogeneities. Remote Sens. 2015, 7, 1300–1319. [Google Scholar] [CrossRef]
  8. Hosseini, M.; McNairn, H.; MerzouKi, A.; PacHeco, A. Estimation of Leaf Area Index (LAI) in corn and soybeans using multi-polarization C- and L-band radar data. Remote Sens. Environ. 2015, 170, 77–89. [Google Scholar] [CrossRef]
  9. Mulla, d.J. Twenty five years of remote sensing in precision agriculture: Key advances and remaining knowledge gaps. Biosyst. Eng. 2013, 114, 358–371. [Google Scholar] [CrossRef]
  10. Manninen, T.; Stenberg, P.; Rautiainen, M.; Voipio, P.; Smolander, H. Leaf area index estimation of boreal forest using ENVISAT ASAR. IEEE Trans. Geosci. Remote Sens. 2005, 43, 2627–2635. [Google Scholar] [CrossRef]
  11. He, B.B.; Quan, X.W.; Xing, M.F. Retrieval of leaf area index in alpine wetlands using a two-layer canopy reflectance model. Int. J. Appl. Earth Obs. Geoinf. 2013, 21, 78–91. [Google Scholar] [CrossRef]
  12. Quan, X.; He, B.; Li, X. A Bayesian network-based method to alleviate the ill-posed inverse problem: A case study on leaf area index and canopy water content retrieval. IEEE Trans. Geosci. Remote Sens. 2015, 53, 6507–6517. [Google Scholar] [CrossRef]
  13. Wu, M.; Zhang, X.; Huang, W.; Niu, Z.; Wang, C.; Li, W.; Hao, P. Reconstruction of daily 30 m data from HJ CCD, GF-1 WFV, Landsat, and MODIS data for crop monitoring. Remote Sens. 2015, 7, 16293–16314. [Google Scholar] [CrossRef]
  14. Wu, M.; Yang, C.; Song, X.; Hoffmann, W.C.; Huang, W.; Niu, Z.; Wang, C.; Li, W.; Yu, B. Monitoring cotton root rot by synthetic sentinel-2 NDVI time series using improved spatial and temporal data fusion. Sci. Rep. 2018, 8, 2016. [Google Scholar] [CrossRef] [PubMed]
  15. Li, S.; Xiao, J.; Ni, P.; Zhang, J.; Wang, H.; Wang, J. Monitoring paddy rice phenology using time series MODIS data over Jiangxi Province, China. Int. J. Agric. Biol. Eng. 2014, 7, 28–36. [Google Scholar] [CrossRef]
  16. Li, S.; Ni, P.; Cui, G.; He, P.; Liu, H.; Li, L.; Liang, Z. Estimation of rice biophysical parameters using multitemporal RADARSAT-2 images. In Proceedings of the Symposium of the International Society for Digital Earth (ISDE), Halifax, NS, Canada, 5–9 October 2015; p. 012019. [Google Scholar]
  17. Ahmadian, N.; Borg, E.; Roth, A.; Zölitz, R. Estimating the Leaf Area Index of Agricultural Crops using multi-temporal dual-polarimetric TerraSAR-X Data: A case study in North-Eastern Germany. Photogramm. Fernerkun. 2016, 2016, 301–317. [Google Scholar] [CrossRef]
  18. Chen, J.; Lin, H.; Huang, C.; Fang, C. The relationship between the leaf area index (LAI) of rice and the C-band SAR vertical/horizontal (VV/HH) polarization ratio. Int. J. Remote Sens. 2009, 30, 2149–2154. [Google Scholar] [CrossRef]
  19. Asilo, S.; Nelson, A.; de Bie, K.; Skidmore, A.; Laborte, A.; Maunahan, A.; Quilang, E.J.P. Relating X-band SAR backscattering to leaf area index of rice in different phenological phases. Remote Sens. 2019, 11, 1462. [Google Scholar] [CrossRef]
  20. Suga, Y.; Konishi, T. Rice crop monitoring using X, C and L band SAR data. In Remote Sensing for Agriculture, Ecosystems, and Hydrology X, Proceedings of SPIE, Cardiff, Wales, UK, 16–18 September 2008; International Society for Optics and Photonics: Bellingham, DC, USA, 2008; p. 710410. [Google Scholar]
  21. Jiao, X.; Mcnairn, H.; Shang, J.; Pattey, E.; Liu, J.; Champagne, C. The sensitivity of RADARSAT-2 polarimetric SAR data to corn and soybean leaf area index. Can. J. Remote Sens. 2011, 37, 69–81. [Google Scholar] [CrossRef]
  22. Leonard, A.; Beriaux, E.; Pierre, D. Complementarity of linear polarizations in C-band SAR imagery to estimate leaf area index for maize and winter wheat. In ESA Living Planet Symposium 2013, Proceedings of European Space Agency (ESA), Edinburgh, UK, 9–13 September 2013; Esa Communications Ltd.: Oakville, ON, Canada, 2013; p. 722. [Google Scholar]
  23. Cable, J.; Kovacs, J.; Shang, J.; Jiao, X. Multi-temporal polarimetric RADARSAT-2 for land cover monitoring in northeastern Ontario, Canada. Remote Sens. 2014, 6, 2372–2392. [Google Scholar] [CrossRef]
  24. He, Z.; Li, S.; Wang, Y.; Dai, L.; Lin, S. Monitoring Rice Phenology Based on Backscattering Characteristics of Multi-Temporal RADARSAT-2 Datasets. Remote Sens. 2018, 10, 340. [Google Scholar] [CrossRef] [Green Version]
  25. Hirooka, Y.; Homma, K.; Maki, M.; Sekiguchi, K. Applicability of synthetic aperture radar (SAR) to evaluate leaf area index (LAI) and its growth rate of rice in farmers’ fields in Lao PDR. Field Crop Res. 2015, 176, 119–122. [Google Scholar] [CrossRef] [Green Version]
  26. Kim, Y.; Jackson, t.; Bindlish, R.; Lee, H.; Hong, C. Monitoring soybean growth using L-, C-, and X-band scatterometer data. J. Appl. Remote Sens. 2013, 34, 4069–4082. [Google Scholar] [CrossRef]
  27. Paloscia, S. An empirical approach to estimating leaf area index from multifrequency SAR data. Int. J. Remote Sens. 1998, 19, 359–364. [Google Scholar] [CrossRef]
  28. Baghdadi, N.N.; Hajj, M.E.; Zribi, M.; Fayad, I. Coupling SAR C-band and optical data for soil moisture and leaf area index retrieval over irrigated grasslands. IEEE J. Sel. Top. Appl. Earth Observ. Remote Sens. 2016, 9, 1229–1243. [Google Scholar] [CrossRef] [Green Version]
  29. Kumar, V.; Mamta, K.; Sudip, K.S. Leaf area index estimation of lowland rice using semi-empirical backscattering model. J. Appl. Remote Sens. 2013, 7, 447–456. [Google Scholar] [CrossRef]
  30. Inoue, Y.; Sakaiya, E.; Wang, C. Capability of C-band backscattering coefficients from high-resolution satellite SAR sensors to assess biophysical variables in paddy rice. Remote Sens. Environ. 2014, 140, 257–266. [Google Scholar] [CrossRef]
  31. Yang, S.; Zhao, X.; Li, B.; Hua, G. Interpreting RADARSAT-2 quad-polarization SAR signatures from rice paddy based on experiments. IEEE Geosci. Remote Sens. Lett. 2012, 9, 65–69. [Google Scholar] [CrossRef]
  32. Lin, H.; Chen, J.; Pei, Z.; Zhang, S.; Hu, X. Monitoring sugarcane growth using ENVISAT ASAR data. IEEE Trans. Geosci. Remote Sens. 2009, 47, 2572–2580. [Google Scholar] [CrossRef]
  33. Adams, J.R.; Rowlandson, T.L.; Mckeown, S.J.; Berg, A.A.; Mcnairn, H.; Sweeney, S.J. Evaluating the Cloude-Pottier and Freeman-Durden scattering decompositions for distinguishing between unharvested and post-harvest agricultural fields. Can. J. Remote Sens. 2014, 39, 318–327. [Google Scholar] [CrossRef]
  34. Cable, J.; Kovacs, J.; Jiao, X.; Shang, J. Agricultural monitoring in northeastern Ontario, Canada, using multi-temporal polarimetric RADARSAT-2 data. Remote Sens. 2014, 6, 2343–2371. [Google Scholar] [CrossRef] [Green Version]
  35. Cloude, S.R.; Pottier, E. An entropy based classification scheme for land applications of polarimetric SAR. IEEE Trans. Geosci. Remote Sens. 1997, 35, 68–78. [Google Scholar] [CrossRef]
  36. Freeman, A.; Durden, S.L. A Three-Component Scattering Model for Polarimetric SAR Data. IEEE Trans. Geosci. Remote Sens. 1998, 36, 963–973. [Google Scholar] [CrossRef] [Green Version]
  37. Zhang, L.; Guo, H.; Li, X. Simulation analysis on the relationship between the leaf area index and polarimetric parameters of crops. Int. J. Digit. Earth 2012, 5, 319–337. [Google Scholar] [CrossRef]
  38. Francis, C.; Richard, F. ALOS PALSAR L-band polarimetric SAR data and in situ measurements for leaf area index assessment. Remote Sens. Lett. 2012, 3, 221–229. [Google Scholar] [CrossRef]
  39. Manninen, T.; Stenberg, P.; Rautiainen, M.; Voipio, P. Leaf area index estimation of boreal and subarctic forests using VV/HH ENVISAT/ASAR data of various swaths. IEEE Trans. Geosci. Remote Sens. 2013, 51, 3899–3909. [Google Scholar] [CrossRef]
  40. Zadoks, J.C.; Chang, T.T.; Konzak, C.F. A decimal code for the growth stages of cereals. Weed Res. 1974, 14, 415–421. [Google Scholar] [CrossRef]
  41. Kim, Y.; Jackson, T.; Bindlish, R.; Lee, H.; Hong, S. Radar vegetation index for estimating the vegetation water content of rice and soybean. IEEE Geosci. Remote Sens. Lett. 2012, 9, 564–568. [Google Scholar] [CrossRef]
  42. Francis, C.; Shang, J.; Liu, J.; Huang, X.; Ma, B.; Jiao, X.; Geng, X.; John, M.K.; Dan, W. Tracking crop phenological development using multi-temporal polarimetric Radarsat-2 data. Remote Sens. Environ. 2017, 210, 508–518. [Google Scholar] [CrossRef]
  43. Pacheco, A.; McNairn, H.; Li, Y.; Lampropoulos, G.; Powers, J. Using RADARSAT-2 and TerraSAR-X satellite data for the identification of canola crop phenology. SPIE Remote Sens. 2016, 9998, 999802. [Google Scholar] [CrossRef]
  44. Van Zyl, J.J. Application of Cloude’s target decomposition theorem to polarimetric imaging radar. In Radar Polarimetry, Proceedings of SPIE, San Diego, CA, USA, 12 February 1993; SPIE: Bellingham, DC, USA, 1993; pp. 184–191. [Google Scholar]
  45. Xu, T.; Liao, J.; Shen, G.; Wang, J.; Yang, X.; Wang, M. Estimation of wetland vegetation LAI in the Poyang Lake area using GF-1 and RADARSAT-2 data. J. Infrared Millim. Waves 2016, 35, 332–340. [Google Scholar] [CrossRef]
  46. Ballester-Berman, J.D.; Lopez-Sanchez, J.M. Applying the Freeman–Durden decomposition concept to polarimetric SAR interferometry. IEEE Trans. Geosci. Remote Sens. 2009, 48, 466–479. [Google Scholar] [CrossRef]
  47. An, W.; Cui, Y.; Yang, J. Three-component model-based decomposition for polarimetric SAR data. IEEE Trans. Geosci. Remote Sens. 2010, 48, 2732–2739. [Google Scholar] [CrossRef]
  48. Kim, Y.; van Zyl, J.J. A time-series approach to estimate soil moisture using polarimetric radar data. IEEE Trans. Geosci. Remote Sens. 2009, 47, 2519–2527. [Google Scholar] [CrossRef]
  49. Lopez-Sanchez, J.M.; Vicente-Guijalba, F.; Ballester-Berman, J.D.; Cloude, S.R. Polarimetric response of rice fields at C-band: Analysis and phenology retrieval. IEEE Trans. Geosci. Remote Sens. 2014, 52, 2977–2993. [Google Scholar] [CrossRef] [Green Version]
  50. Lopez-Sanchez, J.M.; Cloude, S.R.; Ballester-Berman, J.D. Rice phenology monitoring by means of SAR polarimetry at X-band. IEEE Trans. Geosci. Remote Sens. 2012, 50, 2695–2709. [Google Scholar] [CrossRef]
  51. Wang, L.; Kong, J.; Ding, K.; Le Toan, T.; Ribbes-Baillarin, F.; Floury, N. Electromagnetic scattering model for rice canopy based on Monte Carlo simulation. Prog. Electromagn. Res. 2005, 52, 153–171. [Google Scholar] [CrossRef] [Green Version]
  52. Koppe, W.; Gnyp, M.L.; Hütt, C.; Yao, Y.; Miao, Y.; Chen, X.; Bareth, G. Rice monitoring with multi-temporal and dual-polarimetric TerraSAR-X data. Int. J. Appl. Earth Obs. Geoinf. 2013, 21, 568–576. [Google Scholar] [CrossRef]
  53. Inoue, Y.; Kurosu, T.; Maeno, H.; Uratsuka, S.; Kozu, T.; Dabrowska-Zielinska, K.; Qi, J. Season-long daily measurements of multifrequency (Ka, Ku, X, C, and L) and full-polarization backscatter signatures over paddy rice field and their relationship with biological variables. Remote Sens. Environ. 2002, 81, 194–204. [Google Scholar] [CrossRef]
  54. Fieuzal, R.; Baup, F. Estimation of leaf area index and crop height of sunflowers using multi-temporal optical and SAR satellite data. Int. J. Remote Sens. 2016, 37, 2780–2809. [Google Scholar] [CrossRef]
  55. Jiao, X.; McNairn, H.; Shang, J.; Pattey, E.; Liu, J.; Champagne, C. The sensitivity of RADARSAT-2 quad-polarization SAR data to crop LAI. In Remote Sensing and Modeling of Ecosystems for Sustainability VI, Proceedings of SPIE, San Diego, CA, USA, 5–6 August 2009; SPIE: Bellingham, DC, USA, 2009; p. 74540O. [Google Scholar]
Figure 1. The study area is shown in the Landsat-8 true-color image acquired on 17 July 2016. Thirty sample sites are marked in yellow. Eleven ground control points are marked in red.
Remotesensing 11 02640 g001
Figure 2. Rice phenological phases identified at the 30 sample sites on the four dates of in situ observation.
Remotesensing 11 02640 g002
Figure 3. Growth status of rice plants at the (a) transplanting phase, (b) vegetative phase, (c) reproductive phase, and (d) maturity phase. The above are nadir-view photographs.
Remotesensing 11 02640 g003aRemotesensing 11 02640 g003b
Figure 4. The study area is shown in the Freeman–Durden decomposition image (26 July 2016). The red, green, and blue bands correspond to P D , P V , and P S , respectively.
Remotesensing 11 02640 g004
Figure 5. Phenological variation of rice LAI derived from the ground measurement.
Remotesensing 11 02640 g005
Figure 6. Phenological variation of the basic polarimetric parameters (training dataset). (a) HV, VV, and HH backscattering coefficients, (b) entropy (H), anisotropy (A), and alpha angle (α), and (c) powers of the surface ( P S ), double-bounce ( P D ), and volume ( P V ) scattering.
Remotesensing 11 02640 g006
Figure 7. Phenological variation of the polarimetric parameter combinations (training dataset). (a) VV/HH, HV/VV, and HV/HH, (b) P V / P S , P D / P V , and P D / P S , (c) R V I σ , (d) R V I C P , (e) R V I F D .
Remotesensing 11 02640 g007
Figure 8. Scatterplots and trends of rice LAI (training dataset) as a function of (a) HV/VV or (b) RVI FD .
Remotesensing 11 02640 g008
Figure 9. Measured and modeled LAIs. The black diagonal is the 1:1 line.
Remotesensing 11 02640 g009
Table 1. Rice phenology described by BBCH scale.
Principle PhaseBBCHName
Transplanting00–09Germination
10–19Leaf development
Vegetative20–29Tillering
30–39Stem elongation
40–49Booting
Reproductive50–59Heading
60–69Flowering
Maturity70–79Development of fruit
80–89Ripening
90–99Senescence
Table 2. Coefficients of determination (R2) between rice LAI and polarimetric parameters (training dataset).
Coefficients of Determination (R2)
TransplantingVegetativeReproductiveMaturityEntire Growth Cycle
HV0.25 L0.16 E*0.34 L*0.00 L0.52 E*
VV0.30 L0.45 L*0.36 L*0.00 E0.08 P*
HH0.43 L0.01 E0.48 L*0.26 E0.13 P*
HV/HH0.17 L0.16 E*0.09 L0.14 E0.56 P*
HV/VV0.03 L0.75 E*0.09 L0.02 L0.81 E*
VV/HH0.20 L0.52 E*0.01 L0.18 E0.15 E*
RVI σ 0.06 E0.50 E*0.10 L0.03 E0.70 L*
H0.02 E0.04 L0.07 L0.08 E0.34 P*
A0.12 E0.58 E*0.00 L0.07 N0.63 E*
α0.05 L0.18 E*0.02 E0.00 L0.43 E*
RVI CP 0.16 N0.26 E*0.02 N0.00 E0.60 P*
P D 0.33 L0.33 L*0.21 L0.05 E0.31 L*
P S 0.12 L0.40 E*0.23 L0.00 E0.62 P*
P V 0.09 L0.15 E*0.40 L*0.02 L0.51 E*
P D / P S 0.03 L0.03 E0.00 L0.04 L0.21 E*
P D / P V 0.05 L0.35 L*0.06 L0.05 E0.54 P*
P V / P S 0.03 E0.54 E*0.07 L0.04 E0.77 P*
RVI FD 0.05 E0.68 E*0.11 L0.04 E0.84 E*
L Linear regression achieved the highest R2 value. N Logarithmic regression achieved the highest R2 value. E Exponential regression achieved the highest R2 value. P Polynomial regression achieved the highest R2 value. * Significance level at 1%.

