Abstract
Evapotranspiration (ET) is a major component of the global and regional water cycle. An operational Geostationary Operational Environmental Satellite (GOES) ET and Drought (GET-D) product system has been developed by the National Environmental Satellite, Data and Information Service (NESDIS) in the National Oceanic and Atmospheric Administration (NOAA) for numerical weather prediction model validation, data assimilation, and drought monitoring. GET-D system was generating ET and Evaporative Stress Index (ESI) maps at 8 km spatial resolution using thermal observations of the Imagers on GOES-13 and GOES-15 before the primary operational GOES satellites transitioned to GOES-16 and GOES-17 with the Advanced Baseline Imagers (ABI). In this study, the GET-D product system is upgraded to ingest the thermal observations of ABI with the best spatial resolution of 2 km. The core of the GET-D system is the Atmosphere-Land Exchange Inversion (ALEXI) model, which exploits the mid-morning rise in the land surface temperature to deduce the land surface fluxes including ET. Satellite-based land surface temperature and solar insolation retrievals from ABI and meteorological forcing from NOAA NCEP Climate Forecast System (CFS) are the major inputs to the GET-D system. Ancillary data required in GET-D include land cover map, leaf area index, albedo and cloud mask. This paper presents preliminary results of ET from the upgraded GET-D system after a brief introduction of the ALEXI model and the architecture of GET-D system. Comparisons with in situ ET measurements showed that the accuracy of the GOES-16 ABI based ET is similar to the results from the legacy GET-D ET based on GOES-13/15 Imager data. The agreement with the in situ measurements is satisfactory with a correlation of 0.914 averaged from three Mead sites. Further evaluation of the ABI-based ET product, upgrade efforts of the GET-D system for ESI products, and conclusions for the ABI-based GET-D products are discussed.
1. Introduction
The evaporation from the earth’s surface and the transpiration from the vegetation stomata is commonly referred to as evapotranspiration (ET). Earth’s surface evaporation includes evaporation from both the soil surface and evaporation of the water intercepted by vegetation canopy. The latent heat (LE) required for the evapotranspiration processes and transfers to the atmosphere is one of the most important energy sources of the atmospheric dynamics and can influence local and regional weather via temperature and moisture advection and atmospheric momentum [1,2,3,4]. Thus, accurate estimates of ET or LE are critical for numerical weather and climate prediction models [5,6,7].
ET is also a major component of the global water cycle. ET from vegetation is an important hydrologic process used to establish the water balance in basins and estimate the water demand of irrigation systems. The proper partitioning of precipitation between ET and runoff of land surfaces has an important impact on the water budget. The antecedent ET can largely determine the antecedent soil moisture condition that in turn plays a significant role in the amount of runoff at the watershed scale [8]. Therefore, many hydrological models for the monitoring or forecasts of streamflow and droughts also require reliable estimates of ET rates.
Remote sensing approaches have been developed to retrieve regional or global scale evapotranspiration for decades [6,7,9,10,11,12,13,14,15]. Due to the relatively low expense and continuous spatial coverage, satellite remote sensing of evapotranspiration has been applied to monitoring regional and global droughts in the recent decades and is probably the most practical and efficient approach to providing the ET data needs for the numerical weather, climate and hydrological prediction models (e.g., [6,7,16,17,18,19,20]).
Among the dozens of ET remote sensing models, the Atmosphere-Land Exchange Inversion (ALEXI) model, based on the two-source energy balance (TSEB) model, was developed to address many of issues and disadvantages associated with remote sensing of ET [10,13,21,22,23]. The ALEXI model interpolates a physically realistic representation of land and atmosphere energy exchange over a wide range of vegetation conditions with minimum need for meteorological supporting data [20,21]. The ALEXI model is one of few diagnostic models which are capable of routinely, robustly and long-term generating ET and soil moisture stress maps. Numerous inter-comparison studies have shown that the ET estimates from the ALEXI model demonstrated its reliability and robustness [19,20,24].
Moreover, remotely sensed drought indices based on the land surface vegetation condition (e.g., VegDRI, [25]) are designed to detect poor vegetation health under drought conditions. However, these types of drought indices are only sensible after significant damage occurs to vegetation after a certain period of drought experience [26]. Thermal infrared-based indices, on the other hand, such as the Evaporative Stress Index (ESI) derived from the ALEXI model can provide an effective early warning signal of impending agricultural drought as impacts of temperature are able to be captured even at the early stages of drought development [21,27,28].
Based on the aforementioned advantages, NOAA NESDIS scientists selected the ALEXI model to develop an operational GOES Imager-based ET and Drought (GET-D) product system to provide NOAA and other users with daily ET estimates and multi-weekly drought maps for North America [29,30]. The GET-D system started to operationally generate ET and the ET-based ESI drought product from September 2016.
After the successful launches of the new generation of GOES-R and GOES-S satellites in November 2016 and March 2018, respectively, the primary operational geostationary satellites were transitioned from GOES-13/15 to the new GOES-16/17. After this transition, the GET-D system stopped operation because of the observational data differences between the old imagers on GOES-13/15 and the new Advanced Baseline Imagers (ABIs) on GOES-16/17. In this study, the GET-D system is upgraded to ingest ABI data sets. This paper presents the preliminary results of ET from the upgraded GET-D system. After a brief introduction of the theoretical basis of GET-D system, the architecture of the upgraded GET-D is presented. The ABI-based ET outputs from the upgraded GET-D are then compared with the GOES-13/15 Imager-based ET from the old GET-D system using a set of in situ ET measurements. Preliminary results of the GOES ABI-based ET are summarized in the last section, along with the discussion about further upgrade of the GET-D system.
2. GET-D and Its Theoretic Basis-ALEXI Model
The operational GET-D product system generates daily ET and multi-weekly Evaporative Stress Index data products at 8 km spatial resolution for the North America domain based on the 10.7 micrometer channel brightness temperature data and solar radiation retrievals from the Imagers of GOES-13/15 [29,31], NOAA NESDIS, 2016(GET-D product. Available online: https://www.star.nesdis.noaa.gov/smcd/emb/droughtMon/products_droughtMon.php; accesses on 3 July 2018).
The core of the product system is the ALEXI model described in Anderson et al. (1997). The model is built on the TSEB approach of Norman et al. (1995), which partitions the composite surface radiometric temperature acquired from a satellite-based platform into characteristic soil and canopy temperatures, based on a fraction of vegetation cover [13,32,33]. The TSEB has been coupled with a one-dimensional atmospheric boundary layer (ABL) model for regional applications [34]. In ALEXI, the lower boundary conditions for the two-source model are provided by thermal infrared observations taken at two times during the morning hours from the GOES platform. The ABL model then relates the rise in air temperature above the canopy during this interval and the growth of the ABL to the time-integrated influx of sensible heating from the surface, and ET is computed as a partial residual to the energy budget.
A simple evaporative stress index (ESI), which represents anomalies as the ratio of actual-to-potential ET (fPET), is calculated from ALEXI ET estimates [19,35]. ESI ranges from the value of 0 when there is ample moisture/no stress, to the value of 1 when evapotranspiration has been cut off because of stress-induced stomatal closure and/or complete drying of the soil surface.
The GET-D system started to operationally generate ET and the ESI drought product from September 2016. Figure 1 shows the product of ESI 4-week composite ESI on 3 July 2016.
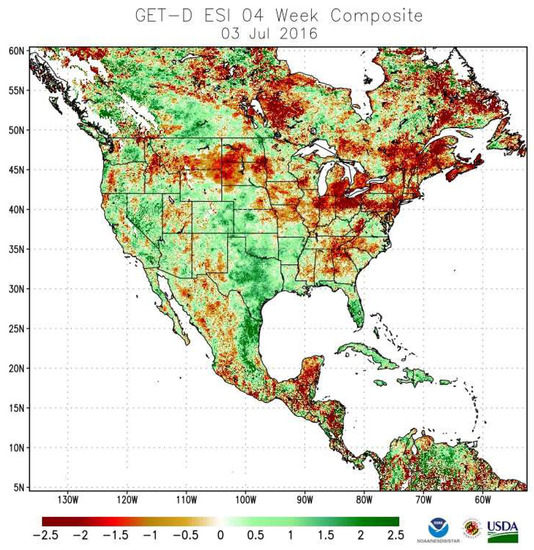
Figure 1.
Current operational GOES Imager-based evapotranspiration (ET)and Drought (GET-D) product of evaporative stress index (ESI) 4-week composite on 3 July 2016.
3. Description of the Upgraded GET-D System
3.1. System Design
The upgraded GET-D system is designed to derive ET for cloud- and snow-free land pixels at 2 km spatial resolution over the CONUS domain (125W–66.75W, 24.83N–49.83N). The processing outline of the upgraded GET-D is shown in Figure 2. The detailed introduction of system inputs is given in Section 3.2, including GOES-R observations, meteorological forcing products, other satellite-based inputs, and ancillary data sets. The system consists of five main processing components, which pre-process system inputs for the use in the ALEXI core model and output ET, fluxes, as well as associated quality control flags in required data formats (NetCDF, GRIB2, and PNG). Section 3.3 introduces system key components in more detail, followed by the description of model output in Section 3.4.
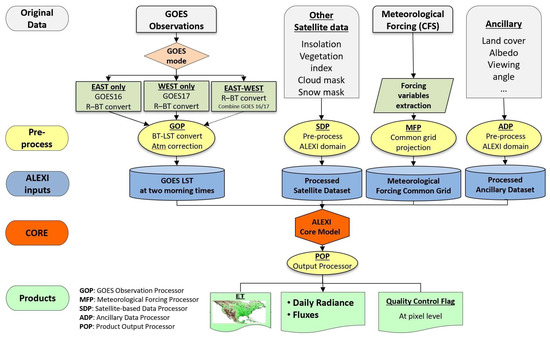
Figure 2.
Data flow diagram of the upgraded GET-D system.
3.2. System Inputs
3.2.1. GOES Observations and Other Satellite Data
The primary real-time satellite-based inputs are the ABI’s thermal band 13 (10.35 µm) from the GOES-R series [31]. Specifically, GOES-R Radiance L1b product at 2 km spatial resolution is assembled as the major input in the upgraded GET-D system. GOES-R ABI products are available at the Comprehensive Large Array-data Stewardship System (CLASS) of NOAA (NOAA CLASS. Available online: https://www.avl.class.noaa.gov; accessed on 3 July 2018).
Other satellite-based observations include the daily insolation from the GOES Surface and Insolation Products (GSIP), surface vegetation cover from the Visible Infrared Imaging Radiometer Suite (VIIRS), cloud mask and snow mask. All the real-time satellite-based products, data sources, and their descriptions are given in detail in Table 1. GSIP insolation product is an hourly solar radiation product derived from GOES-East and –West radiance measurements. The product is also available from the NOAA CLASS archive. Surface Leaf Area Index (LAI) required in the ALEXI model is derived from VIIRS Green Vegetation Fraction (GVF) global product at 4 km spatial resolution. Considering VIIRS LAI is not routinely available at present, a simple linear regression has been built and used. The GOES-R Clear Sky Mask has been adopted in the GET-D system to determine the presence of cloud pixels. Lastly, real-time snow mask product generated from the Interactive Multisensor Snow and Ice Mapping System (IMS) is collected to screen out snow cover pixels.

Table 1.
List of inputs from primary real-time sensor data.
3.2.2. Meteorological Data
The GET-D system is designed to ingest meteorological data from multiple data sources. The selection of meteorological data is controlled by a configuration file. GET-D is set to use the Climate Forecast System (CFS) data as default and the North American Regional Reanalysis (NARR) as the alternative meteorological data source when CFS is not available. Both data sets are produced by the National Centers for Environmental Prediction (NCEP). The original NARR meteorological data are in GRIB format (General Regularly-distributed Information in Binary form) and CFS in GRIB2 (GRIB version 2). The detailed description of these two meteorological datasets is listed in Table 2. Forcing variables extracted from the meteorological datasets can be divided into 2-D and 3-D variables. The forcing variables with their corresponding ID in original formats are listed in Table 3.
Table 2.
Spatial coverage and resolution of meteorological datasets (North American Regional Reanalysis (NARR) and Climate Forecast System (CFS)).
Table 3.
Description of extracted variables from meteorological data (NARR and CFS).
3.2.3. Static Ancillary Data
The ALEXI model requires land cover information to describe the characteristics of the canopy. These parameters are subsequently used to calculate exchange coefficients between the atmosphere and canopy. The land-surface classification currently used in the GET-D system is the University of Maryland 1 km Global Landcover Product [36] which consists of twelve vegetation classes. Other supporting data for the GET-D system include climatological clear-sky insolation derived from GSIP and surface albedo from MODIS. GET-D system also needs solar and satellite geometry information such as solar zenith angle and viewing angles. All ancillary data are pre-processed to binary format and resampled to the GET-D study domain.
3.3. Key System Components
As shown in Figure 2, there are five components at the system level including the GOES Observation Processor (GOP), Meteorological Forcing Processor (MFP), Satellite-based Data Processor (SDP), Ancillary Data Processor (ADP), and Product Output Processor (POP). The GOP is the key processor which pre-processes GOES-16 and GOES-17 observations. This component involves the most modifications during the system upgrading and will be introduced in more detail.
The GOP module is responsible for pre-processing GOES-R observations to land surface temperature at 1.5 hours after sunrise and 1.5 hours before noon. The GOP processing unit first reads GOES-R L1b Radiance product and then converts the original spectral radiance (mW/(m2 × sr × cm-1)) to brightness temperature (K), and finally applies an atmospheric correction model to derive land surface temperature (K).
After the introduction of the GOES-R series observations, the GOP module was updated to account for changes in viewing angles and radiances. The upgraded GET-D is able to proceed relying on either single GOES observation (GOES-16 or GOES-17) or GOES-16 and GOES-17 combined. The use of the combined GOES-16 and GOES-17 observations is expected to give the best performance since the satellite viewing angle over the CONUS domain is significantly reduced. The GET-D system is also capable of generating full spatial coverage products with GOES-East data only but with the compromise in accuracy over western areas due to relatively large viewing angles (larger than 45°). However, if the GOES-East data set is not available, GET-D product will lose retrievals over eastern regions.
When the system runs with both satellite observations combined, the above-mentioned pre-process is applied to GOES 16 and 17 observations separately, which are then merged together to obtain the full coverage of the study domain. As for the overlap area where observations from both sensors are available, the observation from the satellite with a smaller viewing angle was chosen.
The viewing angle maps from a single satellite of GOES-16 and GOES-17 are shown in Figure 3a and b, respectively, while the combined viewing angle pattern is shown in Figure 3c. Figure 3d presents the improvement in viewing angle using dual-satellite observations. Larger viewing angles are reduced on the order of 10 to 30 degrees over western U.S. and the decrease can reach around 35 degrees along the east coast area when combing both GOES-16 and GOES-17 satellites compared to single observations.
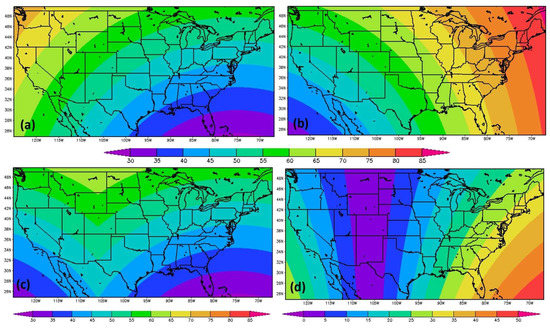
Figure 3.
Maps of the satellite viewing angle of (a) GOES-16, (b) GOES-17, (c) GEOES-16 and GOES-17 combined, and (d) improvement in viewing angles using dual-observations compared to single satellite.
The MFP module extracts and subsets forcing variables listed in Table 3. The SDP contains four separate sub-routines to process the real-time satellite-based supporting data sets, including insolation, VI, cloud mask and snow mask. Static ancillary data are pre-processed in ADP module to prepare land cover, satellite viewing geometry and climatology albedo in required spatial coverage for ALEXI model. Lastly, the POP creates quality control (QC) flags for ET and flux components and the derived ET and fluxes are output in multiple formats.
3.4. System Output
The main outputs of the GET-D system are daily ET and fluxes, including daily sensible heat, soil heat, downward short-wave radiation, long-wave down/up radiation and net radiation (Table 4). Along with the ET and flux variables, QC flags are generated at pixel level as well.
Table 4.
Description of upgraded GET-D outputs.
4. Results
4.1. Upgraded GET-D Products and Analysis of Product Consistency
The upgraded system has been tested from July to October 2017 when both GOES-16 and GOES-13 are available. The overlap period provides an opportunity to assess the consistency of the upgraded system with the current operational the GET-D system. The comparison of the ET monthly composites (July 2017) over the CONUS domain is presented in Figure 4. ET maps from current operational GET-D system are at 8 km spatial resolution over the North America domain (Figure 4a) while the upgraded system focuses on the Continental United States (CONUS) at 2 km (Figure 4c). The pattern of the 2 km ET map is very close to that of 8 km product over CONUS when visually comparing Figure 4b,c. Taking a closer look at regional maps over Oklahoma, the 2 km ET map (Figure 4e) agrees well with current operational product (Figure 4d), capturing low-to-high transition patterns from western to eastern Oklahoma, but provides much improved spatial details.
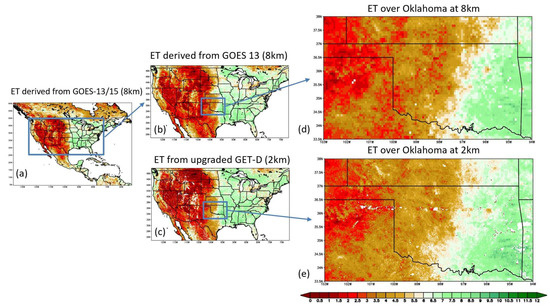
Figure 4.
ET estimates comparison between operational GOES-13/15 based 8 km product (a: over North America domain and b: over CONUS domain) and upgraded GOES-16 based 2 km product (c),with regional comparison over Oklahoma at 8km (d) and 2km (e). Monthly composite of July 2017 (mm day−1).
To better compare the consistency of the upgraded product, the 2 km ET maps have been aggregated to 8 km using a simple averaging scheme and are compared with ET estimates from the current GET-D system visually and quantitatively. Figure 5 illustrates monthly ET composites of August over Oklahoma for (a) the 8 km estimates derived from GOES-13/15 based GET-D system, (b) the 8 km ET aggregated from the 2 km product, (c) the 2 km map from upgraded system, and (d) scatterplot of retrieved ET from the upgraded GET-D compared with current operation. The statistical significance has been tested at the significance level of 5%. The testing results revealed that computed correlation coefficients in this comparison are significant at the confidence interval of 95%. The aggregated map at 8 km presents the consistency between the two products with spatial correlation as high as 0.942 over Oklahoma region. Slight differences show up over southwestern Oklahoma where GOES-16 based retrievals are lower than those from GOES-13 on the order of about 0.3. The comparison for September 2017 is presented in Figure 6 over the same region. ET estimates exhibit a general decrease by around 20% in Sept. compared to last month. Spatial correlation reaches 0.952 and the two products show no apparent bias for this month.
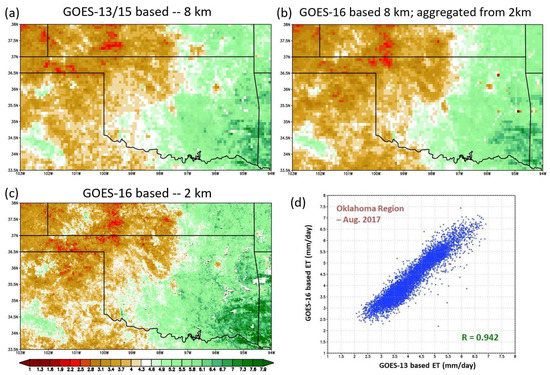
Figure 5.
Monthly ET (mm day−1) composites over Oklahoma of (a) the 8 km estimates derived from GOES-13/15 GET-D system, (b) the 8 km average aggregated from the 2 km product of the upgraded GOES-16 GET-D, (c) the 2 km estimates from GOES-16 GET-D, and (d) scatterplot of retrieved ET from the upgraded GET-D compared with current operation, for Aug. 2017, correlation is significant at the 95% confidence interval.
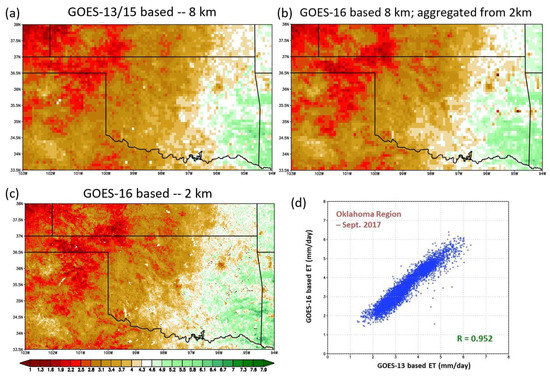
Figure 6.
Same as in Figure 5 but for September 2017.
Another case is provided for comparison over the lower Mississippi region for August 2017 in Figure 7 and for September in Figure 8. ET product generated from the upgraded system appears to be generally higher across the region, especially during high ET condition. The spatial correlations over this region are relatively lower than those over Oklahoma and yet still satisfactory.
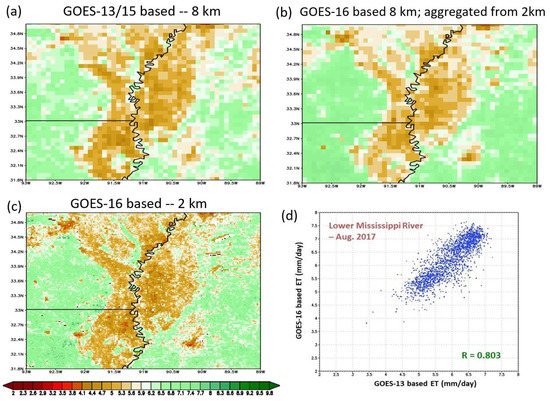
Figure 7.
Monthly ET (mm day−1) composites over lower Mississippi region of (a) the 8 km estimates derived from GOES-13/15 GET-D system, (b) the 8 km average aggregated from the 2 km product of the upgraded GOES-16 GET-D, (c) the 2 km estimates from GOES-16 GET-D, and (d) scatterplot of retrieved ET from the upgraded GET-D compared with current operation, for Aug. 2017, correlation is significant at the 95% confidence interval.
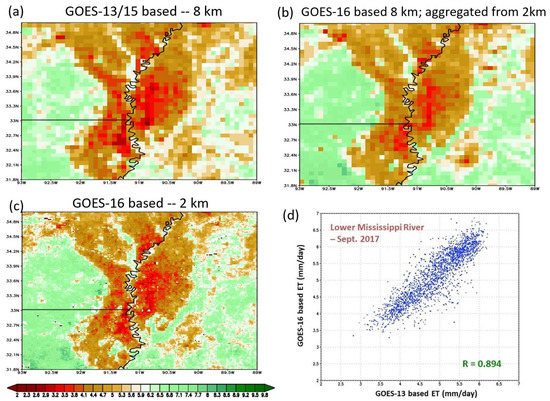
Figure 8.
Same as in Figure 7 but for September 2017 (mm day−1).
In general, better spatial heterogeneity is captured in all regional 2 km ET maps derived from the upgraded GET-D system. The upgraded system proves to be very consistent with the current operation with spatial correlation of 0.946 averaged over the whole CONUS domain.
4.2. Validation Results Comparing with In Situ ET Measurements
ET estimates from the upgraded GET-D system were compared with ET ground observations collected from the University of Nebraska Agricultural Research and Development Center near Mead, NE. The MEAD Ameriflux sites consist of three sites (Figure 9), two irrigated fields (lower left) with a center pivot irrigation equipment and one rain-fed (upper right) field relying entirely on rainfall [37]. Field 1 is planted with continuous maize, while Field 2 and Field 3 are cropped with maize and soybean rotation. Detailed information regarding historical cropping status and activities of these three fields can be found in [37].
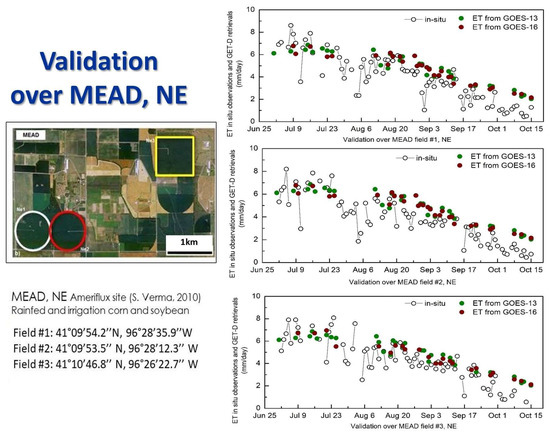
Figure 9.
Time-series comparison between GET-D ET retrievals and ground observations from three fields in MEAD, NE from July 1 to 15 October 2017.
Time series of ET estimates from the current operational GOES-13 based GET-D system and upgraded GOES-16 based system along with in situ observations are provided in Figure 9 from July 1 to 15 October 2017. The time series comparison shows GET-D ET retrievals agree well with in-situ observations in general, capturing the decreasing trend from early July to mid-October. Satellite retrievals match well with ground measurements without significant bias from July to September but starting from Oct., overestimations can be detected for both satellite retrievals for all the three fields.
The inter-comparison between the ET derived from GOES-13 and GOES-16 shows GET-D products are consistent before and after the system upgrade. The error matrix (Table 5) further illustrates the statistical accuracy of the upgraded product and is comparable with that of the operational GOES-13 product with bias around 0.6 mm/day for both products. It is promising to see that the GOES-16 based ET estimations present relatively lower bias and RMSE and higher correlation compared to current operation when validated against the Mead in situ observations.
Table 5.
Error statistics of GET-D ET estimates (mm/day) validated against in situ measurements in MEAD, NE.
5. Discussion and Conclusions
The NESDIS GET-D system has been generating ET and ESI data products at 8 km spatial resolution for NCEP NWP model validation and drought monitoring since 2016. Continuation of GET-D operation using the current high-resolution GOES-R series satellite observations is in high demand. The NCEP operational models rely on upgraded GET-D products to validate and evaluate the most critical land component to enhance the representation of land-atmosphere interactions. Continuation of GET-D operation will be of great benefit to NOAA and other users for a variety of applications.
The GET-D system has been upgraded successfully to generate ET at a much-improved spatial resolution of 2 km over CONUS using GOES-16 observations. The detailed design of GET-D system with five major components, as well as system inputs and outputs have been presented in this paper. In addition, upgraded GET-D products are validated against independent in situ ET measurements from three Mead sites. The comparison proves ET estimates from the upgraded GET-D system to be very consistent with the current operational products. The spatial pattern of upgraded maps matches well with current products but provides much more spatial details. The spatial correlation between the two products reaches 0.946 averaged over CONUS domain for the studying period. Validation against ground observations from Mead sites further confirmed the high consistency of the GET-D system before and after upgrading. Validation results also reveal that the accuracy of the new GET-D ET product is satisfactory with the bias of 0.588 mm/day and the correlation of 0.914 averaged from three Mead sites.
Future upgrades of the system will include the use of GOES-17 observations and combined GOES-16 and GOES-17 to produce ET maps at 2 km spatial resolution covering the CONUS domain. Moreover, the generation of the evaporative stress index is planned in the future for drought monitoring. To generate the ESI from GET-D, a reliable GET-D ET time series data set is vital. Evaluation results showed the GOES-16 based ET product is quite consistent with current operational GOES-13 based products. It is possible to extend the ET climatology obtained from the legacy GOES Imager-based GET-D results to current time for use in a 4 km ESI product given the 4 km limitation of legacy GOES satellites. Further validation is being conducted to update the legacy ESI product and a more comprehensive validation with more in situ ET measurements will be investigated.
Author Contributions
X.Z. and M.S. worked on system design, product validation and revised the manuscript; S.K. is responsible for project administration; I.L. provided the solar insolation input for GET-D; P.Y. provided GOES-R LST products; C.C. provided validation data sets; C.H. and M.A. initiated the ALEXI model and worked on GET-D system design and implementation; L.F. implemented the system upgrade, carried out validation and wrote the paper.
Funding
This research was funded by the NOAA NESDIS GOES-R Risk Reduction (GOES-R3) program for project #488.
Acknowledgments
Zhengpeng Li was the original developer of the software package of the early GOES-13/15 GET-D product system. Contributions for the previous operation of the GOES-13/15 GET-D system from Hanjun Ding of NESDIS Office of Satellite and Product Operation is acknowledged.
Conflicts of Interest
The authors declare that there is no conflict of interest regarding the publication of this paper. The manuscript contents are solely the opinions of the authors and do not constitute a statement of policy, decision, or position on behalf of NOAA or the U. S. Government.
References
- Sato, N.; Sellers, P.J.; Randall, E.K.; Schneider, J.; Shukla, J.; Kinter III, J.L.; Hou, Y.T.; Albertazzi, E. Effects of implementing the simple biosphere model (Sib) in a general circulation model. J. Atmos. Sci. 1989, 46, 2757–2782. [Google Scholar] [CrossRef]
- Allen, R.G.; Pereira, L.S.; Raes, D.; Smith, M. Crop evapotranspiration: Guidelines for computing crop water requirements. In FAO Irrigation and Drainage Paper 56; FAO: Rome, Italy, 1998. [Google Scholar]
- Allen, R.G.; Tasumi, M.; Morse, A.; Trezza, R. A Landsat-based energy balance and evapotranspiration model in Western US water rights regulation and planning. Irrig. Drain. Syst. 2005, 19, 251–268. [Google Scholar] [CrossRef]
- Wetherald, R.T.; Manabe, S. Cloud Feedback Processes in a General Circulation Model. J. Atmos. Sci. 1988, 45, 1397–1416. [Google Scholar] [CrossRef]
- Rabin, R.M.; Stadler, S.; Wetzel, P.J.; Stensrud, D.J.; Gregory, M. Observed Effects of Landscape Variability on Convective Clouds. Bull. Am. Meteorol. Soc. 1990, 71, 272–280. [Google Scholar] [CrossRef]
- Bastiaanssen, W.G.M.; Menenti, M.; Feddes, R.A.; Holtslag, A.A.M. A remote sensing surface energy balance algorithm for land (SEBAL). 1. Formulation. J. Hydrol. 1998, 212, 198–212. [Google Scholar] [CrossRef]
- Bastiaanssen, W.G.M.; Pelgrum, H.; Wang, J.; Ma, Y.; Moreno, J.F.; Roerink, G.J.; van der Wal, T. A remote sensing surface energy balance algorithm for land (SEBAL).: Part 2: Validation. J. Hydrol. 1998, 212, 213–229. [Google Scholar] [CrossRef]
- Loague, K.M.; Freeze, R.A. A Comparison of Rainfall-Runoff Modeling Techniques on Small Upland Catchments. Water Resour. Res. 1985, 21, 229–248. [Google Scholar] [CrossRef]
- Norman, J.M.; Becker, F. Terminology in thermal infrared remote sensing of natural surfaces. Agric. For. Meteorol. 1995, 77, 153–166. [Google Scholar] [CrossRef]
- Kustas, W.P.; Norman, J.M. Use of remote sensing for evapotranspiration monitoring over land surfaces. Hydrol. Sci. J. 1996, 41, 495–516. [Google Scholar] [CrossRef]
- Courault, D.; Seguin, B.; Olioso, A. Review on estimation of evapotranspiration from remote sensing data: From empirical to numerical modeling approaches. Irrig. Drain. Syst. 2005, 19, 223–249. [Google Scholar] [CrossRef]
- Vinukollu, R.K.; Wood, E.F.; Ferguson, C.R.; Fisher, J.B. Global estimates of evapotranspiration for climate studies using multi-sensor remote sensing data: Evaluation of three process-based approaches. Remote Sens. Environ. 2011, 115, 801–823. [Google Scholar] [CrossRef]
- Anderson, M.C.; Norman, J.M.; Diak, G.R.; Kustas, W.P.; Mecikalski, J.R. A two-source time-integrated model for estimating surface fluxes using thermal infrared remote sensing. Remote Sens. Environ. 1997, 60, 195–216. [Google Scholar] [CrossRef]
- Kalma, J.D.; McVicar, T.R.; McCabe, M.F. Estimating Land Surface Evaporation: A Review of Methods Using Remotely Sensed Surface Temperature Data. Surv. Geophys. 2008, 29, 421–469. [Google Scholar] [CrossRef]
- Gillies, R.R.; Kustas, W.P.; Humes, K.S. A verification of the ‘triangle’ method for obtaining surface soil water content and energy fluxes from remote measurements of the Normalized Difference Vegetation Index (NDVI) and surface e. Int. J. Remote Sens. 1997, 18, 3145–3166. [Google Scholar] [CrossRef]
- Allen, R.; Irmak, A.; Trezza, R.; Hendrickx, J.M.H.; Bastiaanssen, W.; Kjaersgaard, J. Satellite-based ET estimation in agriculture using SEBAL and METRIC. Hydrol. Process. 2011, 25, 4011–4027. [Google Scholar] [CrossRef]
- Allen, R.G.; Tasumi, M.; Trezza, R. Satellite-Based Energy Balance for Mapping Evapotranspiration with Internalized Calibration (METRIC)—Model. J. Irrig. Drain. Eng. 2007, 133, 380–394. [Google Scholar] [CrossRef]
- Mu, Q.; Heinsch, F.A.; Zhao, M.; Running, S.W. Development of a global evapotranspiration algorithm based on MODIS and global meteorology data. Remote Sens. Environ. 2007, 111, 519–536. [Google Scholar] [CrossRef]
- Hain, C.R.; Crow, W.; Mecikalski, J.R.; Anderson, M.C.; Holmes, T.R.H. An intercomparison of available soil moisture estimates from thermal-infrared and passive microwave remote sensing and land-surface modeling. J. Geophys. Res. 2011, 116. [Google Scholar] [CrossRef]
- Anderson, M.C.; Hain, C.; Otkin, J.; Zhan, X.; Mo, K.; Svoboda, M.; Wardlow, B.; Pimstein, A. An Intercomparison of Drought Indicators Based on Thermal Remote Sensing and NLDAS-2 Simulations with U.S. Drought Monitor Classifications. J. Hydrometeorol. 2013, 14, 1035–1056. [Google Scholar] [CrossRef]
- Anderson, M.C.; Hain, C.R.; Wardlow, B.; Pimstein, A.; Mecikalski, J.R.; Kustas, W.P. Evaluation of drought indices based on thermal remote sensing of evapotranspiration over the continental U.S. J. Clim. 2011, 24, 2025–2044. [Google Scholar] [CrossRef]
- Anderson, M.C.; Norman, J.M.; Mecikalski, J.R.; Otkin, J.P.; Kustas, W.P. A climatological of surface fluxes and moisture stress across the continental United States based on Thermal Infrared Remote Sensing. Part I: Model formulation. J. Geophys. Res. 2007, 112, D11112. [Google Scholar] [CrossRef]
- Kustas, W.P.; Norman, J.M. A two-source approach for estimating turbulent fluxes using multiple angle thermal infrared observations. Water Resour. Res. 1997, 33, 1495–1508. [Google Scholar] [CrossRef]
- Fang, L.; Hain, C.R.; Zhan, X.; Anderson, M.C. An inter-comparison of soil moisture data products from satellite remote sensing and a land surface model. Int. J. Appl. Earth Obs. Geoinf. 2016, 48, 37–50. [Google Scholar] [CrossRef]
- Brown, J.F.; Wardlow, B.D.; Tadesse, T.; Hayes, M.J.; Reed, B.C. The Vegetation Drought Response Index (VegDRI): A New Integrated Approach for Monitoring Drought Stress in Vegetation. GIScience Remote Sens. 2008, 45, 16–46. [Google Scholar] [CrossRef]
- Moran, M.S. Thermal Infrared Measurement as an Indicator of Plant Ecosystem Health; Taylor and Francis: Abingdon, UK, 2003. [Google Scholar]
- Otkin, J.A.; Anderson, M.C.; Hain, C.; Mladenova, I.E.; Basara, J.B.; Svoboda, M. Examining Rapid Onset Drought Development Using the Thermal Infrared–Based Evaporative Stress Index. J. Hydrometeorol. 2013, 14, 1057–1074. [Google Scholar] [CrossRef]
- Otkin, J.A.; Anderson, M.C.; Hain, C.; Svoboda, M. Examining the Relationship between Drought Development and Rapid Changes in the Evaporative Stress Index. J. Hydrometeorol. 2014, 15, 938–956. [Google Scholar] [CrossRef]
- Li, Z.; Hain, C.; Fang, L.; Zhan, X.; Anderson, M.C. GOES Evapotranspiration and Drought Product System (GET-D). In Proceedings of the 30th Conference on Hydrology of American Meteorological Society Annual Meeting, New Orlean, LA, USA, 10–15 January 2016. [Google Scholar]
- Zhan, X.; Fang, L.; Yin, J.; Schull, M.; Liu, J.; Hain, C.; Anderson, M.; Kustas, W.; Kalluri, S. Remote Sensing of Evapotranspiration for Global Drought Monitoring. In Global Drought and Flood Prediction; Wu, H., Lettermaier, D., Ward, P., Tang, Q., Eds.; AGU Book: Hoboken, New Jersey, 2019. [Google Scholar]
- Zhan, X.; Hain, C.; Fang, L.; Li, Z. GOES Evapotranspiration (ET) and Drought Product System Algorithm Theoretical Basis Document; NOAA NESDIS STAR; NOAA: Silver Spring, MD, USA, 2016. [Google Scholar]
- Anderson, M.C.; Norman, J.M.; Kustas, W.P.; Li, F.; Prueger, J.H.; Mecikalski, J.R. Effects of vegetation clumping on two-source model estimates of surface energy fluxes from an agricultural landscape during SMACEX. J. Hydrometeorol. 2005, 6, 892–909. [Google Scholar] [CrossRef]
- Mecikalski, J.M.; Diak, G.R.; Anderson, M.C.; Norman, J.M. Estimating fluxes on continental scales using remotely sensed data in an atmosphere-land exchange model. J. Appl. Meteorol. 1999, 38, 1352–1369. [Google Scholar] [CrossRef]
- McNaughton, K.J.; Spriggs, T.W. A mixed-layer model for regional evaporation. Bound. Layer Meteorol. 1986, 74, 243–262. [Google Scholar] [CrossRef]
- Hain, C.R.; Mecikalski, J.R.; Anderson, M.C. Retrieval of an available water-based soil moisture proxy from thermal infrared remote sensing. Part I: Methodology and validation. J. Hydrometeorol. 2009, 10, 665–683. [Google Scholar] [CrossRef]
- Hansen, M.C.; Defries, R.S.; Townshend, J.R.G.; Sohlberg, R. Global land cover classification at 1 km spatial resolution using a classification tree approach. Int. J. Remote Sens. 2000, 21, 1331–1364. [Google Scholar] [CrossRef]
- Suyker, A.E.; Verma, S.B. Coupling of carbon dioxide and water vapor exchanges of irrigated and rainfed maize–soybean cropping systems and water productivity. Agric. For. Meteorol. 2010, 150, 553–563. [Google Scholar] [CrossRef]
© 2019 by the authors. Licensee MDPI, Basel, Switzerland. This article is an open access article distributed under the terms and conditions of the Creative Commons Attribution (CC BY) license (http://creativecommons.org/licenses/by/4.0/).