Article

Sentinel-2 Validation for Spatial Variability Assessment in Overhead Trellis System Viticulture Versus UAV and Agronomic Data

by
Salvatore Filippo Di Gennaro
1,†,
Riccardo Dainelli
1,†,
Alberto Palliotti
2,
Piero Toscano
1,* and
Alessandro Matese
1
1
Institute of BioEconomy (IBE), National Research Council (CNR), Via Caproni 8, 50145 Florence, Italy
2
Department of Agricultural, Food and Environmental Science, University of Perugia, Borgo XX Giugno 74, 06128 Perugia, Italy
*
Author to whom correspondence should be addressed.
The two authors contributed equally to this work.
Remote Sens. 2019, 11(21), 2573; https://doi.org/10.3390/rs11212573
Submission received: 21 September 2019 / Revised: 28 October 2019 / Accepted: 30 October 2019 / Published: 2 November 2019
(This article belongs to the Special Issue Remote Sensing in Viticulture)

Abstract

:
Several remote sensing technologies have been tested in precision viticulture to characterize vineyard spatial variability, from traditional aircraft and satellite platforms to recent unmanned aerial vehicles (UAVs). Imagery processing is still a challenge due to the traditional row-based architecture, where the inter-row soil provides a high to full presence of mixed pixels. In this case, UAV images combined with filtering techniques represent the solution to analyze pure canopy pixels and were used to benchmark the effectiveness of Sentinel-2 (S2) performance in overhead training systems. At harvest time, UAV filtered and unfiltered images and ground sampling data were used to validate the correlation between the S2 normalized difference vegetation indices (NDVIs) with vegetative and productive parameters in two vineyards (V1 and V2). Regarding the UAV vs. S2 NDVI comparison, in both vineyards, satellite data showed a high correlation both with UAV unfiltered and filtered images (V1 R2 = 0.80 and V2 R2 = 0.60 mean values). Ground data and remote sensing platform NDVIs correlation were strong for yield and biomass in both vineyards (R2 from 0.60 to 0.95). These results demonstrate the effectiveness of spatial resolution provided by S2 on overhead trellis system viticulture, promoting precision viticulture also within areas that are currently managed without the support of innovative technologies.

Graphical Abstract

1. Introduction

Precision viticulture (PV) aims to increase production efficiency and minimize environmental impact by overcoming the traditional uniform approach with a site-specific management based on spatial variability within the vineyard [1,2,3,4,5,6,7,8,9,10]. The knowledge of spatial and temporal variability improves all aspects of vineyard management such as ground sampling, vines status monitoring, fertilizer distribution, phytosanitary treatments, weed control, and quality-selective harvesting [2,11,12,13]. In the last three decades, advances in proximal and remote sensing technologies have provided useful and cost-effective solutions to better characterize in-field variability [14,15,16,17,18,19].
In viticulture, in order to obtain fast information on spatial variability, several remote sensing technologies have been tested from traditional aircraft and satellite platforms to recent unmanned aerial vehicles (UAVs) [20,21,22,23,24]. In assessing the effectiveness of these remote sensing platforms, image ground resolution, technology costs, and flight coverage range must be taken into account. The choice of one platform over another is always based on a compromise, which depends on the objectives of monitoring spatial variability and the economic and human resources available to end-users such as agricultural companies. It is undeniable that the factor that has exponentially encouraged the spread of UAV application in agriculture is the continuous advance in sensor technologies, providing higher resolution, lower weight and dimensions, and cost reduction [23,25,26,27,28]. Several authors describe a wide range of UAV applications for PV purposes: vigor and biomass [29,30,31,32,33,34], yield and quality monitoring [35,36], water stress [37,38,39,40,41], canopy management [42], diseases [43,44,45,46], weeds [47,48,49], and missing plants [50,51,52,53].
All these papers describe applications on vertical pruning systems (VPS), the most widespread class of training systems used in quality viticulture, which presents a discontinuous spatial layout with vegetated rows alternating with soil [54,55]. In these cases, spatial analysis of remote sensing images requires separation of the canopy from bare soil, shadows, and green cover, which can be achieved with advanced filtering techniques for canopy extraction [56,57,58,59,60]. Many authors suggest unsupervised filtering techniques in a vineyard based on a canopy height model (CHM) derived from a digital elevation model (DEM) [51,53], geometric structure by texture analysis [61,62], 3D point cloud [63], automatic threshold on color distribution in RGB [64], different color spaces such as HSV (hue, saturation, value), or L*a*b* (L* for the lightness from black to white, a* from green to red and b* from blue to yellow) [65]. The work suggested by Cinat et al. [65] presents an overview of those methodologies.
VPS has undoubted advantages such as the possibility of high planting densities (over 5000 vines/ha), easy mechanization, and better air circulation through vegetation [55], but at the same time it has the disadvantage of creating a high exposure degree of the fruiting zone, so in warm climates there is a high risk of sunburn damage, especially in a global warming scenario [66,67].
With this premise, training systems in several areas that are capable of keeping bunches in diffused light conditions during the hottest hours of the day represent an optimal solution to maintain high yield and quality. Among the most suitable training systems to achieve this goal is the overhead trellis system, which provides full soil covering and is widely used for both table and wine grapes in Italy (tendone and pergola), Portugal (latada), Spain (parral), Argentina (parral), and Chile (parron) [54].
Trellis systems are also able to limit the dangerous sunburn damage to berries [68], even if an excessive shading of bunches can increase the risk of fungal diseases and possibly lead to unbalanced fruit composition. Nevertheless, it should be emphasized that in a warming climate, minimizing the exposure of grapes to high daytime temperatures is more important than other aspects [69]. Overhead trellis systems with low density (about 1500–2000 vines/ha) are commonly chosen for high yield (because of efficient light interception) and used in environments with high temperatures and low relative air humidity [68]. Many key fruit attributes such as soluble solids, color, aroma compounds, and phenols can be optimized in warm sites by reducing berry temperature with moderate fruit exposure [55]. Moreover, it is necessary to develop suitable cultivation techniques to overcome or at least buffer, in the short- and medium-term, the negative effects deriving from climate change [66,67]. Currently, these vine training solutions are gaining interest due to the natural shading of bunches and radiative stress protection in the context of global warming [68]. In Italy, the overhead trellis systems tendone and pergola are used in many regions: Trentino, Veneto, Emilia-Romagna, Sardinia, Sicily, Puglia, and Abruzzo [69]. The tendone trellis system comprises a tall stake at each vine with two orthogonal steel wires attached 1.7–1.8 m above ground level, and a grid of steel wires supporting the shoots. Each vine has a 1.2–1.4 m tall trunk, with two branches and two fruit-bearing shoots per branch, aligned orthogonally or parallel to the grid [70]. Despite being a widespread training system, recent scientific studies concerning various aspects of grape tendone systems are not very numerous [71,72,73,74,75] and only one uses data from a remote sensing platform (i.e., satellite data for evapotranspiration valuation) [76]. In our study area, viticulture is still an emerging sector, producing a high quantity of wine (i.e., grape yield equal to 16.6 t/ha, the second highest in Italy [77]) with low added value, therefore, it would be desirable to introduce PV techniques to sustain farmers’ incomes and the environment.
In the overhead trellis systems such as tendone with full vegetation cover, a centimetric spatial resolution turns out to be less important than the possibility of obtaining a large area of monitoring with minimum cost and high acquisition frequency. Since 2015, there has been a growing focus on the potential of Sentinel-2 platforms, which has led to a minor revolution in the field of remote crop monitoring. Indeed, Sentinel-2 is free, has a high frequency of image acquisition, many spectral bands, and could be used for vegetation monitoring over time for the evaluation of crop response to agronomic inputs and for land use identification. The literature includes some papers describing Sentinel-2 validation with field measurements for woodlands [78], mangroves [79], forests [80], pastures [81], and cereal crop fields [82,83,84]. Few papers report spectral comparisons between Sentinel-2 and UAV platforms in semi-arid sandy areas [85], on continuous crops such as sugarcane, rice, and soybean [86], or wheat, barley, and rye [87], and on discontinuous VPS in a vineyard [61].
The primary aim of the work was to compare Sentinel-2 (S2) imagery with UAV filtered and unfiltered images on an overhead training system (tendone) with the objective of exploiting the use of satellite-free imagery for the characterization of the spatial variability of the vigor in a vineyard. Secondly, to better highlight the potential benefit for the decision making processes in viticulture of these remote sensing platforms, comparisons with quantitative and qualitative agronomic ground observation datasets were performed. In the 2015 season, a field test was conducted in two tendone vineyards located in Abruzzo (Italy), with the aim of performing Sentinel-2 data validation versus UAV high-resolution spectral images acquired in the same period, and key ground parameters such as biomass, yield, and grape composition sampled within different vigor zones at harvest time.

2. Materials and Methods

2.1. Experimental Design

The research was undertaken in 2015 in two vineyards, Costa di Moro (V1) (42°12′57″N; 14°190′42″E) and Magliano (V2) (42°17′07″N; 14°18′34″E); both are part of the Orsogna Winery, located near Chieti, Central Italy. Both vineyards are planted with Vitis vinifera L. cv. Montepulciano and trained with a tendone trellis system (Figure 1a,b), which comprises a tall stake at each vine with an orthogonal grid of steel wires attached at 1.8 m supporting the shoots. Vineyard characteristics are reported in Table 1.

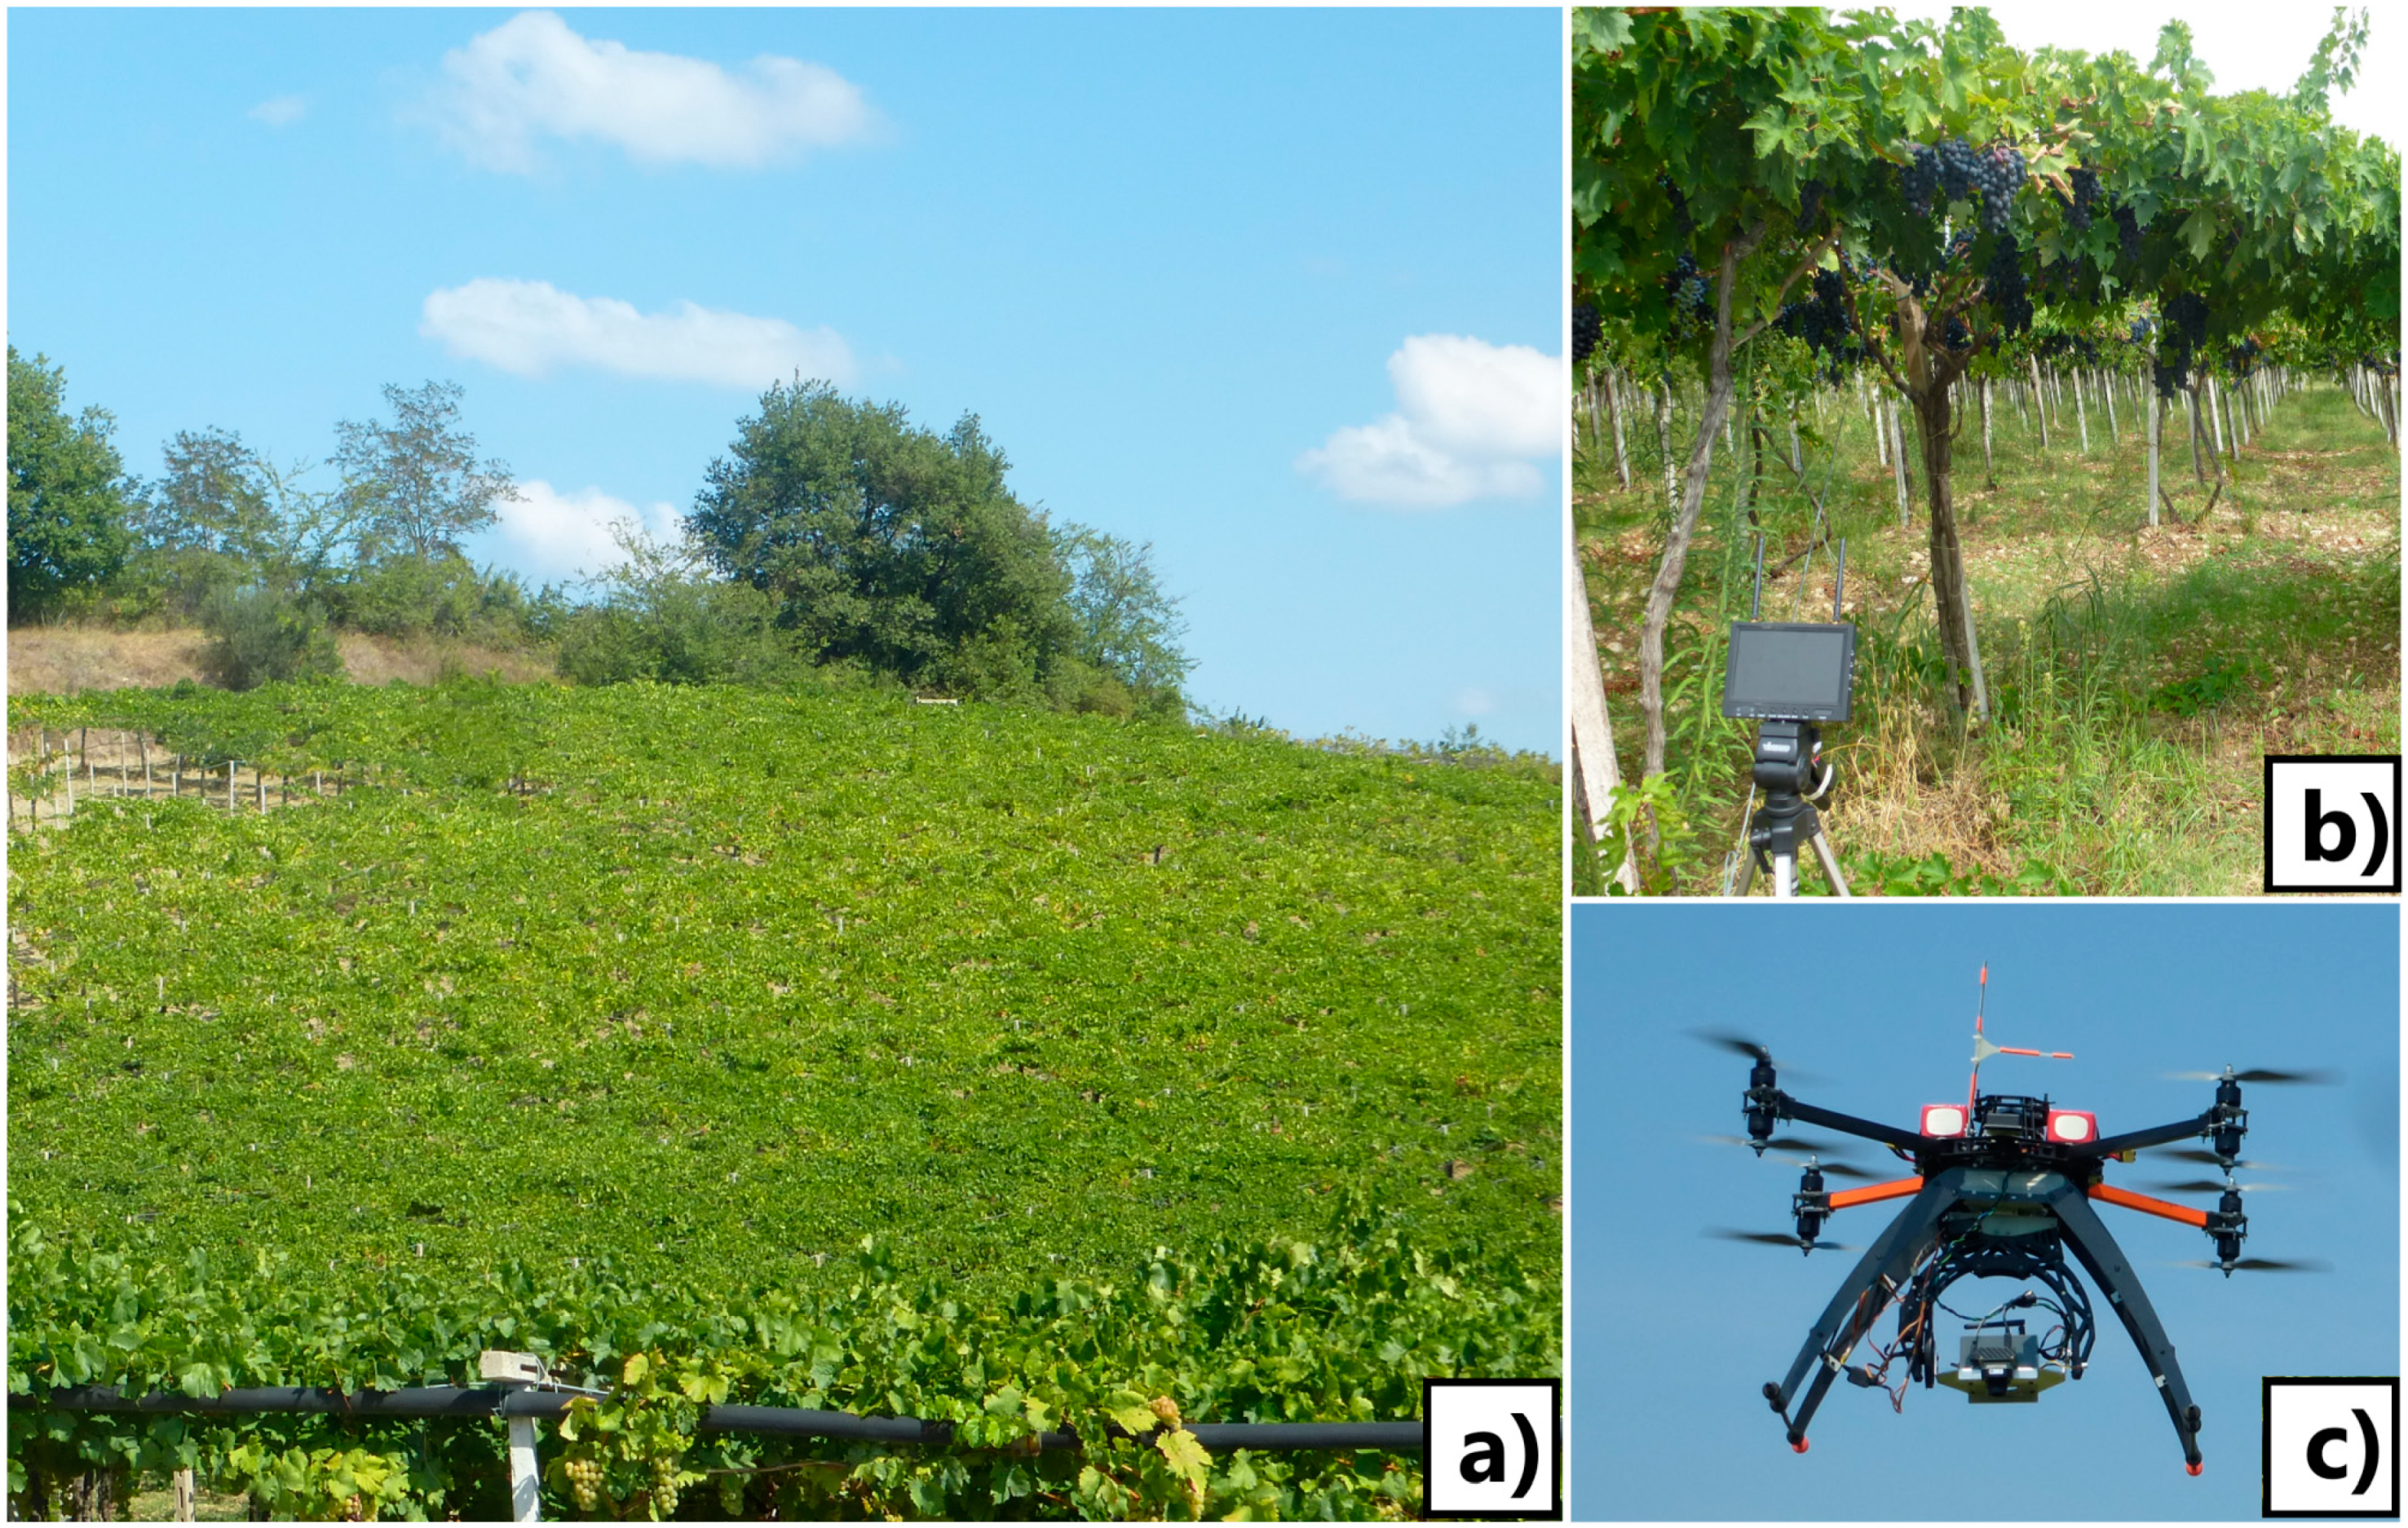
2.2. Remote Sensing Platforms

2.2.1. UAV

A flight campaign was made on 10 September 2015 with a modified multirotor UAV platform (HiSystems GmbH, Moomerland, Germany) (Figure 1c), described by Matese et al. [17], equipped with a Tetracam ADC Snap multispectral camera (Tetracam Inc., Chatsworth, CA, USA), which records images in the visible red and green and near infrared (NIR) spectrum with nominal wavelengths of 520–600, 630–690, and 760–900 nm, respectively. The flights were performed at 70 m a.g.l. with 70% both sides overlap (forward and lateral), yielding a ground resolution of 0.03 m/pixel. All images were taken between 11:30 and 13:00, without wind, and in clear sky conditions.

2.2.2. Data Analysis

Georeferenced multispectral images were mosaicked using Agisoft Photoscan Professional Edition 1.1.6 [88], allowing the generation of a high-resolution (0.03 m/pixel) orthophoto and a digital elevation model (DEM) of the experimental sites. A vicarious calibration based on the absolute radiance method was chosen, given that the digital number (DN) value for each pixel has a direct relationship (linear model) with the radiance detected by the sensor [89]. A radiometric calibration process was performed with MATLAB [90] to convert the digital number (DN) value for each pixel in radiance, by means of three OptoPolymer (OptoPolymer—Werner Sanftenberg, Munich, Germany) homogeneous and Lambertian surface panels (95%, 50%, and 5% reflectance). The filtering elaboration step to extract pure vine pixels was performed by applying an unsupervised algorithm developed in MATLAB and described in a previous paper by the authors [65]. This algorithm identifies soil, shadow, and vines by Otsu’s global thresholding, using the HSV color spectrum. The HSV color spectrum assigns to each spectral frequency, identified by the value of hue (H), a chromatic saturation magnitude (S, where 0 is white and 1 is full color) and value (V, where 0 is black and 1 is full color). The HSV directly converts the image to the HSV color space, and the saturation channel (S) is used to identify and remove shadows. Next, the non-shadowed image is filtered by applying masks based on green and NIR values on the multispectral image to identify canopy pixels from soil. The vigor spatial variability within the two study sites was then assessed by processing the normalized difference vegetation index (NDVI) [91] for both unfiltered (UAV_uf) and filtered (UAV_f) orthomosaics with MATLAB. Ground sampling was based on a tercile classified vigor map (LV = low vigor, MV = mean vigor, HV = high vigor) elaborated from UAV multispectral images with MATLAB. Sentinel-2 band 4 (RED) and band 8 (NIR) were chosen to elaborate NDVI maps with QGis [92]. To compare the influence of spectral and spatial resolution directly on the vineyard characterization in terms of biomass and yield parameters, the UAV images were resampled to the same spatial resolution as the Sentinel-2 data. A square grid-based resampling (10 x 10 m) was applied to UAV orthomosaic using the Vector Grid function in QGis.

2.2.3. Sentinel-2

Remote sensing images acquired by the multi-spectral instrument (MSI) aboard the Sentinel-2 satellite were used in the study. Sentinel-2A/MSI captures images in 13 spectral bands at 10, 20, and 60 m spatial resolution. After cloud and shadow screening, a total of two Sentinel-2 scenes were selected (30 August 2015–19 September 2015). Sentinel-2A/MSI images were atmospherically corrected for surface reflectance using the European Space Agency’s (ESA) Sen2Cor algorithm (http://step.esa.int/main/third-party-plugins-2/sen2cor), which processes ESA’s Level-1C top-of-atmosphere reflectance to atmospherically-corrected bottom-of-atmosphere (BoA) reflectance (Level-2A). NDVI was calculated using band 8 (NIR) and band 4 (RED) according to the formula:
NDVI = (NIR − RED)/(NIR + RED),
providing two maps of NDVI with a support of 10 × 10 m2.

2.3. Ground Data Measurements

Ground sampling was performed at harvest time on 30 September 2015 for the Costa di Moro vineyard and 5 October 2015 for the Magliano vineyard based on a three-class vigor map provided by the UAV flight campaign. For both vineyards, the mean value ± standard error of each vegetative and productive parameter were derived from three single ground samples for each of the three vigor classes established in each vineyard. In both vineyards, harvesting was done when berry sugar accumulation appeared to level off on the basis of total soluble solids (TSS). Yield per vine was measured and the number of clusters per vine counted on three vines per vigor class. In each vineyard, three samples of 300 berries per vigor class were randomly collected, weighed to determine berry fresh weight, and crushed to obtain a juice sample for measuring TSS (as °Babo), pH, and titratable acidity (TA). A temperature-compensating RX 5000 refractometer (Atago-Co Ltd.) was used to measure TSS, while TA was measured using a Titrex Universal Potenziometric Titrator (Steroglass S.R.L.) by titrating with 0.1 N NaOH to a pH 8.2 end point, expressed as g/L of tartaric acid equivalent. The pH was measured with a digital PHM82 pH meter (Radiometer). Anthocyanin and phenolic contents (expressed as g/kg of grapes) were determined according to Amerine and Ough [93] and Slinkard and Singleton [94], respectively. Leaf area was checked on 12 September 2015, randomly collecting 10 fruiting shoots from 10 vines within each vigor class. Total leaf area per shoot was measured with an AAM-7 leaf area meter (Hayashi-Denko) and calculated by multiplying mean leaf area per shoot, by shoot number per vine. During winter pruning, which in both vineyards occurred at the beginning of February 2016, canes from ten representative vines for each vigor class were weighed after pruning to estimate annual vine growth.

2.4. Statistical Analysis

NDVI features (count, mean, minimum, maximum, and standard deviation) from UAV and satellite images were extracted using the Zonal statistic plugin in QGis.
The statistical relationship between remote sensing data and grape quantitative and qualitative parameters is described by means of the determination coefficient (R2).

3. Results and Discussion

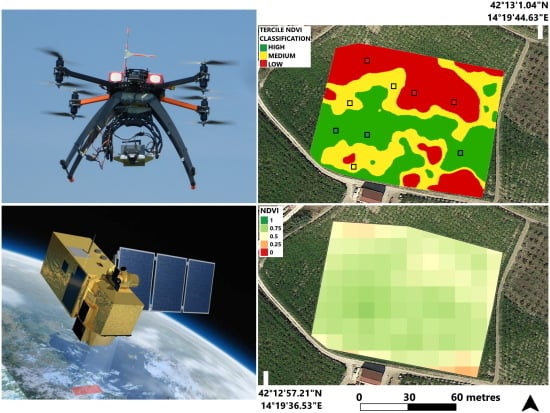
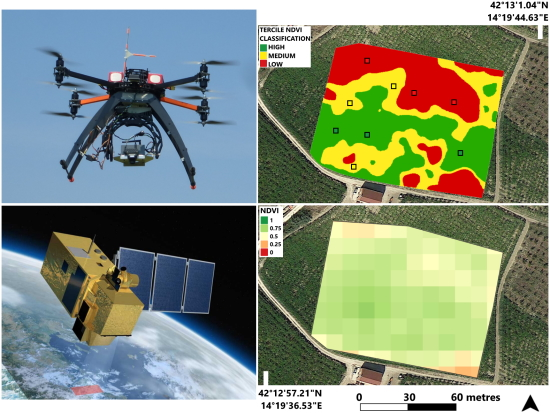
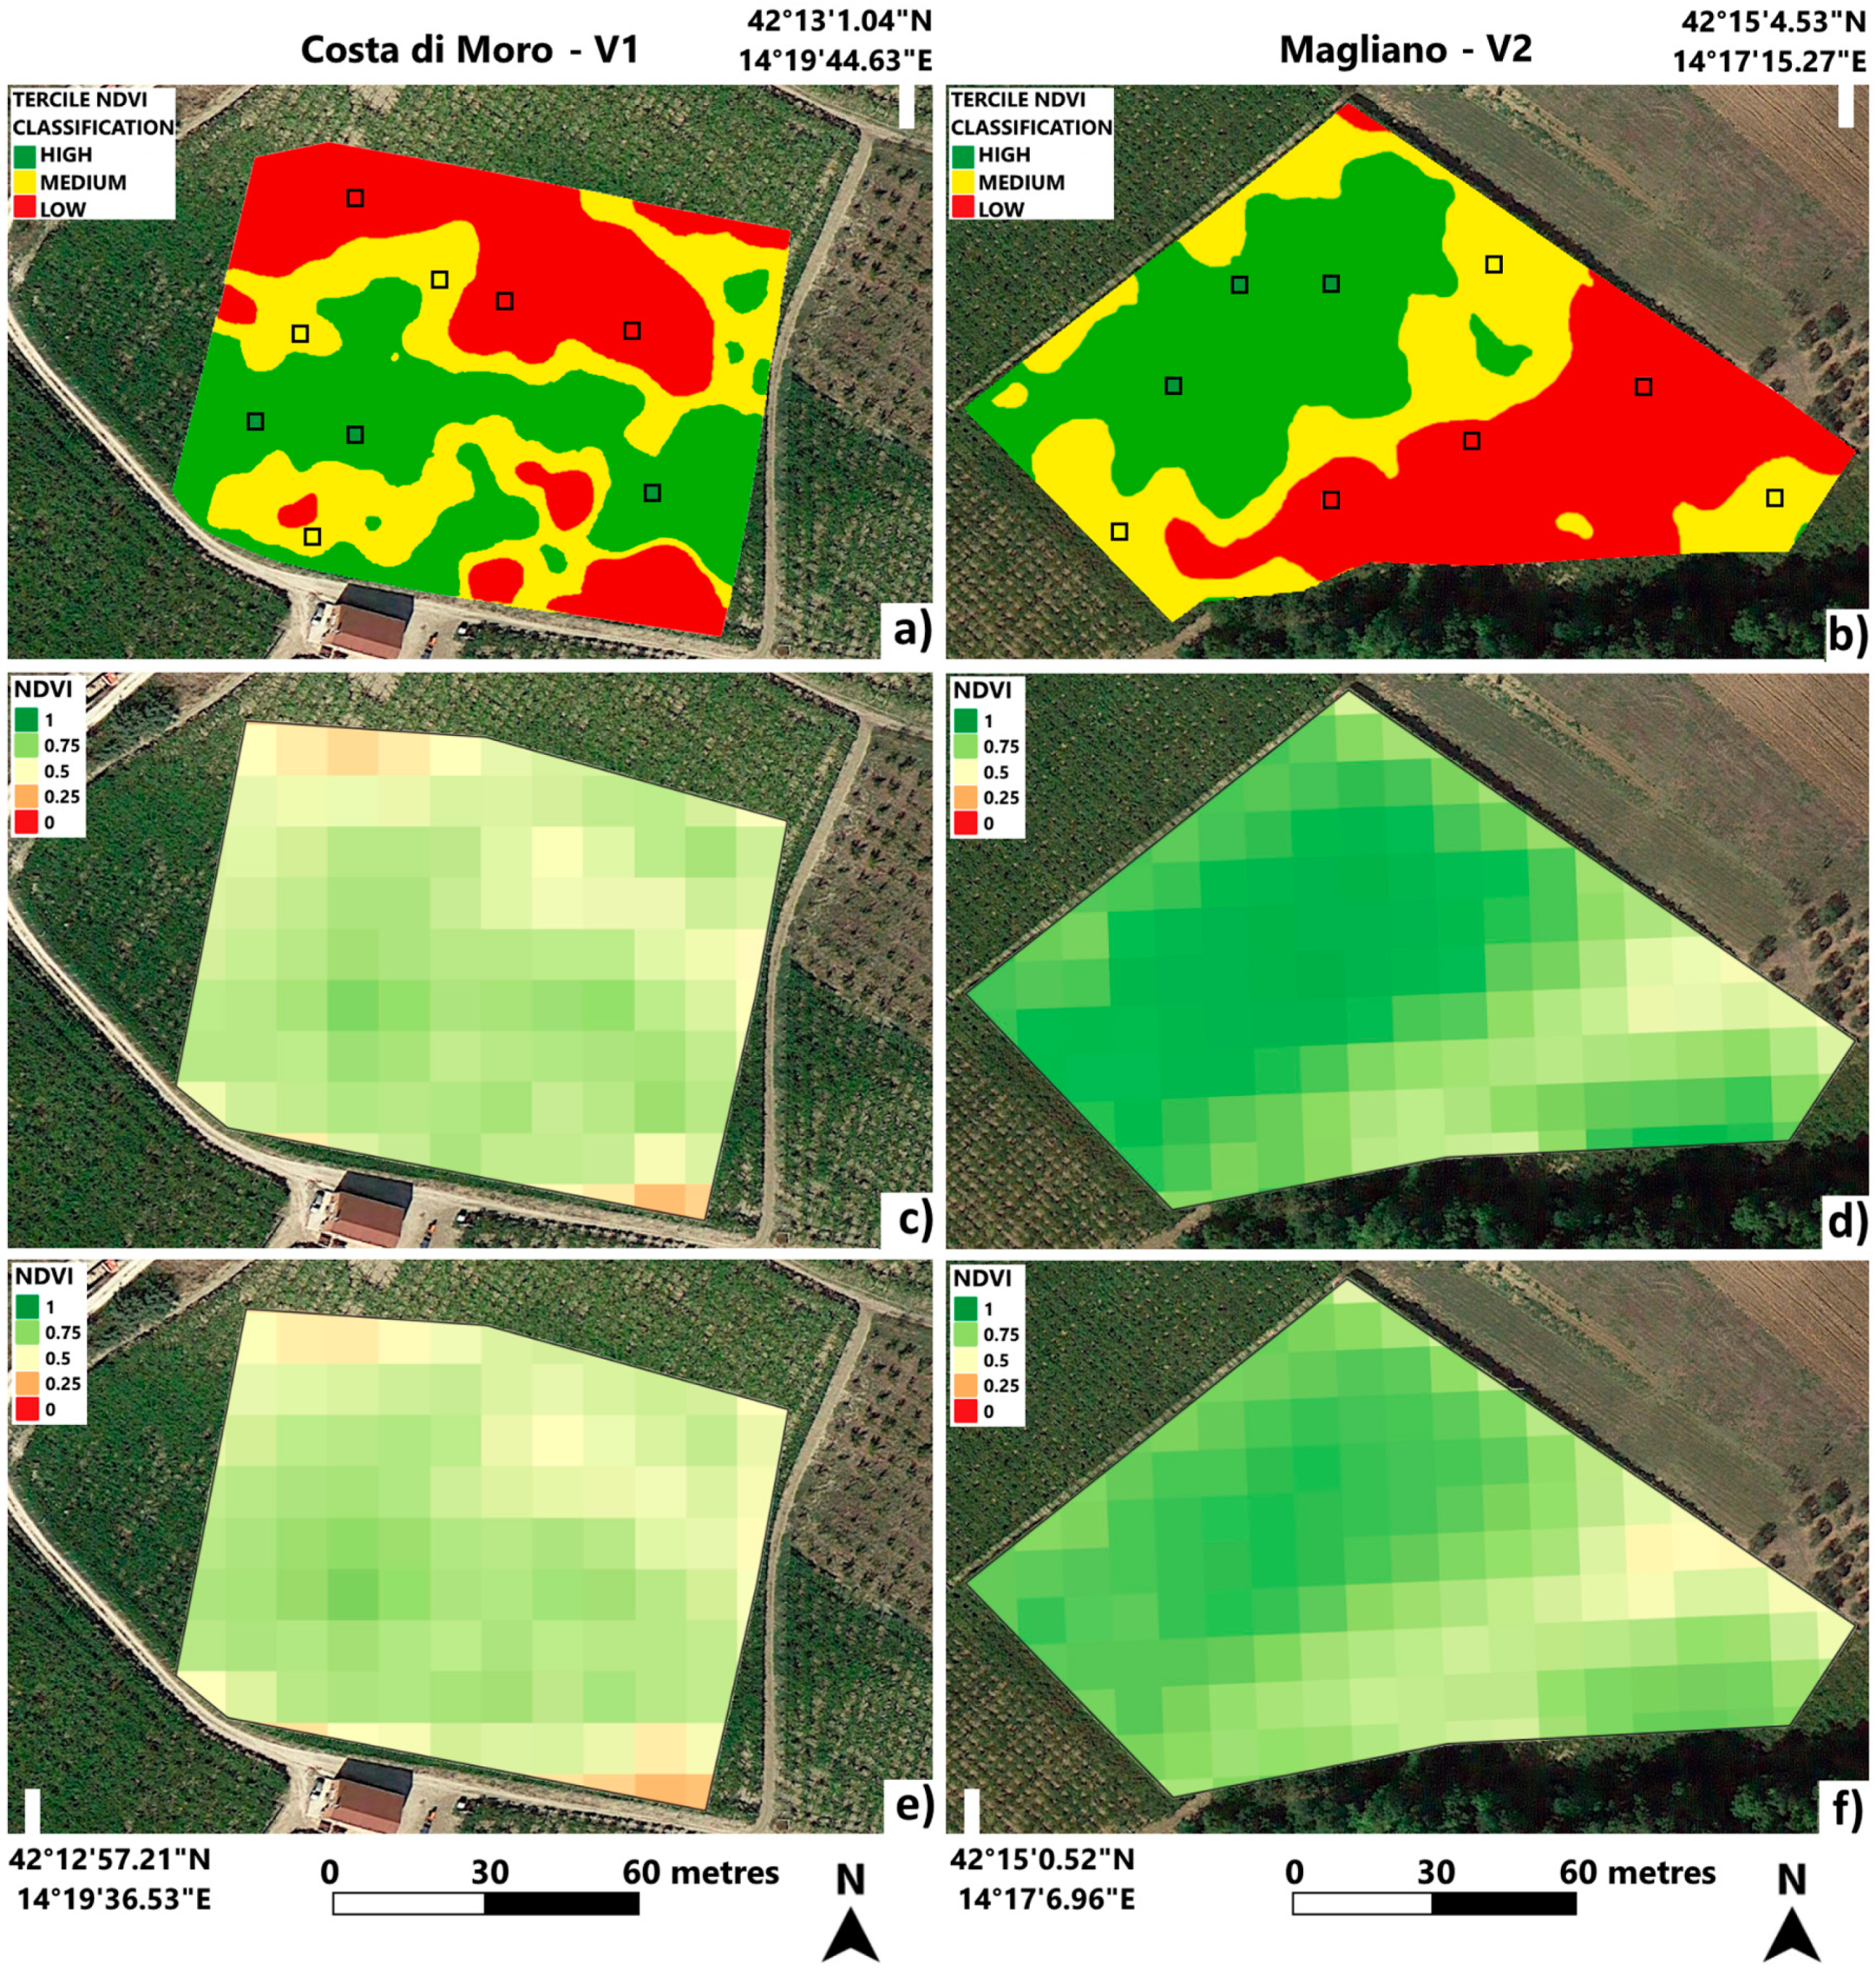
3.1. Vineyard Spatial Variability

In this section, results of spatial variability in terms of vine vigor are presented. Vigor maps of the study sites (V1 and V2), obtained from UAV and Sentinel-2 images (30 August and 19 September 2015) are reported in Figure 2.
From a visual inspection of the NDVI maps, both UAV and Sentinel-2 show the same trend in terms of vigor for each vineyard as reported also by Nonni et al. [95]. Analyzing Figure 2a,c,e, the V1 vineyard is characterized by a low vigor zone in the north part as a consequence of sloping and stony soil that encourages loss of water by gravity and fast drainage. The rest of the vineyard presents higher vigor values, with a few exceptions of low vigor sub-zones (i.e., the south-eastern part) due to the presence of active limestone zones, which is another explanation of that variability in vegetative growth [96,97]. In V2, vigor distribution (Figure 2b,d,f) presents two different zones: high value (green) in the north part and low value (red) in the south. Both zones are surrounded by medium vigor values. This vigor distribution could be explained by competition for water and nutrients and by the nitrogen in primis due to the presence of olive and poplar plants close to that area.
The two sets of maps from Sentinel-2 (images of 30 August and 19 September 2015) show a similar vigor distribution pattern for each vineyard following a chronological comparison, even if in the second one there is a decrease in vigor, especially in V2 (Figure 2f). This is due to the different phenological stage: On 30 August 2015, berry ripening is almost complete, but all leaves are green and have full photosynthetic activity, while on 19 September 2015, in the pedoclimatic conditions of the study site, some leaves, especially the basal ones aged more than 4–5 months, have already started to lose chlorophyll and begin the senescence phenomena. Focusing on the difference between vineyard sites, it can be noted that V1 has a lower plant vigor due to the marked ground slope (6%–7%) and poor soil organic matter content.

3.2. Ground Data

Ground data relating to vegetative and productive parameters sampled in different vigor zones are given in Table 2.
As might be expected, the purely quantitative parameters (yield, bunch weight, pruning biomass, and leaf area) increase with vigor, showing for all parameters almost double the values in the high vigor areas with respect to the low ones (i.e., yield increases from 4.07 to 8.27 kg/vine in V1 and from 4.20 to 10.33 kg/vine in V2, due to highest bunch weight). The reduction of bunch weight in lower vigor areas of both vineyards was caused by lower berry weight (−24% in V1 and −31% in V2) and fewer berries per bunch (precisely −27% in V1 and −29% in V2). Analyzing grape composition, the sugars content did not show significant changes according to vigor, whereas titratable acidity showed higher values in high vigor areas (+0.66 g/L in V1 and +0.70 g/L in V2) linked with a weak vegetative growth and foliage mass and then a higher temperature at bunch level. During ripening, the organic acids in the must, especially malic acid, are used as a substrate for respiration according to temperature [98].
It can be observed that in the V2 vineyard, the agronomic parameter values are on average higher than those in V1, except that of titratable acidity. These differences can be attributed both to the soil’s physical and chemical properties and to a water deficit and radiative-thermal excesses that occurred in V1 due to its southern exposure and 6%–7% slope.
The results of analyzing ground data by means of NDVI class can be summarized as follows (mean values from two vineyards):
1. HV zone: Vines are characterized by high yield (13.1 and 16.5 t/ha of grapes in V1 and V2, respectively. Data estimated from plant yield, vine spacing, and vineyard area), good technological parameters (~19 °Babo for sugars, 5.6 g/L for titratable acidity, 1.68 and 2.78 g/kg of grapes for anthocyanins and total polyphenols, respectively, and balanced vegetative-reproductive indexes (1.3 m2 leaf area/kg grape and ~5 kg grape/kg pruning wood).
2. MV zone: Vines have lower yield in comparison to the Green zone (−20% in V1 and −26% in V2), similar technological parameters and anthocyanins and total polyphenols content (on average 1.70 and 2.75 g/kg of grape) as well as lower vigor (−23% and −25% of pruning wood and −43% and −41% of leaf area per vine) than in the green zone.
3. LV zone: Weak vines are characterized by a strongly limited leaf surface and shoot development and by more than halved grape yield compared to the more vigorous plants in the green area. The vine canopy has a low light interception capacity and covers only 55%–60% of the total space available for each plant (6.25 m2). The grapes have barely enough technological maturity (sugar and acidity) and total polyphenol content (on average 2.74 g/kg of grapes), while they were strongly deficient in anthocyanins with only 1.24 g/kg of grapes. This last result can be easily explained in that the decrease in anthocyanin accumulation under high temperatures (as seen in the grapes not covered by leaves, as occurs in low vigor areas) results from anthocyanin degradation as well as the inhibition of mRNA transcription on the anthocyanin biosynthetic genes [99].

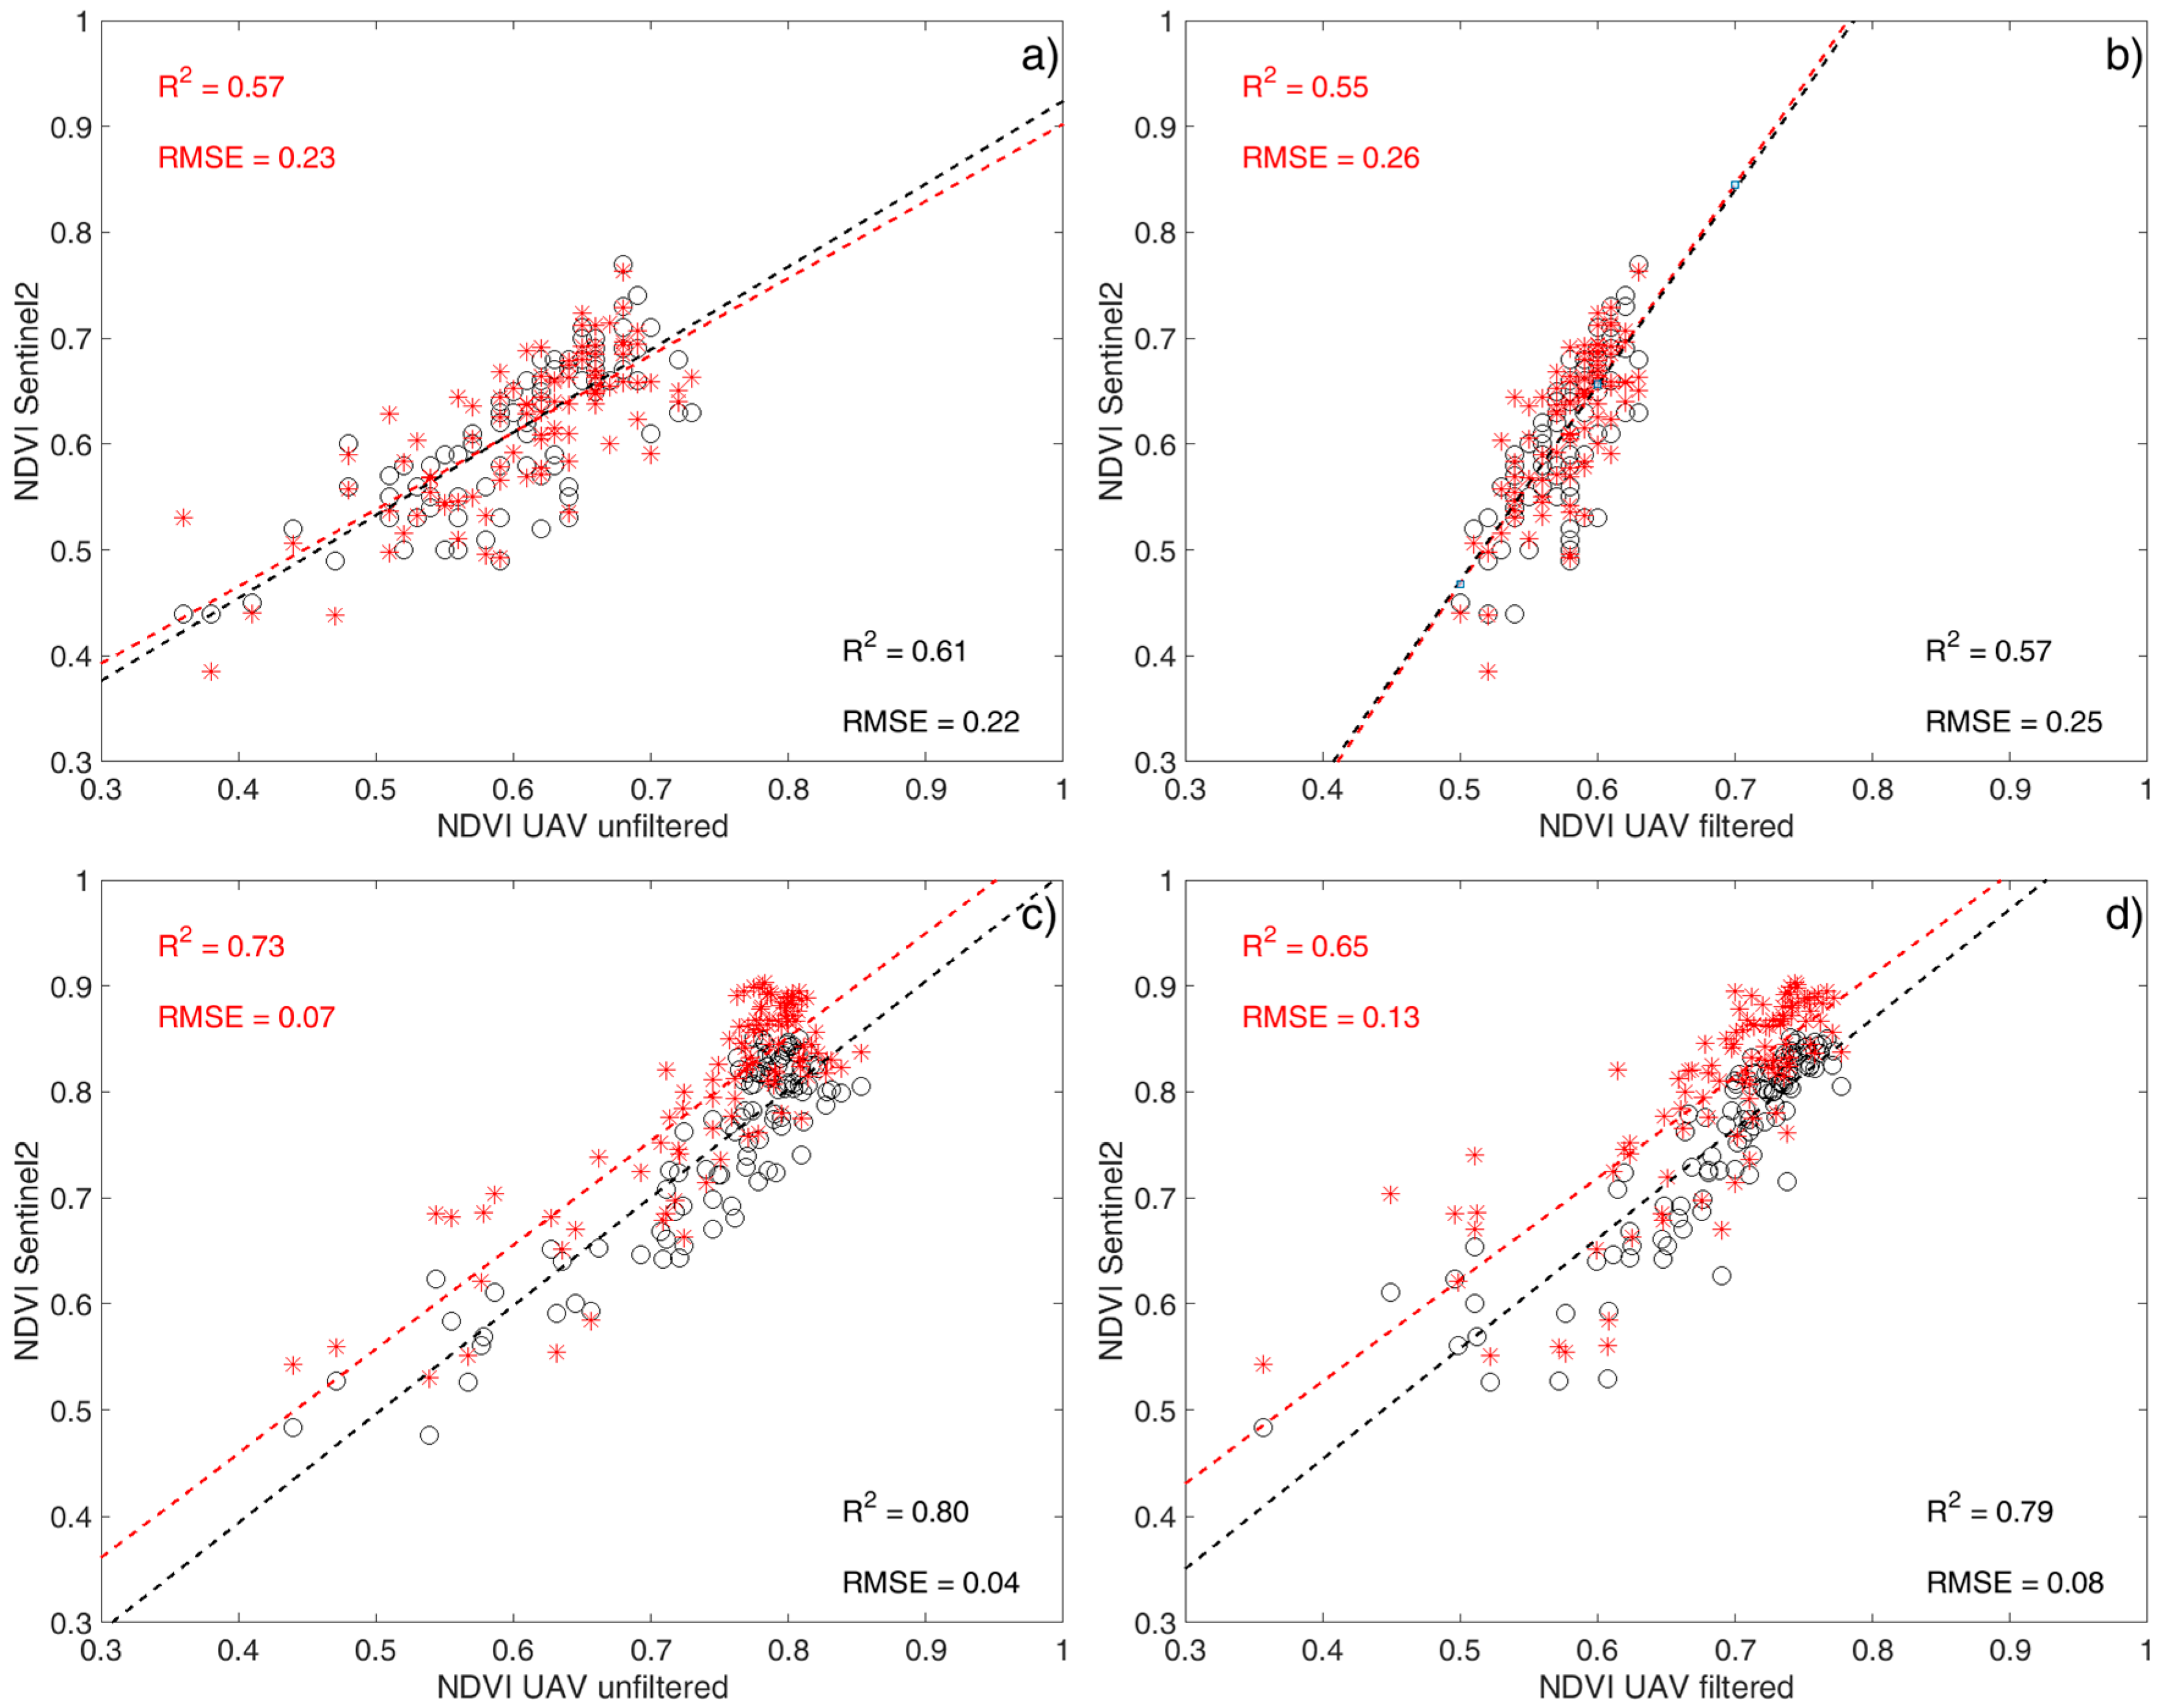
3.3. NDVI Comparison: UAV vs. Sentinel-2

This section shows the results of the NDVI comparison between UAV and Sentinel-2. In particular, Figure 3 represents the comparison between UAV_uf and UAV_f with S2 (images of 30 August and 19 September 2015), in V1 and V2, respectively.
As might be expected and was reported by Khaliq et al. [61], in both vineyards and images, S2 data show higher correlation with UAV_uf than UAV_f, except for V2 in August (same R2 value equal to 0.57) (Table 3). The improved efficiency of filtering UAV images is due to soil and shadow pixel removal, which impacts on NDVI, causing lower and higher values, respectively.
The correlations between S2 and UAV (filtered and unfiltered) are higher in the V2 vineyard for both S2 images (30 August and 19 September 2015). This could be explained by taking into account the different spatial distribution pattern of vigor between the two vineyards. Specifically, V2 was characterized by larger clusters of vegetation, while V1 had greater heterogeneity, especially in the south part. Confirming the results of Matese et al. [23], in the case of a vineyard having large vegetation clusters (V2) with a spatial gradient variability (trend), lower resolutions seem more informative, providing similar results in both platforms with respect to more irregular vegetation distribution in the cases of V1 (south part). The work of Kaliq et al. [61] is the only previous work available on the relationship between UAV and S2 data in viticulture. The authors focused on an effective filtering approach to remove inter-row pixel contribution on a row-based vineyard. That work achieved lower correlated results (0.55–0.72 Pearson correlation coefficients range) compared to our work, probably due to a different data analysis approach applied on a different training system architecture.

3.4. Ground Data and Remote Sensing Platforms Correlation

To compare different remote sensing platforms, correlation with ground data is pivotal to validate results as reported by several studies [78,79,85].
Table 4 shows the correlation matrix between ground data (see Table 2) and NDVI from remote sensing platforms (unfiltered and filtered UAV and Sentinel-2). There is a good correlation between NDVI from the UAV and from the satellite for quantitative agronomic parameters (yield, bunch weight, pruning wood, and leaf area) in both V1 and V2 vineyards and for both S2 image acquisition dates, with R2 varying from 0.60 for pruning biomass with S2 in V1 in September to 0.95 for yield with UAV_f in V2. Titratable acidity has a fluctuating trend but with low-medium R2 values, except for UAV_f in V2, where R2 is 0.69. Sugars do not seem to be correlated with the NDVI index in either vineyard nor with all remote sensing platforms; R2 values ranged from 0.02 to 0.20 in August and September S2 images, respectively, in V1, with a peak of 0.33 in the V2 vineyard with UAV_f. Those results are in line with general knowledge, according to which NDVI is well correlated to quantitative agronomic parameters (i.e., yield, bunch weight, pruning wood, and leaf area) while the correlation is quite weak with respect to the qualitative parameters (i.e., titratable acidity and sugars) [20,100,101].
The slight difference between UAV_uf and S2 in some R2 values for quantitative agronomic parameters, such as bunch weight, pruning biomass, and leaf area in V1 on both S2 image acquisition dates and pruning biomass in August and leaf area in September in V2, could be explained by the time gap of 10 and 9 days, respectively, between the UAV flight and the available S2 images of 30 August and 19 September 2015. As might be expected, in both vineyards, filtering technique, which allows only the pixels representing crop canopies in the correlation with ground data to be analyzed, slightly improves the already high R2 values of the unfiltered images. Exceptions were found in V1 for sugars and pruning biomass parameters in UAV_f with similar (0.10 vs. 0.10 R2) or lower (0.76 vs. 0.73 R2) correlation values than UAV_uf.
In V1 and V2, S2 has a high correlation coefficient (R2) for agronomic parameters closely related to biomass production such as yield, bunch weight, pruning wood, and leaf area (with values ranging from 0.60 for pruning biomass to 0.88 for yield in both V1 and in September). This trend (high R2 value) is similar for both S2 image acquisition dates, even if August S2 image has a better fit with respect to quantitative agronomic parameters (except for yield) due to low plant senescence in August.
According to the aim of this study, S2 correlation values are very similar to those of UAV_uf, demonstrating the effectiveness of spatial resolution provided by Sentinel-2 on crops with a continuous canopy such as an overhead trellis system. In contrast to the first comparison of S2 and UAV in a vineyard [61], which described an accurate spectral analysis on a row-based trellis system with visual vigor assessment validation, a strong point of this work is the high ground validation measurements related to yield, quality, and biomass parameters. The influence of bare soil plays a critical role in remote-sensing crop-monitoring approaches, strongly affecting the plant vigor estimation. In the case of bare soil, filtering methods applied to high resolution images provide the best solution for an effective analysis of crop spectral response. The S2 approach shows very good results in tendone systems, and the presence of limited zones with missing plants and bare soil (V1 ≤ 4%; V2 ≤ 2%) does not strongly affect our spectral and agronomical analysis.

4. Conclusions

This study performed a Sentinel-2 data validation versus UAV high-resolution images and ground key parameters such as biomass, yield, and grape composition sampled within different vigor zones at harvest time.
In terms of vineyard spatial variability, a visual inspection of UAV and Sentinel-2 NDVI maps shows the same vigor trend for each vineyard. For the NDVI values after the filtering technique, in both vineyards, Sentinel-2 data show a higher correlation with UAV_uf than UAV_f. As further proof of comparable outcomes between two remote sensing platforms, Sentinel-2’s lower resolution provides similar results with respect to UAV_uf, especially in the vineyard characterized by large vegetation clusters. This study also shows the good correlation between NDVIs elaborated from both platforms and agronomic key parameters, with a marginal improvement for the filtered UAV data. These results demonstrate the effectiveness of the spatial resolution provided by Sentinel-2 on an overhead trellis system viticulture, as already well-proven on other continuous crops, suggesting the diffusion of innovative technologies for site-specific management for an emerging viticulture area with low value-added production thanks, above all, to the free images provided by Sentinel-2.
Beyond the results of the present study, some of the future challenges facing the use of Sentinel-2 in PV concern the correlation and validation with biomass and production parameters in row-based vineyards given the inter-row spectral contribution due to the presence of bare soil, grass cover, and shadow pixels.

Author Contributions

All authors conceived and designed the study. S.F.D.G. and A.P. designed the experiment. S.F.D.G., R.D., A.P., P.T., and A.M. formulated the research methodology and wrote the manuscript. S.F.D.G., R.D., and A.P. provided necessary data curation. All authors reviewed and edited the draft.

Funding

This research received no external funding.

Acknowledgments

The authors are grateful to Andrea Berton (IFC-CNR) for technical support on UAV image acquisition. They also acknowledge Orsogna Winery for having hosted the experimental activities.

Conflicts of Interest

The authors declare no conflict of interest.

References

  1. Tisseyre, B.; Ojeda, H.; Taylor, J. New technologies and methodologies for site-specific viticulture. J. Int. Sci. Vigne Vin 2007, 41, 63–76. [Google Scholar] [CrossRef]
  2. Arnó, J.; Martínez Casasnovas, J.A.; Ribes Dasi, M.; Rosell, J.R. Review. Precision viticulture. Research topics, challenges and opportunities in site-specific vineyard management. Span. J. Agric. Res. 2009, 7, 779. [Google Scholar] [CrossRef] [Green Version]
  3. Morari, F.; Castrignanò, A.; Pagliarin, C. Application of multivariate geostatistics in delineating management zones within a gravelly vineyard using geo-electrical sensors. Comput. Electron. Agric. 2009, 68, 97–107. [Google Scholar] [CrossRef]
  4. Andrenelli, M.C.; Magini, S.; Pellegrini, S.; Perria, R.; Vignozzi, N.; Costantini, E.A.C. The use of the ARP© system to reduce the costs of soil survey for precision viticulture. J. Appl. Geophys. 2013, 99, 24–34. [Google Scholar] [CrossRef]
  5. Newson, D.N.; Nettelbeck, R.J. Precision mechanisation in the australian wine industry for product quality, and financial sustainability. Acta Hortic. 2013, 978, 355–367. [Google Scholar] [CrossRef]
  6. Rossi, R.; Pollice, A.; Diago, M.P.; Oliveira, M.; Millan, B.; Bitella, G.; Amato, M.; Tardaguila, J. Using an automatic resistivity profiler soil sensor on-the-go in precision viticulture. Sensors 2013, 13, 1121–1136. [Google Scholar] [CrossRef]
  7. Costa, J.M.; Vaz, M.; Escalona, J.; Egipto, R.; Lopes, C.; Medrano, H.; Chaves, M.M. Modern viticulture in southern Europe: Vulnerabilities and strategies for adaptation to water scarcity. Agric. Water Manag. 2016, 164, 5–18. [Google Scholar] [CrossRef]
  8. Balafoutis, A.; Beck, B.; Fountas, S.; Vangeyte, J.; Van Der Wal, T.; Soto, I.; Gómez-Barbero, M.; Barnes, A.; Eory, V. Precision agriculture technologies positively contributing to GHG emissions mitigation, farm productivity and economics. Sustainability 2017, 9, 1339. [Google Scholar] [CrossRef]
  9. Pérez-Expósito, J.P.; Fernández-Caramés, T.M.; Fraga-Lamas, P.; Castedo, L. Vinesens: An eco-smart decision-support viticulture system. Sensors 2017, 17, 465. [Google Scholar] [CrossRef]
  10. Santesteban, L.G. Precision viticulture and advanced analytics. A short review. Food Chem. 2019, 279, 58–62. [Google Scholar] [CrossRef]
  11. Bramley, R.G.V.; Hamilton, R.P. Understanding variability in winegrape production systems 1. Within vineyard variation in quality over several vintages. Aust. J. Grape Wine Res. 2004, 10, 32–45. [Google Scholar] [CrossRef]
  12. Latif, M.A. An Agricultural Perspective on Flying Sensors: State of the Art, Challenges, and Future Directions. IEEE Geosci. Remote Sens. Mag. 2018, 6, 10–22. [Google Scholar] [CrossRef]
  13. Gómez-Miguel, V.D.; Sotés, V.; Martínez, Á.; González-SanJosé, M.L. Use of remote sensing in zoning’s studies for terroir and precision viticulture: Implementation in DO Ca Rioja (Spain)/Uso de la teledetección en los estudios del terroir para la viticultura de precisión: Aplicación en la DO Ca Rioja (España). BIO Web Conf. 2016, 7, 01025. [Google Scholar] [CrossRef]
  14. Maimaitiyiming, M.; Sagan, V.; Sidike, P.; Kwasniewski, M.T. Dual activation function-based Extreme Learning Machine (ELM) for estimating grapevine berry yield and quality. Remote Sens. 2019, 11, 740. [Google Scholar] [CrossRef]
  15. Barnes, A.P.; Soto, I.; Eory, V.; Beck, B.; Balafoutis, A.; Sánchez, B.; Vangeyte, J.; Fountas, S.; van der Wal, T.; Gómez-Barbero, M. Exploring the adoption of precision agricultural technologies: A cross regional study of EU farmers. Land Use Policy 2019, 80, 163–174. [Google Scholar] [CrossRef]
  16. Reiser, D.; Paraforos, D.S.; Khan, M.T.; Griepentrog, H.W.; Vázquez-Arellano, M. Autonomous field navigation, data acquisition and node location in wireless sensor networks. Precis. Agric. 2017, 18, 279–292. [Google Scholar] [CrossRef]
  17. Matese, A.; Di Gennaro, S.F. Practical applications of a multisensor UAV platform based on multispectral, thermal and RGB high resolution images in precision viticulture. Agriculture 2018, 8, 116. [Google Scholar] [CrossRef]
  18. Rey-Caramés, C.; Diago, M.P.; Pilar Martín, M.; Lobo, A.; Tardaguila, J. Using RPAS multi-spectral imagery to characterise vigour, leaf development, yield components and berry composition variability within a vineyard. Remote Sens. 2015, 7, 14458–14481. [Google Scholar] [CrossRef]
  19. Gil, E.; Arnó, J.; Llorens, J.; Sanz, R.; Llop, J.; Rosell-Polo, J.R.; Gallart, M.; Escolà, A. Advanced technologies for the improvement of spray application techniques in Spanish viticulture: An overview. Sensors 2014, 14, 691–708. [Google Scholar] [CrossRef]
  20. Anastasiou, E.; Balafoutis, A.; Darra, N.; Psiroukis, V.; Biniari, A.; Xanthopoulos, G.; Fountas, S. Satellite and proximal sensing to estimate the yield and quality of table grapes. Agriculture 2018, 8, 94. [Google Scholar] [CrossRef]
  21. Borgogno-Mondino, E.; Lessio, A.; Tarricone, L.; Novello, V.; de Palma, L. A comparison between multispectral aerial and satellite imagery in precision viticulture. Precis. Agric. 2018, 19, 195–217. [Google Scholar] [CrossRef]
  22. Erena, M.; Montesinos, S.; Portillo, D.; Alvarez, J.; Marin, C.; Fernandez, L.; Henarejos, J.M.; Ruiz, L.A. Configuration and specifications of an unmanned aerial vehicle for precision agriculture. Int. Arch. Photogramm. Remote Sens. Spat. Inf. Sci. ISPRS Arch. 2016, 2016, 809–816. [Google Scholar] [CrossRef]
  23. Matese, A.; Toscano, P.; Di Gennaro, S.F.; Genesio, L.; Vaccari, F.P.; Primicerio, J.; Belli, C.; Zaldei, A.; Bianconi, R.; Gioli, B. Intercomparison of UAV, aircraft and satellite remote sensing platforms for precision viticulture. Remote Sens. 2015, 7, 2971–2990. [Google Scholar] [CrossRef]
  24. Karakizi, C.; Oikonomou, M.; Karantzalos, K. Spectral discrimination and reflectance properties of various vine varieties from satellite, UAV and proximate sensors. Int. Arch. Photogramm. Remote Sens. Spat. Inf. Sci. ISPRS Arch. 2015, 40, 31–37. [Google Scholar] [CrossRef]
  25. Barbedo, J.G.A. A review on the use of Unmanned Aerial Vehicles and imaging sensors for monitoring and assessing plant stresses. Drones 2019, 3, 40. [Google Scholar] [CrossRef]
  26. Simic Milas, A.; Sousa, J.J.; Warner, T.A.; Teodoro, A.C.; Peres, E.; Gonçalves, J.A.; Delgado Garcia, J.; Bento, R.; Phinn, S.; Woodget, A. Unmanned Aerial Systems (UAS) for environmental applications special issue preface. Int. J. Remote Sens. 2018, 39, 4845–4851. [Google Scholar] [CrossRef]
  27. Hunt, E.R.; Daughtry, C.S.T. What good are unmanned aircraft systems for agricultural remote sensing and precision agriculture? Int. J. Remote Sens. 2018, 39, 5345–5376. [Google Scholar] [CrossRef]
  28. Torres-Sánchez, J.; López-Granados, F.; Serrano, N.; Arquero, O.; Peña, J.M. High-throughput 3-D monitoring of agricultural-tree plantations with Unmanned Aerial Vehicle (UAV) technology. PLoS ONE 2015, 10, e0130479. [Google Scholar] [CrossRef]
  29. Di Gennaro, S.F.; Toscano, P.; Cinat, P.; Berton, A.; Matese, A. A low-cost and unsupervised image recognition methodology for yield estimation in a vineyard. Front. Plant Sci. 2019, 10, 559. [Google Scholar] [CrossRef]
  30. Pádua, L.; Marques, P.; Hruška, J.; Adão, T.; Peres, E.; Morais, R.; Sousa, J.J. Multi-temporal vineyard monitoring through UAV-based RGB imagery. Remote Sens. 2018, 10, 1907. [Google Scholar] [CrossRef]
  31. Weiss, M.; Baret, F. Using 3D Point Clouds Derived from UAV RGB Imagery to Describe Vineyard 3D Macro-Structure. Remote Sens. 2017, 9, 111. [Google Scholar] [CrossRef]
  32. Pichon, L.; Ducanchez, A.; Fonta, H.; Tisseyre, B. Quality of digital elevation models obtained from unmanned aerial vehicles for precision viticulture. OENO One 2016, 50, 101–111. [Google Scholar] [CrossRef]
  33. Mathews, A.J. Object-based spatiotemporal analysis of vine canopy vigor using an inexpensive unmanned aerial vehicle remote sensing system. J. Appl. Remote Sens. 2014, 8, 085199. [Google Scholar] [CrossRef]
  34. Kalisperakis, I.; Stentoumis, C.; Grammatikopoulos, L.; Karantzalos, K. Leaf area index estimation in vineyards from UAV hyperspectral data, 2D image mosaics and 3D canopy surface models. Int. Arch. Photogramm. Remote Sens. Spat. Inf. Sci. ISPRS Arch. 2015, 40, 299–303. [Google Scholar] [CrossRef]
  35. Carrillo, E.; Matese, A.; Rousseau, J.; Tisseyre, B. Use of multi-spectral airborne imagery to improve yield sampling in viticulture. Precis. Agric. 2016, 17, 74–92. [Google Scholar] [CrossRef]
  36. Romboli, Y.; Di Gennaro, S.F.; Mangani, S.; Buscioni, G.; Matese, A.; Genesio, L.; Vincenzini, M. Vine vigour modulates bunch microclimate and affects the composition of grape and wine flavonoids: An unmanned aerial vehicle approach in a Sangiovese vineyard in Tuscany. Aust. J. Grape Wine Res. 2017, 23, 368–377. [Google Scholar] [CrossRef]
  37. Matese, A.; Baraldi, R.; Berton, A.; Cesaraccio, C.; Di Gennaro, S.F.; Duce, P.; Facini, O.; Mameli, M.G.; Piga, A.; Zaldei, A. Estimation of Water Stress in grapevines using proximal and remote sensing methods. Remote Sens. 2018, 10, 114. [Google Scholar] [CrossRef]
  38. Santesteban, L.G.; Di Gennaro, S.F.; Herrero-Langreo, A.; Miranda, C.; Royo, J.B.; Matese, A. High-resolution UAV-based thermal imaging to estimate the instantaneous and seasonal variability of plant water status within a vineyard. Agric. Water Manag. 2017, 183, 49–59. [Google Scholar] [CrossRef]
  39. Baluja, J.; Diago, M.P.; Balda, P.; Zorer, R.; Meggio, F.; Morales, F.; Tardaguila, J. Assessment of vineyard water status variability by thermal and multispectral imagery using an unmanned aerial vehicle (UAV). Irrig. Sci. 2012, 30, 511–522. [Google Scholar] [CrossRef]
  40. Bellvert, J.; Zarco-Tejada, P.J.; Marsal, J.; Girona, J.; González-Dugo, V.; Fereres, E. Vineyard irrigation scheduling based on airborne thermal imagery and water potential thresholds. Aust. J. Grape Wine Res. 2016, 22, 307–315. [Google Scholar] [CrossRef]
  41. Poblete-Echeverría, C.; Espinace, D.; Sepúlveda-Reyes, D.; Zúñiga, M.; Sanchez, M. Analysis of crop water stress index (CWSI) for estimating stem water potential in grapevines: Comparison between natural reference and baseline approaches. Acta Hortic. 2017, 1150, 189–194. [Google Scholar] [CrossRef]
  42. Torres-Sánchez, J.; Marín, D.; De Castro, A.I.; Oria, I.; Jiménez-Brenes, F.M.; Miranda, C.; Santesteban, L.G.; López-Granados, F. Assessment of vineyard trimming and leaf removal using UAV photogrammetry. In Precision Agriculture ’19; Wageningen Academic Publishers: Wageningen, The Netherlands, 2019; pp. 187–192. [Google Scholar]
  43. Di Gennaro, S.F.; Battiston, E.; Di Marco, S.; Facini, O.; Matese, A.; Nocentini, M.; Palliotti, A.; Mugnai, L. Unmanned Aerial Vehicle (UAV)-based remote sensing to monitor grapevine leaf stripe disease within a vineyard affected by esca complex. Phytopathol. Mediterr. 2016, 55, 262–275. [Google Scholar]
  44. Albetis, J.; Duthoit, S.; Guttler, F.; Jacquin, A.; Goulard, M.; Poilvé, H.; Féret, J.B.; Dedieu, G. Detection of Flavescence dorée grapevine disease using Unmanned Aerial Vehicle (UAV) multispectral imagery. Remote Sens. 2017, 9, 308. [Google Scholar] [CrossRef]
  45. Kerkech, M.; Hafiane, A.; Canals, R. Deep leaning approach with colorimetric spaces and vegetation indices for vine diseases detection in UAV images. Comput. Electron. Agric. 2018, 155, 237–243. [Google Scholar] [CrossRef]
  46. Del-Campo-Sanchez, A.; Ballesteros, R.; Hernandez-Lopez, D.; Fernando Ortega, J.; Moreno, M.A. Quantifying the effect of Jacobiasca lybica pest on vineyards with UAVs by combining geometric and computer vision techniques. PLoS ONE 2019, 14, e0215521. [Google Scholar] [CrossRef] [PubMed]
  47. López-Granados, F.; Torres-Sánchez, J.; Serrano-Pérez, A.; de Castro, A.I.; Mesas-Carrascosa, F.J.; Peña, J.M. Early season weed mapping in sunflower using UAV technology: Variability of herbicide treatment maps against weed thresholds. Precis. Agric. 2016, 17, 183–199. [Google Scholar] [CrossRef]
  48. De Castro, A.I.; Peña, J.M.; Torres-Sánchez, J.; Jiménez-Brenes, F.; López-Granados, F. Mapping Cynodon dactylon in vineyards using UAV images for site-specific weed control. Adv. Anim. Biosci. 2017, 8, 267–271. [Google Scholar] [CrossRef]
  49. Jiménez-Brenes, F.M.; López-Granados, F.; Torres-Sánchez, J.; Peña, J.M.; Ramírez, P.; Castillejo-González, I.L.; de Castro, A.I. Automatic UAV-based detection of Cynodon dactylon for site-specific vineyard management. PLoS ONE 2019, 14, e0218132. [Google Scholar] [CrossRef]
  50. Su, B.; Jinru, X.; Chunyu, X.; Fang, Y.; Song, Y.; Fuentes, S. Digital surface model applied to unmanned aerial vehicle based photogrammetry to assess potential biotic or abiotic effects on grapevine canopies. Int. J. Agric. Biol. Eng. 2016, 9, 119. [Google Scholar]
  51. Pádua, L.; Marques, P.; Hruška, J.; Adão, T.; Bessa, J.; Sousa, A.; Peres, E.; Morais, R.; Sousa, J.J. Vineyard properties extraction combining UAS-based RGB imagery with elevation data. Int. J. Remote Sens. 2018, 39, 5377–5401. [Google Scholar] [CrossRef]
  52. Primicerio, J.; Caruso, G.; Comba, L.; Crisci, A.; Gay, P.; Guidoni, S.; Genesio, L.; Aimonino, D.R.; Vaccari, F.P. Individual plant definition and missing plant characterization in vineyards from high-resolution UAV imagery. Eur. J. Remote Sens. 2017, 50, 179–186. [Google Scholar] [CrossRef]
  53. De Castro, A.I.; Jiménez-Brenes, F.M.; Torres-Sánchez, J.; Peña, J.M.; Borra-Serrano, I.; López-Granados, F. 3-D characterization of vineyards using a novel UAV imagery-based OBIA procedure for precision viticulture applications. Remote Sens. 2018, 10, 584. [Google Scholar] [CrossRef]
  54. Robinson, J. The Oxford Companion to Wine; American Chemical Society: Washington, DC, USA, 2015; ISBN 9780198705383. [Google Scholar]
  55. Reynolds, A.G.; Vanden Heuvel, J.G. Influence of Grapevine Training Systems on Vine Growth and Fruit Composition: A Review. Am. J. Enol. Vitic. 2009, 60, 251–268. [Google Scholar]
  56. Louargant, M.; Jones, G.; Faroux, R.; Paoli, J.N.; Maillot, T.; Gée, C.; Villette, S. Unsupervised classification algorithm for early weed detection in row-crops by combining spatial and spectral information. Remote Sens. 2018, 10, 761. [Google Scholar] [CrossRef]
  57. Matese, A.; Di Gennaro, S.F.; Miranda, C.; Berton, A.; Santesteban, L.G. Evaluation of spectral-based and canopy-based vegetation indices from UAV and Sentinel 2 images to assess spatial variability and ground vine parameters. Adv. Anim. Biosci. 2017, 8, 817–822. [Google Scholar] [CrossRef]
  58. Matese, A.; Di Gennaro, S.F.; Berton, A. Assessment of a canopy height model (CHM) in a vineyard using UAV-based multispectral imaging. Int. J. Remote Sens. 2017, 38, 2150–2160. [Google Scholar] [CrossRef]
  59. Pérez-Ortiz, M.; Peña, J.M.; Gutiérrez, P.A.; Torres-Sánchez, J.; Hervás-Martínez, C.; López-Granados, F. A semi-supervised system for weed mapping in sunflower crops using unmanned aerial vehicles and a crop row detection method. Appl. Soft Comput. J. 2015, 37, 533–544. [Google Scholar] [CrossRef]
  60. Peña, J.M.; Torres-Sánchez, J.; de Castro, A.I.; Kelly, M.; López-Granados, F. Weed Mapping in Early-Season Maize Fields Using Object-Based Analysis of Unmanned Aerial Vehicle (UAV) Images. PLoS ONE 2013, 8, e77151. [Google Scholar] [CrossRef]
  61. Khaliq, A.; Comba, L.; Biglia, A.; Aimonino, D.R.; Chiaberge, M.; Gay, P. Comparison of satellite and UAV-based multispectral imagery for vineyard variability assessment. Remote Sens. 2019, 11, 436. [Google Scholar] [CrossRef]
  62. Nolan, A.P.; Park, S.; Fuentes, S.; Ryu, D.; Chung, H. Automated detection and segmentation of vine rows using high resolution UAS imagery in a commercial vineyard. In Proceedings of the 21st International Congress on Modelling and Simulation, Queensland, Australia, 29 November–4 December 2015; pp. 1406–1412. [Google Scholar]
  63. Comba, L.; Biglia, A.; Ricauda Aimonino, D.; Gay, P. Unsupervised detection of vineyards by 3D point-cloud UAV photogrammetry for precision agriculture. Comput. Electron. Agric. 2018, 155, 84–95. [Google Scholar] [CrossRef]
  64. Poblete-Echeverría, C.; Olmedo, G.F.; Ingram, B.; Bardeen, M. Detection and segmentation of vine canopy in ultra-high spatial resolution RGB imagery obtained from Unmanned Aerial Vehicle (UAV): A case study in a commercial vineyard. Remote Sens. 2017, 9, 268. [Google Scholar] [CrossRef]
  65. Cinat, P.; Di Gennaro, S.F.; Berton, A.; Matese, A. Comparison of unsupervised algorithms for Vineyard Canopy segmentation from UAV multispectral images. Remote Sens. 2019, 11, 1023. [Google Scholar] [CrossRef]
  66. Palliotti, A.; Tombesi, S.; Silvestroni, O.; Lanari, V.; Gatti, M.; Poni, S. Changes in vineyard establishment and canopy management urged by earlier climate-related grape ripening: A review. Sci. Hortic. 2014, 178, 43–54. [Google Scholar] [CrossRef]
  67. Palliotti, A.; Tombesi, S.; Frioni, T.; Silvestroni, O.; Lanari, V.; D’Onofrio, C.; Matarese, F.; Bellincontro, A.; Poni, S. Physiological parameters and protective energy dissipation mechanisms expressed in the leaves of two Vitis vinifera L. genotypes under multiple summer stresses. J. Plant Physiol. 2015, 185, 84–92. [Google Scholar] [CrossRef] [PubMed]
  68. Palliotti, A.; Silvestroni, O.; Leoni, F.; Agrarie, S.; Perugia, U.; Agrarie, S.; Ambientali, A.; Politecnica, U.; Vitivinicola, A.; Frutti-viticoltura, I.; et al. Canopy management and grape ripening in Vitis vinifera L.: Cultural practices to be reconsidered owing to climate change and new market demand. Italus Hortus 2012, 19, 1–15. [Google Scholar]
  69. Gily, B.M. The demise of the Italian pergola trellis. Aust. Vitic. 2009, 13, 37–38. [Google Scholar]
  70. Pascuzzi, S. Outcomes on the Spray Profiles Produced by the Feasible Adjustments of Commonly Used Sprayers in “Tendone” Vineyards of Apulia (Southern Italy). Sustainability 2016, 8, 1307. [Google Scholar] [CrossRef]
  71. Pascuzzi, S.; Cerruto, E.; Manetto, G. Foliar spray deposition in a “tendone” vineyard as affected by airflow rate, volume rate and vegetative development. Crop Prot. 2017, 91, 34–48. [Google Scholar] [CrossRef]
  72. De Bem, B.P.; Bogo, A.; Everhart, S.E.; Casa, R.T.; Gonçalves, M.J.; Filho, J.L.M.; Rufato, L.; da Silva, F.N.; Allebrandt, R.; da Cunha, I.C. Effect of four training systems on the temporal dynamics of downy mildew in two grapevine cultivars in southern Brazil. Trop. Plant Pathol. 2016, 41, 370–379. [Google Scholar] [CrossRef]
  73. Pascuzzi, S.; Cerruto, E. An innovative pneumatic electrostatic sprayer useful for tendone vineyards. J. Agric. Eng. 2015, 46, 123–127. [Google Scholar] [CrossRef] [Green Version]
  74. Pascuzzi, S. The effects of the forward speed and air volume of an air-assisted sprayer on spray deposition in tendone trained vineyards. J. Agric. Eng. 2013, 44, 125–132. [Google Scholar] [CrossRef]
  75. Giorio, P.; Nuzzo, V. Leaf area, light environment, and gas exchange in Montepulciano grapevines trained to Tendone trellising system. Plant Biosyst. 2012, 146, 322–333. [Google Scholar] [CrossRef]
  76. Vanino, S.; Pulighe, G.; Nino, P.; de Michele, C.; Bolognesi, S.F.; D’Urso, G. Estimation of evapotranspiration and crop coefficients of tendone vineyards using multi-sensor remote sensing data in a Mediterranean environment. Remote Sens. 2015, 7, 14708–14730. [Google Scholar] [CrossRef]
  77. ISTAT Tavola C26S8—Superficie (Ettari) e Produzione (Quintali): Uva da Tavola, Uva da Vino, Vino. Dettaglio per Regione. Available online: http://dati-censimentoagricoltura.istat.it/Index.aspx (accessed on 12 September 2019).
  78. Puliti, S.; Saarela, S.; Gobakken, T.; Ståhl, G.; Næsset, E. Combining UAV and Sentinel-2 auxiliary data for forest growing stock volume estimation through hierarchical model-based inference. Remote Sens. Environ. 2018, 204, 485–497. [Google Scholar] [CrossRef]
  79. Navarro, J.A.; Algeet, N.; Fernández-Landa, A.; Esteban, J.; Rodríguez-Noriega, P.; Guillén-Climent, M.L. Integration of UAV, Sentinel-1, and Sentinel-2 data for mangrove plantation aboveground biomass monitoring in Senegal. Remote Sens. 2019, 11, 77. [Google Scholar] [CrossRef]
  80. Majasalmi, T.; Rautiainen, M. The potential of Sentinel-2 data for estimating biophysical variables in a boreal forest: A simulation study. Remote Sens. Lett. 2016, 7, 427–436. [Google Scholar] [CrossRef]
  81. Punalekar, S.M.; Verhoef, A.; Quaife, T.L.; Humphries, D.; Bermingham, L.; Reynolds, C.K. Application of Sentinel-2A data for pasture biomass monitoring using a physically based radiative transfer model. Remote Sens. Environ. 2018, 2018, 207–220. [Google Scholar] [CrossRef]
  82. Padró, J.C.; Muñoz, F.J.; Ávila, L.Á.; Pesquer, L.; Pons, X. Radiometric correction of Landsat-8 and Sentinel-2A scenes using drone imagery in synergy with field spectroradiometry. Remote Sens. 2018, 10, 1687. [Google Scholar] [CrossRef]
  83. Defourny, P.; Bontemps, S.; Bellemans, N.; Cara, C.; Dedieu, G.; Guzzonato, E.; Hagolle, O.; Inglada, J.; Nicola, L.; Rabaute, T.; et al. Near real-time agriculture monitoring at national scale at parcel resolution: Performance assessment of the Sen2-Agri automated system in various cropping systems around the world. Remote Sens. Environ. 2019, 221, 551–568. [Google Scholar] [CrossRef]
  84. Toscano, P.; Castrignanò, A.; Filippo, S.; Gennaro, D.; Vittorio, A.; Ventrella, D.; Matese, A. A precision agriculture approach for durum wheat yield assessment using remote sensing data and yield mapping. Agronomy 2019, 9, 437. [Google Scholar] [CrossRef]
  85. Liu, Q.; Zhang, T.; Li, Y.; Li, Y.; Bu, C.; Zhang, Q. Comparative Analysis of Fractional Vegetation Cover Estimation Based on Multi-sensor Data in a Semi-arid Sandy Area. Chin. Geogr. Sci. 2019, 29, 166–180. [Google Scholar] [CrossRef]
  86. Maurya, A.K.; Singh, D.; Singh, K.P. Development of fusion approach for estimation of vegetation fraction cover with drone and sentinel-2 data. Int. Geosci. Remote Sens. Symp. 2018, 7448–7451. [Google Scholar]
  87. Kazantsev, T.; Shevchenko, V.; Bondarenko, O.; Furier, M.; Samberg, A.; Ametov, F.; Iakovenko, V. COTS UAV-borne multispectral system for vegetation monitoring. In Proceedings of the Remote Sensing for Agriculture, Ecosystems, and Hydrology XX, Berlin, Germany, 10–13 September 2018; pp. 1–10. [Google Scholar]
  88. Agisoft, Photoscan Professional. Available online: https://www.agisoft.com (accessed on 1 October 2019).
  89. Kelcey, J.; Lucieer, A. Sensor correction of a 6-band multispectral imaging sensor for UAV remote sensing. Remote Sens. 2012, 4, 1462–1493. [Google Scholar] [CrossRef]
  90. MATLAB, version 2016; MathWorks Inc.: Natick, MA, USA.
  91. Rouse, J.W.J.; Haas, R.H.; Schell, J.A.; Deering, D.W. Monitoring Vegetation Systems in the Great Plains with ERTS. In Proceedings of the Third Earth Resources Technology Satellite–1 Symposium, Washington, DC, USA, 10–14 September 1974; pp. 309–317. [Google Scholar]
  92. QGIS, Noosa Version. Available online: https://www.qgis.org/it/site/ (accessed on 1 October 2019).
  93. Amerine, M.A.; Ough, C.S. Grape pigments. In Methods for Analysis of Musts and Wines; John Wiley and Sons: New York, NY, USA, 1980; ISBN 0471050776. [Google Scholar]
  94. Slinkard, K.; Singleton, V.L. Total Phenol Analysis: Automation and Comparison with Manual Methods. Am. J. Enol. Vitic. 1977, 28, 49–55. [Google Scholar]
  95. Nonni, F.; Malacarne, D.; Pappalardo, S.E.; Codato, D.; Meggio, F.; De Marchi, M. Sentinel-2 Data Analysis and Comparison with UAV Multispectral Images for Precision Viticulture. GI Forum 2018, 1, 105–116. [Google Scholar] [CrossRef]
  96. Orsogna Winery agronomist. Personal communication, 2015.
  97. Vaudour, E.; Leclercq, L.; Gilliot, J.M.; Chaignon, B. Retrospective 70 y-spatial analysis of repeated vine mortality patterns using ancient aerial time series, Pléiades images and multi-source spatial and field data. Int. J. Appl. Earth Obs. Geoinf. 2017, 58, 234–248. [Google Scholar] [CrossRef]
  98. Ruffner, H.P. Metabolism of Tartaric and Malic Acids in Vitis: A Review-Part B. Vitis 1982, 21, 346–358. [Google Scholar]
  99. Mori, K.; Goto-Yamamoto, N.; Kitayama, M.; Hashizume, K. Loss of anthocyanins in red-wine grape under high temperature. J. Exp. Bot. 2007, 58, 1935–1945. [Google Scholar] [CrossRef]
  100. Hall, A.; Lamb, D.W.; Holzapfel, B.P.; Louis, J.P. Within-season temporal variation in correlations between vineyard canopy and winegrape composition and yield. Precis. Agric. 2011, 12, 103–117. [Google Scholar] [CrossRef]
  101. Hansen, P.M.; Schjoerring, J.K. Reflectance measurement of canopy biomass and nitrogen status in wheat crops using normalized difference vegetation indices and partial least squares regression. Remote Sens. Environ. 2003, 86, 542–553. [Google Scholar] [CrossRef]
Figure 1. Montepulciano vineyard (V1) trained with a tendone trellis system (a,b) monitored with the unmanned aerial vehicle (UAV) platform equipped with a multispectral camera (c).
Remotesensing 11 02573 g001
Figure 2. Study vineyards Costa di Moro (V1, left) and Magliano (V2, right) vigor maps, elaborated from UAV (a,b) and from Sentinel-2 (c,d images of 30 August 2015; e,f images of 19 September 2015).
Remotesensing 11 02573 g002
Figure 3. UAV vs. S2 NDVI images 30 August 2015 (red star) and 19 September 2015 (black circle) comparison in V1 (unfiltered (UAV_uf) (a) and filtered (UAV_f) (b)) and V2 (UAV_uf (c) and UAV_f (d)).
Remotesensing 11 02573 g003
Table 1. Experimental vineyards.
Costa di Moro (V1)Magliano (V2)
Location42°12′57″N; 14°19′42″E42°17′07″N; 14°18′34″E
Surface (ha)1.601.25
Altitude (m a.s.l.)220330
Planting year20022004
VarietyMontepulciano (clone R7)Montepulciano (clone R7)
RootstockCOBER 5BBCOBER 5BB
Trellis systemTendoneTendone
Vine spacing (m)2.5 × 2.52.5 × 2.5
Slope (%)6–71–2
ExposureSouthSouth-East
Soil Organic Carbon (%)1.031.71
Soil typecalcaric regosolcalcaric cambisol
Table 2. Ground sampling data (mean ± standard deviation). LV = low vigor; MV = mean vigor; HV = high vigor.
SiteVigor ZoneYield (kg/vine)Bunch Weight (g)Sugars (° Babo)Titratable Acidity (g/L)Pruning Biomass (kg/vine)Leaf Area (m2/vine)
V1HV8.3±0.7238.2±9.218.8±0.95.7±0.21.7±0.110.9±0.5
MV6.5±0.5178.3±10.419.2±0.35.3±0.41.3±0.16.3±0.5
LV4.1±0.3130.7±6.018.3±0.35.1±0.20.9±0.14.1±0.2
V2HV10.3±0.7264.8±12.219.5±0.75.5±0.11.9±0.112.5±0.7
MV7.6±0.5191.6±8.219.9±0.95.4±0.31.4±0.17.4±0.5
LV4.2±0.4132.3±4.018.5±0.54.8±0.30.9±0.44.4±0.5
Table 3. Comparison between UAV unfiltered and filtered (10 September 2015) and Sentinel-2 (30 August and 19 September 2015) images.
SiteS2 ImageUAV_ufUAV_f
R2RMSER2RMSE
V130 August0.570.230.570.25
19 September0.610.220.550.26
V230 August0.730.070.650.13
19 September0.800.040.790.08
Table 4. Correlation coefficients (R2) between remote and ground data.
Site YieldBunch WeightSugarsTitratable AcidityPruning BiomassLeaf Area
V1S2 August0.820.700.020.190.670.68
S2 September0.880.690.200.320.600.64
UAV_uf0.840.850.100.400.760.86
UAV_f0.910.890.100.510.730.92
V2S2 August0.850.820.120.440.790.79
S2 September0.850.760.120.340.720.69
UAV_uf0.830.780.190.560.710.82
UAV_f0.950.870.330.690.850.83

