Letter

Soil Moisture Estimation by GNSS Multipath Signal

1
School of Geodesy and Geomatics, Wuhan University, Wuhan 430079, China
2
Key Laboratory of Geospace Environment and Geodesy, Ministry of Education, Wuhan 430079, China
3
School of Environmental Science and Spatial Informatics, China University of Mining and Technology, Xuzhou 221116, China
4
Chongqing Meteorological Bureau, Chongqing 401147, China
*
Author to whom correspondence should be addressed.
Remote Sens. 2019, 11(21), 2559; https://doi.org/10.3390/rs11212559
Submission received: 26 September 2019 / Revised: 28 October 2019 / Accepted: 30 October 2019 / Published: 31 October 2019
(This article belongs to the Special Issue Global Navigation Satellite Systems for Earth Observing System)

Abstract

:
Global navigation satellite system (GNSS) multipath signals received by a geodetic-quality GNSS receiver can be used to estimate the water content of soil around the antenna. The direct signals from satellite to GNSS antenna are the most valuable signals in geodetic measurement, such as positioning, navigation, GNSS control network, deformation monitoring, and so on. However, the GNSS antenna also captures the reflected signals from the ground, which contain information of surrounding environment, so that useful information about the reflection surface can be inferred by analyzing the reflected signal. This technique is termed as GNSS-interferometric reflectometry. The signal-to-noise ratio (SNR) data recorded by a receiver contains SNR component of reflected signals, which is related to the soil moisture of the ground. The changes of soil moisture content will cause the change of soil permittivity and reflectivity which are the key factors that make further change of the SNR of reflected signals. We used the measured data to evaluate the correlation between amplitude of multipath induced SNR time series and real soil moisture. An improved soil moisture estimation algorithm based on multipath induced SNR amplitude data is proposed in this paper. The performance of the proposed soil moisture estimation method is evaluated using the 15-month data recorded by PBO H2O GNSS station and a 14-day experiment in Wuhan, China. The experimental results show that the estimated soil moisture has a strong correlation with the real soil moisture and the estimation accuracy in terms of root-mean-square error (RMSE) is 0.0345 cm3cm−3 and 0.0339 cm3cm−3, respectively. Meanwhile, the application scope of the method is given.

Graphical Abstract

1. Introduction

In addition to the basic functions of positioning, navigation, and timing, a global navigation satellite system (GNSS) can be utilized for a range of other applications including communications, surveillance, and remote sensing such as atmosphere sensing, earthquake monitoring, and deformation monitoring [1,2,3]. Global positioning system (GPS) reflected signal was first used for sensing ocean wind, proposed by Hall and Cordey in 1988 [4]. Since then, GNSS reflectometry has been investigated for estimating a range of geophysical parameters, including ocean altimetry [5,6,7], significant wave height [8,9,10], tsunami height and wavelength [11,12,13], snow depth [14,15], soil moisture [16], and plant coverage [17,18,19].
The direct and reflected signals can be received by a single GNSS receiver antenna and the technique is termed as GNSS interferometric reflectometry (GNSS-IR). The main reason why GNSS-IR works is that the magnitude of the signal-to-noise ratio (SNR) time series recorded by receiver varies as the water content of the soil around the GNSS antenna changes [20]. An estimation model was proposed by Clew to retrieve the soil moisture for the top 5 cm of bare soil [21]. There are thousands of geodetic-quality GNSS receivers deployed throughout the world, which are used as Continuously Operating Reference Stations (CORS). Geodetic-quality GNSS receivers are not designed for remote sensing, but they can be used to provide a new, cost-effective and high-efficiency method to sense geophysical parameters such as soil moisture and snow depth. GNSS signals are well suited for near surface remote sensing as they use L-band frequency (microwave frequency). For microwave frequencies, the soil permittivity and signal reflection coefficient are highly dependent on soil moisture [22]. Because of this effect, the SNR or power of ground-reflected GNSS signals are considerably affected by the amount of water contained in the soil.
Zavorotny et al. developed a quantitative relationship between soil moisture and reflected GPS signals by a stationary tower-based experiment [23]. A delay mapping receiver was used to record GPS reflected data in a soil moisture experiment in 2002, Iowa, USA [24]. Larson et al. observed that the ground reflected signal captured by a geodetic-quality GPS antenna is sensitive to soil moisture so that it is possible to use the GPS signals to sense soil moisture [25,26,27]. Yan et al. verified the feasibility of soil moisture estimation based on GPS L1 band interference signals by analyzing the frequency and initial phase variation before and after rainfall [28]. Wu and Jin simulated DBS delay Doppler maps (DDM) reflected from vegetation to obtain vegetation characteristics [29]. Luo et al. built an empirical model based on the relationship between soil reflection coefficient and soil moisture [30]. Ban et al. proposed four methods of soil moisture estimation based on GEO interferometric reflectometry (GEO-IR) and GEO reflectometry (GEO-R) [31]. The effect of plant coverage on reflected SNR data was also observed so that the effect needs to be mitigated to achieve better estimation of the soil moisture [32]. This is also in accordance with results of a field test experiment reported in [33].
PBO H2O is a project that uses GNSS reflection data from NSF’s Plate Boundary Observatory (PBO) to study the water cycle, such as snow, snow water equivalent (SWE), soil moisture, and vegetation. Soil moisture estimation is based on fluctuations in phase offset and the linear relationship is based on forward modeling with measured soil moisture [22]. In fact, the change in phase offset is not only affected by soil moisture, but also satellite elevation, and the reflected signal signal-to-noise ratio (SNR) sequence is not a standard trigonometric function. As the totally fitting method would treat the signal amplitude of SNR sequence as a constant, which is an attenuated variable in fact, this would cause the loss of signal amplitude characteristics and the phase estimation error of SNR sequence. In addition, the noise of SNR sequence would also affect the parameters estimation accuracy of SNR signal for the totally fitting method. Here, an improved method is proposed for soil moisture estimation using GNSS-IR. Median filtering is applied to initially processed SNR data. The filtered SNR series is then fitted piecewise with a parabolic function. The peak values of the fitted SNR series are averaged to generate the average peak value. A model is then established to describe the relation between the average peak value and soil moisture. More details about the proposed method will be described in the following sections.

2. Methods

2.1. Retrieval of Signal-Noise Ratio Multipath Signal

A geodetic-quality GNSS antenna is typically installed with face up as shown in Figure 1. The antenna captures both direct and ground-reflected signals, which are processed by the receiver. To enhance positioning accuracy, the reflected or multipath signals are mitigated significantly by different techniques. For instance, the antenna is manufactured with a specific radiation pattern where the antenna gains at negative elevation angles are much smaller than those of median to large positive elevation angles. However, some energy of multipath signals still goes through the antenna and interferes with the direct signal, producing measurement errors [34,35,36,37]. After being reflected from the ground surface, the amplitude, frequency, and phase of the signals are changed, and so is the observed SNR. The amount of the parameter variation mainly depends on the dielectric constant of the ground, which is primarily a function of the soil moisture content. Thus, GNSS receivers can be used to estimate dielectric constant and retrieve soil moisture [22].
The upper panel of Figure 2 shows a time series of SNR data recorded by a GPS receiver. It contains SNR components of direct and reflected signals. Clearly, with the increase of the elevation angle, the time series shows a slowly rising trend. This is mainly caused by the variation of the SNR component of direct signal due to the antenna gain variation. The fast-periodic variation is produced by multipath interference. This multipath induced component contains the information of the reflective ground surface, while the direct component does not. Therefore, before analyzing the reflected component, it is necessary to remove the direct component. A parabolic function can be used to model the rising trend or the direct component. In this case, the parabolic function is given by
S N R d = 12.94 ( sin θ ) 2 + 22.94 sin θ + 32.78
where S N R d is the SNR of direct signal.
After subtracting the modelled direct component from the original time series, the multipath induced component is generated as shown in the lower panel of Figure 1. In fact, the amplitude of the resulting component is still affected by the direct component as derived in the following section. It can also clearly be observed that the multipath induced component is considerably corrupted by noise. Thus, filtering and fitting are required to recover the waveform. More details about the filtering and fitting will be presented in the next section.

2.2. Normalization of Signal-Noise Ratio Multipath Signal

The reflected signal from specular scattering point will arrive at the receiver with a reflection excess phase with respect to the direct phase, known as the interferometric phase, given by [37]
δ φ r ( t ) = 4 π H 0 λ sin θ ( t )
where θ ( t ) is the time-varying satellite elevation angle, H 0 is the antenna height relative to the reflection surface, and λ is the wavelength of GNSS signal. Due to the geometrical relationship, the squared amplitude (A) of received signal can be expressed as [38,39,40]
A 2 = A d 2 + A r 2 + 2 A d A r cos δ φ r ( t )
where
A r = α A d
Here, A d   and A r are the amplitude of direct and reflected signal, and α is the amplitude attenuation factor (AAF) as studied in our previous work [40]. The AAF mainly depends on the characteristics of scattering surface and antenna gain patterns. Assuming a purely RHCP (right-hand circularly polarized) incident electric field, the received direct power P d and reflected power P r can be written as [39,41]
{ P d = P G d W d 2 = A d 2 P r = P | X E W r | 2 = ( α A d ) 2
where P is the power of received direct signals arriving at the antenna, G d is the antenna gain for the direct signal, W d   and W r are direct and reflected signals’ real-valued Woodward ambiguity function. X is the complex-valued sum of the reflection coefficients including the effect of the antenna gain, E is coherent power loss that is related to soil roughness. Accordingly, the AAF can be expressed as
α = P | X E W r | P G d W d 2
Therefore, the SNR of received signals can be described as
S N R = P N 0 = A 2 N 0 = A d 2 N 0 + 2 α A d 2 N 0 cos δ φ r ( t ) + ( α A d ) 2 N 0
where N 0 is the noise power. The first term and the third term in (7) are the SNR components of the direct signal and reflected signal, respectively. The second term in (7), caused by multipath interference and denoted by M e r r o r , is of interest, which can be expressed as
M e r r o r = 2 α A d 2 N 0 cos δ φ r ( t ) = S N R A d 2 N 0 ( α A d ) 2 N 0
As the GNSS signals travel through the atmosphere including ionosphere and troposphere, the strength of GNSS signal would vary significantly. Thus, it is necessary to mitigate such effect so that the variations in the observed GNSS signals are basically only associated with the reflection surface. One way to achieve this purpose is to get rid of A d 2 / N 0 from the left-hand side of second equation in (8). Dividing both sides of (8) by A d 2 / N 0 produces
M n o r m a l = M e r r o r A d 2 N 0 = 2 α cos δ φ r ( t ) = S N R A d 2 N 0 1 α 2
where M n o r m a l is the normalized value of M e r r o r .
In practice, the direct component of SNR can be fitted by a parabolic function like (1) so that the division operation can be readily performed. The parameter M n o r m a l will be used for regression analysis modeling after further processing in next section.

2.3. Data Processing and Estimation Procedure

In the data preprocessing stage as Figure 3 shows, the SNR data recorded by the receiver are first classified according to different satellites. The revisiting period of GPS satellites is slightly less than 12 h, so there will be up to four available periods which can be used for soil moisture retrieval each day, that is, two ascending periods and two descending periods, corresponding to sequences of elevation angles up to around 25 degrees, in which the multipath induced SNR amplitude is significant as shown in Figure 2. Since the two satellite revisiting trajectories in a day are different, the ground reflection areas corresponding to the two ascending and descending periods are also different. Therefore, it is necessary to divide the SNR data into four groups associated with the four ascending and descending periods and to process each group of SNR data independently.
There are considerable errors in the recorded original SNR data. Especially when the elevation angles are between 0 to 5 degree the quality of data is dramatically deteriorated due to the blockage of buildings and structures as well as specific topologies. Thus, the SNR data with elevation angles from 5 to 25 degrees are selected for further processing. To mitigate the observation error and noise, the selected data are smoothed by a median filter, which is easy to implement and often more effective than the simple average algorithm. A 0.1-degree window of elevation angle is used, and the median of the SNR data within the window is treated as the SNR value over the window duration. The window is moving from the start to the end of the selected SNR series without overlapping. Thus, this filtering technique may be termed sliding window moving median (SWMM). The selection of the smoothed window size is related to the sampling rate of the data used. The GPS satellite orbital period is approximately 12 h and its average angular velocity is approximately 0.0083 degrees per second. Therefore, the time required for each satellite angle change of 0.1 degrees is about 12 s. When the GPS data sampling period is 1 s, each smoothing window will have 12 observations. Such a number of observations are sufficient to make a smoothing algorithm effective. On the other hand, if the sampling period of GPS data is 5 s, then each 0.1-degree smoothing window has only 2 observations, making effective smoothing or filtering unlikely. An example of the filtering results is shown in Figure 4, represented by the blue dashed line. It can be seen that the median filter is effective, significantly reducing the noise compared with the original SNR series as shown in Figure 2. The original SNR observation sequence shown in Figure 2 is not plotted here for clarity.
As seen from (8) and (9), the multipath induced SNR is not a standard sinusoidal function, but a quasi-sinusoidal signal. Due to the influence of the antenna gain, as the elevation angle increases, the multipath induced SNR tends to decay. To further reduce the observation noise, a parabolic function is used to fit each sequence over each positive and negative semi-cycle as given by
M = a ( sin θ ) 2 + b ( sin θ ) + c
where a , b , and c are the fitting coefficients of parabolic function. For each parabolic function, it can be derived that the local maximum or minimum function values at the crest or trough points are equal to
M ( i ) = 4 a i c i b i 2 4 a i
Figure 4 shows median filtering and parabolic fitting results. The pink solid line represents the piecewise fitting results, while the red dots denote the crest and trough points of the fitting parabolic function, which are equal to the values calculated by (11). It was observed that those maximum and minimum values are sensitive to the soil moisture. Motivated by this observation, we propose to use the average of the maximum and minimum values, termed ‘average peak’, as a relevant variable given by
M ¯ = 1 n i = 1 n | M ( i ) |
where n maximum and minimum values are used to calculate the average peak. The use of average is intended to reduce the effect of noise and interference. The environment and soil composition surrounding different GPS stations are usually different, so it is necessary to establish an empirical model to describe the relationship between the soil moisture and the average peak M ¯ for each station independently. For the same satellite, the absolute average peaks in the same type of track are sequentially ordered by date to form a time series of average peaks. An empirical inversion model will be established using regression analysis of the average peak series of all available satellites and measured data in the following section.

2.4. Introduction of Experiments Data

The PBO H2O project was funded by the NSF GEO directorate, specifically the Atmospheric Sciences, Hydrology, and EarthScope programs. The water cycle products from GPS data (primarily the Plate Boundary Observatory) had been computed and archived on the website. Figure 5 shows a GNSS station of PBO H2O, MFLE, which is located in Boulder, Colorado. The soil around the station is desert steppe, where vegetation variation is insignificant over the four different seasons. Two studies showed that the vegetation effect around MFLE station can be ignored [32,42]. Therefore, we choose MFLE station data for our experimental studies. PBO H2O project also provides the estimation results of some GNSS stations on the website. (https://www.unavco.org/data/gps-gnss/data-access-methods/dai2/app/dai2.html).
Since there are not soil moisture measurements at other PBH H20 stations, we used the data collected during a short-term experiment recently conducted in Wuhan, China for GNSS soil moisture estimation. Part of the satellite data was used to build empirical model, while others were used for verification. Wuhan experiment is described in Section 3.2.

2.5. Method of Modelization

MFLE is a L2C station with a high data rate logging, which has been used for investigating GPS based soil moisture retrieval at University of Colorado Boulder. In order to control complex variables, the terrain around the station is gentle and the vegetation coverage is low. The ground reflected tracks of signals of six GPS satellites are also showed in Figure 5. The station is at mid-latitude of the northern hemisphere, so the reflected tracks are mostly distributed in the south and west directions.
According to Figure 3, the data of MFLE are processed to generate the time series of M ¯ . As we classified data based on satellites’ ascending and descending periods, there are 28 satellites, each of which has at least one complete data set over all observation periods of the year and there are totally 62 usable data sequences. Figure 6 shows three such M ¯   sequences associated with three satellites, denoted by blue, red and green lines respectively. For example, G01.ascend.1 means that the results are produced by GPS data observed over the first ascending periods of satellite G01. The yellow histogram represents the in-situ soil moisture measured by the probe as ground-truth data. When the soil moisture increases, the electrical conductivity of soil increases, more power of signal is absorbed by soil and hence less power is reflected to the receiver. This is in accordance with the results showed in Figure 6 where the M ¯ time series show a negative correlation with the in-situ soil moisture. Based on this fact, the reciprocal of each average peak M ¯ is used, that is, the observation variable is defined as
M r e c i p r o c a l ( q ) = 1 k j = 1 k 1 M ¯ j ( q )
where q is the index of days, there are k average peaks of all satellites in a day, and M ¯ j ( q ) is the kth average peak on the qth day. The daily time series of M r e c i p r o c a l is then used in regression analysis for modeling.

3. Experiments

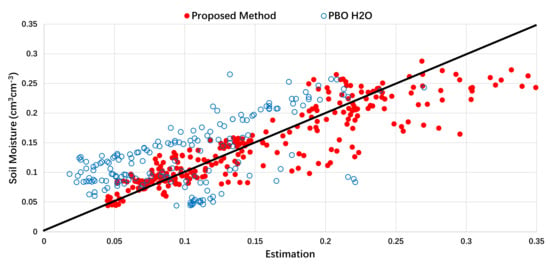
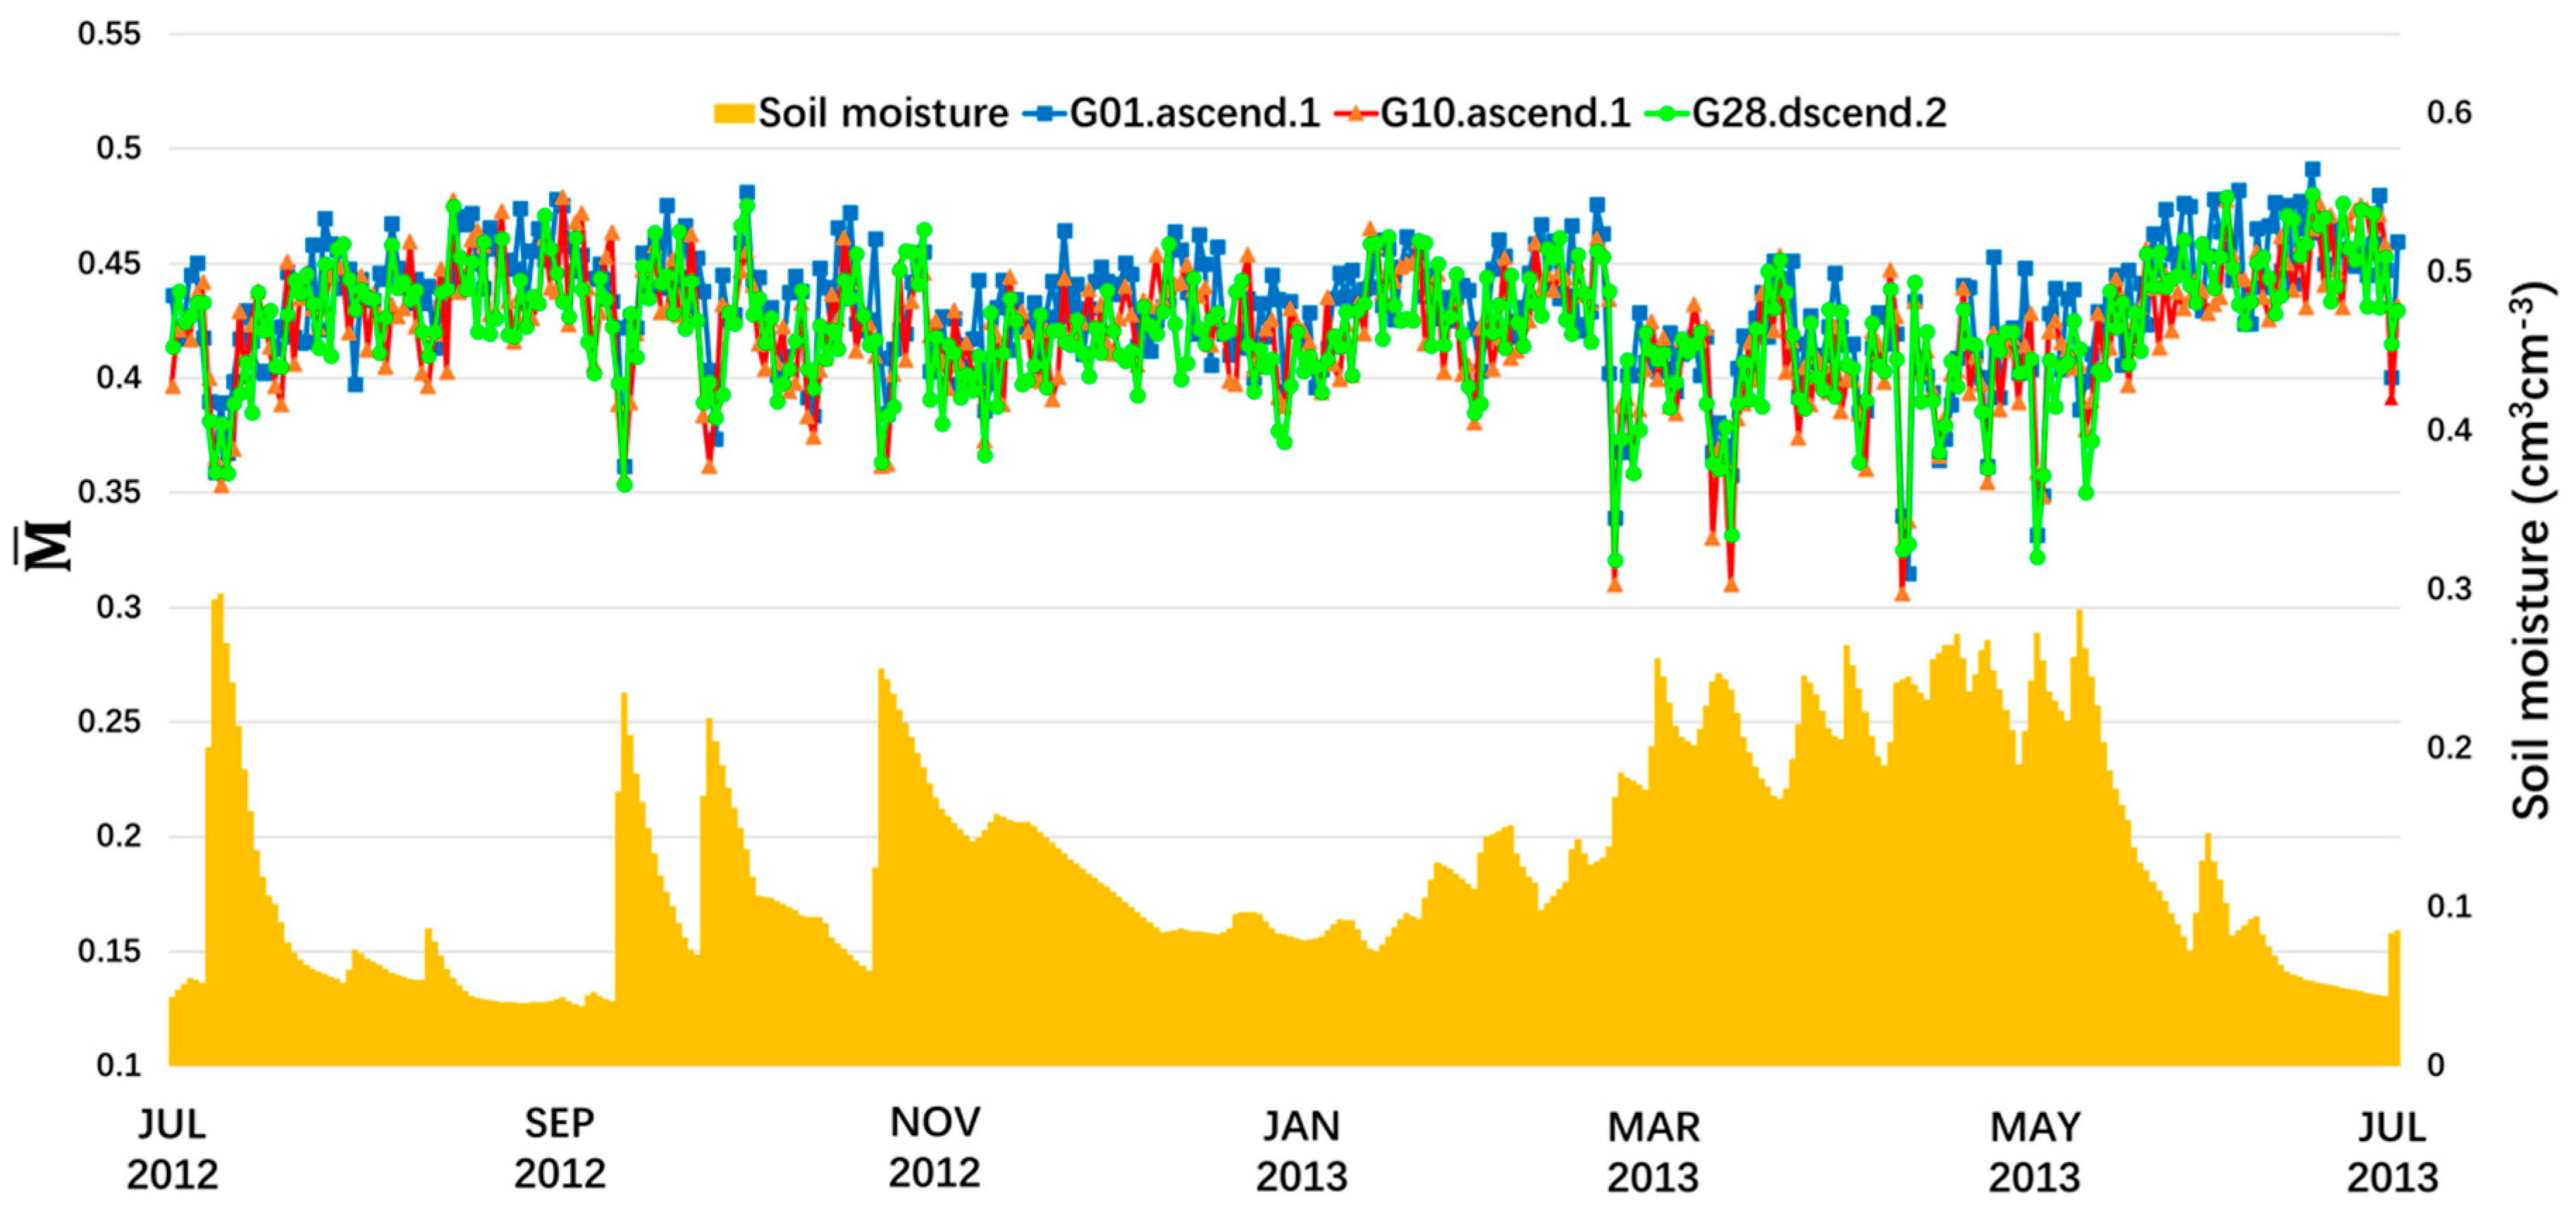
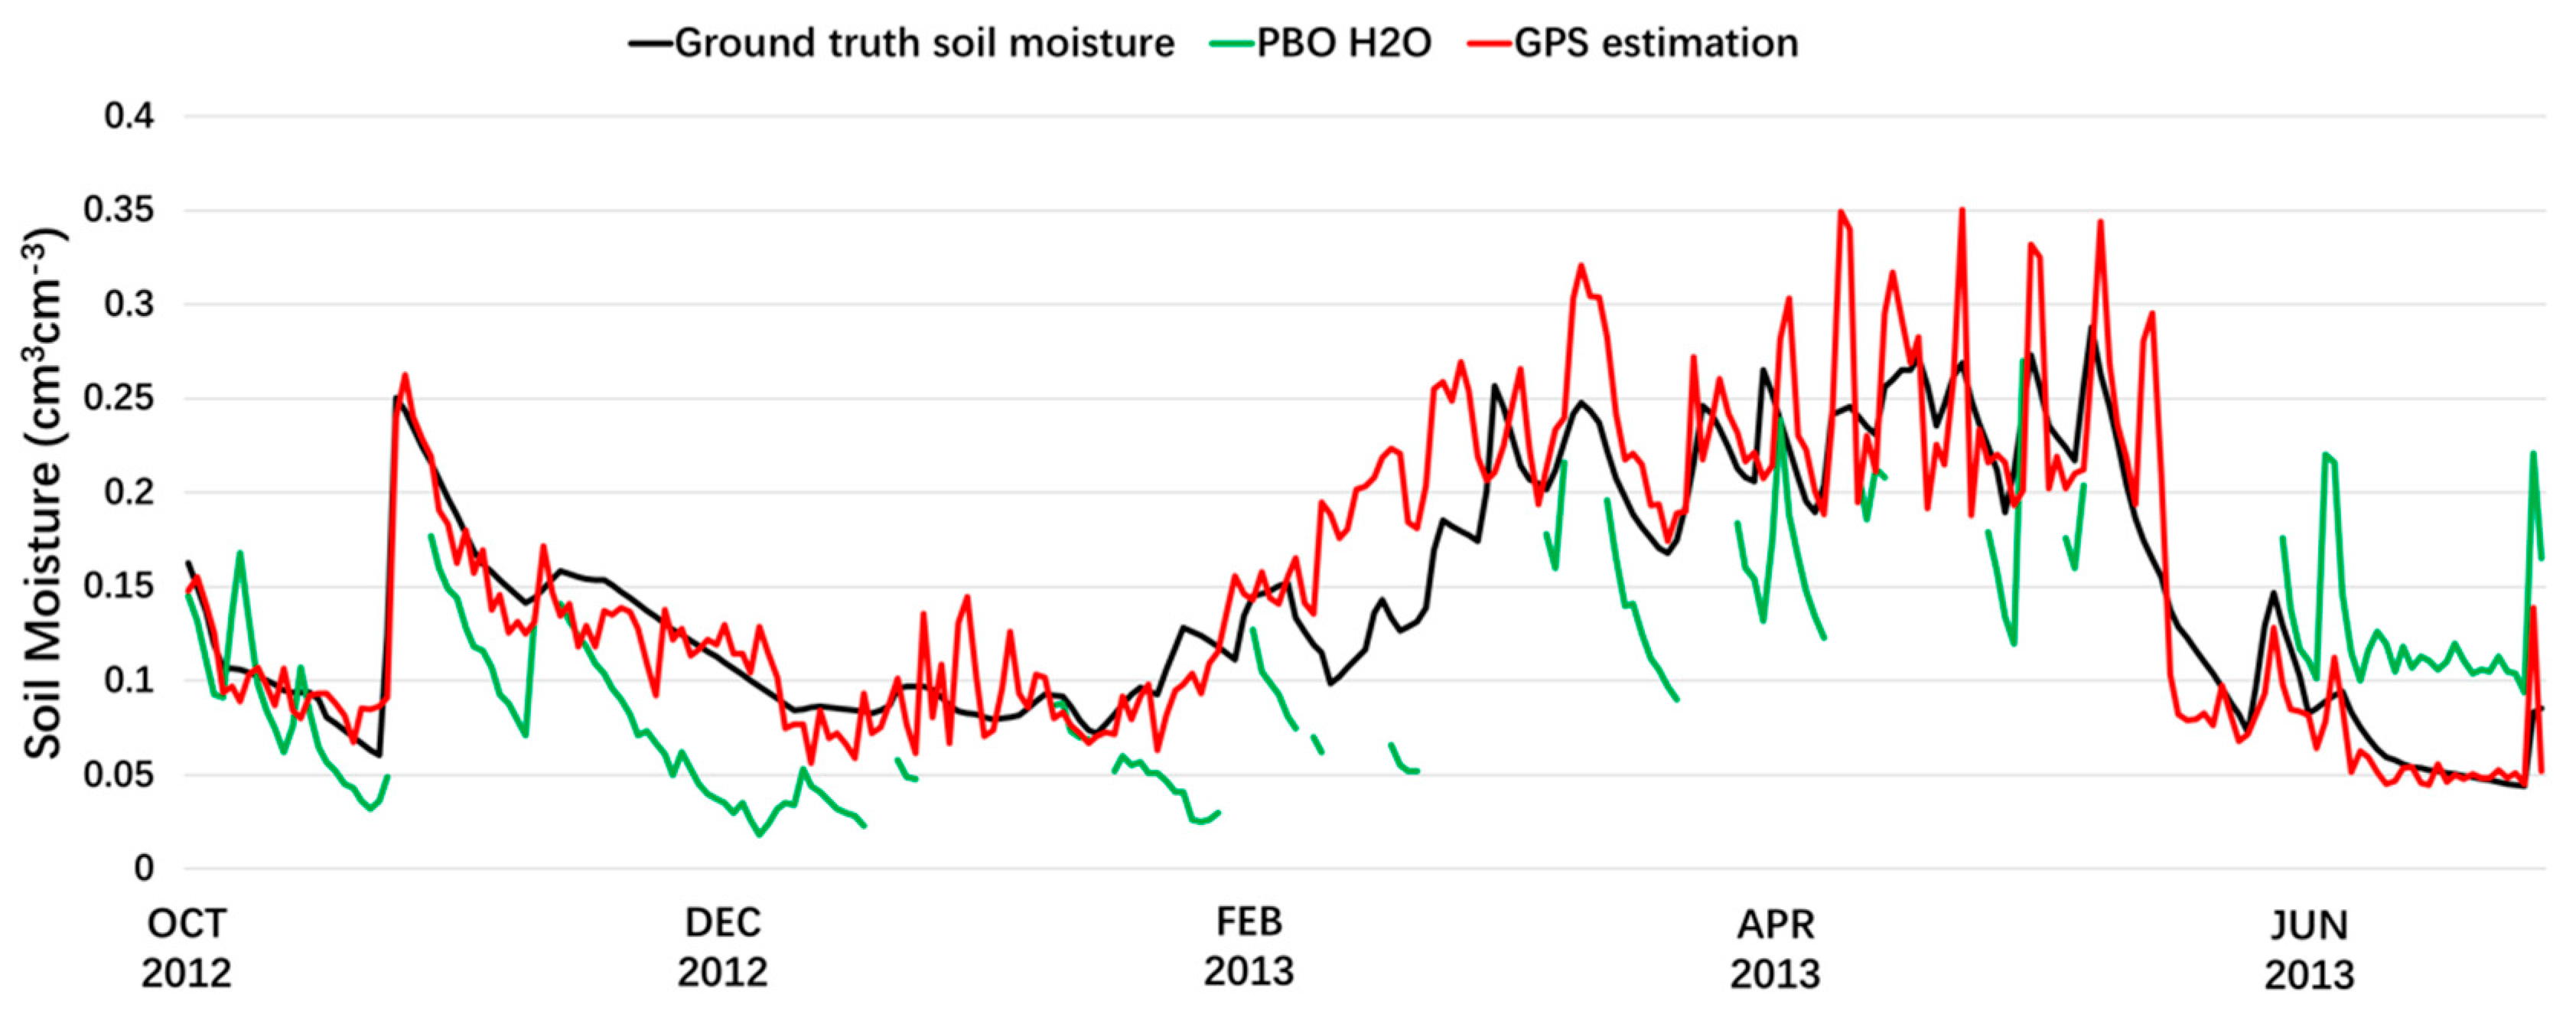
3.1. PBO H2O Station Experiment

The data we used were recorded from 1 April 2012 to 30 June 2013. Six-month data were used to build empirical model and the other nine-month data were used to verify the model by comparing the estimation results with the ground-truth data and the PBO H2O estimation results. Therefore, it is clear that Figure 7 is showing verification predictions with soil moisture measurements. There is an in situ probe installed at 2.5 cm depth within 250 m of the GNSS station MFLE antenna which can provide daily average of soil moisture. The empirical model is based on reflected signals and measured soil moisture data in the certain environment at a specific GNSS station. The method of modeling is consistent for different locations, but model parameters are different, which can not apply to other areas with soil of significantly different properties and components.
Through regression analysis by using the M r e c i p r o c a l sequence and daily average of measured soil moisture by in-situ probe, it is found that a parabola function is the best regression function given by
S M = 0.0651 M r e c i p r o c a l 2 0.1397 M r e c i p r o c a l + 0.0423
where SM means soil moisture. Figure 8 shows the model curve produced by the parabolic fitting. The curve basically represents the data well, although the deviation is also considerable.
Using the empirical model given by (14), the soil moisture estimates can be readily obtained once the M r e c i p r o c a l values are calculated, as shown in Figure 8. The black lines represent the daily ground-truth soil moisture measured by in-situ probe, red lines are daily soil moisture estimation results by the proposed method, and green lines are estimation results from the PBO H2O project. The results produced by the proposed method have a good match with the ground-truth data in general. Note that between March and May 2013, the results by the proposed method deviate from the ground-truth data considerably. Through the analysis of other meteorological data, it can be seen that there were snowfalls during this period. Snowfall will increase the soil water content, and when the snow covers the soil, the received GPS multipath signal would be produced by reflection from snow and soil, causing the significant deviation and variation of the GPS inversion results. In the same period, the inversion results by the PBO H2O project also have the problem of large deviation and fluctuation. In addition, PBO H2O does not provide any estimation results over a number of periods.
The soil moisture estimation of PBO H2O is based on the variation of phase offset, and the phase shift is considered to be a constant term and obtained by totally fitting. However, the change in phase offset is not only affected by soil moisture, but also satellite elevation. In this paper, the amplitude attenuation sequence was subjected to median filtering and piecewise fitting to get the average value sequences of peak values, and then established a relationship with the measured soil moisture. Figure 9 shows the soil moisture estimation errors produced by the proposed method and the PBO H2O project, which are represented by red and blue columnar statistics, respectively. The accuracy in terms of error statistics of the two estimation methods are displayed in Table 1.

3.2. Wuhan Experiment

The second experiment was recently performed in Wuhan, China by the authors. Figure 10 shows the experiment equipment, surrounding environment and soil moisture sensor. A Trimble R9 GNSS receiver and antenna were used to collect the GNSS direct and reflected signals and the vegetation coverage is relatively sparse. The ground truth soil moisture is measured by a sensor installed at 5 cm depth within 3 m of the GNSS receiver which can provide measured soil moisture every 10 min, showed in Figure 10. The experiment lasted 14 days from 15 June to 28 June in 2019. Due to the inability to provide continuous logistical support, the duration of the experiment was short, so we used part of the satellite data to build an empirical model and another part of the satellite data for soil moisture estimation. Two rainfalls occurred during the experiment. As a result, the earth surface experienced dry-to-wet-to-dry variation. Such a great change can better verify the sensitivity of the proposed method of this paper. However, the empirical model is based on the reflected signals and measured soil moisture data in the certain environment, which can not apply to other areas with different types or properties of soil.
For Wuhan experiment, the duration of the experiment was short. Each satellite should have four segmental arcs of different time each day (24 h), and the soil moisture sensor of this experiment can provide measured soil moisture data once every 10 min. Therefore, we do not need to calculate the daily average like the MFLE station, but we will arrange all the available satellite arcs in the order of time. The estimation results were achieved by GPS utilizes a short period of time change of elevation between 5 to 25 degree. For comparison with the sensor measuring soil moisture every 10 min, a time synchronization work should be carried out. In this paper, we select the moment when the satellite elevation angle is 10 degree as the time represented by the inversion result of this satellite arc segment. This could provide enough data from a short-period experiment for modeling and verification. Thus, we used the data of half of the satellites to build the empirical model, and the data of the other half satellites were used to estimate the soil moisture by the empirical model. Figure 11 shows the parabolic model based on regression analysis and the empirical model is given by
S M = 0.0214 M r e c i p r o c a l 2 + 0.1998 M r e c i p r o c a l 0.0951
According to Equation (15), the soil moisture can be calculated, and Figure 12 showed the estimated results of Wuhan experiment. The black line is ground truth soil moisture measured by soil moisture sensor, the red points are GPS estimation results.

4. Discussion

In PBO H2O experiment, it can be seen from both Figure 9 and Table 1 that the proposed method achieves a significant performance gain compared with the PBO H2O project; the RMSE is decreased by 38%. Figure 13 shows the scatterplot of the soil moisture estimation by the proposed method and the PBO H2O project. The red and blue hollow points are proposed method results and PBO H2O results, respectively. It can be seen that the estimates of the PBO H2O project deviate considerably more from the ground-truth soil moisture data than the proposed method. That is, the proposed method has increased the correlation coefficient by 47%.
For the Wuhan experiment, as we can see from Figure 13, the GPS estimation results are consistent with the trend of true values. According to our on-site environmental records, there were two heavy rainfall events from June 17 to 18 and June 21 to 22, which caused dramatic changes on soil moisture over the corresponding time period. The GPS estimation results show good sensitivity to changes of soil moisture. However, when the soil moisture is greater than 0.4 cm3cm−3, GPS multipath signals can hardly reproduce soil moisture changes. Through our on-site observation, after continuous heavy rainfall, the rate of water infiltration is slower than rainfall, and the water content of shallow soil is saturated. At this time, the reflecting surface has become flowing water layer over the surface of land, which is why the GPS reflection estimation results are distributed around 0.4 cm3cm−3 continuously. This experiment shows that the method has a certain scope of application, it has better inversion performance in the whole range of low soil moisture to the saturation of soil moisture. The correlation coefficient of the proposed method and ground truth soil moisture is 0.869, and the RMSE is 0.0339cm3cm−3. Please note that 0.4 cm3cm−3 is the limit value of GNSS-IR estimation that can only be attributed to the soil used in this particular experiment. The saturation values of different soil are different.

5. Conclusions

In this paper, an improved method has been proposed for soil moisture estimation over the ground surface surrounding a geodetic-quality GNSS antenna. Multipath induced SNR data are classified according to different satellites, and different ascending and descending periods of each satellite. The multipath induced SNR data are normalized to reduce the effect of ionosphere and troposphere. Median filtering is used to mitigate the effect of noise and interference. Piecewise fitting is used to further smooth the filtered data so that SNR amplitude peak sequences can be extracted accurately. An empirical model is established to associate the average peak variable to the soil moisture of the ground surface around the antenna.
A 15-month soil moisture time series, estimated by the GNSS-IR technique, was compared with in situ soil moisture data and PBO H2O estimation results. The experimental results show a good correlation between the ground truth data and the estimated soil moisture, the RMSE is 0.0345 cm3cm−3. Compared with the PBO H2O project, the RMSE is decreased by 38% and the correlation coefficient is increased by 47%. Another short-term experiment also shows reliable estimation results, the RMSE is 0.0339 cm3cm−3. Meanwhile, this experiment also shows that it has better inversion performance in the whole range of low soil moisture to the saturation of soil moisture. However, when beyond the saturation, the reflecting surface is changed, so the applicability reduced significantly. This study verifies the feasibility of inverting soil moisture based on the observation of the SNR data recorded by traditional geodetic receivers. Future research will focus on investigating soil moisture retrieval in the presence of vegetation and mitigating the effect of topographic relief.

Author Contributions

Y.L. and Q.Z. collected and made initial processing of the experiment data; J.L. helped to obtain the equipment for search and provided supervision; X.C. partly designed the improved method, analyzed the data, wrote the initial version of paper, and validated the improved method; K.Y. and T.J. conceived the improved method, wrote the revised version of the paper, and provided supervision.

Funding

This research was funded by Key Laboratory of Geospace Environment and Geodesy, Ministry of Education, Wuhan University, under grant number 17-02-07; Major Technology Innovation Project of Hubei Province of China under grant number 2018AAA066; Natural Science Foundation of Hubei Province of China under grant number 2019CFB427; National Basic Research Program of China under grant number 2013CB733302; and by the National Natural Science Foundation of China under grants 41574031, 41730109, and 41721003.

Conflicts of Interest

The authors declare no conflict of interest.

References

  1. Li, X.; Dick, G.; Lu, C.; Ge, M.; Nilsson, T.; Ning, T.; Schuh, H. Multi-GNSS Meteorology: Real-Time Retrieving of Atmospheric Water Vapor from BeiDou, Galileo, GLONASS, and GPS Observations. IEEE Geosci. Remote Sens. 2015, 53, 6385–6393. [Google Scholar] [CrossRef]
  2. Herring, T.A. Geodetic applications of GPS. Proc. IEEE 1999, 87, 92–110. [Google Scholar] [CrossRef]
  3. Qusen, C.; Weiping, J.; Xiaolin, M.; Peng, J.; Kaihua, W.; Yilin, X.; Jun, Y. Vertical deformation monitoring of the suspension bridge tower using gnss: A case study of the forth road bridge in the uk. Remote Sens. 2018, 10, 364. [Google Scholar]
  4. Hall, C.D.; Cordey, R.A. Multistatic Scatterometry. In Proceedings of the International Geoscience & Remote Sensing Symposium, Edinburgh, UK, 12–16 September 1988. [Google Scholar]
  5. Mashburn, J.; Axelrad, P.; Lowe, S.T.; Larson, K.M. Global ocean altimetry with gnss reflections from techdemosat-1. IEEE Geosci. Remote Sens. 2018, 56, 4088–4097. [Google Scholar] [CrossRef]
  6. Larson, K.M.; Ray, R.D.; Williams, S.D.P. A 10-year comparison of water levels measured with a geodetic gps receiver versus a conventional tide gauge. J. Atmos. Ocean. Tech. 2017, 34, 295–307. [Google Scholar] [CrossRef]
  7. Mashburn, J.; Axelrad, P.; Lowe, S.T.; Larson, K.M. An assessment of the precision and accuracy of altimetry retrievals for a monterey bay gnss-r experiment. IEEE J-STARS 2016, 9, 1–9. [Google Scholar] [CrossRef]
  8. Alonso-Arroyo, A.; Camps, A.; Park, H.; Pascual, D.; Onrubia, R.; Martin, F. Retrieval of significant wave height and mean sea surface level using the gnss-r interference pattern technique: Results from a three-month field campaign. IEEE Geosci. Remote Sens. 2015, 53, 3198–3209. [Google Scholar] [CrossRef]
  9. Cong, Y.; Yun-Chang, C.; Bin, Z.; Ming-Li, L.I.; Hong-Jia, W.U.; Wei-Hua, L. Application of significant wave height measurement using GNSS-R signals. J. Oper. Oceanogr. 2012, 31, 36–40. [Google Scholar]
  10. Xin, W.; Qiang, S.; XunXie, Z.; DaRen, L.; LianJun, S.; Xiong, H.; Soulat, F. First China ocean reflection experiment using coastal GNSS-R. Chinse Sci. Bull. 2008, 53, 1117–1120. [Google Scholar] [CrossRef] [Green Version]
  11. Yu, K. Tsunami-Wave Parameter Estimation Using GNSS-Based Sea Surface Height Measurement. IEEE Geosci. Remote Sens. 2015, 53, 2603–2611. [Google Scholar] [CrossRef]
  12. Yu, K. Simplified Tsunami Modelling and Waveform Reconstruction with GNSS-R Observations. IEEE Trans. Aerosp. Electron. Syst. 2018, 54, 1470–1484. [Google Scholar] [CrossRef]
  13. Yu, K. Tsunami lead wave reconstruction based on noisy sea surface height measurements. In Proceedings of the International Archives of the Photogrammetry, Remote Sensing and Spatial Information Sciences, Prague, Czech Republic, 12–19 July 2016; pp. 525–528. [Google Scholar]
  14. Rodriguez-Alvarez, N.; Aguasca, A.; Valencia, E.; Bosch-Lluis, X.; Ramos-Pérez, I.; Park, H.; Vall-Llossera, M. Snow monitoring using GNSS-R techniques. In Proceedings of the IEEE International Geoscience and Remote Sensing Symposium, Vancouver, BC, Canada, 24–29 July 2011; pp. 4375–4378. [Google Scholar]
  15. Cardellach, E.; Fabra, F.; Rius, A.; Pettinato, S.; D’Addio, S. Characterization of drysnow sub-structure using GNSS reflected signals. Remote Sens. Environ. 2012, 124, 122–134. [Google Scholar] [CrossRef]
  16. Masters, D.S. Surface Remote Sensing Applications of GNSS Bistatic Radar: Soil Moisture and Aircraft Altimetry; University of Colorado: Boulder, CO, USA, 2004. [Google Scholar]
  17. Ferrazzoli, P.; Guerriero, L.; Pierdicca, N.; Rahmoune, R. Forest biomass monitoring with GNSS-R: Theoretical simulations. Adv. Space Res. 2011, 47, 1823–1832. [Google Scholar] [CrossRef]
  18. Camps, A.; Aguasca, A.; Park, H.; Rodriguez-Alvarez, N.; Bosch-Lluis, X.; Vall-Llossera, M.; Ramos-Perez, I.; Valencia, E. Review of crop growth and soil moisture monitoring from a ground-based instrument implementing the Interference Pattern GNSS-R Technique. Radio Sci. 2011, 46. [Google Scholar] [CrossRef]
  19. Rodriguez-Alvarez, N.; Bosch-Lluis, X.; Camps, A.; Ramos-Perez, I.; Valencia, E.; Park, H.; Vall-Llossera, M. Vegetation water content estimation using gnss measurements. IEEE Geosci. Remote Sens Lett. 2012, 9, 282–286. [Google Scholar] [CrossRef]
  20. Dobson, M.C.; Ulaby, F.T.; Hallikainen, M.T.; El-Rayes, M.A. Microwave Dielectric Behavior of wet soil-Part I: Empirical Models and experimental observations. IEEE Geosci. Remote Sens. 1985, 23, 35–46. [Google Scholar] [CrossRef]
  21. Chew, C.C.; Small, E.E.; Larson, K.M.; Zavorotny, V.U. Vegetation sensing using gps-interferometric reflectometry: Theoretical effects of canopy parameters on signal-to-noise ratio data. IEEE Geosci. Remote Sens. 2015, 53, 2755–2764. [Google Scholar] [CrossRef]
  22. Chew, C.C.; Small, E.E.; Larson, K.M.; Zavorotny, V.U. Effects of near-surface soil moisture on gps snr data: Development of a retrieval algorithm for soil moisture. IEEE Geosci. Remote Sens. 2014, 52, 537–543. [Google Scholar] [CrossRef]
  23. Zavorotny, V.; Masters, D.; Gasiewski, A.; Bartram, B.; Katzberg, S.; Axelrad, P.; Zamora, R. Seasonal polarimetric measurements of soil mois-ture using tower-based GPS bistatic radar. IEEE Geosci. Remote Sens. 2003, 2, 781–783. [Google Scholar]
  24. Masters, D.; Axelrad, P.; Katzberg, S. Initial results of land-reflected GPS bistatic radar measurements in SMEX02. Remote Sens. Environ. 2004, 92, 507–520. [Google Scholar] [CrossRef]
  25. Larson, K.M.; Small, E.E.; Gutmann, E.; Bilich, A.; Axelrad, P.; Braun, J. Using gps multipath to measure soil moisture fluctuations: Initial results. GPS Solut. 2008, 12, 173–177. [Google Scholar] [CrossRef]
  26. Larson, K.M.; Small, E.E.; Gutmann, E.D.; Bilich, A.L. Use of gps receivers as a soil moisture network for water cycle studies. Geophys. Res. Lett. 2008, 35, 851–854. [Google Scholar] [CrossRef]
  27. Larson, K.M.; Braun, J.J.; Small, E.E.; Zavorotny, V.U.; Gutmann, E.D.; Bilich, A.L. Gps multipath and its relation to near-surface soil moisture content. IEEE J. Sel. Top. Appl. Earth Obs. Remote Sens. 2010, 3, 91–99. [Google Scholar] [CrossRef]
  28. Yan, S.; Li, Z.; Yu, K.; Zhang, K. GPS-R L1 interference signal processing for soil moisture estimation: An experimental study. Eurasip J. Adv. Signal Process. 2014, 2014, 107. [Google Scholar] [CrossRef]
  29. Wu, X.; Jin, S. Simulations and analysis of BeiDou navigation satellite system (BDS)-Relectometry delay-Doppler maps for vegetation. China Satellite Navigat. Conf. 2014, 1, 87–95. [Google Scholar]
  30. Luo, X.; Yan, S.; Shan, J.; Yan, H.; Wang, H. Using the BDS-R signal for soil moisture estimation. China Satellite Navigat. Conf. 2016, 1, 175–185. [Google Scholar]
  31. Ban, W.; Yu, K.; Zhang, X. GEO-Satellite-Based Reflectometry for Soil Moisture Estimation: Signal Modeling and Algorithm Development. IEEE Trans. Geosci. Remote Sens. 2017, 56, 1829–1838. [Google Scholar] [CrossRef]
  32. Wan, W.; Larson, K.M.; Small, E.E.; Chew, C.C.; Braun, J.J. Using geodetic gps receivers to measure vegetation water content. GPS Solut. 2015, 19, 237–248. [Google Scholar] [CrossRef]
  33. Bilich, A.; Larson, K.M.; Axelrad, P. Modeling gps phase multipath with snr: Case study from the salar de uyuni, boliva. J. Geophys. Res. 2008, 113, 113. [Google Scholar] [CrossRef]
  34. Ray, J.K.; Cannon, M.E. Synergy between global positioning system code, carrier, and signal-to-noise ratio multipath errors. J. Guid. Control Dynam. 2001, 24, 54–63. [Google Scholar] [CrossRef]
  35. Reichert, A.; Axelrad, P. Gps carrier phase multipath reduction using snr measurements to characterize an 41effective reflector. In Proceedings of the International Technical Meeting of the Satellite Division of the Institute of Navigation, Nashville, TN, USA, 14–17 September 1999; pp. 1951–1960. [Google Scholar]
  36. Comp, C.; Axelrad, P. Adaptive snr-based carrier phase multipath mitigation technique. IEEE Trans. Aerosp. Electron. Syst. 1998, 34, 264–276. [Google Scholar] [CrossRef]
  37. Bilich, A.; Larson, K.M. Mapping the gps multipath environment using the signal-to-noise ratio (snr). Radio Sci. 2007, 42, 42. [Google Scholar] [CrossRef]
  38. Yu, K.; Ban, W.; Zhang, X.; Yang, X. Snow depth estimation based on multipath phase combination of gps triple-frequency signals. IEEE Geosci. Remote Sens. 2015, 53, 5100–5109. [Google Scholar] [CrossRef]
  39. Yu, K.; Li, Y.; Chang, X. Snow depth estimation based on combination of pseudorange and carrier phase of gnss dual-frequency signals. IEEE Geosci. Remote Sens. 2018, 57, 1817–1828. [Google Scholar] [CrossRef]
  40. Li, Y.; Chang, X.; Yu, K.; Wang, S.; Li, J. Estimation of snow depth using pseudorange and carrier phase observations of GNSS single-frequency signal. GPS Solut. 2019, 23, 118. [Google Scholar] [CrossRef]
  41. Nievinski, F.G.; Larson, K.M. Forward modeling of gps multipath for near-surface reflectometry and positioning applications. GPS Solut. 2014, 18, 309–322. [Google Scholar] [CrossRef]
  42. Chew, C.; Small, E.E.; Larson, K.M. An algorithm for soil moisture estimation using gps-interferometric reflectometry for bare and vegetated soil. GPS Solut. 2016, 20, 525–537. [Google Scholar] [CrossRef]
Figure 1. Geometrical relationship of a reflected signal and direct signal for satellite elevation angle ( θ   ) and antenna height (H0). Blue lines represent the direct signal transmitted from the satellite, the red line is the reflected signal from the ground. The received signals are the combination of direct signals and reflected signals.
Remotesensing 11 02559 g001
Figure 2. A measured SNR series from receiver and a reflected signal series.
Remotesensing 11 02559 g002
Figure 3. Data processing and soil moisture estimation flow chart.
Remotesensing 11 02559 g003
Figure 4. Median filtering and fitting results.
Remotesensing 11 02559 g004
Figure 5. The MFLE station is located in Boulder, Colorado. Some GPS satellites ground reflected tracks showed in the figure.
Remotesensing 11 02559 g005
Figure 6. Three M ¯ time series of different satellites.
Remotesensing 11 02559 g006
Figure 7. GPS estimation results of MFLE from 2012.10.01 to 2013.06.30.
Remotesensing 11 02559 g007
Figure 8. Parabolic modeling based on regression analysis of MFLE station.
Remotesensing 11 02559 g008
Figure 9. Soil moisture estimation errors of proposed method and PBO H2O.
Remotesensing 11 02559 g009
Figure 10. Equipment and surrounding environment (left), soil moisture sensor (right).
Remotesensing 11 02559 g010
Figure 11. Parabolic modeling based on regression analysis of Wuhan experiment.
Remotesensing 11 02559 g011
Figure 12. Estimation results of Wuhan experiment.
Remotesensing 11 02559 g012
Figure 13. Scatter diagram of the estimated soil moisture by the proposed method and the PBO H2O project.
Remotesensing 11 02559 g013
Table 1. Soil moisture estimation precision statistics.
Correlation CoefficientMean Error (cm3cm−3)Root-Mean-Square Error (cm3cm−3)
Proposed method0.899−0.0070.0345
PBO H2O0.609−0.02750.0558

