Article

Comparison of Arctic Sea Ice Concentrations from the NASA Team, ASI, and VASIA2 Algorithms with Summer and Winter Ship Data

1
Arctic and Antarctic Research Institute, Bering Str., 38, Saint Petersburg 199397, Russia
2
A.M. Obukhov Institute of Atmospheric Physics of the Russian Academy of Sciences, Pyzhevsky Per., 3, Moscow 119017, Russia
3
Space Research Institute of the Russian Academy of Sciences, 84/32 Profsoyuznaya Str., Moscow 117997, Russia
4
Moscow Institute of Physics and Technology (State University), 9 Institutskiy Per., Dolgoprudny, Moscow Region 141701, Russia
5
Lomonosov Moscow State University, GSP-1, 1 Leninskiye Gory, Moscow 119991, Russia
*
Author to whom correspondence should be addressed.
Remote Sens. 2019, 11(21), 2481; https://doi.org/10.3390/rs11212481
Submission received: 9 September 2019 / Revised: 18 October 2019 / Accepted: 22 October 2019 / Published: 24 October 2019

Abstract

:
The paper presents a comparison of sea ice concentration (SIC) derived from satellite microwave radiometry data and dedicated ship observations. For the purpose, the NASA Team (NT), Arctic Radiation and Turbulence Interaction Study (ARTIST) Sea Ice (ASI), and Variation Arctic/Antarctic Sea Ice Algorithm 2 (VASIA2) algorithms were used as well as the database of visual ice observations accumulated in the course of 15 Arctic expeditions. The comparison was performed in line with the SIC gradation (in tenths) into very open (1–3), open (4–6), close (7–8), very close and compact (9–10,10) ice, separately for summer and winter seasons. On average, in summer NT underestimates SIC by 0.4 tenth as compared to ship observations, while ASI and VASIA2 by 0.3 tenth. All three algorithms overestimate total SIC in regions of very open ice and underestimate it in regions of close, very close, and compact ice. The maximum average errors are typical of open ice regions that are most common in marginal ice zones. In winter, NT and ASI also underestimate SIC on average by 0.4 and 0.8 tenths, respectively, while VASIA2, on the contrary, overestimates by 0.2 tenth against the ship data, however, for open and close ice the average errors are significantly higher than in summer. In the paper, we also estimate the impact of ice melt stage and presence of new ice and nilas on SIC derived from NT, ASI, and VASIA2.

Graphical Abstract

1. Introduction

Every year, persistent ice cover forms on the surface of the Arctic seas due to harsh climate conditions typical of the polar regions. Sea ice plays an important role in the climatic system of the Earth and is among the major indicators of climate change. Knowledge of sea ice condition is crucial for many applications and scientific tasks: maritime activities, shelf mineral production, assessment of the ocean–atmosphere heat exchange, etc. [1,2,3,4,5]. Given the limited coverage of the polar regions by ship and ground observations, the emphasis has largely been on remote sensing of sea ice [6].
Every data type has its advantages and limitations; therefore, the most precise and complete analysis of ice cover characteristics can only be achieved by considering and integrating all available data. Ship-based ice observations are irregular, though include very comprehensive information on all characteristics of sea ice. Daily satellite observations cover the whole vastness of the Arctic waters, however retrieval of some ice parameters (ridging, snow depth, melt stage) is constrained by coarse data resolution [7]. Hence, it is effective to combine satellite and ship data in an analysis, though they may differ considerably, especially at ice edge. Errors in total sea ice concentration and extent retrievals from microwave satellite data should be taken into account when using the data in applications and scientific tasks [8].
Of all satellite data sources existing today, microwave radiometry is the leading one in terms of obtained data volume. For over 40 years, passive microwave sensors on board satellites have been used to monitor and study sea ice distribution in the polar regions on a global scale irrespective of the time of day and weather conditions [7].
Many algorithms have been developed to retrieve sea ice concentration (SIC) from passive microwave remote sensing data [7]. A large number of studies compared microwave satellite data with other types of satellite information of higher resolution (visible, infrared, and radar) [9,10,11], as well as sea ice charts on their basis [12,13,14]. SIC data obtained using different algorithms were repeatedly compared with each other to reveal their functionality under different ice and weather conditions [15,16,17,18]. Comparisons were also made with ship observations [19,20,21,22,23].
It was shown that for high SIC areas the algorithms sensitivities to hydrometeors in the atmosphere are lower than over open water. In general, this is because over close pack ice the atmosphere water vapor content is lower and there is no wind roughening. Other sources of even larger errors in SIC retrieval are related to surface effects during the summer melt and freeze-up periods [15].
Comparison of 11 algorithms with each other is presented in Ivanova et al., 2014 [16]. The authors determined the average sea ice extent in the Arctic for 1979–2012 and 1992–2012 using each of these algorithms. The difference between the obtained results reached 1.3 million km2, and sea ice extent demonstrated a decreasing decadal trend of 0.534 to 0.978 million km2, depending on the algorithm. Intercomparison of the algorithms gives the differences between sea ice extent estimates, while comparison with ship observations shows the difference between each algorithm results and field data and helps explain the reasons of such huge discrepancies in sea ice extent estimates.
Comparisons of microwave satellite data with ship observations in the Arctic and the Antarctic were based on visual observations according to the Antarctic Sea Ice Processes and Climate (ASPeCt, http://www.aspect.aq) and IceWatch/ASSIST (Arctic Ship-Based Sea Ice Standardization, http://icewatch.gina.alaska.edu) protocols [19,20,21,22,23]. In international practice, shipboard visual observations are conducted once per hour (or per three hours). According to this method, ice condition is determined at one point every 10–20 km, depending on the speed of the ship in ice [20,24]. For many years, the Arctic and Antarctic Research Institute (AARI) has accumulated a database of dedicated ship observations conducted using a different method implying continuous observation of ice cover and delineation of homogeneous ice zones (Appendix A). Delineation of sea ice cover of homogeneous ice zones means that sea ice parameters are known at each point of the ship track. The amount of ice observations is calculated not in points, but in kilometers. This method provides for a more complete picture of sea ice condition than observations made once an hour. For the first time, these data were used for comparison with microwave satellite data (NT) in [8]. Also, some of them were used in the development of the VASIA2 algorithm [25,26]. In this paper, we evaluate NASA Team (NT), Arctic Radiation and Turbulence Interaction Study (ARTIST) Sea Ice (ASI), and Variation Arctic/Antarctic Sea Ice Algorithm 2 (VASIA2) against ship data obtained in various seasons, and demonstrate the effects of ice melt and presence of new ice and nilas on the difference in SIC estimation.

2. Materials and Methods

2.1. The NT Algorithm

The NT algorithm [27] developed by the NASA Team uses two relationships: polarization ratio PR (19) (19.4 GHz horizontally (H) and vertically (V) polarized channels):
P R ( 19 ) = T B ( 19 V ) T B ( 19 H ) T B ( 19 V ) + T B ( 19 H ) ,
and gradient ratio GR (37V19V) (vertically polarized 19.35 and 37.0 GHz channels):
G R ( 37 V / 19 V ) = T B ( 37 V ) T B ( 19 V ) T B ( 37 V ) + T B ( 19 V ) ,
where TB is brightness temperature in the specified radiometer channel.
The algorithm distinguishes the radiation from three surfaces: multi-year (MY) and first-year (FY) ice and open water (OW). Based on this assumption, the brightness temperature of a channel is determined as:
T B = T W ( 1 C M C F ) + T F C F + T M C M ,
where TF, TM, TW are the characteristic brightness temperatures of FY and MY ice and OW, respectively; CF, CM are concentrations of FY and MY ice, respectively. The FY and MY ice concentrations follow from (1)–(3):
C F =   a 0 + a 1 P R + a 2 G R + a 3 P R G R c 0 + c 1 P R + c 2 G R + c 3 P R G R   , C M = b 0 + b 1 P R + b 2 G R + b 3 P R G R c 0 + c 1 P R + c 2 G R + c 3 P R G R   ,
where coefficients ai, bi, and ci are determined on the basis of nine known (tabular) values of brightness temperature for clean surfaces of FY and MY ice and OW at 19.35 GHz vertical and horizontal polarizations and 37 GHz vertical polarization. These characteristic brightness temperatures are called tie-points. They are specified for particular radiometer (SMMR (scanning multichannel microwave radiometer), SSM/I (special sensor microwave/imager), SSMIS (special sensor microwave imager/sounder)) separately for the Arctic and Antarctic [28].
To reduce the probability of false detection of sea ice over OW, NT uses weather filters. False SIC occurs as a result of wind-induced changes in sea surface roughness and also due to atmospheric humidity variations. For SMMR, a filter based on the GR(37 V/18 V) threshold value is used. At GR(37 V/18 V) > 0.08, the SIC is assumed to be zero [29]. For SSM/I and SSMIS, two weather filters based on GR(37 V/19 V) and GR(22 V/19 V) are used: if GR(37 V/19 V) > 0.05 and/or GR(22 V/19 V) > 0.045, then SIC is assumed to be zero [28]. The use of an additional filter, as a combination of the 19.4 GHz and 22.2 GHz vertical polarization channels, is explained by the proximity of the 19.35 GHz channel to the 22.24 GHz water vapor line compared to the 18.0 GHz SMMR channel [29].
Errors in SIC estimation may increase due to melt processes, presence of snow, wind waves, or in case of spatial differences, for example, due to geographical differences in chemical and physical properties of open sea water, ice, and snow cover [30].

2.2. The ASI Algorithm

The ASI algorithm [31], developed at the University of Bremen, is based on the polarization difference P of the high frequency channel (85.5 GHz for SSM/I, 91.655 GHz for SSMIS, 89 GHz for AMSR (advanced microwave scanning radiometer)):
P = T B , V T B , H ,
where TB,V and TB,H are brightness temperatures at the vertical and horizontal polarizations, respectively. In this range, the difference is much smaller for various types of ice than for open water. This algorithm is an upgrade of the Svendsen algorithm, also having the name “Near 90 GHz” [32]. The algorithm uses the transfer equation for the radiation diffusely reflected by the surface at an angle of 53° for the Arctic horizontally stratified atmosphere with the effective temperature replacing the vertical temperature profile [32]. On the basis of this approximation, the high frequency channel polarization difference with account taken of the influence of atmosphere is written as follows:
P = P s e τ ( 1.1 e τ 0.11 ) = P s a c ,
where τ is the absorption in the atmosphere, Ps is the polarization difference of the surface, ac is the effect of the atmosphere. Taking into account ice concentration C, Equation (6) becomes:
P = ( C P s , i + ( 1 C ) P s , w ) a c ,
where Ps,i and Ps,w are the surface polarization differences for ice and water, respectively. It is assumed that ac is a function of the SIC [32]. The boundary conditions for C = 0 (open water) and C = 1 (compact ice) are defined as:
P 0 = a 0 P s , w , C = 0 , P 1 = a 1 P s , i , C = 1 .
The expansion of (7) in a Taylor series up to the first order coupled with boundary conditions (8) gives the following expressions for SIC:
C = ( P P 0 1 ) ( P s , w P s , i P s , w ) a t   C = 0 , C = P P 1 + ( P P 1 1 ) ( P s , w P s , i P s , w )   a t   C = 1 .
For the Arctic conditions [32]:
( P s , w P s , i P s , w ) = 1.14 .
Assuming that the atmospheric effect is a smooth function of C, the latter can be expressed as a polynomial of the third degree obtained by interpolation between the two boundary expressions (9):
C = d 3 P 3 + d 2 P 2 + d 1 P + d 0 .
The coefficients di are determined from the system of linear equations:
[ P 0 3 P 0 2 P 1 3 P 1 2 P 0 1 P 1 1 3 P 0 3 2 P 0 2 3 P 1 3 2 P 1 2 P 0 0 P 1 0 ] [ d 3 d 2 d 1 d 0 ] = [ 0 1 1.14 0.14 ] .
Thus, if the values of P0 and P1 are known, then the obtained coefficients di lead to determining SIC from (11). The values of P0 and P1 are critical for the ASI and Svendsen algorithms and their choice makes the major difference. Both values are tie-points of the algorithms. Svendsen uses maximum P1 and minimum P0. However, as shown by further research, due to sudden atmospheric changes, the choice of extreme P0 and P1 values sometimes results in significant errors in identifying open water or compact ice [31].
In the ASI algorithm, the values of P0 and P1 are determined by comparing the SIC obtained by Svendsen with SIC reference data derived from other independent sources, for example, from lower frequency channels [21]. Currently, there are six versions of ASI [33]. To determine P0 and P1, ASI 0 uses AVHRR (advanced very-high-resolution radiometer) data. ASI 1 and ASI 2 use the results of aircraft measurements in March–April 1998 obtained during the scientific experiment ARTIST (Arctic Radiation and Turbulence Interaction STudy) conducted in the Svalbard area [31]. ASI 1 uses the data of the optical line scanner and ASI 2 those of infrared radiometer. ASI 3 employs the NT technique together with airborne radiometric measurements and SSM/I data. In ASI 4, data correction is carried out by repeated minimization of the standard deviation of SIC obtained by NT and ASI4. Currently, the algorithm version ASI 5 is in use. In this version, the values of P0 and P1 are determined using a numeric polynya model [34], and also the ARTIST experimental data, ERS-SAR (European remote sensing satellite–synthetic aperture radar) imagery and hydrographic data [33]. ASI 5 sets the following values: P0 = 47 K and P1 = 11.7 K [33].
The ASI algorithm employs the same weather filters as NT. Only in the case of the AMSR instrument, the relations GR(36.5 V/18.7 V) > 0.045 and GR(23.8 V/18.7 V) > 0.04 are used. In addition, if the SIC found by the Bootstrap algorithm [35] is 0, then it is also set to 0 in ASI.

2.3. The VASIA2 Algorithm

The algorithm named VASIA2 (Variation Arctic/Antarctic Sea Ice Algorithm 2) is developed by a team from three Russian research organizations: Space Research Institute and A.M. Obukhov Institute of Atmospheric Physics, both of the Russian Academy of Sciences, and Arctic and Antarctic Research Institute. The initially developed algorithm VASIA was found to underestimate SIC in the warm season. The shortcoming was identified and successfully eliminated and the modified algorithm got the name VASIA 2 [36,37].
The algorithm is fundamentally different from all current algorithms. It is based not on experimental data, but a theoretical model of radiation from the “sea surface–ice cover–snow cover– atmosphere” system [26].
As the main parameters, the algorithm uses three tangents of the angles between the lines drawn through the brightness temperature values at two different frequencies of the same polarization and the frequency axis: tangent for frequencies of 85.5 GHz and 19.35 GHz of vertical polarization - tg(85–19 V), tangent for frequencies of 85.5 GHz and 37 GHz of horizontal polarization - tg(85–37 H) and tangent for frequencies of 37 GHz and 19.35 GHz of vertical polarization - tg(37–19 V):
t g ( 85 19 V ) = T 85 V T 19 V 85.5 19.35 , t g ( 85 37 H ) = T 85 H T 37 H 85.5 37 , t g ( 37 19 V ) = T 37 V T 19 V 37 19.35 ,
where T X Y – is the brightness temperature for frequency X and polarization Y.
The choice of these frequencies and polarizations (and, consequently, tangents) is justified by the difference in frequency dependences of sea ice and open water emissivities in the 19–100 GHz range (see, for example, [21]). With frequency rise from 19 to 100 GHz, the emissivity of any sea ice type either decreases or remains the same, while the emissivity of open water increases. Consequently, the values of the chosen tangents are near 0 or less for sea ice, while for open water they are always above 0. So, for the sea surface with ice and open water, the tangent values in this range are always determined by the SIC: the greater the SIC, the lower is the tangent value (near or below 0).
Figure 1 shows the ranges of tangent values calculated for various physical and structural characteristics of the surface: SIC and type of ice, temperature, thickness of snow cover, wetness of ice and snow, surface roughness, etc. The ranges of these characteristics were selected in accordance with the climatic and glaciological data of the polar regions [1,6,38,39,40,41,42,43].
Normally, snow cover can contain approximately 9–30% of liquid water in a unit volume depending on the density and structure of snow [44,45]. The excess water drains down. If the snow is on top of ice and no drainage is possible, a snow–water mixture (SWM) occurs. The final form of SWM evolution is melt pond (we assume SWM to be a snow cover with a wetness from 30% up to formation of melt pond). Melt ponds are an important element of the Arctic climate system. They can occupy up to 50% of the total ice cover [46,47,48,49,50,51] and play a significant role in the ocean and atmosphere interaction. The depth of melt ponds can vary from a few centimeters to 1.5 meters [52,53]. Their horizontal size can reach hundreds of square meters [47,54].
The tangents tg(85–19 V) and tg(85–37 H) are determined mainly by SIC and weakly depend on various surface characteristics (Figure 1A,B). The open area between the two straight lines (1) corresponds to ice free of snow or covered with dry and wet snow. The region inside the shaded triangle (2) indicates ice with SWM in various stages including melt ponds formation [36,37]. Each of these four regions was averaged by a linear function depending only on the SIC. Four linear dependences were obtained, two for ice without SWM (dashed lines, Figure 1A,B):
f 85 37 h ( I ) = 0.085 × I + 0.908 ,
f 85 19 v ( I ) = 0.086 × I + 0.55 ,
and two for ice with SWM (dash-dotted lines, Figure 1A,B):
φ 85 37 h ( I ) = 0.039 × I + 1.19 ,
φ 85 19 v ( I ) = 0.04 × I + 0.7
where I is the SIC expressed in 10ths.
The criterion for the presence or absence of SWM on ice is the tangent of 37 GHz and 19.35 GHz of vertical polarization tg(37–19 V). The dependence of the tangent on SIC is shown in Figure 1C. The choice of this criterion is explained by the strong dependence of this tangent on moisture content of the surface layer: the shaded triangle in Figure 1C is much larger than those in Figure 1A,B.
In the general case, the tangent tg(37–19 V) values for different ice concentrations (Figure 1C) will be either in region 1 (ice covered by snow and clean ice) or inside the shaded triangle—region 2 (ice with SWM). In real physical and structural conditions of the surface layer, the tangent values may not exist outside these regions. The top line of region 2 corresponds to open water surface. The bottom line of region 1 defines another limit of possible values of physical and structural parameters of the surface layer (temperature, wetness, density, porosity, etc.). At a certain ice concentration, values of the three tangents (tg(85–19 V), tg(85–37 H), and tg(37–19 V)) must fall within the permitted region and correspond to one ice concentration value. If the two main tangents (tg(85–19 V), tg(85–37 H)) point out ice concentration equal to 10%, then tangent tg(37–19 V) must give the same ice concentration and fall within the allowed region (1 and 2). If the tangent tg(37–19 V) value appears in the forbidden region (left ellipse in Figure 1C), it means that ice concentration is defined incorrectly. In this case, the allowed values of tangent tg(37–19 V) are in the region of high concentration (e.g., the right ellipse in Figure 1C), which corresponds to presence of SWM on the surface of ice. The lower boundary of region 1 (Figure 1C) is selected as a criterion for the presence or absence of SWM on ice. If the value of tg(37–19 V) at a certain SIC lies below this boundary, then SWM is present on ice [36,37]. The lower boundary of region 1 (Figure 1C) is approximated by a linear function that depends only on I:
δ 37 19 v ( I ) = 0.187 × I + 1.1 .
Hence, the design of the algorithm is as follows:
  • Three tangents tg(85–19 V), tg(85–37 H), tg(37–19 V) are calculated from microwave satellite data.
  • Criterion function F1 is constructed. It is the sum of squared coefficients of variation between the theoretical dependencies of tangents (14) and (15) and the satellite data tangents tg(85–19 V) and tg(85–37 H):
    F 1 = 1 2 [ ( f 85 37 h ( I ) t g ( 85 37 H ) ) 2 ( t g ( 85 37 H ) ) 2 + ( f 85 19 v ( I ) t g ( 85 19 V ) ) 2 ( t g ( 85 19 V ) ) 2 ] .
  • Criterion function F1 is calculated for SIC from 0 to 10 tenths with a step equal to 0.1.
  • The minimum value of the criterion function F1 determines I1—the SIC with no error correction related to SWM on ice.
  • At the given I1, for each pixel the value obtained by (18) is compared to satellite data tangent tg(37–19 V):
    δ 37 19 v ( I 1 ) t g ( 37 19 V ) .
  • If
    δ 37 19 v ( I 1 ) < t g ( 37 19 V ) ,
    then the SIC is taken equal to the one determined at Step 4: I2 = I1.
  • If
    δ 37 19 v ( I 1 )     t g ( 37 19 V ) ,
    then the criterion function F2 is constructed as the sum of squared coefficients of variation between the theoretical tangent values (16) and (17) and the satellite data tangents tg(85–19 V) and tg(85–37 H):
    F 1 = 1 2 [ ( φ 85 37 h ( I ) t g ( 85 37 H ) ) 2 ( t g ( 85 37 H ) ) 2 + ( φ 85 19 v ( I ) t g ( 85 19 V ) ) 2 ( t g ( 85 19 V ) ) 2 ] .
  • For the interval of SIC from 0 to 10, the minimum value of criterion function F2 is found.
  • The minimum value of criterion function F2 determines the resulting SIC value I2.
The value of I2 is the real SIC in the given pixel. The difference between the concentrations obtained at Steps 9 and 4 (I2I1) shows the specific area occupied by SWM on the surface of ice.
Linear Equations (14)–(18) are the approximations of theoretical tangents calculated for SSM/I radiometer channels (19.35, 37, and 85.5 GHz). However, further calculations demonstrate their validity also for SSMIS (channels 19.35, 37, and 91.655 GHz) and AMSR2 (channels 18.7, 36.5, and 89 GHz) [37].

2.4. Microwave Satellite Data

To determine the SIC by NT, the SSM/I (F13) data for the period 1996–2005 for a 25 km resolution grid were used. The datasets were obtained from [55]. The SIC by ASI was calculated at the Center for Marine and Atmospheric Science/Institute of Oceanography (Hamburg, Germany), on the basis of SSM/I (F13) data for the period 1996–2005 for a 12.5 km resolution grid. The datasets were obtained from http://nsidc.org (last access date: 25.01.2008). The algorithm version 2.1, used in the present work, is described in Ezraty et al. 2007 [56].
For converting polar stereographic coordinates (ASI, NT, VASIA2) to geodetic coordinates (latitude/longitude), which were used in ship observations, we applied special software for transformation, presented on the official site of National Snow and Ice Data Center (NSIDC). (https://nsidc.org/data/polar-stereo/ps_grids.html, https://nsidc.org/data/polar-stereo/tools_geo_pixel.html).
For calculations by VASIA2, the POLE-RT-Fields database of SSM/I and SSMIS data for a 12.5 km grid on the polar regions was employed. It was developed at the Department of Earth Studies from Space, Space Research Institute of the Russian Academy of Sciences [57] (Appendix B). For the processing, the original data were used in the form of brightness temperatures obtained by SSM/I and SSMIS of DMSP (Defense Meteorological Satellite Program). These are free-access data provided by the National Snow and Ice Data Center at https://nsidc.org/data/NSIDC-0032/versions/2 (last accessed date: 15.11.2018).

2.5. Dedicated Ship Observations

Visual observations from ship were carried out according to the unified methodological principles traditionally adopted by the AARI specialists in strict accordance with the requirements of the regulatory guidance [58]. According to the document, the observations are made from the navigation bridge along the entire track of the vessel (see Appendix A). There is a group of three observers on board, each working two 4-hour shifts on the bridge per day. Thus, continuous 24-hour ice observation without breaks is ensured during the ship movement through the ice cover. Only experienced and specially trained sea ice specialists may qualify to conduct the observations. The observations include a visual definition of the complex of main characteristics of ice cover: development stage, total and partial SIC of each of the observed ice types, as well as their forms (horizontal size of ice floes), sea ice thickness and snow depth, hummock and ridge concentration, average and maximum ridge height, melt stage, ice compacting, orientation and size of fractures and leads. Ice conditions in the navigation area (within the limits of horizontal visibility) may differ significantly from the conditions directly along the ship track (in the area along the track, the width of which is equal to 2–3 times the width of the ship hull on both sides). Therefore, all of the above characteristics are recorded separately for the region and the track. During the observations, homogeneous ice zones are delineated. This means the following: when the ship approaches the ice, the time and coordinates of the first contact with the ice edge are recorded as well as all sea ice parameters near and around the ship. Subsequently, when any parameter changes, the observer records the coordinates and time to mark the beginning of a new ice zone and determines all sea ice parameters anew. The same procedure continues during the whole expedition [8].
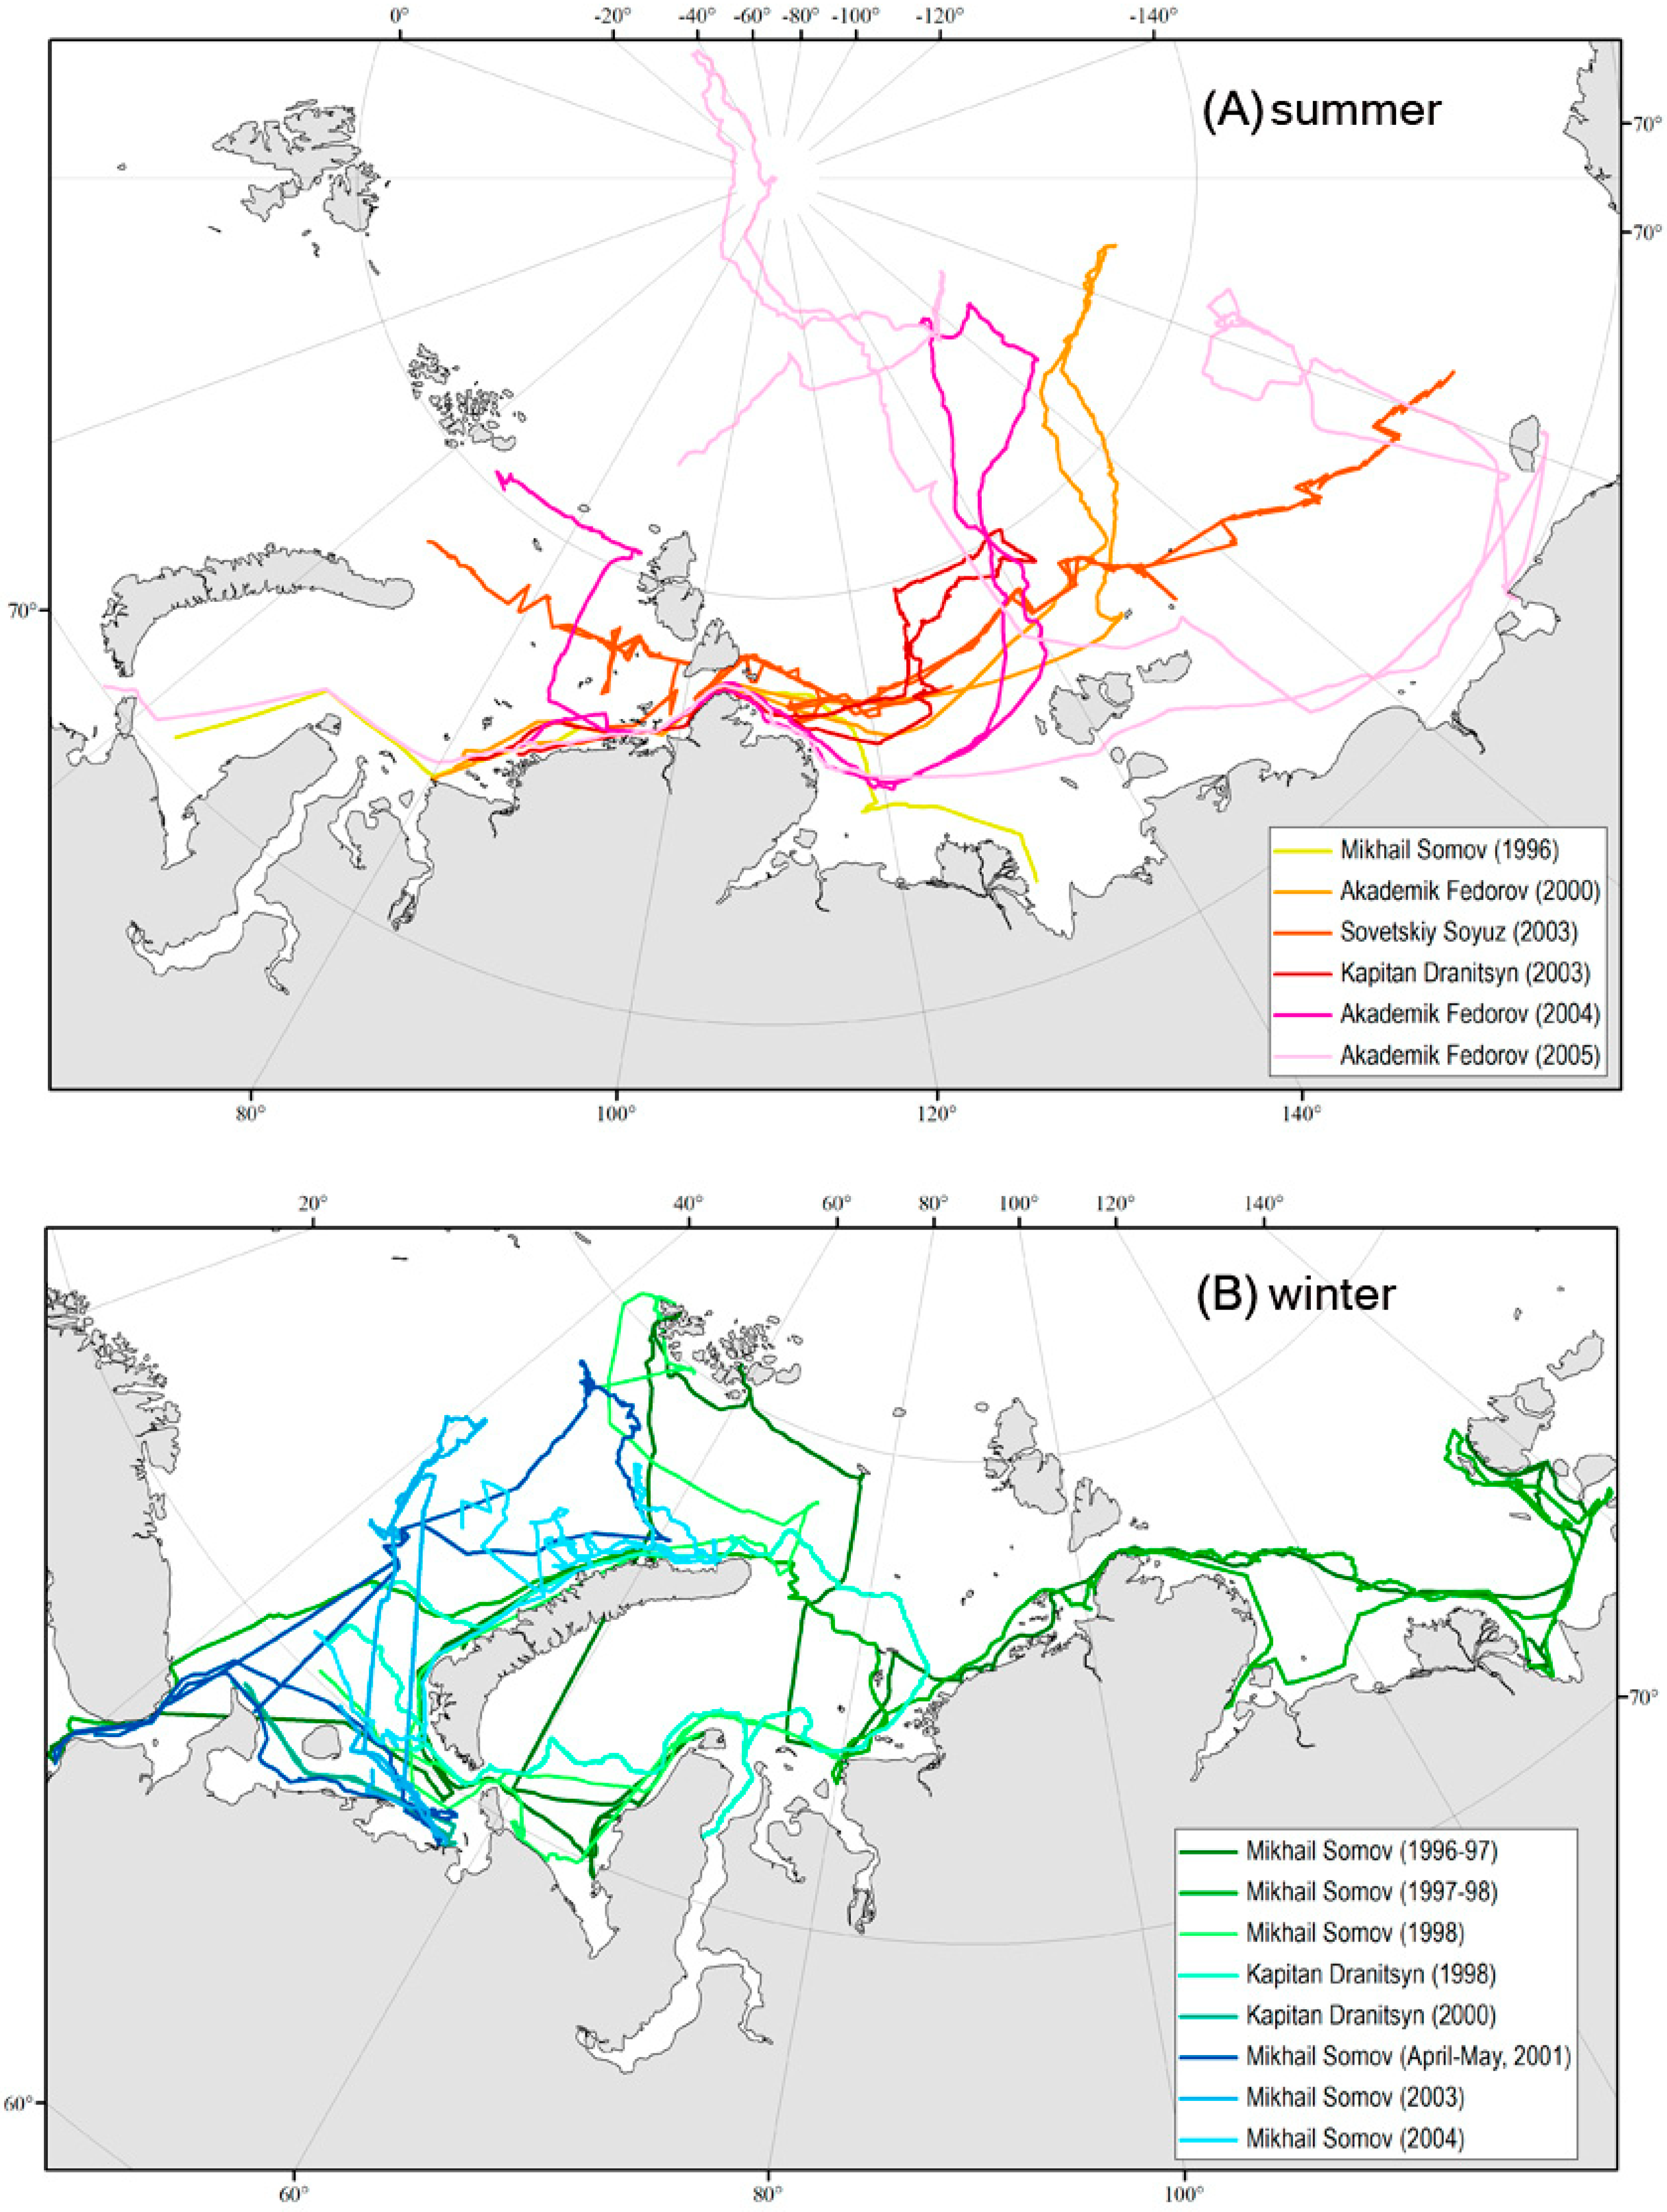
Comparison of the total SIC obtained from satellite microwave radiometry data (Csmr) with the total SIC obtained during ship observations (Cso) was performed separately for the summer and winter seasons. A comparison was also made with the ship-based total SIC from which the new ice and nilas (up to 10 cm thick) types of ice were excluded (Cso-ni). The expeditions were divided into summer and winter ones by their dates and observed ice conditions (Table 1). In July–September in the Kara, Laptev, and East-Siberian Seas ice melt was observed. Therefore, the expeditions conducted in this period were ranked as summer ones. The expeditions carried out in October–May in the Barents, Kara, and Laptev Seas were ranked as winter ones since they recorded freeze up and maximal development of the ice cover. Summer observations (Figure 2A) were carried out during six expeditions of research vessels (RVs) Akademik Fedorov (2000, 2004, and 2005) and Mikhail Somov (1996), as well as icebreakers Sovetskiy Soyuz (2003) and Kapitan Dranitsyn (2003). Data of eight winter expeditions (Figure 2B) were obtained aboard research vessel Mikhail Somov (1996–1997, 1997–1998, 1998, 2001, 2003, and 2004) and icebreaker Kapitan Dranitsyn (1998 and 2000). In total, in the study area (Barents, Kara, Laptev, and East Siberian Seas) continuous dedicated visual observations of ice condition were conducted along a track distance of nearly 91 thousand kilometers.
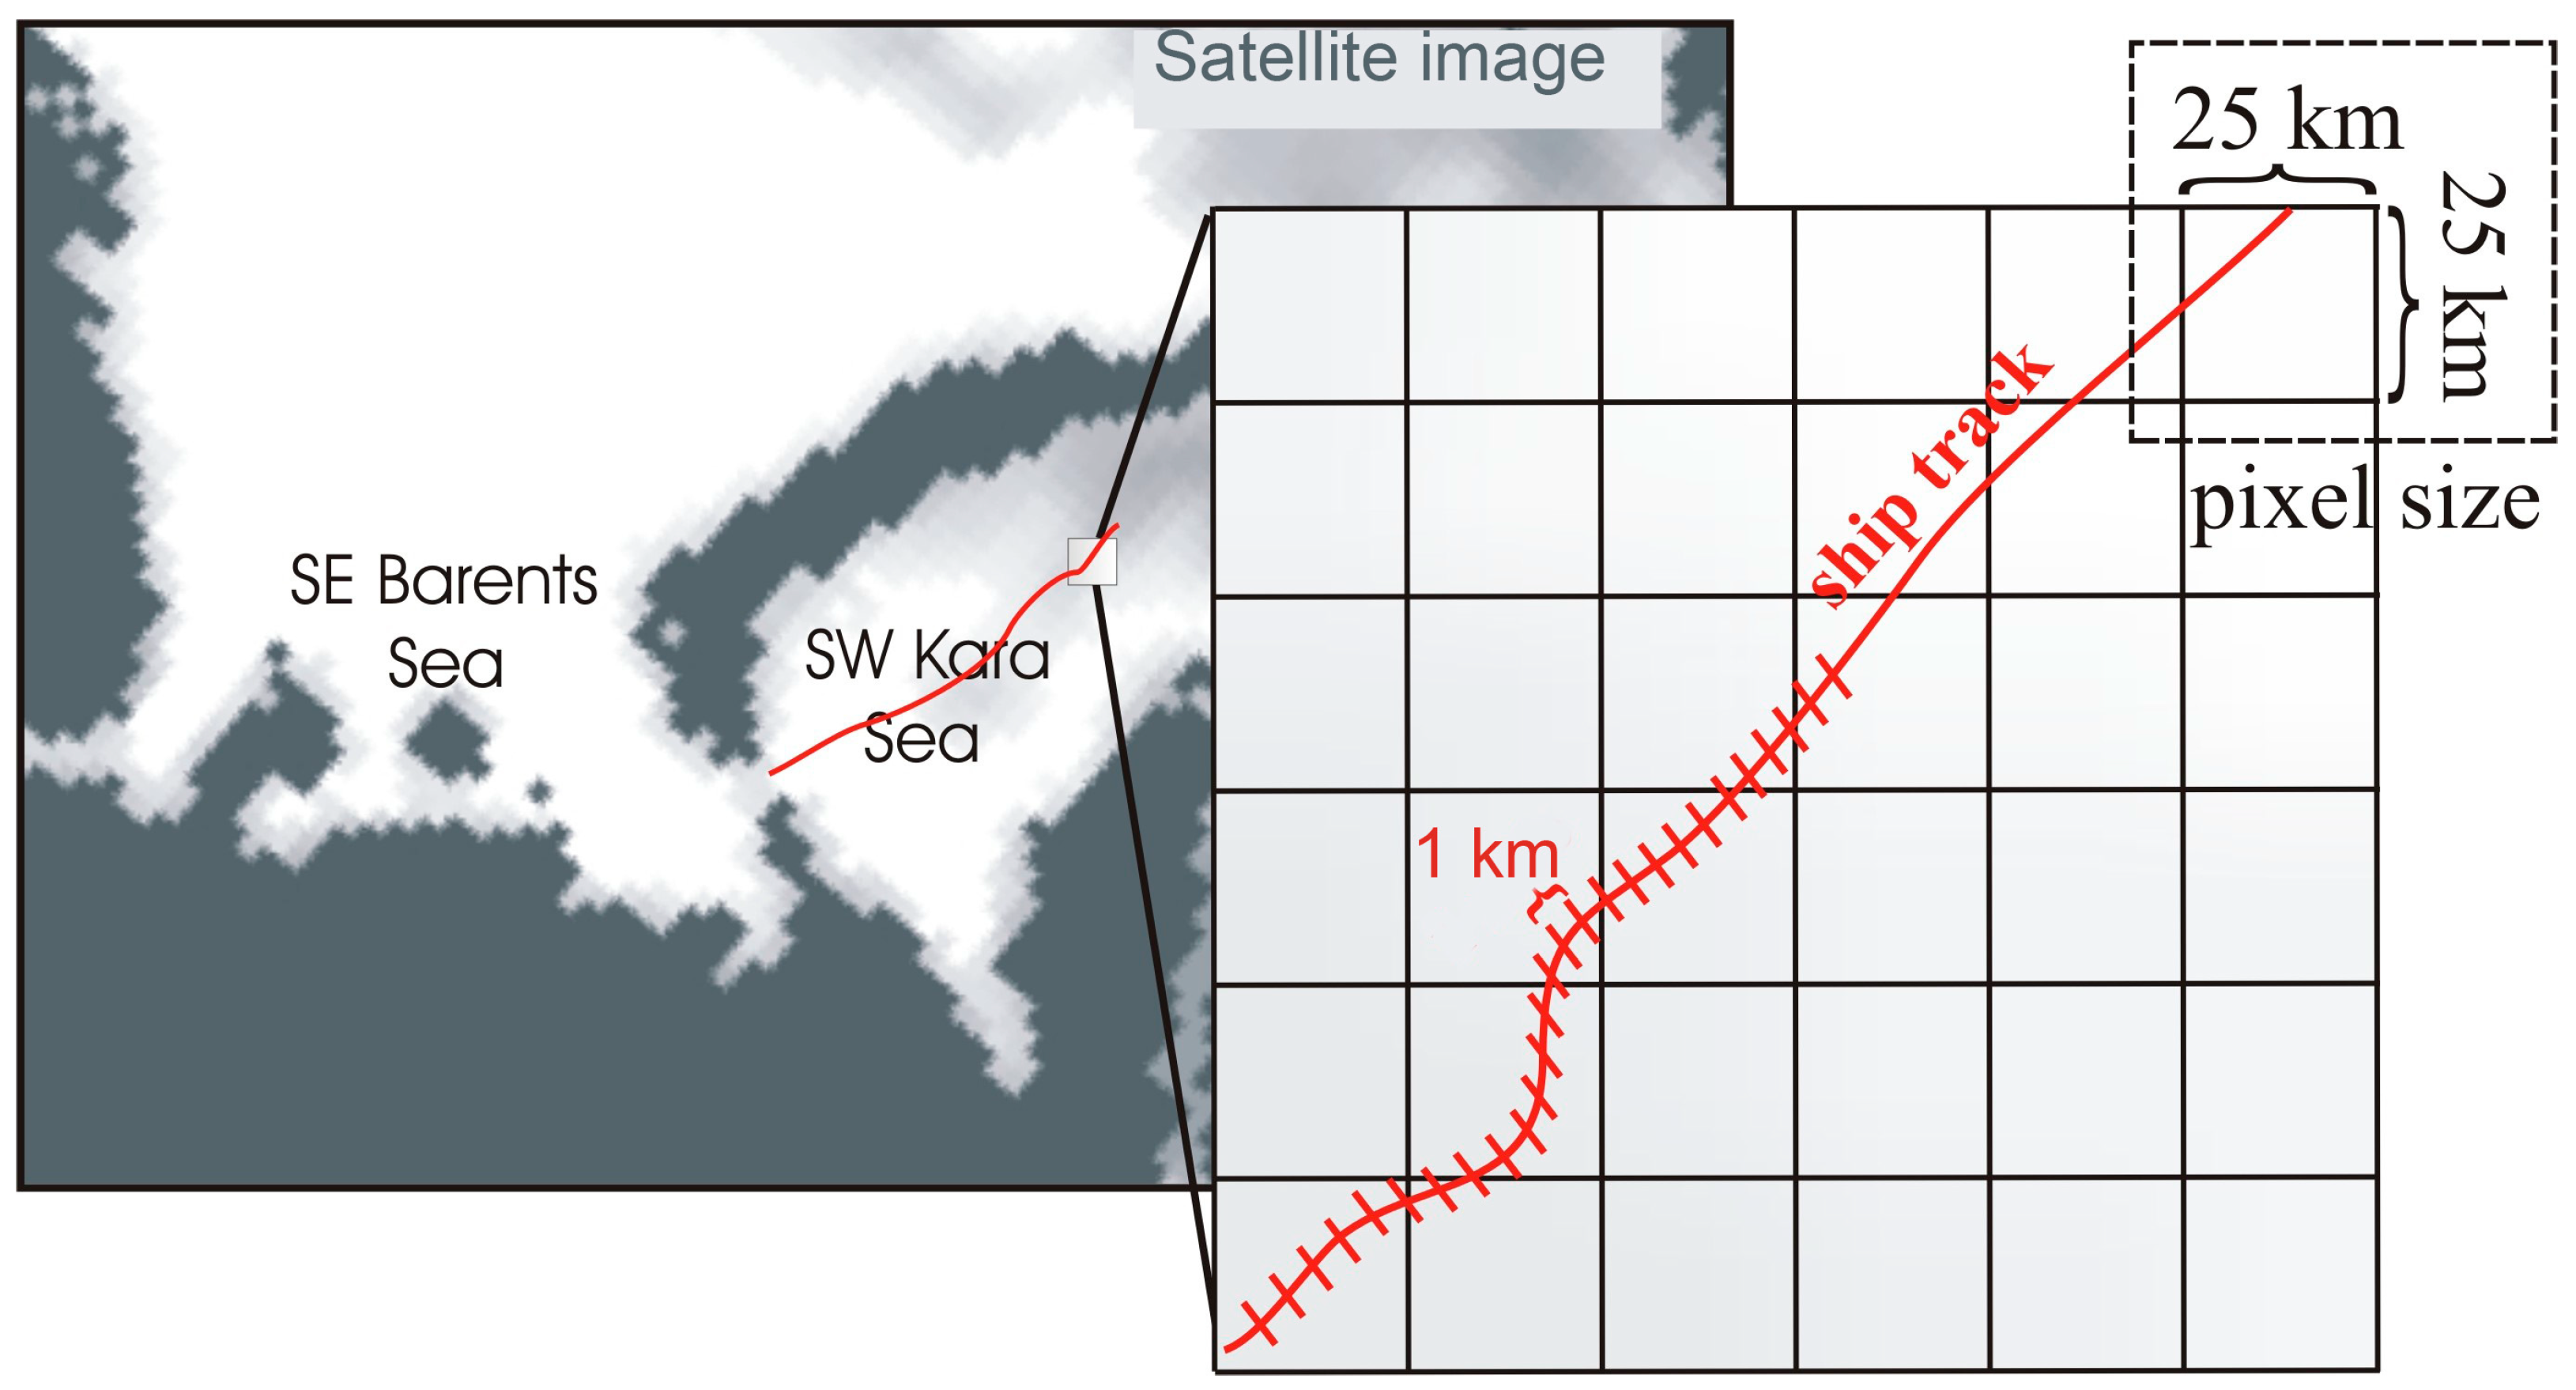
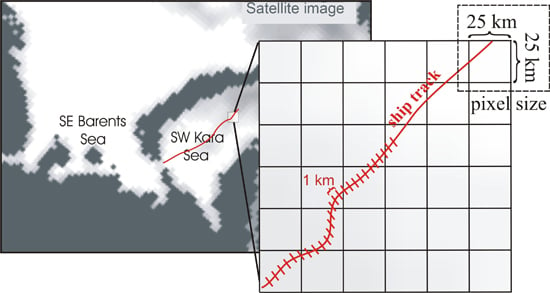
For comparison of ship observations with satellite data, the total SIC observed in the navigation area was used. Since the techniques for obtaining satellite and ship data are fundamentally different, their spatial resolution may differ quite significantly. Therefore, before analyzing, it is necessary to reduce them to a single discreteness. The discreteness of ship measurement points is not constant, so ship data are reduced to spatial resolutions with grid cells of 25 × 25 km and 12.5 × 12.5 km matching the pixel sizes of the satellite images (Figure 3). Each ice zone has its own length (depending on how fast sea ice parameters are changing). To unify them, the ship tracks were divided into 1 km segments. For each segment, its location on a pixel grid was calculated. Sea ice parameters that corresponded to the same pixel on the same date were averaged along a track.
Ship movement is usually selective in finding the best way through the ice, and the ship track is not a straight line (Figure 3). According to our calculations, the average length of the actually chosen ship track inside the area of one image pixel of 25 × 25 km (pixel area 625 km2) is about 20–25 km, and in an area of 12.5 × 12.5 km (pixel area 156.25 km2) it is about 8–12 km. With good visibility, visual observations cover a distance of up to 5 km on both sides of the ship track (by experience of ice observers and shipmasters, though no exact distance can be found in the literature).
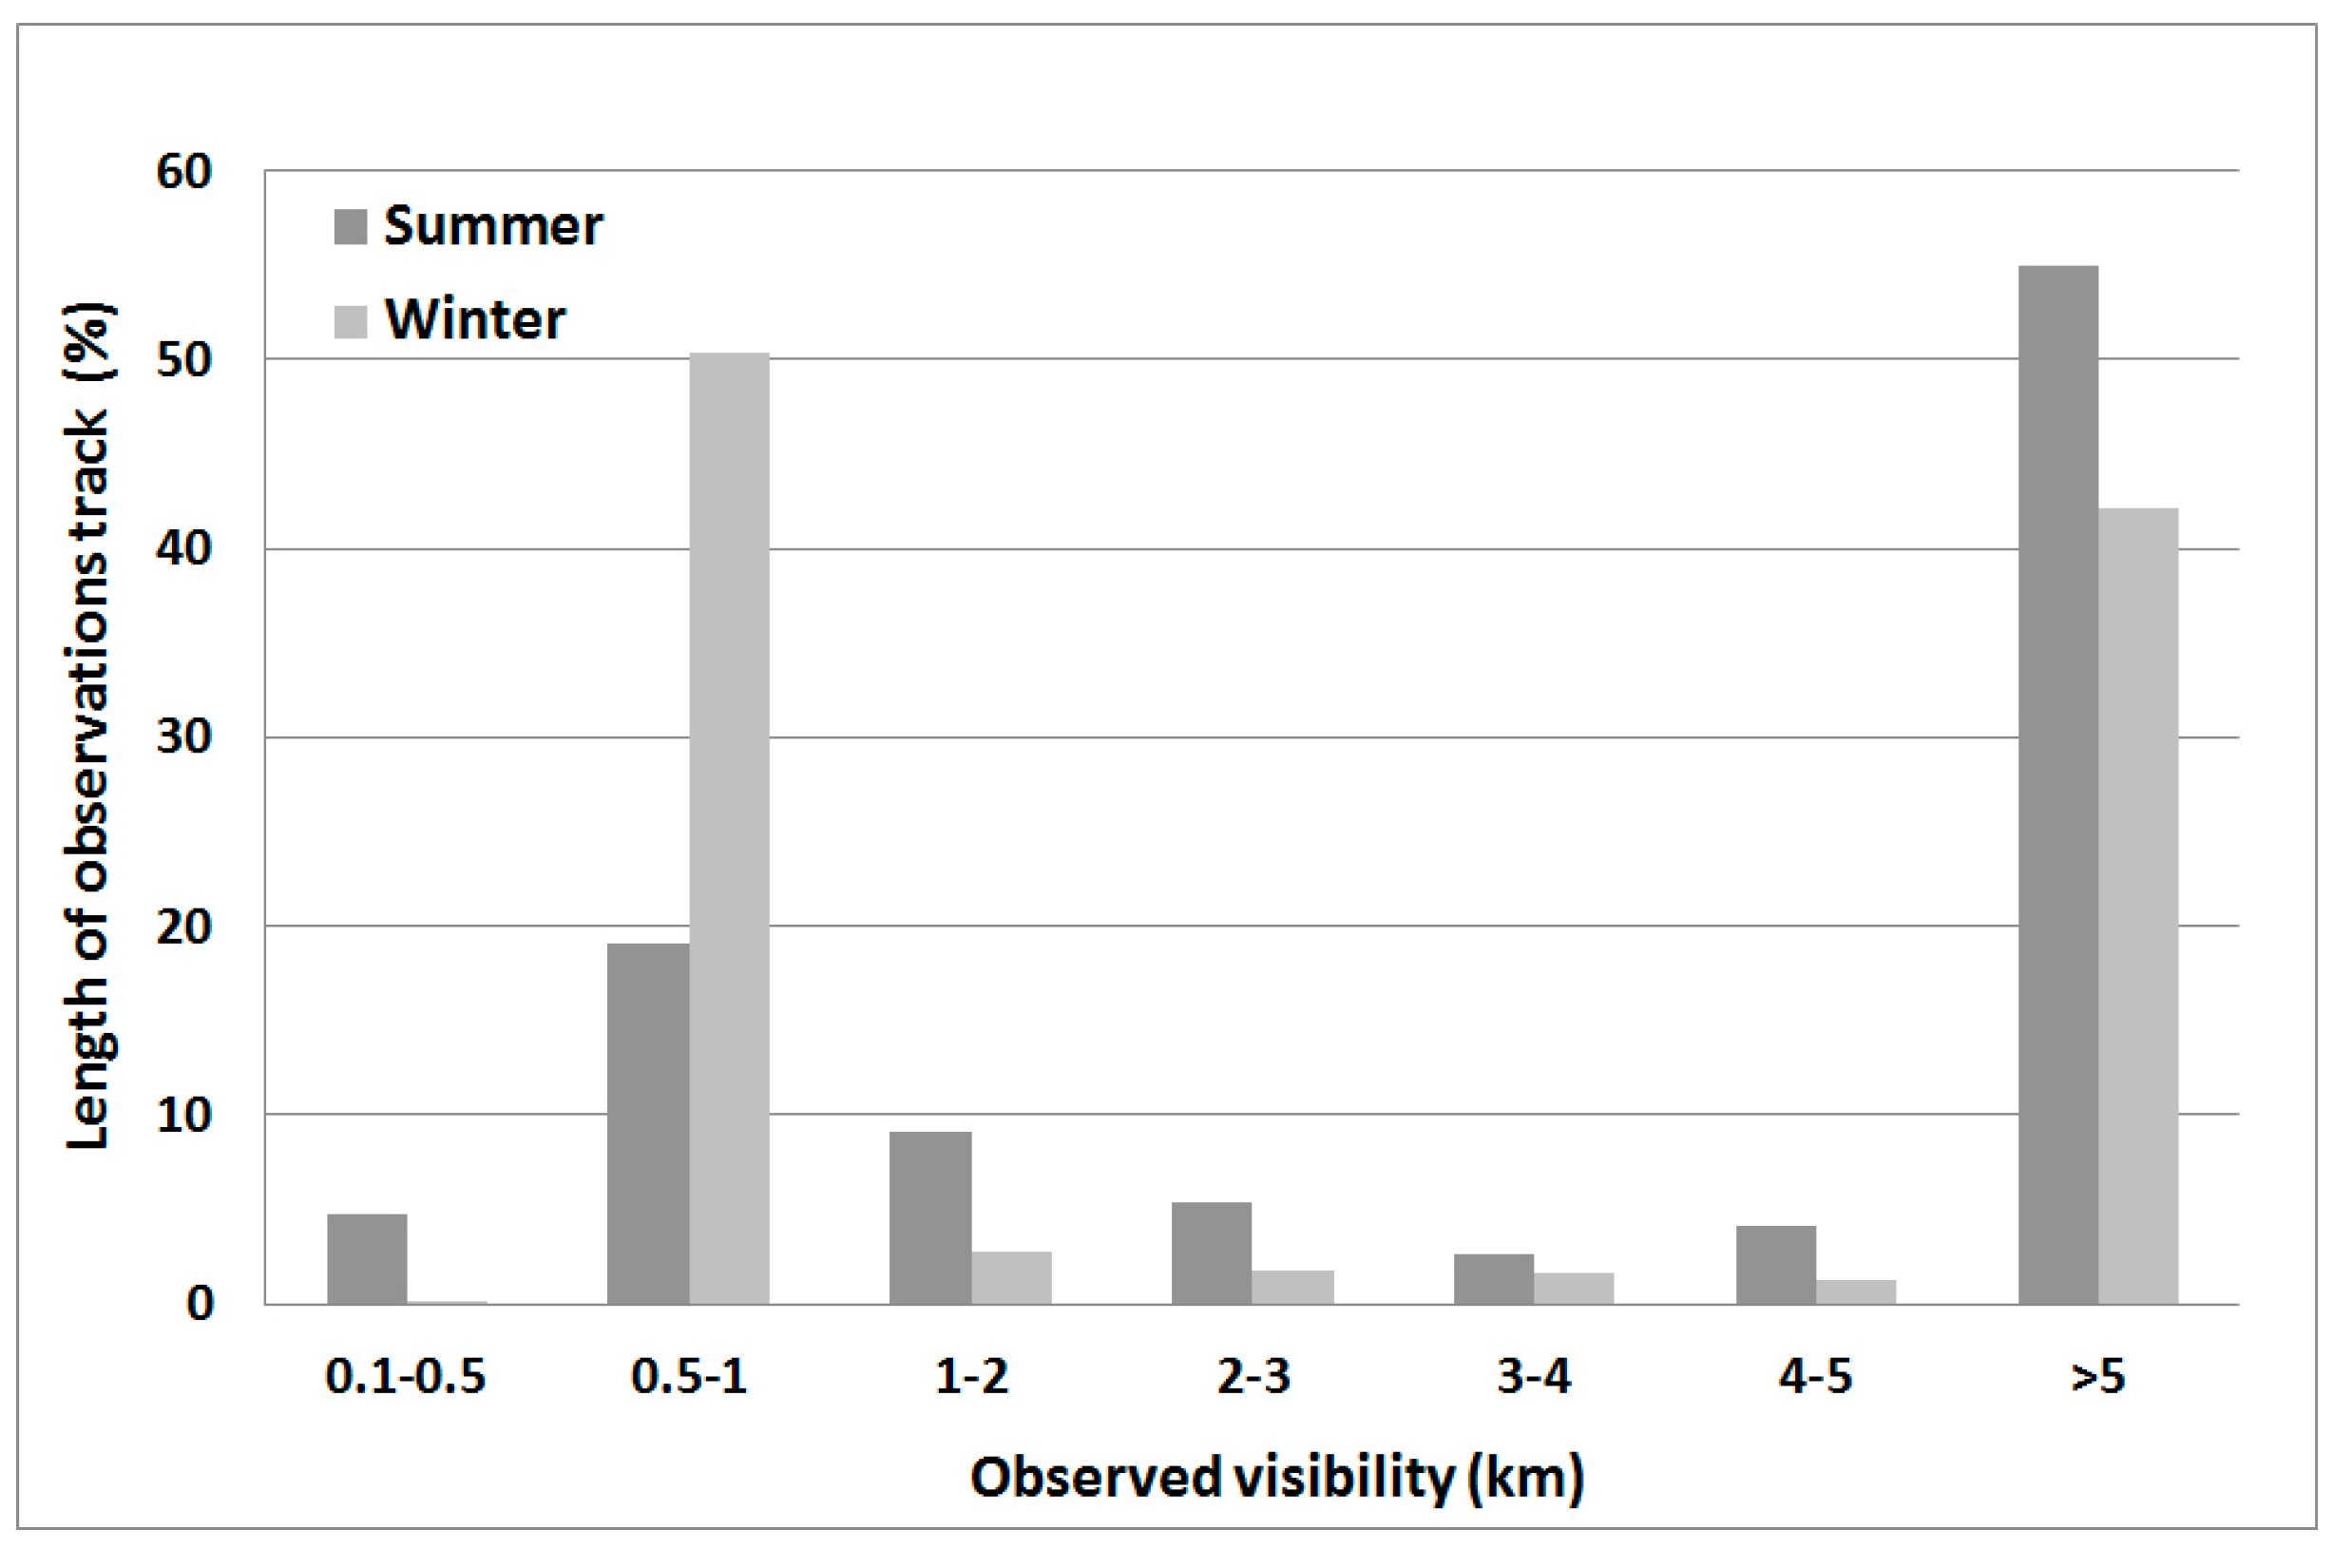
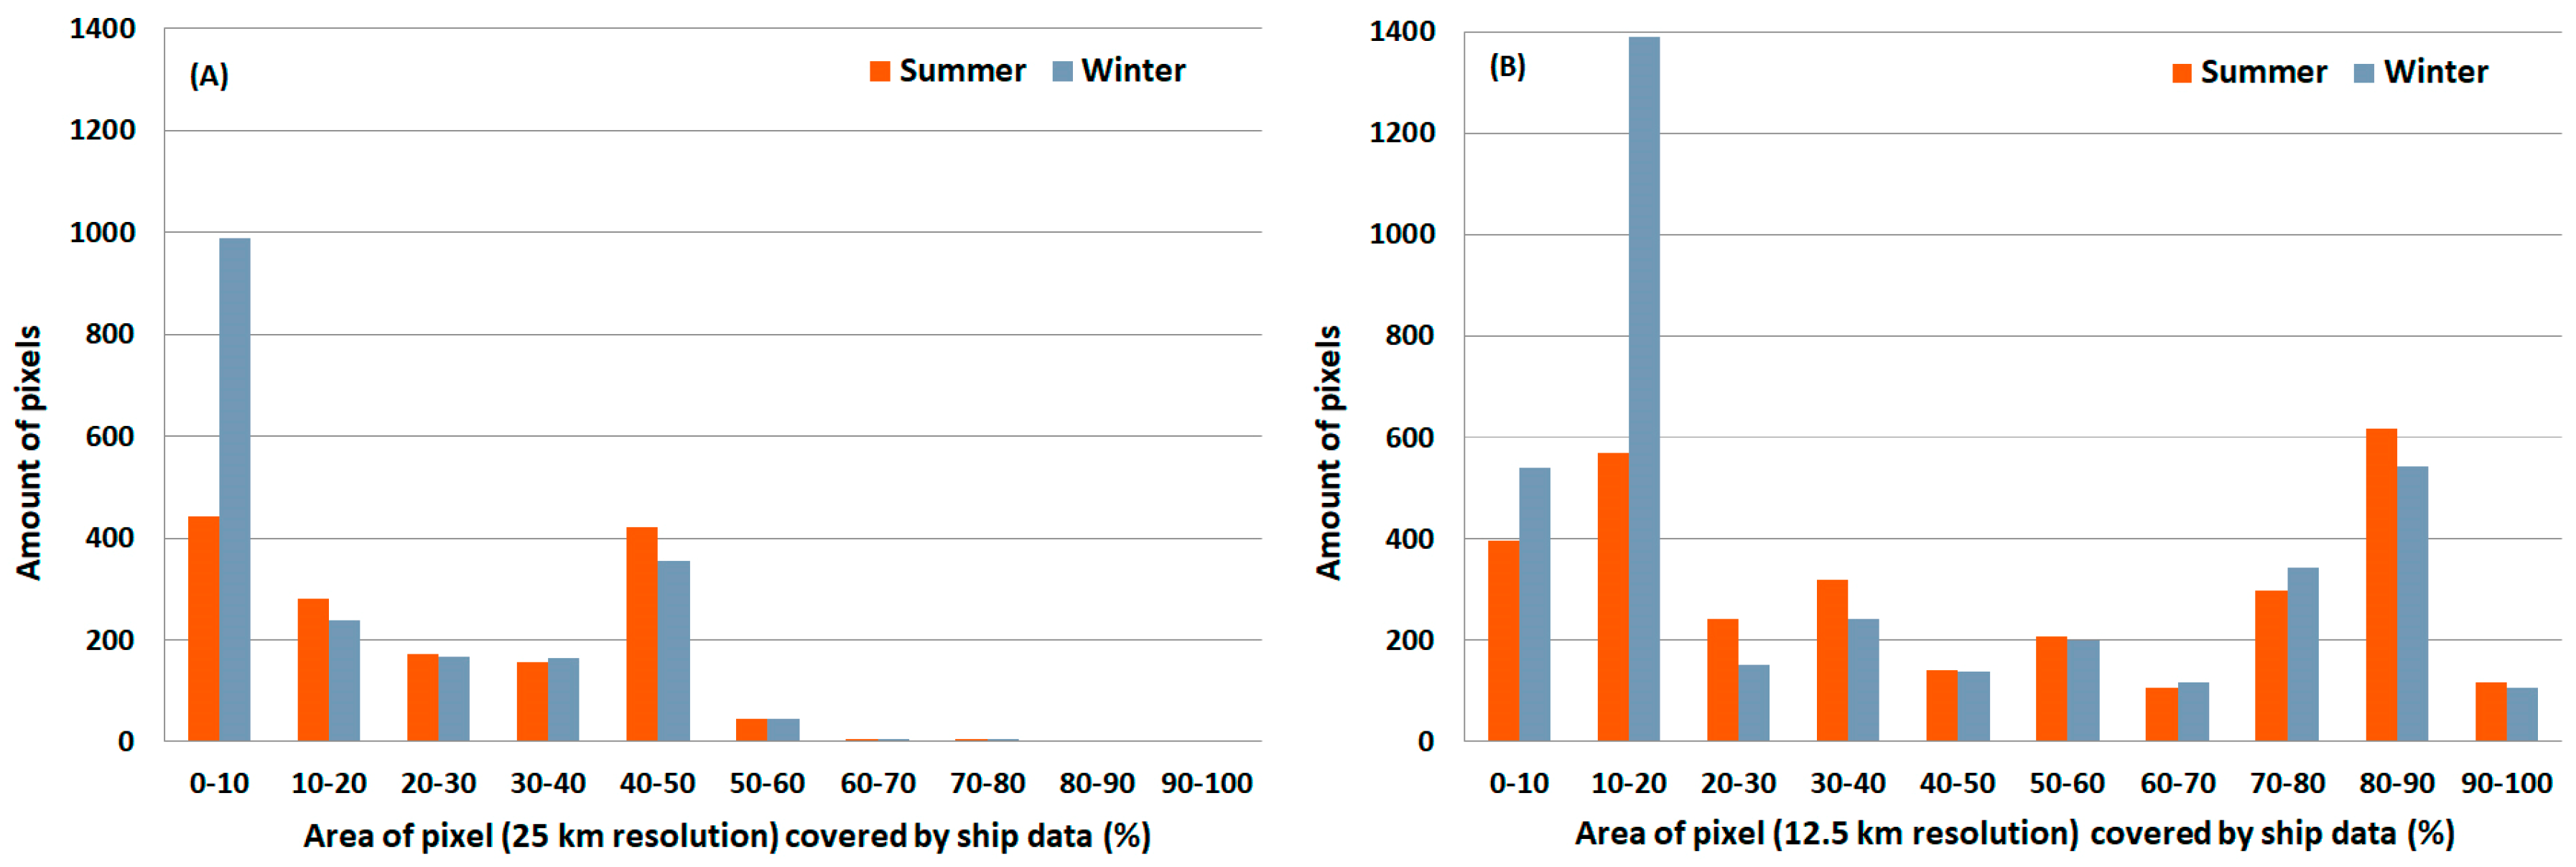
In summer, most of the ice observations were conducted under favorable weather conditions and most of them in daylight (Figure 4). While in winter, more than half of the observations were in conditions of poor visibility or at dusk. To estimate the coverage of the pixel area by ship observations, the length of the ship track corresponding to each pixel was multiplied by the observed visibility (but not more than 5 km from each side of the ship, that is the maximum distance visual observations are supposed to cover with good visibility). Figure 5A presents the distribution of 25 × 25 km pixel area coverage by ship observations (for NT). The maximum coverage was 70–80% with good visibility and maximum ship track length contained within pixel. However, only a small part of the pixels was covered by observations for more than 50% of pixel area, both in summer and winter. On the distribution histogram (Figure 5A), there are two maximums: 0–10% of the pixels correspond to short ship track sections and/or poor visibility, 40–50% of the pixels correspond to longer track sections and good visibility. Based on this distribution, 40% coverage by ship observation of a 25 × 25 km pixel was set as a cut-off value, meaning that pixels covered by ship observations to less than 40% were excluded from the analysis. Figure 5B shows the distribution of 12 × 12.5 km pixel area coverage by ship observations. Despite the fact that the coverage of smaller pixels by ship observations is larger, the 40% coverage cut-off was assumed for all three algorithms in view of following a uniform analysis procedure.
Similar comparisons have been performed to validate satellite data in various studies. For example, [20] discusses comparison with ship measurements taken once per hour and video data from a helicopter that in 1 minute covered an area of 0.2 × 2.6 km of the sea surface. In [19], to validate SMMR data, visual observations were carried out using the AARI technique during one cruise of RV Mikhail Somov in the Weddell Sea.

3. Results

Despite only partial coverage of pixels in satellite images by ship observations, the comparison of microwave satellite data with a vast array of ship data is of great importance. In addition to total SIC, ship observations highlight other ice cover parameters: melt stage, ridging, snow height, ice field sizes, etc. These parameters can have a significant impact on the SIC obtained from satellite data.
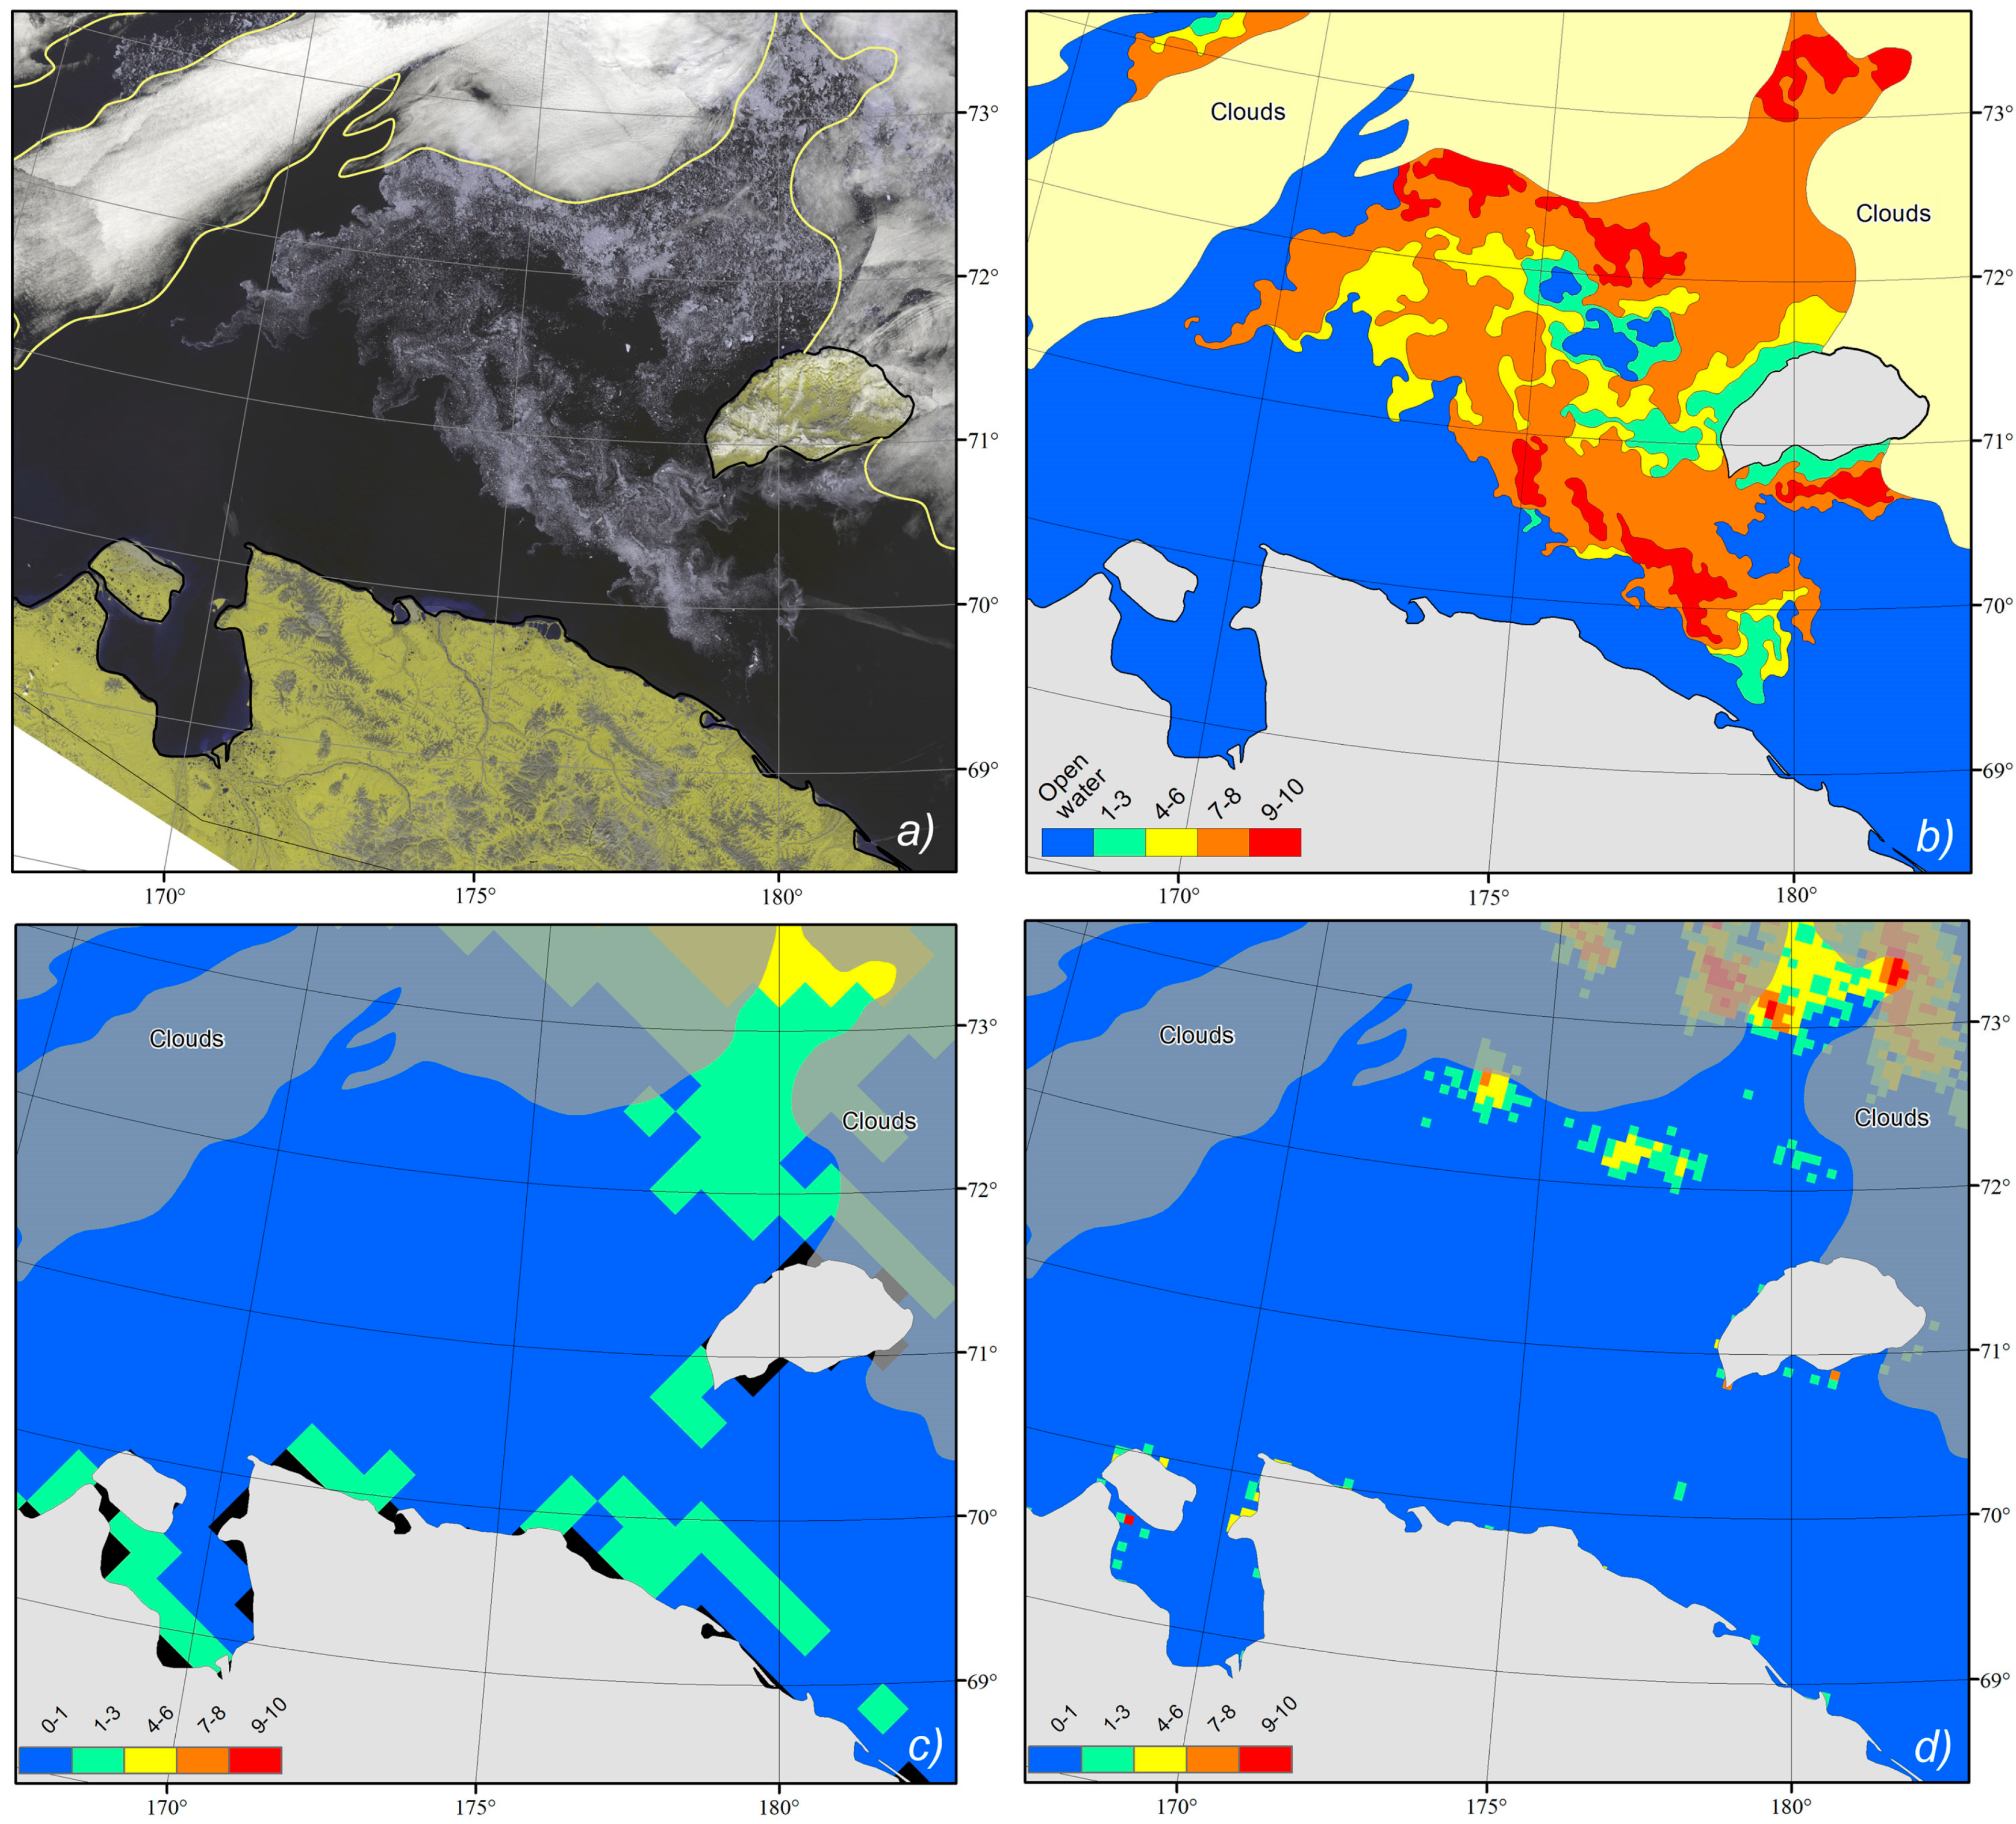
Figure 6 illustrates the magnitude of error that processing of microwave satellite data taken in the period of intense ice melt can produce. When compiling an overview ice chart of the East Siberian Sea on 26 July 2017, during the melt period, a significant difference was found between the passive microwave data and the image in the visible range obtained by Terra MODIS (moderate-resolution imaging spectroradiometer). Very close and compact (9–10 tenths), close (7–8 tenths), and open (4–6 tenths) ice clearly visible in the Terra MODIS image to the west of Wrangel Island (center)—all appear as open water in the passive microwave images. During summer melt, microwave radiant energy comes from the surface of melt ponds rather than the underlying ice surface so the sensor cannot distinguish between the melt ponds on the sea ice and the sea surface. This results in underestimation of the SIC [13].
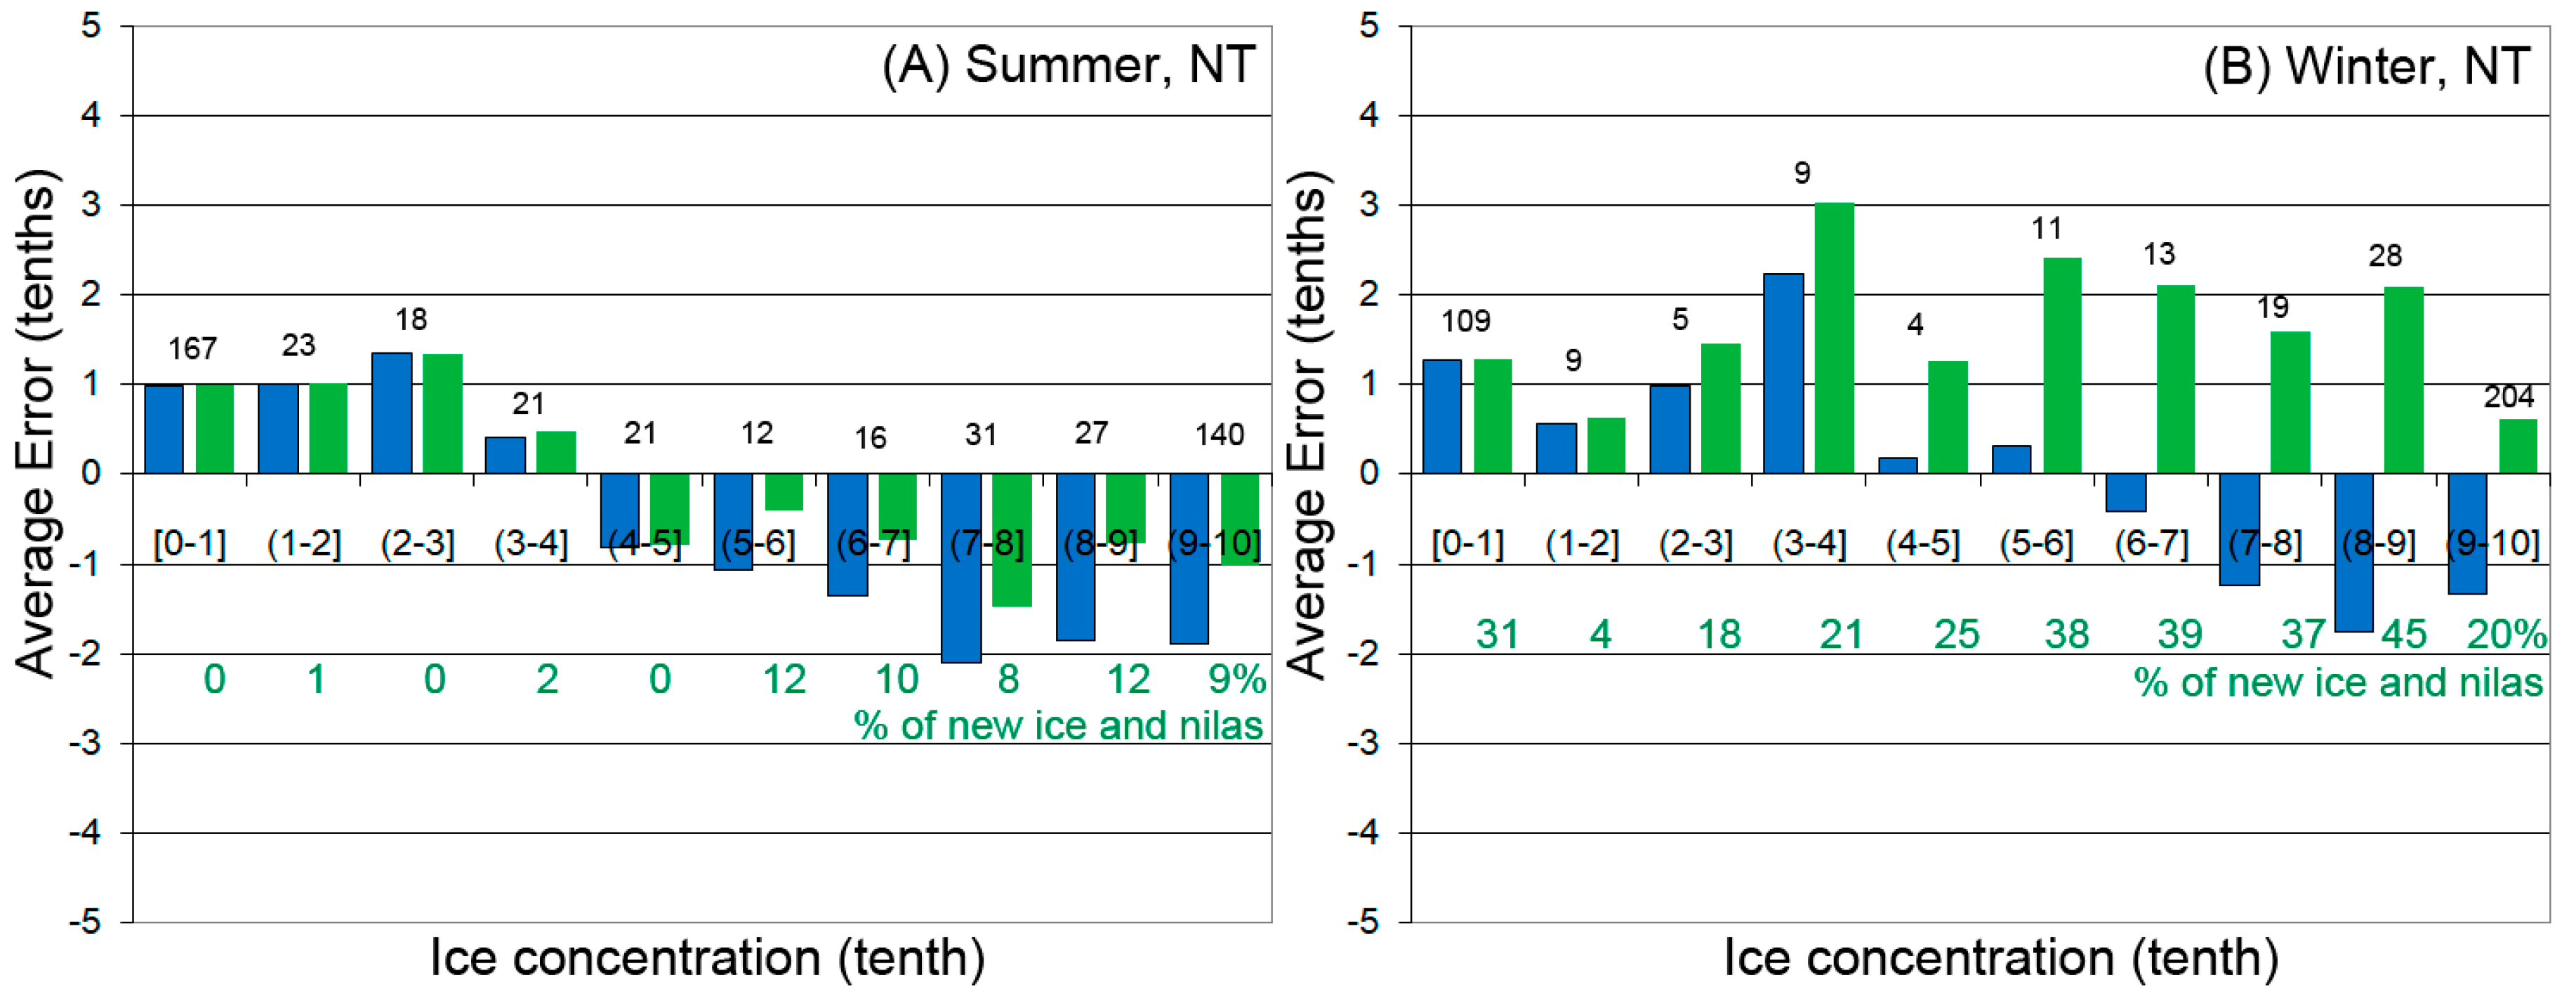
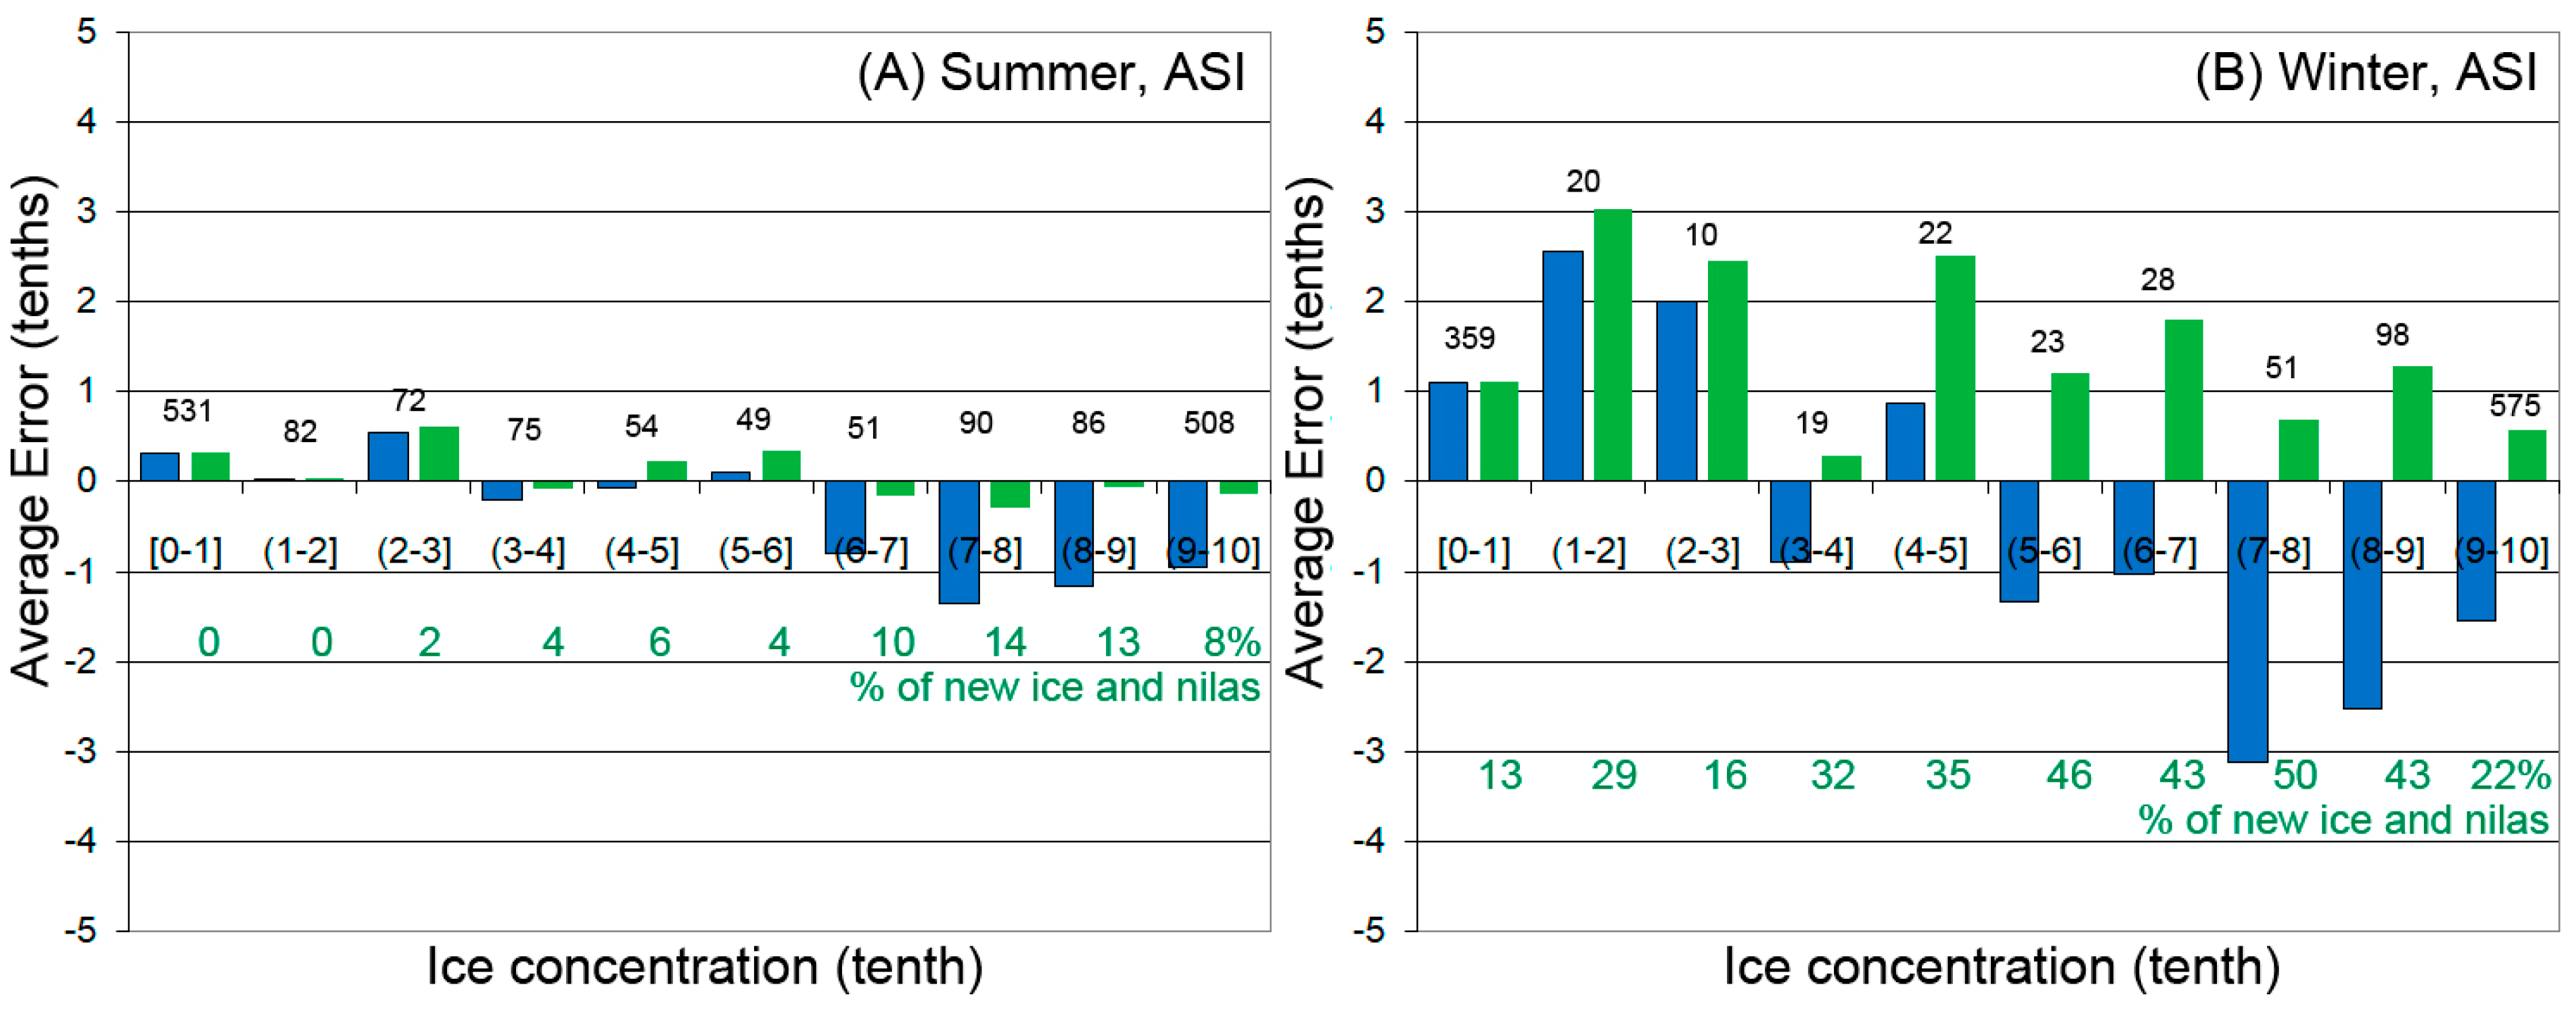
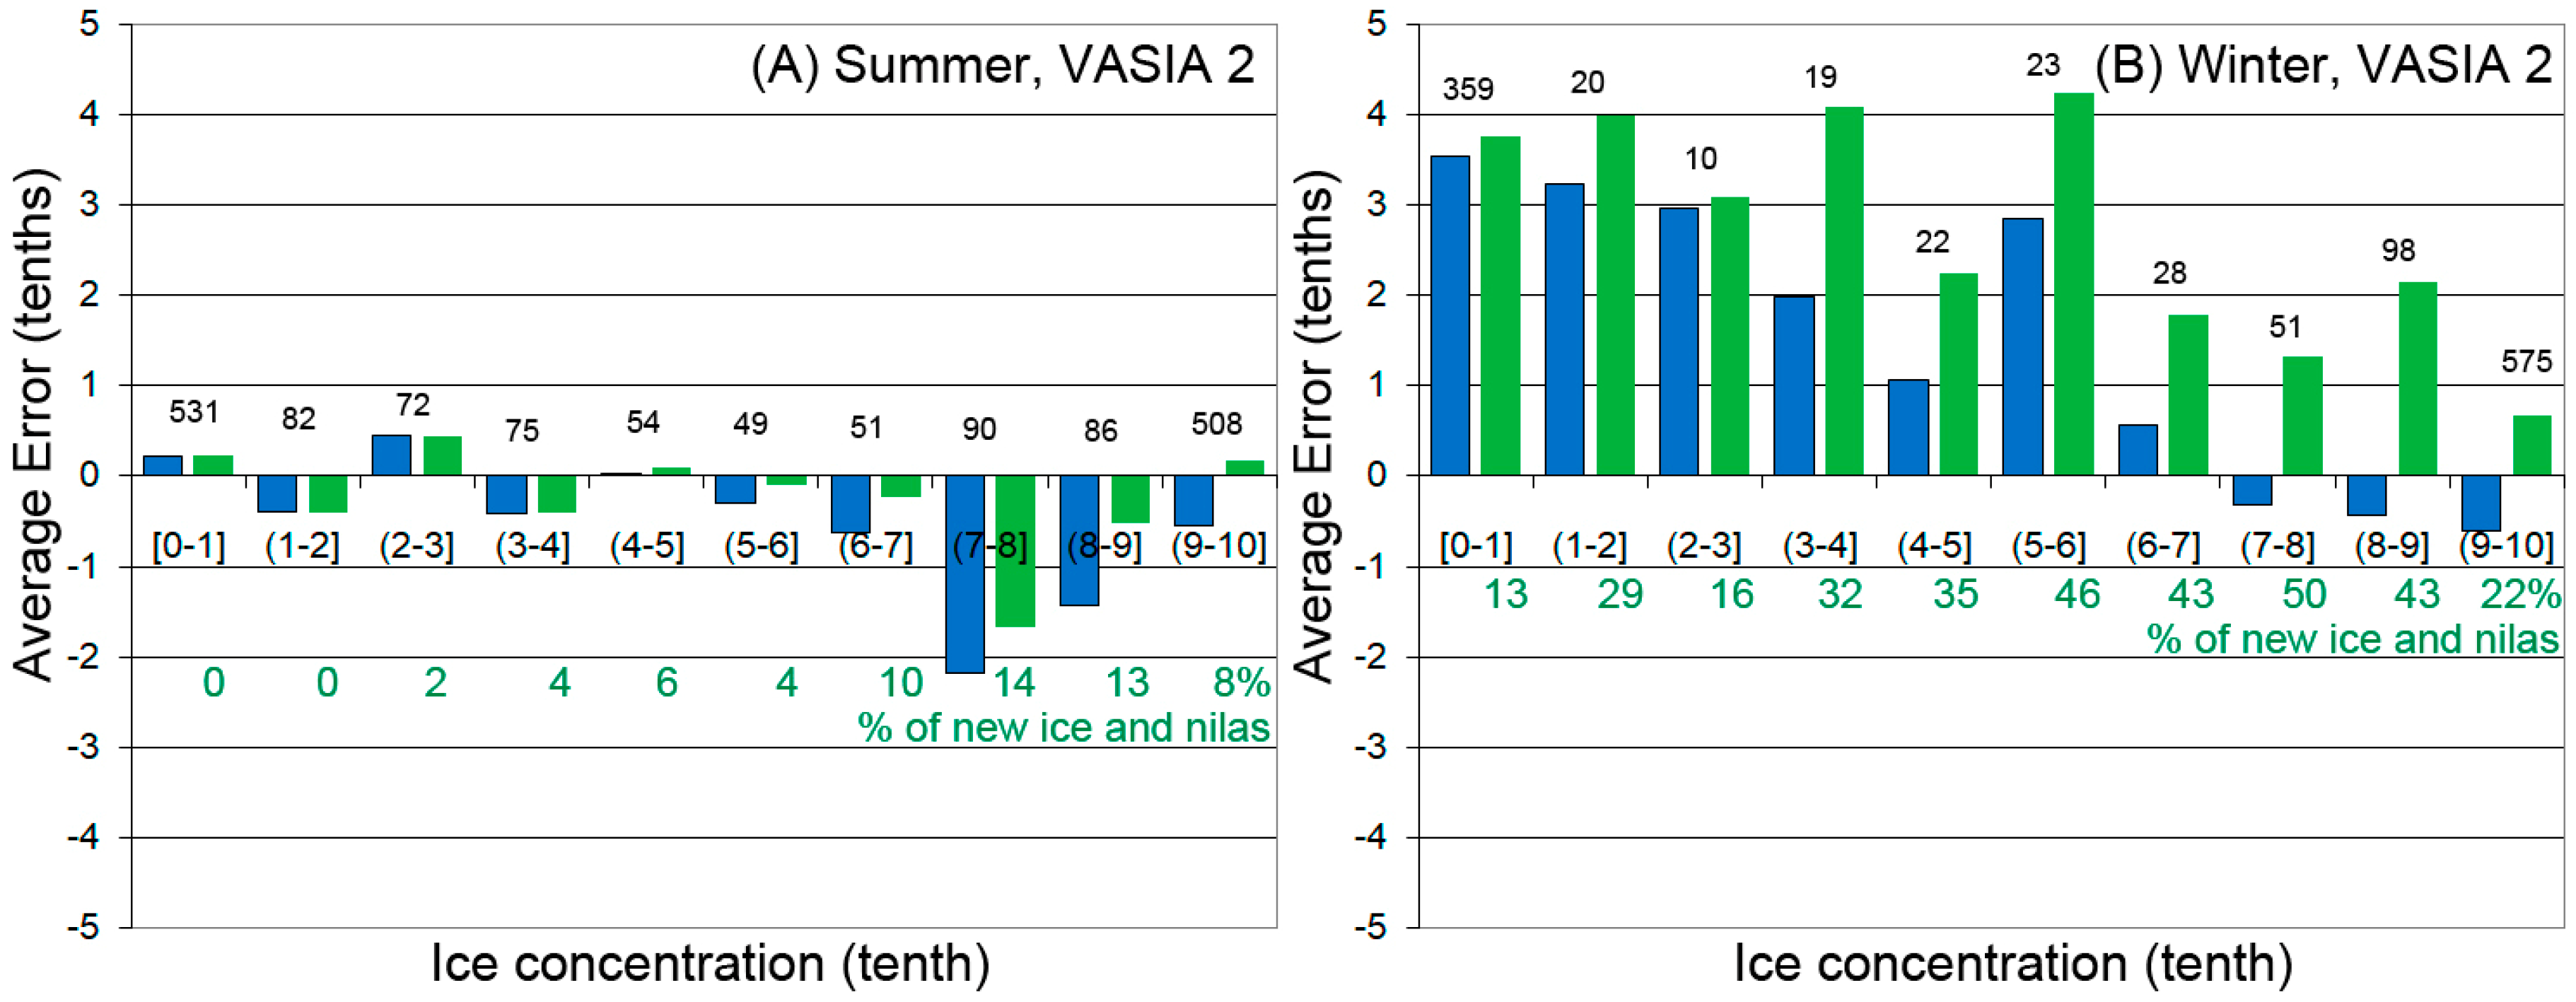
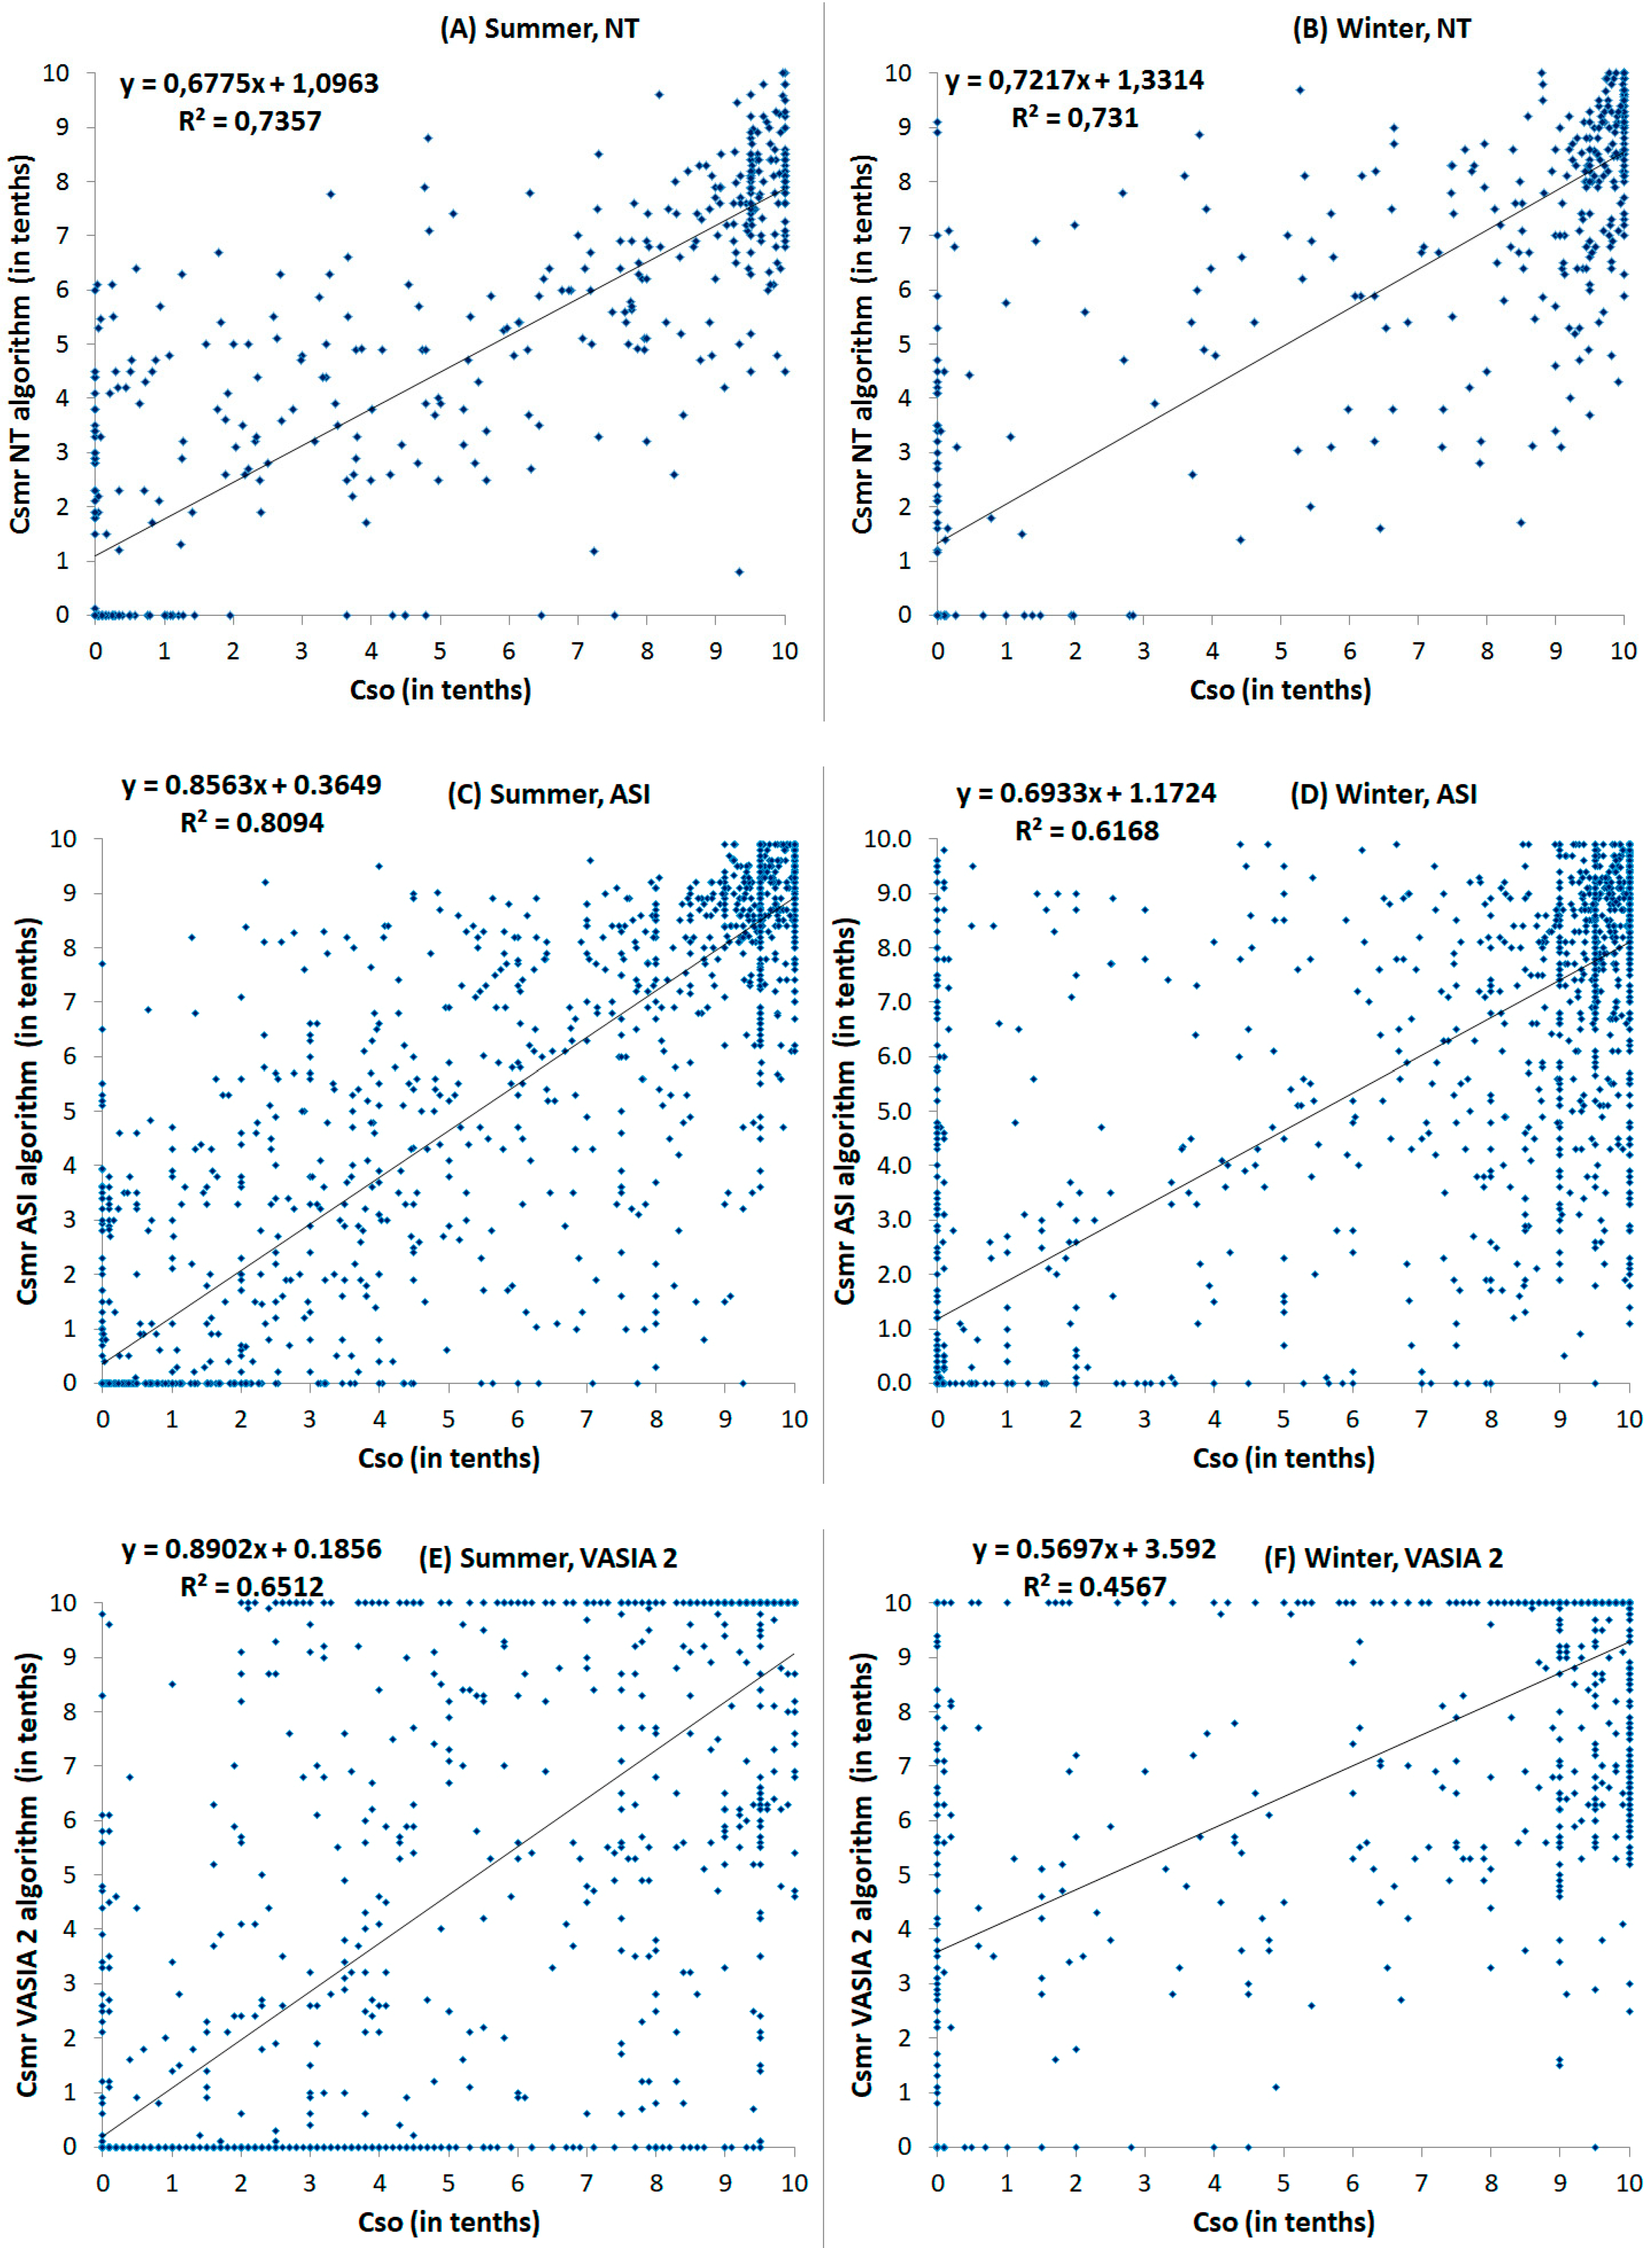
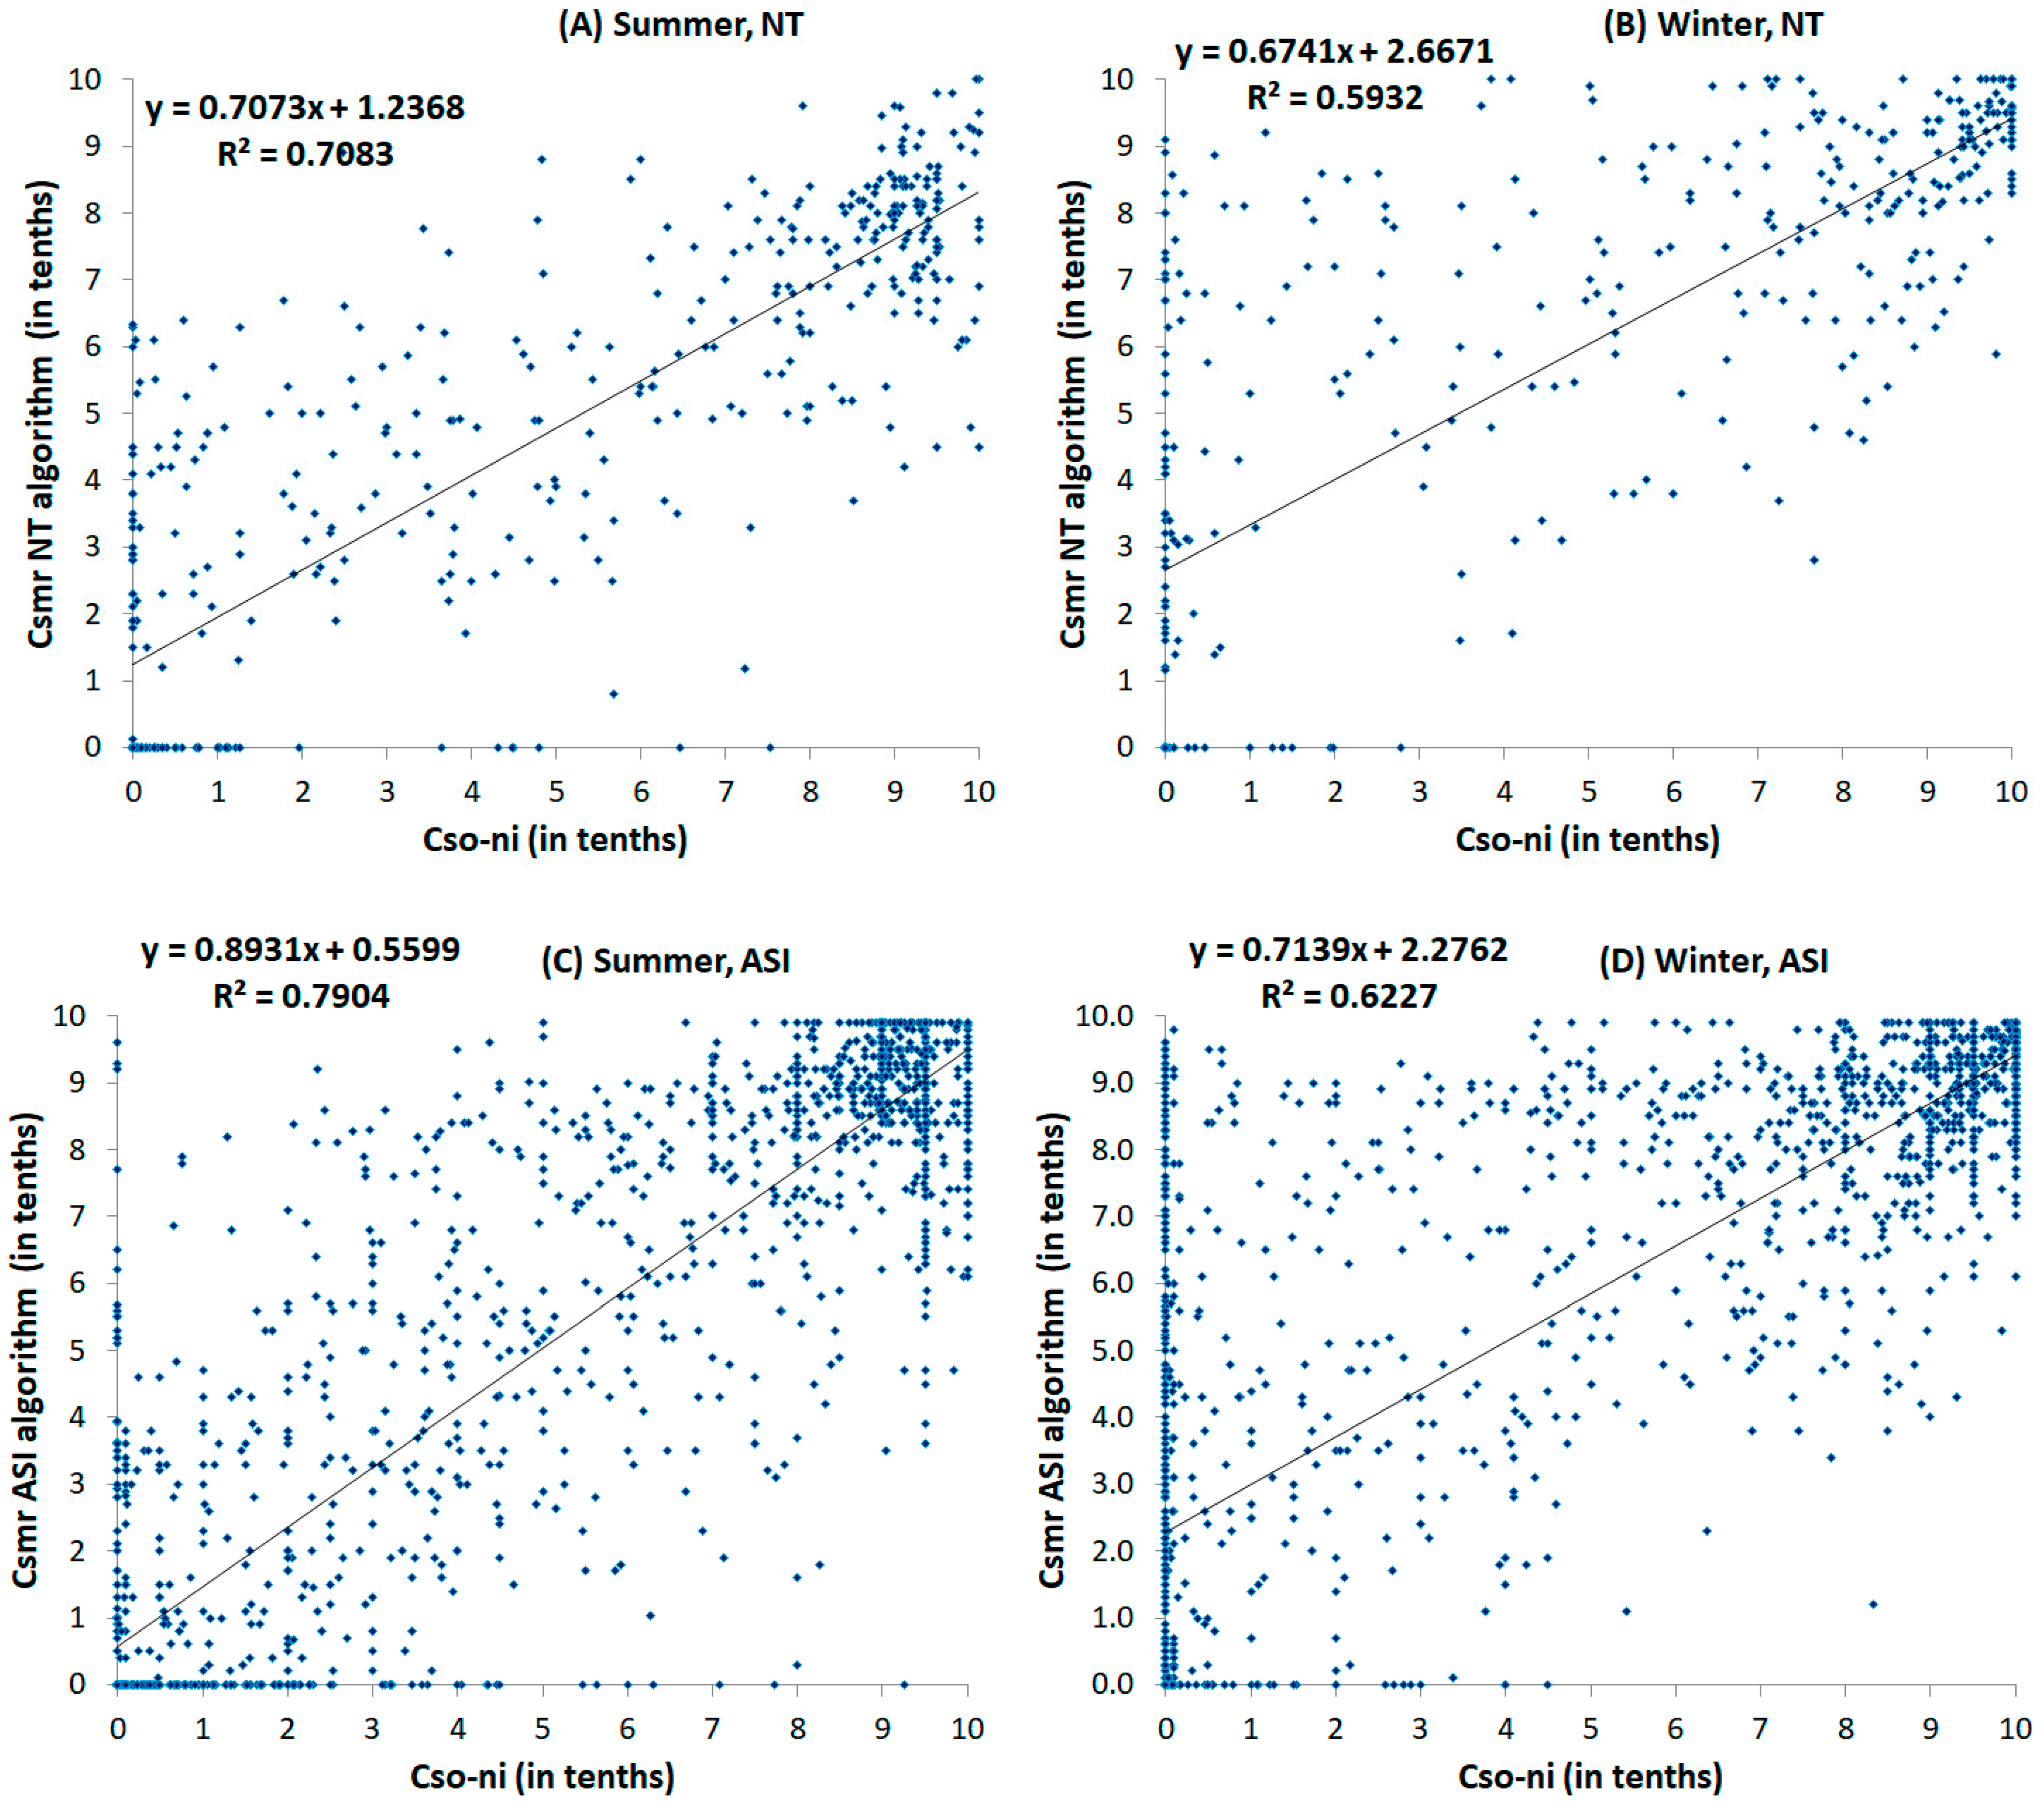
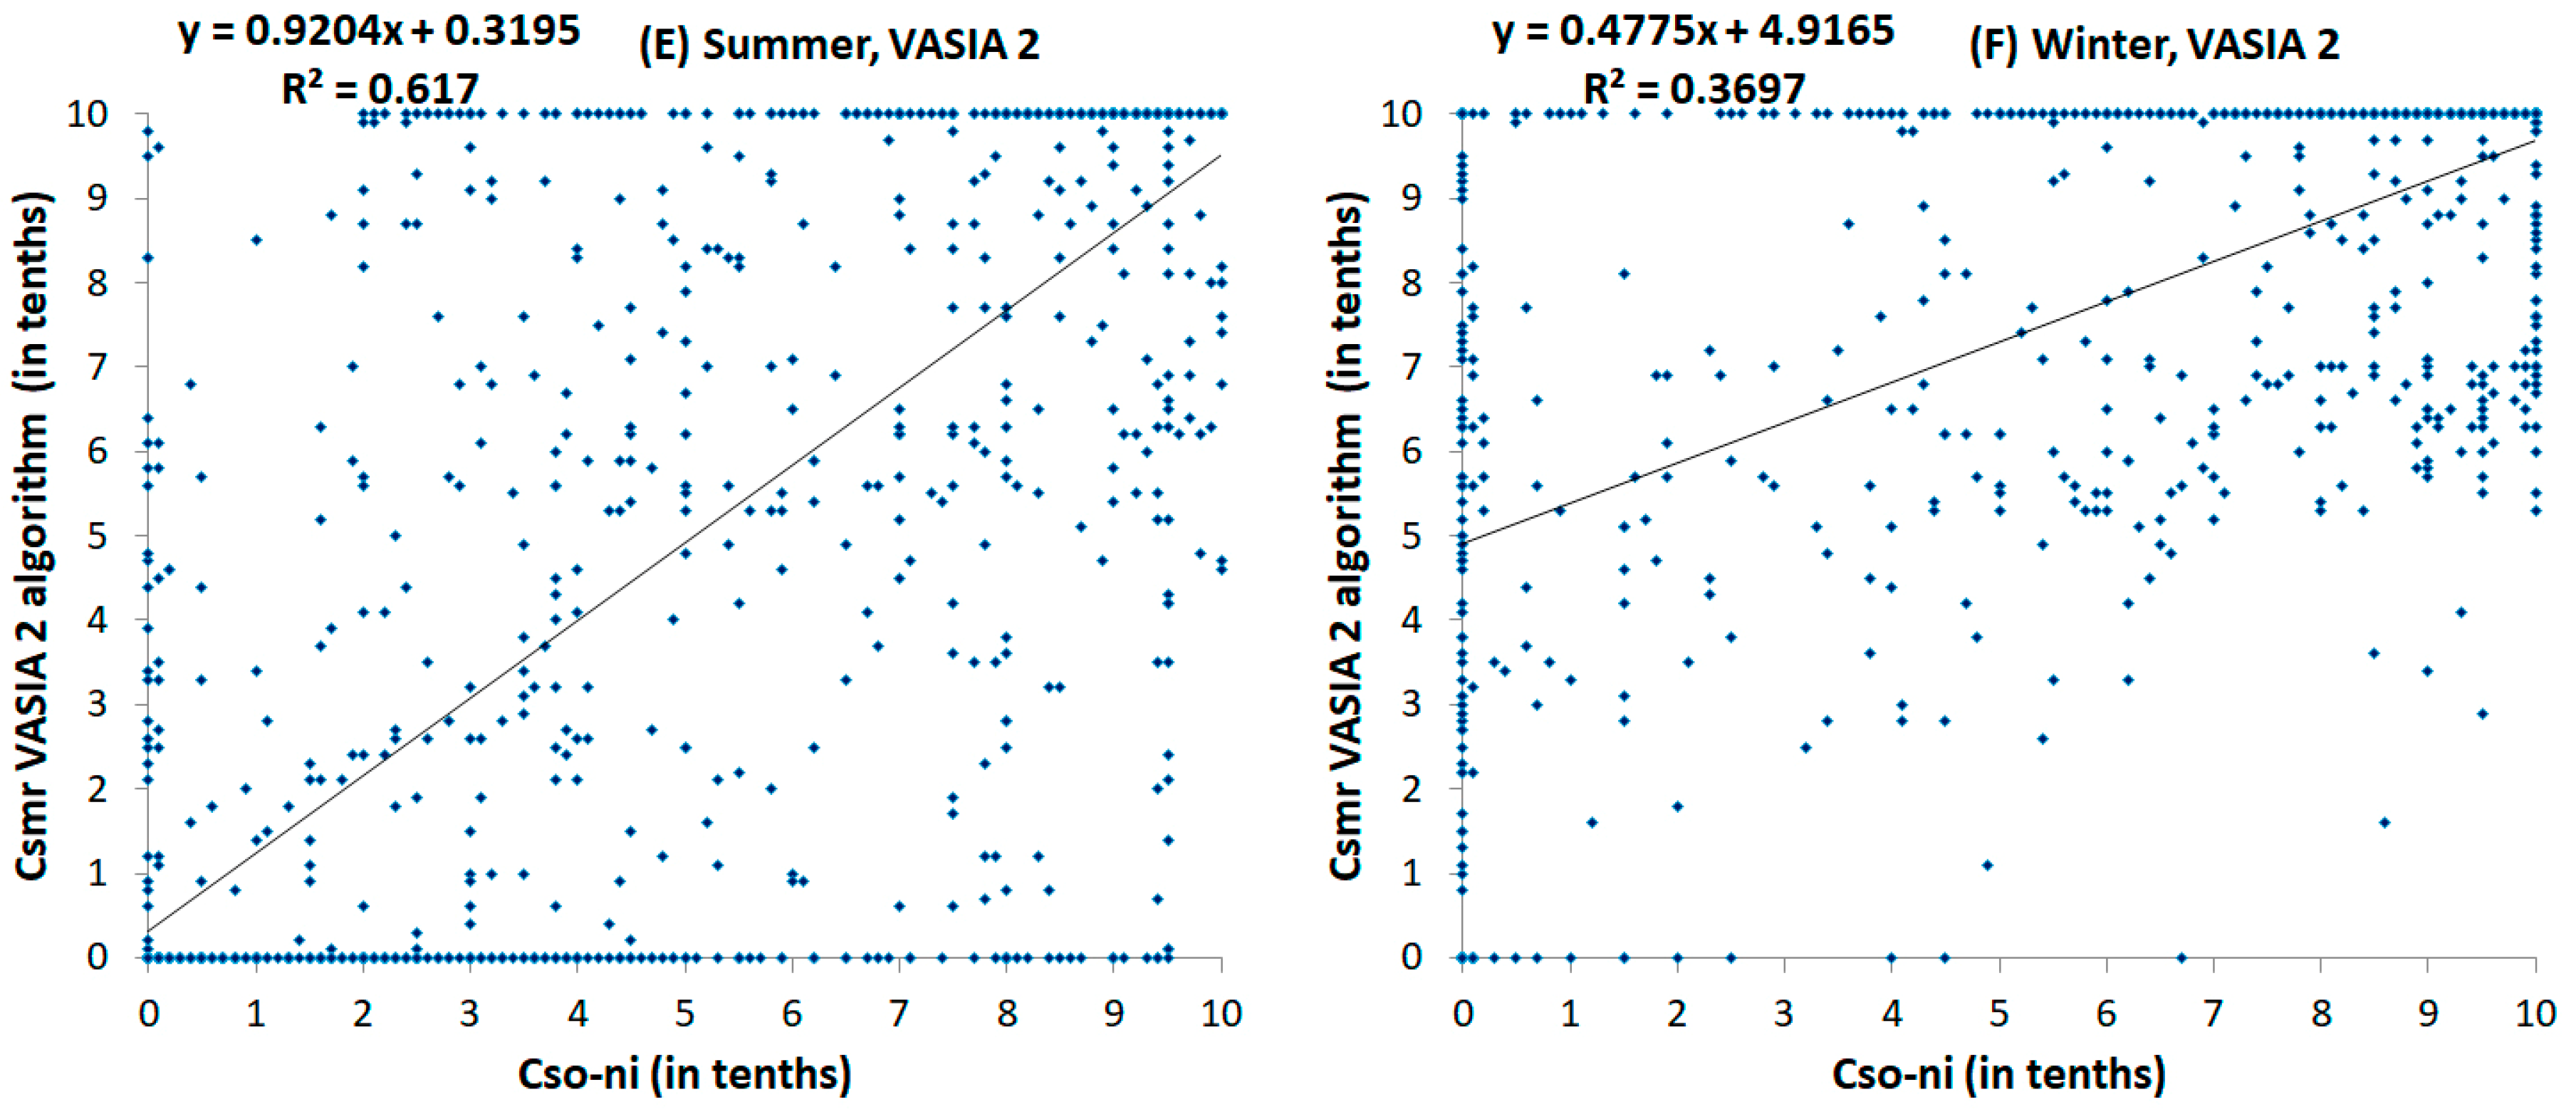
Figure 7, Figure 8 and Figure 9 show the distribution histograms of the difference between Csmr calculated by the three algorithms and Cso (Csmr–Cso) (Section 3.1), and also the difference between Csmr and Cso-ni (Csmr–Cso-ni) (Section 3.2) for the summer and winter seasons. Scatterplots of correlation between Cso and Cso-ni with Csmr are presented in Figure 10 and Figure 11. The most part of Cso observations were conducted in SIC conditions of 0–1 and 9–10 tenths (the number of pixels is shown above each SIC range in Figure 7, Figure 8 and Figure 9). Therefore, the data points in Figure 10 and Figure 11 are located mostly within the SIC ranges of 0–1 and 9–10 tenths where they massively overlap.

3.1. Difference between Csmr and Cso

For the summer season, total SIC calculated (in tenths) by all three algorithms is overestimated in areas covered with very open ice (1–3 tenths): NT by 1.0–1.4, ASI by 0.1–0.6, and VASIA2 can either underestimate by 0.4 or overestimate by 0.4 tenths. For close (7–8 tenths), very close and compact (9–10 and 10 tenths) ice, passive microwave sensing, on the contrary, underestimates total SIC: NT by 1.8–2.0, ASI by 1.0–1.4, and VASIA2 by 0.5–2.2 tenths on average.
For the winter season, the difference between Csmr by NT and Cso decreases and NT overestimates the SIC by 0.6–1.3 for very open ice (1–3 tenths) and underestimates it by 1.2–1.8 tenths for close (7–8 tenths), very close and compact (9–10 and 10 tenths) ice. In contrast, the difference between Csmr by ASI and Cso increases: SIC is overestimated by 1.1–2.6 for very open ice and underestimated by 1.6–3.1 tenths for close ice (7–8 tenths), very close and compact (9–10 and 10 tenths) ice. For very open ice, VASIA2 underperforms the other algorithms as it overestimates the SIC by 3.0–3.5 on average. For close (7–8 tenths), very close and compact (9–10 and 10 tenths) ice, on the contrary, VASIA2 performs the best, underestimating the SIC by only 0.3–0.6 tenths.
By all the algorithms, there is no obvious SIC overestimation/underestimation for open ice (4–6 tenths), neither for summer nor winter. Open ice is most often found in the marginal ice zones, which are considered the most problematic areas for determining SIC from microwave satellite data [13,17]. In this case, the algorithms can both underestimate and overestimate SIC. The relatively small errors shown in Figure 7, Figure 8 and Figure 9 actually result from approximately the same amount of high positive and high negative errors compensating each other. This is illustrated in Figure 10. It should be noted that observations conducted under the SIC conditions of 0–1 and 9–10 tenths prevailed, so these ranges prevail in the total amount of compared pixels.
The zones of very close and compact (9–10, 10 tenths) ice are of particular notice. Here, Csmr calculated by ASI and VASIA2 show good consistency with Cso for both summer and winter seasons. These algorithms underestimate SIC by 1.0 (ASI) and 0.5 (VASIA2) in summer, 1.5 (ASI) and 0.5 tenths (VASIA2) in winter. NT underestimates SIC by 1.9 in summer and 1.3 tenths in winter.
Table 2 presents the coefficients of determination and the standard deviations between the ship and satellite data in summer and winter periods. For ASI and VASIA2, the coefficients of determination in summer are higher than in winter, the standard deviation for ASI is higher in winter than in summer and for VASIA2 it remains the same. For NT, the statistics are almost the same in summer and winter. So, Csmr calculated by ASI and VASIA2 better corresponds to the ship data in summer compared to winter, while NT does not show any particular difference between SIC summer and winter estimates.

3.2. Difference between Csmr and Cso-ni

When subtracting the concentration of new ice and nilas from total SIC determined visually from ship in summer, the average error increases from −0.4 to 0 tenths for NT, while for ASI and VASIA2, it changes from negative to positive, that is, from −0.3 to +0.1 and from −0.3 to +0.1 tenths, respectively (Table 2).
Similar analysis of the winter data gives average errors from −0.4 to +1.1 for NT, from −0.8 to +1.0 for ASI and from +0.2 to +1.4 tenths for VASIA2. In contrast to the summer period, deletion of new ice and nilas from winter Cso increases the average error.
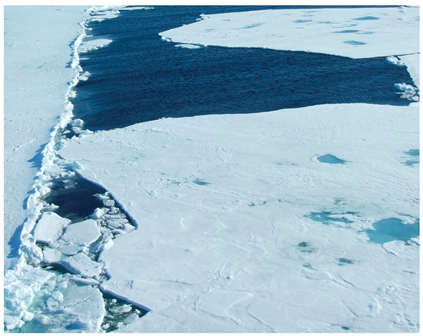
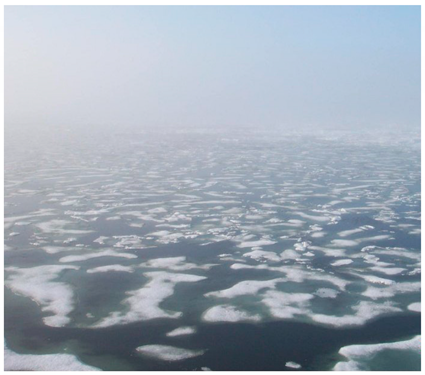
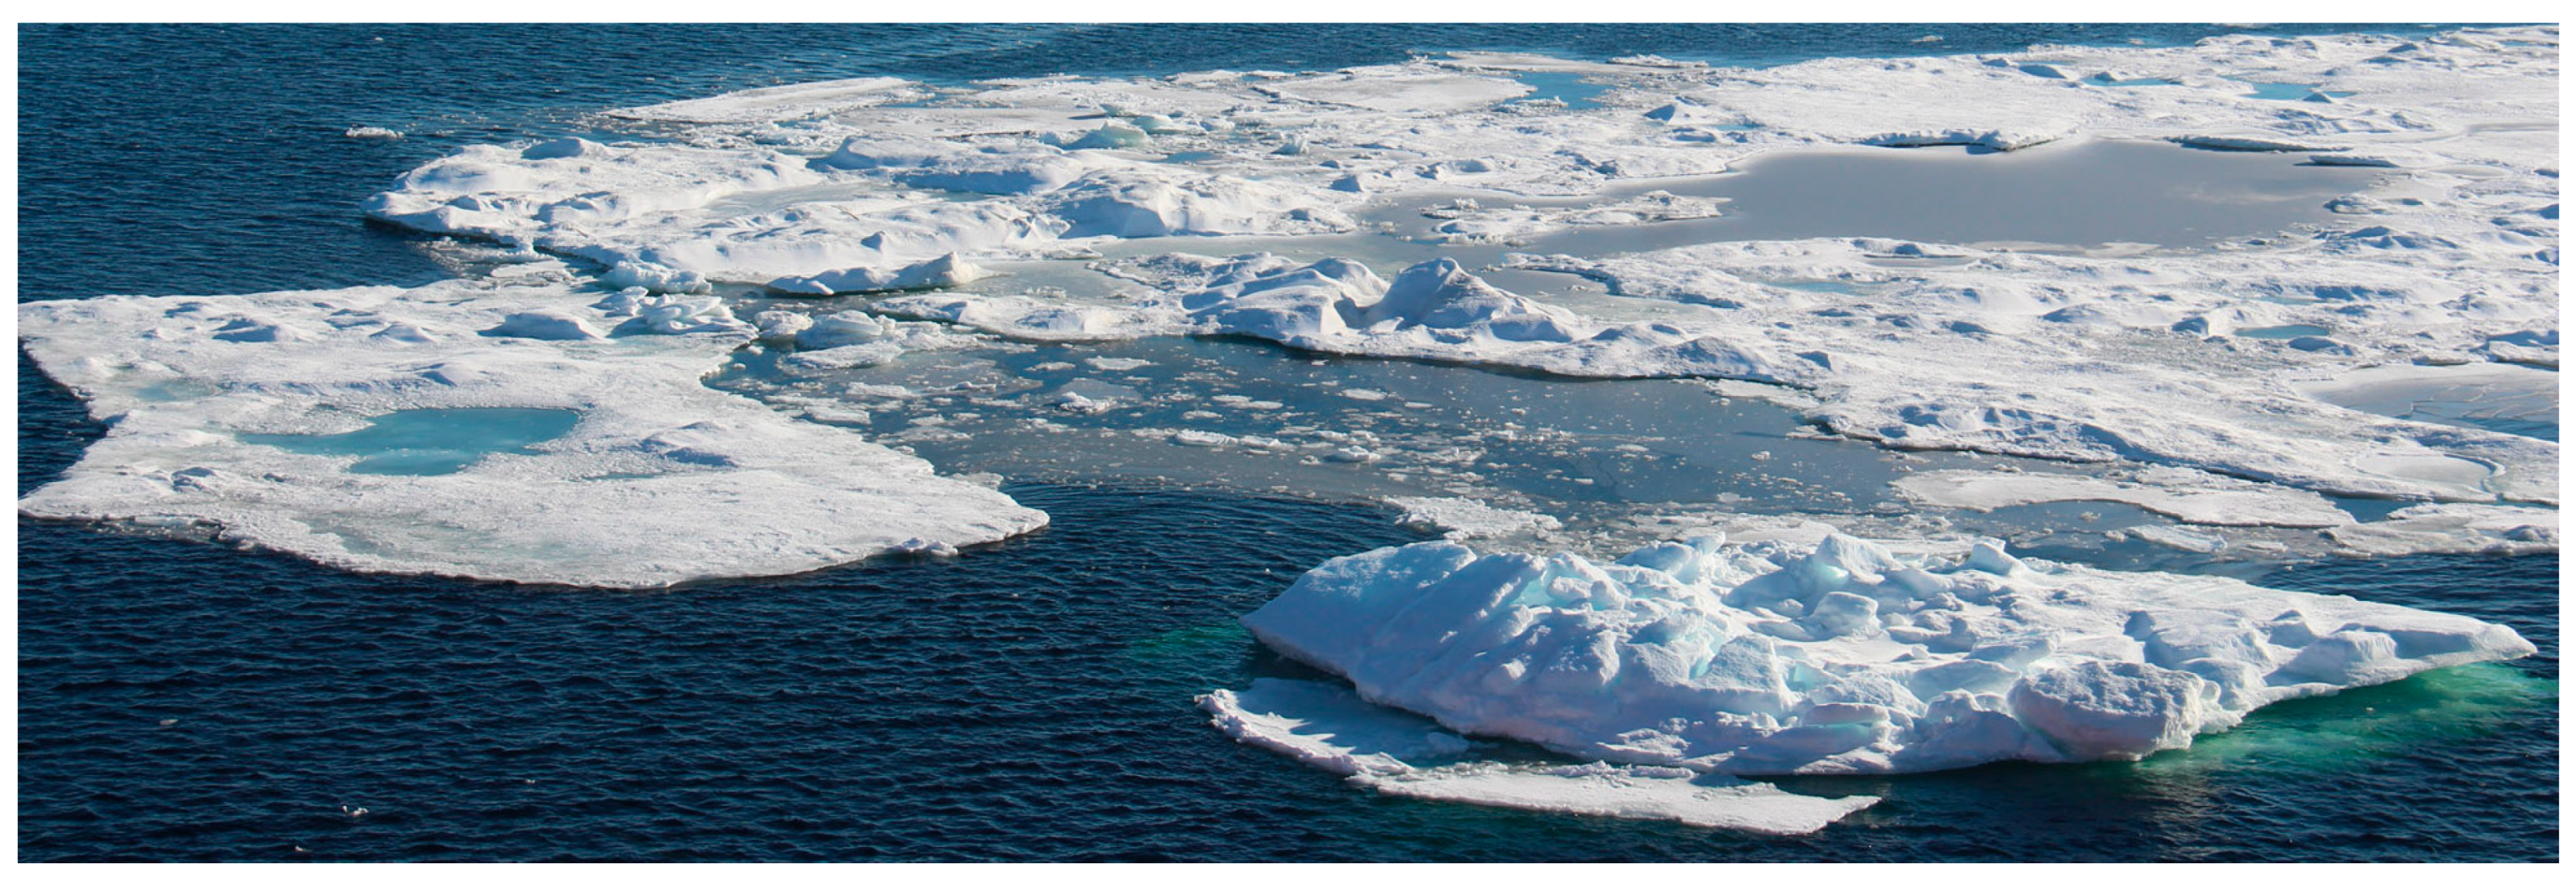
New ice and nilas were observed during the expeditions usually carried out in August to the beginning of September. Although this period in the Arctic is generally characterized by ice melt, irregular ice formation also occurs being often interrupted by short-term air temperature increases and changes in the state of ocean water surface [59]. The photo in Figure 12 taken in the Laptev Sea at the end of August illustrates ice formation during ice melt. There are melt ponds on the ice surface, however the surface of the melt ponds is frozen and new ice is being formed between the ice floes.
When ice begins to form, its temperature is basically the same as that of the surrounding water. For newly formed ice, the measured radiation emanates not just from the ice but also from the water underneath [30]. Ivanova et al. 2015 [17] and Heygster et al. [60] noted that some algorithms are sensitive to thin sea ice and some algorithms can underestimate the SIC for ice thickness less than 30–35 cm. The influence is stronger for algorithms involving lower frequency channels. Among 29 algorithms considered by Heygster et al. [60], ASI is shown to be the least sensitive, and NT the most sensitive one.
Comparisons of summer Csmr–Cso and Csmr–Cso-ni in Figure 7, Figure 8 and Figure 9 show that the average errors for very open and open ice remain the same. It is explained by absence of new ice and nilas in open and very open ice in summer observations (percentage of new ice and nilas in Cso is given by green numbers in Figure 7, Figure 8 and Figure 9). For close, very close and compact ice, when new ice and nilas reach 10–14% in Cso in summer, the difference between the satellite and the ship data decreases. The difference between Cso (blue columns) and Cso-ni (green columns) for close, very close and compact ice in the NT histograms is 0.5–1.1 tenths, ASI 0.8–1.1 tenths, VASIA2 0.7–0.9 tenths (for compact ice, VASIA2 flips to overestimating the SIC, in contrast to NT and ASI). This is also well illustrated in the scatterplots (Figure 11). Comparing Figure 10 and Figure 11, one can see how the position of the trend line changes when new ice and nilas are removed from Cso: the right end of the line rises to higher Csmr values. Also, the number of points in the lower right corner is reduced, which reflects underestimation of Cso by all three algorithms for close ice. This pattern is explained by the fact that at the end of summer–beginning of autumn, the formation of new ice and nilas among old ice within ice massifs cannot be fully captured by passive microwave sensing.
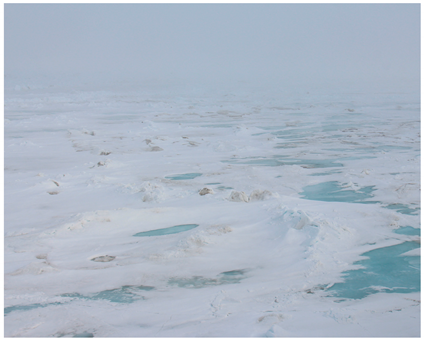
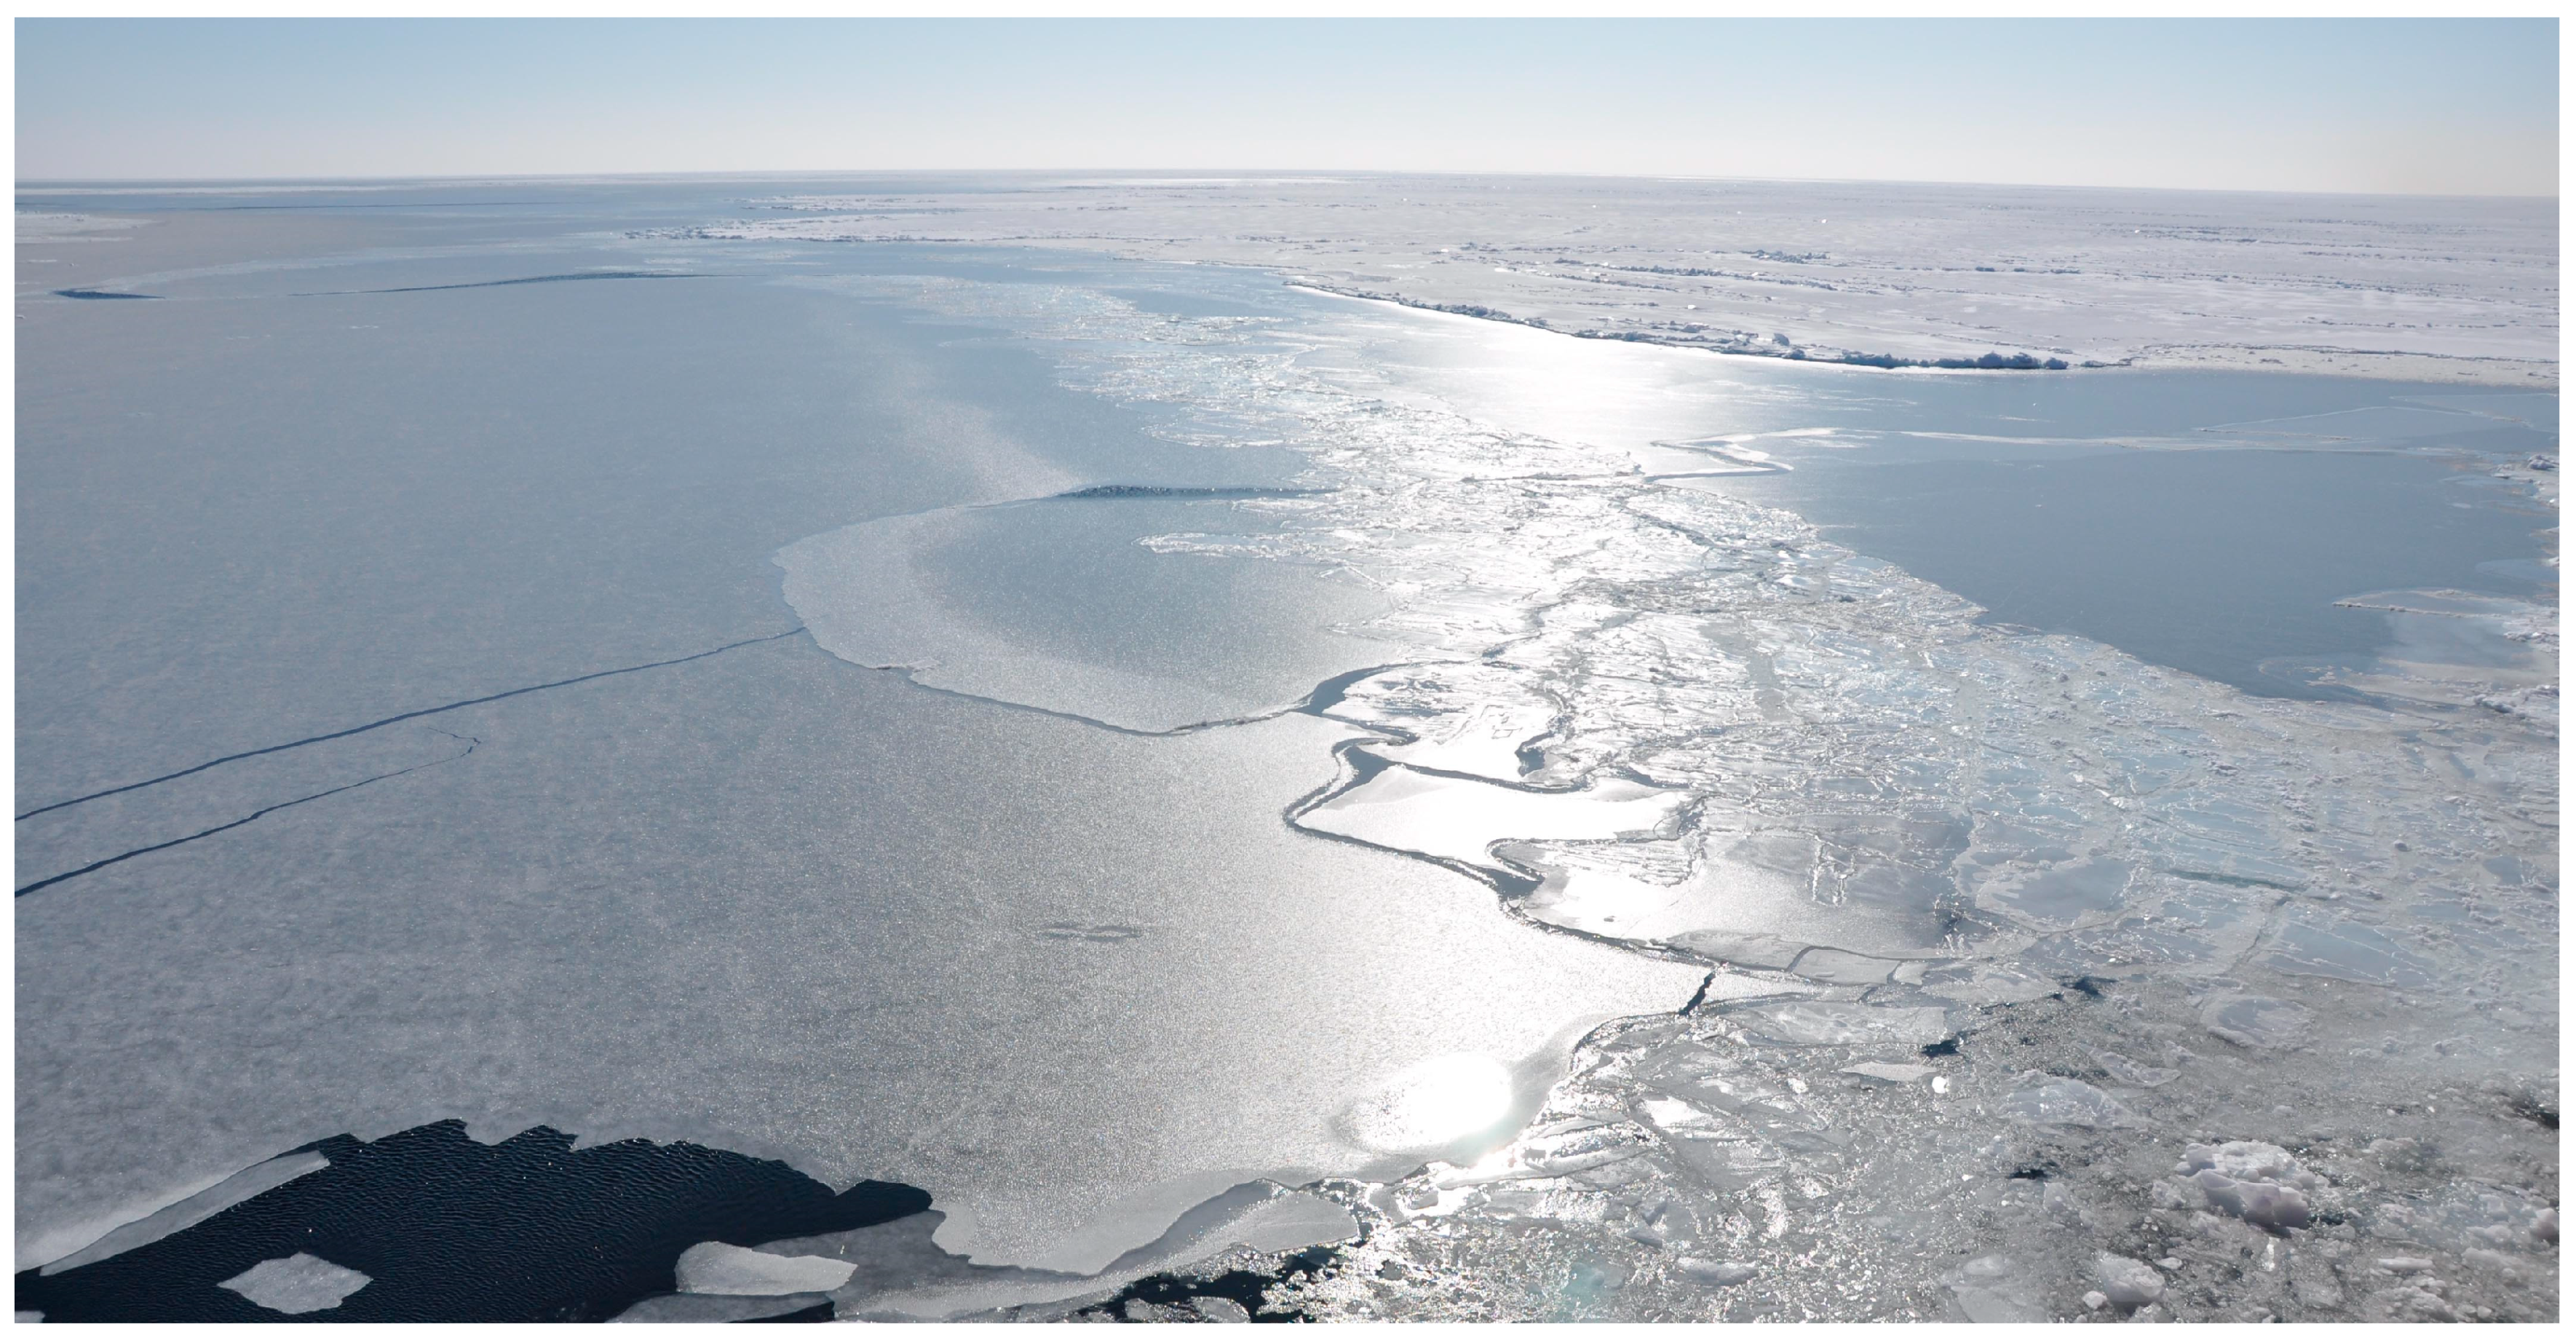
However, for the winter and spring months subtraction of new ice and nilas from total SIC, when their formation occurs everywhere, leads to a significant increase in the average error. Figure 13 illustrates a typical picture of initial ice and nilas formation in winter. Due to low air temperature and overcooled water, the initial ice quickly grows in thickness and covers almost the entire free surface of the sea, in contrast to weak and sporadic ice formation in summer. Accordingly, such initial ice and nilas, included in the total SIC observed during winter expeditions, are better detected by means of microwave radiometry.

3.3. Stages of Ice Melt

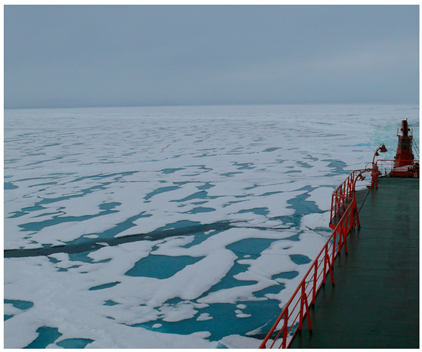
Among the important parameters to be closely monitored during dedicated ship observations, is the stage of ice cover melt. This parameter is not so much quantitative as a qualitative one. To determine it, a five-point scale is used to indicate the area occupied by melt ponds on the ice surface and all the associated ice melt processes. The melt scale description and examples are given in Appendix A. It should be noted that the technique of visual observations from ships was developed for specific purposes, and in particular, for shipping. The external signs of changes in ice cover during melting, being part of a qualitative description of this process, were used, for example, to register the time when ice breccias collapse and it becomes easier for ships to pass through ice floes. Thus, the melt stages described in Appendix A and determined during the expeditions listed in Table 1 reflect all processes that occur during summer melt, not just the quantitative parameter such as the area of melt ponds on the ice surface. Since it is very difficult to compare melt stage, a qualitative parameter, and SIC, a quantitative parameter, the results that follow are given mostly in an attempt to reveal the effect of melt stage as one of the key factors influencing SIC retrieval from microwave radiometry data.
From the entire array of ship observations, ice zones featuring melt processes were selected. Part of the data was not used, as in the journal of ice observations there was a “no data” note referring to melt stage. In total, to analyze the effect of melt stage, 269 pixels for NT and 891 pixels for ASI and VASIA2 were used. For each melt stage, average errors of the difference Csmr–C so were calculated (Table 3) in order to evaluate the effect of this parameter on SIC retrieval.
Average errors at different melt stages were calculated separately for the whole SIC range and only for compact (9.5–10 tenths) ice in ice massifs in order to exclude errors for open ice due to the surrounding open water, smaller size of ice floes, etc. Panels in Figure 14, Figure 15 and Figure 16 were also compiled separately for the whole SIC range and very close ice in ice massifs.
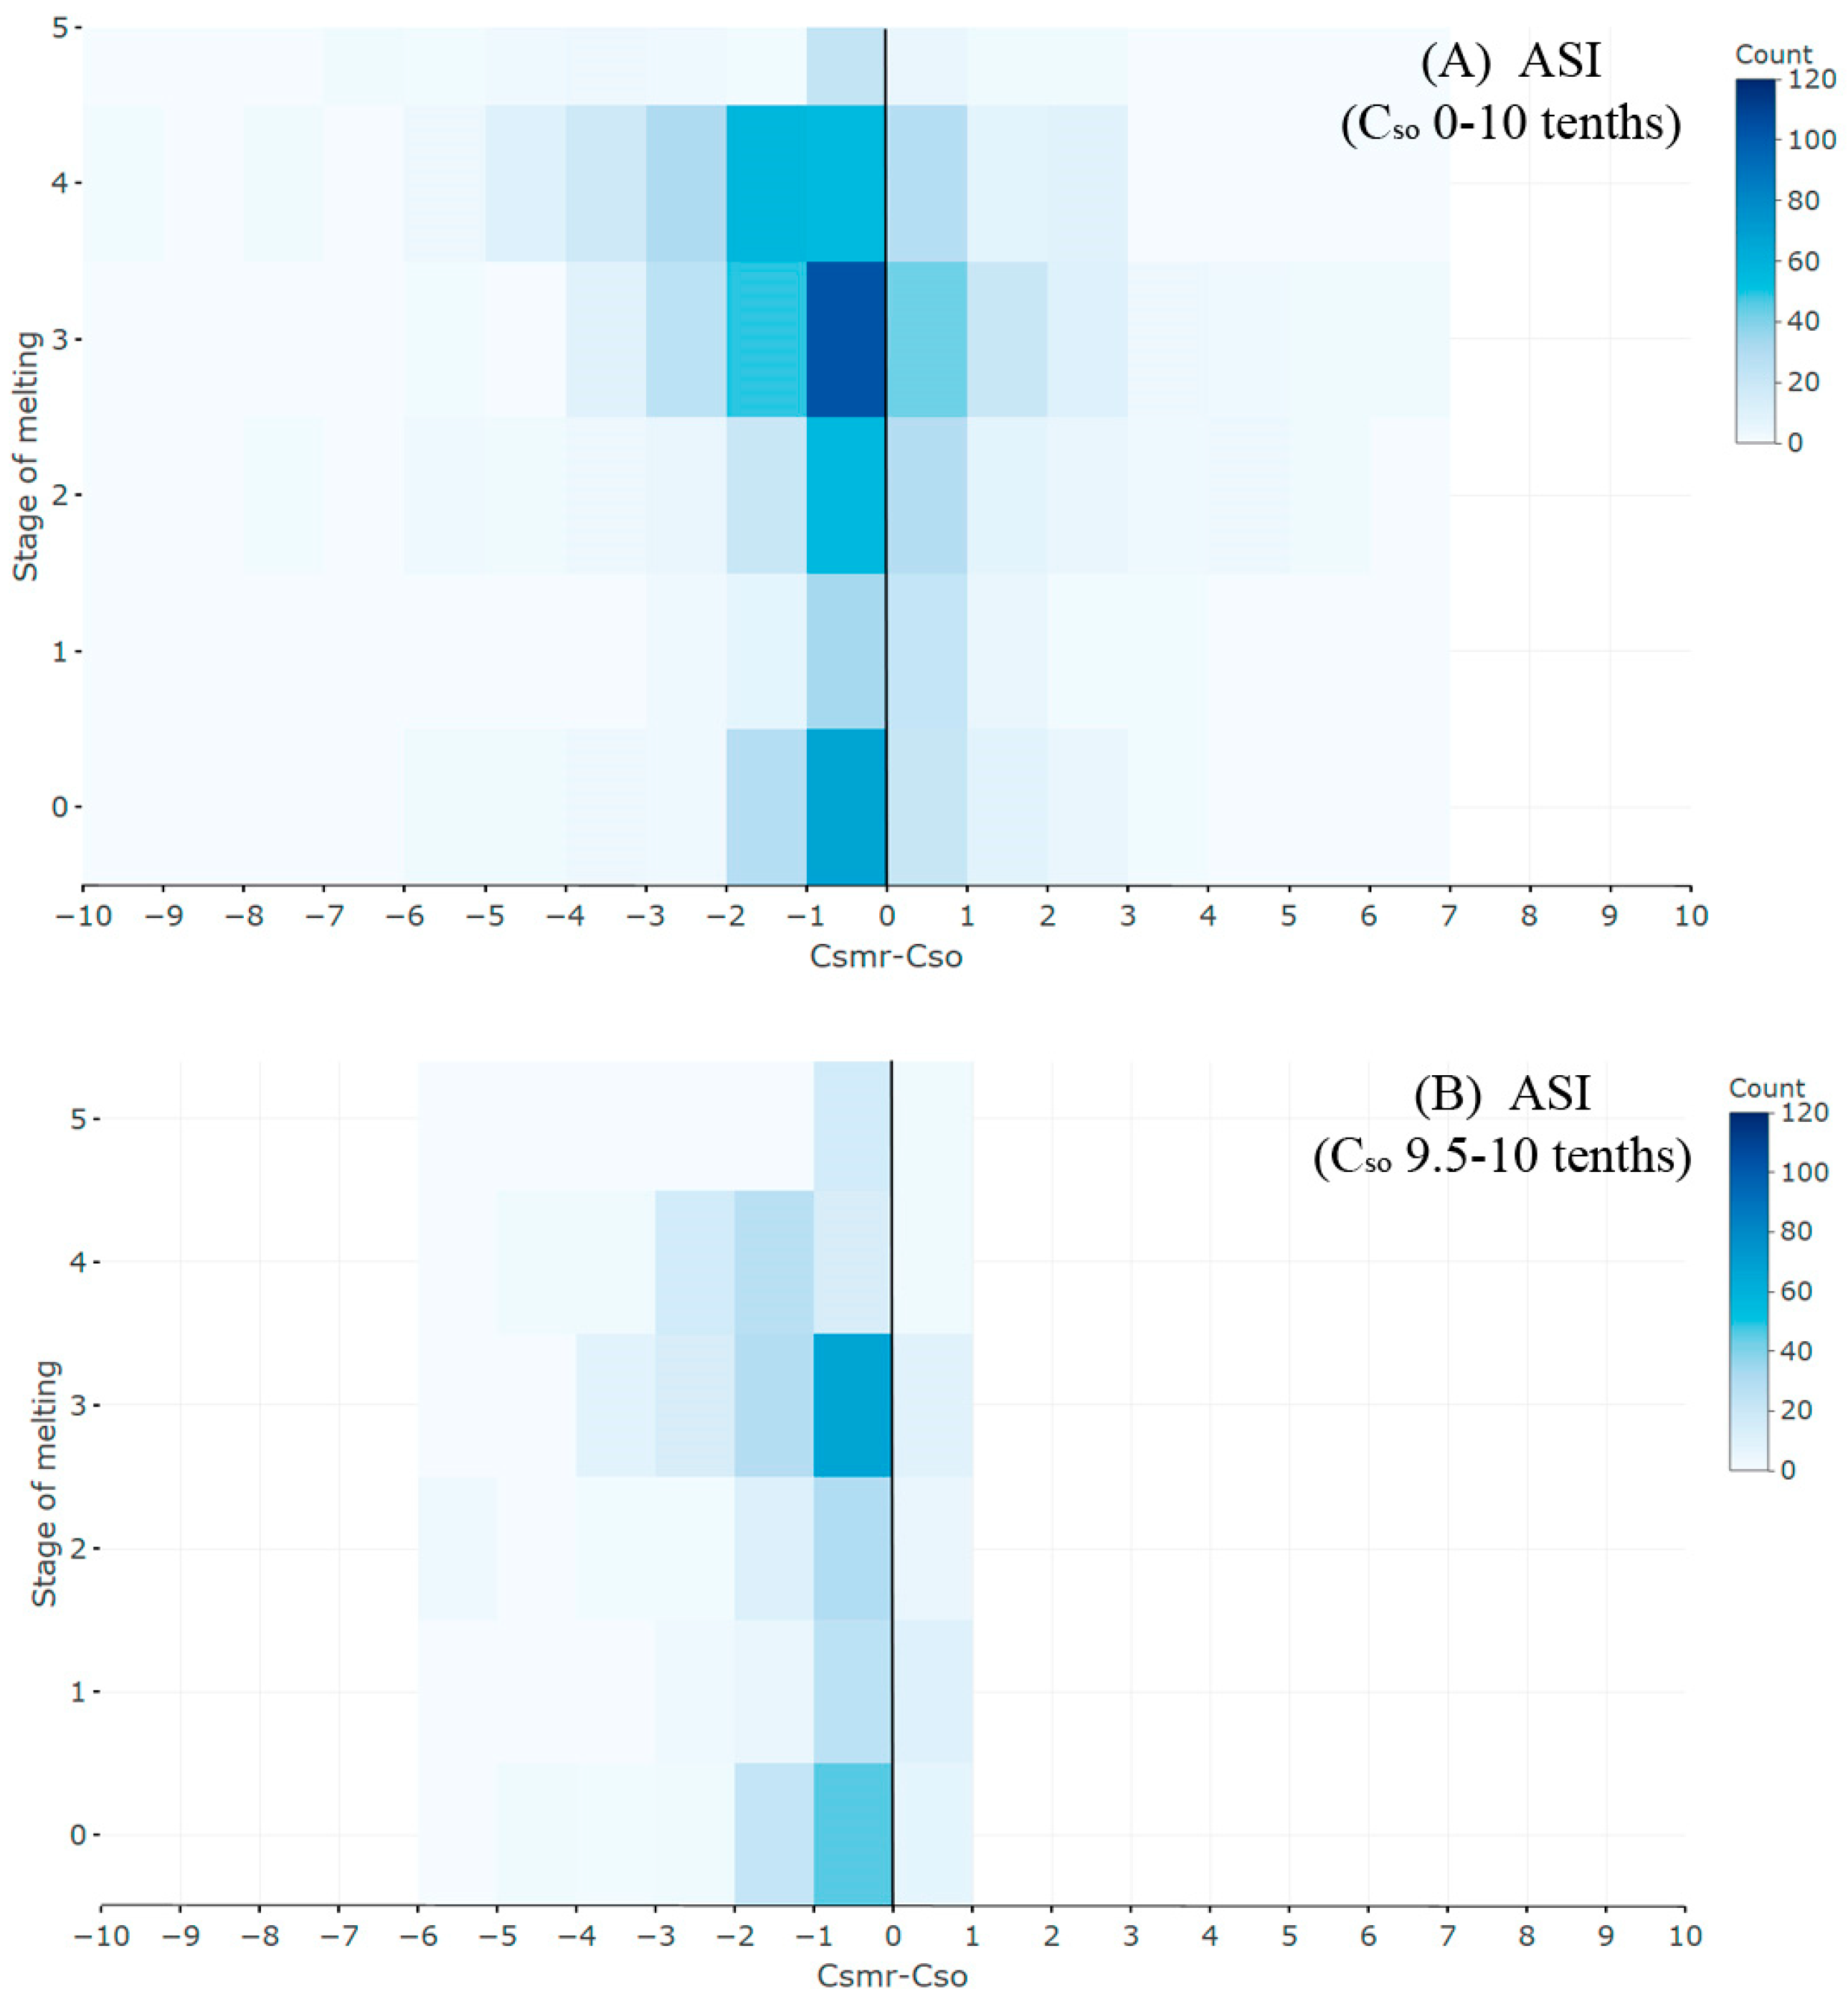
Figure 14, Figure 15 and Figure 16 show the dependence of Csmr–Cso on ice melt stage. The intensity of the color indicates the frequency of Csmr–Cso values (count) falling in different intervals of the melt stage. The color distribution (darker left sides of the plots) reflects the predominantly negative average errors (negative Csmr–Cso) of the three considered algorithms (see Table 3).
On average, NT underestimates the SIC by 0.4 tenths, as compared with ship observations (Table 2). For the cases when melt stage is determined during ship observations, the average error is higher: NT underestimates the SIC by 1.0–1.8 tenths (Table 3). This is explained by the fact that, as melt develops, the snow becomes saturated with water and the number of melt ponds on ice increases. The area of ice under the melt ponds is “mistaken” by microwave radiometers for open water, and, consequently, the SIC is underestimated [36,37,61,62].
ASI underestimates SIC by 0.3 tenth on average (Table 2). With ice melt advance from 1 to 3 points, SIC underestimation grows from 0.1 to 0.5 and reaches 2.1 tenths at a melt stage of 4 points.
VASIA2 underestimates total SIC by 0.3 tenth on average in summer (Table 2). However, at the initial 1-point melt stage, VASIA2 overestimates SIC by 0.4 tenths. Then, at 2-point melt stage, VASIA2 again underestimates it by 0.2 tenths. After that, the underestimation keeps increasing and reaches the maximum of 1.4 tenths at a melt stage of 4 points, similarly to ASI (Table 3).
Although the average error of SIC estimates is negative for all three algorithms (Table 3), high Csmr–Cso counts appear on the right of the charts in Figure 14A, Figure 15A, and Figure 16A, meaning that in some cases microwave radiometry data overestimate the SIC even at high melt stages. When calculating the average error separately for compact ice, the spread of the difference Csmr–Cso reduces (Figure 14B, Figure 15B, Figure 16B). In comparison to NT and ASI, only VASIA2 on average overestimates the SIC at the initial melt stage of 1 point, and also presents higher counts with positive differences (on the right of the charts) for compact ice. Since melt processes are not the only natural factor affecting the SIC determination from passive microwave sensing data, a more detailed analysis of average errors requires consideration of other ice and meteorological parameters.

4. Discussion and Conclusions

In the present work, the results of SIC estimation by three algorithms based on passive microwave sensing data, that are NT, ASI, and the new algorithm VASIA2, are for the first time compared with the data of six summer and eight winter Arctic expeditions. In the expeditions, dedicated ship observations of ice conditions were conducted according to the technique developed at AARI, which is detailed in Appendix A.
Several studies have already been conducted to compare some algorithms with data from ship observations performed by other techniques (ASPeCt, IceWatch/ASSIST). In each study, the absolute average errors and other statistical parameters differ depending on algorithm, satellite sensor, ship observation technique, expedition period, and route.
For example, in [21] the data of RV Polarstern observations, conducted in March–April 2003 and July–August 2004, are compared with the ASI (6.25 km grid), NASA Team 2 (12.5 km grid), and Bootstrap (12.5 km grid) results obtained on the basis of AMSR-E data. The following mean differences between the ship and calculated SIC are obtained: in March–April, −3% for ASI, −1% for NASA Team 2, and −4% for Bootstrap; in July–August, +12% for ASI, +11% for NASA Team 2, and +10% for Bootstrap. While for the winter–spring period the results of [21] and the present study are similar: Passive microwave sensing algorithms (except VASIA2) underestimate the SIC against the ship observations, the results for the summer expeditions vary considerably. In this study, all three algorithms underestimate total SIC in summer, whereas [21] reports overestimation, despite the melt period when the presence of melt ponds on ice should lead to underestimation of the SIC [13]. However, the difference in the ASPeCt protocol used in [21] and AARI method of observations needs be considered: By separating the area of observations to “navigation area” and “area of ship track”, the AARI data exclude the leads that are selected for ship movement. Therefore, the SIC observed in the navigation area is usually higher that of the ship track area.
In [20], the SICs determined using NT (25 km grid) and Bootstrap (25 km grid) from SSM/I are compared with observations obtained (according to the ASPeCt protocol) during three expeditions in the Ross Sea in the Antarctic. The results are completely in line with the distribution of NT average errors obtained in the present work: The algorithm overestimates SIC for very open ice, shows large errors (both positive and negative) for open ice, and underestimates it in close, very close, and compact ice. In earlier works, for example [63,64], a comparative analysis of SIC retrieved from SMMR (NT) and Landsat data was performed. The results are comparable with the results of this work and also show that SSMR (NT) data tend to overestimate total SIC of open ice and underestimate total SIC of close ice.
Our study shows that subtracting the concentration of new ice and nilas from total SIC determined from ship observations decreases the average error in the summer season. This implies that the algorithms poorly determine new ice and nilas formed among old ice in the period of irregular ice formation at the end of summer–beginning of autumn. In winter, remote sensing techniques define new ice and nilas better than in summer, therefore, subtracting the new ice and nilas from the total SIC estimate does not lead to an average error decrease.
One of the important parameters monitored during AARI dedicated ship observations is ice melt stage. It was used to assess the impact of melt processes on the average error in SIC retrieval against the data of visual ship observations. The AARI ice melt observation technique described in this paper gives qualitative rather than quantitative estimates. In the presence of melt processes, comparison of passive microwave radiometry data with ship observation data results in higher average errors: The algorithms, on average, lead to worse underestimation of SIC.
This paper presents a comparative overview of two SIC data sources. The analysis shows that the new algorithm VASIA2 has some advantages and disadvantages in comparison to NT and ASI and can be further improved. The results obtained in this work will be used for this purpose. To obtain a detailed picture of how ice surface characteristics affect the results of different algorithms, a comprehensive analysis using more field data on ice physics is required.
Thus, due to the large database of dedicated AARI ship observations conducted in the summer and winter seasons, we were able to highlight the general mechanisms behind the retrieval of SIC from satellite microwave radiometry data. One should be extremely cautious in using these data for operational purposes (navigation) and do so only in the absence of other satellite data with higher spatial resolution (visible, infrared, and radar images). For solving large scale scientific problems, satellite microwave radiometry data are indeed an important source of information on ice cover, since they represent the longest series of observations—about 40 years. In this case, it is necessary to use the obtained average errors for correction. This is particularly relevant to studying climate change based on the analysis of the amount and extent of sea ice. The identified errors in SIC retrieval can significantly affect the assessment of ice cover degradation observed in recent years in the Arctic Ocean.

Author Contributions

Conceptualization—T.A., V.T., S.F., E.S.; Data processing—T.A., M.R., V.T., J.S.; Supervision—I.R., E.S.; writing—original draft—T.A., V.T.; writing—review and editing—I.R., E.S., S.S., E.A.

Funding

The present study was supported by the Ministry of Science and Higher Education of the Russian Federation, project QUARCCS (agreement #14.616.21.0078 (RFMEFI61617X0078)).

Acknowledgments

We thank three anonymous reviewers for their helpful, constructive and very detailed reviews. We are grateful to Christian Haas (Alfred Wegener Institute) and Stefan Kern (University of Hamburg) for help on NT and ASI data acquisition and processing. The authors thank Dmitry Ermakov (Institute of Radioengineering and Electronics, Russian Academy of Sciences) for the information on the POLE-RT-Fields database and Tatiana Bocharova (Space Research Institute, Russian Academy of Sciences) for translating the manuscript into English. In this work, we used microwave radiometry data available at https://nsidc.org (NT algorithm), http://seaice.uni-bremen.de (ASI algorithm), http://www.iki.rssi.ru/asp/ (VASIA2 algorithm). Sea ice ship data were taken from the AARI archives. The results presented in this paper will be available soon at the website of the Center of Oceanographic Data http://data.oceaninfo.ru/.

Conflicts of Interest

The authors declare no conflict of interest.

Appendix A

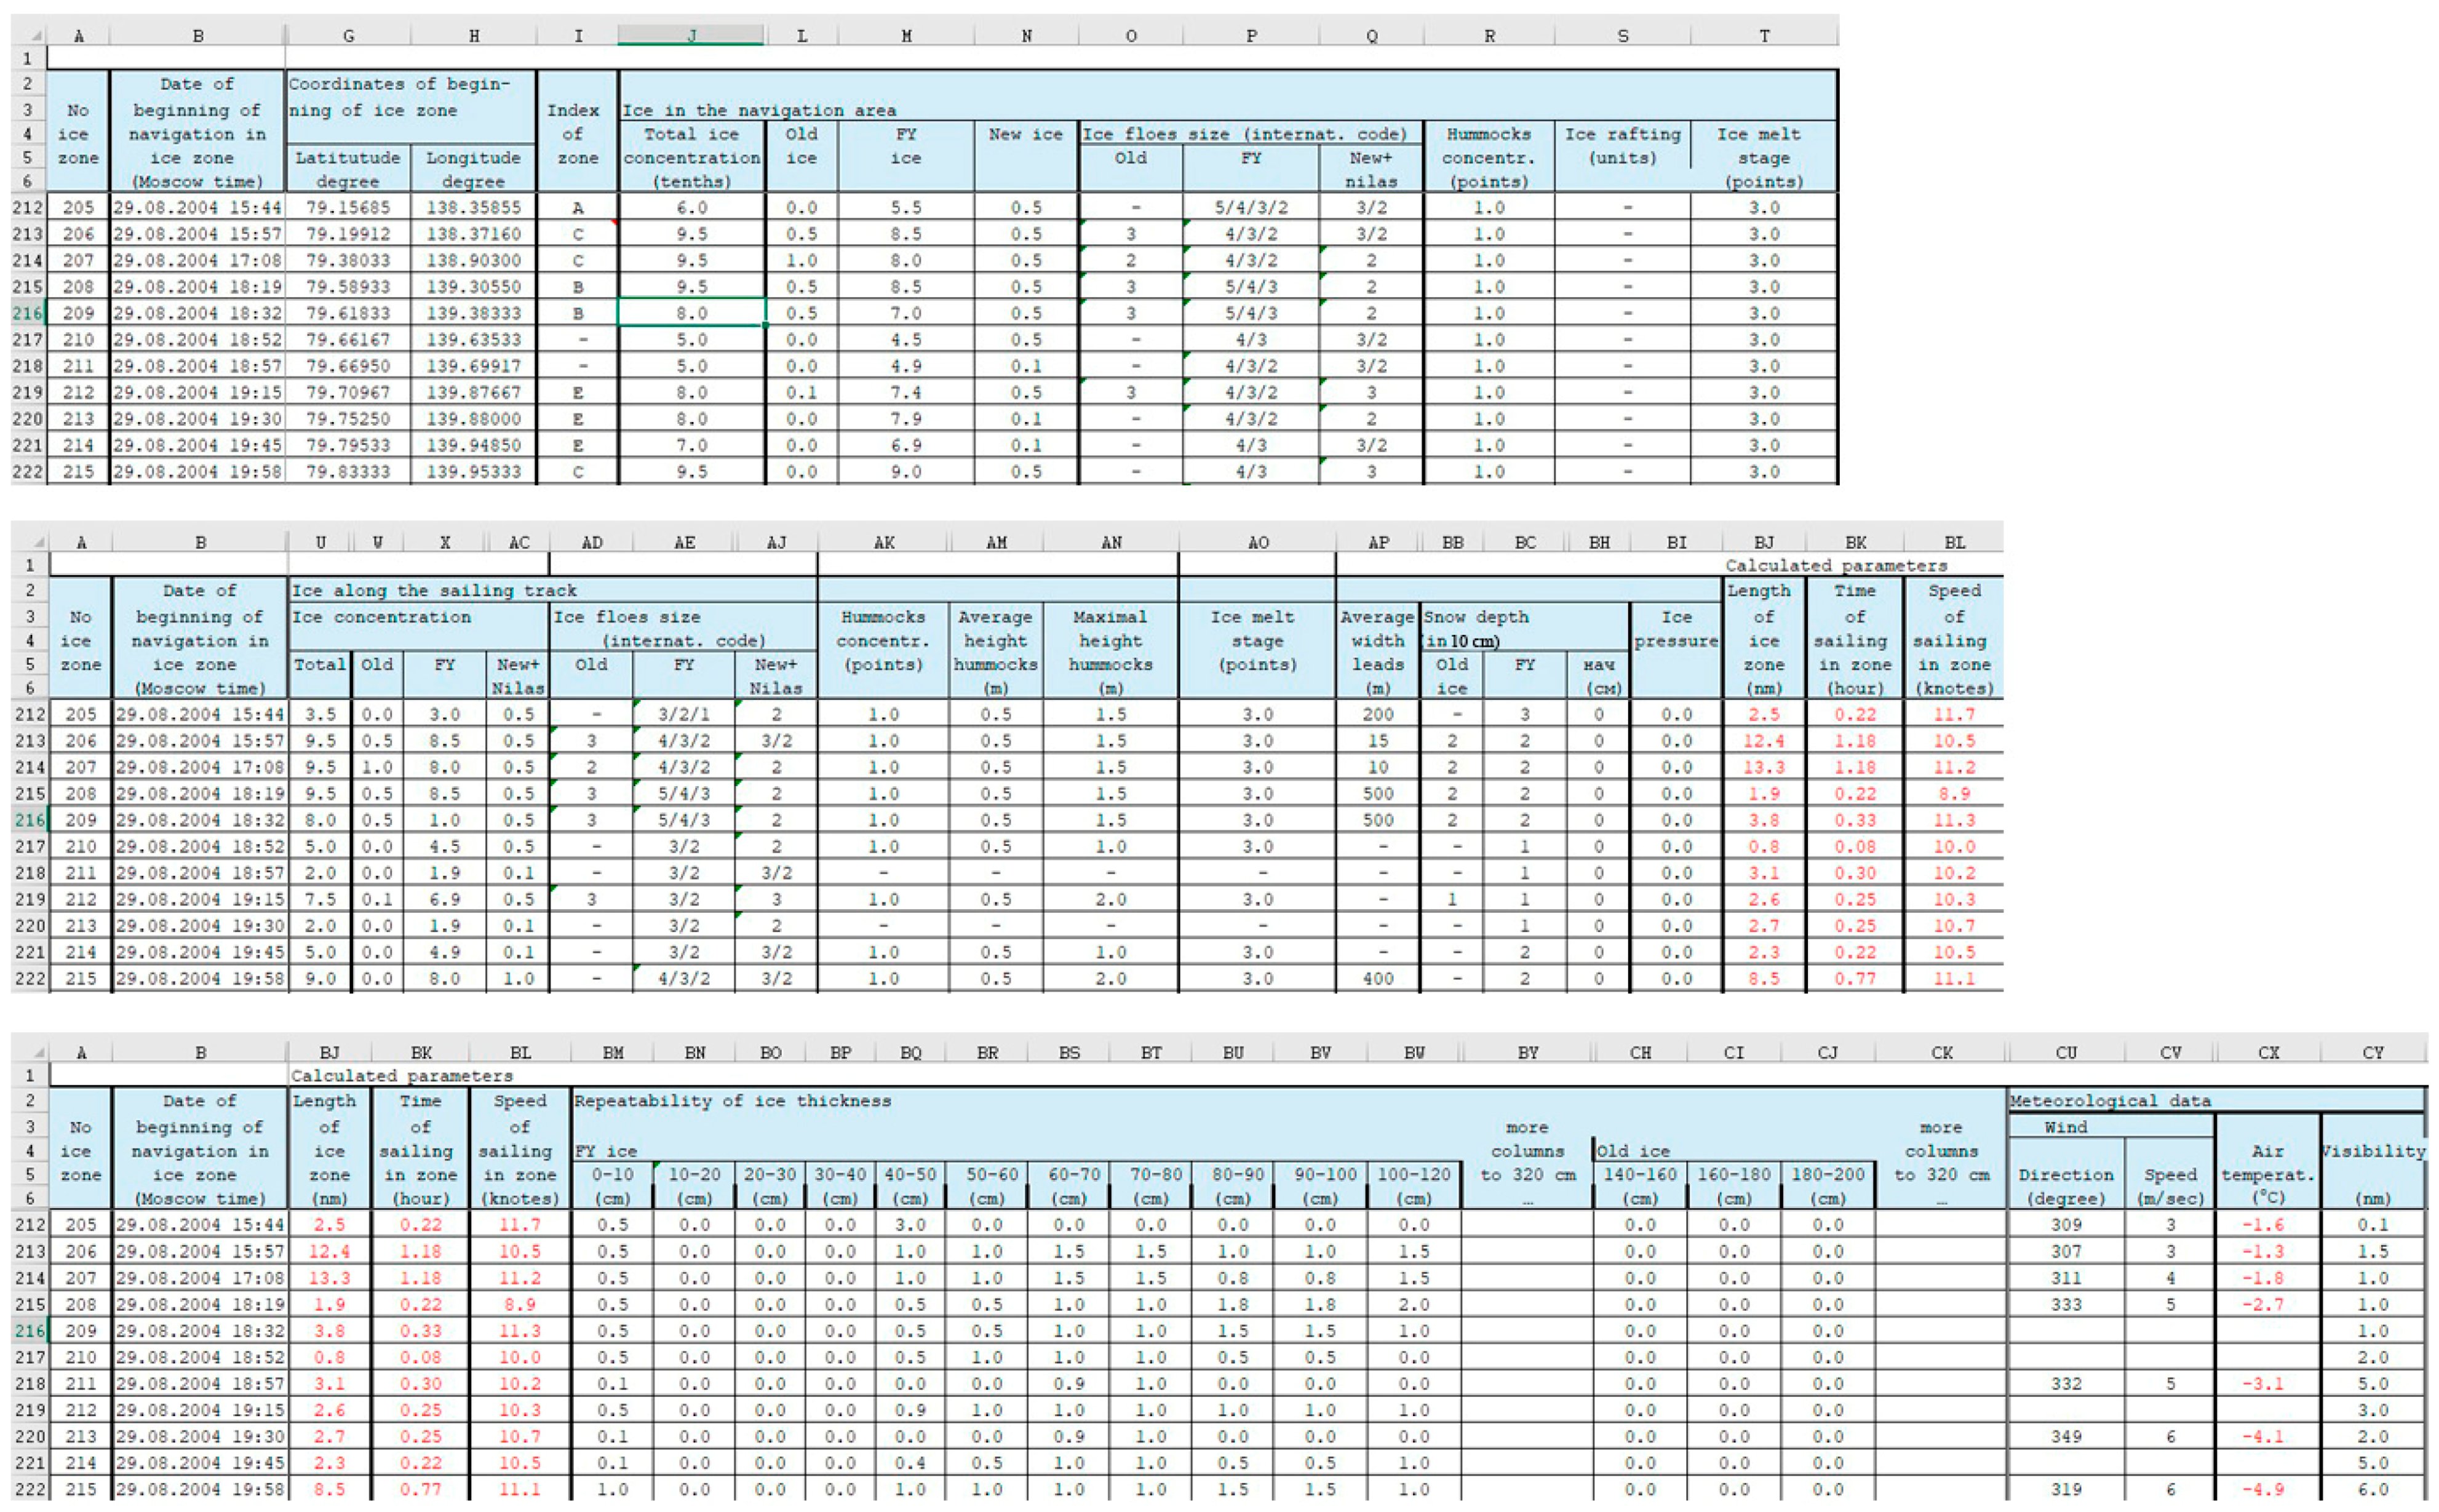
Extracts from Guidance to special shipborne ice observations (published in Russian) [58] related to ship observations used in this work.

Basics of Ship Ice Observations

Homogeneous ice zone is the area whose characteristics vary within the range of ±0.5 tenths for sea ice concentration, ±5–10 cm for ice thickness, and ±0.5 for ice surface parameters (ice ridging, melting stage, intensity of compression).
Spatial discretization of shipboard observations is determined by the length of homogeneous ice zones; temporal discretization depends on the ship speed.
Special ship observations are performed nonstop (24 hours daily) during the whole time of the cruise.
All observations are recorded in the journal of ice observations (paper copy or electronic). Ship observations include geographic positions of the beginning and the end of a homogeneous ice zone, ice characteristics within this zone, and information on the vessel operating indexes while passing this zone (example of a journal is shown in Figure A1).
Figure A1. Example (excerpt) of an ice journal compiled during visual ship observations (here from a 2004 cruise of RV Akademik Fedorov).
Remotesensing 11 02481 g0a1

Collecting Information on Sea Ice Parameters

Sea ice parameters are recorded separately for the whole navigation area (throughout the whole visible area) and along the ship track (within the area limited by 2–3-time ship width).
Standard set of ice parameters related to the navigation area:
-
total SIC;
-
partial SIC of each ice type presented in the area;
-
size of ice formations of each ice type;
-
ice ridging over the whole area;
-
melt stage;
-
leads and cracks and their orientation relative to the ship course.
These observations are not performed during poor visibility conditions (less than 0.1 nautical miles). If visibility is less than 0.1 nautical miles, then “no data” is assigned to the zone. In column “remarks”, the reason is noted (snow, fog, rain, night etc.)
Standard set of ice parameters related to the ship track:
-
total SIC;
-
partial SIC of each ice type presented in the area;
-
size of ice formations of each ice type;
-
thickness of each ice type;
-
snow depth on surface of each ice type;
-
ice ridging;
-
young ice rafting;
-
melt stage;
-
occurrence and intensity of ice compression;
-
icebergs concentration, their shape and size.

Estimating Total SIC

Total SIC is measured in tenths and denotes ice-covered area (1 tenth = 10%) portion of the whole visible area. In ambiguous cases, ice-free area may be estimated first, and the inverse value will indicate ice-covered area.
Instead of exact values (1, 2, 3, and so on), it is allowed to record the range between neighboring values (0–1, 1–2, 2–3, and so on). In this case the SIC is recorded as a fraction (0.5, 1.5, 2.5, and so on).

Estimating Partial SICs

Ice cover is usually composed of more than one ice type.
Ice types are determined by their thickness:
-
new ice (frazil ice, ice grease, slush, shuga);
-
nilas: pancake ice, dark nilas (3–5 cm) and light nilas (5–10 cm);
-
young ice: grey ice (10–15 cm) and grey-white ice (15–30 cm);
-
thin first-year ice: first stage (30–50 cm) and second stage (50–70 cm);
-
medium first-year ice (70–120 cm);
-
thick first-year ice (120 ~ 200 cm);
-
old ice: second-year and multi-year ice, old ice thickness varies depending on the region and season and may reach over 200 cm.
Partial SICs are measured in tenths, and the sum of them all must equal the total SIC. Along with ice thickness, such indicators as ice freeboard, snow depth, and distribution of snow cover, ice tone, ice forms, ridging, and so on, may aid ice type definition.

Definition of Melt Stage

During melt season, ice observations include records of ice melt stage. It is determined by visual appearance of melt ponds, presence of snow cover, occurrence and visual appearance of thaw holes, size of ice objects, ice draught, presence of underwater rams and so on.
The highest melt stage is 5 (see Table A1). Melt stage is estimated for each ice type individually.
Table A1. Stages of first-year sea ice melt.
StageVisible Sea Ice Melt CharacteristicsExamples (Photos by T.A. Alekseeva Taken during the Arctic Expeditions)
0No melt Remotesensing 11 02481 i001
1Few melt ponds and dark patches are detected on the sea surface. Ice breccias begin to disintegrate. Remotesensing 11 02481 i002
2Ice surface is darkened, snow is partly melted, many large melt ponds are visible. Remotesensing 11 02481 i003
3Ponds are everywhere. Snow is melted completely. Thaw holes appear. Ice gets dried and whitens (photo shows melt stage 3, but ice is covered by fresh recent snow). Remotesensing 11 02481 i004
4Heavily decayed ice. Thaw holes and water separations are everywhere, ice breccias have completely disintegrated. Mushroom ice with underwater rams appears among ice floes. Remotesensing 11 02481 i005
5Strongly ablated deformed ice pieces sitting deep in water predominate. Ice is heavily flooded and has grayish color. Remotesensing 11 02481 i006
Instead of exact values (0, 1, 2, 3, and so on), it is allowed to record the range between neighboring values (0–1, 1–2, 2–3, and so on). In this case melting stage is recorded as a fraction (0.5, 1.5, 3.5, and so on).

Appendix B

POLE-RT-Fields contains portions of brightness temperature fields measured by SSM/I and SSMIS over the north and south polar caps, between the latitudes of 60 and 85 degrees. The data are presented in the SWATH format (on the initial measurement grid) and the GRID format (averaged to a regular grid of 0.5° by 0.5° cells). These are measurements from 1987 to the present at frequencies of 19.35, 37.00, and 85.5 GHz (91.655 GHz for SSMIS) of vertical and horizontal polarization and 22.24 GHz of vertical polarization. POLE-RT-Fields search output is dynamically generated upon user query and contains a chronological series of observations in a sequence of files in accordance with the following selection criteria:
-
data source (one of the DMSP instruments: F8, F10, F11, Fl2, F13, F14, F15, …);
-
data channel (from one to seven SSM/I or SSMIS channels);
-
interval of observation (year, month and date of start and end of the measurement);
-
zone of observations (global coverage or a rectangle with specified boundary latitudes and longitudes);
-
scale of spatial averaging (a regular grid step in degrees and fractions of degree with independently set latitude and longitude);
-
scale of time averaging in days (used for accumulating and averaging the data of successive satellite surveys of the selected area of the Earth).
The output information can be presented in PCK and RAW file formats.
Data in the PCK files contain matrices of averaged brightness temperature values in the nodes of a regular grid (according to the query parameters) in the format of double precision floating point numbers (8 bytes per number). The actual accuracy is determined by the maximum precision of the source data (hundredths of a degree). The grid nodes are lined in the order of descending western longitude and/or increasing eastern longitude (direction from west to east) at fixed latitude. The lines follow in the order of descending north and/or ascending south latitude (direction from north to south). Each *.pck file contains data for one interval of time averaging that are filtered, averaged, and combined according to the other selection criteria. Each file is supplemented by one index *.ndx file containing the number of separate measurements of brightness temperature used to calculate the average value in each grid cell. The PCK data format is optimal for further calculations.
The data in the RAW format are arranged similarly to PCK. The difference is that the computed brightness temperatures are multiplied by the scaling factor, rounded to the nearest integer, and presented in integer format (1-–2 bytes per number). These data are optimal for direct visualization of average thermal fields (can be displayed by popular software such as Adobe Photoshop). They are convenient for quick analysis of the selected information, but do not contain absolute temperature values and are therefore not suitable for further calculations.

References

  1. Przybylak, R. The Climate of the Arctic; Springer: Dordrecht, The Netherlands, 2003; p. 271. [Google Scholar]
  2. Vavrus, S.; Harrison, S.P. The impact of sea-ice dynamics on the Arctic climate system. Clim. Dyn. 2003, 20, 741–757. [Google Scholar] [CrossRef]
  3. Frolov, I.E.; Gudkovich, Z.M.; Karklin, V.P.; Kovalev, E.G.; Smolyanitsky, M.V. Climate Change in Eurasian Arctic Shelf Seas—Centennial Ice Cover Observations; Springer: Berlin, Germany, 2009; p. 166. [Google Scholar]
  4. Smith, L.C.; Stephenson, S.R. New Trans-Arctic shipping routes navigable by midcentury. Proc. Natl. Acad. Sci. USA 2013, 110, 4871. [Google Scholar] [CrossRef] [PubMed]
  5. Laliberté, F.; Howell, S.E.L.; Kushner, P.J. Regional variability of a projected sea ice-free Arctic during the summer months. Geophys. Res. Lett. 2016, 43, 256–263. [Google Scholar] [CrossRef]
  6. Tedesco, M. Remote Sensing of the Cryosphere, 1st ed.; John Wiley & Sons: Hoboken, NJ, USA, 2015. [Google Scholar]
  7. Tikhonov, V.V.; Raev, M.D.; Sharkov, E.A.; Boyarskii, D.A.; Repina, I.A.; Komarova, N.Y. Satellite microwave radiometry of sea ice of polar regions: A review. Izv. Atmos. Ocean. Phys. 2016, 52, 1012–1030. [Google Scholar] [CrossRef]
  8. Alekseeva, T.A.; Frolov, S.V. Comparative analysis of satellite and shipborne data on ice cover in the Russian Arctic seas. Izv. Atmos. Ocean. Phys. 2013, 49, 879–885. [Google Scholar] [CrossRef]
  9. Meier, W. Comparison of passive microwave ice concentration algorithm retrievals with AVHRR imagery, in Arctic peripheral seas. IEEE Trans. Geosci. Remote Sens. 2005, 43, 1324–1337. [Google Scholar] [CrossRef]
  10. Wiebe, H.; Heygster, G.; Markus, T. Comparison of the ASI Ice Concentration Algorithm with Landsat-7 ETM+ and SAR Imagery. IEEE Trans. Geosci. Remote Sens. 2009, 47, 3008–3015. [Google Scholar] [CrossRef]
  11. Pang, X.; Pu, J.; Zhao, X.; Ji, Q.; Qu, M.; Cheng, Z. Comparison between AMSR2 Sea Ice Concentration Products and Pseudo-Ship Observations of the Arctic and Antarctic Sea Ice Edge on Cloud-Free Days. Remote Sens. 2018, 10, 317. [Google Scholar] [CrossRef]
  12. Agnew, T.A.; Howell, S. Comparison of digitized Canadian ice charts and passive microwave sea-ice concentrations. In Proceedings of the IEEE International Geoscience and Remote Sensing Symposium, Toronto, ON, Canada, 24–28 June 2002; Volume 231, pp. 231–233. [Google Scholar]
  13. Agnew, T.; Howell, S. The use of operational ice charts for evaluating passive microwave ice concentration data. Atmos. Ocean 2003, 41, 317–331. [Google Scholar] [CrossRef]
  14. Tonboe, R.T.; Eastwood, S.; Lavergne, T.; Sørensen, A.M.; Rathmann, N.; Dybkjær, G.; Pedersen, L.T.; Høyer, J.L.; Kern, S. The EUMETSAT sea ice concentration climate data record. Cryosphere 2016, 10, 2275–2290. [Google Scholar] [CrossRef] [Green Version]
  15. Andersen, S.; Tonboe, R.; Kern, S.; Schyberg, H. Improved retrieval of sea ice total concentration from spaceborne passive microwave observations using numerical weather prediction model fields: An intercomparison of nine algorithms. Remote Sens. Environ. 2006, 104, 374–392. [Google Scholar] [CrossRef]
  16. Ivanova, N.; Johannessen, O.; Pedersen, L.; Tonboe, R. Retrieval of Arctic Sea Ice Parameters by Satellite Passive Microwave Sensors: A Comparison of Eleven Sea Ice Concentration Algorithms. IEEE Trans. Geosci. Remote Sens. 2014, 52, 7233–7246. [Google Scholar] [CrossRef]
  17. Ivanova, N.; Pedersen, L.T.; Tonboe, R.T.; Kern, S.; Heygster, G.; Lavergne, T.; Sørensen, A.; Saldo, R.; Dybkjær, G.; Brucker, L.; et al. Inter-comparison and evaluation of sea ice algorithms: Towards further identification of challenges and optimal approach using passive microwave observations. Cryosphere 2015, 9, 1797–1817. [Google Scholar] [CrossRef]
  18. Zabolotskikh, E.V. Review of Methods to Retrieve Sea-Ice Parameters from Satellite Microwave Radiometer Data. Izv. Atmos. Ocean Phys. 2019, 55, 110–128. [Google Scholar] [CrossRef]
  19. Comiso, J.C.; Ackley, S.F.; Gordon, A.L. Antarctic sea ice microwave signatures and their correlation with in situ ice observations. J. Geophys. Res. Oceans 1984, 89, 662–672. [Google Scholar] [CrossRef]
  20. Knuth, M.A.; Ackley, S.F. Summer and early-fall Sea-ice concentration in the Ross Sea: Comparison of in Situ ASPeCt observations and satellite passive microwave estimates. Ann. Glaciol. 2006, 44, 303–309. [Google Scholar] [CrossRef]
  21. Spreen, G.; Kaleschke, L.; Heygster, G. Sea ice remote sensing using AMSR-E 89-GHz channels. J. Geophys. Res. Oceans 2008, 113. [Google Scholar] [CrossRef] [Green Version]
  22. Beitsch, A.; Kern, S.; Kaleschke, L. Comparison of SSM/I and AMSR-E Sea Ice Concentrations with ASPeCt Ship Observations Around Antarctica. IEEE Trans. Geosci. Remote Sens. 2015, 53, 1985–1996. [Google Scholar] [CrossRef]
  23. Ozsoy-Cicek, B.; Ackley, S.F.; Worby, A.; Xie, H.; Lieser, J. Antarctic sea-ice extents and concentrations: Comparison of satellite and ship measurements from International Polar Year cruises. Ann. Glaciol. 2011, 52, 318–326. [Google Scholar] [CrossRef]
  24. Worby, A.P.; Allison, I. A Technique for Making Ship-Based Observations of Antarctic Sea-Ice Thicknes and Characteristics—Part I: Observational Techniques and Results; Antarctic Cooperative Research Center, University of Tasmania: Hobart, Australia, 1999; p. 63. [Google Scholar]
  25. Tikhonov, V.V.; Boyarskii, D.A.; Repina, I.A.; Raev, M.D.; Sharkov, E.A.; Alexeeva, T.A. Snow Cover Effect on Brightness Temperature of Arctic Ice Fields Based on SSM/I Data. In Proceedings of the Progress in Electromagnetics Research Symposium, PIERS Proceedings, Stockholm, Sweden, 12–15 August 2013; pp. 514–518. [Google Scholar]
  26. Tikhonov, V.V.; Boyarskii, D.A.; Sharkov, E.A.; Raev, M.D.; Repina, I.A.; Ivanov, V.V.; Alexeeva, T.A.; Komarova, N.Y. Microwave Model of Radiation from the Multilayer “Ocean-Atmosphere” System for Remote Sensing Studies of the Polar Regions. Prog. Electromagn. Res. B 2014, 59, 123–133. [Google Scholar] [CrossRef]
  27. Cavalieri, D.J.; Gloersen, P.; Wilheit, T.T. Aircraft and Satellite Passive Microwave Observations of the Bering Sea Ice Cover During MIZEX West. IEEE Trans. Geosci. Remote Sens. 1986, 3, 368–377. [Google Scholar] [CrossRef]
  28. Windnagel, A. Climate Algorithm Theoretical Basis Document (C-ATBD). Sea Ice Concentration. Climate Data Record (CDR) Program; CDR Program Document Number CDRP-ATBD-0107; National Oceanic and Atmospheric Administration (NOAA): Silver Spring, MD, USA, 2018. [Google Scholar]
  29. Cavalieri, D.J.; Germain, K.M.; Swift, C.T. Reduction of weather effects in the calculation of sea-ice concentration with the DMSP SSM/I. J. Glaciol. 1995, 41, 455–464. [Google Scholar] [CrossRef] [Green Version]
  30. Comiso, J.C. Sea ice effective microwave emissivities from satellite passive microwave and infrared observations. J. Geophys. Res. Oceans 1983, 88, 7686–7704. [Google Scholar] [CrossRef]
  31. Kaleschke, L.; Lupkes, C.; Vihma, T.; Haarpaintner, J.; Bochert, A.; Hartmann, J.; Heygster, G. SSM/I Sea Ice Remote Sensing for Mesoscale Ocean-Atmosphere Interaction Analysis. Can. J. Remote Sens. 2001, 27, 526–537. [Google Scholar] [CrossRef]
  32. Svendsen, E.; Matzler, C.; Grenfell, T.C. A model for retrieving total sea ice concentration from a spaceborne dual-polarized passive microwave instrument operating near 90 GHz. Int. J. Remote Sens. 1987, 8, 1479–1487. [Google Scholar] [CrossRef]
  33. Kaleschke, L. Fernerkundung des Meereises mit Passiven und Aktiven Mikrowellensensoren. Ph.D. Thesis, Universität Bremen, Bremen, Germany, 2003. [Google Scholar]
  34. Pease, C.H. The size of wind-driven coastal polynyas. J. Geophys. Res. Oceans 1987, 92, 7049–7059. [Google Scholar] [CrossRef]
  35. Comiso, J.C. SSM/I ice concentrations using the Bootstrap algorithm; NASA Reference Publication 1380; NASA Goddard Space Flight Center: Greenbelt, MD, USA, 1995. [Google Scholar]
  36. Tikhonov, V.V.; Repina, I.A.; Raev, M.D.; Sharkov, E.A.; Boyarskii, D.A.; Komarova, N.Y. Integrative algorithm of determining ice conditions in Polar Regions by data of satellite microwave radiometry (VASIA2). Izv. Atmos. Ocean Phys. 2015, 51, 914–928. [Google Scholar] [CrossRef]
  37. Tikhonov, V.V.; Repina, I.A.; Raev, M.D.; Sharkov, E.A.; Ivanov, V.V.; Boyarskii, D.A.; Alexeeva, T.A.; Komarova, N.Y. A physical algorithm to measure sea ice concentration from passive microwave remote sensing data. Adv. Space Res. 2015, 56, 1578–1589. [Google Scholar] [CrossRef]
  38. Gray, D.M.; Male, D.H. Handbook of Snow: Principles, Processes, Management & Use; Pergamon Press: Oxford, UK, 1981; p. 776. [Google Scholar]
  39. Serreze, M.C.; Barry, R.G. The Arctic Climate System; Cambridge University Press: Cambridge, UK, 2005. [Google Scholar]
  40. Turner, J.; Bindschadler, R.A.; Convey, P.; Di Prisco, G.; Fahrbach, E.; Gutt, J.; Hodgson, D.A.; Mayewski, P.A.; Summerhayes, C.P. Antarctic Climate Change and the Environment; The International Council for Science: Paris, France, 2009; p. 526. [Google Scholar]
  41. Cuffey, K.M.; Paterson, W.S.B. The Physics of Glaciers, 4th ed.; Elsevier: Amsterdam, The Netherlands, 2010; p. 704. [Google Scholar]
  42. Barry, R.; Gan, T.Y. The Global Cryosphere: Past, Present and Future; Cambridge University Press: Cambridge, UK, 2011. [Google Scholar]
  43. Singh, V.P.; Singh, P.; Haritashya, U.K. The Encyclopedia of Snow, Ice and Glaciers; Springer: Berlin, Germany, 2011; p. 1254. [Google Scholar]
  44. Kuz’min, P.P. The Physical Properties of Snow Cover; Nauka: Moscow, Russia, 1957; p. 180. (In Russian) [Google Scholar]
  45. Kotlyakov, V.M. Izbrannye Sochineniya. Kniga 1. Glyatsiologiya Antarktidy; Nauka: Moscow, Russia, 2000; p. 432. [Google Scholar]
  46. Tschudi, M.A.; Maslanik, J.A.; Perovich, D.K. Derivation of melt pond coverage on Arctic sea ice using MODIS observations. Remote Sens. Environ. 2008, 112, 2605–2614. [Google Scholar] [CrossRef]
  47. Polashenski, C.; Perovich, D.; Courville, Z. The mechanisms of sea ice melt pond formation and evolution. J. Geophys. Res. Oceans 2012, 117. [Google Scholar] [CrossRef]
  48. Rösel, A.; Kaleschke, L. Exceptional melt pond occurrence in the years 2007 and 2011 on the Arctic sea ice revealed from MODIS satellite data. J. Geophys. Res. Oceans 2012, 117. [Google Scholar] [CrossRef]
  49. Rösel, A.; Kaleschke, L.; Birnbaum, G. Melt ponds on Arctic sea ice determined from MODIS satellite data using an artificial neural network. Cryosphere 2012, 6, 431–446. [Google Scholar] [CrossRef] [Green Version]
  50. Istomina, L.; Heygster, G.; Huntemann, M.; Schwarz, P.; Birnbaum, G.; Scharien, R.; Polashenski, C.; Perovich, D.; Zege, E.; Malinka, A.; et al. Melt pond fraction and spectral sea ice albedo retrieval from MERIS data—Part 1: Validation against in situ, aerial, and ship cruise data. Cryosphere 2015, 9, 1551–1566. [Google Scholar] [CrossRef]
  51. Istomina, L.; Heygster, G.; Huntemann, M.; Marks, H.; Melsheimer, C.; Zege, E.; Malinka, A.; Prikhach, A.; Katsev, I. Melt pond fraction and spectral sea ice albedo retrieval from MERIS data—Part 2: Case studies and trends of sea ice albedo and melt ponds in the Arctic for years 2002–2011. Cryosphere 2015, 9, 1567–1578. [Google Scholar] [CrossRef]
  52. Morassutti, M.P.; Ledrew, E.F. Albedo and depth of melt ponds on sea-ice. Int. J. Climatol. 1996, 16, 817–838. [Google Scholar] [CrossRef]
  53. Perovich, D.K.; Grenfell, T.C.; Richter-Menge, J.A.; Light, B.; Tucker, W.B., III; Eicken, H. Thin and thinner: Sea ice mass balance measurements during SHEBA. J. Geophys. Res. Oceans 2003, 108. [Google Scholar] [CrossRef]
  54. Tucker, W.B., III; Gow, A.J.; Meese, D.A.; Bosworth, H.W.; Reimnitz, E. Physical characteristics of summer sea ice across the Arctic Ocean. J. Geophys. Res. Oceans 1999, 104, 1489–1504. [Google Scholar] [CrossRef]
  55. Cavalieri, D.J.; Parkinson, C.L.; Gloersen, P.; Zwally, H.; Meier, W.; Fetterer, F.; Knowles, K.; Savoie, M.; Brodzik, M. Sea Ice Concentrations from Nimbus-7 SMMR and DMSP SSM/I-SSMIS Passive Microwave Data, Version 1. Available online: https://nsidc.org/data/nsidc-0051 (accessed on 15 February 2007).
  56. Ezraty, R.; Girard-Ardhuin, F.; Piolle, J.-F.; Kaleschke, L.; Heygster, G. Arctic and Antarctic Sea Ice Concentration and Arctic Drift Estimates from Special Sensor Microwave Data—User’s Manual; Version 2.1; IFREMER: Brest, France, 2007. [Google Scholar]
  57. Ermakov, D.M.; Raev, M.D.; Suslov, A.I.; Sharkov, E.A. Electronic long-standing database for the global radiothermal field of the Earth in context of multi-scale investigation of the atmosphere-ocean system. Issled. Zemli Kosm. 2007, 1, 7–13. (In Russian) [Google Scholar]
  58. AARI. Guidance to Special Shipborne Ice Observations; AARI: Saint-Petersburg, Russia, 2011; 42p. [Google Scholar]
  59. Shokr, M.; Sinha, N. Sea Ice: Physics and Remote Sensing; John Wiley & Sons: Hoboken, NJ, USA; American Geophysical Union: Washington, DC, USA, 2015. [Google Scholar]
  60. Heygster, G.; Huntemann, M.; Ivanova, N.; Saldo, R.; Pedersen, L.T. Response of passive microwave sea ice concentration algorithms to thin ice. In Proceedings of the 2014 IEEE Geoscience and Remote Sensing Symposium, Quebec City, QC, Canada, 13–18 July 2014; pp. 3618–3621. [Google Scholar]
  61. Kern, S.; Rösel, A.; Pedersen, L.T.; Ivanova, N.; Saldo, R.; Tonboe, R.T. The impact of melt ponds on summertime microwave brightness temperatures and sea-ice concentrations. Cryosphere 2016, 10, 2217–2239. [Google Scholar] [CrossRef] [Green Version]
  62. Comiso, J.C.; Kwok, R. Surface and radiative characteristics of the summer Arctic sea ice cover from multisensor satellite observations. J. Geophys. Res. Oceans 1996, 101, 28397–28416. [Google Scholar] [CrossRef]
  63. Steffen, K.; Maslanik, J.A. Comparison of Nimbus 7 scanning multichannel microwave radiometer radiance and derived sea ice concentrations with Landsat imagery for the north water area of Baffin Bay. J. Geophys. Res. Oceans 1988, 93, 10769–10781. [Google Scholar] [CrossRef]
  64. Steffen, K.; Schweiger, A. NASA team algorithm for sea ice concentration retrieval from Defense Meteorological Satellite Program special sensor microwave imager: Comparison with Landsat satellite imagery. J. Geophys. Res. Oceans 1991, 96, 21971–21987. [Google Scholar] [CrossRef]
Figure 1. Dependencies of tangents tg(85–19 V) (A), tg(85–37 H) (B), and tg(37–19 V) (C) on sea ice concentration (SIC). Open region (1) between the two straight lines corresponds to ice cover with and without snow on top, shaded triangle (2) to ice cover with snow-water mixture (SWM). Dash-dotted and dashed lines denote the medians of the regions.
Remotesensing 11 02481 g001
Figure 2. Cruise tracks of the research vessels and icebreakers that hosted the dedicated summer (A) and winter (B) ice observations.
Remotesensing 11 02481 g002
Figure 3. Schematic illustration of matching the ship and the satellite microwave SIC data.
Remotesensing 11 02481 g003
Figure 4. Distribution of observed visibility in % of ship track length. Visibility was recalculated from nautical miles (units of observations) to kilometers.
Remotesensing 11 02481 g004
Figure 5. Distribution of ship data coverage area in pixels of 25 km (A) and 12.5 km (B) resolution in summer and winter.
Remotesensing 11 02481 g005
Figure 6. Ice cover in the east of the East Siberian Sea on 26 July 2017: (a) Terra MODIS (or Moderate Resolution Imaging Spectroradiometer), 00:30 UTC (Coordinated Universal Time), RGB (Red, Green, Blue) composite of bands 2-2-1; (b) Arctic and Antarctic Research Institute (AARI) overview SIC chart based on Terra MODIS image (a), (c) SIC derived from NASA Team (NT) algorithm, resolution 25 km (dataset Sea Ice Concentrations from Nimbus-7 Special Sensor Microwave Radiometer (SMMR) and Defence Meteorological Satellite Program (DMSP) Special Sensor Microwave Imager (SSM/I) - Special Sensor Microwave Imager Sounder (SSMIS) Passive Microwave Data, Version 1 (NSIDC-0051)); (d) SIC derived from Arctic Radiation and Turbulence Interaction Study (ARTIST) Sea Ice (ASI) algorithm, resolution 6.25 km (version 5.4.). Both the radiometer-derived SIC charts are shown at the same scale as the AARI one. In (bd), the SIC is in tenths: 0–1 corresponds to 0–9%, 1–3 to 10–30%, 4–6 to 31–60%, 7–8 to 61–80%, and 9–10 to 81–100%.
Remotesensing 11 02481 g006
Figure 7. (A,B) Average error distribution of SIC derived from NT against the ship data in summer and winter seasons. Blue bars denote Csmr–Cso, green bars Csmr–Cso-ni. Pixel number is noted above each SIC range. Green numbers show the percentage of new ice and nilas in Cso for each SIC range.
Remotesensing 11 02481 g007
Figure 8. (A,B) Average error distribution of SIC derived from ASI against the ship data in summer and winter seasons. Blue bars denote CsmrCso, green bars CsmrCso-ni. Pixel number is noted above each SIC range. Green numbers show the percentage of new ice and nilas in Cso for each SIC range.
Remotesensing 11 02481 g008
Figure 9. (A,B) Average error distribution of SIC derived from VASIA2 against the ship data in summer and winter seasons. Blue bars denote Csmr–Cso, green bars Csmr–Cso-ni. Pixel number is noted above each SIC range. Green numbers show the percentage of new ice and nilas in Cso for each SIC range.
Remotesensing 11 02481 g009
Figure 10. (AF) Observed Cso vs SIC derived by NT, ASI, and VASIA2 in summer and winter.
Remotesensing 11 02481 g010
Figure 11. (AF) Observed Cso-ni vs SIC derived by NT, ASI, and VASIA2 in summer and winter seasons.
Remotesensing 11 02481 g011aRemotesensing 11 02481 g011b
Figure 12. Photo of 27 August 2016, taken on board RV Akademik Tryoshnikov in the Laptev Sea at 75.56 N, 126.84 E (by T.A. Alekseeva).
Remotesensing 11 02481 g012
Figure 13. Photo of 20 April 2011, taken on board Kapitan Danilkin cargo vessel in the Kara Sea (east of Cape Gelaniya) by T.A. Alekseeva.
Remotesensing 11 02481 g013
Figure 14. (A,B) The difference between NT (25 km) and ship observations depending on ice melt stage. The horizontal axis denotes the difference Csmr–Cso (tenths), the vertical axis the melt stage (points). Color intensity indicates the Csmr–Cso count for particular melt stage.
Remotesensing 11 02481 g014
Figure 15. (A,B) The difference between ASI (12.5 km) and ship observations depending on ice melt stage. The horizontal axis denotes the difference Csmr–Cso (tenths), the vertical axis the melt stage (points). Color intensity indicates the Csmr–Cso count for particular melt stage.
Remotesensing 11 02481 g015
Figure 16. (A,B) The difference between VASIA2 (12.5 km) and ship observations depending on ice melt stage. The horizontal axis denotes the difference Csmr–Cso (tenths), the vertical axis the melt stage (points). Color intensity indicates the Csmr–Cso count for particular melt stage.
Remotesensing 11 02481 g016
Table 1. Dates and periods of the expeditions that provided the ship data.
Summer (expeditions during the ice melt period in July–mid-September)
Vessel, YearPeriod of observationArea of observation
Mikhail Somov, 199624–27 SeptemberLaptev Sea
Akademik Fedorov, 200014 August–13 SeptemberEast Siberian, Laptev, Kara Seas
Sovetskiy Soyuz, 200325 July–15 SeptemberEast Siberian, Laptev, Kara Seas
Kapitan Dranitsyn, 200330 August–13 SeptemberEast Siberian, Laptev, Kara Seas
Akademik Fedorov, 200425 August–10 SeptemberEast Siberian, Laptev, Kara Seas
Akademik Fedorov, 200519 July–10 SeptemberEast Siberian, Laptev, Kara Seas
Winter (expeditions during freeze up and maximal development of the ice cover)
Vessel, YearPeriod of observationArea of observation
Mikhail Somov, 1996–199717 October–23 JanuaryBarents, Kara, Laptev Seas
Mikhail Somov, 1997–199823 October–18 AprilBarents, Kara, Laptev Seas
Mikhail Somov, 19989 October–25 DecemberBarents, Kara Seas
Kapitan Dranitsyn, 199827 April–13 MayBarents, Kara Seas
Kapitan Dranitsyn, 200013–24 FebruaryBarents, Kara Seas
Mikhail Somov, 20017–27 AprilBarents Sea
Mikhail Somov, 20035 April–20 MayBarents Sea
Mikhail Somov, 200410 April–10 MayBarents Sea
Table 2. Statistics of comparison between microwave satellite and ship data.
Summer
NT (25 km)
Cso/Cso-ni (8% of new ice and nilas in total Cso)
ASI (12.5 km)
Cso/Cso-ni (9% of new ice and nilas in total Cso)
VASIA2 (12.5 km)
Cso/Cso-ni (9% of new ice and nilas in total Cso)
Coefficient of determination (R2)0.74/0.710.81/0.790.65/0.62
Average error, tenths−0.4/0.0 −0.3/+0.1 −0.3/+0.1
Standard deviation, tenths2.1/2.11.8/1.92.6/2.8
Winter
NT (25 km)
Cso/Cso-ni(24% of new ice and nilas in total Cso)
ASI (12.5 km)
Cso/Cso-ni(28% of new ice and nilas in total Cso)
VASIA2 (12.5 km)
Cso/Cso-ni(28% of new ice and nilas in total Cso)
Coefficient of determination (R2)0.73/0.590.62/0.620.46/0.37
Average error, tenths−0.4/+1.1 −0.8/+1.0 +0.2/+1.4
Standard deviation, tenths2.2/2.62.7/2.62.6/3.0
Table 3. Average errors of Csmr against Cso (tenths) at different ice melt stages (points) calculated for: the whole SIC range (0–10 tenths)/compact ice (9.5–10 tenths).
MeltNTASIVASIA2
5
Strongly ablated deformed ice pieces sitting deep in water predominate. Ice is heavily flooded and has grayish color.
−1.3/−1.7−1.1/−0.1 −0.6/0.1
4
Heavily decayed ice. Thaw holes and water separations are everywhere, ice breccias have completely disintegrated. Mushroom ice with underwater rams appears among ice floes.
−1.2/−2.7−2.1/−1.7 −1.4/−0.4
3
Ponds are everywhere. Snow is melted completely. Thaw holes appear. Ice gets dried and whitens.
−1.0/−1.7−0.5/−1.2 −0.5/−0.7
2
Ice surface is darkened, snow is partly melted, many large melt ponds are visible.
−1.1/−1.8−0.3/−1.0−0.2/−1.1
1
Few melt ponds and dark patches are detected on the sea surface. Ice breccias begin to disintegrate.
−1.8/−1.8−0.1/−0.40.4/0.1
0
No visible evidence of melt, however the most probably that snow cover is moist.
−1.5/−1.5−0.5/−0.80.1/−2.0