Abstract
Remnant midwestern oak savannas in the USA have been altered by fire suppression and the encroachment of woody evergreen trees and shrubs. The Gus Engeling Wildlife Management Area (GEWMA) near Palestine, Texas represents a relatively intact southern example of thickening and evergreen encroachment in oak savannas. In this study, 18 images from the CHRIS/PROBA (Compact High-Resolution Imaging Spectrometer/Project for On-Board Autonomy) sensor were acquired between June 2009 and October 2010 and used to explore variation in canopy dynamics among deciduous and evergreen trees and shrubs, and savanna grassland in seasonal leaf-on and leaf-off conditions. Nadir CHRIS images from the 11 useable dates were processed to surface reflectance and a selection of vegetation indices (VIs) sensitive to pigments, photosynthetic efficiency, and canopy water content were calculated. An analysis of temporal VI phenology was undertaken using a fishnet polygon at 90 m resolution incorporating tree densities from a classified aerial photo and soil type polygons. The results showed that the major differences in spectral phenology were associated with deciduous tree density, the density of evergreen trees and shrubs—especially during deciduous leaf-off periods—broad vegetation types, and soil type interactions with elevation. The VIs were sensitive to high densities of evergreens during the leaf-off period and indicative of a photosynthetic advantage over deciduous trees. The largest differences in VI profiles were associated with high and low tree density, and soil types with the lowest and highest available soil water. The study showed how time series of hyperspectral data could be used to monitor the relative abundance and vigor of desirable and less desirable species in conservation lands.
Keywords:
savanna; post oak; vegetation index; ecosystem function; phenology; encroachment; evergreen; deciduous 1. Introduction
Midwestern oak savannas originally occupied the transition zone between the true prairie grasslands and the eastern deciduous forests in North America. They stretched from eastern Texas in the south to northern Minnesota and occupied as much as 20 M ha in a continuous band []. Despite their association with rolling landforms on light sandy soils, most of these savannas were cleared for grazing and arable agriculture in the 19th century, leaving only about 12,000 ha of highly fragmented remnants []. Much of the remaining southern remnants are post oak woodlands and savanna grasslands in varying states of intactness, conservation status, or extirpation. Post oak savanna and savanna grasslands occupy approximately 2.7 M ha of eastern Texas []. Other studies place the total area in Texas at around 4 M ha [,]. In eastern Texas, Post Oak Motte and Woodland occupies about 38% and Savanna Grassland occupies about 58% of this vegetation type, with other minor types making up the remainder [].
The Gus Engeling Wildlife Management Area (GEWMA) represents a relatively intact example of post oak savanna and savanna grassland and includes hardwood bottomland forest and riparian areas []. As a result of fire suppression, the upland oak savanna dominated by post oak (Quercus stellata), red oak (Q. falcata), blackjack oak (Q. marilandica), and bluejack oak (Q. incana) has thickened to exclude understory grasses such as little bluestem (Shizachyrium scoparium) in many areas, and open areas have suffered from woody encroachment by native evergreen species such as eastern red cedar (Juniperus virginiana; []) and yaupon (Ilex vomitoria). The GEWMA is under an active program of land cover management aimed at the regeneration of open savannas by clearing sections of oak and replanting little bluestem grassland.
For the past 15 years, the spaceborne hyperspectral remote sensing of vegetation has depended upon two experimental sensors, EO-1 Hyperion (Earth Observer 1 Hyperion) and CHRIS/PROBA (Compact High-Resolution Imaging Spectrometer/Project for On-board Autonomy) for data at a spatial resolution (30–34 m pixels) for field and landscape-scale studies [,,,,]. Although the CHRIS sensor only covers the 400–1000 nm wavelength range, it also provides nadir images and two forward and backward-looking off-nadir angles. It has been applied to a wide range of studies on classification [], vegetation properties [,], vegetation mapping [,], water [,,], canopy function [], canopy radiative transfer [,], and vegetation indices [].
Time series of hyperspectral data have proven valuable in vegetation classification and the detection of changes in functional processes. However, dense time series over a single site are relatively rare. The GEWMA site, with its thickening of post oak woodland and woody encroachment by evergreens, provides an opportunity to use CHRIS data to explore the extent to which suites of functionally based vegetation indices (VI) can distinguish differences in vegetation canopy properties and behaviors over a full seasonal growing cycle. A very large number of VIs have been constructed to target various aspects of photosynthetic function, canopy structure, fractional cover of photosynthetic and non-photosynthetic components, and canopy water content []. In general, narrow-band VIs acquired from visible and near infrared wavelengths can provide quantitative information about photosynthetic pigments such as chlorophyll, carotenoids and anthocyanins ([,,], photosynthetic radiation use efficiency (RUE; [,]), canopy senescence using the chlorophyll to carotenoid ratio [], and subtle differences in photosynthetic capacity based on many variants and more complex surrogates of the Normalized Difference Vegetation Index (NDVI; see []). Imagery from sensors such as Hyperion with short-wave infrared bands can be used to derive VIs with sensitivity to canopy water content and dynamics [] and the fractional cover of photosynthetic and non-photosynthetic canopies and bare soil [].
Previous work has explored the application of selected VIs derived from EO-1 Hyperion imagery to the identification of vegetation states in tropical savannas [] and North American savannas and grasslands []. However, the image acquisition frequency in these studies was insufficient for the characterization of phenology. In this study, a sequence of 17 CHRIS images was acquired between June 2009 and October 2010, providing an opportunity to explore variation in canopy dynamics among deciduous and evergreen trees and shrubs and savanna grassland in seasonal leaf-on and leaf-off conditions for a valuable remnant of the threatened midwestern oak savannas. The objectives of the study were as follows:
- (1)
- To characterize the seasonal phenology of deciduous post oak savanna and encroaching evergreen shrubs with functional VIs derived from CHRIS PROBA imagery;
- (2)
- To explore the sensitivity of VIs for distinguishing differences in photosynthetic capacity and water status between deciduous savanna vegetation and evergreen shrubs;
- (3)
- To illustrate the utility and sensitivity of combinations of VIs for describing differences in vegetation function across soil-vegetation associations in a post oak savanna.
2. Materials and Methods
2.1. Study Area
The Gus Engeling Wildlife Management Area (GEWMA) is located about 29 km northwest of Palestine, near Bethel in Anderson County, Texas (Figure 1a). The GEWMA was acquired by the State of Texas between 1950 and 1960, and comprises 4434 ha of prairie, post oak savanna, hardwood bottomlands, and riparian areas including pitcher plant bogs ([,,]. The area is regarded as being less disturbed than much of Texas, since soils are too poor for arable agriculture. However, it was grazed as open range by cattle and hogs from the mid-1800s, becoming severely overgrazed prior to acquisition by the State []. The landscape has a rolling terrain with elevation ranging from 75 to 150 m and vegetation cover dominated by a mix of deciduous and evergreen trees and shrubs (Figure 1a,b). The climate is characterized by hot summers and mild winters, with average monthly maximum temperatures approaching 35 °C in August and average monthly minima approaching 0 °C in January (Figure 2). Average monthly rainfall reaches a peak in May and October; however, rainfall can be highly variable. Very heavy rainfall in May 2010 resulted in the flooding of the lower parts of GEWMA and the surrounding villages and towns (Figure 2).
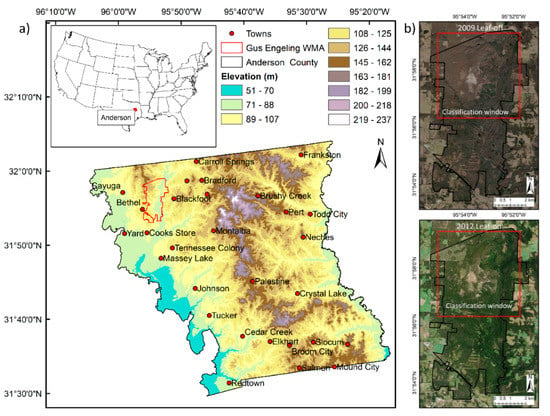
Figure 1.
(a) Location of Gus Engeling Wildlife Management Area (GEWMA) in Anderson County, near Bethel, Texas showing the elevation of the county landscape. (https://tpwd.texas.gov/huntwild/hunt/wma). (b) National Agricultural Imagery Program (NAIP) images from 2009 and 2012 show the canopy cover in leaf-off and leaf-on states, the classification window (red box) used later in the study, and the structured clearing of thickened woodland to re-establish savanna in the north-west of the area (2012 image).
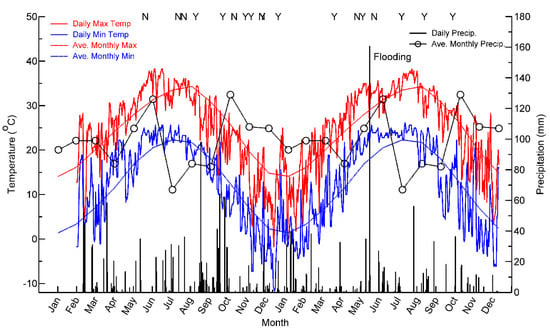
Figure 2.
Average monthly and actual daily maximum and minimum temperatures and precipitation for Palestine, Texas for 2009 and 2019. Note the flooding rains in late May 2010. Letters indicate the timing of Compact High-Resolution Imaging Spectrometer (CHRIS) acquisitions with Y/N indicating whether the image was used in the analysis or not.
The soils range from loamy sands and sandy loams on the terraces and lowlands to fine sands on the upland post, black and bluejack oak woodlands (Table 1). The Ecological Site Description (ESD) provided with soil maps by the Natural Resources Conservation Service (NRCS) of the United States Department of Agriculture (USDA) provides descriptions of original reference vegetation and state and transition frameworks for vegetation succession in response to disturbance, fire exclusion and management of herbivory (Table 1; Soil Survey Staff, NRCS, 3 October 2017). However, the detailed vegetation mapping in [] and in Phase 2 of the Texas Vegetation Classification Project [] (Figure 3b; Table 2) provides a better indication of the vegetation on GEWMA at the time of this study.

Table 1.
Dominant ecological site descriptions (provisional status), soil types and major Texas Land Cover Project classes for GEWMA.
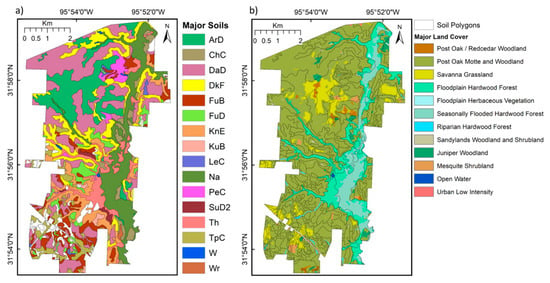
Figure 3.
(a) Major soil types by soil polygon from the United States Department of Agriculture (USDA) Natural Resources Conservation Service (NRCS) for GEWMA; see Table 1 for descriptions (minor soil types in the southern area are shown as blank for simplicity). (b) Major land cover classes from the Texas Vegetation Classification Project ([] for GEWMA (minor classes covering <200 pixels in the dissected southern area have been excluded for simplicity).

Table 2.
Major species associated with the most important land cover types from the TNRIS classification and major encroaching evergreen species mapped in this study [,]. Species are listed from major to minor; however, woodlands and forests are very heterogeneous.
The vegetation canopy structure on GEWMA is shown in Figure 1b contrasting leaf-off and leaf-on images from 2009 and 2012. Note that site managers started to clear part of the thickened woodland in 2010 in order to restore some of the original oak savanna parkland environment. The result of this is visible in the 2012 image. A simplified version of the Phase 2 land cover map identifies four major and three minor vegetation associations on GEWMA: savanna grassland, post oak motte and woodland, seasonally flooded hardwood forest, floodplain hardwood evergreen forest; and juniper woodland, mesquite woodland, and post oak/red cedar motte and woodland (Figure 3b). The species composition of these main types is shown in Table 2, indicating the diversity of the genera and species involved. The proportions of these vegetation sites associated with each major ESD and NRCS soil types are shown in Table 1 (the minor land cover types with evergreen shrubs are all aggregated into one for this purpose). The savanna grassland, post oak motte and woodland are strongly concentrated on Darco, Kirvin, Teneha and Tonkawa fine sands, whilst floodplain hardwoods and seasonally flooded hardwoods are primarily concentrated on Thenas fine sandy loam, Naconiche loamy fine sand, and Nahatche and Pluck soils (Table 1).
Observations from field work carried out in November 2009 indicated that the upland oak savanna was thickened and dense with little or no understory (Figure 4a), the savanna grassland (Figure 4b,c) had areas of bare soil, thin areas of little bluestem and scattered evergreen shrubs, and the lowlands and terraces contained dense stands of hardwoods with evergreen shrub understories (Figure 4c background, Figure 4d roadside). The map developed in [] identifies natural vegetation types with more spatially explicit detail but does not identify invasive evergreens aside from long-established eastern red cedar and mesquite stands.
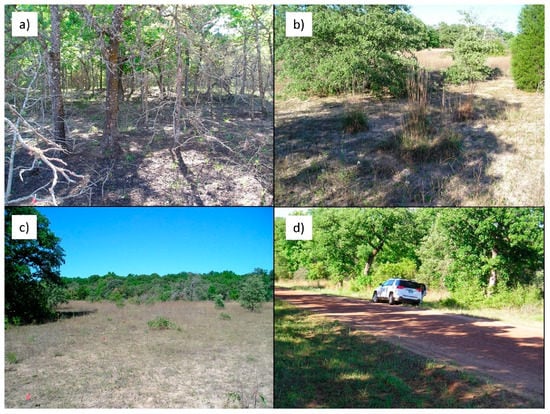
Figure 4.
(a) Thickened post oak woodland on the sandy upland ArD or DaD soil type with virtually no understory. (b) Savanna grassland with sparse grasses, yaupon and eastern red cedar. (c) Degraded savanna grassland with bottomland hardwood forest in the background. (d) Dense mixed oak woodland with shrubby understory by the road. (Photos: M.J.H and A.M.).
2.2. Remote Sensing Data and Processing
2.2.1. Aerial Photography
To aid with the geometric correction of CHRIS data, characterization of the vegetation cover, and identification of evergreen vegetation, a National Agricultural Imagery Program (NAIP) 1 m resolution airborne image with red, green, blue and near infrared bands was acquired for January 2009 coinciding with the winter leaf-off period for deciduous trees. The four-band image was subjected to an unsupervised isodata classification to create 25 classes. These classes were then aggregated to five vegetation classes (water or shadow, deciduous trees, leaf/grass understory; bare or sparse herbaceous vegetation, and evergreen trees and shrubs) based on a visual interpretation of the NAIP image (Figure 5a). Potential for error was greatest in distinguishing deciduous tree cover from understory since the separation of trees from understory under leaf-off conditions was dependent upon trunk/shadow mixtures. Varying the aggregated class allocation for the most marginal class resulted in unacceptably high “omission” differences of -86% for deciduous tree cover and a “commission” difference of 140% for understory, which did not match our knowledge of the site based on measurements of canopy trees along two transects in central GEWMA, as well as qualitative surveys throughout the area. Using the most conservative aggregation for evergreens changed the evergreen percentage from around 20% to around 10%. However, this excluded classes with clear red edge signatures indicative of photosynthetic vegetation. Since this classification was undertaken at the NAIP pixel resolution of 1 m, but subsequent analysis was undertaken at a resolution of multiple CHRIS pixels, minor accuracy errors in this classification had very little impact on the results of the study.
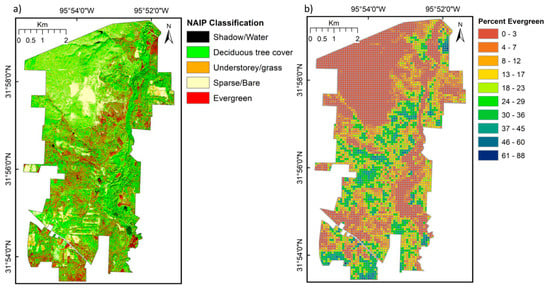
Figure 5.
(a) Classification of the winter 2009 NAIP image into five classes specifically identifying evergreen trees; and (b) Fishnet polygons corresponding to a 5 × 5 grid of CHRIS Project for On-Board Autonomy (PROBA) pixels showing the proportion of evergreen trees.
2.2.2. CHRIS PROBA Data
The ESA sensor CHRIS/PROBA was launched on 22 October 2001 []. The CHRIS sensor on the PROBA-1 platform was designed to capture high-resolution images at multiple view angles in 62 narrow reflectance channels for wavelengths between 400 and 1000 nm [] (Table 3). The sensor could be tasked in several modes which varied the swath width, pixel resolution and number of spectral channels. For this study, CHRIS data were acquired in Mode 1 which provided 62 spectral channels and five view angles at a nominal pixel resolution of 34 m (Table 3). The CHRIS data were acquired on 17 dates between June 2009 and October 2010 over the GEWMA study area (Table 4).

Table 3.
CHRIS PROBA Specifications for Acquisition Mode 1.

Table 4.
CHRIS PROBA image acquisition dates, viewing geometry for nadir image, solar geometry and cloud contamination.
The CHRIS images were processed using the CHRIS Toolbox [] in version 4.7 of the BEAM software package to process data from a variety of European Space Agency sources [] and in ENVI®(ENvironment for Visualizing Images). Following the procedure in [], the standard noise reduction, cloud identification and masking, and atmospheric correction with spectral calibration, aerosol optical thickness retrieval and column water vapor retrieval were carried out to obtain surface reflectance images. The atmospheric correction module of the CHRIS Toolbox [] is based on MODTRAN4 (MODerate resolution atmospheric TRANsmission) []. Although the full set of multi-angular images was acquired and processed for almost all dates, only nadir images were used in this study, as the focus was on the temporal domain rather than the angular domain.
Nadir surface reflectance images were converted to tiff format, exported and imported into ENVI®. Only those images without cloud over the GEWMA site were subjected to further processing, and the 20 December image was excluded due to a targeting error. This left 11 useable images for further processing (Table 4). Images for each date were individually geometrically corrected using ground control points from the NAIP image. Due to the nature of the GEWMA environment with limited manmade features, CHRIS images were warped to an 18 m pixel resolution with a registration accuracy of approximately 1 pixel. Although this leads to the oversampling and smearing of the detected signal, this was not important in the context of this study, in which patch-based temporal profiles were the major target. Finally, the individually registered images were co-registered using Texas Road centerlines with an accuracy of approximately 2 pixels (36 m).
2.2.3. Vegetation Indices
A total of 51 narrow band VIs was calculated from the 62 channel surface reflectance images based on the formulae documented in [] with wavelengths adjusted for CHRIS band centers. Given the nature of the study site, with very dense tree cover except for certain soils where savanna grassland occurred, the identification of the key VIs focused first on known pigment-sensitive wavelength combinations found to be effective in previous studies with Hyperion imagery [,], and then on whether the many different narrow-band indices creating variants on the NDVI [] and targeting the red edge provided any additional sensitivity to augment NDVI. The VIs that utilized blue wavelengths below 480 nm often failed due to low-quality blue bands. Based on [,], visual assessment of images and pixel histograms, eight VIs were selected as indicators of vegetation canopy properties (Table 5). The NDVI was ultimately selected as the indicator of greenness/photosynthetic capacity since no advantage was gained from the other greenness VI variants. Although band centers were well aligned with narrow band reference values, CHRIS band widths at 6–12 nm can only broadly approximate the narrow bands used in the original derivation of some of these indices. For example, [] used an average band width of 2.8 nm in deriving the PRI2. Nevertheless, the image value ranges for highly precise VIs such as PRI and PRI2 matched the ranges observed in the original studies [,].

Table 5.
Vegetation indices selected as indicators. Formulae depict band reflectance (R) wavelengths in nanometers.
2.3. Analysis
2.3.1. Fishnet Polygon Extraction of Tree Cover Density and VI Profiles
In order to capture the broad patterns of vegetation canopy dynamics with such heterogeneous species mixtures (Table 2), the analysis was based on averaging across pixels at a patch scale. A fishnet polygon layer was constructed with a polygon cell size of 5 × 5 CHRIS pixels making a 90 × 90 m cell. Each fishnet polygon was attributed a unique number. Pixel counts of tree and other cover classes were then extracted from the classified NAIP image (with each fishnet polygon cell containing 8100 NAIP pixels), converted to cover class proportions and assigned to each fishnet polygon cell (Figure 5b; percentage of evergreen class shown). The fishnet was then merged with the soil polygon layer for GEWMA to create a combined layer with vegetation cover fractions and soil type for each fishnet polygon. The fishnet was then used to extract VI values for each fishnet polygon from each VI time series creating a database with cover fraction, soil type, and VI value for each 90 × 90 m polygon across GEWMA. To minimize the effects of uncertainty in the attribution of aggregated classes in the NAIP image classification, the time series profiles of each VI were then examined for average deciduous and evergreen tree cover at 10% intervals. Associations with the Texas Land Cover classes were also examined.
2.3.2. Combined Indicators of Vegetation Function
Based on image coverage and quality, two dates (September 2009—leaf-on—and 25 January 2010—leaf-off) were selected to explore information provided by combining VIs. The data were windowed to focus on the northern half of GEWMA, where a consistent gradient from the upland sandy savannas to the lowland hardwood floodplain and riparian areas could be sampled. The six best VIs from the phenological analysis were stacked (Anthocyanin Reflectance Index 2 (ARI2), Carotenoid Reflectance Index (CRI), NDVI, Photochemical Reflectance Index 2 (PRI2), Plant Senescence Reflectance Index (PSRI) and Water Index (WI)) for each date. An isodata unsupervised classification was carried out on the VI stacks for each date to create a 20-class image. The classifications were then aggregated to eight classes based on the dendrograms and class distances. The mean and standard deviation of VI index values, NAIP classification cover percentages and dominant soil type percentage were extracted for each classified image.
3. Results
The extracted time series profiles showed major differences in relation to the major land cover types and deciduous tree density levels and in relation to the proportion of evergreen trees and shrubs present.
3.1. Overall VI Profiles
The comparison of profiles for the selected VIs showed a clear separation between areas with trees and those without during leaf-on. For most leaf-on dates, savanna grassland VI profiles were separated from the 40% and 80% tree cover profiles by more than one standard deviation (Figure 6). The differences among the deciduous tree canopies largely disappeared during leaf-off.
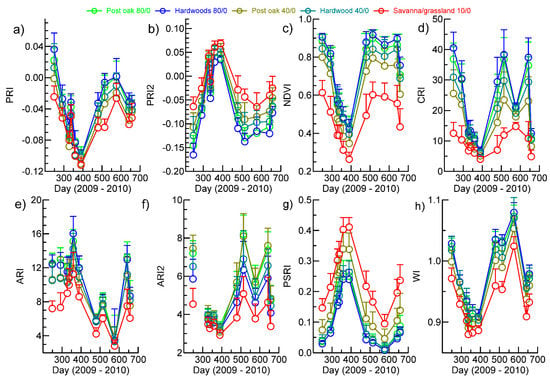
Figure 6.
Overview of seasonal phenology of vegetation indices that are indicators of photosynthetic activity and pigments averaged across soil polygons with predominant vegetation types of post oak, bottomland hardwoods and grassland at tree cover percentages of 80, 40 and <10 and no evergreens. The bars denote standard deviations. The gap in the ARI2 profile is due to an unrecoverable error in the calculation for 19 October (see Table 1 for land cover association with soil types). (a) PRI; (b) PRI2; (c) NDVI; (d) CRI; (e) ARI; (f) ARI2; (g) PSRI; and (h) WI.
Although increments in VI response to tree density were evident, there was a substantial overlap in standard deviations, with CRI and ARI1 and ARI2 exhibiting a higher variation in values within a tree density level and between dates. In general, magnitudes of pigment-sensitive VIs during leaf on could be ranked 80% > 40% hardwood > 40% post oak >> savanna/grassland (for PRI2, low values represent a high response). The largest range of response was exhibited by CRI during leaf-on, but the rankings among tree densities were the same. The PSRI exhibited little sensitivity to hardwood tree density, but a consistently higher response for post oak at 40% tree cover and savanna/grassland (Figure 6g). The compressed and low values for CRI, ARI and ARI2 for day 576 (July 30) are likely anomalous as they are not supported by parallel behaviors in NDVI, WI, PRI or PRI2. The WI showed large seasonal variation in canopy water content, but the main difference in profiles was between the savanna grassland and the areas with trees (Figure 6h).
3.2. Response of VIs to Evergreen Density
The effect of evergreens on the VI profiles was examined for the DaD soil type dominated by post oak woodland with total tree cover of >80% (see Table 1) and evergreen tree cover in increments of 10% up to the maximum observed of 40% (Figure 7). The pigment-sensitive VIs exhibited small increases in values in the leaf-off period between 350 and 430 days (mid-December 2009–mid-March) in response to increasing evergreen cover, except for the ARI (Figure 7). Although the increments due to evergreen density were evident, standard deviations within date and density levels were relatively large and exhibited a significant overlap. The PRI2 and NDVI exhibited lower values at 40% tree cover than at 80% tree cover in the leaf-on period of 2010 (Figure 7a,b). The PSRI and WI provided the clearest response to increasing evergreen percentage, with PSRI declining and WI increasing incrementally with each 10% increase in evergreens (Figure 7c,d). The responses to increasing the evergreen percentage were similar for the other soil types, but the magnitude of the difference between zero and 40% evergreens was generally smaller. Evergreen percentages were very low on the ArD soil type except when adjacent to bottomlands.
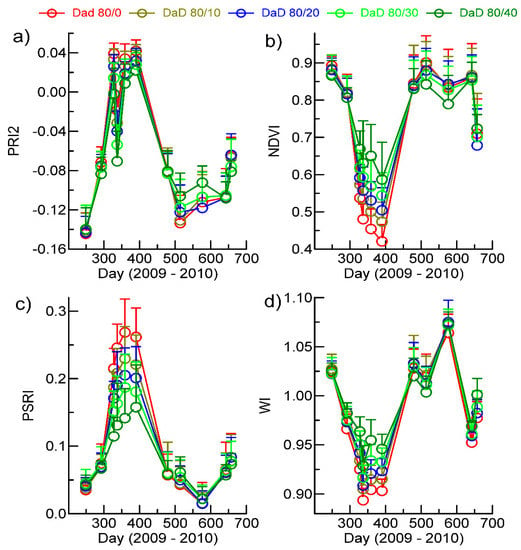
Figure 7.
Variation in responses of the Vegetation Indices (VIs) most sensitive to increasing levels of evergreen tree cover within the DaD soil type dominated by post oak woodland. The bars denote standard deviations. (a) PRI2; (b) NDVI; (c) PSRI; and (d) WI.
3.3. Responses within Tree Density Levels among Soil Types
Available soil water (ASW) is a major variable among dominant soil types on GEWMA, with upland sandy soils having 6–10% ASW and loamy bottomland soils having approximately 14–16% ASW (Table 1). In contrast with the other profile analyses, differences in PRI2 and WI among the different combinations of soil type and tree density mostly exceeded one standard deviation indicating the importance of ASW in canopy processes. The comparisons between selected soils at the extremes of ASW content showed major differences during the leaf-on period among the three soil types predominantly associated with grassland savanna or woodland at tree densities of <10% for PRI2, and smaller differences during the leaf-off period (Figure 8a). There were also differences between the ArD and Na at 80% tree cover in the leaf-on period, but these disappeared in the leaf-off period. There were small differences in WI between ArD and both DkF and DaD soils in the leaf-on and leaf-off periods, and between ArD and Na in the leaf-on period (Figure 8b), but the relative differences were smaller than for PRI2.
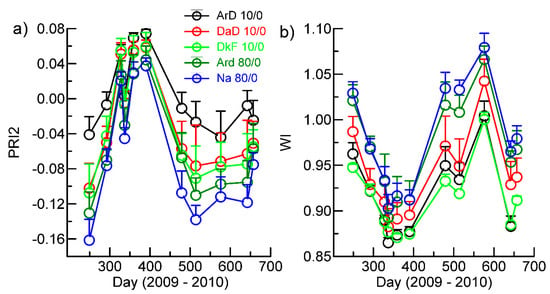
Figure 8.
Variation in VI indicators across extremes of deciduous tree cover (<10% and >80%) without evergreens, and across soil types in terms of available soil water (see Table 1). The bars denote standard deviations. (a) Photosynthetic activity, PRI2; and (b) vegetation water content, WI.
3.4. Sensitivity of VIs to Spatial Variability in Leaf-on and Leaf-off Periods
Images from 6 September 2009 and 25 January 2010—peak leaf-on and leaf-off conditions, respectively—were chosen to examine the sensitivity to vegetation and canopy variation and underlying soil differences that could be obtained by combining the VIs by classification. The 2009 date was chosen because site managers commenced clearing parts of the upland woodland in mid-2010 (see Figure 1) and consistent vegetation cover between leaf-on and leaf-off was required. The images from these dates clearly reflect the differences in leaf-on and leaf-off canopies (Figure 9) and highlight the presence of evergreen vegetation in January (Figure 9b,d,f,h). Whilst the NDVI shows limited within-canopy sensitivity, PRI2 shows a marked difference between evergreen-dominated and deciduous oak-dominated areas in September (Figure 9a,c). The upland post oak woodland and savanna environment associated with drier soil types (Table 1) is sharply delineated in January NDVI and ARI2 (Figure 9b,f). The PSRI and WI show the same patterns as the pigment-specific indices with a similar sharp delineation of the upland post oak woodland and savanna in January in both VIs (Figure 10) and the presence of evergreen vegetation in January (Figure 10b,d).
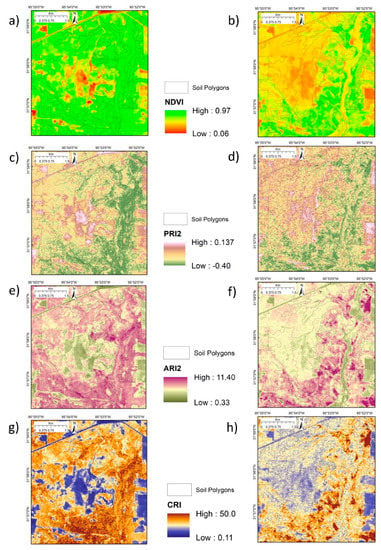
Figure 9.
Photosynthesis and pigment-sensitive VIs at leaf-on and leaf-off for deciduous trees. (a) NDVI 6 September 2009; (b) NDVI 25 January 2010; (c) PRI2 6 September 2009; (d) PRI1 25 January 2010; (e) ARI2 6 September 2009; (f) ARI2 25 January 2010; (g) CRI 6 September 2009; (h) CRI 25 January 2010.
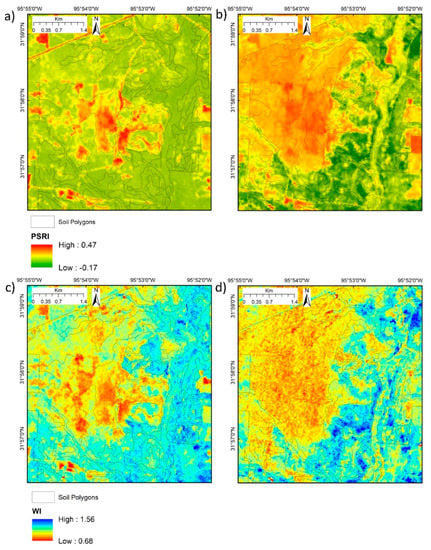
Figure 10.
Dryness and moisture-sensitive VIs at leaf-on and leaf-off for deciduous trees. (a) PSRI 6 September 2009; (b) PSRI 25 January 2010; (c) WI 6 September 2009; (d) WI 25 January 2010.
The image classification results for September and January produced distinctly different class patterns, with the leaf-on September image highlighting the grassland/savanna areas, variation in the post oak woodland canopy, and no clear distinction of hardwoods on bottomland (Figure 11a). By contrast, the results for January clearly distinguished the post oak woodland and savanna grassland on ArD and DaD soil types, areas of evergreen vegetation and the flooded stream bottomland associated with the Na soil type (Figure 11b).
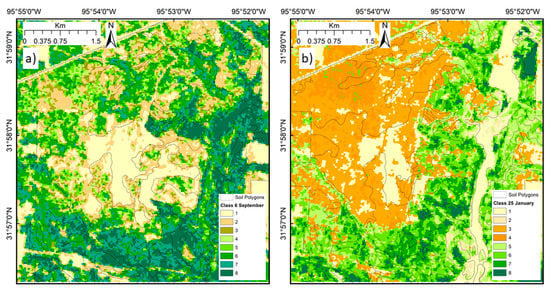
Figure 11.
Classification of the northern section of GEWMA based on six VIs aggregated to eight classes. (a) September 6, 2009: deciduous leaf-on; (b) January 25, 2010: deciduous leaf-off.
The extracted profiles for each classification illustrate the difference in VI sensitivity, class association with tree and evergreen density, and class association with soil type (Figure 12). Available soil water is a major variable among dominant soil types on GEWMA, with upland sandy soils having 6–10% ASW and loamy bottomland soils having approximately 14–16% ASW (Table 1). Within the image, the dominant soil types were DaD > ArD > DkF > Na, thus representing a contrast between drier soils supporting post oak woodland and savanna grassland, and bottomland loams supporting hardwood forest (Figure 12). In September, most of the area was occupied by classes 1, 2, 6, 7 and 8. Classes 1 (78%) and 2 (61%) were strongly associated with elevations between 100 and 129 m, while classes 7 (55%) and 8 (76%) were strongly associated with elevations between 78 and 100 m. Neither the evergreen vegetation nor the understory fraction varied much between classes, but bare soil was most associated with class 1 and least associated with class 8. In all cases, VI class values showed either a regular positive progression from class 1 to class 8 for ARI2, CRI, NDVI, PRI2 (negative PRI2 represents a higher value) and WI, and a negative progression for PSRI (Figure 12). These progressions represented a regular increase in pigments, photosynthetic activity and canopy water content, and a regular decrease in brownness/yellowness with class number. Class 1 occupied 40% of soil type ArD, while class 2 occupied 20% of each of ArD, DkF and FuB.
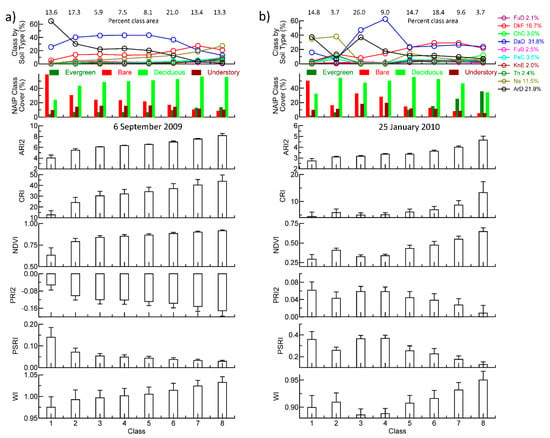
Figure 12.
Vegetation Index profiles of cover types from classified NAIP imagery and proportion of NRCS Web Soil Survey soil types associated with (a) September 2009 and (b) January 2010 classifications shown in Figure 11. Numbers at the top indicate the percentage of the area occupied by each class. Numbers on the soil type legend indicate the percentage of the area occupied by each major soil type (minor soil types were excluded).
In January, most of the area was occupied by classes 1, 3, 4, 5, 6, and 7 (Figure 12b). Bare areas were associated with classes 1 and 3, and evergreen vegetation was associated with classes 7 and 8. The class association with elevation was more marked than in September, with between 88–100% of classes 5–8 being associated with elevations between 78–115 m, and 63% of class 2 being associated with elevations between 78 and 85 m. Classes 7 and 8 had the highest NDVI, CRI and ARI2 and the lowest PRI2 values as well as the highest WI and lowest PSRI. Among classes 1, 3 and 4, associated with the deciduous post oak woodland and savanna grassland, there were lower values for WI for classes 3 and 4 with greater understory cover than class 1 with more bare cover. Class 1 occupied >40% of the Na soil type, class 3 occupied between 30 and 40% of soil types ArD, DaD and FuB, and class 6 occupied around 30% of the minor soil types KnE, DkF and PeC (Figure 12b).
4. Discussion
This study on a remnant post oak woodland area has shown that the major differences in spectral phenology as defined by VIs are associated with deciduous tree density, the density of evergreen trees and shrubs—especially during deciduous leaf-off periods—broad vegetation types, and soil types. Although major differences in VIs at peak leaf-on and leaf-off were clearly associated with high and low evergreen density and extremes of ASW associated with soils, combining VIs in a simple classification also revealed variation in canopy water content and photosynthetic capacity within ostensibly uniform post oak savanna on the sandy soils with low ASW. The photosynthetic capacity of evergreens during deciduous leaf-off was clearly indicated by NDVI, PRI1 and PRI2 profiles with obvious growth advantages for further encroachment. Although tree species vary between post oak savanna and bottomland hardwoods, VI phenology was remarkably similar at the same tree densities. Heterogeneous and shared species composition post oak woodland and hardwood forests limited patch-scale discrimination with VI profiles.
The temporal pattern of spectral VIs was dominated by the deciduous tree leaf-on/leaf-off cycle of post oak woodland and hardwoods, and spatial variation in amplitude was primarily determined by tree density from >80% cover down to <10%. There was a greater range in the amplitude of NDVI and CRI than PSRI—an indicator of the chlorophyll/carotenoid ratio []—or ARI and ARI2 during leaf-on in response to the tree densities and major vegetation types. The precipitation records from September 2009 to October 2010 indicate that the site did not undergo any unusual moisture stress during the study. In addition, due to a flooding event in May of 2010 with substantial cloud in the preceding couple of months, 2010 spring green-up was not captured. There are significant differences in pigment magnitudes [], anthocyanin synthesis [] and rates of decay during senescence associated with stress or different mixes of deciduous species [,]. Such differences were either minimal or undetectable in this study. Since deciduous species are highly intermingled in both post oak savanna and bottomland hardwood forest (see Table 2 [,]; the pixel resolution of CHRIS and the 90 m resolution of the fishnet used in the analysis meant that patch-scale species differences were likely to be distinguishable).
At the landscape scale, the upland post oak savanna was clearly delineated in the leaf-off VI images, and there was a strong association with soil type and elevation. However, in leaf-on images, PRI2 and WI showed most sensitivity to the differences between upland and bottomland in soil properties, elevation and vegetation type, and to variation within the upland post oak savanna woodland and savanna grassland. The PRI and PRI2 are sensitive to photosynthetic RUE [,] and evergreens exhibit reduced midday PRI levels compared to deciduous species []. In this study, lower values for PRI and higher values for PRI2 were observed for 40% evergreen tree cover compared to 0–30% evergreen cover at 80% total tree cover in the peak leaf-on period of 2010. This suggests that evergreens suffer some disadvantage in photosynthesis when competing with deciduous trees during the leaf-on period. However, this is a minor factor when compared with the opportunity for photosynthesis and growth in the 3–4 month deciduous leaf-off period. An examination of the weather during the study period (Figure 2) and the long-term climate indicates that the temperature and precipitation are favorable for the growth of evergreens, especially coniferous Juniperus spp., while deciduous trees are in a leaf-off state.
The largest differences in pigment/senescence and photosynthetic-sensitive VIs occurred when comparing tree canopies among the sandy soil types with the lowest ASW at tree densities of <10%, and between the soil types with the lowest and highest ASW for tree densities >80%. This suggests that water relations are not only the most important driver of the vegetation types between upland woodland and bottomland hardwood forest at the landscape scale, but also potentially influence the vigor and location of savanna tree species at the patch scale. While differences in leaf-off classes derived from combined VIs were obviously associated with the presence or absence of an evergreen canopy, leaf-on classes associated with deciduous cover of >50% and ≤20% bare (classes 5–8) showed a significant variation in WI that is indicative of different canopy water contents. Studies have shown significant differences in water use attributes such as access to soil water, stomatal conductance, water use efficiency, and leaf-specific hydraulic conductance among Quercus spp. [,]. The post oak woodland contains a mix of Quercus spp., but tree-by-tree identification for any local site was not available or collected for this study. However, spatial variation in class distribution in the water-limited upland savanna environment in September 2010 may be indicative of both local variation in Quercus species composition and the vigor of trees associated with differences in water relations attributes.
The observation and analysis of woody encroachment across North America suggest that the potential for “release” of woody encroachers favored by fire suppression is greater at sites with higher precipitation [], and by inference might be better on bottomland soils with higher ASW rather than on upland soils with lower ASW. Certain Quercus species have exhibited higher pre-dawn and midday water potentials than eastern red cedar [,] which is known to use water year-round, and almost 100% of precipitation reaches the soil surface []. In this study, higher densities of evergreens were clearly negatively associated with the soils with the lowest ASW, higher elevation (compare Figure 3 and Figure 5) and those most dominated by thickened post oak woodland. Evergreens were mainly distributed among a range of soils in the bottomlands as an understory to hardwood canopies and along small tributaries of the main stream, Catfish Creek, at relatively lower elevations than the adjacent terrain. Among the native evergreens, eastern red cedar may have the most potential to encroach on low ASW soils since it has a record of highly successful encroachment in grasslands where it has an advantage in terms of rooting depth [] and in upland oak forests in Oklahoma []. At the time of this study, the upland post oak savanna area was densely thickened with no grasses and a dense thatch of leaf litter (Figure 4a). The combination of high oak density, low ASW, rapid soil drainage at higher elevations, and the advantage in water relations attributes over eastern red cedar may explain its almost complete absence from the upland post oak woodlands.
Close to the end of the study period, a section of the northern upland post oak savanna was partially cleared to enable the planting of grasses and regeneration of a savanna landscape as part of an on-going management plan by the Texas Parks and Wildlife Department (Figure 1b). Small areas of GEWMA had been replanted with Shizachyrium scoparium prior to the commencement of this study. Airborne and satellite remote sensing could play a key role in the monitoring and management of GEWMA by tracking the development of replanted areas, identifying evergreen woody encroachment in newly planted areas, selecting areas for spraying, burning and/or mechanical control of eastern red cedar, and monitoring the long-term health of the important remnants of original savanna grassland, post oak woodland and hardwood forest (e.g., []). Such monitoring could be carried out with relatively frequent imagery at a 10–20 m resolution from Sentinel 2a and 2b. A prior study simulated Sentinel 2 with Hyperion imagery across a range of sites in North America and showed that suites of VIs could provide clear insights into differences among vegetation states and processes []. Various baseline conditions and approaches for the restoration of oak savannas [,] could be informed with suitable passive and active remote sensing data (e.g., [,]). This study used a now almost 20-year-old sensor with relatively low signal to noise and 400–1000 nm spectral coverage to detect a variety of differences seasonal phenology due to plant functional type, vegetation type, soils, and tree density. Advances in the hyperspectral detection of plant species diversity and function [,,,,] provide exciting potential for monitoring important repositories of biodiversity with heterogeneous species composition from space or airborne platforms.
5. Conclusions
This study showed that functional VIs can identify differences in vegetation types that are strongly associated with soil type and landform and indicative of differences in physiological function and plant functional type. The study applied a relatively rare time series of CHRIS imagery at an acquisition frequency that captured variation in canopy dynamics both between and within major vegetation types and tree densities. Although the discrimination of known species-level differences in pigment dynamics and soil water access could not be detected with precision using the CHRIS data due to heterogeneous species mixtures and the patch-scale analysis applied, the potential for this with airborne sensors or new spaceborne hyperspectral sensors was clearly indicated. Although no explicit difference in photosynthetic function among deciduous canopies was detected in this study, nevertheless, the VIs sensitive to carotenoids, anthocyanins and photosynthetic efficiency can discriminate among species and landscape components when retrieved with better-quality sensors. In the meantime, Sentinel 2 with its additional bands in the pigment-sensitive wavelengths at a 20 m pixel resolution, may be used effectively for current monitoring. Although evergreen encroachment on rare oak savanna conservation lands may be easily monitored with leaf-off aerial photography, hyperspectral imagery can provide additional insights into the phenological behaviors that relate to physiological function and competitive advantage. This information could be helpful in the management and control of evergreen shrubs on bottomland areas [] that present a substantial challenge due to their competitive advantages over deciduous oaks and hardwoods in the leaf-off period.
Author Contributions
Conceptualization, M.J.H. and A.M.; methodology, M.J.H.; field observations and photos A.M. and M.J.H.; formal analysis, M.J.H., R.L. and C.N.; data curation, M.J.H.; writing—original draft preparation, M.J.H.; writing—review and editing, A.M.; project administration, A.M. and M.J.H.
Funding
The involvement of the senior author was partially supported by grants from NASA (Contract #NNX09AQ81G and #NNX10AH20G).
Acknowledgments
We thank the managers of GEWMA for providing access to the site for field observations. Tony Fillipi assisted with field work. Field work costs were covered by funds from Texas Agriculture Experiment Station, Texas A&M University to A.M.
Conflicts of Interest
The authors declare no conflict of interest. The funders had no role in the design of the study; in the collection, analyses, or interpretation of data; in the writing of the manuscript, or in the decision to publish the results.
References
- McPherson, G.R. Ecology and Management of North American Savannas; University of Arizona Press: Tuscon, AZ, USA, 1997; 208p. [Google Scholar]
- Srinath, I.; Millington, A.C. Evaluating the potential of the original Texas Land Survey for mapping historical land and vegetation cover. Land 2016, 5, 4. [Google Scholar] [CrossRef]
- Ludeke, K.; German, D.; Scott, J. Texas Vegetation Classification Project: Interpretive Booklet for Phase II. Texas Parks and Wildlife Department and Texas Natural Resources Information System. 2009. Available online: https://morap.missouri.edu/wp-content/uploads/2019/02/Texas_Vegetation_Classification_Phase_2_Interpretive_Booklet.pdf (accessed on 2 December 2009).
- Gould, F.W. Texas Plants. A Checklist and Ecological Summary; Texas Agriculture Experiment Station, Texas A&M University: College Station, TX, USA, 1962. [Google Scholar]
- Singhurst, J.R.; Cathy, J.C.; Prochaska, D.; Haucke, H.; Kroh, G.C.; Holmes, W. The vascular flora of Gus Engeling Wildlife Management Area, Anderson County, Texas. Southeast. Nat. 2009, 2, 347–368. [Google Scholar] [CrossRef]
- Smith, S. Eastern Red-Cedar: Positives, Negatives and Management; Samuel Roberts Noble Foundation: Ardmore, OK, USA, 2011; 8p. [Google Scholar]
- Barnsley, M.J.; Settle, J.J.; Cutter, M.A.; Lobb, D.R.; Teston, F. The PROBA/CHRIS mission: A low-cost smallsat for hyperspectral multiangle observations of the earth surface and atmosphere. IEEE Trans. Geosci. Remote Sens. 2004, 42, 1512–1520. [Google Scholar] [CrossRef]
- Barnsley, M.J.; Lewis, P.; O’Dwyer, S.; Disney, M.I.; Hobson, P.; Cutter, M.; Lobb, D. On the potential of CHRIS/PROBA for estimating vegetation canopy properties from space. Remote Sens. Rev. 2000, 19, 171–189. [Google Scholar] [CrossRef]
- Green, R.O.; Pavri, B.E.; Chrien, T.G. On-orbit radiometric and spectral calibration characteristics of EO-1 Hyperion derived with an underflight of AVIRIS and in situ measurements at Salar de Arizaro, Argentina. IEEE Trans. Geosci. Remote Sens. 2003, 41, 1194–1203. [Google Scholar] [CrossRef]
- Pearlman, J.S.; Barry, P.S.; Segal, C.C.; Shepanski, J.; Beiso, D.; Carman, S.L. Hyperion, a space-based imaging spectrometer. IEEE Trans. Geosci. Remote Sens. 2003, 41, 1160–1173. [Google Scholar] [CrossRef]
- Middleton, E.M.; Ungar, S.G.; Mandl, D.; Ong, L.; Frye, S.; Campbell, P.E.; Landis, D.R.; Young, J.P.; Pollack, N.H. The Earth Observing One (EO-1) satellite mission: Over a decade in space. IEEE J. Sel. Top. Appl. Earth Observ. Remote Sens. (JSTARS) 2013, 6, 243–256. [Google Scholar] [CrossRef]
- Duca, R.; Del Frate, F. Hyperspectral and multiangle CHRIS-PROBA images for the generation of land cover maps. IEEE Trans. Geosci. Remote Sens. 2008, 46, 2857–2866. [Google Scholar] [CrossRef]
- Stagakis, S.; Markos, N.; Sykioti, O.; Kyparissis, A. Monitoring canopy biophysical and biochemical parameters in ecosystem scale using satellite hyperspectral imagery: An application on a Phlomis fruticosa Mediterranean ecosystem using multiangular CHRIS/PROBA observations. Remote Sens. Environ. 2010, 114, 977–994. [Google Scholar] [CrossRef]
- Mousivand, A.; Menenti, M.; Gorte, B.; Verhoef, W. Multi-temporal, multi-sensor retrieval of terrestrial vegetation properties from spectral-directional radiometric data. Remote Sens. Environ. 2015, 158, 311–330. [Google Scholar] [CrossRef]
- Verrelst, J.; Romijn, E.; Kooistra, L. Mapping vegetation density in a heterogeneous river floodplain ecosystem using pointable CHRIS/PROBA data. Remote Sens. 2012, 4, 2866–2889. [Google Scholar] [CrossRef]
- García Millán, V.E.; Sánchez-Azofeifa, A.; Málvarez García, G.C.; Rivard, B. Quantifying tropical dry forest succession in the Americas using CHRIS/PROBA. Remote Sens. Environ. 2014, 144, 120–136. [Google Scholar] [CrossRef]
- Torbick, N.; Corbiere, M.A. Multiscale mapping assessment of Lake Champlain cyanobacterial harmful algal blooms. Int. J. Environ. Res. Public Health 2015, 12, 11560–11578. [Google Scholar] [CrossRef] [PubMed]
- Gürsoy, Ö.; Birdal, A.C.; Özyonar, F.; Kasaka, E. Determining and monitoring the water quality of Kizilirmak River of Turkey: First results. Int. Arch. Photogram. Remote Sens. Spat. Inf. Sci. 2015, 40, 1469–1474. [Google Scholar] [CrossRef]
- Tian, Y.; Guo, Z.Q.; Qiao, Y.C.; Lei, X.; Xie, F. Remote sensing of water quality monitoring in Guanting Reservoir. Shengtai Xuebao 2015, 35, 2217–2226. [Google Scholar] [CrossRef][Green Version]
- Latorre-Carmona, P.; Knyazikhin, Y.; Alonso, L.; Moreno, J.F.; Pla, F.; Yan, Y. On hyperspectral remote sensing of leaf biophysical constituents: Decoupling vegetation structure and leaf optics using CHRIS-PROBA data over crops in barrax. IEEE Geosci. Remote Sens. Lett. 2014, 11, 1579–1583. [Google Scholar] [CrossRef]
- Laurent, V.C.E.; Verhoef, W.; Clevers, J.G.P.W.; Schaepman, M.E. Inversion of a coupled canopy-atmosphere model using multi-angular top-of-atmosphere radiance data: A forest case study. Remote Sens. Environ. 2011, 115, 2603–2612. [Google Scholar] [CrossRef]
- Hilker, T.; Coops, N.C.; Hall, F.G.; Nichol, C.J.; Lyapustin, A.; Black, T.A.; Wulder, M.A.; Leuning, R.; Barr, A.; Hollinger, D.Y.; et al. Inferring terrestrial photosynthetic light use efficiency of temperate ecosystems from space. J. Geophys. Res. Biogeosci. 2011, 116, G03014. [Google Scholar] [CrossRef]
- Carmona, F.; Rivas, R.; Fonnegra, D.C. Vegetation index to estimate chlorophyll content from multispectral remote sensing data. Eur. J. Remote Sens. 2015, 48, 319–326. [Google Scholar] [CrossRef]
- Agapiou, A.; Hadjimitsis, D.G.; Alexakis, D.D. Evaluation of Broadband and Narrowband Vegetation Indices for the Identification of Archaeological Crop Marks. Remote Sens. 2012, 4, 3892–3919. [Google Scholar] [CrossRef]
- Datt, B. Remote sensing of chlorophyll a, chlorophyll b, chlorophyll a+b, and total carotenoid content in eucalyptus leaves. Remote Sens. Environ. 1998, 66, 111–121. [Google Scholar] [CrossRef]
- Gitelson, A.A.; Merzlyak, M.N.; Chivkunova, O.B. Optical Properties and Nondestructive Estimation of Anthocyanin Content in Plant Leaves. Photochem. Photobiol. 2001, 71, 38–45. [Google Scholar] [CrossRef]
- Gitelson, A.A.; Zur, Y.; Chivkunova, O.B.; Merzlyak, M.N. Assessing Carotenoid Content in Plant Leaves with Reflectance Spectroscopy. Photochem. Photobiol. 2002, 75, 272–281. [Google Scholar] [CrossRef]
- Filella, I.; Amaro, T.; Araus, J.L.; Peñuelas, J. Relationship between photosynthetic radiation-use efficiency of barley canopies and the photochemical reflectance index (PRI). Physiol. Plant. 1996, 96, 211–216. [Google Scholar] [CrossRef]
- Gamon, J.A.; Serrano, L.; Surfus, J.S. The photochemical reflectance index: An optical indicator of photosynthetic radiation use efficiency across species, functional types, and nutrient levels. Oecologia 1997, 112, 492–501. [Google Scholar] [CrossRef] [PubMed]
- Merzlyak, M.N.; Gitelson, A.A.; Chivkunova, O.B.; Rakitin, V.Y. Nondestructive optical detection of pigment changes during leaf senescence and fruit ripening. Physiol. Plant. 1999, 106, 135–141. [Google Scholar] [CrossRef]
- Peñuelas, J.; Filella, I.; Biel, C.; Serrano, L.; Savé, R. The reflectance at the 950–970 nm region as an indicator of plant water status. Int. J. Remote Sens. 1993, 14, 1887–1905. [Google Scholar] [CrossRef]
- Guerschman, J.-P.; Hill, M.J.; Barrett, D.J.; Renzullo, L.; Marks, A.; Botha, E. Estimating fractional cover of photosynthetic vegetation, non-photosynthetic vegetation and soil in mixed tree-grass vegetation using the EO-1 and MODIS sensors. Remote Sens. Environ. 2009, 113, 928–945. [Google Scholar] [CrossRef]
- Hill, M.J.; Renzullo, L.J.; Guerschman, J.P.; Marks, A.S.; Barrett, D.J. Use of vegetation index “fingerprints” from Hyperion data to characterize vegetation states within land cover/land use types in an Australian tropical savanna. IEEE J. Sel. Top. Appl. Earth Observ. Remote Sens. (JSTARS) 2013, 6, 309–319. [Google Scholar] [CrossRef]
- Hill, M.J. Vegetation index suites as indicators of vegetation state in grassland and savanna: An analysis with simulated SENTINEL 2 data for a North American transect. Remote Sens. Environ. 2013, 137, 94–111. [Google Scholar] [CrossRef]
- Haucke, H.; Prochaska, D. Management Plan for Gus Engeling Research and Demonstration Area; Texas Parks and Wildlife Department: Austin, TX, USA, 1998; 22p.
- Alonso, L.; Gómez-Chova, L.; Moreno, J.; Guanter, L.; Brockmann, C.; Fomferra, N.; Quast, R.; Regner, P. CHRIS/PROBA Toolbox for hyperspectral and multiangular data exploitations. In Proceedings of the 2009 IEEE International Geoscience and Remote Sensing Symposium, University of Cape Town, Cape Town, South Africa, 12–17 July 2009; Volume 2, p. II-202. [Google Scholar] [CrossRef]
- Fomferra, N.; Brockmann, C. BEAM—The ENVISAT MERIS and AATSR toolbox. In Proceedings of the MERIS (A)ATSR Workshop 2005, Frascati, Italy, 26–30 September 2005; 3p. [Google Scholar]
- Guanter, L.; Alonso, L.; Gomez-Chova, L.; Moreno, J. PROBA/CHRIS Atmospheric Correction Module Algorithm Theoretical Basis Document; Contract No. 20442/07/I-LG; ESA ESRIN: Frascati, Italy, 2008; 27p. [Google Scholar]
- Berk, A.; Anderson, G.P.; Acharya, P.K.; Hoke, M.L.; Chetwynd, J.H.; Bernstein, L.S.; Shettle, E.P.; Matthew, M.W.; Adler-Golden, S.M. MODTRAN4 Version 3 Revision 1 User’s Manual; Technical Report; Air Force Research Laboratory: Hanscom Air Force Base, MA, USA, 2003; 91p.
- Tucker, C.J. Red and photographic infrared linear combinations for monitoring vegetation. Remote Sens. Environ. 1979, 8, 127–150. [Google Scholar] [CrossRef]
- Cutter, M. CHRIS Data Format; Surrey Satellite Technology: Guildford, UK, 2008; 37p. [Google Scholar]
- Moy, A.; Le, S.; Verhoeven, A. Different strategies for photoprotection during autumn senescence in maple and oak. Physiol. Plant. 2015, 155, 205–216. [Google Scholar] [CrossRef] [PubMed]
- Lee, D.W.; O’Keefe, J.; Holbrook, N.M.; Field, T.S. Pigment dynamics and autumn leaf senescence in a New England deciduous forest, eastern USA. Ecol. Res. 2003, 18, 677–694. [Google Scholar] [CrossRef]
- Keskitalo, J.; Bergquist, G.; Gardeström, P.; Jansson, S. A cellular timetable of autumn senescence. Plant Phys. 2005, 139, 1635–1648. [Google Scholar] [CrossRef] [PubMed]
- García-Plazaola, J.I.; Hernández, A.; Becerril, J.M. Antioxidant and pigment composition during autumnal leaf senescence in woody deciduous species differing in their ecological traits. Plant Biol. 2003, 5, 557–566. [Google Scholar] [CrossRef]
- Abrams, M.D. Adaptations and responses to drought in Quercus species of North America. Tree Phys. 1990, 7, 227–238. [Google Scholar] [CrossRef]
- Donovan, L.A.; West, J.B.; McLeod, K.W. Quercus species differ in water and nutrient characteristics in a resource-limited fall-line sandhill habitat. Tree Phys. 2000, 20, 929–936. [Google Scholar] [CrossRef]
- Ratajczak, Z.; Nippert, J.B.; Collins, S.L. Woody encroachment decreases diversity across North American grasslands and savannas. Ecology 2012, 93, 697–703. [Google Scholar] [CrossRef]
- Hinckley, T.M.; Dougherty, P.M.; Lassoie, J.P.; Roberts, J.E.; Teskey, R.O. A severe drought: Impact on tree growth, phenology, net photosynthetic rate and water relations. Am. Midland Nat. 1979, 102, 307–316. Available online: https://www.jstor.org/stable/2424658 (accessed on 15 August 2019). [CrossRef]
- Ginter-Whitehouse, D.L.; Hinckley, T.M.; Pallardy, S.G. Spatial and temporal aspects of water relations of three tree species with different vascular anatomy. For. Sci. 1983, 29, 317–329. [Google Scholar]
- Caterina, G.L.; Will, R.E.; Turton, D.J.; Wilson, D.S.; Zou, C.B. Water use of Juniperus virginiana trees encroached into mesic prairies in Oklahoma, USA. Ecohydrology 2014, 7, 1124–1134. [Google Scholar] [CrossRef]
- Eggemeyer, K.D.; Awada, T.; Harvey, F.E.; Wedin, D.A.; Zhou, X.; Zanner, C.W. Seasonal changes in depth of water uptake for encroaching trees Juniperus virginiana and Pinus ponderosa and two dominant C4 grasses in a semiarid grassland. Tree Phys. 2009, 29, 157–169. [Google Scholar] [CrossRef] [PubMed]
- DeSantis, R.D.; Hallgren, S.W.; Lynch, T.B.; Burton, J.A.; Palmer, M.W. Long-term directional changes in upland Quercus forests throughout Oklahoma, USA. J. Veg. Sci. 2010, 21, 606–615. [Google Scholar] [CrossRef]
- Chastain, R.A., Jr.; Struckhoff, M.A.; He, H.S.; Larsen, D.R. Mapping Vegetation Communities Using Statistical Data Fusion in the Ozark National Scenic Riverways, Missouri, USA. Photogramm. Eng. Remote Sens. 2008, 74, 247–264. [Google Scholar] [CrossRef]
- Asbjornsen, H.; Brudvig, L.A.; Mabry, C.M.; Evans, C.W.; Karnitz, H.M. Defining reference information for restoring ecologically rare tallgrass oak savannas in the Midwestern United States. J. For. 2005, 103, 345–350. [Google Scholar] [CrossRef]
- Grundel, R.; Pavlovic, N.B. Using conservation value to assess land restoration and management alternatives across a degraded oak savanna landscape. J. Appl. Ecol. 2008, 45, 315–324. [Google Scholar] [CrossRef]
- Chen, Q.; Baldocchi, D.; Gong, P.; Kelly, M. Isolating individual trees in a savanna woodland using small footprint LiDAR data. Photogram. Eng. Remote Sens. 2006, 72, 923–932. [Google Scholar] [CrossRef]
- Asner, G.P.; Jones, M.O.; Martin, R.E.; Knapp, D.E.; Hughes, R.F. Remote sensing of native and invasive species in Hawaiian forests. Remote Sens. Environ. 2008, 112, 1912–1926. [Google Scholar] [CrossRef]
- Asner, G.P.; Martin, R.E.; Anderson, C.B.; Knapp, D.E. Quantifying forest canopy traits: Imaging spectroscopy versus field survey. Remote Sens. Environ. 2015, 158, 15–27. [Google Scholar] [CrossRef]
- Feilhauer, H.; Asner, G.P.; Martin, R.E. Multi-method ensemble selection of spectral bands related to leaf biochemistry. Remote Sens. Environ. 2015, 164, 57–65. [Google Scholar] [CrossRef]
- Chadwick, K.; Asner, G. Organismic-scale remote sensing of canopy foliar traits in lowland tropical forests. Remote Sens. 2016, 8, 87. [Google Scholar] [CrossRef]
- McManus, K.; Asner, G.; Martin, R.; Dexter, K.; Kress, W.; Field, C. Phylogenetic structure of foliar spectral traits in tropical forest canopies. Remote Sens. 2016, 8, 196. [Google Scholar] [CrossRef]
- Mitchell, R.; Cathey, J.C.; Drabbert, B.; Prochaska, D.; Dupree, S.; Sosebee, R. Managing Yaupon with fire and herbicodes in the Texas post oak savannah. Rangelands 2005, 27, 17–19. [Google Scholar] [CrossRef]
© 2019 by the authors. Licensee MDPI, Basel, Switzerland. This article is an open access article distributed under the terms and conditions of the Creative Commons Attribution (CC BY) license (http://creativecommons.org/licenses/by/4.0/).