Article

Rapid Detection of Windthrows Using Sentinel-1 C-Band SAR Data

1
Department of Land Change Science, Swiss Federal Institute for Forest, Snow and Landscape Research WSL, Zürcherstrasse 111, 8903 Birmensdorf, Switzerland
2
Remote Sensing Laboratories (RSL), University of Zürich, Winterthurerstrasse 190, 8057 Zürich, Switzerland
*
Author to whom correspondence should be addressed.
Remote Sens. 2019, 11(2), 115; https://doi.org/10.3390/rs11020115
Submission received: 8 November 2018 / Revised: 20 December 2018 / Accepted: 4 January 2019 / Published: 10 January 2019
(This article belongs to the Special Issue Dense Image Time Series Analysis for Ecosystem Monitoring)

Abstract

:
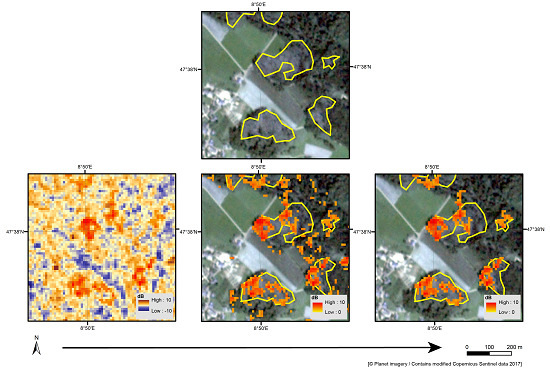
Storm events are capable of causing windthrow to large forest areas. A rapid detection of the spatial distribution of the windthrown areas is crucial for forest managers to help them direct their limited resources. Since synthetic aperture radar (SAR) data is acquired largely independent of daylight or weather conditions, SAR sensors can produce temporally consistent and reliable data with a high revisit rate. In the present study, a straightforward approach was developed that uses Sentinel-1 (S-1) C-band VV and VH polarisation data for a rapid windthrow detection in mixed temperate forests for two study areas in Switzerland and northern Germany. First, several S-1 acquisitions of approximately 10 before and 30 days after the storm event were radiometrically terrain corrected. Second, based on these S-1 acquisitions, a SAR composite image of before and after the storm was generated. Subsequently, after analysing the differences in backscatter between before and after the storm within windthrown and intact forest areas, a change detection method was developed to suggest potential locations of windthrown areas of a minimum extent of 0.5 ha—as is required by the forest management. The detection is based on two user-defined parameters. While the results from the independent study area in Germany indicated that the method is very promising for detecting areal windthrow with a producer’s accuracy of 0.88, its performance was less satisfactory at detecting scattered windthrown trees. Moreover, the rate of false positives was low, with a user’s accuracy of 0.85 for (combined) areal and scattered windthrown areas. These results underscore that C-band backscatter data have great potential to rapidly detect the locations of windthrow in mixed temperate forests within a short time (approx. two weeks) after a storm event. Furthermore, the two adjustable parameters allow a flexible application of the method tailored to the user’s needs.

Graphical Abstract

1. Introduction

Storm events with strong wind gusts can cause severe windthrows to large forest areas—their immediate assessment is crucial for several reasons. Although windthrow is a significant natural phenomenon in forests, it causes direct economic losses for forestry, which may be heightened by fungal infestation of the windthrown trunks [1]. Bark beetle dispersal should be anticipated to protect the remaining standing trees and prevent subsequent indirect economic losses [2,3]. Thus, foresters aim to immediately clear up windthrown areas and plan an adapted reforestation [4]. Since resources of manpower are generally limited, both the extent and degree of the affected forest area and its accessibility must be known shortly after the storm. In recent years, extreme storm events have regularly hit central Europe; their frequency is expected to increase in the future due to a changing climate [5,6]. Usually, a first rough overview of windthrown areas is obtained by field surveys or by the interpretation of aerial imagery (airplane and unmanned aerial vehicle (UAV)). As both methods are time consuming and therefore costly, and field surveys are often restricted due to security concerns, there is an increasing need for faster and more efficient methods.
Remote sensing is continually evolving to offer efficient tools to obtain the required information more quickly (compared to the methods mentioned above), objectively, and over large areas. Depending on the size of the area of interest, the detection of windthrows is mainly carried out using data either from optical sensors, airborne laser scanning (ALS), or synthetic aperture radar (SAR). Both spaceborne and airborne imagery with varying spatial resolutions have been used for windthrow detection. Landsat imagery with a spatial resolution of 30 m was mainly used for relatively generalised mapping of windthrows over large areas [7,8,9]. More detailed detections of windthrows were obtained by Elatawneh et al. [10] and Einzmann et al. [11] based on RapidEye imagery with a spatial resolution of 5 m and change detection techniques. Several studies showed good single windthrown tree detection rates using high spatial resolution imagery from airplanes or UAVs [12,13,14]. A common critical shortcoming of optical imagery is its dependence on daylight and cloud-free conditions, which usually is not to be expected immediately after a storm event. For example, Elatawneh et al. [10] reported on latencies of six weeks to obtain cloud-free imagery. These uncertainties regarding data availability diminishes their applicability in the framework of fast response. Promising and even more advantageous results were reported using approaches based on ALS data [15,16]. A great benefit of ALS data is the feasibility to detect single windthrown trees that were covered by the canopies of intact foliage. The disadvantages are relatively high cost and its usually limited applicability over larger areas.
Great potential is given by the use of SAR data, since they are acquired virtually independently of daylight and cloud cover. Active remote sensing techniques, such as SAR, can provide reliable and consistent data at different scales with a high temporal resolution [17]. Employing SAR data is therefore becoming indispensable in the framework of fast response. Generally, SAR backscatter from forested areas has been reported to be dependent on object and a few sensor properties, such as frequency (X-, C-, L-band) and polarisation, e.g., co-polarised horizontal-horizontal (HH) and vertical-vertical (VV), and the cross-polarised vertical-horizontal (VH) and horizontal-vertical (HV). If a higher frequency, e.g., C-band, is used, then the microwave energy is mainly scattered back to the sensor from the upper tree crown and less from beneath. In contrast, more backscatter information is obtained from beneath if lower frequencies are used (e.g., L-band), as stronger penetration into the canopy is observed [18]. The effect of the polarisation is less distinct, but cross-polarised (VH or HV) backscatter generally shows higher correlation with biomass than co-polarised channels [19]. Object properties that might affect backscatter from forested areas can be separated into two categories. The first consists of properties that directly affect the dielectric constant of the trees, specifically the wood’s temperature [20], especially when below the freezing point [21], and the internal and external moisture conditions [22,23]. Particularly, wet snow impacts backscatter to a great extent [24]. The second comprises structural properties of a forest, such as the size, orientation, and spatial pattern of trees as a whole, but also of their branches and leaves [25,26,27]. In addition, Ahern et al. [28] and Rüetschi et al. [29] reported on a distinct impact of phenological changes in foliage on backscatter in broadleaved forests. Thus, SAR backscatter can be used to detect major changes in forest structure, e.g., as caused by windthrows.
In the past, only few studies have addressed this topic. For example, Green [30] used airborne AIRSAR data to show the impact of windthrown areas on L- and C-band backscatter. Fransson et al. [31] found a significant difference in CARABAS-II VHF backscatter between intact and windthrown areas at a spatial resolution of 2.5 m. In addition to these studies using airborne sensors, spaceborne SARs have been successfully applied to detect windthrows. The AIRSAR-based findings of Green [30] were supported and extended in the studies of Eriksson et al. [32] and Thiele et al. [33]—they reported on a sensitivity of HH backscatter to windthrown areas in ALOS PALSAR L-band, RADARSAT-2 C-band, and TerraSAR-X X-band data. The post-event increase in backscatter within windthrown areas in C-band was partly attributed to the increased surface roughness [32]. Ulander et al. [34] tested different spatial resolutions between 10 and 30 m from RADARSAT-1 and ENVISAT-ASAR C-band data to detect windthrows. They concluded that the spatial resolution of 30 m from ASAR data using Image Mode Precision (IMP) and Alternating Polarisation Precision (APP) products was not sufficient. In contrast, windthrown areas were partly detected using 10 m spatial resolution RADARSAT-1 HH data acquired in fine mode. Only recently, a threshold-based approach using ALOS PALSAR L-band data enabled the successful detection of windthrows [35]. The potential for an immediate detection of windthrows has gained currency with Sentinel-1 (S-1) C-band data, which provide a spatial resolution similar to RADARSAT-1 but with improved radiometric stability and a user-friendly free and open data policy [36].
In the present study, the potential of S-1 backscatter data to detect the locations of windthrows was evaluated in the framework of fast response. For this appraisal, we considered two study areas in Switzerland and northern Germany that were hit by two different storm events. The study areas differ regarding topography, climate, forest structure, tree species composition, and forest management. In a first step, temporal composites that include several S-1 acquisitions were generated for close time periods before and after the storm events. In a second step, for the study area in Switzerland, differences in backscatter before and after the storm event and between windthrown and intact forest areas were analysed. In a third step, in the same study area, a change detection method consisting of two parameters was developed and trained to detect windthrows with a minimum size of 0.5 ha. With our method, we were able to rapidly detect the locations of windthrown areas. Since it is not possible to determine their exact boundary, no quantitative use of area estimates is intended. The same method was applied to the German study area and then validated. Finally, the use of different numbers of S-1 acquisitions and their influence on the correct detection of windthrows was determined, and the required minimum latency for acquisitions after a storm event was assessed.

2. Materials and Methods

2.1. Study Areas

Two study areas in central Europe were examined to develop and validate our rapid windthrow detection method. Both study areas are characterised by mixed temperate forest stands that were windthrow-affected by two independent storm events.

2.1.1. Swiss Study Area (SE of Schaffhausen, Switzerland): CH

To develop our method, we selected a study area with windthrows in the north of Switzerland southeast of Schaffhausen, as shown in Figure 1. The forested area has a size of approximately 8 km2 and the forest is mainly composed of Norway spruce (Picea abies) and European beech (Fagus sylvatica). The topography of the area is flat in the SW and hillier in the NE, with elevations ranging from 417 to 640 m a.s.l.
The windthrows were caused by a local downburst in the night between 1–2 August 2017. Wind speeds of 170 km/h caused severe damage on infrastructure and windthrow in the region’s forests [37]. The windthrows in the forest consisted of many scattered single windthrown trees but also areal windthrow. Both uprooted and broken trees were observed.

2.1.2. German Study Area (East of Lüneburg, Germany): DE

After developing the method based on the Swiss data, its applicability and transferability were tested in another study area with windthrows in northern Germany east of Lüneburg (Figure 1). Aerial images were available for approximately 125 km2 of the forest area. The validation study area was about 15 times larger than the Swiss study area. The main tree species are European beech (Fagus sylvatica), European oak (Quercus robur), and Scots pine (Pinus sylvestris). The topography is flat, with elevations ranging from 19 to 66 m.a.s.l.
The storm event Xavier on 5 October 2017 with wind speeds up to 117 km/h caused widespread damage in northern Germany [38]. The study area was strongly affected, resulting mainly in scattered single windthrown trees, but also a few areal windthrows.

2.2. Data

To detect windthrows, we used Sentinel-1 C-band SAR data acquired at VV and VH polarisation. Table A1 in Appendix A lists the Interferometric Wide swath (IW) Ground Range Detected High Resolution (GRDH) products that were used. In IW mode, S-1 acquires data at nominal incident angles between 31° and 46°, with a swath width of 250 km [36]. GRDH products have a pixel spacing of 10 m; the geolocation accuracy has been shown to be well within the product specification of 7 m [39].
Five S-1 acquisitions before the event and ten after the storm were used for both study areas. For the study area CH, we chose pre- and post-storm timespans of 20 June 2017–1 August 2017 and 3–31 August 2017, respectively. Both timespans included S-1 acquisitions from both pass directions ascending and descending. This can also be stated for the pre- and post-storm timespans of the study area DE with the chosen periods 25 September 2017–4 October 2017 and 6–28 October 2017, respectively. We used a maximum of ten acquisitions after the storm event, as we decided that further latency (more than four weeks) would not conform to the fast response framework and would increase the probability of contamination from already started clean-up in the forest. Moreover, after approx. four weeks, the chances of being able to acquire cloud-free optical imagery, which can offer spatial resolution and spectral information superior to SAR data, substantially increase.
Digital terrain models (DTM) of both study areas were required to process the SAR acquisitions. For the study area CH, a DTM with a spatial resolution of 2 m [40] was averaged to 10 m ground sample distance to match the pixel spacing of the SAR acquisitions. As no comparable DTM was available for the second study area, a digital surface model (DSM) was used that offered a spatial resolution of 25 m [41]. The DSM for the study area DE was resampled through bilinear interpolation to 10 m. The upsampling of the DSM of the second study area was deemed as unproblematic due to the flat topography in the region.
Reference data was obtained from orthoimage interpretation and field surveys. Orthoimages for both study areas were available shortly after the respective storm. Planet imagery provided two cloud-free orthoimages from 30 July 2017 (before) and 14 August 2017 (after the storm event) for the study area CH, with the four spectral bands blue, green, red, and NIR at a spatial resolution of 3.125 m [42]. For the study area CH, windthrown forest areas were investigated in a two-stage procedure. First, clearly detectable windthrown areas were delineated by an image interpreter, as shown in Figure 2a. Second, to guarantee high quality reference data, each of these delineations were then visited in the field and validated with local foresters. In accordance with foresters, we decided to only consider windthrown areas with a minimum size of 0.5 ha, deeming it reasonable for forest management. This resulted in a total of 26 reference windthrown areas of various sizes, summarised in Table 1, according to their extent.
For the study area DE, reference windthrown areas, obtained from aerial image interpretation and validated in field surveys, were provided by the department of forestry of Mecklenburg-Vorpommern. The aerial images were acquired between 16 October 2017 and 29 October 2017 with a Nikon D300 camera at a flight height of approximately 800 m with a spatial resolution of 12 cm. The reference data consist of polygons of windthrow areas. The high spatial resolution of the aerial imagery enabled a further subdivision into three categories that were based on estimations of the number of windthrown trees in the indicated area. The categories were (a) single windthrown trees (1–50% windthrown trees), (b) single standing trees (51–90% windthrown trees), and (c) areal windthrows (>90% windthrown trees). An example for the category ‘areal windthrow’ is shown in Figure 2b. As in the study area CH, only windthrown areas larger than 0.5 ha were considered, resulting in a total of 250 reference areas (see Table 2). Finally, the reference datasets of both study areas were converted into a grid with a spatial resolution of 10 m [43].
Current forest masks of both study areas were required to separate the forested from built-up and agricultural areas. For the study area CH, a vegetation height model with a spatial resolution of 10 m was available [44]. We defined the forest mask as all the pixels with vegetation higher than 3 m, according to the forest definition of the Swiss national forest inventory. For the study area DE, the department of forestry of Mecklenburg-Vorpommern provided a vector forest mask, which was rasterised to a 10 × 10 m grid for use in the study [43].

2.3. Methods

2.3.1. SAR Data Processing

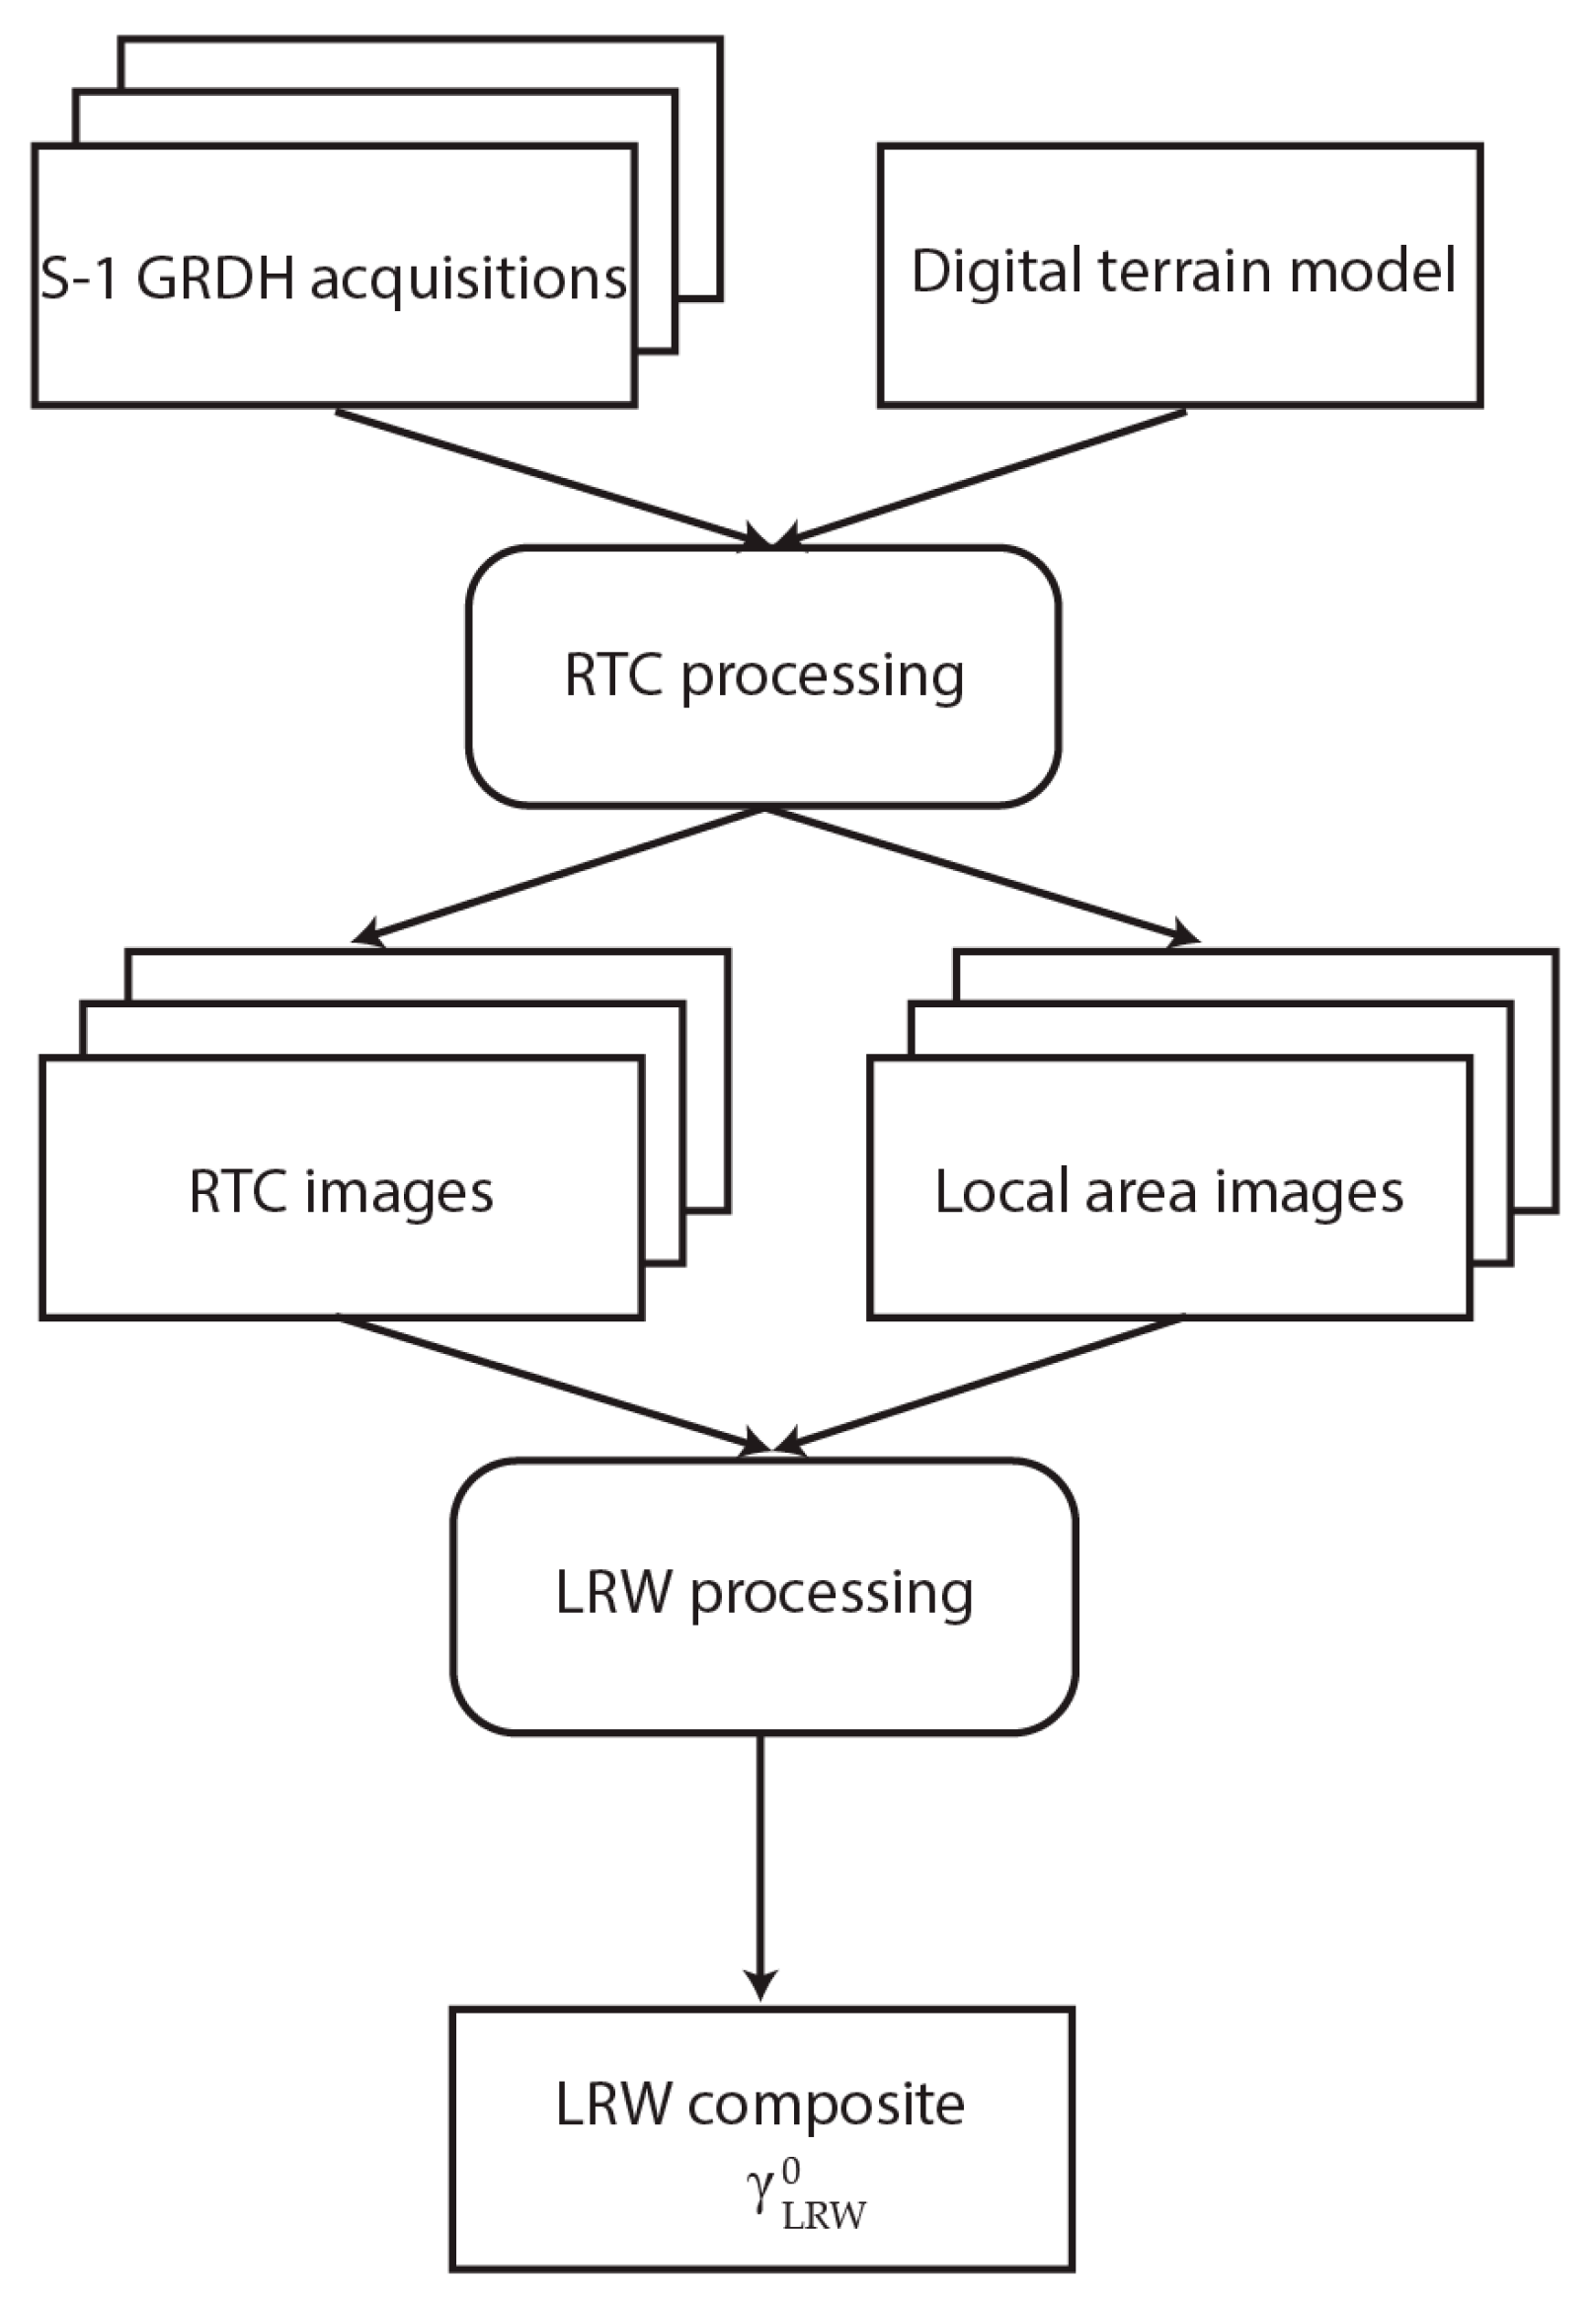
All S-1 acquisitions that are listed in Table A1 of both polarisations VV and VH were processed in two main steps, as shown in Figure 3. First, they were radiometrically calibrated and terrain-geocoded based on the methodology of Small [45]. The radiometric terrain correction (RTC) methodology flattens the backscatter values: both the geometry and radiometry of the scene is corrected for terrain-effects. The approach normalises backscatter using the modelled local illuminated area based on a DTM rather than a modelled local incident angle based on an ellipsoid. As a result, the influence of the topography on the SAR acquisition is mitigated, producing RTC images that are more easily interpreted, at a ground sample distance of 10 m. As a side product, the local illuminated area was also output. The sets of RTC and area images were next combined in a second processing stage.
In the second stage, a temporal compositing was conducted to enhance spatial resolution, reduce noise, and mitigate the influence of speckle and viewing geometry [46]. This local resolution weighting (LRW) methodology merges all available RTC images from a specific time period into a single composite backscatter product. The local spatial resolution of an RTC image is reciprocally proportional to the local illuminated area. Therefore, the local illuminated area output of the first processing step defines the contribution of each RTC image to each pixel. For the main analysis within both study areas, we chose LRW processing time periods that included five acquisitions from before or after the storm. Hence, all resulting γ LRW 0 composites contained information from acquisitions that were made in both ascending and descending pass directions. As the S-1 revisit time was slightly shorter in the study area DE, its time periods were only 10 and 11 days for before and after the storm, as compared to the 13 days for both timespans in the study area CH.

2.3.2. Image Differencing & Calculation of Statistics

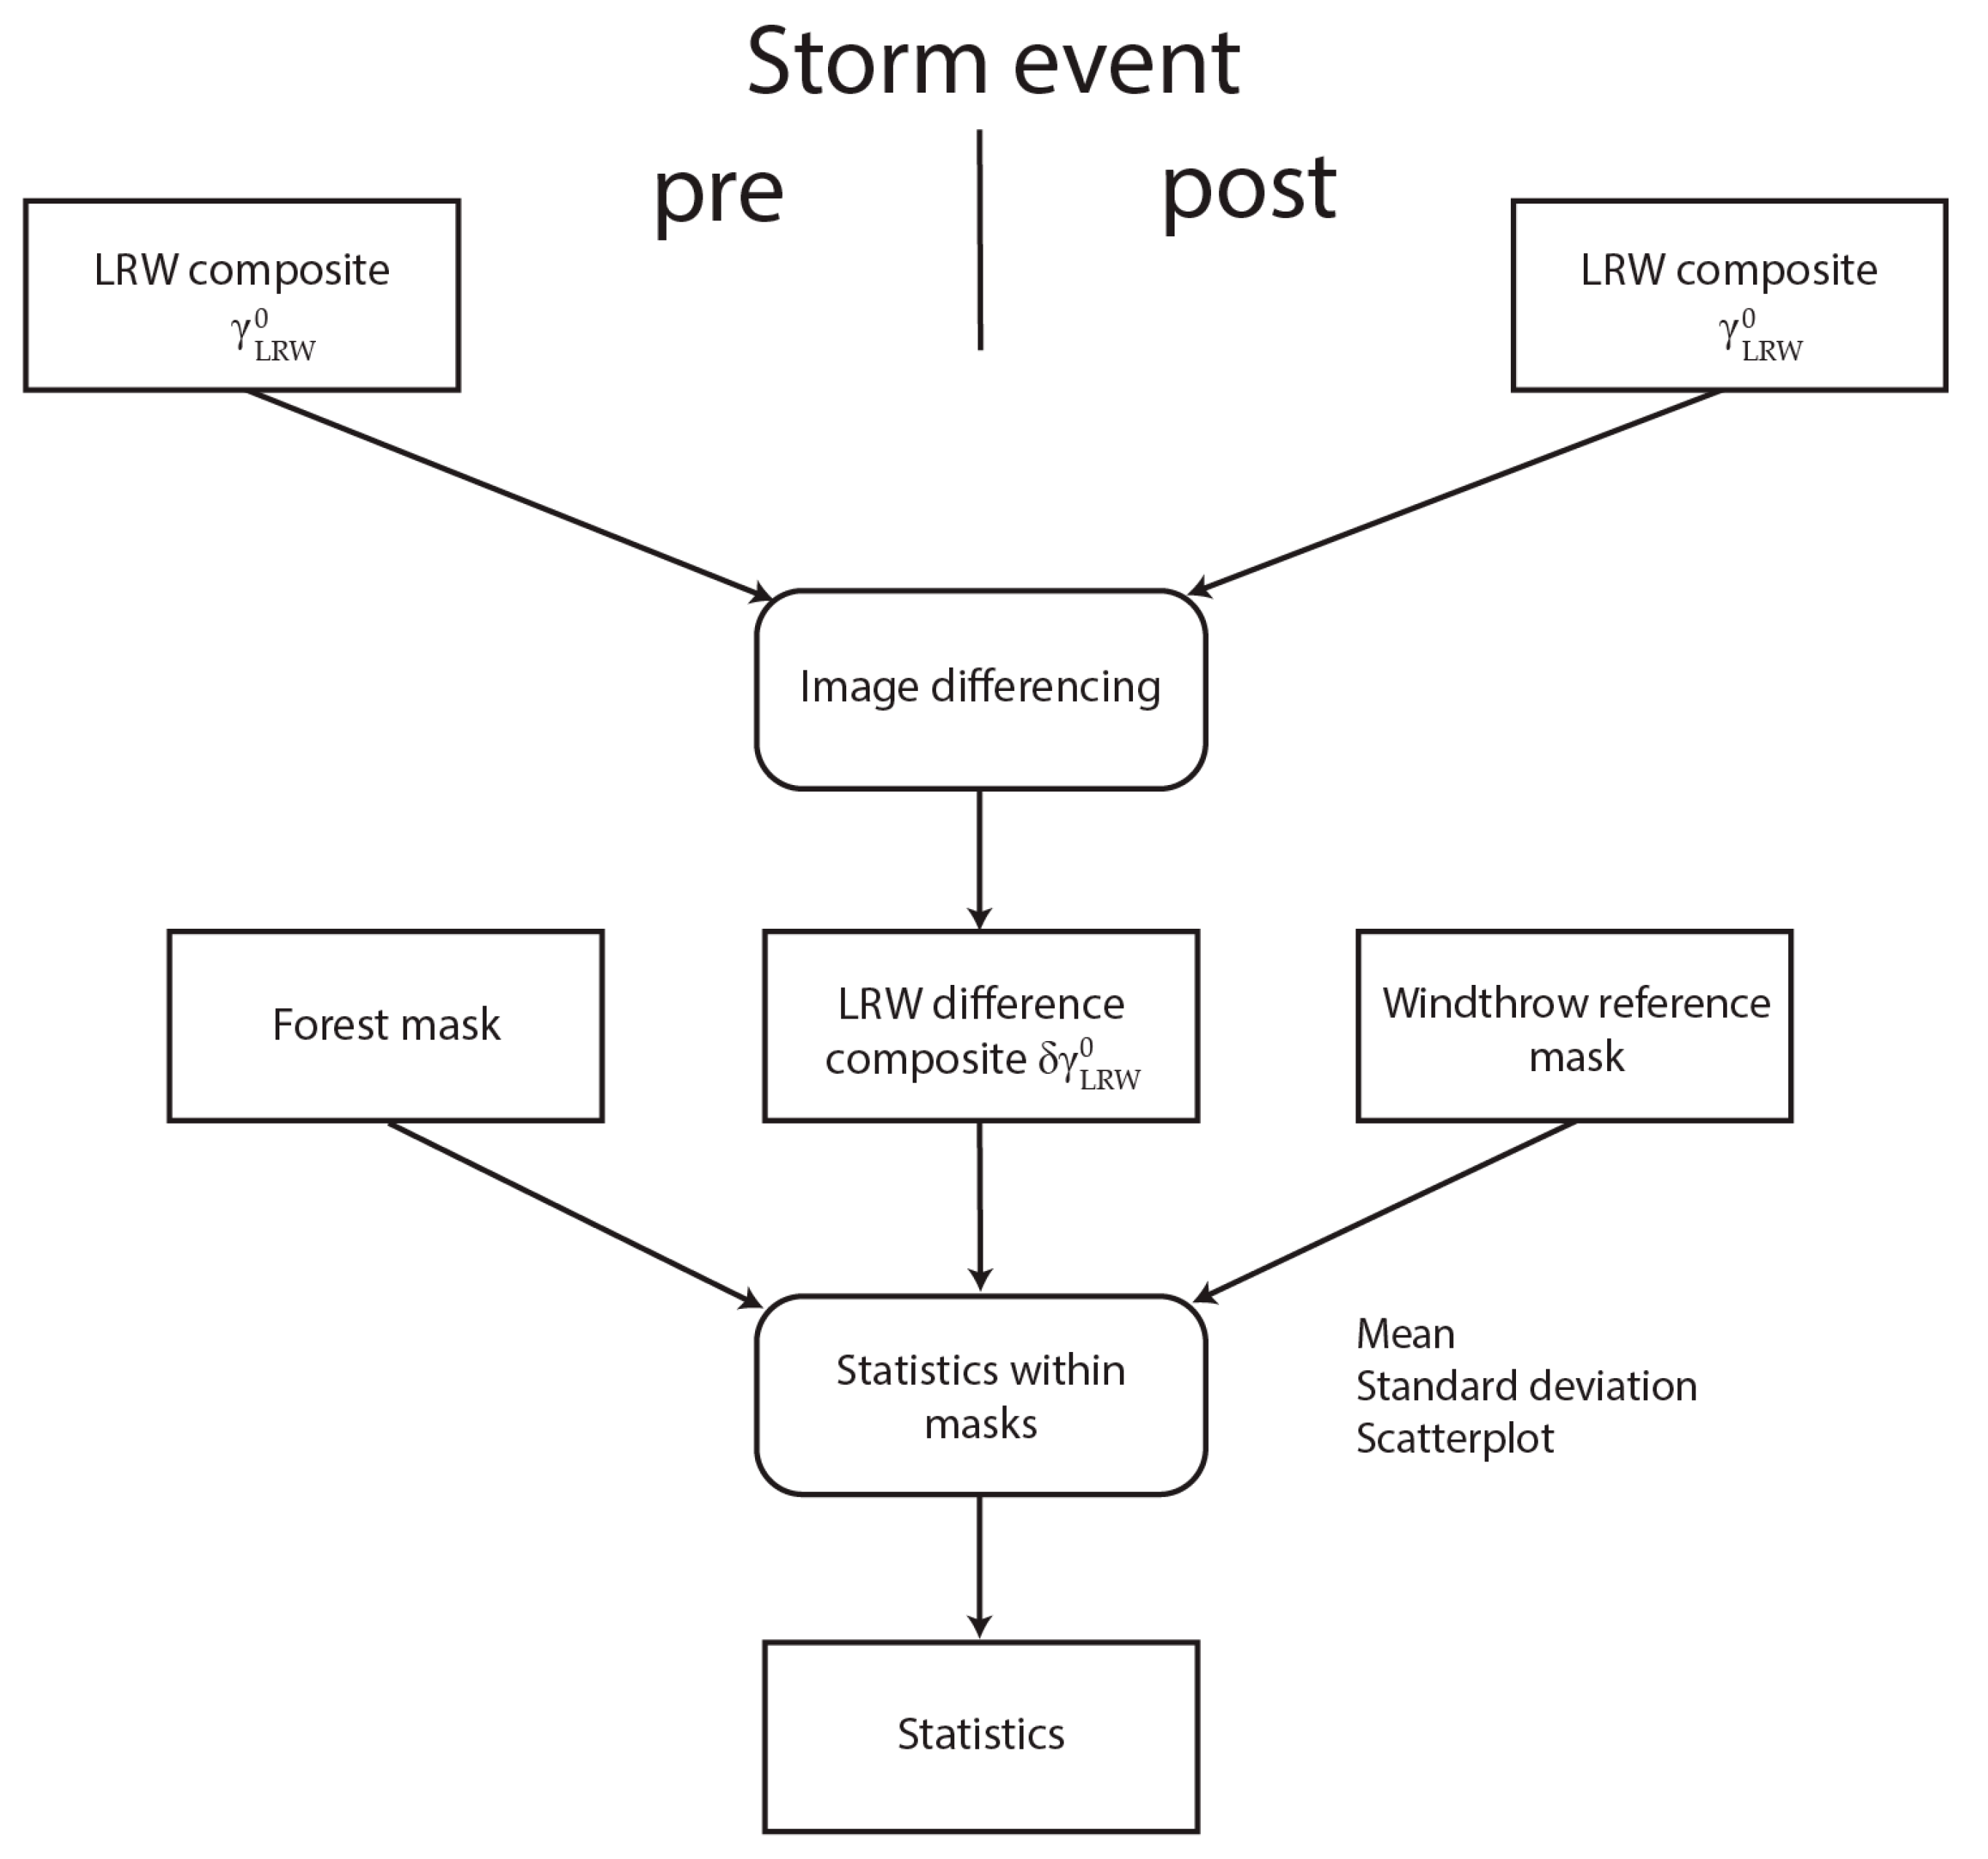
To study typical changes in SAR backscatter behaviour in windthrow-affected forest areas, backscatter differences were analysed between γ LRW 0 composites calculated based on data before vs. after the storm event in the study area CH. To analyse the differences, the simple change detection method ‘image differencing’ [47,48] was applied to the two γ LRW 0 composites from before and after the storm event (Figure 4). In the process, the difference composites were calculated for both VV and VH polarisations in the following manner:
δ γ LRW , VV 0 = γ LRW , VV , t 2 ( post ) 0 γ LRW , VV , t 1 ( pre ) 0
δ γ LRW , VH 0 = γ LRW , VH , t 2 ( post ) 0 γ LRW , VH , t 1 ( pre ) 0
Subsequently, the mean and standard deviation were calculated for the difference composites. This was done for all the pixels within the forest mask as well as only within the windthrow reference mask to gain an idea of the difference between the two. Scatterplots comparing the backscatter before and after the storm event were generated. The first results indicated much higher backscatter from the windthrown areas after the storm event as compared to the mainly intact forest areas. This was observed as higher mean values for the windthrown areas in both polarisations. More detailed results on this are presented in Section 3.1.

2.3.3. Detection Method

Based on our observations, supported by the findings of Eriksson et al. [32], we developed a heuristic windthrow index (WI) for the rapid detection of windthrows after a storm event. The index is principally based on γ LRW 0 composite differences of VV and VH backscatter, as we observed higher backscatter in windthrown areas after the storm in both polarisations.
WI = ( γ LRW , VV , t 2 ( post ) 0 γ LRW , VV , t 1 ( pre ) 0 ) + ( γ LRW , VH , t 2 ( post ) 0 γ LRW , VH , t 1 ( pre ) 0 )
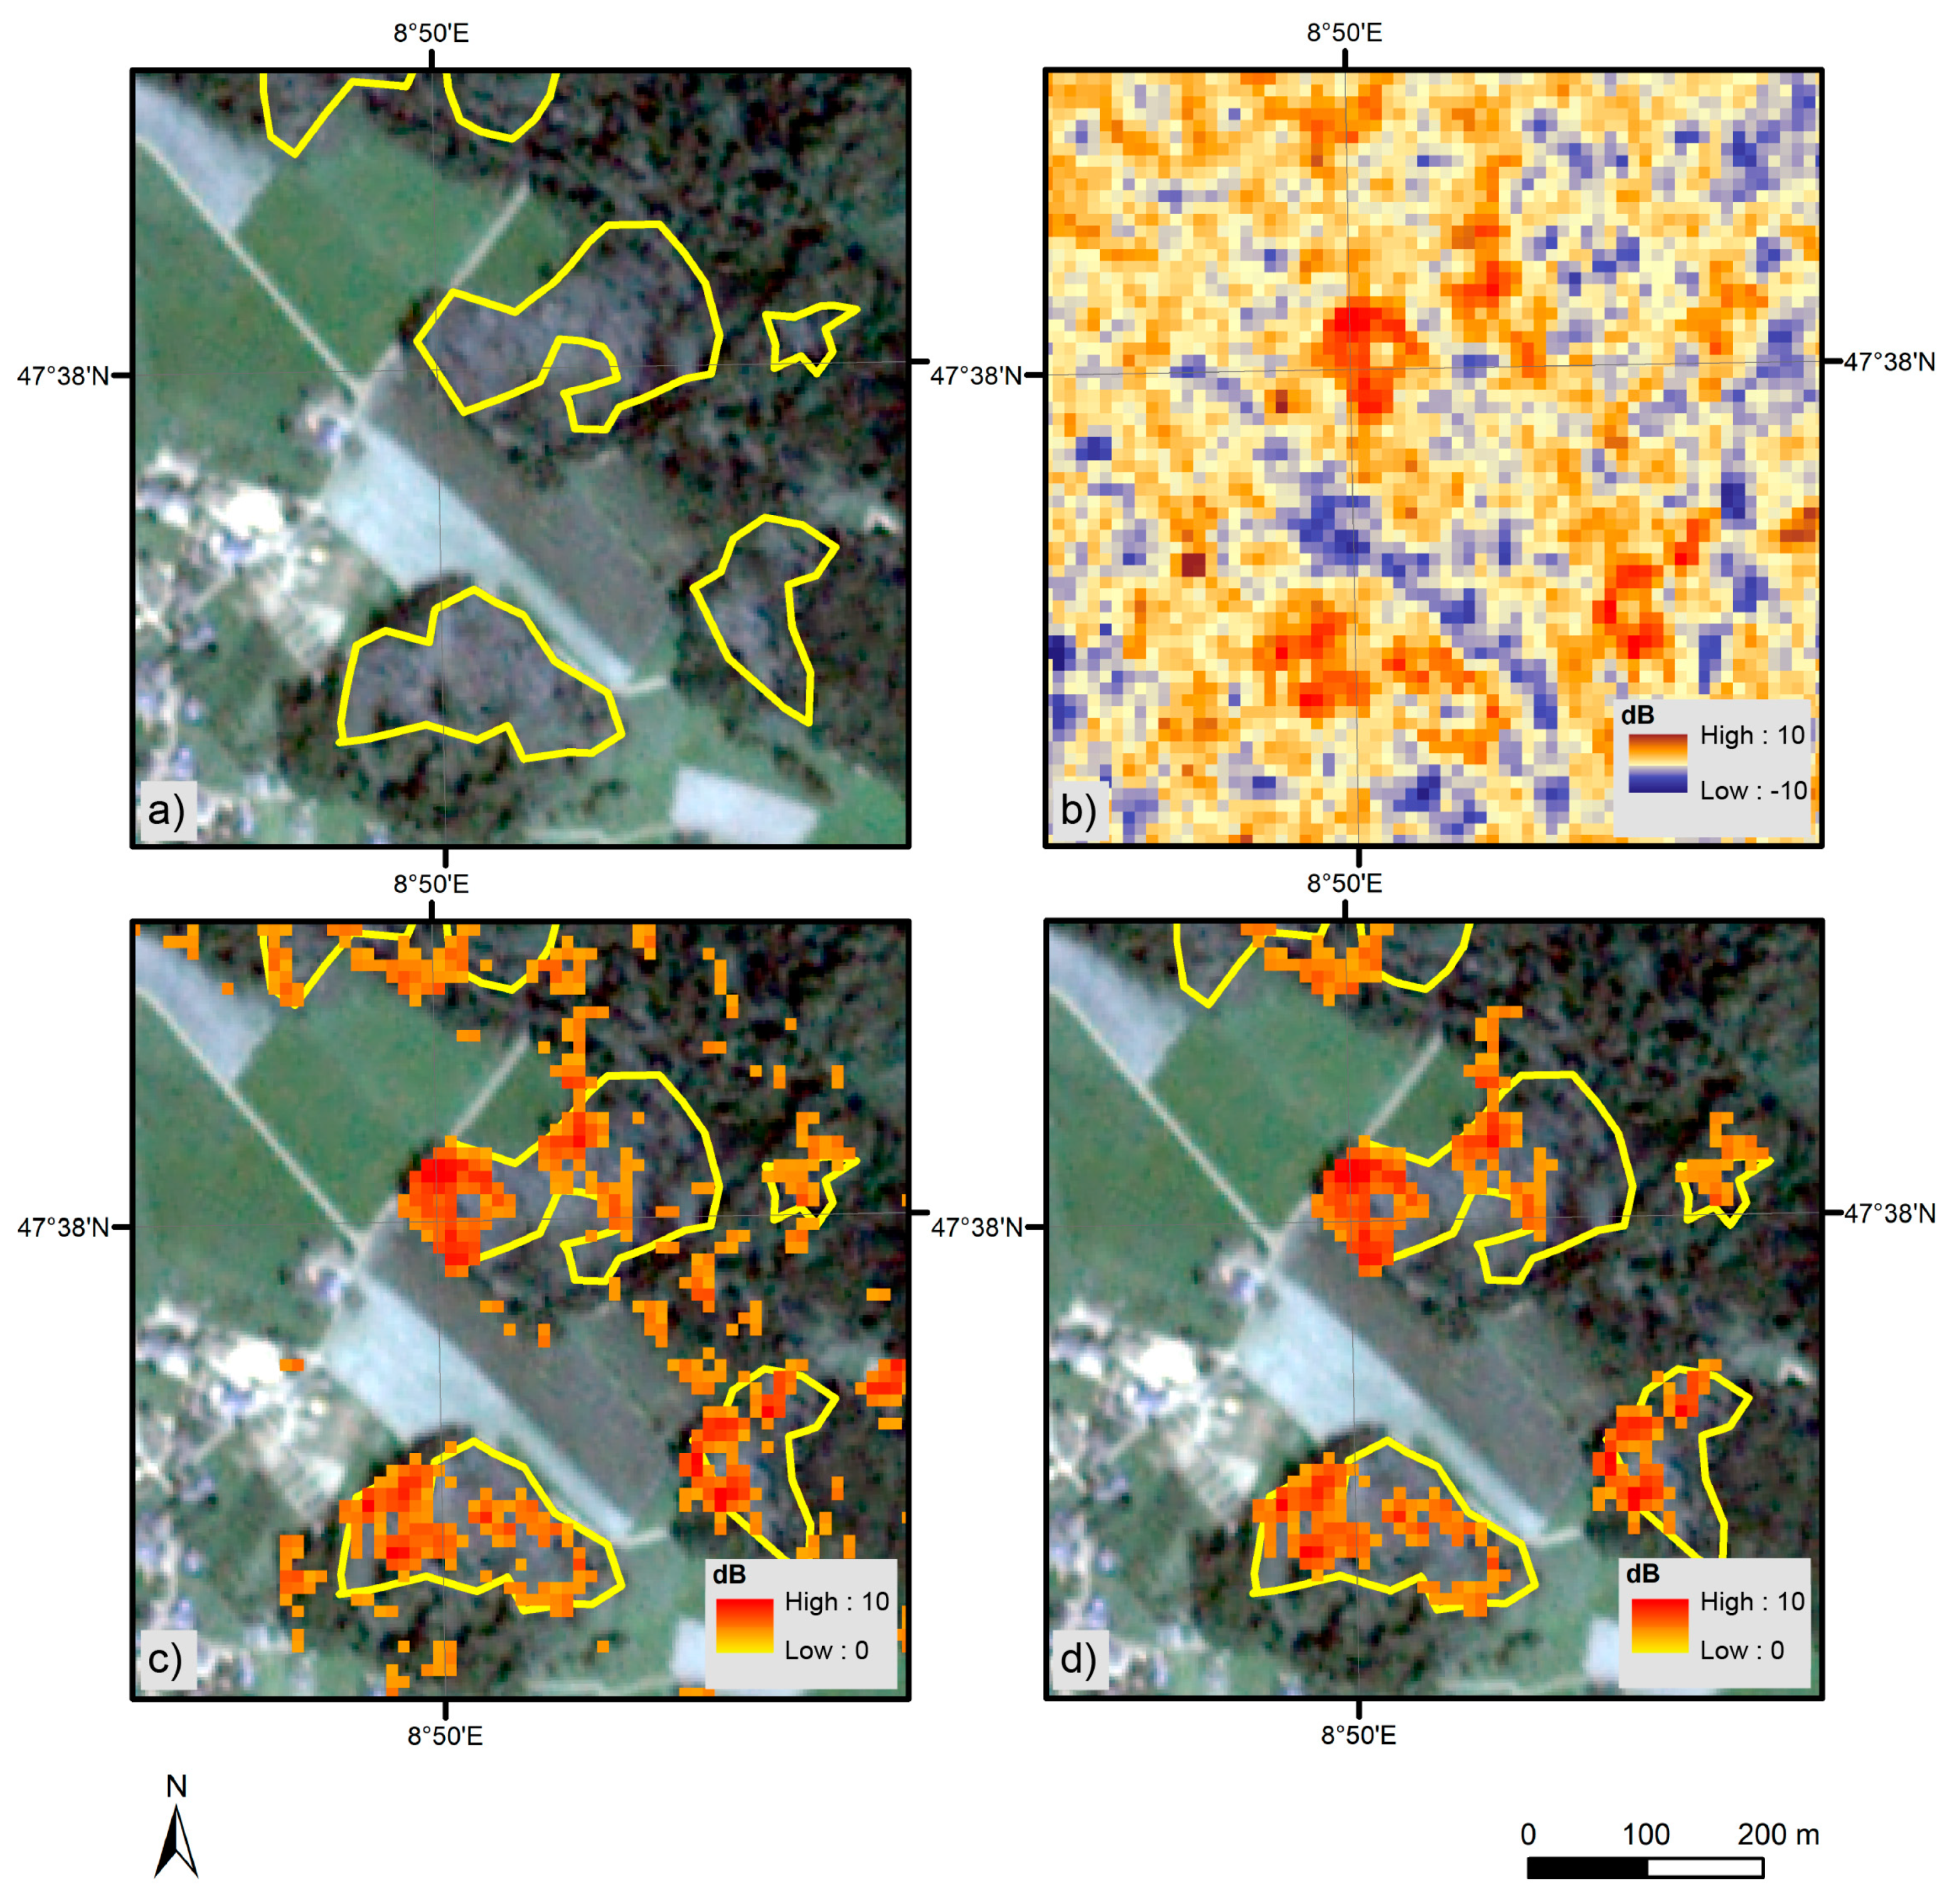
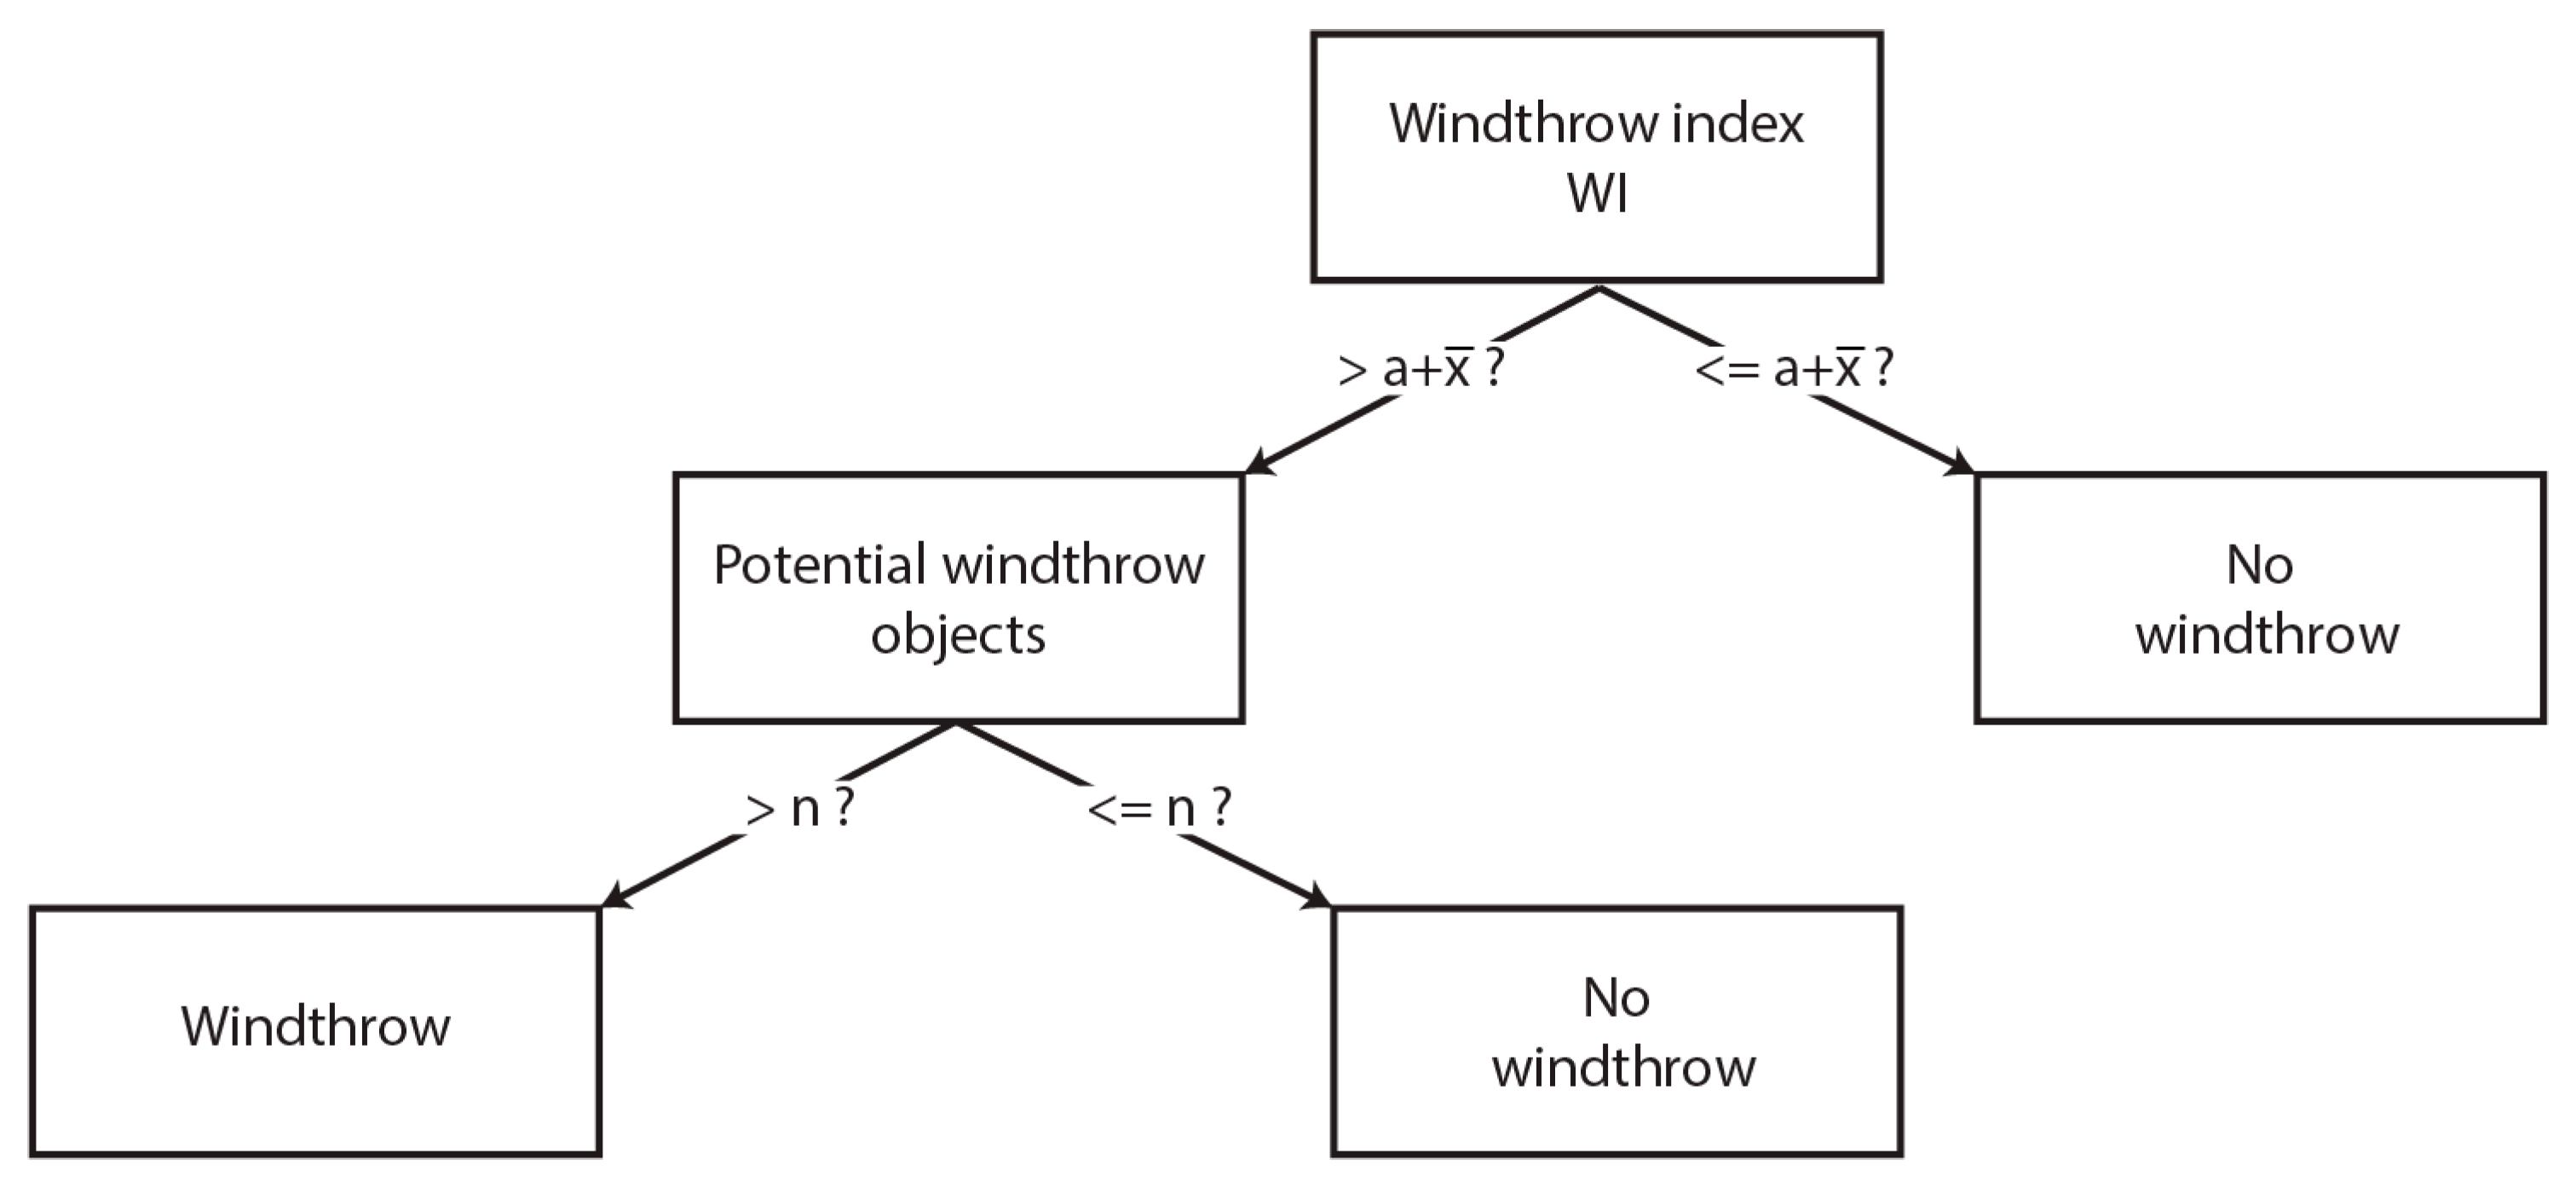
Calculated for all pixels, the proposed WI indicated all locations with large increases in backscatter after the storm event (see Figure 5a,b). Subsequently, for effective detection, two parameters had to be set. Figure 6 illustrates the applied decision tree.
A threshold was first chosen to define the degree of change in backscatter of a pixel that is considered as a potential windthrow object. As higher degrees of change are usually observed in non-forested agricultural areas and grassland, this segregation was only applied to the pixels within the forest mask. The threshold consists of the parameter a and the observed mean x ¯ of the WI within the forest mask. x ¯ was considered to handle the possible differences in backscatter caused by other sources (e.g., changing meteorological conditions). If the value in a pixel was higher than the threshold, it was flagged as a potential windthrow. Since many of the flagged pixels were likely caused by noise (see Figure 5c), only potential windthrow objects that consisted of a certain number of pixels were considered as true windthrows. To handle this, a second parameter n was introduced. It defines the minimum count of flagged pixels that are associated in a potential windthrow object. The resulting map gives a more realistic image of the real windthrows of the specific area (see comparison of Figure 5c,d).
To find the optimal parameter combination, windthrow maps using different values for the two parameters were generated for the study area CH. As preliminary results showed that good detection rates were obtained with a around 3, we tested twelve values for a, ranging from 2.8 to 3.35 in steps of 0.05. They were all positive, as higher backscatter was observed for both polarisations in the windthrown areas after the storm event. For the parameter n, values around 25 showed promising results, so the tested values were 20, 22–28, and 30. In total, 108 different parameter combinations were tested and subsequently evaluated against the windthrow reference.
This evaluation was performed in a manner similar to the object-based method of Einzmann et al. [11]. We generated a contingency table for the two classes “windthrow” and “no windthrow”. We next extracted the number of true positives (TP), false positives (FP), and false negatives (FN). An extraction of true negatives was not possible, because only “windthrow” was available in the reference data. A case was considered to be a TP when a predicted windthrow object overlapped with a reference windthrow object. Subsequently, the performance measures producer’s (PA) and user’s (UA) accuracy were calculated, as follows.
PA = TP TP + FN
UA = TP TP + FP
The performance measures of the 108 windthrow maps with different parameter combinations were then displayed in a matrix of size 12 × 9 for both measures to visually derive the best possible combination. To achieve this, we treated PA and UA as equally important, and calculated the mean of the two.
Subsequently, the performance of the detection method with the chosen parameters was validated in the independent study area DE. Since for this area a reference with three different windthrow classes was available, contingency tables were generated for each class. This was useful, as it allowed for an evaluation of the performance for different classes of windthrow severity. In addition to the contingency tables, PA and UA for each windthrow class were also calculated. As a class-specific UA is of less interest for a map operator, we also calculated the UA for all three classes combined, giving an indication of the UA for general windthrow.

2.3.4. Influence of the Number of S-1 Acquisitions

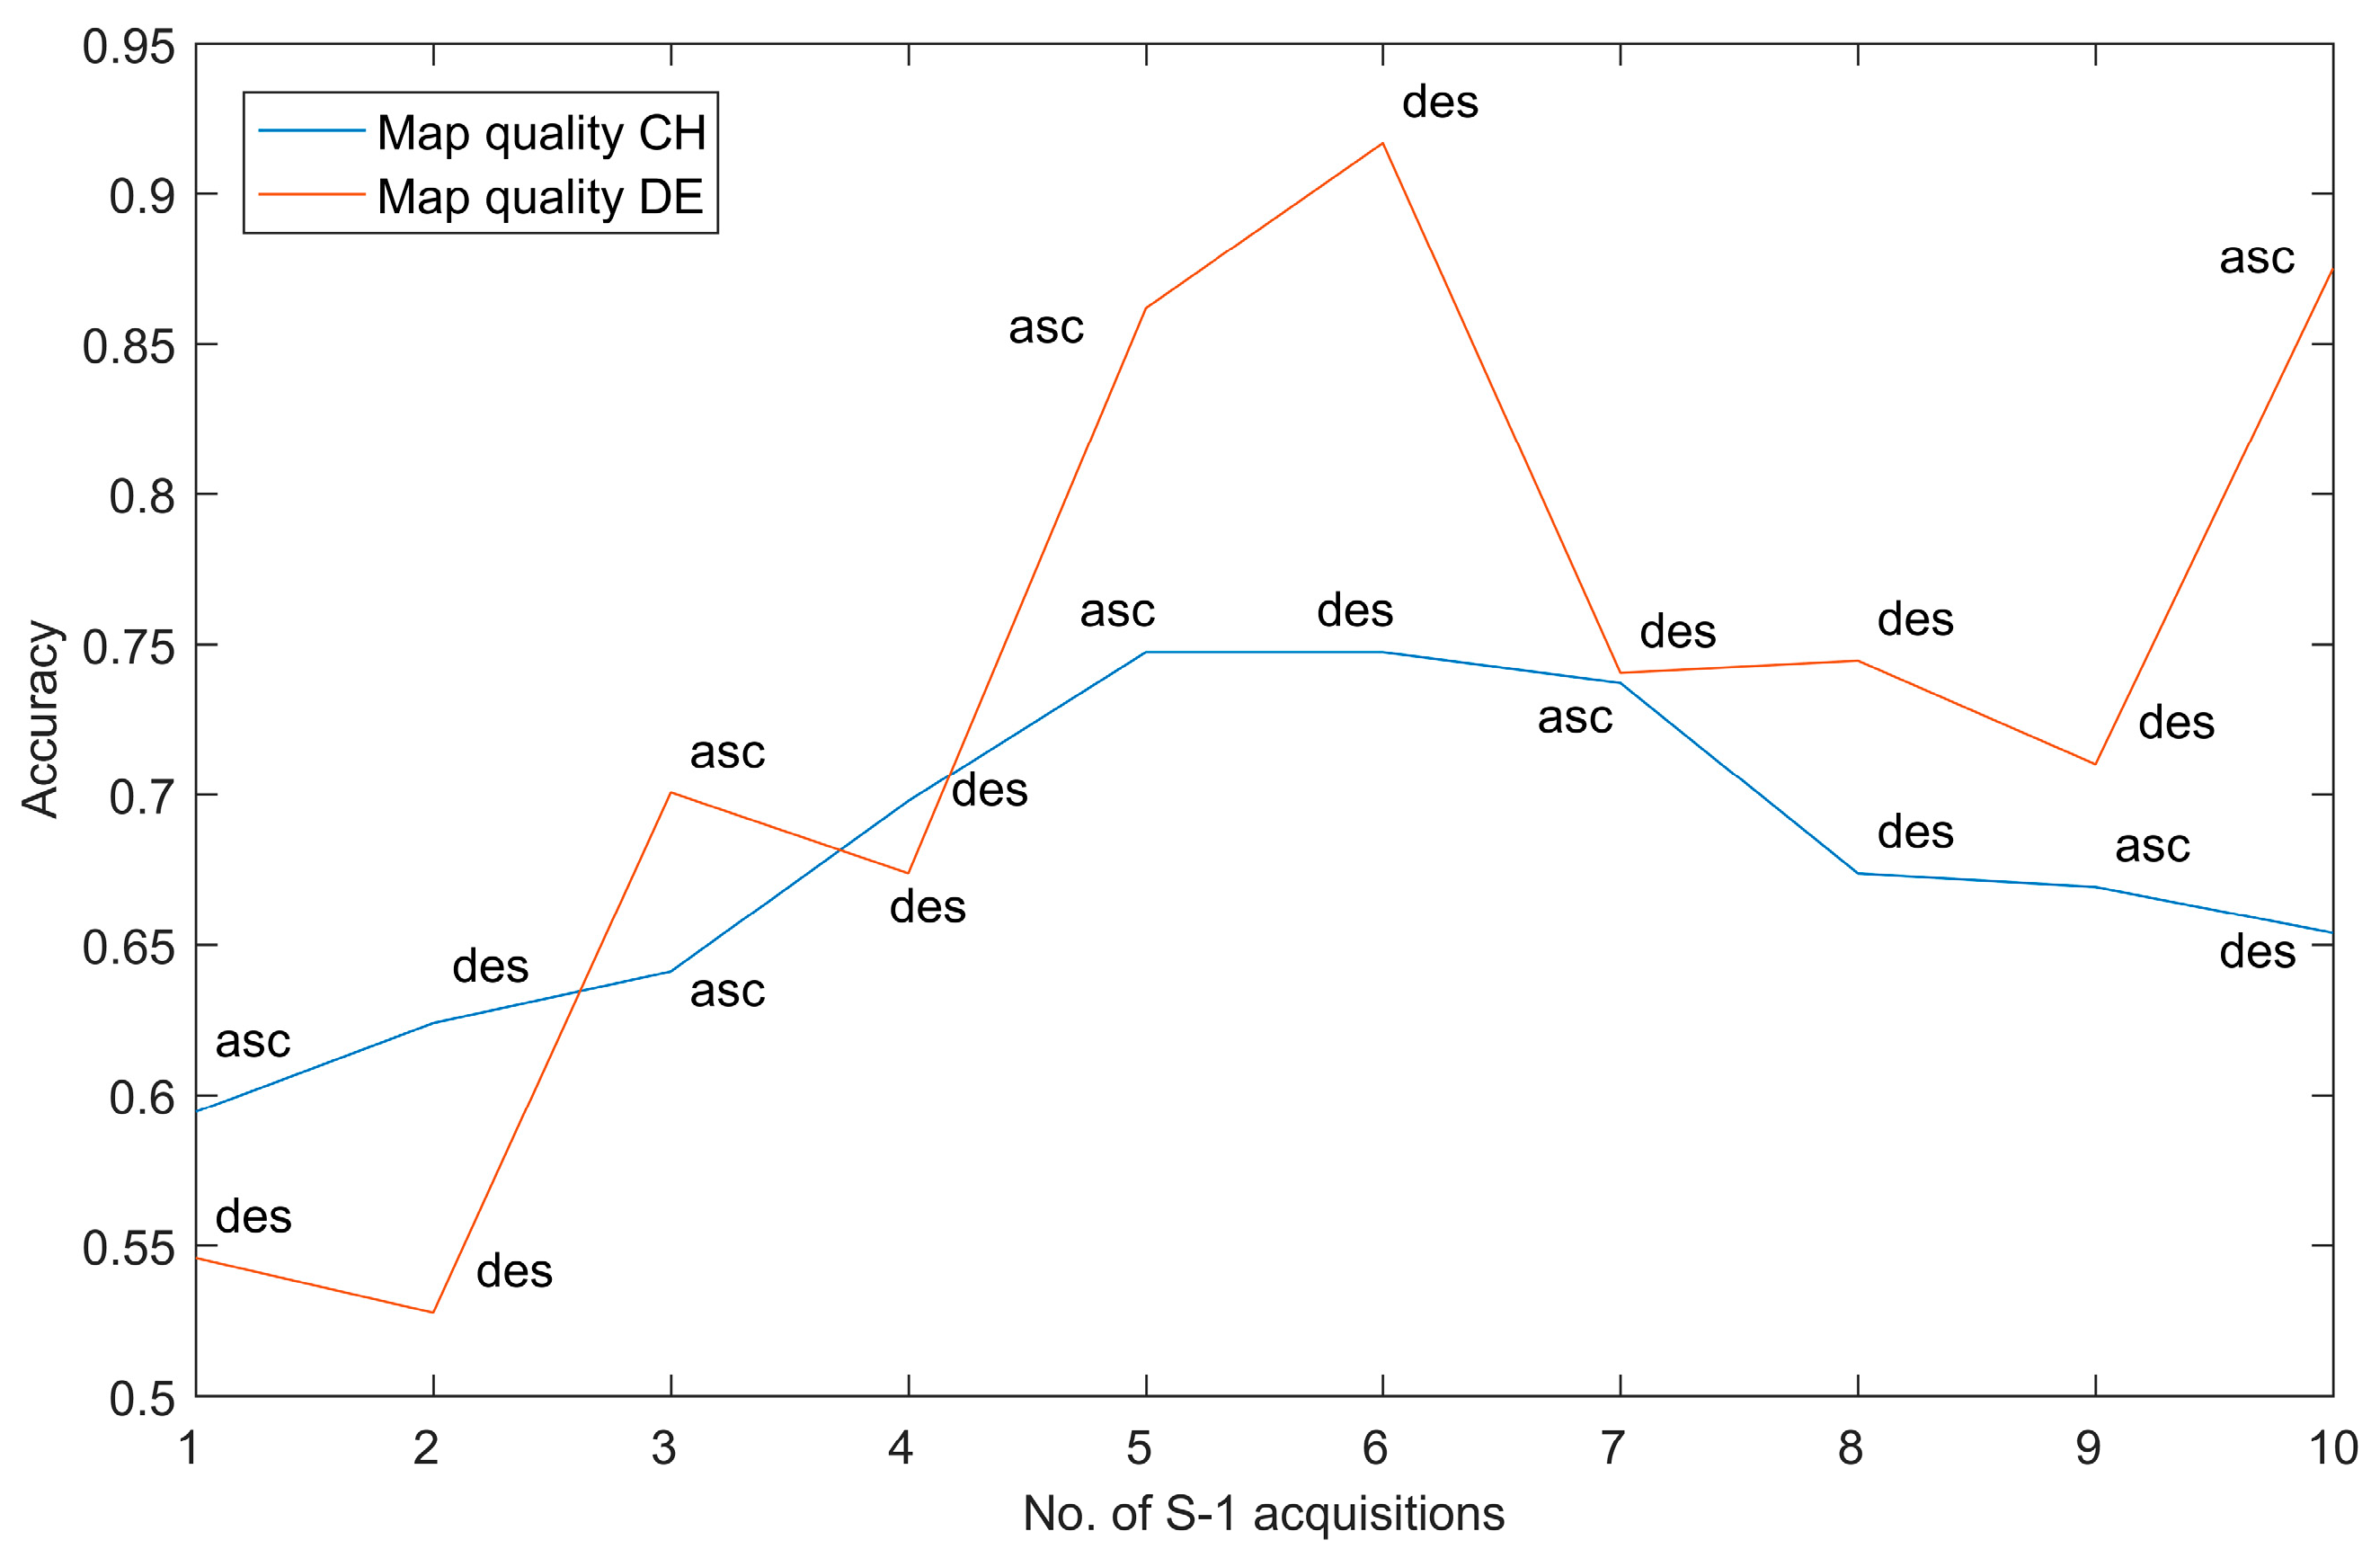
In a last stage, we tested the influence of the number of S-1 acquisitions that were used in the LRW processing on the performance measures. This was an essential step, as choosing the number of acquisitions for a satisfactory detection performance is crucial for an application immediately after a storm event. The fewer acquisitions needed, the faster a windthrow detection can be conducted, but performance in such cases was expected to be less robust. To test this influence, the number of acquisitions was gradually increased from one to ten (up to approx. four weeks after the storm event) for the γ LRW 0 composites after the storm for both study areas. For each new γ LRW 0 composite, the best parameter combination was determined and the performance measures were calculated in the same manner as in Section 2.3.3. For the study area DE, the PA calculation was made for the class ‘areal windthrow’ and the UA for all three classes combined. Subsequently, the map quality was assessed by computing the mean of the PA and UA. This map quality was subsequently plotted to illustrate its dependence on the number of acquisitions used.

3. Results

3.1. Statistics from Image Differencing

Table 3 shows statistics of the γ LRW 0 difference composites calculated within the windthrow reference and the whole forest mask of the study area CH. At VV-pol., the mean backscatter difference from mainly intact forest was negligible: 0.05 dB. The mean over windthrown areas was higher at 0.5 dB. The standard deviation was slightly higher within windthrown areas, with 1.78 vs. 1.58 dB. Similar backscatter behaviour was observed at VH polarisation, with different mean backscatter values of 0.31 and 0.97 dB from mainly intact vs. windthrown forest. The standard deviation changed from 1.6 to 1.81 dB for the two cases. Thus, a distinct change in backscatter was recorded at VV- and VH-pol., with higher mean values of 0.45 and 0.68 dB from the windthrown areas, respectively. This indicated higher backscatter in both polarisations from these areas after the storm. Mann-Whitney-U-tests for both polarisations indicated a highly significant (p < 0.001) disparity in the distribution of the γ LRW 0 difference between values from within the whole forest mask and the windthrow reference mask.
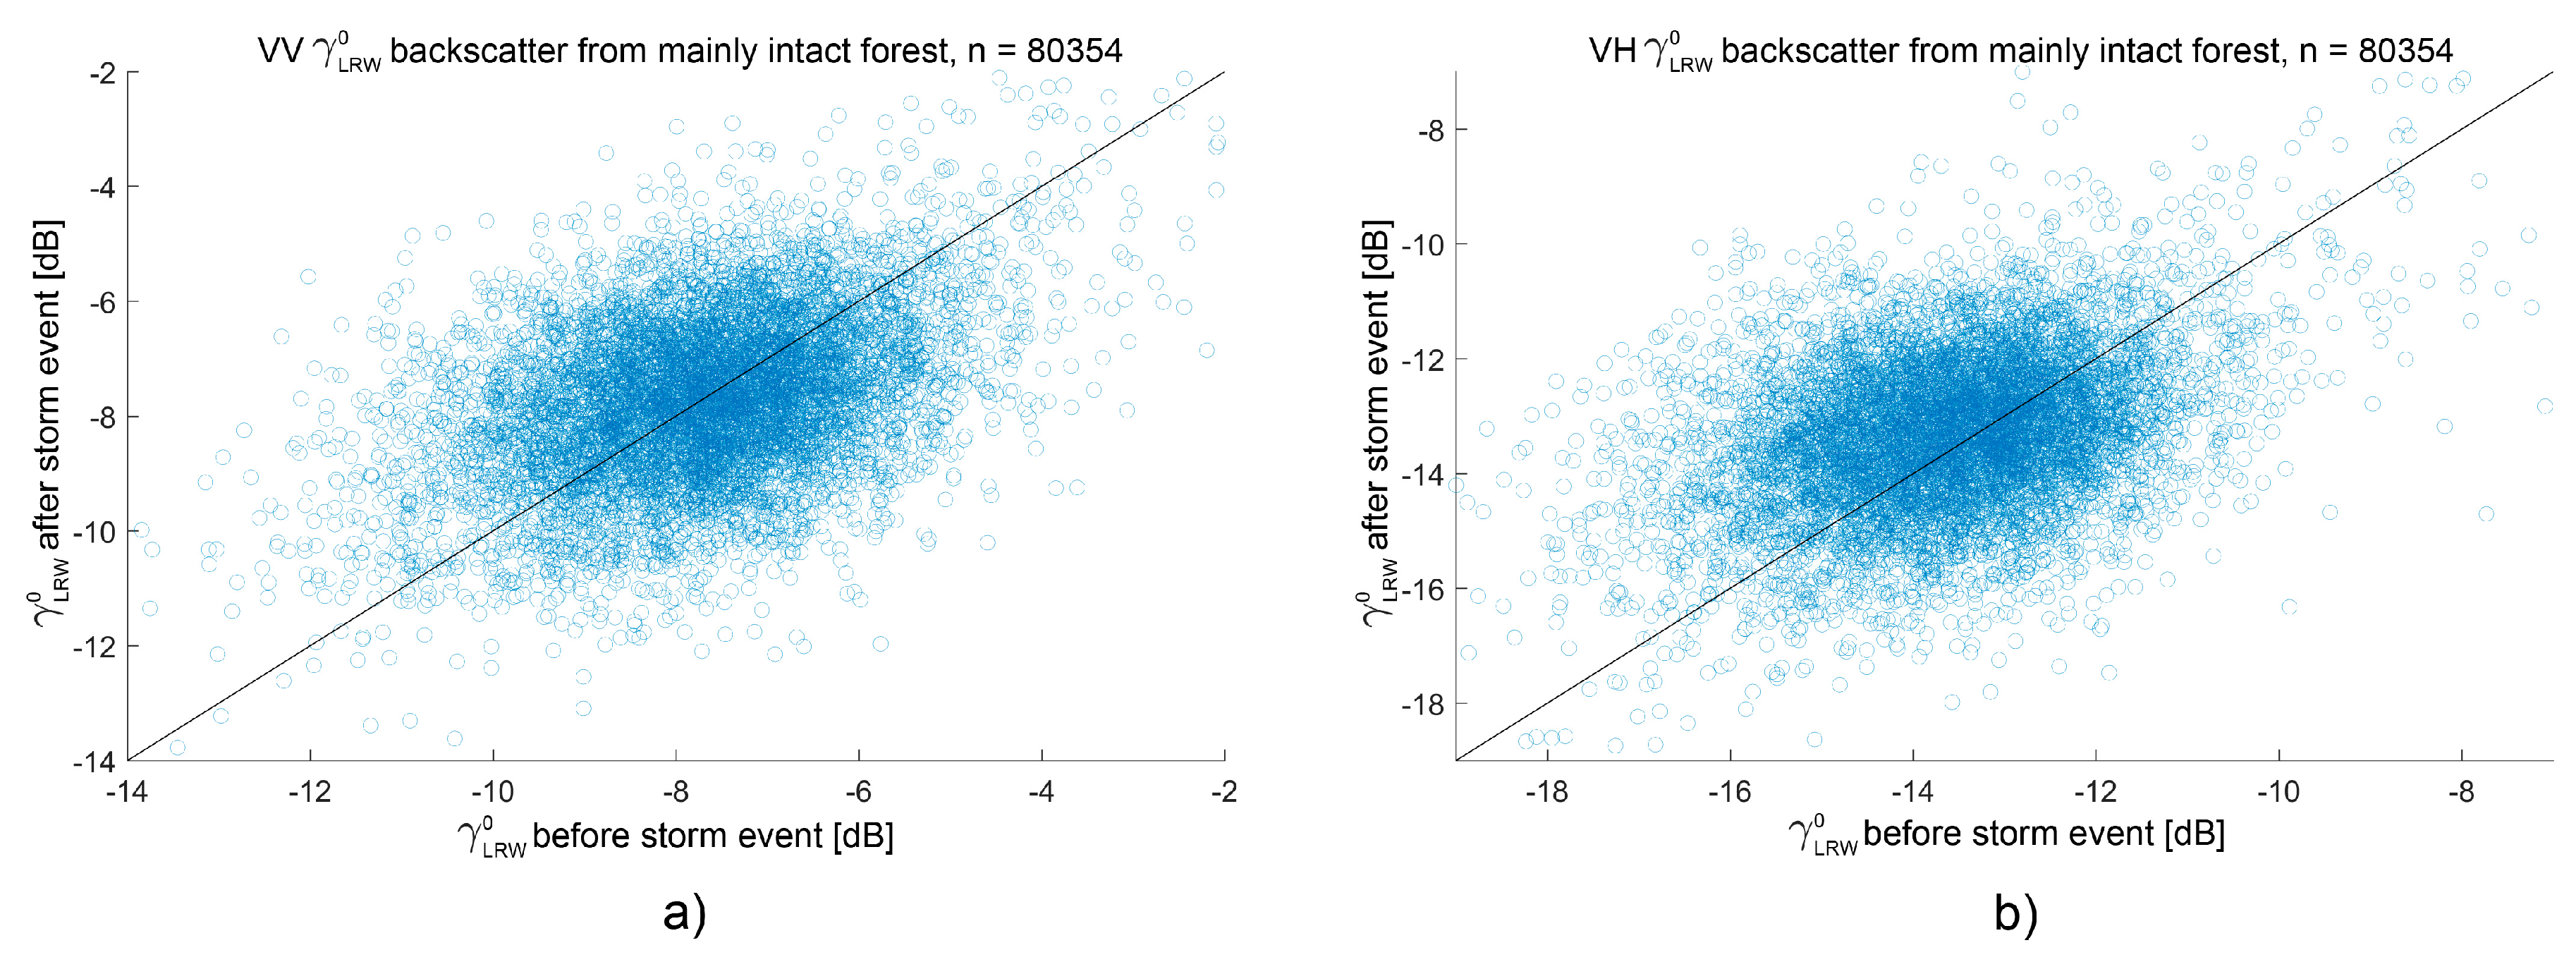
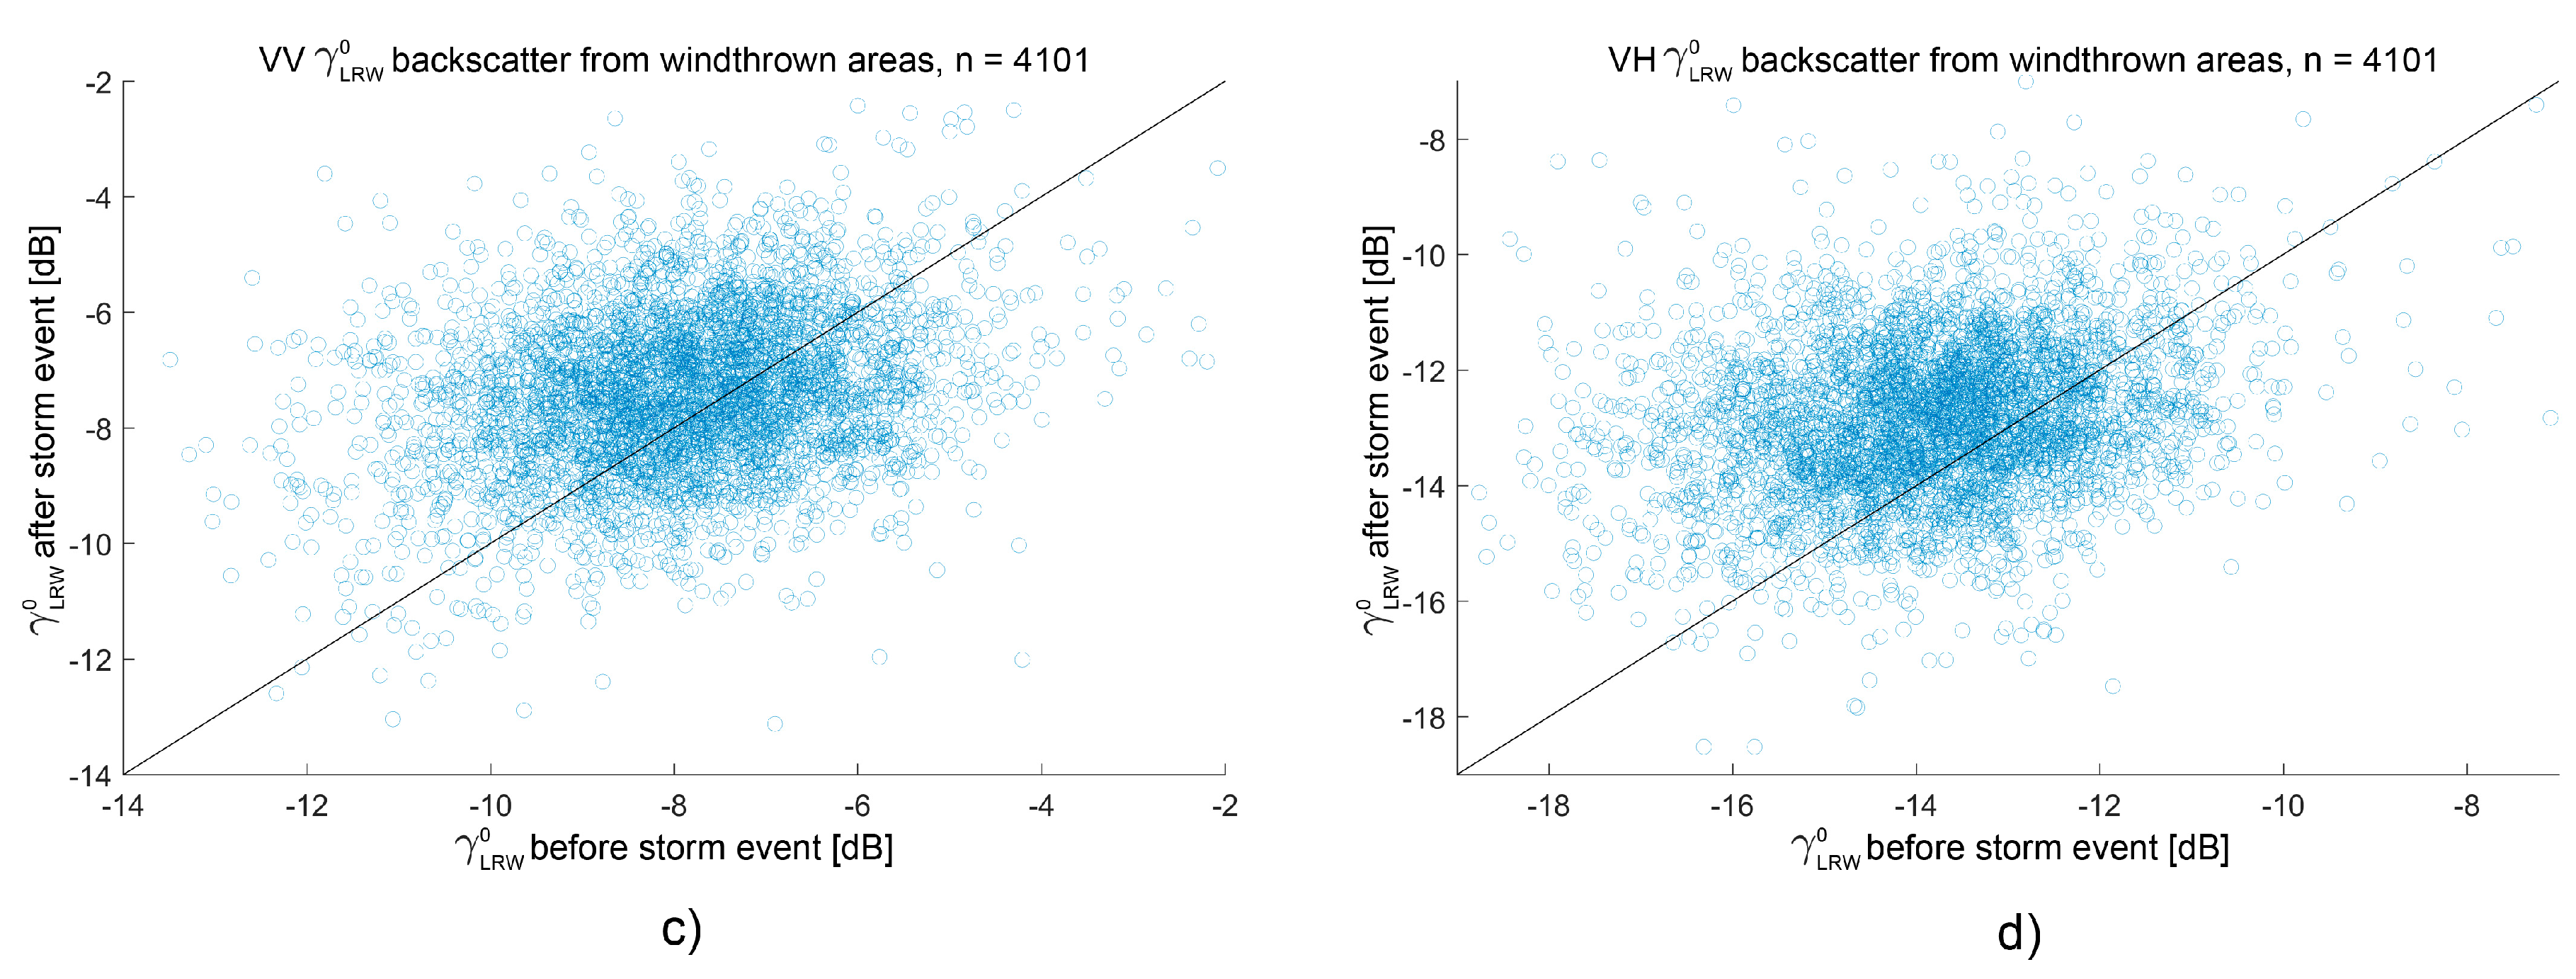
The scatterplots that are shown in Figure 7 illustrate the same effect. The distribution of the point cloud in the scatterplots differs between the two rows. In Figure 7a,b, showing backscatter from the whole forest mask, the point cloud is approximately located on the equivalence line. In Figure 7c,d however, the centre of the point cloud is observed above the equivalence line, indicating higher backscatter after the storm event. When comparing the scatterplots in Figure 7c,d, this observation is better articulated in VH-pol., consistent with the larger degree of positive change shown in Table 3.

3.2. Parameter Combination Evaluation—Training of Method in Development Area

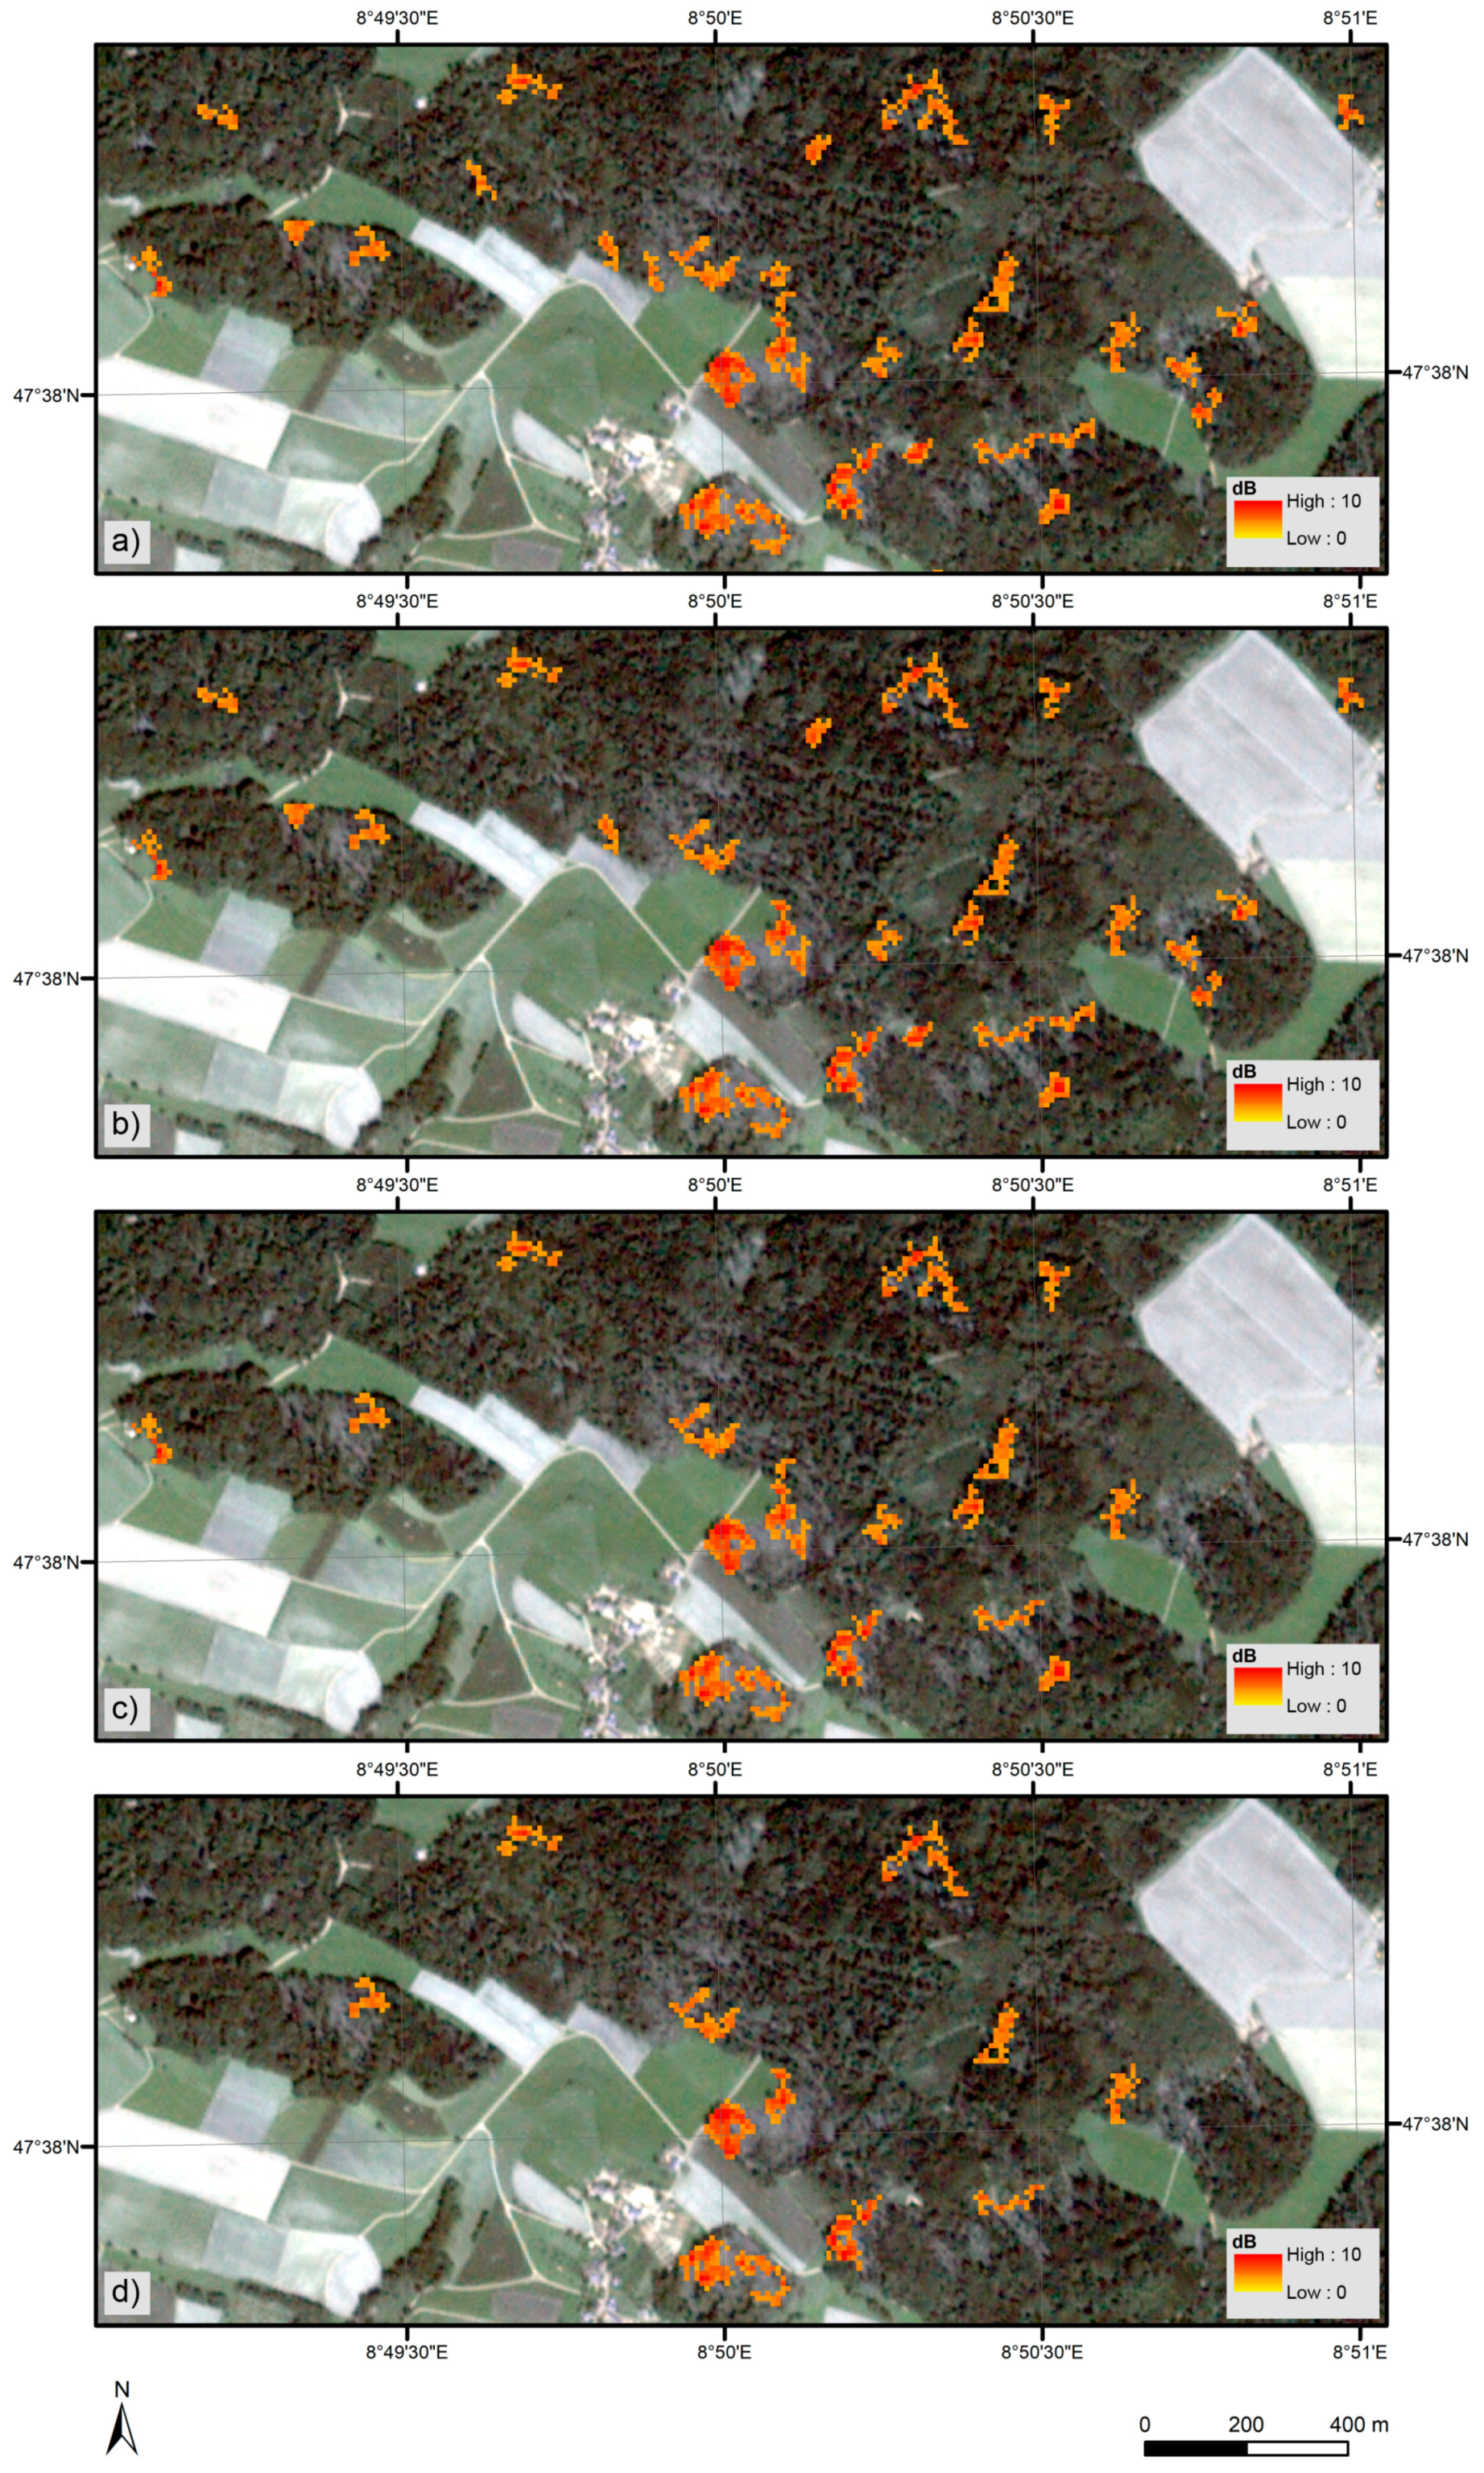
Figure 8 exemplarily shows four windthrow maps that were based on different parameter combinations. Obviously, the parameter combination has a great influence on the produced map. Increasing the value of the parameter a resulted in fewer windthrow objects in the map. Changing the parameter a from 2.8 to 2.9, while keeping the parameter n constant, resulted in fewer objects in the whole map, as seen in Figure 8a,b. The same applied to an increase of the parameter n. With an n of 25 instead of 15 and a constant value of a, fewer objects were classified as windthrown (Figure 8a,c). Even fewer objects were classified as windthrown when higher a (2.9) and n (27) parameters were applied (see Figure 8d).
Since it was assumed that the detection performance of windthrown areas strongly depends on the parameter combination, further investigations on this issue were carried out in the study area CH. Windthrow maps that were based on different parameter combinations were produced and compared with the reference windthrown areas.
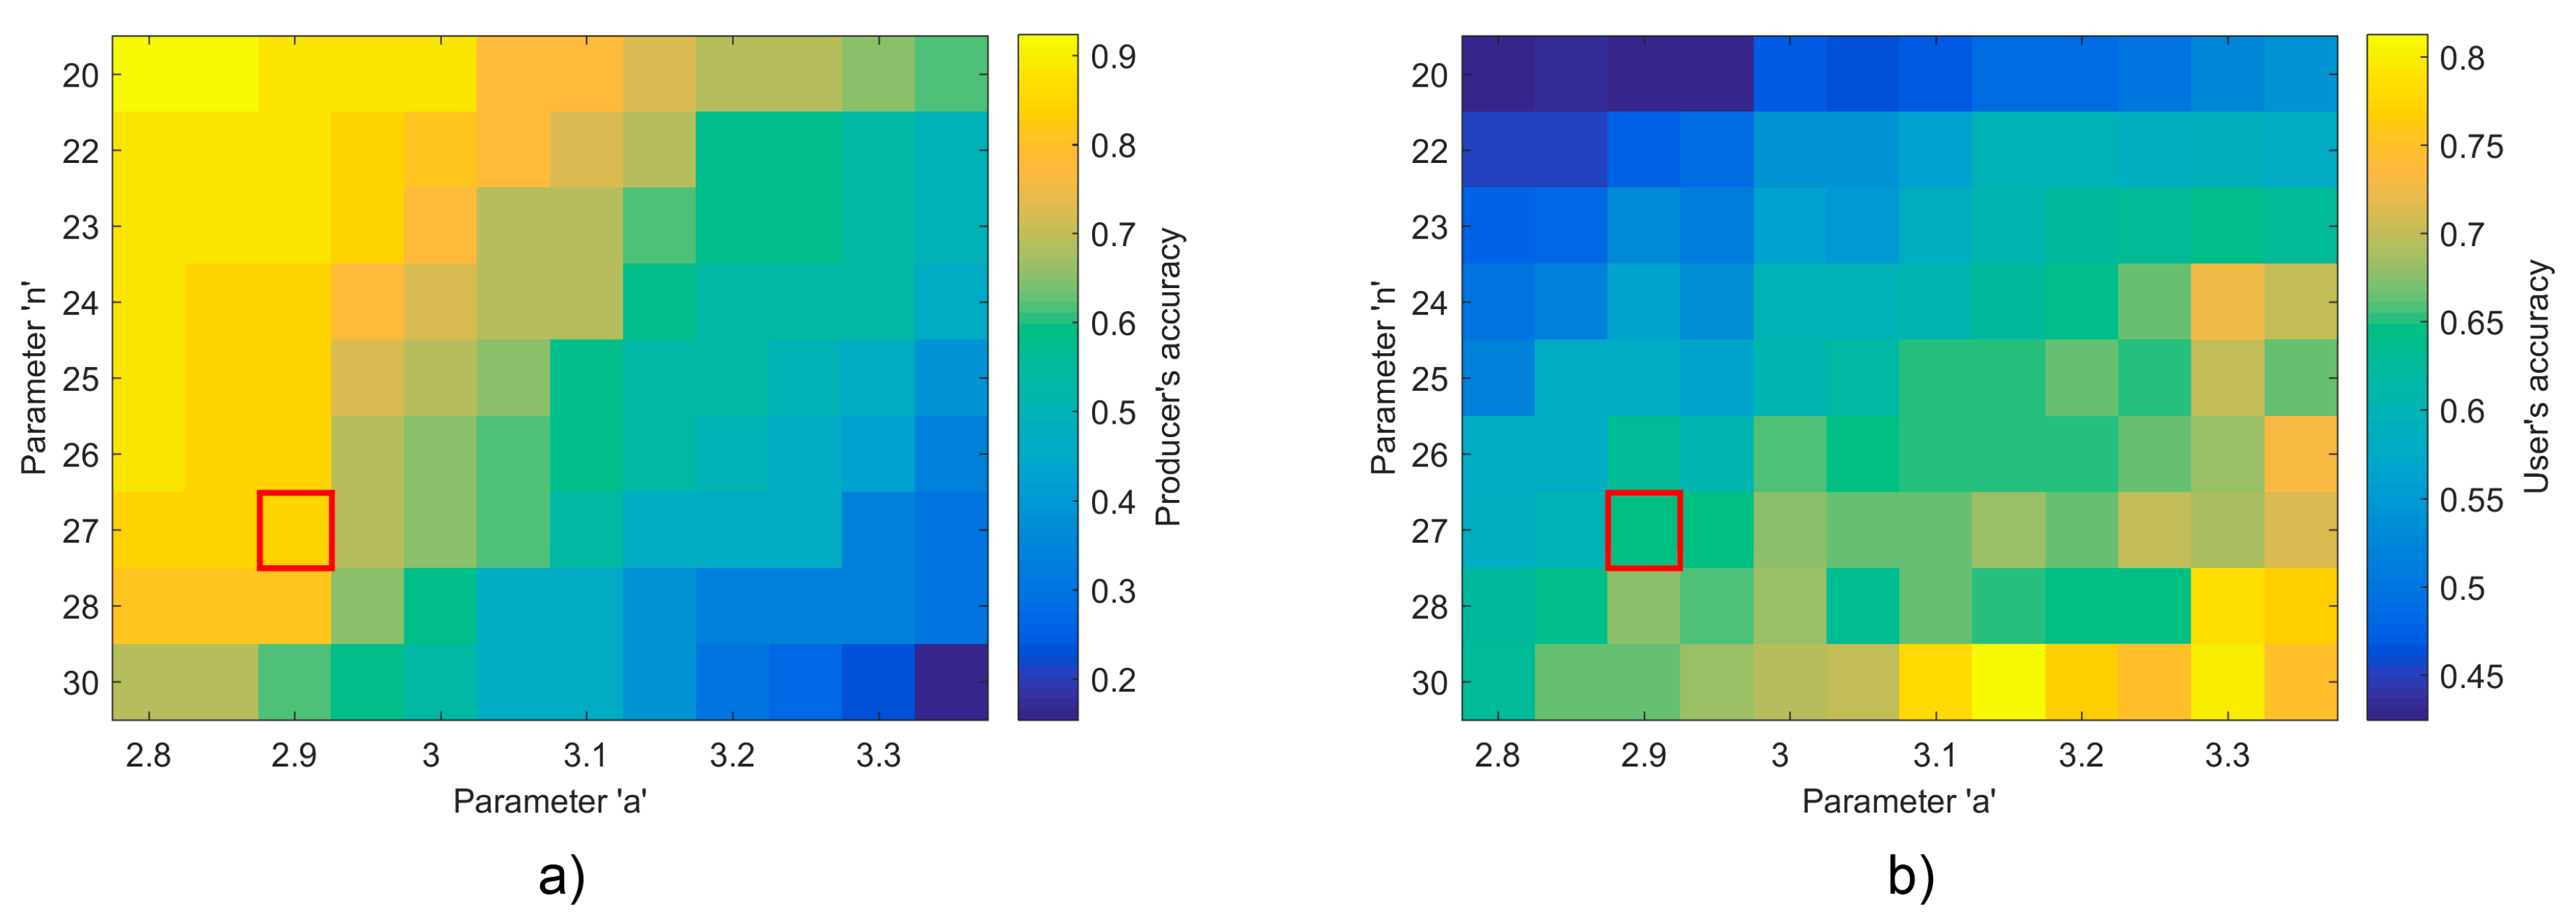
The resulting PAs and UAs are listed in the performance measure matrices in Figure 9. The highest PAs of 0.92 were obtained when low values for n and a were used (see Figure 9a). In contrast to the PAs, high values for n and a produced higher UAs, with a maximum of 0.81 (Figure 9b).
Taking both performance measures to be equally critical, the best parameter combination was obtained with n = 27 and a = 2.9, resulting in a correct detection of 22 (from a total of 26) reference windthrown areas (PA of 0.85). Twenty-four (from a total of 37) of the suggested windthrown areas were included in the reference, resulting in a UA of 0.65.
Visual inspection of the windthrow map with the best performance measures showed that most referenced windthrown areas were correctly detected. However, the retrieved areas of these objects were not entirely congruent, i.e., often underestimated in comparison to the area of the reference. Furthermore, the lower UA value was mainly caused by two issues. First, five of the suggested areas were included in the original reference but were then excluded due to the minimum windthrow extent limit of 0.5 ha. Second, a systematic error was observed at forest edges, which resulted in six wrongly suggested areas.

3.3. Method Evaluation in the German Validation Area Mecklenburg-Vorpommern

To test the applicability of the method, the best parameter combination for the study area CH was tested in the independent study area DE. As three different windthrow classes were available in the reference of this area, the performance measures PA and UA were calculated for each class. Table 4 shows the contingency tables that were generated for each class. Using the parameter combination of a = 2.9, n = 27, the method suggested 33 windthrow objects in the area. Twenty-eight of the suggested areas were referenced as one of the three windthrow classes, so generally windthrow was detected with a UA of 0.85. Class-specific accuracies were highly diverse between the three classes.
Seven out of the eight referenced ‘areal windthrow’ areas were suggested by the method, resulting in a fairly high PA of 0.88 for the class. In contrast, the class-specific UA was low, at 0.21. The two classes with scattered windthrows had worse performance. For the class ‘single standing trees’, PA and UA were quite low at 0.29 and 0.15, respectively. The PA of the class ‘single fallen trees’ was even lower, at 0.07. The high UA value of 0.48 was mainly due to the much higher number of 225 referenced windthrown areas of the type ‘single fallen trees’.
Similar characteristics as in CH were observed when the windthrow map was visually inspected. The areas of the suggested objects also underestimated the true extent of the windthrows. Two referenced windthrown areas were detected but then excluded due to their extent. However, a systematic error at forest edges was not observed in DE.

3.4. Influence of the Number of S-1 Acquisitions

Figure 10 illustrates the influence of the number of S-1 acquisitions that were used in the LRW processing on the quality of the detection map. Generally, best performance was achieved using five or six post-storm S-1 acquisitions (map quality corresponds to the mean of PA and UA). Only in this case was a map quality of ≥ 0.75 observed for both study areas. A difference between the two study areas is seen in the shape of the lines. For the study area CH, the map quality gradually rose from a low 0.59 with one acquisition to a higher quality of 0.75 with five or six acquisitions. A gradual decrease to 0.65 was then observed with 10 acquisitions. The general shape of the line was similar for the study area DE: an increase from 0.55 with one acquisition to around 0.9 with five and six, followed by a decrease when using additional acquisitions. However, the map quality for the study areas DE did not rise as gradually. The ascending acquisitions appeared to contribute more to a higher map quality than the descending ones.

4. Discussion

The results clearly show that windthrows in forests have significant influence on C-band backscatter. Higher backscatter from windthrown areas was observed in both polarisations shortly after the storm event. Given that backscatter changes in intact forest areas were less substantial, it was possible to use this diverging behaviour to detect the location of windthrown areas. The detection rate for areal windthrows was very promising for two independent study areas. The detection of scattered windthrown trees was not feasible with the presented approach.

4.1. Diverging Backscatter Behaviour between Windthrown and Intact Forest Areas

Positive changes in backscatter from windthrown areas were observed after the storm event in both polarisations (VV, VH). Backscatter from forested areas is strongly influenced by the structural properties and the arrangement of the trees [25,27]. As a windthrow usually causes changes to the forest structure of an area, a change in backscatter from this area can be expected as well. In both study areas, changes in backscatter were observed within a short period of time before and after the storm event. Other factors that cause considerable changes to the forest structure in such a short period of time could be neglected in both cases. Hence, a substantial change in backscatter at a location was expected to be a change in forest structure indicating storm damage at this location.
Other influences on backscatter that cause potential errors were mitigated by applying multitemporal compositing of acquisitions from ascending and descending tracks, reducing the influence of both signal noise and speckle. A similar mitigating effect was expected on the potential influence of precipitation, as the impact of single precipitation events was reduced. A strong influence from changing temperatures appeared to be negligible in both our datasets, as the temperatures stayed consistently above the freezing point in both areas throughout the acquisition periods.
Whereas almost no change in backscatter from the mainly intact forest areas could be observed at VV-pol., the change was substantially higher in windthrown areas (after the storm), clearly indicating a change in forest structure. The increased backscatter could be attributed to two causes: (1) the more ‘chaotic’ arrangement of the microwave energy scattering trunks and branches in windthrown areas leading to an increased surface roughness (cf. [32]) and (2) a reduced attenuation of the microwave energy within the forest canopy leading to a greater contribution from ground scattering (cf. [22]). A higher standard deviation was noted within the damaged areas. This can also be explained by the more ‘chaotic’ arrangement with more diverse scatterers than before the storm event. The same change in standard deviation was also observed at VH-pol., coupled with an even higher positive change in backscatter in windthrown areas. A plausible explanation for this behaviour could be that the scattering mechanisms change as the wooden material is oriented more randomly post-windthrow. Cross-polarised backscatter is more sensitive to this random arrangement of the scatterers than co-polarised channels [19]. Thus, a higher sensitivity of VH-pol. to structural changes in windthrows could be expected. Unexpectedly, we also measured a slightly positive change in backscatter in supposedly intact forest areas. It was assumed that this was caused by smaller windthrown areas or even single windthrown trees that were not visible (due to closed canopy, topography, and shadows) in the Planet imagery for the reference production.
Comparisons of our measured SAR backscatter from windthrown areas with other studies using spaceborne data revealed similar findings. Similar to our study, Eriksson et al. [32] also obtained higher C-band backscatter (HH-pol.) from windthrown areas after a storm event in coniferous forest stands in southern Sweden. In addition to Radarsat-2 C-band, they also inspected ALOS PALSAR L- and TerraSAR-X X-band data. Analysis of HH-pol. backscatter for both revealed lower and higher backscatter after the storm event for L- and X-band, respectively. Lower backscatter from windthrown areas was also observed in a study that was carried out in mixed temperate forest in southern Germany using ALOS PALSAR L-band data [35]. Thus, it appears that the change in backscatter from windthrown areas tends to be positive at shorter radar wavelengths and negative at longer ones.

4.2. Windthrow Maps

The two windthrow maps based on the proposed method strongly depended on the chosen parameter combination (a and n). The map that was based on the best combination for the study area CH showed promising performance measures. Especially the high PA should meet the demands of potential map operators. The UA was not as high as the PA, but this could be explained to a large degree. First, almost half of the apparent false positives were windthrown areas that were excluded due to their extent. If they were also excluded from the UA calculation, then a value of 0.75 would have been achieved. As map operators are mainly interested in the location and distribution of windthrow, we assume that they would not be disturbed in their work by suggested windthrown areas smaller than 0.5 ha. Second, errors in the forest mask caused many false positives at forest edges. The forest mask used for the study area CH was generated based on an aerial image point cloud. Points that are located at the forest edges are prone to misplacement, as viewing geometry and horizontal branches have a considerable influence on the point cloud generation [49].
Since better independent reference data was available for the study area DE, it was possible to conduct a precise performance evaluation by defining three different classes of windthrow severity. Comparison of the PA values of the different classes indicated that the method produced satisfactory results for the class ‘areal windthrow’. However, the performance measures were not satisfactory for the other two classes consisting of scattered windthrown trees. This could mainly be due to the spatial resolution of 20 m of Sentinel-1 [36]. With 20 m spatial resolution, a single windthrown tree, even a tall tree, is not expected to be detected, since a minimal area of windthrow is required to obtain sufficient signal in the measured backscatter.
The training of the method in the study area CH might be influenced by the coarser spatial resolution of the Planet imagery, which only allowed for a collection of areal windthrows as reference data. As the selected parameters for the windthrow map for the study area DE were developed based on the reference data of the study area CH, the difference in performance was not surprising. Similar to the results that were obtained from the study area CH, a few false positives could be attributed to cases of windthrown areas smaller than 0.5 ha (UA of 0.9 if excluded from UA calculation). The issue with forest edges was not observed in DE. There were fewer misplaced forest edges because the forest mask for this area was based on high-resolution digital aerial images. This underscores the importance of a recent and accurate forest mask for a successful application of the detection method.
A striking difference between the two study areas was the number of suggested windthrown objects in the two maps. Fewer objects were suggested for the study area DE than for the study area CH, although the extent of this area was about 15 times larger. This could be due to three different reasons. First, the wind speeds of the storm event in the study area CH were considerably higher. The logical consequence would be more windthrow in this area. Second, even if both study areas consisted of mixed temperate forest, their species compositions were different. Third, the management regimes also differed between the two study areas. More strictly arranged plantations per area were counted in the study area DE. Analysis of the species’ or the management regime’s influence on the result was beyond the scope of this study.

4.3. Influence of the Number of S-1 Acquisitions

Both similarities and a difference were observed in the analysis of the required number of S-1 acquisitions for a satisfactory detection performance. In general, the map quality was best for both study areas, when five or six acquisitions were used in the LRW processing. This rise in quality can be explained by the supplementary information from the additional acquisitions. In general, the more acquisitions that were integrated in the LRW processing, the more the high internal variation in the SAR data (signal noise and speckle) was reduced. The subsequent decrease when using six to ten acquisitions can be explained by the temporal variation of the scatterers in the region: the longer the LRW processing time period, the greater the expected temporal variation, caused e.g., by clean-up activities. The difference in the shape of the line may be explained by the sequence of the acquisitions’ pass directions. Whereas ascending and descending acquisitions alternated for the study area CH, the sequence was different for the study area DE. The first ascending acquisition was only included in the γ LRW 0 composite with three acquisitions. Hence, it would be expected to gain a higher increase in map quality as the ascending acquisition contains less redundant information than the two of the same pass direction. In addition, the second substantial increase between four and five acquisitions could be attributed to different meteorological conditions in the area. Meteorological records of the area indicated drier conditions for the last acquisition of the 16 October 2017 as compared to the others, which resulted in different backscatter that included even more supplementary information. The strong increase in quality from nine to ten acquisitions could be explained by the fact that only very few windthrow objects were suggested in the map based on ten acquisitions. This resulted in a perfect UA of 1 that lead to a high map quality. Surprisingly, slight declines were observed for the study area DE when the second and the fourth acquisitions were included. This might be attributed to the fact that the maps of DE were generated using the best parameter combination of CH (see Section 3.2).

4.4. Comparison with Existing Windthrow Detection Methods

When compared with recent windthrow detection methods that used spaceborne remote sensing data, our approach was competitive. Thiele et al. [33] generated change maps using TerraSAR-X Spotlight data with a spatial resolution of about 1 m. Their approach achieved a UA of about 0.7, however, no information was provided on the PA. The recent study of Tanase et al. [35] that used L-band data with a pixel spacing of 30 m achieved a PA of 0.67 and a UA of 0.54 shortly after the storm event. Comparable methods that used optical data attained higher accuracies than the aforementioned SAR-based studies. Einzmann et al. [11] achieved PA and UA of about 0.95 using high resolution RapidEye data to detect windthrown areas in mixed temperate forests in southern Germany. Another study using medium resolution LANDSAT data detected windthrow in mixed temperate forests of European Russia and boreal forests of Minnesota with producer’s and user’s accuracies of approximately 0.68 and 0.95, respectively [9]. However, the inevitable disadvantage of methods using optical data is their dependence on daylight and weather, impeding their potential for rapid application after a storm event.
Table 5 schematically illustrates the advantages of our multi-track LRW SAR approach in a fast response framework by comparing the latencies to secure the required data, cost, and areal coverage between different remote sensing systems. Airborne sensors, compared to spaceborne, are often expensive (ordered flights), typically restricted to smaller regions, and short latency is not guaranteed due to their weather dependence. In contrast, spaceborne sensors cover larger areas and can be—depending on the sensor—relatively cheap. Latency is the main difference between spaceborne optical and SAR. The use of optical data is mainly restricted due to cloud cover. The advantage of multi- as compared to exact repeat track SAR is the lower latency of the first. The approach using multiple tracks enables a quicker collection of the required data, as it is able to handle SAR acquisitions made with differing viewing angles.

4.5. Practical Use

In addition to the presented and discussed performance measures, a few points should be mentioned for practical map operators. Our approach underestimated the extent of the windthrown area for all windthrow objects. Thus, one should be aware that the produced windthrow map represents the core region and that it is not a true representation of the actual area extent of windthrow within the affected region. Therefore, quantitative applications, e.g., estimating windthrown timber volume or number of stems are not feasible with our approach. Nevertheless, the map accurately indicated the correct locations of many windthrows in both study areas. By getting an overview of the potential locations, one gathers a perception of the windthrow distribution within a region.
Investigation of the influence of the number of S-1 acquisitions used in the LRW processing indicated that around five acquisitions were required for a satisfactory detection rate in both study areas. Thus, the generation of a windthrow map could be conducted within approximately two weeks after a storm event in Europe. The actual time period is mainly dependent on the latitude of the affected region. Generally, the higher the latitude, the higher the S-1 revisit rate, and consequently the shorter the required time period [50].
For the present study, the parameter combination was chosen that resulted in the best performance with respect to UA and PA in the study area CH. A different parameter combination might result in a better performance for other areas. The two parameters can be changed and set in a flexible way, allowing for a modification of the method’s sensitivity according to its scope. Decreasing a (magnitude of backscatter change) and/or decreasing n (minimal count of associated candidate pixels) reduced the sensitivity, resulting in more suggested windthrow objects and a representation that is closer to the true windthrown area. Beyond providing a better representation of the area, it usually enhanced PA while simultaneously degrading UA. The opposite behaviour was observed when a and n were increased. Hence, the map operator can help to decide whether a high PA or UA, or a trade-off in between the two, is preferred and best meets the user’s specific requirements.
The analysis of this study and the performance measures mentioned in this manuscript are valid for windthrown areas of a minimum size of 0.5 ha. Lower performance measures should be expected when applying the method for areas that are smaller than 0.5 ha. Nevertheless, it was observed that a few smaller areas were detected, as discussed in Section 4.2.

4.6. Outlook

With the launch of the RADARSAT Constellation Mission (RCM) planned in early 2019, an increased number of SAR C-band acquisitions will be potentially available soon [51]. When combined with S-1 data, the time period could be substantially shorter to receive the number of required acquisitions for a windthrow detection of similar quality. With three further sensors available soon, the time period could be significantly reduced, allowing a rapid detection of windthrow within less than one week.
We are currently working on applying the proposed method to storm events in winter. Winter conditions are expected to be subject to more obstacles to a successful application of the method. Because temperatures that are below the freezing point would have to be reckoned with, the influence of freeze/thaw on the backscatter is likely to be confounded with the windthrow signal. In addition, snow cover could have an impact too, as wet snow has been reported to lower C-band sparse forest backscatter by up to 2 dB [24].

5. Conclusions

This study showed that S-1 C-band backscatter data successfully enabled the detection of the location of windthrown areas shortly after two severe storm events. Differences in backscatter before and after the storm event were considerably larger in windthrown areas than in intact areas. Backscatter from windthrown areas was typically about 0.5 dB higher than before the storm event. The diverging backscatter behaviour between the windthrown and intact forest areas was used to develop a method for the detection of windthrown areas. The method is based on a change detection approach applying thresholds to extract the windthrown areas using a windthrow index (WI). The results confirmed that the locations of most areal windthrows were successfully detected, however always slightly underestimated in area. This was shown by promising PAs and UAs of about 0.85 for two independent study areas in Switzerland and northern Germany. Detection was less satisfactory for single scattered windthrown trees, with PAs and UAs below 0.5.
Hence, provided that a precise forest mask is available, it is possible to generate an overview map of the spatial distribution of windthrows in a region shortly after a storm event. For Europe, using freely available Sentinel-1 data, it is currently feasible to generate such an overview within approximately two weeks—independent of cloud cover. If one were able to incorporate suitable data from RCM satellites (due for launch early in 2019), the required waiting time could shrink to half as much, potentially less than one week. This would make the approach using reliable SAR data worthy of consideration, even if its performance is worse than methods using more expensive ALS or optical data with longer latencies due to meteorological conditions. Forest managers would greatly benefit from an immediate first overview map of the windthrow locations, as it allows them to begin their planning of the clearing and reforestation of the windthrown areas as early as possible.

Author Contributions

M.R. and L.T.W. developed the methodology and conducted field work; D.S. pre- processed the SAR data; M.R. performed the remaining data manipulation and analysis; M.R. was mainly responsible for writing the paper, L.T.W. and D.S. reviewed and edited the manuscript.

Funding

This research was funded by the Swiss national forest inventory (NFI).

Acknowledgments

We would like to thank Kai Jütte and the department of forestry of Mecklenburg-Vorpommern for the provision of the aerial images and the windthrow reference map. We also thank the team of Kai Jütte for the precise image interpretation and delineation of windthrows. Further thanks go to several data providers: the European space agency (ESA) for the Sentinel-1 data; Planet imagery for the multispectral images; the Copernicus programme for the digital surface model of the German study area; swisstopo for the digital terrain model of the Swiss study area; and Meteoblue for meteorological data. Finally, we thank the two anonymous reviewers for helping us to improve the manuscript.

Conflicts of Interest

The authors declare no conflict of interest.

Appendix A

Table A1. Overview of the Sentinel-1 Ground Range Detected High Resolution (GRDH) products used in the present study. For both, the Swiss (CH) and the German (DE), study areas (SA), five acquisitions before (pre) and ten after (post) the storm event were used. As indicated in the last column, products of both pass directions ascending (asc) and descending (des) were included in the processing.
SAPre/PostDateCopernicus Open Access Hub IdentifierAsc/Des
CHpre20 July 2017S1B_IW_GRDH_1SDV_20170720T053411_20170720T053436_006567_00B8C9_0638des
CHpre22 July 2017S1A_IW_GRDH_1SDV_20170722T171516_20170722T171541_017587_01D6BC_2029asc
CHpre26 July 2017S1A_IW_GRDH_1SDV_20170726T053445_20170726T053510_017638_01D85F_736Ddes
CHpre28 July 2017S1B_IW_GRDH_1SDV_20170728T171438_20170728T171503_006691_00BC4A_0F41asc
CHpre1 August 2017S1B_IW_GRDH_1SDV_20170801T053411_20170801T053436_006742_00BDCE_523Bdes
CHpost3 August 2017S1A_IW_GRDH_1SDV_20170803T171517_20170803T171542_017762_01DC14_352Fasc
CHpost7 August 2017S1A_IW_GRDH_1SDV_20170807T053446_20170807T053511_017813_01DDB3_C117des
CHpost9 August 2017S1B_IW_GRDH_1SDV_20170809T171439_20170809T171504_006866_00C15B_856Dasc
CHpost13 August 2017S1B_IW_GRDH_1SDV_20170813T053412_20170813T053437_006917_00C2E7_8219des
CHpost15 August 2017S1A_IW_GRDH_1SDV_20170815T171517_20170815T171542_017937_01E169_D0CFasc
CHpost19 August 2017S1A_IW_GRDH_1SDV_20170819T053446_20170819T053511_017988_01E302_08B5des
CHpost21 August 2017S1B_IW_GRDH_1SDV_20170821T171439_20170821T171504_007041_00C672_489Aasc
CHpost25 August 2017S1B_IW_GRDH_1SDV_20170825T053413_20170825T053438_007092_00C7F7_4EABdes
CHpost27 August 2017S1A_IW_GRDH_1SDV_20170827T171518_20170827T171543_018112_01E6B4_8BA5asc
CHpost31 August 2017S1A_IW_GRDH_1SDV_20170831T053447_20170831T053512_018163_01E845_EBD7des
DEpre25 September 2017S1B_IW_GRDH_1SDV_20170925T052421_20170925T052446_007544_00D51A_43AEdes
DEpre28 September 2017S1B_IW_GRDH_1SDV_20170928T165954_20170928T170019_007595_00D689_FC15asc
DEpre30 September 2017S1B_IW_GRDH_1SDV_20170930T053234_20170930T053259_007617_00D737_E3E3des
DEpre1 October 2017S1A_IW_GRDH_1SDV_20171001T052455_20171001T052520_018615_01F62C_8AABdes
DEpre4 October 2017S1A_IW_GRDH_1SDV_20171004T170038_20171004T170103_018666_01F7B5_BA85asc
DEpost6 October 2017S1A_IW_GRDH_1SDV_20171006T053308_20171006T053333_018688_01F871_C8DAdes
DEpost7 October 2017S1B_IW_GRDH_1SDV_20171007T052421_20171007T052446_007719_00DA22_3499des
DEpost10 October 2017S1B_IW_GRDH_1SDV_20171010T165954_20171010T170019_007770_00DB8C_FCFDasc
DEpost12 October 2017S1B_IW_GRDH_1SDV_20171012T053234_20171012T053259_007792_00DC33_6B31des
DEpost16 October 2017S1A_IW_GRDH_1SDV_20171016T170038_20171016T170103_018841_01FD0D_D8CCasc
DEpost18 October 2017S1A_IW_GRDH_1SDV_20171018T053308_20171018T053333_018863_01FDCC_6C39des
DEpost19 October 2017S1B_IW_GRDH_1SDV_20171019T052421_20171019T052446_007894_00DF19_7084des
DEpost24 October 2017S1B_IW_GRDH_1SDV_20171024T053234_20171024T053259_007967_00E134_627Ades
DEpost25 October 2017S1A_IW_GRDH_1SDV_20171025T052455_20171025T052520_018965_0200D3_BC00des
DEpost28 October 2017S1A_IW_GRDH_1SDV_20171028T170038_20171028T170103_019016_02025E_D4A5asc

References

  1. McCarthy, J.K.; Hood, I.A.; Kimberley, M.O.; Didham, R.K.; Bakys, R.; Fleet, K.R.; Brownlie, R.K.; Flint, H.J.; Brockerhoff, E.G. Effects of season and region on sapstain and wood degrade following simulated storm damage in Pinus radiata plantations. For. Ecol. Manag. 2012, 277, 81–89. [Google Scholar] [CrossRef]
  2. Økland, B.; Berryman, A. Resource dynamic plays a key role in regional fluctuations of the spruce bark beetles Ips typographus. Agric. For. Entomol. 2004, 6, 141–146. [Google Scholar] [CrossRef]
  3. Havašová, M.; Ferenčík, J.; Jakuš, R. Interactions between windthrow, bark beetles and forest management in the Tatra national parks. For. Ecol. Manage. 2017, 391, 349–361. [Google Scholar] [CrossRef]
  4. Schwarz, M.; Steinmeier, C.; Holecz, F.; Stebler, O.; Wagner, H. Detection of Windthrow in Mountainous Regions with Different Remote Sensing Data and Classification Methods. Scand. J. For. Res. 2003, 18, 525–536. [Google Scholar] [CrossRef]
  5. Usbeck, T.; Wohlgemuth, T.; Dobbertin, M.; Pfister, C.; Bürgi, A.; Rebetez, M. Increasing storm damage to forests in Switzerland from 1858 to 2007. Agric. For. Meteorol. 2010, 150, 47–55. [Google Scholar] [CrossRef]
  6. Seidl, R.; Schelhaas, M.J.; Rammer, W.; Verkerk, P.J. Increasing forest disturbances in Europe and their impact on carbon storage. Nat. Clim. Chang. 2014, 4, 806–810. [Google Scholar] [CrossRef] [PubMed] [Green Version]
  7. Dyukarev, E.A.; Pologova, N.N.; Golovatskaya, E.A.; Dyukarev, A.G. Forest cover disturbances in the South Taiga of West Siberia. Environ. Res. Lett. 2011, 6. [Google Scholar] [CrossRef]
  8. Jonikavičius, D.; Mozgeris, G. Rapid assessment of wind storm-caused forest damage using satellite images and stand-wise forest inventory data. iForest 2013, 6, 150–155. [Google Scholar] [CrossRef] [Green Version]
  9. Baumann, M.; Ozdogan, M.; Wolter, P.T.; Krylov, A.; Vladimirova, N.; Radeloff, V.C. Landsat remote sensing of forest windfall disturbance. Remote Sens. Environ. 2014, 143, 171–179. [Google Scholar] [CrossRef]
  10. Elatawneh, A.; Wallner, A.; Manakos, I.; Schneider, T.; Knoke, T. Forest cover database updates using multi-seasonal rapideye data-storm event assessment in the Bavarian Forest National Park. Forests 2014, 5, 1284–1303. [Google Scholar] [CrossRef]
  11. Einzmann, K.; Immitzer, M.; Böck, S.; Bauer, O.; Schmitt, A.; Atzberger, C. Windthrow Detection in European Forests with Very High-Resolution Optical Data. Forests 2017, 8, 21. [Google Scholar] [CrossRef]
  12. Honkavaara, E.; Litkey, P.; Nurminen, K. Automatic Storm Damage Detection in Forests Using High-Altitude Photogrammetric Imagery. Remote Sens. 2013, 5, 1405–1424. [Google Scholar] [CrossRef]
  13. Mokroš, M.; Výbošt’ok, J.; Merganič, J.; Hollaus, M.; Barton, I.; Koreň, M.; Tomaštík, J.; Čerňava, J. Early stage forest windthrow estimation based on unmanned aircraft system imagery. Forests 2017, 8, 306. [Google Scholar] [CrossRef]
  14. Duan, F.; Wan, Y.; Deng, L. A novel approach for coarse-to-fine windthrown tree extraction based on unmanned aerial vehicle images. Remote Sens. 2017, 9, 306. [Google Scholar] [CrossRef]
  15. Nyström, M.; Holmgren, J.; Fransson, J.E.S.; Olsson, H. Detection of windthrown trees using airborne laser scanning. Int. J. Appl. Earth Obs. Geoinf. 2014, 30, 21–29. [Google Scholar] [CrossRef]
  16. Polewski, P.; Yao, W.; Heurich, M.; Krzystek, P.; Stilla, U. Learning a constrained conditional random field for enhanced segmentation of fallen trees in ALS point clouds. ISPRS J. Photogramm. Remote Sens. 2018, 140, 33–44. [Google Scholar] [CrossRef]
  17. Kellndorfer, J.M.; Pierce, L.E.; Dobson, M.C.; Ulaby, F.T. Toward consistent regional-to-global-scale vegetation characterization using orbital SAR systems. IEEE Trans. Geosci. Remote Sens. 1998, 36, 1396–1411. [Google Scholar] [CrossRef]
  18. Solimini, D. Understanding Earth Observation; Springer International Publishing: Basel, Switzerland, 2016; pp. 1–703. ISBN 978-3-319-25633-7. [Google Scholar]
  19. Leckie, D.G.; Ranson, K.J. Forestry Applications Using Imaging Radar. In Manual of Remote Sensing: Principles and Applications of Imaging Radar, 3rd ed.; Henderson, F.M., Lewis, A.J., Eds.; John Wiley & Sons, Inc.: New York, NY, USA, 1998; pp. 435–510. ISBN 978-0471294061. [Google Scholar]
  20. Way, J.; Parist, J.; Kasischke, E.; Slaughter, C.; Viereck, L.; Christensen, N.; Dobson, M.C.; Ulaby, F.; Richards, J.; Milne, A.; et al. The effect of changing environmental conditions on microwave signatures of forest ecosystems: Preliminary results of the March 1988 Alaskan aircraft SAR experiment. Int. J. Remote Sens. 1990, 11, 1119–1144. [Google Scholar] [CrossRef]
  21. Wegmüller, U.; Holecz, F.; Wan, Y.; Kattenborn, G. Theoretical sensitivity of ERS-1 SAR backscatter over forest. In Proceedings of the International Geoscience and Remote Sensing Symposium (IGARSS), Pasadena, CA, USA, 8–12 August 1994; pp. 2477–2479. [Google Scholar]
  22. Proisy, C.; Mougin, E.; Dufrêne, E.; Le Dantec, V. Monitoring seasonal changes of a mixed temperate forest using ERS SAR observations. IEEE Trans. Geosci. Remote Sens. 2000, 38, 540–552. [Google Scholar] [CrossRef]
  23. Sharma, R.; Leckie, D.; Hill, D.; Crooks, B.; Bhogal, A.S.; Arbour, P.; D’eon, S. Hyper-Temporal Radarsat SAR data of a Forested Terrain. In Proceedings of the International Workshop on the Analysis of Multi-Temporal Remote Sensing Images, Biloxi, MA, USA, 16–18 May 2005; pp. 71–75. [Google Scholar]
  24. Koskinen, J.T.; Pulliainen, J.T.; Hallikainen, M.T. The Use of ERS-1 SAR Data in Snow Melt Monitoring. IEEE Trans. Geosci. Remote Sens. 1997, 35, 601–610. [Google Scholar] [CrossRef]
  25. Westman, W.E.; Paris, J.F. Detecting forest structure and biomass with C-band multipolarization Radar: Physical model and field tests. Remote Sens. Environ. 1987, 22, 249–269. [Google Scholar] [CrossRef]
  26. Dobson, M.C.; Ulaby, F.T.; LeToan, T.; Beaudoin, A.; Kasischke, E.S.; Christensen, N. Dependence of radar backscatter on coniferous forest biomass. IEEE Trans. Geosci. Remote Sens. 1992, 30, 412–415. [Google Scholar] [CrossRef]
  27. Imhoff, M.L. A Theoretical Analysis of the Effect of Forest Structure on Synthetic Aperture Radar Backscatter and the Remote Sensing of Biomass. IEEE Trans. Geosci. Remote Sens. 1995, 33, 341–352. [Google Scholar] [CrossRef]
  28. Ahern, F.J.; Leckie, D.J.; Drieman, J.A. Seasonal changes in relative C-band backscatter of northern forest cover types. IEEE Trans. Geosci. Remote Sens. 1993, 31, 668–680. [Google Scholar] [CrossRef]
  29. Rüetschi, M.; Schaepman, M.E.; Small, D. Using multitemporal Sentinel-1 C-band backscatter to monitor phenology and classify deciduous and coniferous forests in northern Switzerland. Remote Sens. 2018, 10, 55. [Google Scholar] [CrossRef]
  30. Green, R.M. The sensitivity of SAR backscatter to forest windthrow gaps. Int. J. Remote Sens. 1998, 19, 2419–2425. [Google Scholar] [CrossRef]
  31. Fransson, J.E.S.; Walter, F.; Blennow, K.; Gustavsson, A.; Ulander, L.M.H. Detection of storm-damaged forested areas using airborne CARABAS-II VHF SAR image data. IEEE Trans. Geosci. Remote Sens. 2002, 40, 2170–2175. [Google Scholar] [CrossRef] [Green Version]
  32. Eriksson, L.E.B.; Fransson, J.E.S.; Soja, M.J.; Santoro, M. Backscatter signatures of wind-thrown forest in satellite SAR images. In Proceedings of the International Geoscience and Remote Sensing Symposium (IGARSS), Munich, Germany, 22–27 July 2012; pp. 6435–6438. [Google Scholar]
  33. Thiele, A.; Boldt, M.; Hinz, S. Automated detection of storm damage in forest areas by analyzing TerraSAR-X data. In Proceedings of the International Geoscience and Remote Sensing Symposium (IGARSS), Munich, Germany, 22–27 July 2012; pp. 1672–1675. [Google Scholar]
  34. Ulander, L.M.H.; Smith, G.; Eriksson, L.; Folkesson, K.; Fransson, J.E.S.; Gustavsson, A.; Hallberg, B.; Joyce, S.; Magnusson, M.; Olsson, H.; et al. Mapping of wind-thrown forests in southern Sweden using space- and airborne SAR. In Proceedings of the International Geoscience and Remote Sensing Symposium (IGARSS), Seoul, South Korea, 25–29 July 2005; pp. 3619–3622. [Google Scholar]
  35. Tanase, M.A.; Aponte, C.; Mermoz, S.; Bouvet, A.; Le Toan, T.; Heurich, M. Detection of windthrows and insect outbreaks by L-band SAR: A case study in the Bavarian Forest National Park. Remote Sens. Environ. 2018, 209, 700–711. [Google Scholar] [CrossRef]
  36. Torres, R.; Snoeij, P.; Geudtner, D.; Bibby, D.; Davidson, M.; Attema, E.; Potin, P.; Rommen, B.Ö.; Floury, N.; Brown, M.; et al. GMES Sentinel-1 mission. Remote Sens. Environ. 2012, 120, 9–24. [Google Scholar] [CrossRef]
  37. Swiss Severe Weather Database 20170802 01 Downburst Nordschweiz. Available online: http://www. sturmarchiv.ch/index.php?title=20170802_01_Downburst_Nordschweiz (accessed on 3 November 2018).
  38. German Weather Service Sturmtief XAVIER zieht am 5. Oktober 2017 mit Orkanböen über Deutschland. Available online: https://www.dwd.de/DE/leistungen/besondereereignisse/stuerme/20171009_sturmtief _xavier_deutschland.pdf?__blob=publicationFile&v=4 (accessed on 3 November 2018).
  39. Schubert, A.; Miranda, N.; Geudtner, D.; Small, D. Sentinel-1A/B Combined Product Geolocation Accuracy. Remote Sens. 2017, 9, 607. [Google Scholar] [CrossRef]
  40. Federal Office of Topography Swisstopo swissALTI3D. Available online: https://www.swisstopo.admin. ch/content/swisstopo-internet/de/home/products/height/alti3d/_jcr_content/contentPar/tabs/items/dokmente/tabPar/downloadlist/downloadItems/846_1464690554132.download/swissALTI3D_detaillierteProduktinfo_201802_DE.pdf (accessed on 12 October 2018).
  41. Copernicus EU-DEM v1.1. Available online: https://land.copernicus.eu/pan-european/satellite-derived- products/eu-dem/eu-dem-v1.1/view (accessed on 2 November 2018).
  42. Planet. Planet Imagery Product Specifications. Available online: https://www.planet.com/products/ satellite-imagery/files/Planet_Combined_Imagery_Product_Specs_December2017.pdf (accessed on 3 November 2018).
  43. GDAL Geospatial Data Abstraction Library. Available online: http://www.gdal.org (accessed on 7 October 2018).
  44. Ginzler, C.; Hobi, M.L. Countrywide stereo-image matching for updating digital surface models in the framework of the swiss national forest inventory. Remote Sens. 2015, 7, 4343–4370. [Google Scholar] [CrossRef]
  45. Small, D. Flattening Gamma: Radiometric terrain correction for SAR imagery. IEEE Trans. Geosci. Remote Sens. 2011, 49, 3081–3093. [Google Scholar] [CrossRef]
  46. Small, D. SAR backscatter multitemporal compositing via local resolution weighting. In Proceedings of the International Geoscience and Remote Sensing Symposium (IGARSS), Munich, Germany, 22–27 July 2012; pp. 4521–4524. [Google Scholar] [CrossRef]
  47. Lu, D.; Mausel, P.; Brondízio, E.; Moran, E. Change detection techniques. Int. J. Remote Sens. 2003, 25, 2365–2401. [Google Scholar] [CrossRef]
  48. Tewkesbury, A.P.; Comber, A.J.; Tate, N.J.; Lamb, A.; Fisher, P.F. A critical synthesis of remotely sensed optical image change detection techniques. Remote Sens. Environ. 2015, 160, 1–14. [Google Scholar] [CrossRef] [Green Version]
  49. Waser, L.T.; Fischer, C.; Wang, Z.; Ginzler, C. Wall-to-wall forest mapping based on digital surface models from image-based point clouds and a NFI forest definition. Forests 2015, 6, 4510–4528. [Google Scholar] [CrossRef]
  50. ESA Revisit and Coverage. Available online: https://sentinel.esa.int/web/sentinel/user-guides/sentinel-1- sar/revisit-and-coverage (accessed on 14 October 2018).
  51. Dabboor, M.; Iris, S.; Singhroy, V. The RADARSAT Constellation Mission in Support of Environmental Applications. Proceedings 2018, 2, 323. [Google Scholar] [CrossRef]
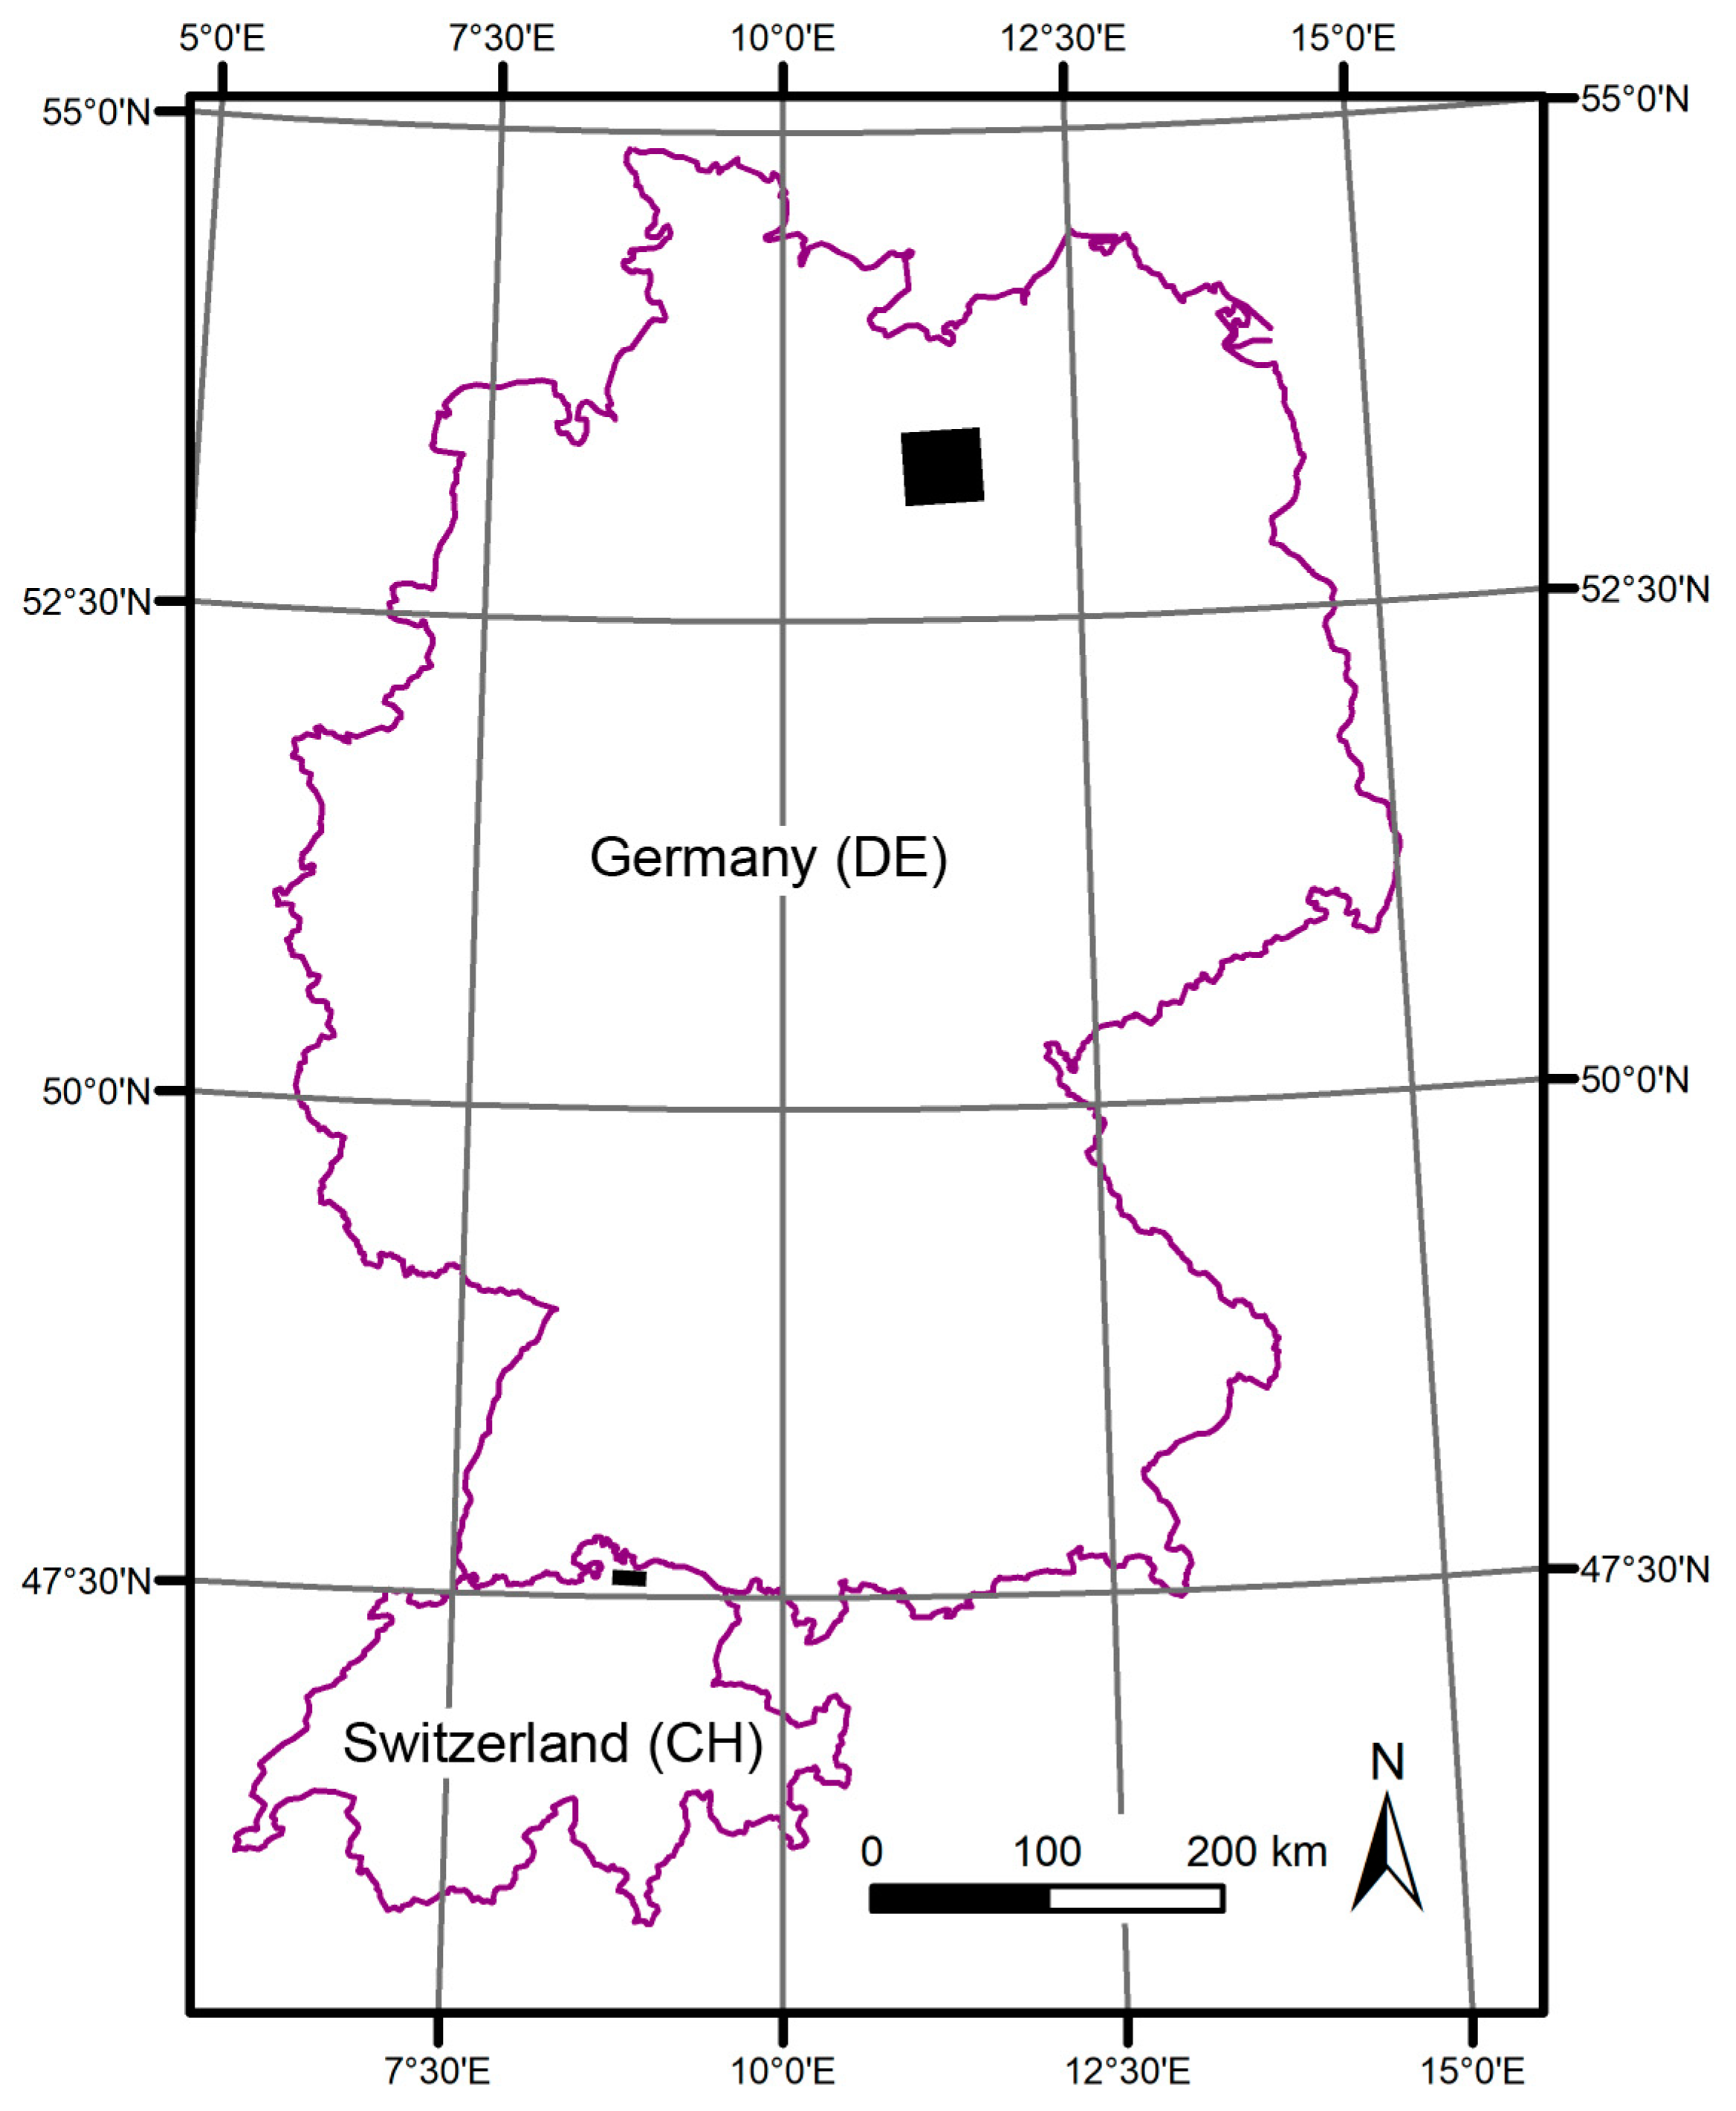
Figure 1. Both study areas were located in central Europe. The black rectangles indicate the locations and extents of the two study areas. The area in northern Germany east of Lüneburg (DE) was considerably larger than the one in northern Switzerland southeast of Schaffhausen (CH).
Remotesensing 11 00115 g001
Figure 2. Example of windthrown areas for the two study areas in Switzerland (a) and Germany (b). The yellow lines indicate the borders of the digitised windthrown area after comparing orthoimages from before and after the storm event. Planet and aerial images were used to digitise the windthrows in the study areas in Switzerland and Germany, respectively. For the German study area, the digitised windthrow, as shown in the image, belongs to the category ‘areal windthrow’. © Planet imagery/© Department of forestry of Mecklenburg-Vorpommern.
Remotesensing 11 00115 g002
Figure 3. Synthetic aperture radar (SAR) data processing scheme. For both study areas, acquisitions of both polarisations vertical-vertical (VV) and vertical-horizontal (VH) were processed, as displayed in the scheme. This processing scheme was followed to derive the γ LRW 0 composites representing before and after the storm event.
Remotesensing 11 00115 g003
Figure 4. Image differencing and the subsequent calculation of statistics within the forest and windthrow reference masks. Both steps were performed for both VV and VH polarisations.
Remotesensing 11 00115 g004
Figure 5. Example of the functionality of the windthrow detection method. (a) True colour Planet image of the region with the borders of the digitised windthrown areas (yellow lines) and (b) windthrow index (WI) of the region in dB. (c) The result after the first branch in the decision tree with all potential windthrown areas in the forest. (d) The final result after application of the minimum size threshold. Only larger objects remain, leading to a more realistic representation of the windthrow in the forest. © Planet imagery/Contains modified Copernicus Sentinel data (2017).
Remotesensing 11 00115 g005
Figure 6. Decision tree with two branches to obtain the windthrown areas from the windthrow index. To detect the windthrows, the two parameters a and n need to be defined by the user.
Remotesensing 11 00115 g006
Figure 7. Scatterplots comparing pre- and post-storm backscatter. In the first row, (a,b) VV and VH backscatter are displayed from the mainly intact forest area. In the second row, (c,d) backscatter of the same polarisations are depicted from the windthrown areas. The number of pixels was considerably lower for (c,d). Contains modified Copernicus Sentinel data (2017).
Remotesensing 11 00115 g007aRemotesensing 11 00115 g007b
Figure 8. Windthrow maps generated with different parameter combinations. The combinations used were (a) n = 15, a = 2.8, (b) n = 15, a = 2.9, (c) n = 25, a = 2.8, and (d) n = 27, a = 2.9, the best combination for the Swiss study area (CH). Both parameters strongly affected the number of suggested windthrows. © Planet imagery/Contains modified Copernicus Sentinel data (2017).
Remotesensing 11 00115 g008
Figure 9. Matrices of the performance measures (a) producer’s accuracy (PA) and (b) user’s accuracy (UA) for different combinations of the parameter a and n in the Swiss study area (CH). Higher PAs were reached with lower a and n, higher UAs with higher a and n. The red rectangles indicate the chosen parameter combination.
Remotesensing 11 00115 g009
Figure 10. Influence of the number of Sentinel-1 (S-1) acquisitions used in the local resolution weighting (LRW) processing for the windthrow map generation. The number of S-1 acquisitions after the storm event was gradually increased from one to ten for both study areas. The displayed map quality corresponds to the mean of PA and UA for each map. ‘asc’ and ‘des’ indicate the additional acquisition’s pass direction ascending and descending, respectively.
Remotesensing 11 00115 g010
Table 1. Overview of the reference windthrown areas used for developing the method. The number of areas (n) for each range of 0.5 ha extent (ex) is displayed. The minimum and maximum extent observed were 0.51 and 3.07 ha, respectively.
ex (ha)n
0.51–112
1–1.54
1.5–22
2–2.55
2.5–32
3–3.071
All26
Table 2. Overview of the reference windthrown areas used for validating the method. The number of areas (n) for each range of 0.5 ha extent (ex) is displayed for all three windthrow categories. The minimum and maximum extents observed were 0.5 and 13.49 ha, respectively.
‘Single Windthrown Trees’‘Single Standing Trees’‘Areal Windthrow’All
ex (ha)nex (ha)nex (ha)nn
0.5–11170.54–1130.51–14134
1–1.5461–1.3241–1.5151
1.5–2181.5–201.5–2119
2–2.5112–2.502–2.5112
2.5–382.5–302.5–308
3–13.49253–3.503–3.37126
All225All17All8250
Table 3. Statistics mean (mn) and standard deviation (sd) of the γ LRW 0 difference composite calculated for mainly intact and windthrown forest areas in the Swiss study area (CH). The number of pixels (n) was considerably lower for the windthrown areas.
PolarisationWithin Whole Forest MaskWithin Windthrow Reference Mask
nmn (dB)sd (dB)nmn (dB)sd (dB)
VV803540.051.5841010.51.78
VH0.311.60.971.81
Table 4. Contingency tables for the two cases “windthrow” (w) and “no windthrow” (nw) with performance measures PA and UA for the classes ‘areal windthrow’, ‘single standing trees’ and ‘single windthrown trees’ in the German study area (DE).
‘Areal Windthrow’‘Single Standing Trees’‘Single Windthrown Trees’
ReferenceProduct ReferenceProduct ReferenceProduct
wnwPAwnwPAwnwPA
w710.88w5120.29w162090.07
nw26- nw28- nw17-
UA0.21 UA0.15 UA0.48
Table 5. Comparison of the most frequently used remote sensing systems to detect locations of windthrown areas in a fast response framework. The systems are compared according to their latency to collect the data required, their cost and their areal coverage. Examples are given in brackets.
Remote Sensing SystemLatencyCostAreal CoverageExamples
Airborne opticalshort-long *highsmall[12,13,14]
Airborne ALSshort-long *highsmall[15,16]
Airborne SARshort-long *highsmall[30,31]
Spaceborne opticalshort-long *low-medium **large[7,8,9,10,11]
Spaceborne exact repeat track SARmediumlow-medium **large[32,33,34,35]
Spaceborne LRW SAR (multi-track)shortlow-medium **large-
* depending on meteorological conditions, ** depending on sensor used.