Supply and Demand Assessment of Solar PV as Off-Grid Option in Asia Pacific Region with Remotely Sensed Data


Abstract

1. Introduction
2. Data and Methods
2.1. Data Description
2.2. Methods
2.2.1. Estimation of Population in Unlit Areas
2.2.2. Cost and Benefit Analysis for Solar PV Installation
2.2.3. Extraction of Power Transmission Lines
3. Results
3.1. High Potential Areas for Solar PV Installation
3.2. Electrification in Highly Populated Areas
3.3. Supply and Demand of Electricity
3.4. Off-Grid Areas Based on Extracted Transmission Lines
4. Discussions
5. Conclusions
Author Contributions
Funding
Acknowledgments
Conflicts of Interest
References
- Wolfe, P. Solar Photovoltaic Projects in the Mainstream Power Market; Routledge: New York, NY, USA, 2013. [Google Scholar]
- REN21. Renewables 2018 Global Status Report REN21; Secretariat: Paris, Franch, 2018. [Google Scholar]
- Chander, S.; Purohit, A.; Sharma, A.; Arvind, S.P.N.; Dhaka, M. A study on photovoltaic parameters of mono-crystalline silicon solar cell with temperature. Energy Rep. 2015, 1, 104–109. [Google Scholar] [CrossRef]
- Mishra, P.; Behera, B. Socio-Economic and environmental implications of solar electrification: Experience of rural Odisha. Renew. Sustain. Energy Rev. 2015, 56, 953–964. [Google Scholar] [CrossRef]
- Palit, D. Solar energy programs for rural electrification: Experiences and lessons from South Asia. Energy Sustain. Dev. 2013, 17, 270–279. [Google Scholar] [CrossRef]
- Szymczak, P.D. Asia Pac Leads Global Solar Photovoltaic (PV) Market. 18 December 2018. Available online: https://oilandgaseurasia.com/2018/12/18/asia-pac-leads-global-solar-photovoltaic-pv-market/ (accessed on 18 May 2019).
- Blue & Green Tomorrow, Asia-Pacific Solar Photovoltaic Installed Capacity to Continue Significant Growth by 2025, Says Global Data. 23 September 2015. Available online: https://blueandgreentomorrow.com/energy/asia-pacific-solar-photovoltaic-installed-capacity-to-continue-significant-growth-by-2025-says-globaldata/ (accessed on 18 May 2019).
- International Renewable Energy Agency. The Socio-Economic Benefits of Solar and Wind Energy; IRENA: Abu Dhabi, UAE, 2014. [Google Scholar]
- Bhaduri, B.; Bright, E.; Coleman, P.; Urban, M. LandScan USA: A high-resolution geospatial and temporal modeling approach for population distribution and dynamics. GeoJournal 2007, 69, 103–117. [Google Scholar] [CrossRef]
- Min, B.; Gaba, K.M.; Sarr, O.F.; Agalassou, A. Detection of rural electrification in Africa using DMSP-OLS night lights imagery. Int. J. Remote. Sens. 2013, 34, 8118–8141. [Google Scholar] [CrossRef]
- Min, B.; Gaba, K.M. Tracking Electrification in Vietnam Using Nighttime Lights. Remote. Sens. 2014, 6, 9511–9529. [Google Scholar] [CrossRef]
- Falchetta, G.; Pachauri, S.; Parkinson, S.; Byers, E. A high-resolution gridded dataset to assess electrification in sub-Saharan Africa. Sci. Data. 2019, 6, 1–9. [Google Scholar] [CrossRef] [PubMed]
- Silva, C.R.; Pacheco, A.D.P.; Centeno, J.A.S. Automatic Extraction of Power Transmission Lines Using Laser Scanner Data. J. Remote Sens. Technol. 2015, 3, 46–54. [Google Scholar] [CrossRef]
- Chen, Y.; Li, Y.; Zhang, H.; Tong, L.; Cao, Y.; Xue, Z. Automatic power line extraction from high resolution remote sensing imagery based on an improved Radon transform. Pattern Recognit. 2016, 49, 174–186. [Google Scholar] [CrossRef]
- Zhang, Y.; Yuan, X.; Li, W.; Chen, S. Automatic Power Line Inspection Using UAV Images. Remote Sens. 2017, 9, 824. [Google Scholar] [CrossRef]
- Yadav, M.; Chousalkar, C.G. Extraction of power lines using mobile LiDAR data of roadway environment. Remote Sens. Appl. Soc. Environ. 2017, 8, 258–265. [Google Scholar] [CrossRef]
- Toschi, I.; Morabito, D.; Grilli, E.; Remondino, F.; Carlevaro, C.; Cappellotto, A.; Tamagni, G.; Maffeis, M. Cloud-Based Solution for Nationwide Power Line Mapping. Int. Arch. Photogramm. Remote Sens. Spat. Inf. Sci. 2019, XLII-2/W13, 119–126. [Google Scholar] [CrossRef]
- Korkovelos, A.; Khavari, B.; Sahlberg, A.; Howells, M.; Arderne, C. The Role of Open Access Data in Geospatial Electrification Planning and the Achievement of SDG7. An OnSSET-Based Case Study for Malawi. Energies. 2019, 12, 1395. [Google Scholar] [CrossRef]
- Principe, J.; Takeuchi, W. Assessment of solar PV power potential over Asia Pacific region with remote sensing considering meteorological factors. J. Renew. Sustain. Energy. 2019, 11, 013502. [Google Scholar] [CrossRef]
- Oak Ridge National Laboratory. LandScan Documentation. Available online: https://landscan.ornl.gov/documentation (accessed on 29 June 2018).
- Jing, X.; Shao, X.; Cao, C.; Fu, X.F.; Yan, L. Comparison between the Suomi-NPP Day-Night Band and DMSP-OLS for Correlating Socio-Economic Variables at the Provincial Level in China. Remote Sens. 2016, 8, 17. [Google Scholar] [CrossRef]
- Elvidge, C.D.; Baugh, K.; Zhizhin, M.; Hsu, F.C. Why VIIRS Data are Superior to DMSP for Mapping Nighttime Lights. In Proceedings of the 36th Meeting of the Asia-Pacific Advanced Network, Daejeon, Korea, 19–23 August 2013. [Google Scholar] [CrossRef]
- Meijer, J.R.; Huijbregts, M.A.J.; Schotten, K.C.G.J.; Schipper, A.M. Global patterns of current and future road infrastructure. Environ. Res. Lett. 2018, 16, 1–11. [Google Scholar] [CrossRef]
- NOAA. Version 4 DMSP-OLS Nighttime Lights Time Series. Available online: https://ngdc.noaa.gov/eog/dmsp/downloadV4composites.html (accessed on 29 October 2018).
- Tadono, T.; Takaku, J.; Tsutsui, K.; Oda, F.; Nagai, H. Status of ALOS World 3D (AW3D) Global DSM Generation. In Proceedings of the 2015 IEEE International Geoscience and Remote Sensing Symposium (IGARSS), Milan, Italy, 26–31 July 2015. [Google Scholar] [CrossRef]
- Yamazaki, D.; Ikeshima, D.; Tawatari, R.; Yamaguchi, T.; OLoughlin, F.; Neal, J.C.; Sampson, C.C.; Kanae, S.; Bates, P.D. A high-accuracy map of global terrain elevations. Geophys. Res. Lett. 2017, 44, 5844–5853. [Google Scholar] [CrossRef]
- Friedl, M.A.; Sulla-Menashe, D.; Tan, B.; Schneider, A.; Ramankutty, N.; Sibley, A.; Huang, X. MODIS Collection 5 global land cover: Algorithm refinements and characterization of new datasets. Remote Sens. Environ. 2010, 114, 168–182. [Google Scholar] [CrossRef]
- The World Bank. Electric Power Consumption (kWh Per Capita). Available online: https://data.worldbank.org/indicator/EG.USE.ELEC.KH.PC (accessed on 22 April 2018).
- United Nations Statistics Division. UN Data A World of Information. Available online: http://data.un.org/Data.aspx?d=SNA&f=group_code%3A302 (accessed on 18 February 2019).
- Clean Energy Council. Guide to Installing Solar for Households. Available online: http://www.solaraccreditation.com.au/dam/cec-solar-accreditation-shared/guides/Guide-to-installing-solar-PV-for-households.pdf (accessed on 18 February 2019).
- Sanjel, N.; Shah, M.; Zahnd, A.; Upadhyaya, M. Power Generation Potential and Cost of a Roof Top Solar PV System in Kathmandu, Nepal. In Proceedings of the International Conference on Renewable Energy Technology for Sustainable Development (RETSUD-09), Kathmandu, Nepal, 12–14 November 2009. [Google Scholar]
- Bangladesh Energy Regulatory Commission. Tariff for Rooftop Solar PV Electricity Regulations. Available online: http://berc.portal.gov.bd/sites/default/files/files/berc.portal.gov.bd/page/a250b6fc_8bcf_4c96_bb20_3c3de230467a/berc_tariff_regulations_rooftof_solar%28draft%29.pdf (accessed on 18 February 2018).
- My Solar Quotes Limited. The Price of a Solar Power System. Available online: https://mysolarquotes.co.nz/about-solar-power/residential/how-much-does-a-solar-power-system-cost (accessed on 19 February 2019).
- Department of Energy Government of Bhutan. BHU: Rural Renewable Energy Development Project. Available online: https://www.adb.org/sites/default/files/project-document/63101/42252-02-bhu-iee-04.pdf (accessed on 18 February 2019).
- Lhendupa, T.; Wangchuk, S.; Norbu, L.; Rinzin, C.; Lhundup, S. Simulated Performance of a Grid-Connected and Standalone Photovoltaic Power System. Int. J. Sci. Eng. Res. 2016, 7, 678–683. [Google Scholar]
- Pearson, J. In North Korea, Solar Panel Boom Gives Power to the People. Available online: https://www.reuters.com/article/northkorea-solar-idUSL4N0XC2O620150421 (accessed on 19 February 2019).
- Ying, C.X.; Saleh, N.N.B. Solar Panel Guideline for Residence, Green Brunei. 2017. Available online: https://green-brunei.com/solar-panel-installation (accessed on 20 February 2019).
- Palau Energy Office. Strategic Action Plan Energy Sector. Available online: http://prdrse4all.spc.int/system/files/essap_final_draft_23-10.pdf (accessed on 19 February 2019).
- Phoumin, H. Renewable Energy Policies and the Solar Home System in Cambodia. Available online: http://www.eria.org/ERIA-DP-2015-64.pdf (accessed on 18 February 2019).
- APERC. Peer Review on Low Carbon Energy Policies in Papua New Guinea. Available online: https://aperc.ieej.or.jp/file/2017/12/13/PRLCE_Report_in_PNG.pdf (accessed on 19 February 2019).
- Bin, L. China’s Solar Industry Is at a Crossroads. Available online: https://www.chinadialogue.net/article/show/single/en/10775-China-s-solar-industry-is-at-a-crossroads (accessed on 18 February 2019).
- Solar Philippines. Price List Standard Package (Residential). Available online: https://www.solarphilippines.ph/residential (accessed on 19 February 2019).
- Lal, S.; Raturi, A. Techno-economic analysis of a hybrid mini-grid system for Fiji Islands. Int. J. Energy Environ. Eng. 2012, 3, 1–10. [Google Scholar] [CrossRef]
- Mayr, F. The Russian Wind and Solar Market: The “Green Giant” Shows Signs of Waking up. Available online: https://www.apricum-group.com/russian-wind-solar-market-green-giant-shows-signs-waking/#_ftnref3 (accessed on 20 February 2019).
- Amplus Solar. Solar Electricity Cost. Available online: https://amplussolar.com/solar-electricity-cost (accessed on 19 February 2019).
- Doshi, T.K.; D’Souza, N.S.; Nguyen, L.; Guan, T.H.; Zahur, N.B. The Economics of Solar PV in Singapore. Int. J. Eng. Technol. 2013, 2, 53–63. [Google Scholar] [CrossRef]
- ADB. Tariff Support for Wind Power and Rooftop Solar PV in Indonesia. Available online: https://static1.squarespace.com/static/53bcdf41e4b0dcd494de635e/t/553f018fe4b0a46bddb2d6b8/1430192527324/CAT+Projects+Indonesia+Wind++RooftopPV+tariffs.pdf (accessed on 19 February 2019).
- Lee, M. The Price of Korean Photovoltaic Technology and the Impact of R&D. J. Environ. Stud. 2016, 2, 1–10. [Google Scholar]
- Yamada, H.; Ikki, O. National Survey Report of PV Power Applications in JAPAN 2016; IEA: Paris, France, 2016. [Google Scholar]
- ADB. Rooftop Solar Power Generation Project: Report and Recommendation of the President. September 2017. Available online: https://www.adb.org/projects/documents/sri-50373-002-rrp (accessed on 20 February 2019).
- Julius, S. Limits of grid extension in the Lao PDR: A financial perspective. J. Humanit. Eng. 2012, 1, 27–38. [Google Scholar]
- Crook, S. Rooftop Power Plants. Available online: https://taiwantoday.tw/news.php?unit=8,29,32&post=14214 (accessed on 20 February 2019).
- Choong, M.Y. Harnessing Rooftops to Generate Solar Power. Available online: https://www.thestar.com.my/lifestyle/features/2012/10/16/harnessing-rooftops-to-generate-solar-power (accessed on 19 February 2019).
- MacDonald, S. Solar Photovoltaic Energy in Thailand: An Assessment of Government Support Mechanisms. Available online: http://www.lse.ac.uk/asiaResearchCentre/_files/ThaiGovScholarScottMacDonald.pdf (accessed on 20 February 2019).
- Nachine, D. Small-Scale Energy Development in Northeast Asia: Experience, Prospects and Social Implications of Solar PV in Mongolia. Erina Rep. 2003, 50, 41–44. [Google Scholar]
- Nerini, F.F.; Dargaville, R.; Howells, M.; Bazilian, M. Estimating the cost of energy access: The case of the village of Suro Craic in Timor Leste, Energy. Energy 2015, 79, 385–397. [Google Scholar] [CrossRef]
- Naing, K. Solar Power Seen as Solution for Remote Villages. Available online: http://www.myanmar.gov.mm/myanmartimes/no186/MyanmarTimes10-186 (accessed on 19 February 2019).
- Thanh, L. Solar Power Costs Remain High in Vietnam. Available online: https://english.vietnamnet.vn/fms/science-it/175646/solar-power-costs-remain-high-in-vietnam.html (accessed on 20 February 2019).
- Nguyen, A. Solar Power Speeds up Approaching Household Sector. Available online: https://e.vnexpress.net/news/business/solar-power-speeds-up-approaching-household-sector-3780592.html (accessed on 20 February 2019).
- Wu, J.; He, S.; Peng, J.; Li, W.; Zhong, X. Intercalibration of DMSP-OLS night-time light data by the invariant region method. Int. J. Remote Sens. 2013, 34, 7356–7368. [Google Scholar] [CrossRef]
- Kyba, C.C.; Kuester, T.; De Miguel, A.S.; Baugh, K.; Jechow, A.; Hölker, F.; Bennie, J.; Elvidge, C.D.; Gaston, K.J.; Guanter, L. Artificially lit surface of Earth at night increasing in radiance and extent. Sci. Adv. 2017, 3, 1–8. [Google Scholar] [CrossRef] [PubMed]
- Kereush, D.; Perovych, I. Determining criteria for optimal site selection for solar power plants. Geomat. Land Manag. Landsc. 2017, 4, 39–54. [Google Scholar] [CrossRef]
- Huang, Y.; Yu, B.; Hu, Z.; Wu, J.; Wu, B. Locating Suitable Roofs for Utilization of Solar Energy in Downtown Area Using Airborne LiDAR Data and Object-Based Method: A Case Study of the Lujiazui Region, Shanghai. In Proceedings of the Second International Workshop on Earth Observation and Remote Sensing Applications, Shanghai, China, 8–11 June 2012. [Google Scholar] [CrossRef]
- Tjengdrawira, C.; Richter, M.; Theologitis, I.-T. Best Practice Guidelines for PV Cost Calculation; Solar Bankability Consortium: Bolzano, Italy, 2016. [Google Scholar]
- IRENA. Cost and Competitiveness Indicators: Rooftop Solar PV; International Renewable Energy Agency: Abu Dhabi, UAE, 2017. [Google Scholar]
- Arán-Carrión, J.; Espin Estrella, A.; Aznar Dols, F.; Zamorano Toro, M.; Rodriguez, M.; Ramos Ridao, A. Environmental decision-support system for evaluating the carrying capacity of land areas: Optimal site selection for grid-connected photovoltaic power plants. Renew. Sustain. Energy Rev. 2008, 12, 2358–2380. [Google Scholar] [CrossRef]
- EDC. Cambodia: National Solar Park Project. Available online: https://www.adb.org/sites/default/files/project-documents/51182/51182-001-iee-en_0.pdf (accessed on 18 May 2019).
- Castellano, A.; Kendall, A.; Nikomarov, M.; Swemmer, T. Electric Power and Natural Gas; McKinsey & Company: New York, NY, USA, 2015. [Google Scholar]
- IRENA. Scaling up Renewable Energy Investment in Emerging Markets: Challenges, Risks and Solutions. Available online: https://coalition.irena.org/-/media/Files/IRENA/Coalition-for-Action/Publication/Coalition-for-Action_Scaling-up-RE-Investment_2018.pdf (accessed on 17 May 2019).
- The World Bank. Access to Electricity (% of Population). Available online: https://data.worldbank.org/indicator/eg.elc.accs.zs (accessed on 22 April 2018).
- Luethje, F.; Tiede, D.; Eisank, C. Terrain Extraction in Built-Up Areas from Satellite Stereo-Imagery-Derived Surface Models: A Stratified Object-Based Approach. ISPRS Int. J. Geo-Inf. 2017, 6, 9. [Google Scholar] [CrossRef]
- Niederost, M. Automated Update of Building Information in Maps Using Medium-Scale Imagery. In Automatic Extraction of Man-Made Objects from Aerial and Space Images (III); Swets & Zeitlinger: Lisse, The Netherlands, 2001; pp. 161–170. [Google Scholar]


| Parameter | Data | Spatial Resolution or Level of Detail | Sources and References | Year |
|---|---|---|---|---|
| Population density | LandScan™ Global | 1 km | Oak Ridge National Lab [20] | 2000‒2016 |
| Nightlight | DMSP-OLS VIIRS-DNB | ~ 1 km 750 m | EOG, NOAA ([21,22,24]) | 2000‒2013 |
| Slope | AW3D-DSM | 30 m | JAXA ([25,26]) | 2015 |
| Land cover | MCD12Q1 | 500 m | USGS [27] | 2016 |
| Solar PV potential | PV power potential | 5 km | [19] | 2016‒2017 |
| Socio-economic | Income, Expenditure, GDP, Electric Consumption | National level | World Bank [28] United Nations [29] | various years |
| Capital Expense (CAPEX) for solar PV | Installation cost | National level | Various sources (see Table 2) | 2016 |
| Road network | Global Road Network | Five road types (highways, primary, secondary, tertiary and local roads) | Global Roads Inventory Project [23] | various years |
| Country | Installation Cost (USD/kWp) | System Lifespan | Sources | Country | Installation Cost (USD/kWp) | System Lifespan | Sources |
|---|---|---|---|---|---|---|---|
| Australia | 1698.00 | 25 | [30] | Nepal | 5290.21 | 25 | [31] |
| Bangladesh | 956.00 | 25 | [32] | New Zealand | 2266.67 | 25 | [33] |
| Bhutan | 6395.41 | 25 | [34,35] | North Korea | 2200.00 | 25 | [36] |
| Brunei Darussalam | 4405.10 | 20 | [37] | Palau | 7000.00 | 25 | [38] |
| Cambodia | 6600.00 | 10 | [39] | Papua New Guinea | 4025.00 | 25 | [40] |
| China | 625.00 | 25 | [41] | Philippines | 1893.49 | 25 | [42] |
| Fiji | 3760.00 | 25 | [43] | Russia | 3400.00 | 25 | [44] |
| India | 1400.00 | 25 | [45] | Singapore | 1250.00 | 25 | [46] |
| Indonesia | 2750.00 | 20 | [47] | South Korea | 2820.00 | 20 | [48] |
| Japan | 2844.00 | 20 | [49] | Sri Lanka | 1500.00 | 20 | [50] |
| Laos | 1552.00 | 20 | [51] | Taiwan | 2000.00 | 25 | [52] |
| Malaysia | 3000.00 | 21 | [53] | Thailand | 4800.00 | 25 | [54] |
| Mongolia | 2727.27 | 25 | [55] | Timor-Leste | 6367.00 | 15 | [56] |
| Myanmar | 4766.67 | 25 | [57] | Vietnam | 2214.50 | 25 | [5859] |
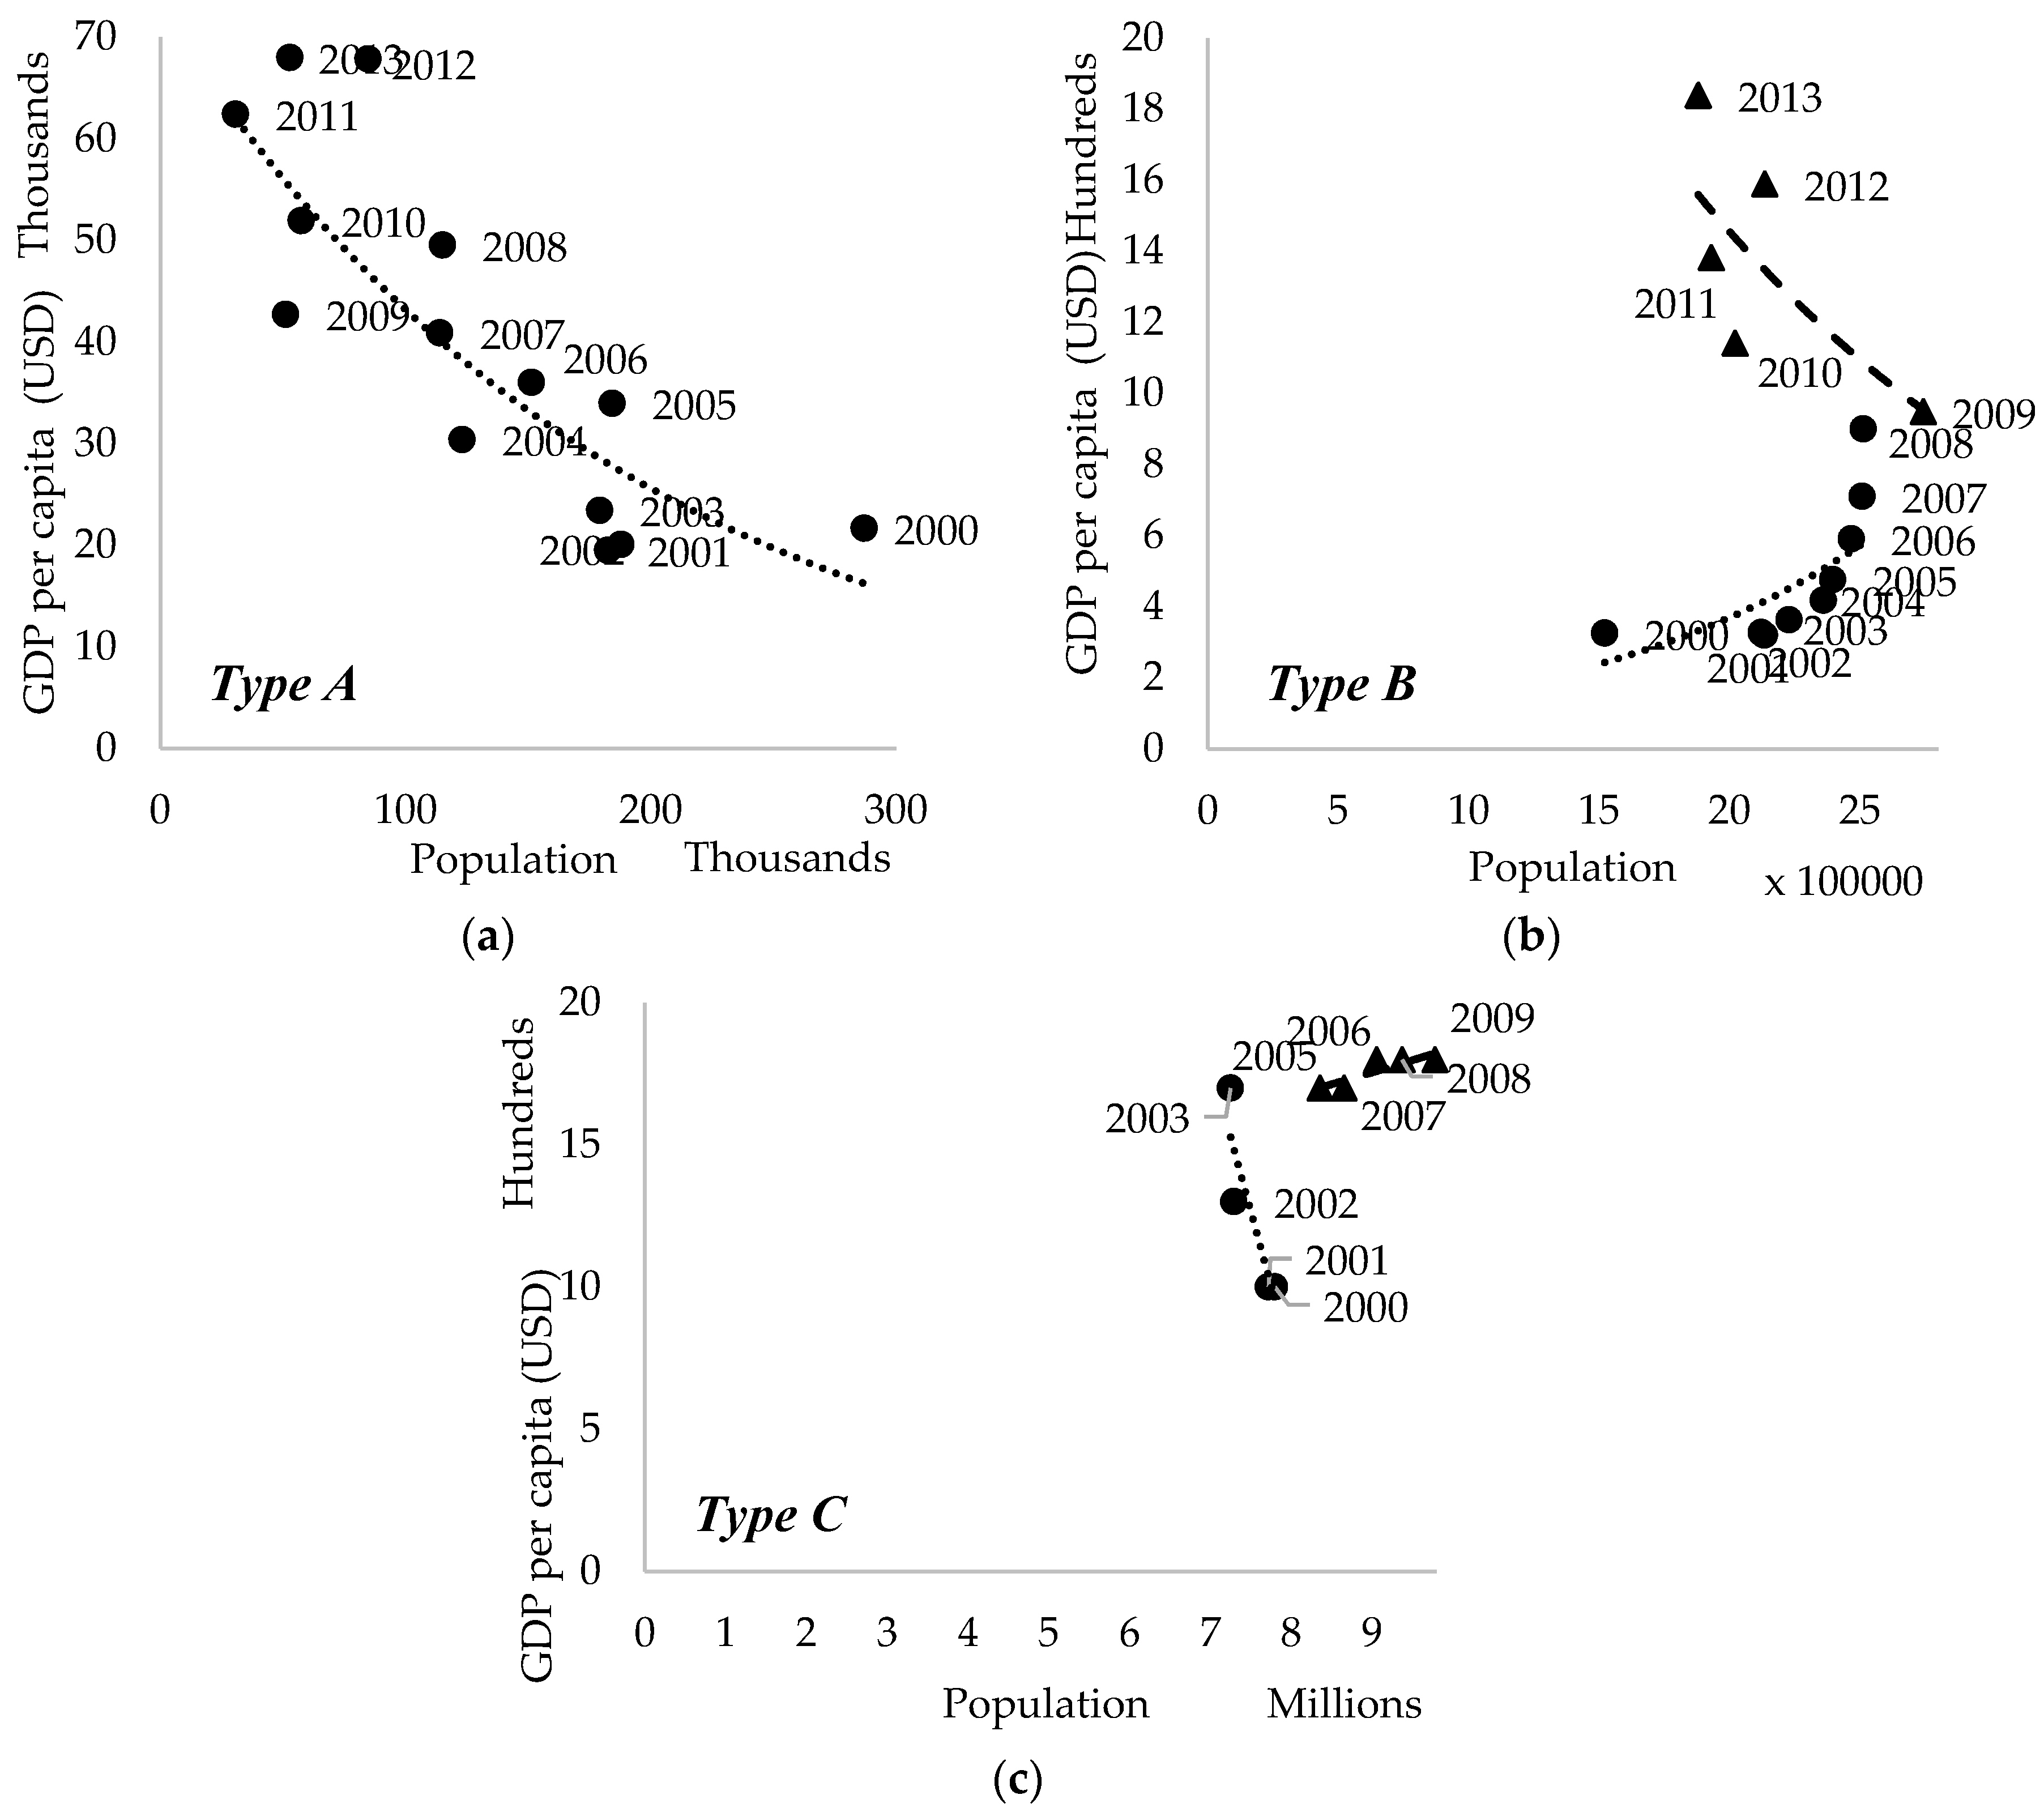
| COUNTRY | ETT | COUNTRY | ETT | COUNTRY | ETT |
|---|---|---|---|---|---|
| Australia | A | Laos | B | Russia | A |
| Bangladesh | B | Malaysia | B | Singapore | N/A * |
| Bhutan | B | Mongolia | B | South Korea | A |
| Brunei Darussalam | A | Myanmar | B | Sri Lanka | A |
| Cambodia | B | Nepal | B | Taiwan | A |
| China | A | New Zealand | B | Thailand | B |
| Fiji | A | North Korea | C | Timor-Leste | B |
| India | B | Palau | B | Vietnam | A |
| Indonesia | B | Papua New Guinea | B | ||
| Japan | A | Philippines | B |
| COUNTRY | Levelized Cost of Electricity (LCOE) (USD/kWh) * | Year when electric price from PV<=Grid | |||||||||
|---|---|---|---|---|---|---|---|---|---|---|---|
| 2016 | 2017 | 2018 | 2019 | 2020 | 2021 | 2022 | 2023 | 2024 | 2025 | ||
| Australia | 0.11 | 0.09 | 0.08 | 0.06 | 0.05 | 0.04 | 0.03 | 0.03 | 0.02 | 0.02 | before 2016 |
| Bangladesh | 0.07 | 0.06 | 0.05 | 0.04 | 0.03 | 0.03 | 0.02 | 0.02 | 0.01 | 0.01 | 2017 |
| Bhutan | 0.62 | 0.51 | 0.42 | 0.34 | 0.28 | 0.23 | 0.19 | 0.15 | 0.13 | 0.10 | after 2025 |
| Brunei Darussalam | 0.31 | 0.25 | 0.21 | 0.17 | 0.14 | 0.11 | 0.09 | 0.08 | 0.06 | 0.05 | after 2025 |
| Cambodia | 0.68 | 0.56 | 0.46 | 0.38 | 0.31 | 0.25 | 0.21 | 0.17 | 0.14 | 0.11 | 2023 |
| China | 0.06 | 0.05 | 0.04 | 0.03 | 0.03 | 0.02 | 0.02 | 0.01 | 0.01 | 0.01 | before 2016 |
| Fiji | 0.49 | 0.40 | 0.33 | 0.27 | 0.22 | 0.18 | 0.15 | 0.12 | 0.10 | 0.08 | before 2016 |
| India | 0.12 | 0.09 | 0.08 | 0.06 | 0.05 | 0.04 | 0.04 | 0.03 | 0.02 | 0.02 | 2018 |
| Indonesia | 0.23 | 0.19 | 0.15 | 0.13 | 0.10 | 0.09 | 0.07 | 0.06 | 0.05 | 0.04 | 2020 |
| Japan | 0.32 | 0.27 | 0.22 | 0.18 | 0.15 | 0.12 | 0.10 | 0.08 | 0.07 | 0.05 | 2018 |
| Laos | 0.11 | 0.09 | 0.08 | 0.06 | 0.05 | 0.04 | 0.03 | 0.03 | 0.02 | 0.02 | 2017 |
| Malaysia | 0.30 | 0.25 | 0.20 | 0.17 | 0.14 | 0.11 | 0.09 | 0.08 | 0.06 | 0.05 | 2024 |
| Mongolia | 0.30 | 0.24 | 0.20 | 0.16 | 0.13 | 0.11 | 0.09 | 0.07 | 0.06 | 0.05 | after 2025 |
| Myanmar | 0.36 | 0.30 | 0.24 | 0.20 | 0.16 | 0.13 | 0.11 | 0.09 | 0.07 | 0.06 | after 2025 |
| Nepal | 0.50 | 0.41 | 0.34 | 0.28 | 0.23 | 0.19 | 0.15 | 0.12 | 0.10 | 0.08 | after 2025 |
| New Zealand | 0.33 | 0.27 | 0.22 | 0.18 | 0.15 | 0.12 | 0.10 | 0.08 | 0.07 | 0.05 | 2019 |
| North Korea | 0.21 | 0.18 | 0.14 | 0.12 | 0.10 | 0.08 | 0.07 | 0.05 | 0.04 | 0.04 | 2024 |
| Palau | 0.43 | 0.35 | 0.29 | 0.24 | 0.20 | 0.16 | 0.13 | 0.11 | 0.09 | 0.07 | 2019 |
| Papua New Guinea | 0.32 | 0.26 | 0.21 | 0.18 | 0.14 | 0.12 | 0.10 | 0.08 | 0.07 | 0.05 | 2020 |
| Philippines | 0.13 | 0.10 | 0.09 | 0.07 | 0.06 | 0.05 | 0.04 | 0.03 | 0.03 | 0.02 | before 2016 |
| Russia | 0.76 | 0.62 | 0.51 | 0.42 | 0.34 | 0.28 | 0.23 | 0.19 | 0.16 | 0.13 | after 2025 |
| Singapore | 0.09 | 0.07 | 0.06 | 0.05 | 0.04 | 0.03 | 0.03 | 0.02 | 0.02 | 0.01 | after 2025 |
| South Korea | 0.26 | 0.21 | 0.17 | 0.14 | 0.12 | 0.10 | 0.08 | 0.06 | 0.05 | 0.04 | 2021 |
| Sri Lanka | 0.11 | 0.09 | 0.07 | 0.06 | 0.05 | 0.04 | 0.03 | 0.03 | 0.02 | 0.02 | 2018 |
| Taiwan | 0.13 | 0.11 | 0.09 | 0.07 | 0.06 | 0.05 | 0.04 | 0.03 | 0.03 | 0.02 | 2018 |
| Thailand | 0.33 | 0.27 | 0.22 | 0.18 | 0.15 | 0.12 | 0.10 | 0.08 | 0.07 | 0.05 | 2022 |
| Timor-Leste | 0.52 | 0.43 | 0.35 | 0.29 | 0.24 | 0.19 | 0.16 | 0.13 | 0.11 | 0.09 | 2024 |
| Vietnam | 0.15 | 0.13 | 0.10 | 0.08 | 0.07 | 0.06 | 0.05 | 0.04 | 0.03 | 0.03 | 2020 |
| Country | Accuracy Parameters | Country | Accuracy Parameters | ||
|---|---|---|---|---|---|
| Completeness | Correctness | Completeness | Correctness | ||
| Australia | 0.71 | 0.91 | Nepal | 1.00 | 0.91 |
| Bangladesh | 0.83 | 0.79 | New Zealand | 0.58 | 0.64 |
| Bhutan | 0.95 | 0.89 | Philippines | 0.82 | 0.90 |
| Cambodia | 0.64 | 0.82 | Russia | 1.00 | 0.50 |
| Indonesia | 0.77 | 1.00 | South Korea | 0.73 | 0.80 |
| Japan | 0.67 | 1.00 | Sri Lanka | 0.57 | 0.80 |
| Laos | 0.80 | 0.80 | Taiwan | 1.00 | 0.90 |
| Malaysia | 0.90 | 0.82 | Thailand | 0.70 | 0.70 |
| Mongolia | 1.00 | 0.56 | Vietnam | 0.90 | 0.90 |
| Myanmar | 1.00 | 0.91 | |||
© 2019 by the authors. Licensee MDPI, Basel, Switzerland. This article is an open access article distributed under the terms and conditions of the Creative Commons Attribution (CC BY) license (http://creativecommons.org/licenses/by/4.0/).
Share and Cite
Principe, J.; Takeuchi, W. Supply and Demand Assessment of Solar PV as Off-Grid Option in Asia Pacific Region with Remotely Sensed Data. Remote Sens. 2019, 11, 2255. https://doi.org/10.3390/rs11192255
Principe J, Takeuchi W. Supply and Demand Assessment of Solar PV as Off-Grid Option in Asia Pacific Region with Remotely Sensed Data. Remote Sensing. 2019; 11(19):2255. https://doi.org/10.3390/rs11192255
Chicago/Turabian StylePrincipe, Jeark, and Wataru Takeuchi. 2019. "Supply and Demand Assessment of Solar PV as Off-Grid Option in Asia Pacific Region with Remotely Sensed Data" Remote Sensing 11, no. 19: 2255. https://doi.org/10.3390/rs11192255
APA StylePrincipe, J., & Takeuchi, W. (2019). Supply and Demand Assessment of Solar PV as Off-Grid Option in Asia Pacific Region with Remotely Sensed Data. Remote Sensing, 11(19), 2255. https://doi.org/10.3390/rs11192255