Abstract
Soil moisture is a factor for risk analysis in the agricultural sector, yet access to temporally and spatially detailed data is challenging for much of the world’s agricultural extend. Significant effort has been focused on developing methodologies to estimate soil moisture from microwave satellite sensors. Canada’s RADARSAT Constellation Mission (RCM) is capable of acquiring imagery in a number of modes with a Compact Polarimetry (CP) configuration at different spatial resolutions (1 to 100 m). RCM offers greater polarization diversity, wide swaths and improved temporal frequency (4-day exact revisit time); all important considerations for large area monitoring of agricultural resources. The major goal of this study was to examine whether CP could accurately estimate surface soil moisture over bare fields. A methodology was developed using the calibrated Integral Equation Model (IEM) multi-polarization inversion approach. RADARSAT-2 data was acquired between 2012 and 2017 over a test site in eastern Canada. CP backscatter for two RCM modes (medium resolution 30 m and 50 m (MR30 and MR50)) was simulated using 63 RADARSAT-2 fully polarimetric images. A simple transfer function was developed between RH (right circular-horizontal) and HH (horizontal-horizontal) intensity, as well as RV (right circular-vertical) and VV (vertical-vertical). These HH- and VV-like intensities were then used in the multi-polarization inversion scheme to retrieve soil moisture. CP soil moisture retrievals were validated against soil moisture measurements from a long term in-situ network instrumented with five soil moisture stations. Retrieved and measured soil moisture were well correlated (R > 0.70) with an unbiased root mean square error (ubRMSE) less than 0.06 m3/m3. Overall, the developed method clearly captured the dry down and wetting trends observed through the five years study period. However, results demonstrated that the inversion method introduced a consistent bias (~0.10 m3/m3). Comparison of CP soil moisture estimates to those from the Soil Moisture Active Passive (SMAP) passive microwave satellite confirmed this bias. This study demonstrates the potential of C-band CP data to deliver accurate soil moisture products over wide swaths for regional and national soil moisture monitoring.
1. Introduction
Soil moisture is a critical variable in many environmental sciences, including hydrology, climatology and agriculture. Studies have demonstrated that surface water content plays an important role in controlling soil-atmosphere energy balance, thereby influencing climate and weather [1,2]. Extreme soil moisture events within agricultural settings, such as floods and droughts, affect food security by reducing crop productivity resulting in significant financial impacts to the agricultural sector. Excessively wet soils can increase the risk of some crop diseases. In 2010, extended periods of saturated soils in the Canadian Prairies resulted in $600 million dollars (CDN) of lost revenue for producers due to the presence of sclerotinia in canola crops [3]. In the spring of 2011, flooding in the Province of Manitoba cost the Canadian economy $1 billion (CDN) with over $320 million (CDN) going to the agriculture sector in Crop Insurance and Agri-Recovery Programs [4]. The ability to produce timely and accurate soil moisture information using satellite technologies could dramatically improve a priori decision making allowing farmers and all levels of government to take actions to mitigate risks to the sector. Yet operational field scale soil moisture data is for the most part, unavailable. However, early approaches using Sentinel-1/Sentinel-2 are starting to appear with production in restricted territories [5,6,7].
Coarse resolution soil moisture maps are currently delivered using scatterometer (Advanced Scatterometer—ASCAT [8]) and radiometer sensor data (Advanced Microwave Scanning Radiometer 2—AMSR2 [9], Soil Moisture Ocean Salinity—SMOS [10], Soil Moisture Active Passive—SMAP [11], and Cyclone Global Navigation Satellite System—CYGNSS [12]). These sensors provide data at kilometer scale resolutions and are making important contributions by improving large scale weather and drought forecasting [13,14]. Yet field scale knowledge of soil moisture is required to inform farm level management such as decision making around precision irrigation, disease prevention and treatment, and fertilization application. Operational soil moisture monitoring at these scales remains challenging.
Synthetic Aperture Radars (SARs) are an obvious choice for retrieval of soil moisture at field scales, given the higher resolutions at which these sensors acquire data compared to scatterometer and radiometer sensor data. However, the modelling of moisture is complicated by the two-way scattering of microwave energy as it enters and exits vegetation canopies. And even without vegetation present, the roughness of the surface of the soil significantly impacts the characteristics of microwave scattering. Researchers have proposed a number of methods for moisture retrieval from a range of SAR satellites [5,6,15,16,17,18,19,20,21]. In Canada, C-band data have been the focus of soil moisture research [22,23,24,25,26] given this country’s history of operating RADARSAT satellites. Canada’s federal ministry of agriculture (Agriculture and Agri-Food Canada—AAFC) has invested significant effort into the retrieval of surface soil moisture using the physically-based Integral Equation Model (IEM) [22,27]. The model does not characterize the scattering from vegetation canopies and as such, has been limited to the retrieval of soil moisture pre-emergence and post-harvest. Nevertheless, this method has delivered accurate estimates with a mean absolute error of 0.04 m3/m3 as applied to RADARSAT-2 image pairs acquired over a test site in Ontario, Canada [22].
IEM and RADARSAT-2 data were applied to a watershed in western Canada in an experiment to assess the value of high spatial resolution soil moisture for hydrological modelling. When compared to point measures, SAR-based soil moisture improved estimates of both the timing and amplitude of peak spring stream flow of a flood event in early April 2015 [28]. Furthermore, the comparison of observed and simulated hourly flow series using RADARSAT-2 soil moisture maps showed that simulated peak matches well with the peak values of measured flow with an error of 0.03 m3/second. Soil moisture estimates from RADARSAT-2 over a Canadian experimental site have also been compared to estimates from land surface models including the Soil-Vegetation-Snow (SVS) scheme, yielding overall good correlations ranging between 0.75–0.86 over sand and 0.68–0.87 over clay soils [29].
Canada’s new generation of RADARSAT satellites, the RADARSAT Constellation Mission (RCM), offers not only C-band continuity, but also several notable mission characteristics which will elevate operational monitoring. In fact, this constellation of three identical satellites delivers exact 4-day repeats and much more frequent relooks of any given target. When compared to scatterometers and passive microwave sensors daily and sub-daily revisit capabilities, RCM presents a better trade-off between spatial and temporal resolution. Also new is the capability of these satellites to image in Compact Polarimetry (CP). Early research by the Canadian team demonstrated that for a range of targets and applications, CP provides richer information about SAR scattering (relative to single and dual-polarizations) and with swath widths significantly larger than fully polarimetry [30]. CP can be selected for most RCM modes, including medium resolution 30-m (MR30) and 50-m (MR50), RCM modes that are of interest to field scale monitoring.
The implementation of CP on RCM is in a hybrid configuration with a right-circular transmit wave, and H and V polarizations received coherently. As such, scattering intensity will be characterized by RH (right circular-horizontal) and RV (right circular-vertical). Charbonneau et al. [30] studied the sensitivity of RH and RV backscatter to soil moisture and reported significant correlations between CP intensities and soil moisture over a soybean field, with low planting density, from mid-May to mid-July 2008. In this study, a simple quadratic empirical model with a second-degree term described the relationship between CP intensities and soil moisture. Williams [31] demonstrated that soil moisture retrieved using simulated fully polarimetric L-band data could be retrieved equally well from compact polarimetry data in a π/4 configuration (transmitted linear wave oriented at 45° and H and V polarizations received coherently). Truong-Loï et al. [32] introduced a simple approximation to the Dubois semi-empirical backscatter model [33] based on airborne P-band CP measurements over bare soils in a hybrid polarity configuration (circular wave transmission and H and V polarizations coherent on reception). They reported a minor degradation within a standard deviation of about 0.02 m3/m3 in soil moisture retrieval performance when CP measurements were used instead of dual-polarized backscatter (HH and VV). In a simulation study, Ouellette et al. [34] developed a hybrid polarity CP time series data cube retrieval method at L-band, with vegetation present. Good agreement was reported between retrieval estimates using the CP approach and those from a fully polarimetric dataset with differences less than 0.02 m3/m3. Ponnurangam et al. [35] evaluated a combination of CP m-α decomposition and an inversion algorithm based on two low frequency surface scattering models (X-Bragg and polarimetric two scale model) for soil moisture estimation under low agricultural vegetation cover. This approach was applied to simulated L-band data and C-band RISAT-1 data in hybrid polarity configuration [36] and reported a weak performance of the developed model-based inversion approach in soils under wet conditions due to less sensitivity of scattering parameters to changes in soil water content above the threshold of 0.34 m3/m3.
RCM’s CP configuration is of significant interest to the land monitoring community. Yet the calibrated IEM multi-polarization inversion approach for soil moisture retrieval is based on dual-like (HH and VV) polarization intensities. The purpose of the research presented here was to adapt the inversion method for RH and RV intensities, and to validate these modelled estimates against soil moisture measured in-situ. CP estimated soil moisture was then compared to SMAP soil moisture products. Multiple years of fully polarimetric RADARSAT-2 data were used to simulate CP data at RCM resolutions, incidence angles and noise floors. Given the operational mandate of RCM, the intent was to prepare the agricultural community to “hit the ground running” as soon as RCM data became available.
2. Materials and Methods
2.1. Study Area
Satellite images and in-situ measurements were collected over an agricultural test site in the Great Lakes–St. Lawrence Valley in eastern Ontario, Canada (Figure 1). The Casselman site is located approximately 65 km south-east of Ottawa. The topography of this site is relatively flat, with a variety of soil types present throughout this area, including silty loams, sands and clays [37]. Soil types vary from light sand to clay and clay loam. Detailed 1:20,000 soils data are available from the Canadian Soil Information service (CanSIS) at AAFC [38]. Southern and western portions are dominated by sandy soils with pockets of loams. The central portion consists of rich clay soils, ideal for agriculture. Soil texture transitions to silty loam northward in the test site. Corn, soybean, and small grains (wheat, barley, and oats) are the dominant crops produced in the area [37]. Fields studied here do not have significant row structure. Rather, the roughness in these fields is random due to multiple tillage activities over each study period. Higher roughness in this study site is observed during two to four tillage operations generally occurring in April and May before the seeding period. Significant acres of permanent pasture and forage crops are also present in this area. Only one crop is planted during the relatively short May to September growing season. Fields in this region of Canada are not irrigated and small in size, 15 ha on average.
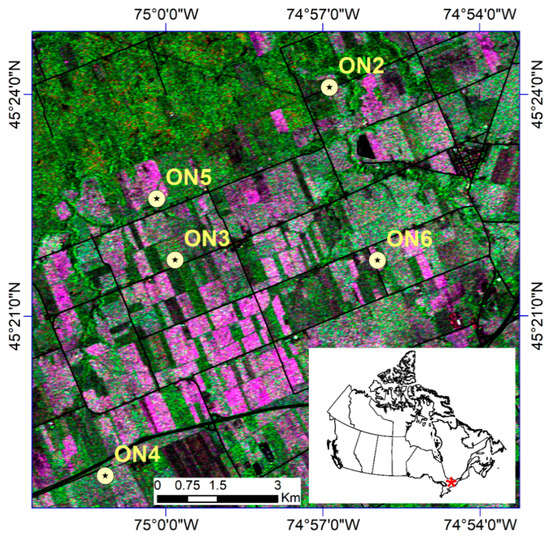
Figure 1.
Location of the study site and the Real-Time In-Situ Soil Monitoring for Agriculture (RISMA) in-situ network in eastern Ontario. ON1 station was decommissioned in the fall of 2015. The background is a RADARSAT-2 image acquired on 6 June 2006.
In general, the climate of eastern Ontario is humid continental with large seasonal variations [39]. This part of Canada receives close to 250 cm of snowfall over an average winter and snow usually remains on the ground from December to March. Summers are fairly warm and humid in this region with an average annual rainfall of 950 mm, usually lasting a little longer than winter in terms of duration. Spring and fall are changeable seasons, prone to extremes in temperature and unpredictable conditions [37]. The average July maximum temperature is 27 °C.
2.2. In-Situ Data
In 2011, AAFC began installing and calibrating a Real-Time In-Situ Soil Monitoring for Agriculture (RISMA) network at three sites in Canada, one of which is Casselman. Casselman was instrumented with five of these soil moisture stations (Figure 1). The network was established to provide a source of high quality measures of soil moisture to support long term research activities involving passive and active radar sensors. Each station is equipped with Stevens Hydra Probes, installed in triplicate at each of three depths: 5, 20 and 50 cm. At the surface, three probes have been placed vertically to capture soil moisture integrated from the surface to the depth of the tines of the probe (5.6 cm). These are in addition to the three probes buried horizontally at 5 cm. Each probe records soil temperature and real dielectric constant (RDC). In addition, each station is equipped with a tipping bucket rain gauge. RISMA network measures are taken every 15 min, and at the top of each hour all measures are transmitted to AAFC where data are automatically quality checked and calibrated. Figure 2 illustrates an example of the data collected from one station (ON6) in 2016. The soil moisture calibration equations are texture-based equations from Seyfried et al. [40] and Bellingham [41]. When soil temperature is below zero degrees Celsius indicating frozen conditions, SAR measurements are no longer sensitive to soil water content, and thus soil moisture readings are not used. Finally, the RISMA data are uploaded for public access (https://agriculture.canada.ca/SoilMonitoringStations).
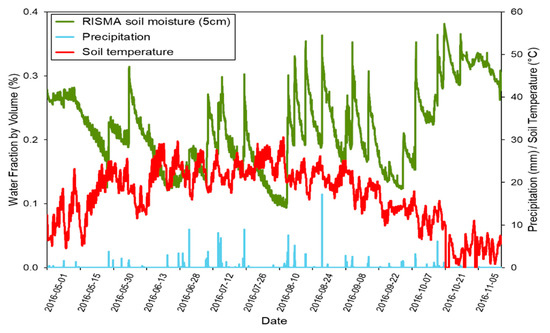
Figure 2.
Soil moisture and temperature at 5 cm depth with precipitation records from ON6 RISMA station in 2016.
2.3. Remote Sensing Data and Pre-Processing
2.3.1. RADARSAT-2 Data
Polarimetric C-band (5.405 GHz) RADARSAT-2 images were acquired in wide fine quad polarization mode (FQW) over an area of 50 × 25 km. Data collection began in 2013 and ended in 2017 with a total of 63 images acquired when crops were not present in spring (April to June) and fall seasons prior to the soil freeze-up (October and November). A wide range of beam modes (FQ1W to FQ21W) were acquired at ascending (~6 PM local time) and descending (~7 AM local time) orbits at different spatial resolutions (7.8 to 17.3 m) and incidence angles (18.4 to 41.6 degrees) have been used throughout the study period. RADARSAT-2 is over-subscribed over our study site and we lose many acquisitions due to conflicts with other users. As such, for this study we had access to a more limited number of images. The polarimetric SAR data were calibrated using a land LUT and provided in compressed Sinclair matrix values for each slant range pixel. Pre-processing of this data set was completed within the Sentinel Application Platform (SNAP) toolbox. A Boxcar 5 × 5 local averaging window filter was applied to the single look complex (SLC) data to reduce speckle noise. This kernel size is suitable given the size of the fields in this region of Canada. Furthermore, this filter type was found appropriate in preserving the phase information of the SAR imagery [42]. Derived HH and VV intensity products were geometrically corrected and geo-referenced using the range-Doppler terrain correction method [43]. This technique uses orbital information in the metadata and the slant to ground range conversion parameters in combination with digital elevation data of the observed scene to derive geolocation information. The accuracy of this method was approximately one pixel in both X and Y directions for all SAR images.
The RCM’s CP hybrid configuration is a transmit right circular polarization (R) with dual linear (H and V) polarizations received coherently. Here, ortho-rectified RH and RV intensity data were simulated from the 63 RADARSAT-2 quad-pol images in SLC format using a simulator developed by the Canada Centre for Mapping and Earth Observation (CCMEO) as described in [44]. This tool was developed to reformat RADARSAT-2 product metadata to RCM format and to simulate RCM data product from RADARSAT-2 SLC data based on pre-launch specifications provided by the Canadian Space Agency. In this study, both the Noise Equivalent Sigma Zero (NESZ) levels and medium resolutions (MR) modes were simulated as per RCM specifications (NESZ = −24 dB for 30 m (MR30); NESZ = −22 dB for 50m (MR50)).
2.3.2. SMAP Data
The Soil Moisture Active Passive (SMAP) satellite was launched in January 2015. SMAP is equipped with an L-band (1.4 GHz) radiometer that observes brightness temperature in horizontal and vertical polarizations. The SMAP mission measures microwave emissions from a 685 km sun-synchronous, near-polar orbit that has equator crossings at 6 AM and 6 PM local time [11]. L4_SM Global 9 km soil moisture products generated between 2015 and 2017 were used in this study. This L4_SM data product consisted of three-hourly surface soil moisture estimates obtained from the integration of a land surface model in a data assimilation system involving SMAP brightness temperature data [45]. This system is driven with observations-based meteorological forcing data, including precipitation [46]. These data have been validated using ground soil moisture measurements from core validation sites and sparse in-situ networks around the world. The assimilation of SMAP brightness temperatures in the L4_SM algorithm was found beneficial with estimates of surface soil moisture meeting the accuracy requirement of errors less than 4% [47].
A total of 27 L4_SM Global 9 km soil moisture products on the Equal-Area Scalable Earth, version 2 (EASEv2) grid [48] generated between 2015 and 2017 were used in this study. These SMAP products are coincident with RADARSAT-2 scenes within a maximum time difference of three hours. Data from the in-situ stations confirmed no precipitation during these three-hour periods.
2.4. Methods
2.4.1. Transfer Functions Generation
For each pixel in the scene, CP backscatter intensities are expressed in the linear polarization basis as follow [44]:
where Sxy are elements of the Sinclair scattering matrix, with x denoting the transmitted wave polarization and y is the polarization of the received wave. Once CP intensity data were synthesized, statistical transfer functions were developed in logarithmic and linear scales between RH-HH and RV-VV backscatter by pooling all 63 RADARSAT-2 images acquired over the test site between spring 2013 and fall 2017. These functions were of the form [49]:
where A1, B1, A2 and B2 are coefficients calculated using a linear fit method, and are simulated RCM CP intensities in RH and RV polarizations, and and are RADARSAT-2 intensities in HH and VV polarizations. Charbonneau et al [30] reported linear relationships between RH-HH and RV-VV backscatter in logarithmic dB scale using a single quad-pol RADARSAT-2 image acquired in October 2008 over an agricultural test site in Québec, Canada. These functions are likely to be significantly different for bare soil surfaces relative to other targets [49]. As such, the conformity coefficient developed by Truong-Loï [32] was used to separate bare surfaces from other targets. This coefficient obtained from the covariance matrix was found to be robust and analogous to Freeman Durden and van Zyl decompositions in discriminating between surface, double bounce and volume scattering. Over natural targets, the conformity coefficient can be expressed as a function of elements of the Sinclair scattering matrix as [32]:
where Re refers to the imaginary part, indicates spatial averaging over neighbouring pixels and * denotes the complex conjugate. Pixels indicative of surface scattering were identified as those having conformity greater than 0.8 [49], and only these pixels were used to create these linear transfer functions. To obtain robust transfer functions, a pixel-by-pixel comparison was performed between RH-HH and RV-VV backscatter.
McNairn et al. [49] evaluated whether additional filtering prior to derivation of transfer functions would improve correlation statistics. Here, correlations were calculated for unfiltered pixels and compared to correlations for two different kernel sizes of the mean filter (5 and 9). HH-RH and VV-RV correlations for MR30 and MR50 were significantly higher when a 5 × 5 window was applied. However, coefficients decreased with a 9 × 9 window size, likely attributable to a more limited number of pixels used in calculating the correlation. In our study, the mean filter with a 5 × 5 window was applied.
2.4.2. Soil Moisture Retrieval and Validation
The calibrated IEM has been used in this study [50]. The performance of this model in retrieving soil moisture was assessed previously for bare soils [22,27,51,52]. Results from forward modeling of the calibrated IEM at incidence angles typically used in this study using the cross and co-like polarizations configurations revealed that: (i) simulated HV backscatter coefficients of bare soils were below the RADARSAT-2 noise floor in most cases and (ii) simulated HH and VV backscatter coefficients were lower than -3 dB over the validity domain of the model particularly with respect to roughness and incidence angles ranges. Consequently, HV was not used in the inversion scheme and pixels with backscatter exceeding −3 dB (for HH and VV intensities) were flagged and replaced with a null value.
The calibrated IEM multi-polarization inversion method was used to retrieve dielectric constant values according to [22,27]. Inversion of the calibrated IEM is difficult to achieve analytically. Therefore, the retrieval scheme involves the creation of a Look Up Table (LUT) of HH () and VV () backscatter values associated with surface real dielectric constant, roughness root mean square height and incidence angle values generated by performing multiple runs of the calibrated IEM within its validity range. Transfer functions presenting higher correlations and lower statistical errors in linear or logarithmic scales were applied to each pixel, whereby simulated RH and RV intensities were converted to HH and VV intensities, respectively. For each pixel, the retrieval optimization calculations were then performed using a direct search algorithm minimizing a cost function Δ representing the least square difference between intensities in the LUT and co-like polarizations intensities from RADARSAT-2 or intensities generated from CP data using the developed transfer functions:
For each pixel, the inversion algorithm implementation uses only one block of the LUT extracted at the local incidence angle before the retrieval process. The implemented direct search algorithm uses the k-d tree technique to retrieve a single global minimum through minimizing the cost function Δ. Inversion of calibrated IEM is a two unknowns retrieval problem (real dielectric constant and roughness root mean square height) using two backscatter intensities. Mathematically, there is only one possible solution to this problem associated to the computed lowest Δ value. Theoretically, roughness root mean square height can be also retrieved using this inversion approach. However, soil moisture rather than roughness retrieval was the focus of this study. Consequently, quantitative roughness measurements were not acquired for the data sets used here.
The Hallikainen dielectric mixing model [53] was used to determine volumetric soil moisture from real dielectric constant values. This polynomial model in a form of a sum of several terms and empirical coefficients is widely used and only requires the soil texture information (clay and sand fractions), making it suitable for operational implementation over diverse regions.
To mitigate the spatial variability attributed to heterogeneity of soil properties and variances induced by surface roughness, pixel-based RADARSAT-2 and CP-derived soil moisture maps with a spatial resolution of 13.23 m were averaged for the soil polygons within which RISMA in-situ stations fell. Only pixels indicative of surface scattering with a conformity greater than 0.8 were used. A soil map of the region was used to delineate polygons of similar soil texture around each RISMA station. Statistical comparisons were done: (i) between RADARSAT-2 and CP-derived soil moisture polygon average products and (ii) between CP-derived soil moisture polygon average products and RISMA readings. The flowchart of the proposed CP method to retrieve soil moisture is illustrated in Figure 3.
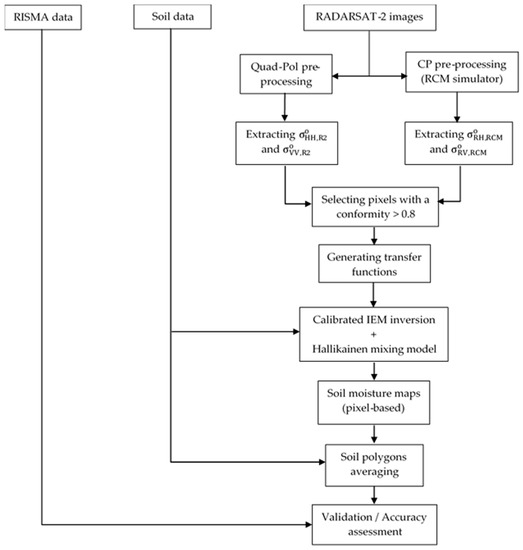
Figure 3.
The flowchart of the proposed Compact Polarimetry (CP) method to retrieve soil moisture.
SMAP L4_SM 9 km products were compared to retrieved soil moisture values by CP at a regional scale. To do so first required validation of the SMAP L4 product against the RISMA measurements. With five in-situ stations strategically deployed to capture soil properties in the study site, assessing the up-scaled RISMA network was achieved using temporally denser data (2012–2017) to increase the statistical confidence in capturing true spatial mean over SMAP resolution. This evaluation was carried out over a full range of soil moisture regimes (wet-to-dry). For any given date, RISMA readings were up-scaled to a 9 km single grid cell by averaging measurements from the five in-situ stations. Next, the CP-derived soil moisture product was compared to the estimate of a 9 km single grid cell SMAP soil moisture L4_SM product within which it fell, for any given date. In this case, CP-derived soil moisture values for the polygons in which RISMA stations were located, were averaged to produce an up-scaled 9 km estimate.
Over agricultural soils, C- and L-bands are estimated to be sensitive to the top ~5 cm (or less) of the soil surface [54]. This sensing depth is shallowest in soils under wet conditions. The sensing depth of SMAP (L-band) and RADARSAT-2 (C-band) is different. The top soil layer thickness affecting the microwave response is frequency-dependant [54,55,56,57,58]. For a given frequency, previous experimental and theoretical studies have shown that the effective soil depth is approximately the same for passive and active microwave remote sensing [55,56,59]. By ignoring microwave scattering in the soil medium, Ulaby et al. [57] have proposed the following relationship that defines the microwave soil observation depth δ (cm) in mineral soils:
where λ (cm) is the observation wavelength, is the real component of the soil relative dielectric constant and is the imaginary component of the soil relative dielectric constant. This model was used to estimate the depth of soil impacting backscatter at C- and L-bands, at the location of the RISMA measures. This analysis provided a metric of the bias in soil moisture retrieval between the SMAP and RADARSAT-2 CP due to frequency differences.
2.4.3. Statistical Analysis
The performance of the CP simulations and the soil moisture retrieval were investigated using Pearson’s correlation coefficient (R), the Mean Absolute Error (MAE), the Root Mean Square Error (RMSE) and the unbiased Root Mean Square Error (ubRMSE). R is defined as a measure of the strength of the linear relationship between modelled and measured variables. RISMA data used in this validation are based on hourly average soil moisture centered on the timing of the satellite acquisition. MAE and RMSE quantify the magnitude of average errors or differences. These two metrics can be compromised if there are biases linked to simulated or retrieved parameters. These biases can be easily removed by defining the ubRMSE. However, the three statistical metrics are all informative and are expressed in volumetric fraction for soil moisture content (m3/m3) and in decibels (dB) for backscatter coefficient estimations [60,61]:
where b is the mean bias, N is the number of data samples, Oi is the observed value at sample i and Pi is the modelled value at sample i.
3. Results and Discussions
3.1. Forward Modelling
In the first phase of this study, the RCM simulator tool [44] was applied to fully polarimetric (QP) RADARSAT-2 images to simulate CP data for both RCM medium resolution modes (30 m (MR30) and 50 m (MR50)). Once simulated, both RH and RV polarizations could be generated. The tool was developed to simulate data as true to RCM specifications as possible. With this approach, users of RCM could assess the performance of this constellation prior to launch, with greater confidence.
Figure 4 illustrates a pixel-by-pixel comparison of the simulated CP data (RH and RV) versus the HH and VV intensities in linear and logarithmic scales over all bare soils pixels in the images with a conformity greater than 0.8. A summary of the associated statistical metrics is given in Table 1. Overall, significant correlations are reported between simulated and measured intensities (R > 0.87). An F-test was performed to determine the level of significance and the performance of the intensity scale (linear or logarithmic) on the goodness of fit models. In all cases, this test demonstrated that linear regression models fit the data well and produced significant relationships (p < 0.0001). Of the two scales, the logarithmic (dB) representation had higher correlations compared to the linear scale (Table 1).
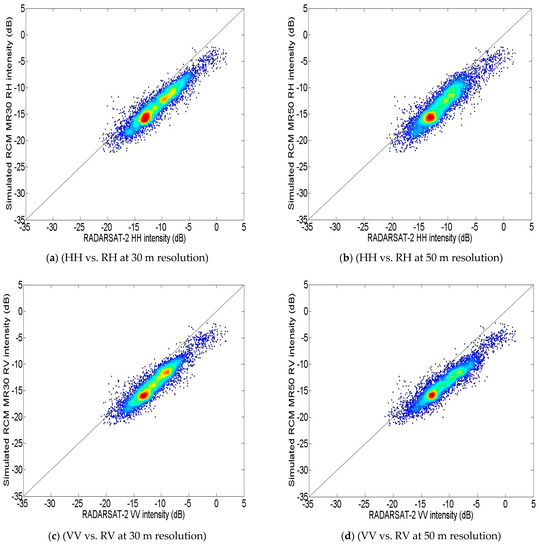
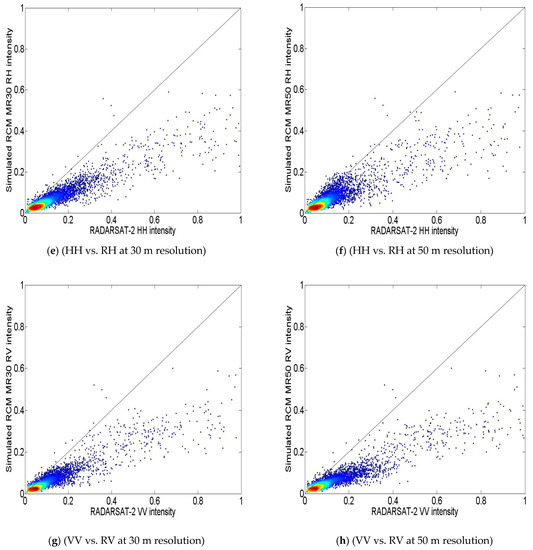
Figure 4.
Scatterplots of RH (right circular-horizontal) and RV (right circular-vertical) intensities from simulated RADARSAT Constellation Mission (RCM) CP as a function of HH and VV intensities from RADARSAT-2 (a–d) scatterplots are in logarithmic scale and (e–h) scatterplots are in linear scale).

Table 1.
Comparison statistics between simulated RADARSAT Constellation Mission (RCM) Compact Polarimetry (CP) intensities and RADARSAT-2 intensities.
Although these overall correlation statistics were significant, a greater divergence between CP (RH and RV) and QP (HH and VV) intensities is observed toward the higher responses, reflected in increased scatter on linear intensity scale scatterplots (Figure 4e–h). CP intensities were less variable over the full range when compared to HH and VV intensities (Figure 4e–h). Scatterplots in logarithmic scale (Figure 4a–d) exhibit less noise along the entire range of responses. Given this more consistent performance, intensities in the logarithmic scale were deemed more suited for creating a linear transfer function between the CP polarizations and HH and VV backscatter.
Statistical measures were used to assess the impact of RCM imaging mode (MR30 versus MR50) on the correlation between HH and RH, as well as VV and RV. For MR30, HH-RH correlation coefficients and ubRMSE were slightly better (R = 0.93, ubRMSE = 1.48 dB, RMSE = 2.84 dB, MAE = 2.53 dB) relative to MR50 (R = 0.90, ubRMSE = 1.83 dB, RMSE = 2.65 dB, MAE = 2.25 dB). This conclusion held true for VV versus RV (MR30: R = 0.92, ubRMSE = 1.49 dB, RMSE = 2.82 dB and MAE = 2.50 dB; MR50: R = 0.91, ubRMSE = 1.66 dB, RMSE = 3.15 dB and MAE = 2.84 dB) (Table 1). Although the higher resolution mode provided slightly lower errors, this analysis suggests that either resolution would be suitable for generating linear transfer functions. The transfer functions for intensity in logarithmic scale are presented in Table 2 for both the MR30 and MR50 RCM simulated modes.
Table 2.
Transfer functions for pixels with conformity above 0.8.
3.2. Inverse Modelling for Soil Moisture Retrieval
3.2.1. Comparing Retrievals from HH and VV to those from RH and RV
In the second phase of this study, near surface moisture content was estimated using a multi-polarization inversion scheme [22,27]. These multiple polarizations included HH with VV, and RH with RV. The transfer functions in Table 2 were used to transpose RH to HH intensity, and RV to VV intensity pixel-by-pixel; calibrated IEM LUT (HH and VV) was then used for inversion. CP-derived soil moisture was then compared to soil moisture values retrieved using the dual like polarizations.
Figure 5 plots soil moisture retrieved using the calibrated IEM and the co-like linear polarizations (HH and VV) against estimates derived using simulated RCM CP circular-linear polarizations (RH and RV). Results are provided for both RCM resolutions (MR30 and MR50). A summary of the associated statistics is given in Table 3. When all of the image data were pooled (270 data points), CP inversion estimates were highly correlated to RADARSAT-2 soil moisture retrievals (MR30: R = 0.96, ubRMSE = 0.02 m3/m3, RMSE = 0.04 m3/m3, MAE = 0.04 m3/m3; MR50: R = 0.94, ubRMSE = 0.03 m3/m3, RMSE = 0.05 m3/m3, MAE = 0.04 m3/m3), demonstrating the potential to use CP to estimate soil moisture with a similar level of accuracy as from the HH and VV data. However, for several of the data acquisitions the CP inversion method tended to slightly overestimate soil moisture, more pronounced at the wet end of the soil moisture range. More precisely, this bias was greater at higher values, particularly over the soil moisture value of 0.25 m3/m3. This is likely related to the transfer functions and their significant bias (~5 dB) observed between simulated and measured intensities toward higher backscatter intensity values. This range of intensities is typically associated with higher soil water concentration and/or higher surface roughness responses to the radar signal.
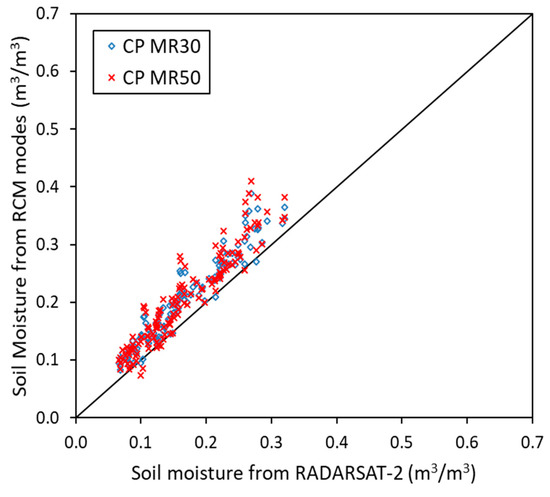
Figure 5.
Comparison between retrieved soil moisture values from RADARSAT-2 and simulated RCM CP.
Table 3.
Estimation error statistics between RADARSAT Constellation Mission (RCM) CP (RH and RV) and RADARSAT-2 (HH and VV) soil moisture retrievals.
3.2.2. Validation of Estimated Soil Moisture Using In-Situ Soil Moisture Measures
The average RADARSAT-2 and CP derived volumetric soil moisture was validated against soil moisture measured by the RISMA network sensors at surface (0–5 cm) and the 5 cm soil depth. Figure 6 and Figure 7 compares the measured and estimated values using the multi-polarization inversion method. It is worth mentioning that RADARSAT-2 results (Figure 6) were found comparable to those obtained using the CP method (Figure 7). A detailed analysis of the RADARSAT-2 multi-polarization inversion method can be found in Merzouki et al. [22]. ubRMSE, RMSE, MAE, and correlation coefficient statistics for CP results are provided in Table 4. Here R values are reported as 0.70 (MR30) and 0.71 (MR50) for the soil surface validation, and 0.75 at the 5 cm soil depth. Although the relationship between retrieved and measured soil moisture is linear and ubRMSE values are relatively low (≤0.06 m3/m3), the calibrated IEM introduced a significant bias (RMSE ≥ 0.11 m3/m3, MAE ≥ 0.10 m3/m3). Furthermore, retrieved soil moisture values were consistently lower; indicative of an underestimation bias regardless of the CP mode used (Figure 7). This was particularly true when examining the validation against the surface (0–5 cm) sensors (Figure 7a). This can be explained by the pronounced effect of wetting/drying gradients within the near surface layers. Vertically installed RISMA Hydra probes (0–5 cm) are therefore more sensitive to wetting and evapotranspiration gradients and variability over the integrated depth [40,54].
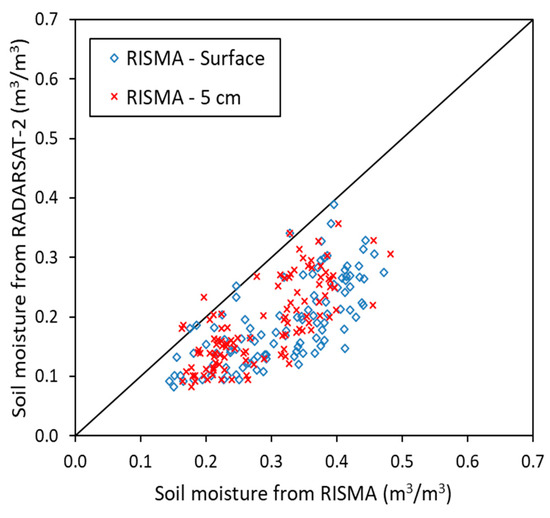
Figure 6.
Comparison between retrieved soil moisture values from RADARSAT-2 and RISMA in-situ measurements at surface and at 5 cm soil depth.
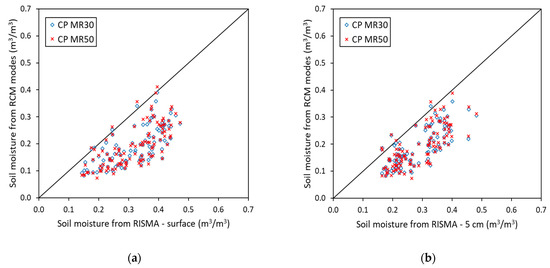
Figure 7.
Comparison between retrieved soil moisture values from RCM CP modes and RISMA in-situ measurements at surface (a) and at 5 cm soil depth (b).
Table 4.
Estimation error statistics between RCM CP soil moisture retrievals and RISMA in-situ measurements.
Although well correlated, the bias in the CP inversion method was also apparent in Figure 8 where measured soil moisture (green line) is graphed for one RISMA station through the 2016 season, along with estimated moisture. The CP estimates tracked drying and wetting events, but underestimated soil moisture particularly in the spring. The drying events observed from early spring until late May reflect the steady increase in daily average temperature from 9 to 18 °C in average and low precipitation. Cooler daytime temperatures combined with regular rain events resulted in an increase of soil moisture in the fall. These conditions along with lower crop-water demands decrease evapotranspiration rates, therefore retaining soil moisture values higher than 0.30 m3/m3. The CP inversion method detected this increase.
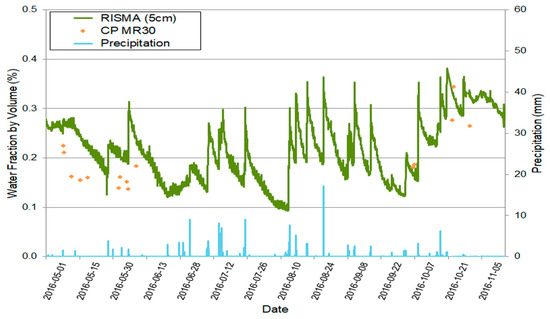
Figure 8.
Retrieved soil moisture from simulated RCM in MR30 mode (diamonds) versus in-situ data from one RISMA station (ON6) (green line). Precipitation events are indicated with blue bars. Graph spans from May to October 2016.
Discrepancies between measured soil moisture values and those predicted by the CP inversion method are likely associated with the calibrated IEM, rather than with SAR data. The calibrated IEM requires the use of a roughness calibration term [50]. This term is less robust in that it is empirically derived and as such can introduce errors and/or a bias. To overcome this limitation, the hybrid (Multi-polarizations/Multi-angles) inversion scheme of the original IEM [22] will be used once RCM data become available whereby the requirement to use the roughness calibration term is eliminated.
Previous assessments of the quality of RADARSAT-2 data confirmed that backscatter intensities recorded by the sensor in different bands were consistent with those reported in the literature [62,63,64], suggesting that SAR-based measurements were well calibrated. Thus, determining the sources of the retrieval underestimation bias is challenging given the number of site-specific factors influencing SAR backscatter, such as: (i) the spatial variability of soil moisture across the sampling area attributable to heterogeneity of soil properties; (ii) the localized meteorological conditions that can induce temporal and spatial variances; (iii) the presence of crop residue and micro and macro roughness structures; and (iv) the differences in sensing depth among different soil types and conditions. The latter factor is modulated by variances attributed to wetting/drying gradients over the integrated soil depth.
3.2.3. Regional Error Analysis and Comparison to SMAP Data
To assess the dry bias associated with CP soil moisture estimations and the impact of the sensing depth on the retrieval results, a comparison was carried out using SMAP L4_SM Global 3-hourly 9 km soil moisture products. Herein, the objective is to quantify the dependency and the sources of the CP underestimation bias. First, an analysis was done to look at the correlation between SMAP measurements and RISMA data averaged over a 9 km single grid cell. The scatterplot in Figure 9 indicates a varying but good performance of SMAP in retrieving soil moisture at surface and 5 cm soil depth. Examination of error statistics reported in Table 5 and their dispersion as a function of the soil moisture range of variation suggests that there is uniform residual distribution along the full range of SMAP and RISMA values. In this case, ubRMSE and MAE yielded similar values (~0.04 m3/m3), indicating no apparent bias associated with SMAP soil moisture estimates. When compared with CP method validation against RISMA (Table 4), errors were reduced and were found to be significantly lower with a clear improvement in ubRMSE (decrease from 0.06 m3/m3 in average to 0.04 m3/m3 for both MR30 and MR50), RMSE (decrease from 0.14 m3/m3 (MR30) and 0.11 m3/m3 (MR50) to 0.05 m3/m3) and in MAE values (decrease from 0.13 m3/m3 (MR30) and 0.10 m3/m3 (MR50) to 0.04 m3/m3).
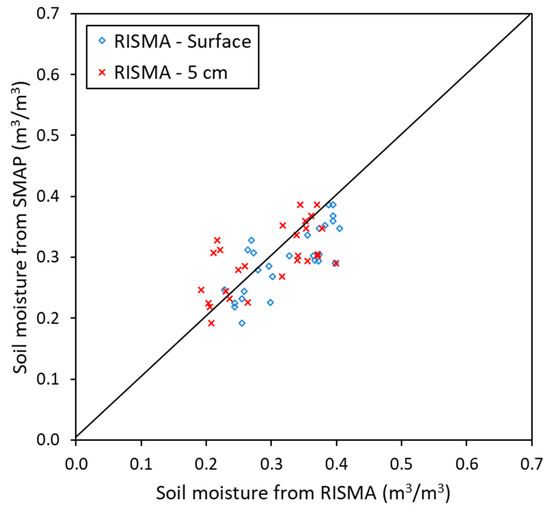
Figure 9.
Comparison between the Soil Moisture Active Passive (SMAP) soil moisture values and RISMA in-situ measurements.
Table 5.
Estimation error statistics between SMAP soil moisture estimations and RISMA in-situ measurements and RCM CP retrievals.
The CP inversion results were compared to coincident SMAP L4_SM products generated since 2015 providing 27 points for the statistical analysis. An example of coincident soil moisture products is illustrated in Figure 10. With this approach, the aforementioned statistical indices (ubRMSE, RMSE, MAE and R) were used to quantitatively compare both soil moisture products (Table 5). As evident in Figure 11, the IEM CP-based inversion model underestimates the soil moisture for both MR30 and MR50 simulated products. This underestimation is reflected by high RMSE (~0.11 m3/m3) and MAE (~0.10 m3/m3) values as reported in Table 5. It is worth mentioning that this negative bias is comparable to the trend depicted in Figure 7 when CP-based soil moisture was validated against RISMA in-situ measures. When this consistent bias is removed, (Figure 11), the ubRMSE between CP soil moisture estimates and field measures is reduced to 0.05 m3/m3 (Table 5).
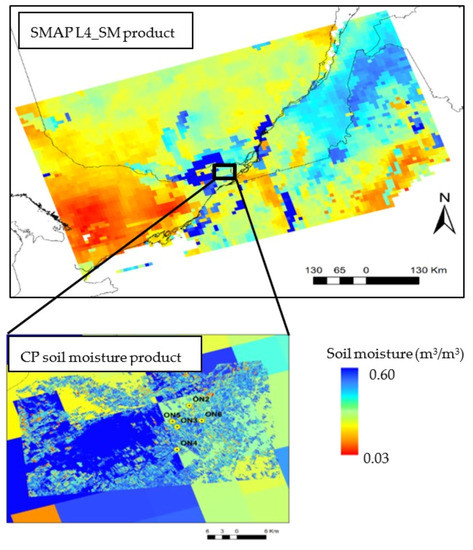
Figure 10.
Example of a SMAP L4_SM soil moisture product and a CP-derived soil moisture on October 6, 2016. RISMA stations fall within a single grid cell of SMAP.
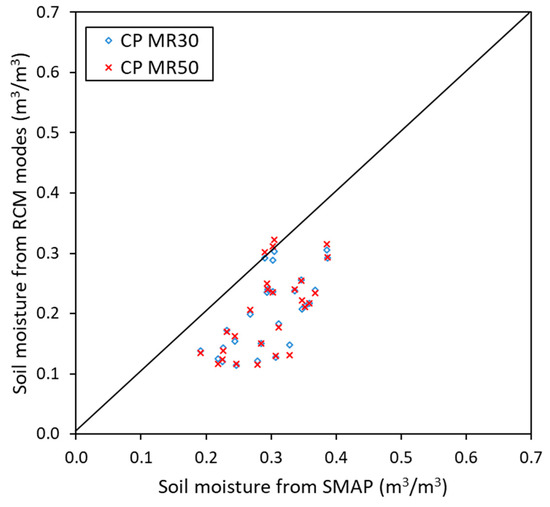
Figure 11.
Comparison between retrieved soil moisture values from RCM CP and SMAP.
The reason for these differences in the quantitative statistical performance caused by the CP underestimation is yet unknown. One possible source of bias is the difference in the RISMA measurement depths relative to the C- and L-bands effective retrieval depths. Figure 12 graphs the C- and L-bands observation depths generated using the Ulaby model (Equation (7)) [57] at the RISMA sites as a function of the volumetric soil moisture fraction. As soil moisture increases, the observation depth decreases. Furthermore, microwave measurements have been found sensitive to soil texture, particularly in the case of passive SMAP measurements (Figure 12b). At L-band, SMAP senses a greater observation depth (ranging from 2.3 cm to 6 cm) than C-band (<1.7 cm) for the full range of RISMA soil moisture measures (Figure 12). Based on these simulation results, the difference between the RISMA measurement depths (0 to 5 cm and 5 cm) and the shallower C-band observation depth may impart a dry bias in the CP retrieve soil moisture. These findings are consistent with those reported in previous research [54,65,66].
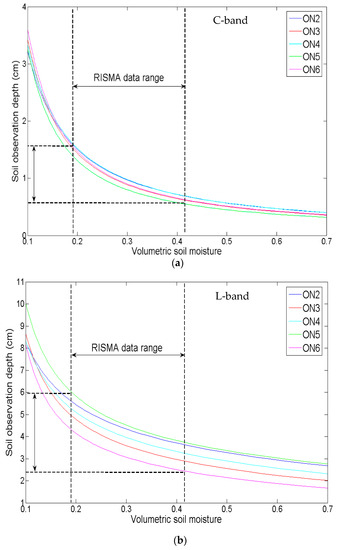
Figure 12.
Simulated soil observation depths with C-band (a) and L-band (b) based on soil texture of five RISMA station’s fields.
4. Conclusions
The purpose of this study was to evaluate the capability of C-band Compact Polarimetry (CP) data to estimate soil moisture over agricultural fields, in preparation for the RADARSAT Constellation Mission (RCM). In this research a new CP approach was introduced based on the calibrated Integral Equation Model (IEM) and simulated RCM CP intensities from RADARSAT-2 images acquired at different dates over a study site in eastern Canada.
First, RH and RV backscatter intensities were simulated using 63 RADARSAT-2 images in two different medium resolution modes (30 m (MR30) and 50 m (MR50)) taking into account the Noise Equivalent Sigma Zero (NESZ) levels as per RCM specifications. At the field scale, significant correlations were found between simulated and measured intensities in dB scale (R > 0.90), indicating that either CP modes would be suitable to generate linear transfer functions. Soil moisture retrievals from the CP multi-polarization method were contrasted with those from a fully polarimetric data. Both techniques produced highly correlated estimates with a slight overestimation in the CP results noticed essentially at the upper range of soil moisture values.
The accuracy of soil moisture retrieval using simulated CP was validated against data measured by Agriculture and Agri-Food Canada’s permanent in-situ soil moisture network. The multi-polarization implementation of the calibrated IEM yielded relatively good correlations (R > 0.70) using RH and RV polarizations. Over time, the CP inversion method clearly tracked wetting and drying trends of the soil as measured in the field and reflected in the meteorological observations. However, an underestimation of soil moisture was reported with high Mean Average Errors (MAE) and Root Mean Square Errors (RMSE). Removing this bias improved the error statistics with an unbiased Root Mean Square Error (ubRMSE) less than 0.06 m3/m3. Once RCM real data become available, we expect to acquire MR30 and MR50 modes with improved NESZ levels and greater range of incidence angles. This will allow us to tackle the question as to the impact of the radiometric quality of RCM modes. This may in fact improve the error statistics of the developed retrieval scheme.
The CP retrieval underestimation was attributed to the variance between the sensing depth between the in-situ measures and RADARSAT-2’s C-band sensing depth. This bias was again observed between SMAP’s L4_SM 9 km soil moisture products and the CP-derived estimates and confirmed with a simulation analysis of the effective retrieval depth, therefore indicating a shallower observation depth for C-band (<1.7 cm) compared to L-band. These results, demonstrated the possibility to quantify the dry bias associated with the proposed CP inversion approach for oil moisture retrieval.
The current study is limited to essentially bare soils. There are many significant applications of soil moisture on bare soils in fall and spring in Canada, even if we do not extend into the growing season. These include flood risk, erosion modelling and management decisions with respect to timing of seeding and pre-emergence fertilizer applications. There is also growing interest in the efficacy of nitrogen fertilizers under excess moisture conditions and de-nitrification losses (both from an agronomic and greenhouse gas emission perspective). Typically, nitrogen fertilizer is applied under these bare soil conditions. Agriculture and Agri-Food Canada is currently working on methods to model vegetation contribution in the radar signal so that we can extend C-band soil moisture monitoring into the active growing season.
Author Contributions
Conceptualization, A.M. and H.M.; Methodology, A.M. and H.M.; Writing—original draft, A.M. and H.M.; Writing—review & editing, A.M., H.M., J.P. and M.F.
Funding
This research was funded by the Canadian Space Agency under the Data Utilization and Applications Plan (DUAP).
Acknowledgments
The authors would like to thank the reviewers for their comments and suggestions. RADARSAT-2 Data and Products © Maxar Technologies Ltd. (2018)—All Rights Reserved. RADARSAT is an official mark of the Canadian Space Agency.
Conflicts of Interest
The authors declare no conflict of interest.
References
- Entekhabi, D. Recent advances in land–atmosphere interaction research. Rev. Geophys. 1995, 33, 995–1004. [Google Scholar] [CrossRef]
- Pablos, M.; Martínez-Fernández, J.; Piles, M.; Sánchez, N.; Vall-llossera, M.; Camps, A. Multi-temporal evaluation of soil moisture and land surface temperature dynamics using in situ and satellite observations. Remote Sen. 2016, 8, 587. [Google Scholar] [CrossRef]
- Pionner Canada. Agronomy Sciences Research Summary: Canadian Edition, 2012, 40p. Available online: https://ca.pioneer.com/west/en/agronomy/agronomy-research-summary/ (accessed on 14 January 2019).
- O’Riordan, J.; Karlsen, E.; Sandford, B.; Newman, L. Summary for Decision Makers: Climate Change Adaptation and Canada’s Crops and Food Supply; Adaptation to Climate Change Team, Simon Fraser University: Burnaby, BC, Canada, 2013. [Google Scholar]
- El Hajj, M.; Baghdadi, N.; Zribi, M.; Bazzi, H. Synergic use of Sentinel-1 and Sentinel-2 images for operational soil moisture mapping at high spatial resolution over agricultural areas. Remote Sens. 2017, 9, 1292. [Google Scholar] [CrossRef]
- Gao, Q.; Zribi, M.; Escorihuela, M.; Baghdadi, N. Synergetic use of Sentinel-1 and Sentinel-2 data for soil moisture mapping at 100 m resolution. Sensors 2017, 17, 1966. [Google Scholar] [CrossRef] [PubMed]
- Soil Moisture at Very High Spatial Resolution. Available online: www.theia-land.fr/en/product/soil-moisture-with-very-high-spatial-resolution (accessed on 30 August 2019).
- Bartalis, Z.; Wagner, W.; Naeimi, V.; Hasenauer, S.; Scipal, K.; Bonekamp, H.; Figa, J.; Anderson, C. Initial soil moisture retrievals from the METOP-A Advanced Scatterometer (ASCAT). Geophys. Res. Lett. 2007, 34, L20401. [Google Scholar] [CrossRef]
- Imaoka, K.; Kachi, M.; Kasahara, M.; Ito, N.; Nakagawa, K.; Oki, T. Instrument performance and calibration of AMSR-E and AMSR2. Int. Arch. Photogramm. Remote Sens. Spat. Inf. Sci. 2010, 38, 13–18. [Google Scholar]
- Kerr, Y.H.; Waldteufel, P.; Wigneron, J.-P.; Delwart, S.; Cabot, F.; Boutin, J.; Escorihuela, M.J.; Font, J.; Reul, N.; Gruhier, C.; et al. The SMOS mission: New tool for monitoring key elements of the global water cycle. Proc. IEEE 2010, 98, 666–687. [Google Scholar] [CrossRef]
- Entekhabi, D.; Njoku, E.G.; O’Neill, P.E.; Kellogg, K.H.; Crow, W.T.; Edelstein, W.N.; Entin, J.K.; Goodman, S.D.; Jackson, T.J.; Johnson, J.; et al. The Soil Moisture Active Passive (SMAP) mission. Proc. IEEE 2010, 98, 704–716. [Google Scholar] [CrossRef]
- Kim, H.; Lakshmi, V. Use of Cyclone Global Navigation Satellite System (CYGNSS) observations for estimation of soil moisture. Geophys. Res. Lett. 2018, 45, 8272–8282. [Google Scholar] [CrossRef]
- Martínez-Fernández, J.; González-Zamora, A.; Sánchez, N.; Gumuzzio, A.; Herrero-Jiménez, C.M. Satellite soil moisture for agricultural drought monitoring: Assessment of the SMOS derived soil water deficit index. Remote Sens. Environ. 2016, 177, 277–286. [Google Scholar] [CrossRef]
- Mishra, A.; Vu, T.; Veeti, A.V.; Entekhabi, D. Drought monitoring with Soil Moisture Active Passive (SMAP) measurements. J. Hydrol. 2017, 552, 620–632. [Google Scholar] [CrossRef]
- Pierdicca, N.; Pulvirenti, L.; Pace, G. A prototype software package to retrieve soil moisture from sentinel-1 data by using a Bayesian multitemporal algorithm. J. Sel. Top. Appl. Earth Observ. Remote Sens. 2014, 7, 153–166. [Google Scholar] [CrossRef]
- He, L.; Qin, Q.; Panciera, R.; Tanase, M.; Walker, J.P.; Hong, Y. An extension of the alpha approximation method for soil moisture estimation using time-series SAR data over bare soil surfaces. IEEE Geosci. Remote Sens. Lett. 2017, 14, 1328–1332. [Google Scholar] [CrossRef]
- Izumi, Y.; Widodo, J.; Kausarian, H.; Demirci, S.; Takahashi, A.; Tetuko, J.; Sumantyo, S.; Sato, M. Soil moisture retrieval by means of adaptive polarimetric two-scale two-component model with fully polarimetric ALOS-2 data. In Proceedings of the IEEE International Geoscience and Remote Sensing Symposium (IGARSS 2018), Valencia, Spain, 22–27 July 2018; pp. 4619–4622. [Google Scholar] [CrossRef]
- Hajdu, I.; Yule, I.; Dehghan-Shear, M.H. Modelling of near-surface soil moisture using machine learning and multi-temporal Sentinel 1 images in New Zealand. In Proceedings of the IEEE International Geoscience and Remote Sensing Symposium (IGARSS 2018), Valencia, Spain, 22–27 July 2018; pp. 1422–1425. [Google Scholar] [CrossRef]
- Tao, L.; Wang, G.; Chen, W.; Chen, X.; Li, J.; Cai, Q. Soil moisture retrieval from SAR and optical data using a combined model. IEEE J. Sel. Top. Appl. Earth Obs. 2019, 12, 637–647. [Google Scholar] [CrossRef]
- Bauer-Marschallinger, B.; Freeman, V.; Cao, S.; Paulik, C.; Schaufler, S.; Stachl, T.; Modanesi, S.; Massari, C.; Ciabatta, L.; Brocca, L.; et al. Toward global soil moisture monitoring with Sentinel-1: Harnessing assets and overcoming obstacles. IEEE Trans. Geosci. Remote Sens. 2019, 57, 520–539. [Google Scholar] [CrossRef]
- Balenzano, A.; Mattia, F.; Satalino, G.; Pauvels, V.; Snoeij, P. SMOSAR algorithm for soil moisture retrieval using Sentinel-1 data. In Proceedings of the IEEE International Geoscience and Remote Sensing Symposium (IGARSS 2012), Munich, Germany, 22–27 July 2012. [Google Scholar] [CrossRef]
- Merzouki, A.; McNairn, H. A hybrid (multi-angle and multipolarization) approach to soil moisture retrieval using the integral equation model: Preparing for the RADARSAT constellation mission. Can. J. Remote Sens. 2015, 41, 349–362. [Google Scholar] [CrossRef]
- Huang, X.Q.; Wang, J.-G.; Shang, J. An adaptive two-component model-based decomposition on soil moisture estimation for C-band RADARSAT-2 imagery over wheat fields at early growing stages. IEEE Geosci. Remote Sens. Lett. 2016, 13, 414–418. [Google Scholar] [CrossRef]
- Wang, H.; Magagi, R.; Goita, K. Comparison of different polarimetric decompositions for soil moisture retrieval over vegetation covered agricultural area. Remote Sens. Environ. 2017, 199, 120–136. [Google Scholar] [CrossRef]
- Berg, A.; Krafczek, M.; Clewley, D.; Whitcomb, J.; Akbar, R.; Moghaddam, M.; McNarin, H. Contributions of geophysical and C-band SAR data for estimation of field scale soil moisture. In Proceedings of the IEEE International Geoscience and Remote Sensing Symposium (IGARSS 2018), Valencia, Spain, 22–27 July 2018; pp. 6127–6130. [Google Scholar] [CrossRef]
- Wang, H.; Magagi, R.; Goita, K. Potential of a two-component polarimetric decomposition at C-band for soil moisture retrieval over agricultural fields. Remote Sens. Environ. 2018, 217, 38–51. [Google Scholar] [CrossRef]
- McNairn, H.; Merzouki, A.; Pacheco, A.; Fitzmaurice, J. Monitoring soil moisture to support risk reduction for the agriculture sector using RADARSAT-2. IEEE J. Sel. Top. Appl. Earth Obs. 2012, 5, 824–834. [Google Scholar] [CrossRef]
- Bhuiyan, A.K.M.; McNairn, H.; Powers, J.; Merzouki, A. Application of HEC-HMS in a cold region watershed and use of RADARSAT-2 soil moisture in initializing the model. Hydrology 2017, 4, 9. [Google Scholar] [CrossRef]
- Dabboor, M.; Sun, L.; Carrera, M.L.; Friesen, M.; Merzouki, A.; McNairn, H.; Powers, J.; Bélair, S. Comparative analysis of high-resolution soil moisture simulations from the Soil, Vegetation, and Snow (SVS) land surface model using SAR imagery over bare soil. Water 2019, 11, 542. [Google Scholar] [CrossRef]
- Charbonneau, F.J.; Brisco, B.; Raney, R.K.; McNairn, H.; Liu, C.; Vachon, P.W.; Shang, J.; Champagne, C.; Merzouki, A.; Geldsetzer, T. Compact polarimetry overview and applications assessment. Can. J. Remote Sens. 2010, 36, 298–315. [Google Scholar] [CrossRef]
- Williams, M.L. Potential for surface parameter estimation using compact polarimetric SAR. IEEE Geosci. Remote Sens. Lett. 2009, 5, 471–473. [Google Scholar] [CrossRef]
- Truong-Loï, M.; Freeman, A.; Dubois-Fernandez, P.; Pottier, E. Estimation of soil moisture and Faraday rotation from bare surfaces using compact polarimetry. IEEE Trans. Geosci. Remote Sens. 2009, 47, 3608–3615. [Google Scholar] [CrossRef]
- Dubois, P.; van Zyl, J.; Engman, T. Measuring soil moisture with imaging radars. IEEE Trans. Geosci. Remote Sens. 1995, 33, 915–926. [Google Scholar] [CrossRef]
- Ouellette, J.D.; Johnson, J.T.; Kim, S.; Van Zyl, J.; Moghaddam, M.; Spencer, M.W.; Tsang, L.; Entekhabi, D. A simulation study of compact polarimetry for radar retrieval of soil moisture. IEEE Trans. Geosci. Remote Sens. 2014, 52, 5966–5973. [Google Scholar] [CrossRef]
- Ponnurangam, G.G.; Rao, Y.S. The application of compact polarimetric decomposition algorithms to L-band PolSAR data in agricultural areas. Int. J. Remote Sens. 2018, 39, 8337–8360. [Google Scholar] [CrossRef]
- Ponnurangam, G.G.; Jagdhuber, T.; Hajnsek, I.; Rao, Y.S. Soil moisture inversion using hybrid polarimetric SAR data of RISAT-1. IEEE Trans. Geosci. Remote Sens. 2016, 54, 2033–2049. [Google Scholar] [CrossRef]
- SNC (South Nation Conservation). 2012 Annual Report. Available online: www.nation.on.ca (accessed on 10 June 2014).
- Soil Survey Reports for Ontario. CanSIS (Canadian Soil Information Service). Available online: http://sis.agr.gc.ca/cansis/publications/surveys/on/index.html (accessed on 29 July 2019).
- SNC (South Nation Conservation). 2014 Annual Report. Available online: www.nation.on.ca (accessed on 11 July 2016).
- Seyfried, M.S.; Grant, L.E.; Du, E.; Humes, K. Dielectric loss and calibration of Hydra Probe soil water sensor. Vadose Zone J. 2005, 4, 1070–1079. [Google Scholar] [CrossRef]
- Bellingham, K. The Stevens Hydra Probe Inorganic Soil Calibrations; Stevens Water Monitoring Systems: Portland, OR, USA, 2007. [Google Scholar]
- Medasani, S.; Reddy, G.U. Analysis and evaluation of speckle filters for polarimetric synthetic aperture radar (PolSAR) data. Int. J. Appl. Eng. Res. 2017, 12, 4916–4927. [Google Scholar]
- Curlander, J.C.; McDonough, R.N. Synthetic Aperture Radar: Systems and Signal Processing; Wiley: New York, NY, USA, 1991. [Google Scholar]
- Charbonneau, F.; Brisco, B.; van der Sanden, J.; Toutin, T.; Touzi, R.; Chen, H.; Liu, C.; McNairn, H.; Shang, J.; Buckley, J.; et al. RCM compact polarimetric applications developments overview. In Proceedings of the IEEE International Geoscience and Remote Sensing Symposium (IGARSS 2014), Quebec City, QC, Canada, 13–18 July 2014. [Google Scholar]
- Reichle, R.H.; De Lannoy, G.; Forman, B.A.; Draper, C.S.; Liu, Q. Connecting satellite observations with water cycle variables through land data assimilation: Examples using the NASA GEOS-5 LDAS. Surv. Geophys. 2014, 35, 577–606. [Google Scholar] [CrossRef]
- Reichle, R.H.; Koster, R.; De Lannoy, G.; Crow, W.; Kimball, J. SMAP Level 4 Surface and Root Zone Soil Moisture Data Product: L4_SM Algorithm Theoretical Basis Document (Revision A), Soil Moisture Active Passive (SMAP) Mission Science Document; JPL D-66483; Jet Propulsion Laboratory: Pasadena, CA, USA, 2014.
- Reichle, R.H.; De Lannoy, G.; Liu, Q.; Colliander, A.; Conaty, A.; Jackson, T.; Kimball, J.; Koster, R. Soil Moisture Active Passive (SMAP) Project Assessment Report for the Beta-Release L4_SM Data Product; Technical Report Series on Global Modeling and Data Assimilation; NASA/TM–2015-104606/Vol. 40; Goddard Space Flight Center: Greenbelt, MD, USA, 2015.
- Brodzik, M.J.; Billingsley, B.; Haran, T.; Raup, B.; Savoie, M.H. EASE-Grid 2.0: Incremental but significant improvements for Earth-gridded data sets. ISPRS Int. J. Geoinf. 2012, 1, 32–45. [Google Scholar] [CrossRef]
- McNairn, H.; Merzouki, A.; Li, Y.; Lampropoulos, G.; Tan, W.; Powers, J.; Friesen, M. Retrieval of field-scale soil moisture using compact polarimetry: Preparing for the RADARSAT-Constellation. In Proceedings of the IEEE International Geoscience and Remote Sensing Symposium (IGARSS 2018), Valencia, Spain, 22–27 July 2018; pp. 6135–6138. [Google Scholar] [CrossRef]
- Baghdadi, N.; Hola, N.; Zribi, M. Calibration of the integral equation model for SAR data in C-band and HH and VV polarizations. Int. J. Remote Sens. 2006, 27, 805–816. [Google Scholar] [CrossRef]
- Álvarez-Mozos, J.; Casalí, J.; González-Audícana, M.; Verhoest, N.E.C. Assessment of the operational applicability of RADARSAT-1 data for surface soil moisture estimation. IEEE Trans. Geosci. Remote Sens. 2006, 44, 913–924. [Google Scholar] [CrossRef]
- Choker, M.; Baghdadi, N.; Zribi, M.; El Hajj, M.; Paloscia, S.; Verhoest, N.E.C.; Lievens, H.; Mattia, F. Evaluation of the Oh, Dubois and IEM backscatter models using a large dataset of SAR data and experimental soil measurements. Water 2017, 9, 38. [Google Scholar] [CrossRef]
- Hallikainen, M.T.; Ulaby, F.T.; Dobson, M.C.; El-Rayes, M.A.; Wu, L.-K. Microwave dielectric behaviour of wet soil—Part I: Empirical models and experimental observations. IEEE Trans. Geosci. Remote Sens. 1985, GE-23, 25–34. [Google Scholar] [CrossRef]
- Adams, J.R.; McNairn, H.; Berg, A.; Champagne, C. Evaluation of near-surface soil moisture data from an AAFC monitoring network in Manitoba, Canada: Implications for L-band satellite validation. J. Hydrol. 2015, 521, 582–592. [Google Scholar] [CrossRef]
- van Oevelen, P.J. Soil moisture variability: A comparison between detailed field measurements and remote sensing measurement techniques. Hydrol. Sci. J. 1998, 43, 511–520. [Google Scholar] [CrossRef]
- Walker, J.P. Estimating Soil Moisture Profile Dynamics from Near-Surface Soil Moisture Measurements and Standard Meteorological Data. Ph.D. Thesis, The University of Newcastle, Callaghan, Australia, 1999. [Google Scholar]
- Ulaby, F.T.; Moore, R.K.; Fung, A.K. Microwave Remote Sensing: Active and Passive; Volume II: Radar Remote Sensing and Surface Scattering and Emission Theory; Artech House: Norwood, MA, USA, 1982. [Google Scholar]
- Zribi, M.; Gorrab, A.; Baghdadi, N.; Lili-Chabaane, Z.; Mougenot, B. Influence of radar frequency on the relationship between bare surface soil moisture vertical profile and radar backscatter. IEEE Geosci. Remote Sens. Lett. 2014, 11, 848–852. [Google Scholar] [CrossRef]
- Engman, E.T.; Chauhan, N. Status of microwave soil moisture measurements with remote sensing. Remote Sens. Environ. 1995, 51, 189–198. [Google Scholar] [CrossRef]
- Willmott, C.J. Some comments on the evaluation of model performance. Bull. Am. Meteorol. Soc. 1982, 63, 1309–1313. [Google Scholar] [CrossRef]
- Entekhabi, D.; Reichle, R.H.; Koster, R.D.; Crow, W. Performance metrics for soil moisture retrievals and application requirements. J. Hydrometeorol. 2010, 11, 832–840. [Google Scholar] [CrossRef]
- Luscombe, A. Image quality and calibration of RADARSAT-2. In Proceedings of the IEEE International Geoscience and Remote Sensing Symposium (IGARSS 2009), Cape Town, South Africa, 12–17 July 2009; pp. II-757–II-760. [Google Scholar] [CrossRef]
- Merzouki, A.; McNairn, H.; Pacheco, A. Evaluation of the Dubois, Oh, and IEM radar backscatter models over agricultural fields using C-band RADARSAT-2 SAR image data. Can. J. Remote Sens. 2010, 36, S274–S286. [Google Scholar] [CrossRef]
- Williams, D.; LeDantec, P.; Chabot, M.; Hillman, A.; James, K.; Caves, R.; Thompson, A.; Vigneron, C.; Wu, Y. RADARSAT-2 image quality and calibration update. In Proceedings of the 10th European Conference on Synthetic Aperture Radar (EUSAR 2014), Berlin, Germany, 3–4 June 2014; pp. 1–4. [Google Scholar]
- Escorihuela, M.J.; Chanzy, A.; Wigneron, J.P.; Kerr, Y.H. Effective soil moisture sampling depth of L-band radiometry: A case study. Remote Sens. Environ. 2010, 114, 995–1001. [Google Scholar] [CrossRef]
- Le Morvan, A.; Zribi, M.; Baghdadi, N.; Chanzy, A. Soil moisture profile effect on radar signal measurement. Sensors 2008, 8, 256–270. [Google Scholar] [CrossRef] [PubMed]
© 2019 by Her Majesty the Queen in Right of Canada as represented by the Minister of Agriculture and Agri-Food Canada. Licensee MDPI, Basel, Switzerland. This article is an open access article distributed under the terms and conditions of the Creative Commons by Attribution (CC-BY) license (http://creativecommons.org/licenses/by/4.0/).