High-Resolution Sea Surface Temperature and Salinity in Coastal Areas Worldwide from Raw Satellite Data


Abstract
1. Introduction
2. Methodology
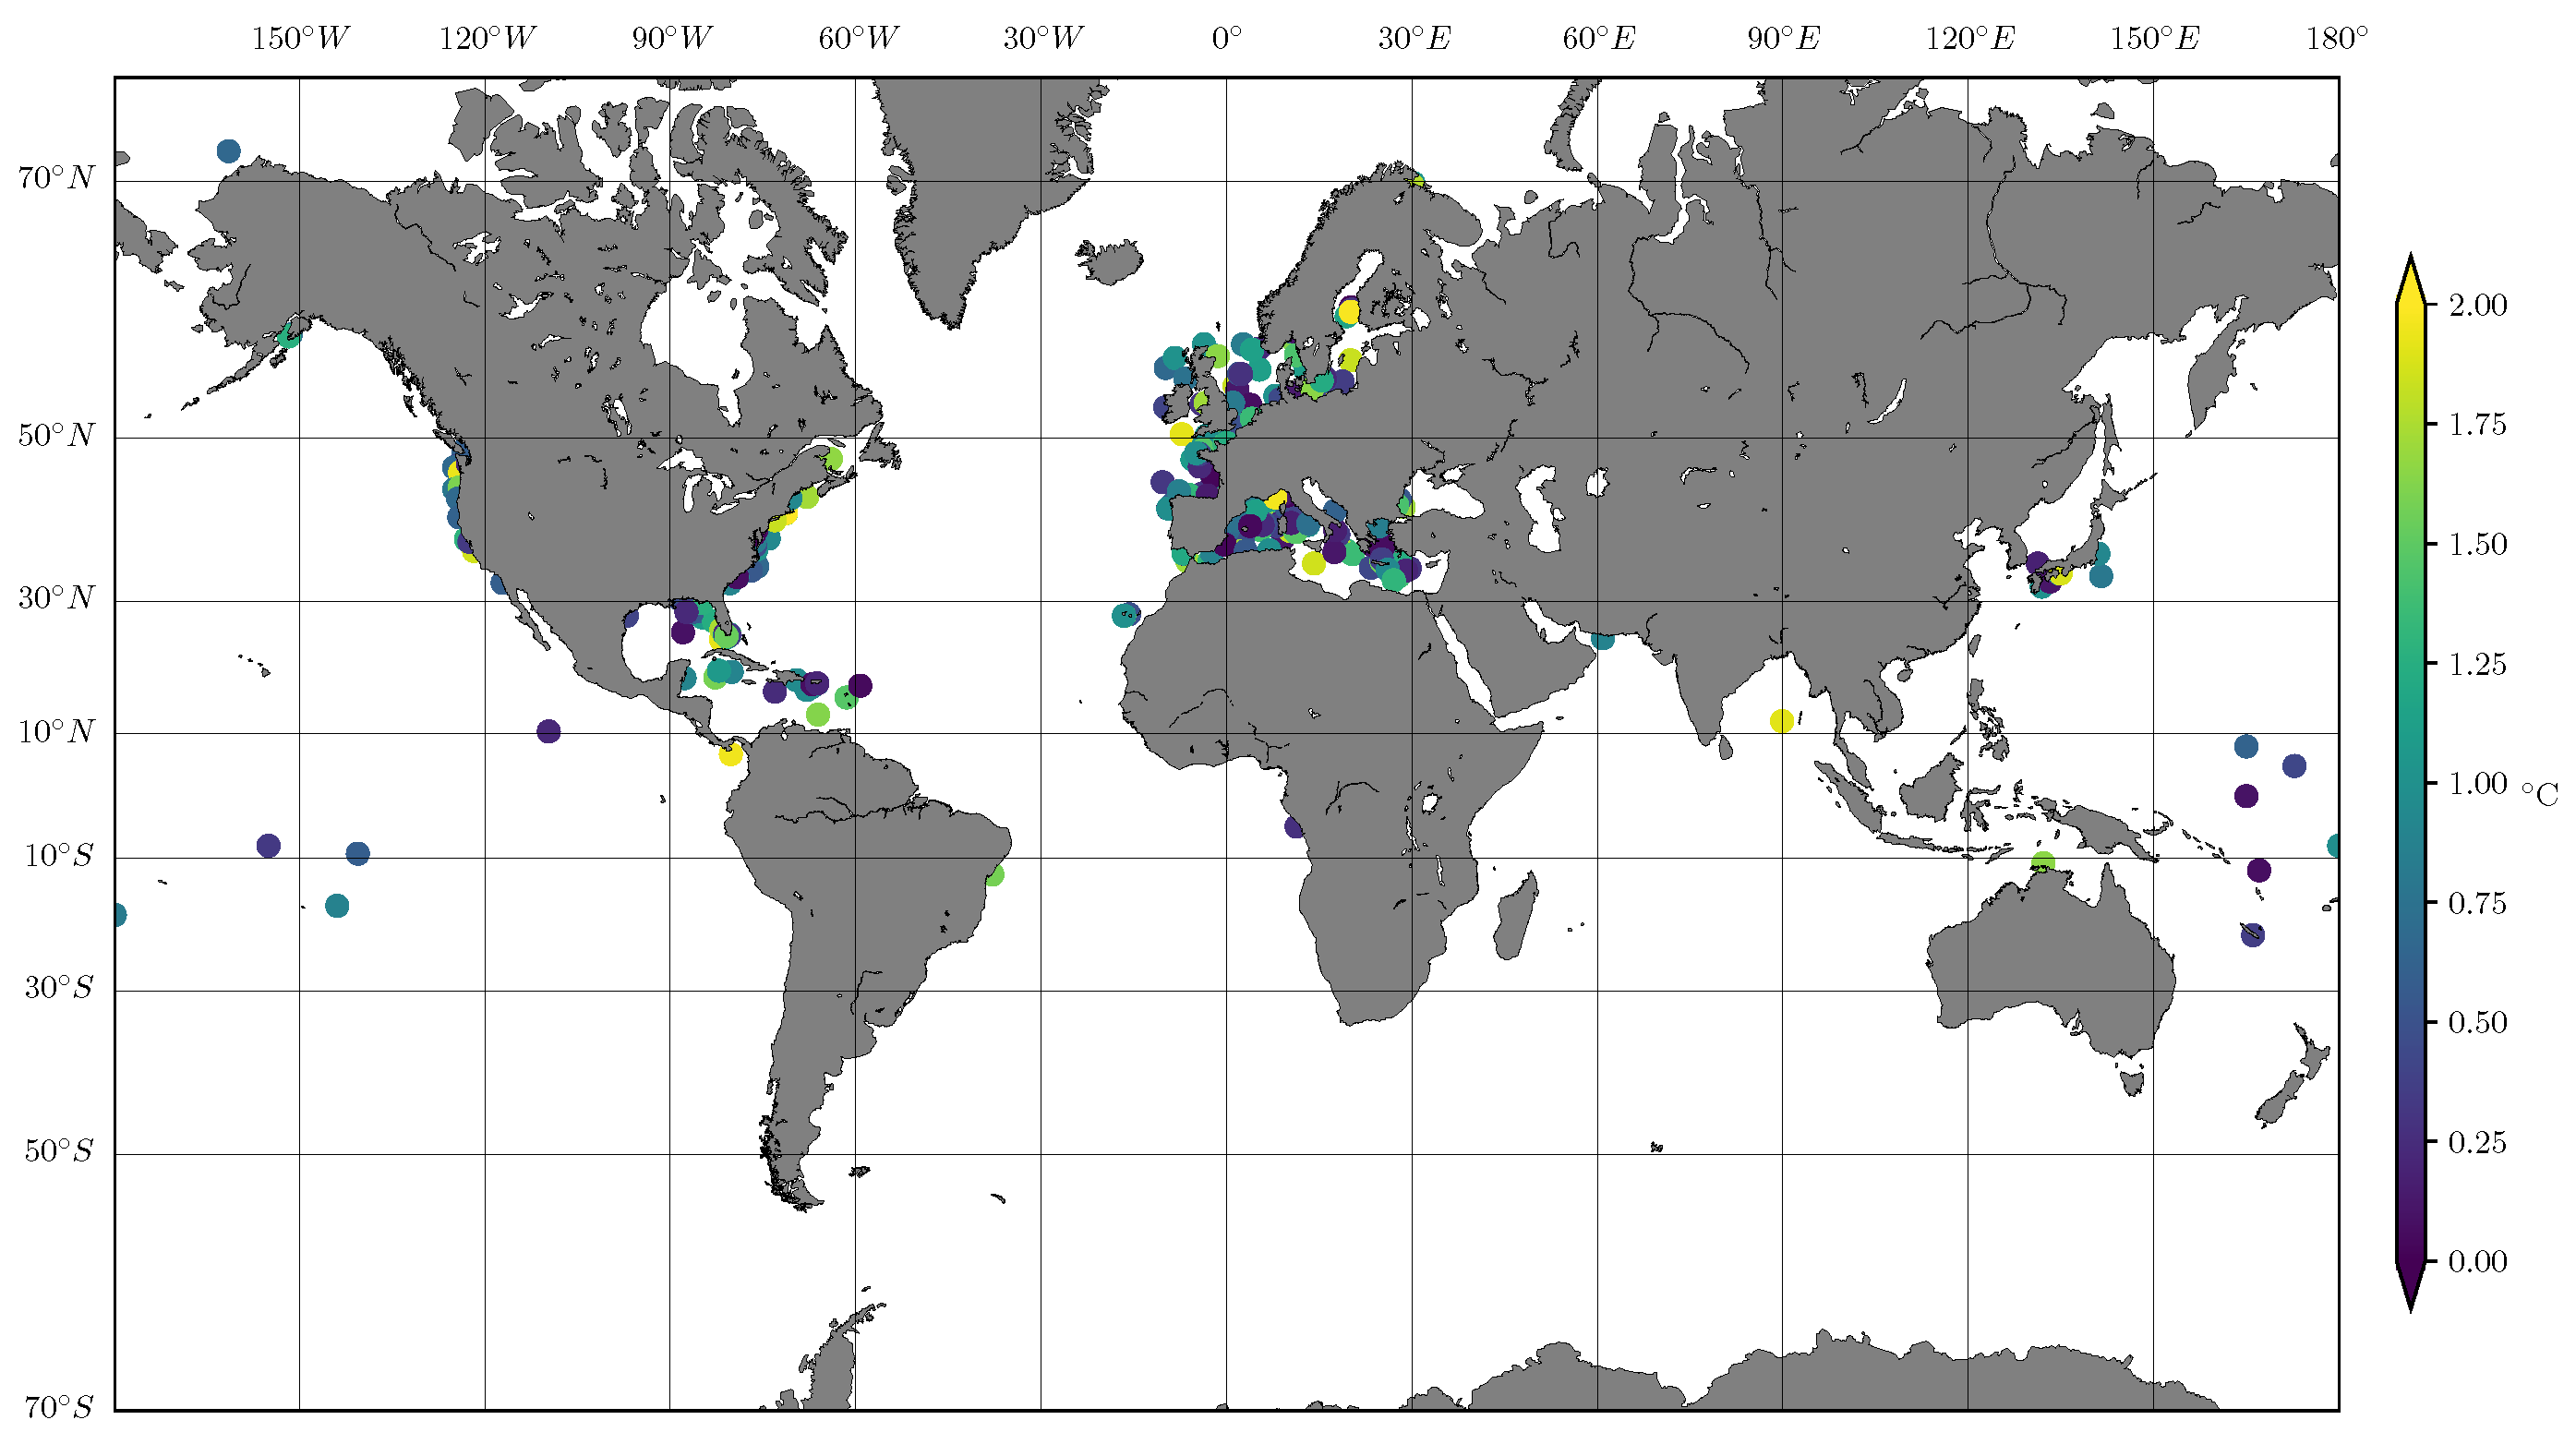
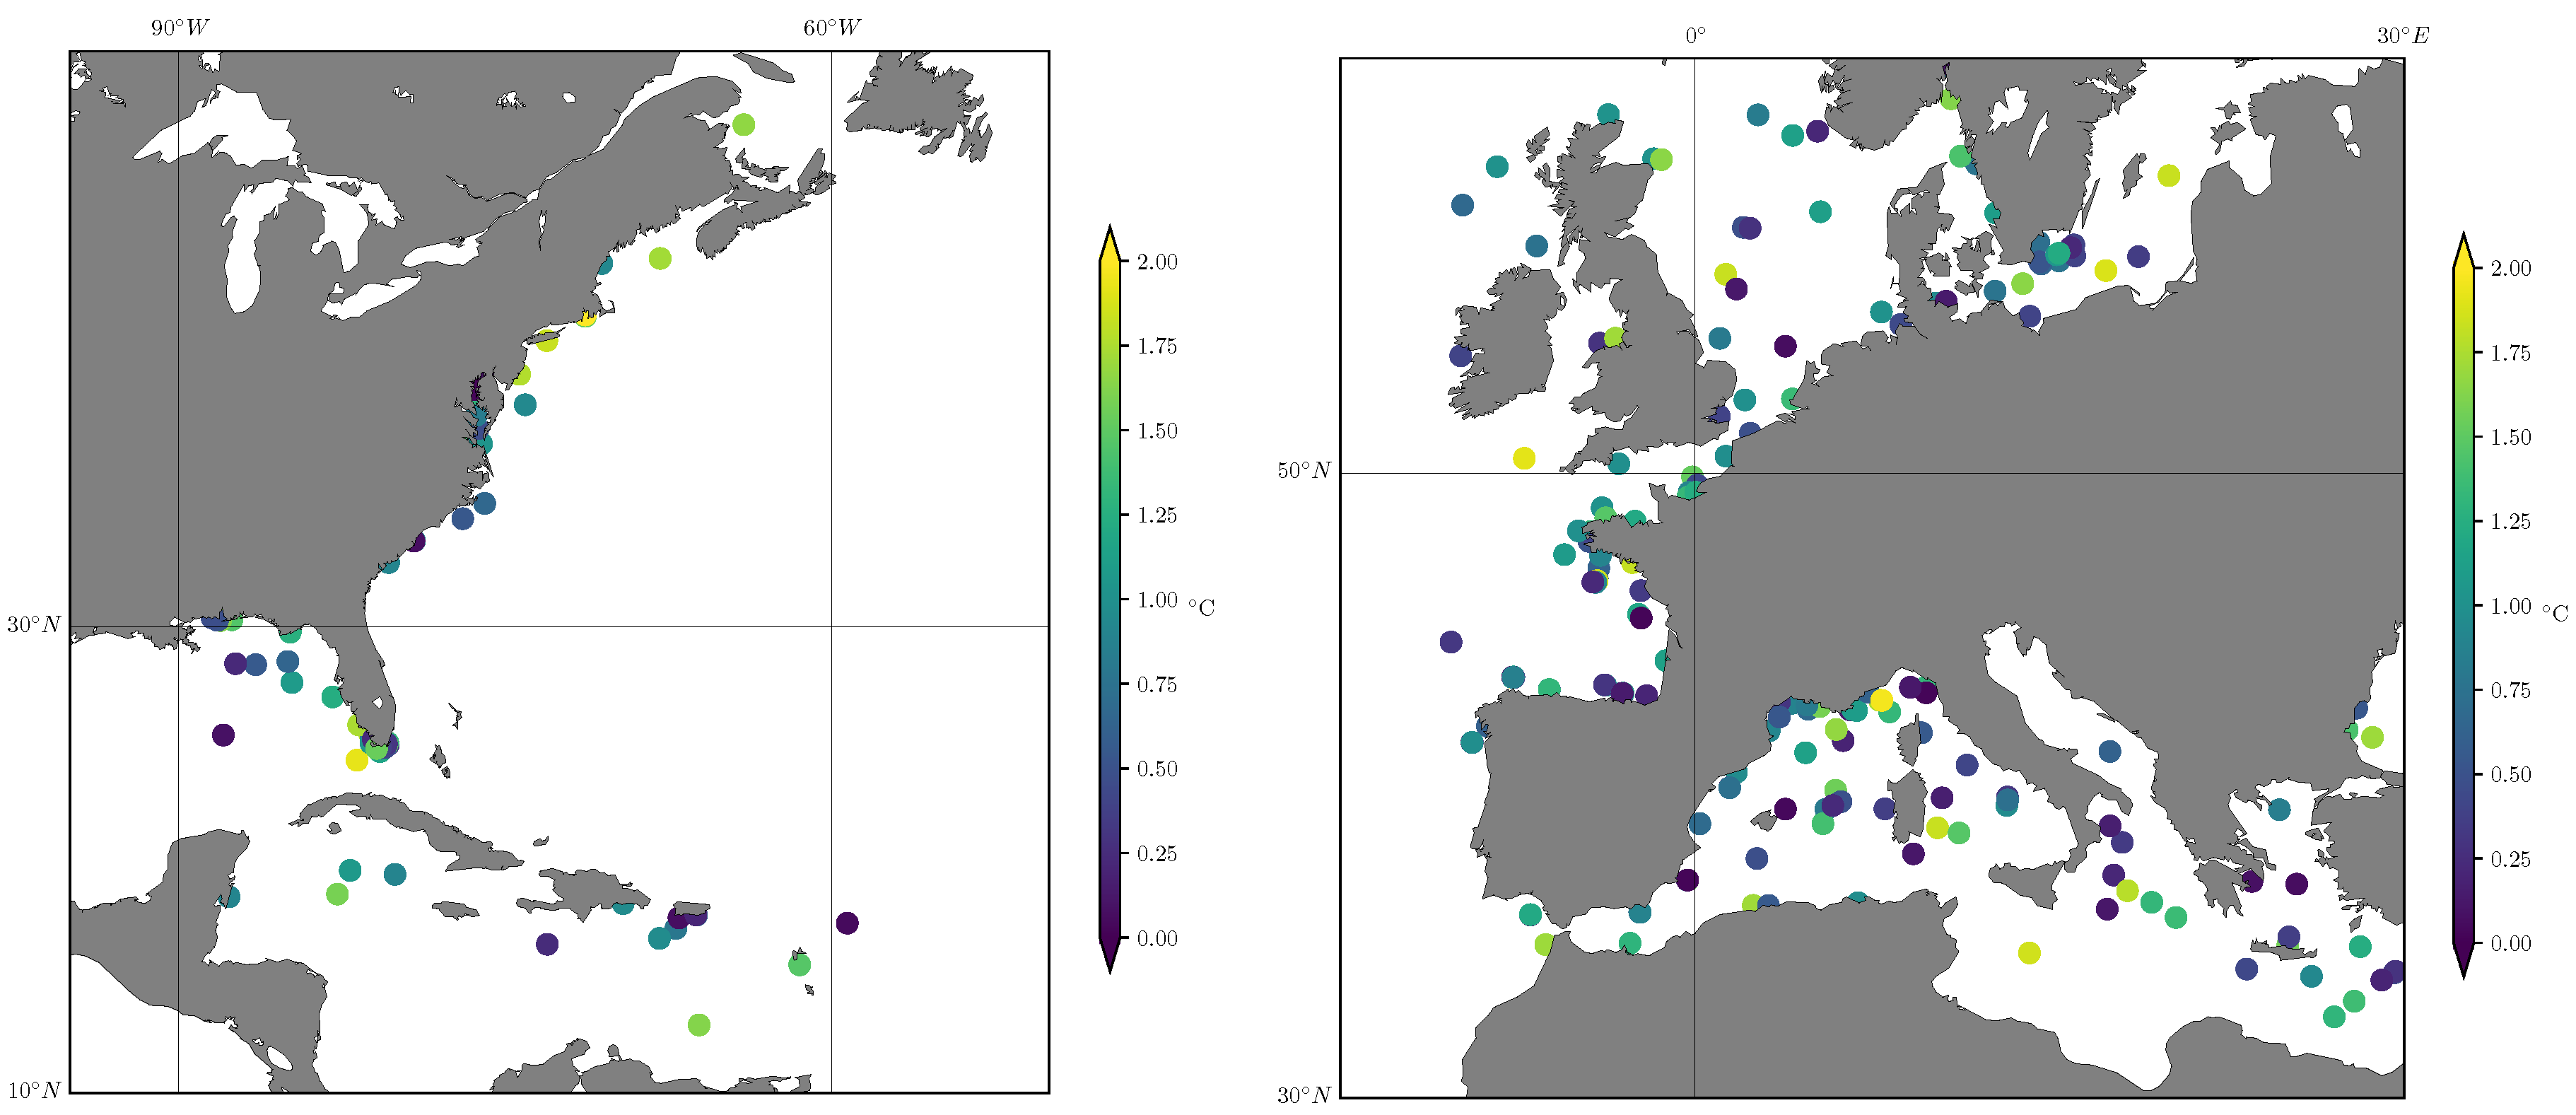
2.1. In Situ Data
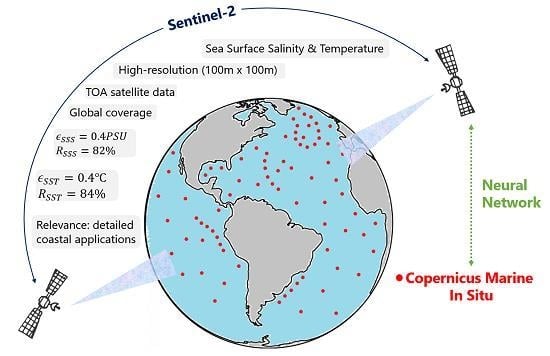
2.2. Satellite Data
2.3. Matching Process
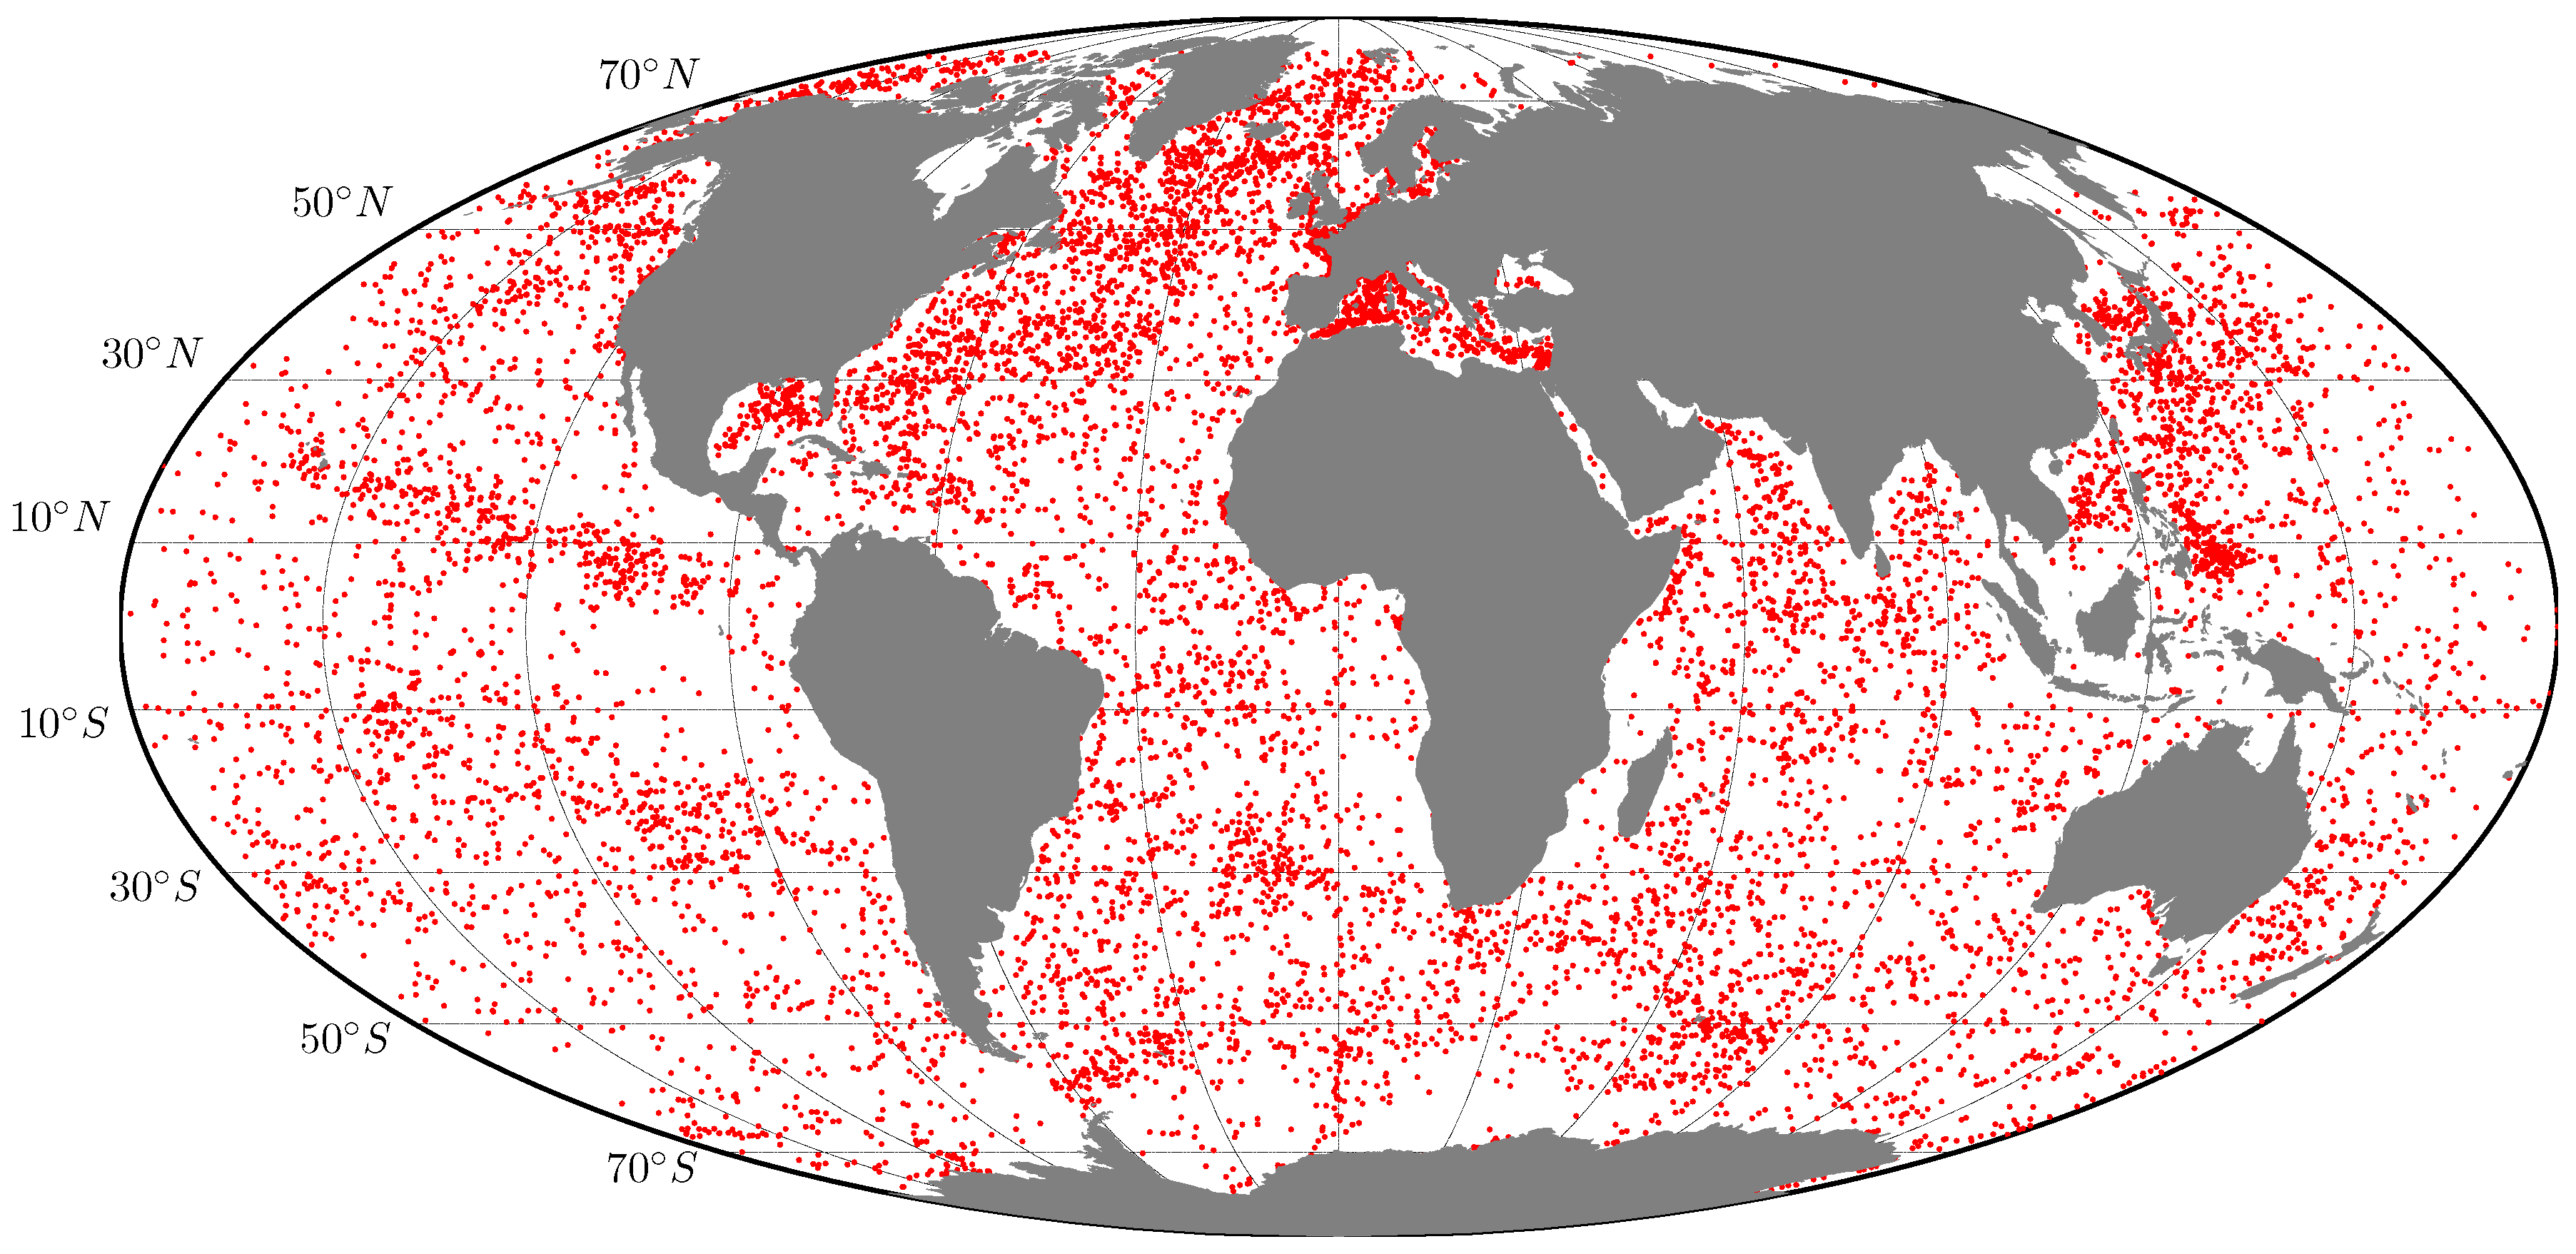
- In situ data containing salinity and temperature from the 23 June 2015 onwards (start of Sentinel-2 mission) is downloaded from the Copernicus Marine In Situ data portal, [4]. Data worldwide is obtained, with more than files and about 160GB of data downloaded.
- For each in situ measurement point, the Sentinel-2 image collection is filtered to the tiles that contain the point on the day and time when the measurement was taken. The image is only considered if the in situ measurement was taken within 1 h of Sentinel-2 pass time. Previous research considered wider time windows, but with this approach more accurate results are expected.
- If there is any valid tiles for that point, they are clipped in boxes of m m area centred in the point location to obtain high-resolution estimators of SST and SSS. This box size is taken to average the effect of wave reflectance.
- The time difference between the in situ measurement and the satellite image is recorded. In case of multiple tiles covering the point of interest, the matched data is sorted by time difference, and the one with the smallest difference is selected.
- A table containing satellite data (band information and other properties) and equivalent in situ information (salinity and temperature) for each valid point is composed.
- Band QA60 containing a cloud mask has been used to select points only with a clear sky, i.e., points were clouds are persistent have not been considered: no opaque clouds or cirrus clouds present.
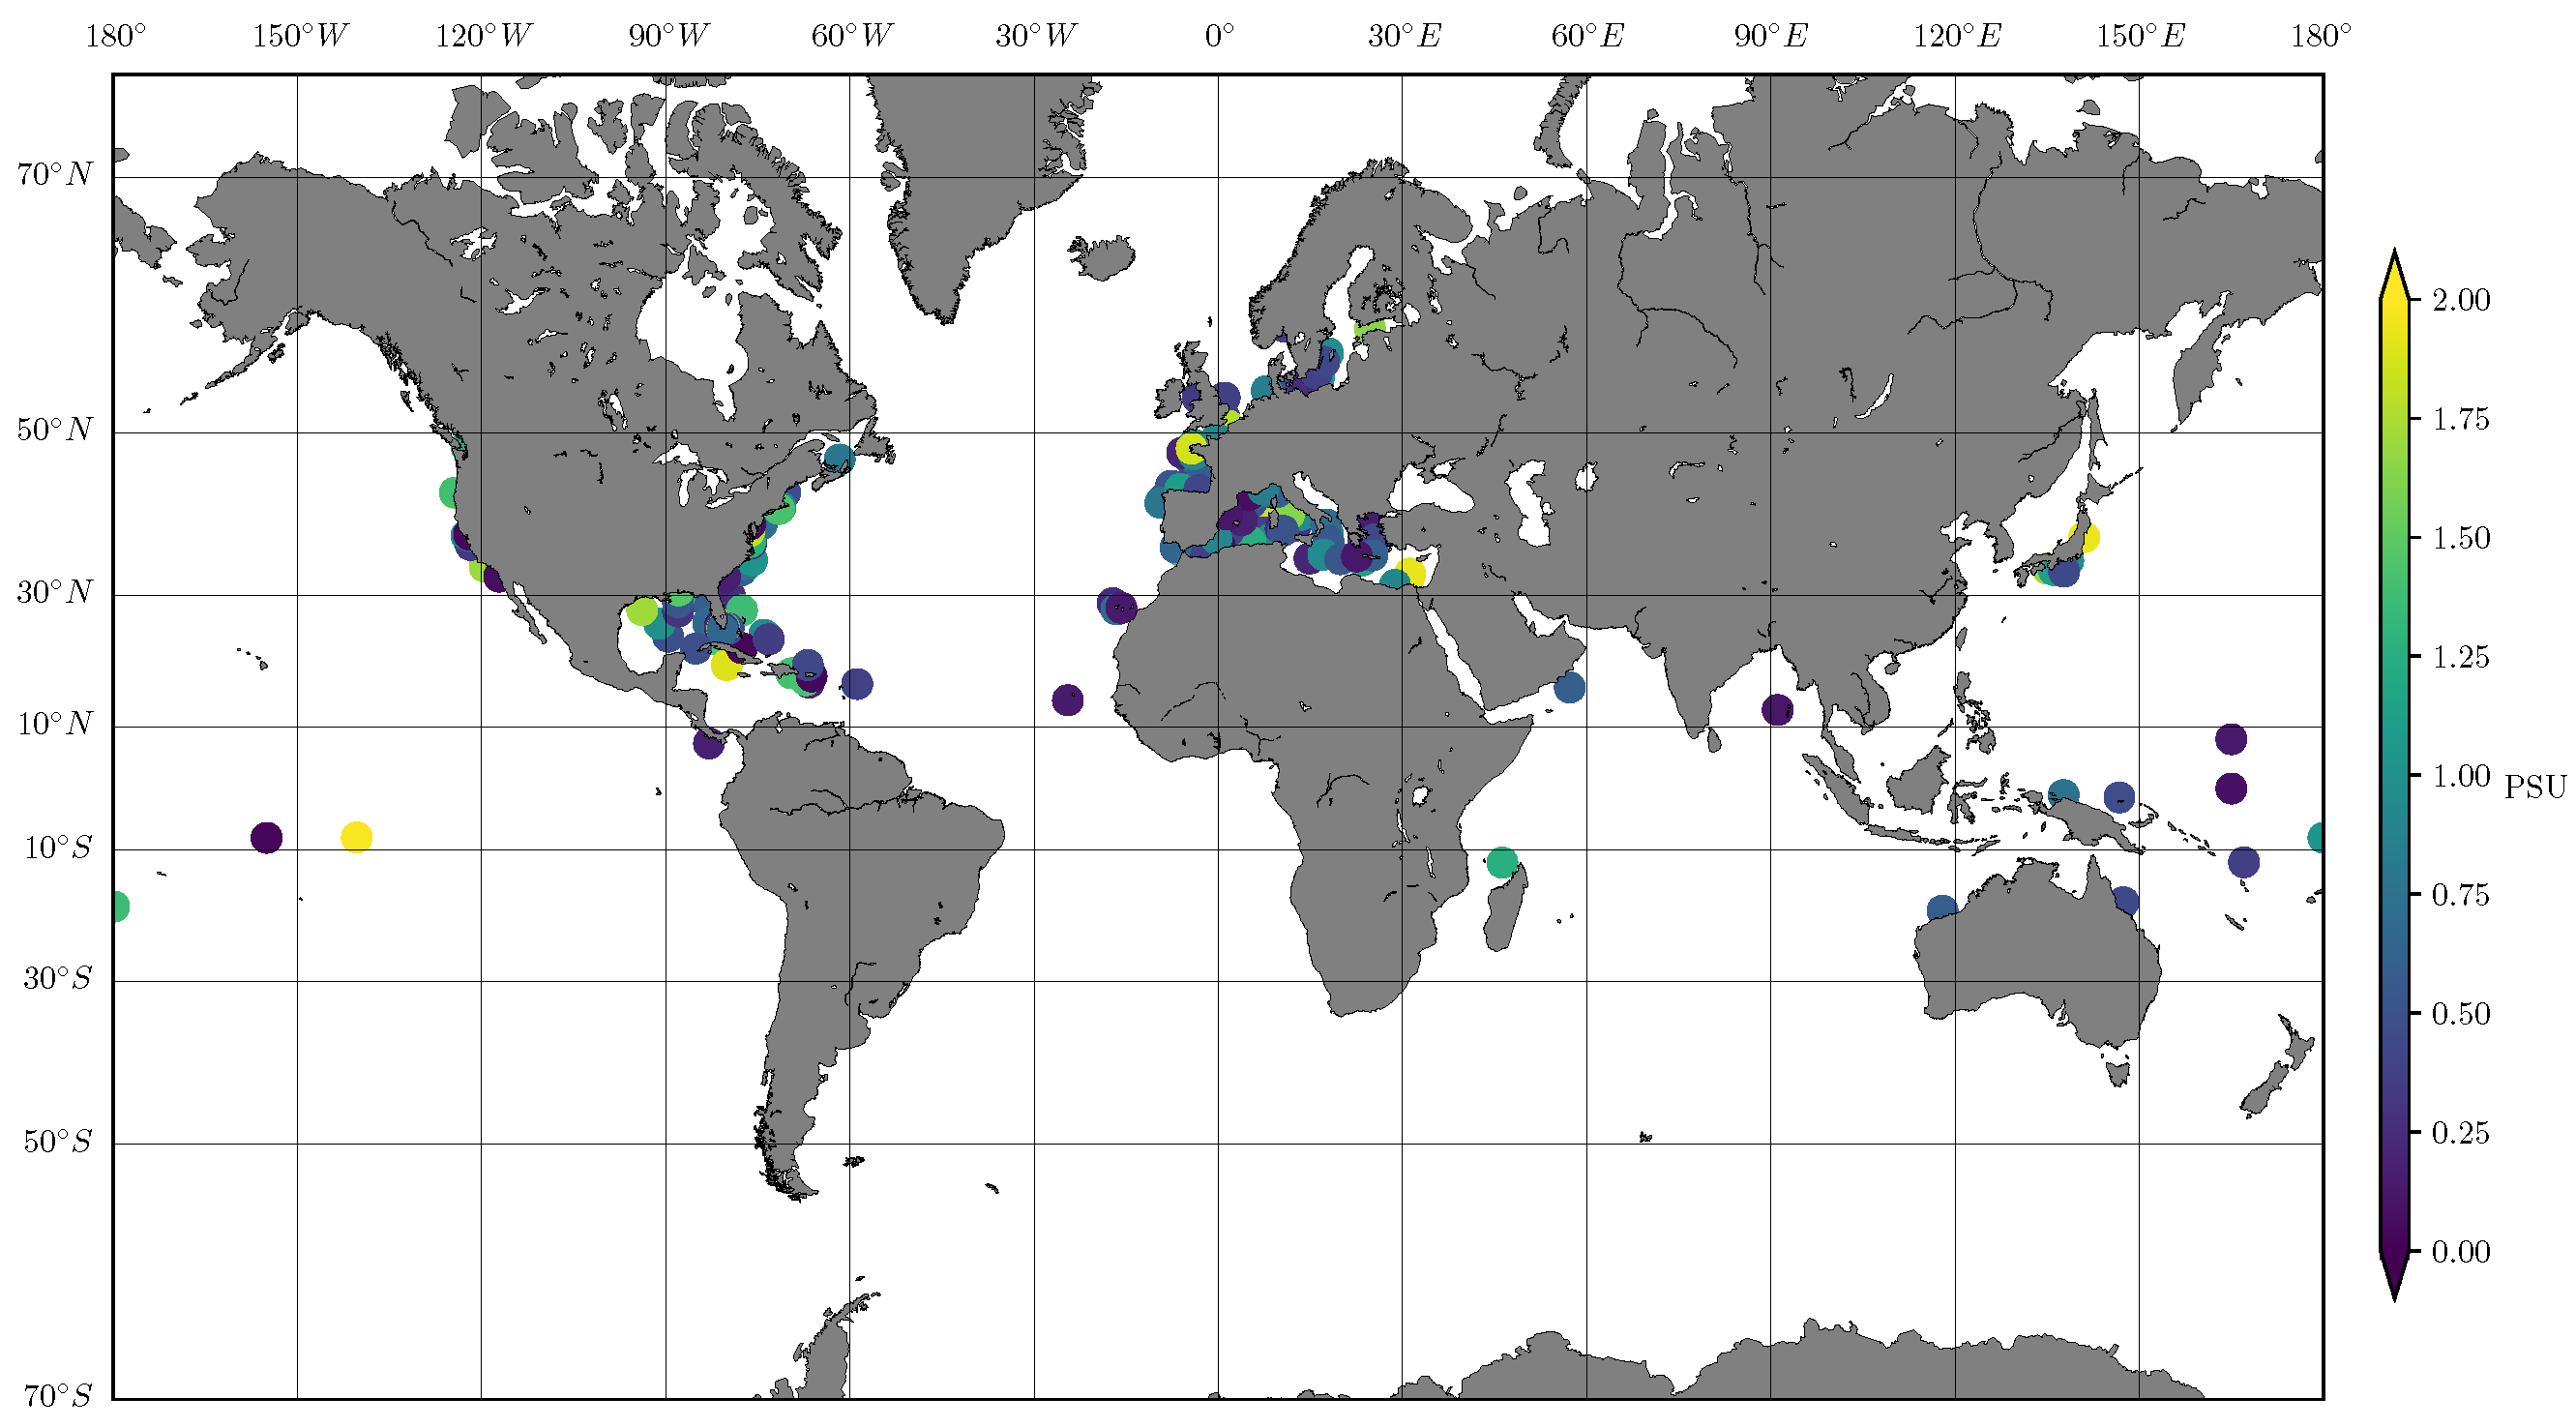
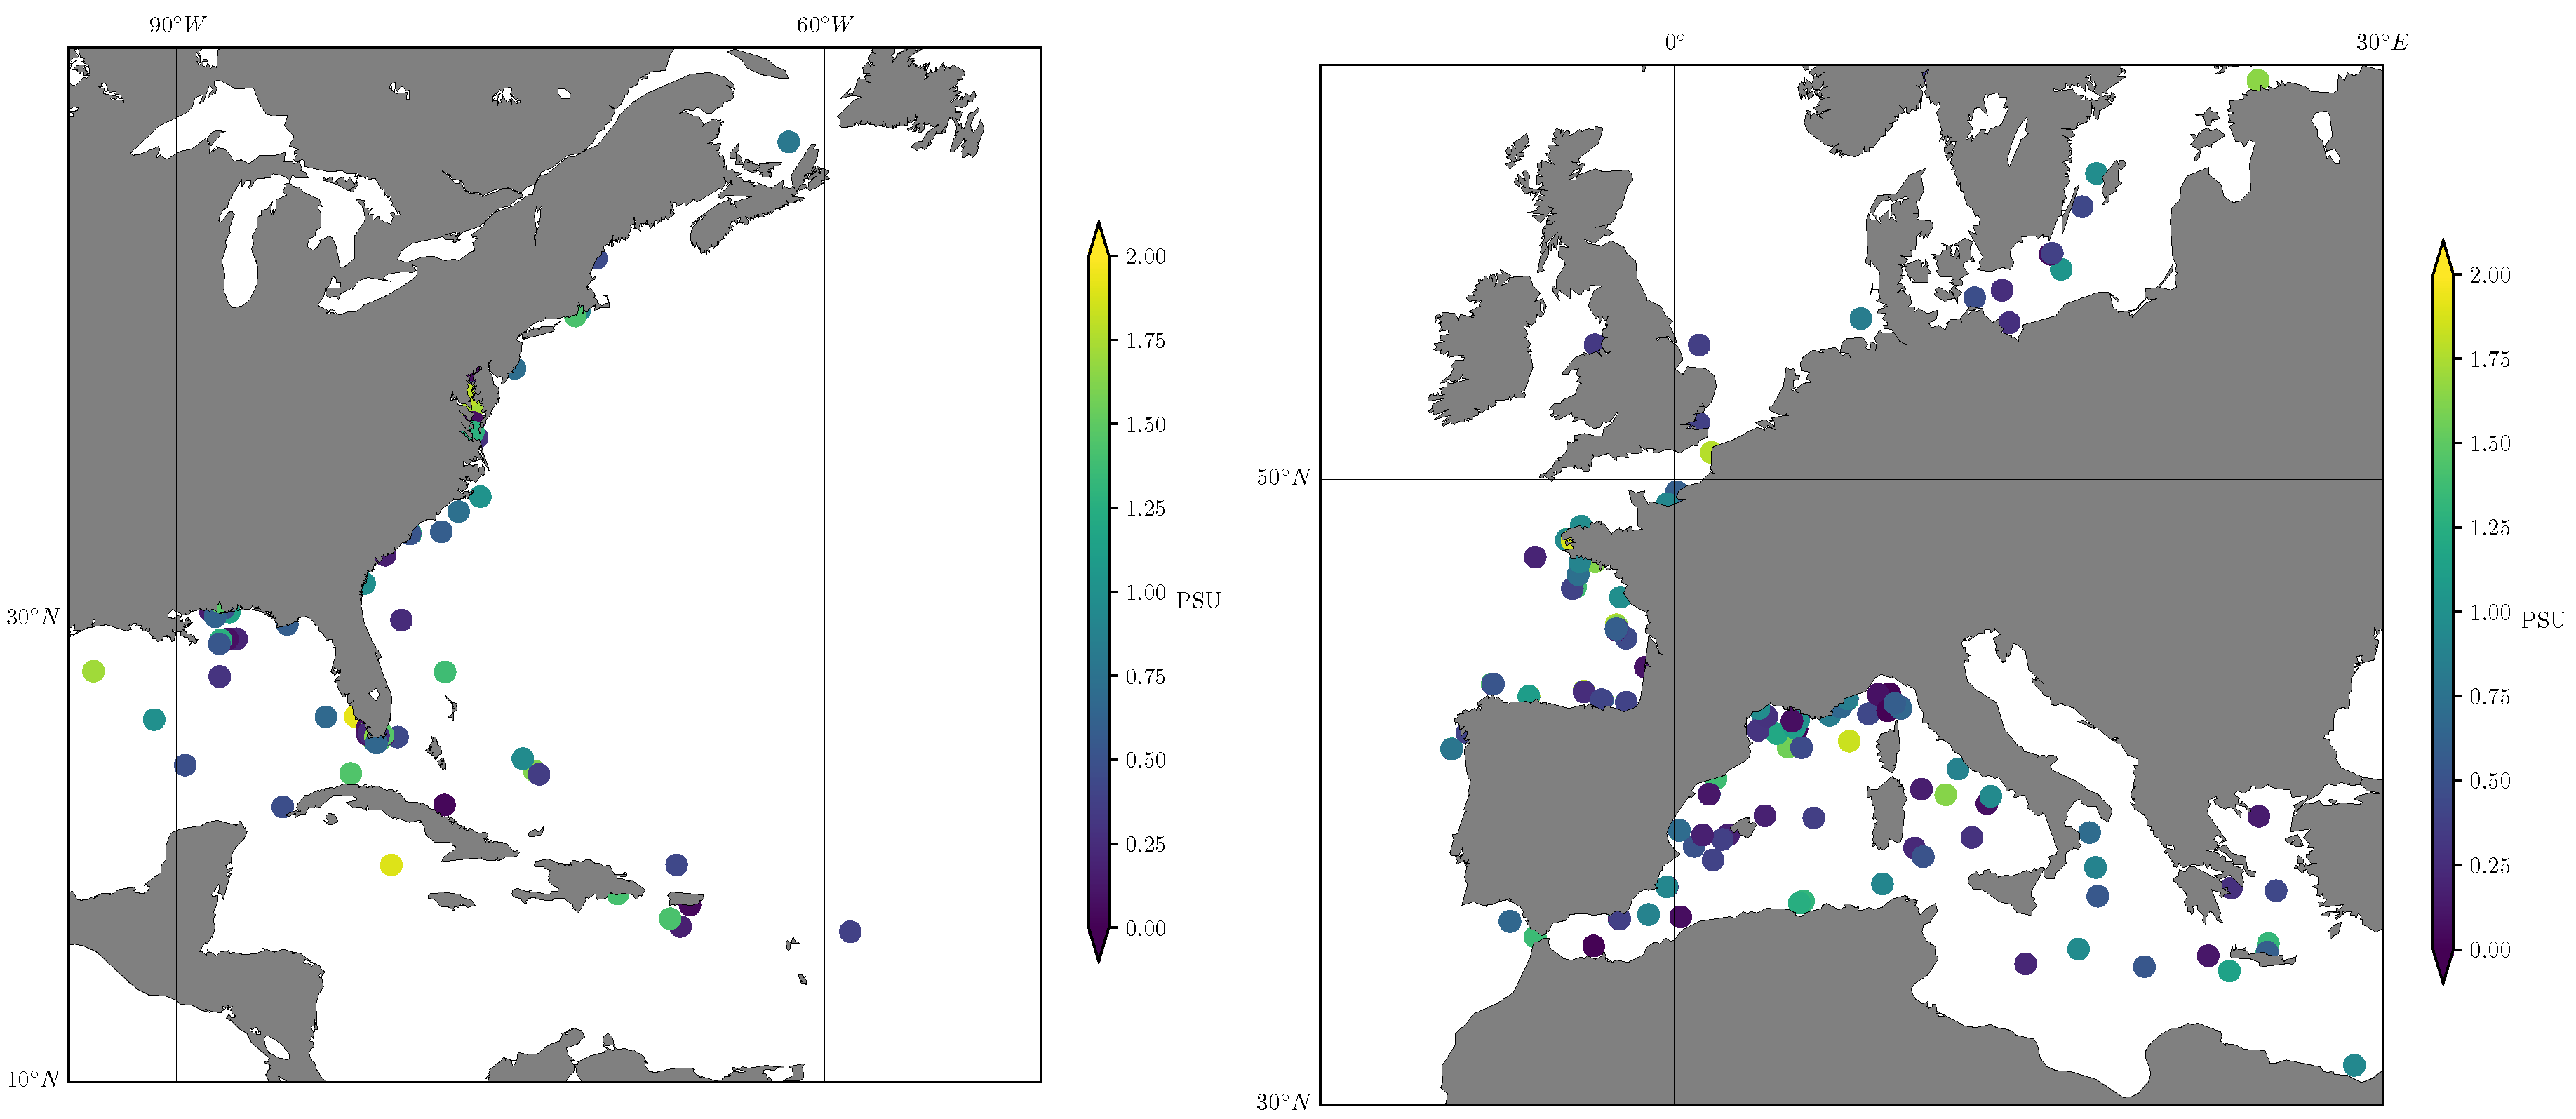
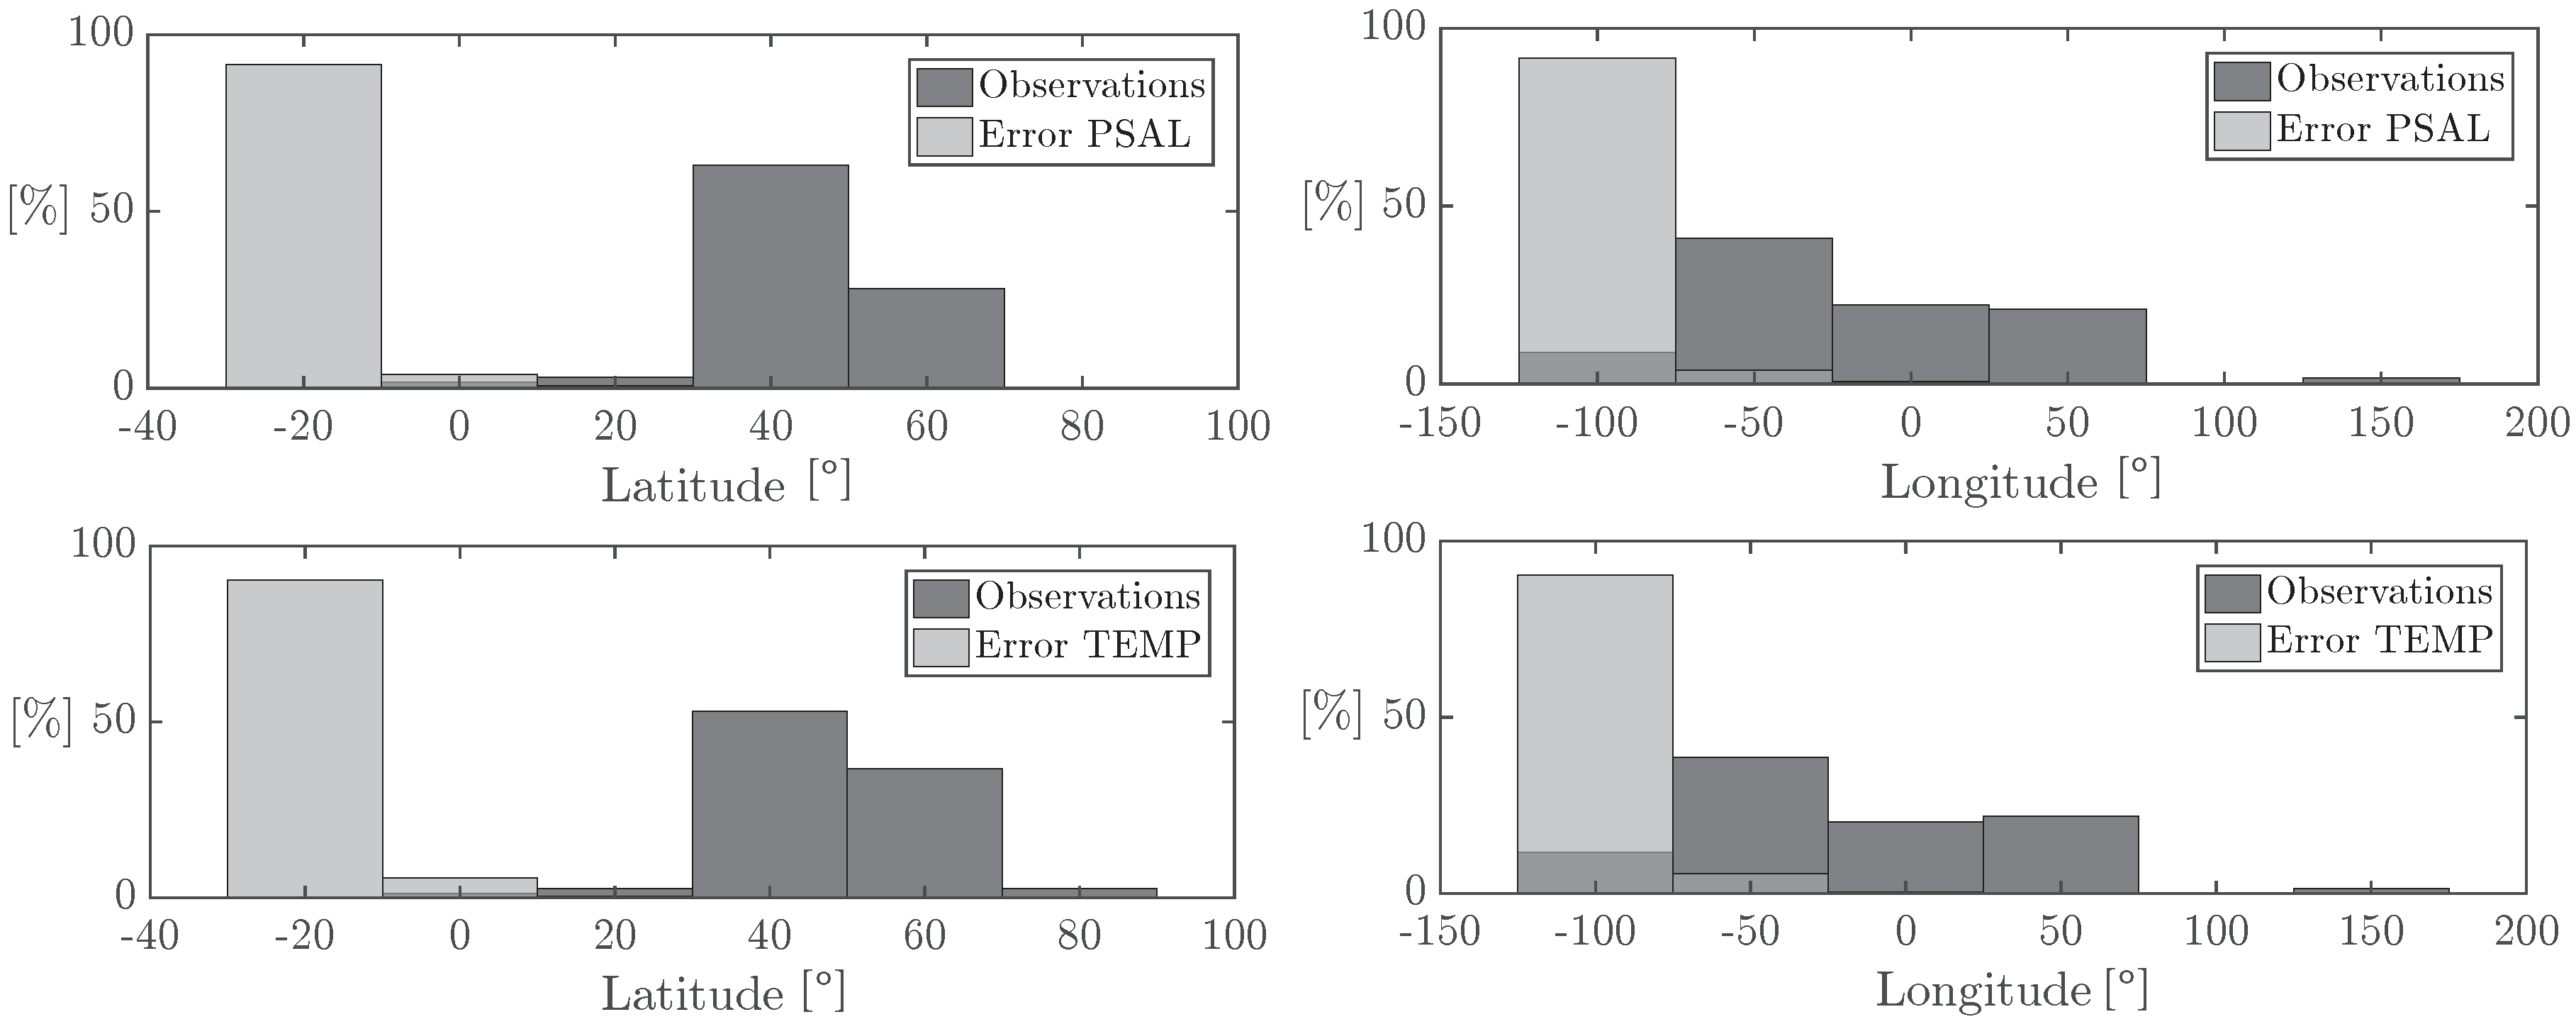
2.4. Data Usage and Coverage
2.5. Neural Network
2.5.1. Data Processing, File Loading, Filtering and Outliers Removal
2.5.2. Normalisation
2.5.3. Training and Test Data Split
2.5.4. Trainer
2.5.5. Running Predictions
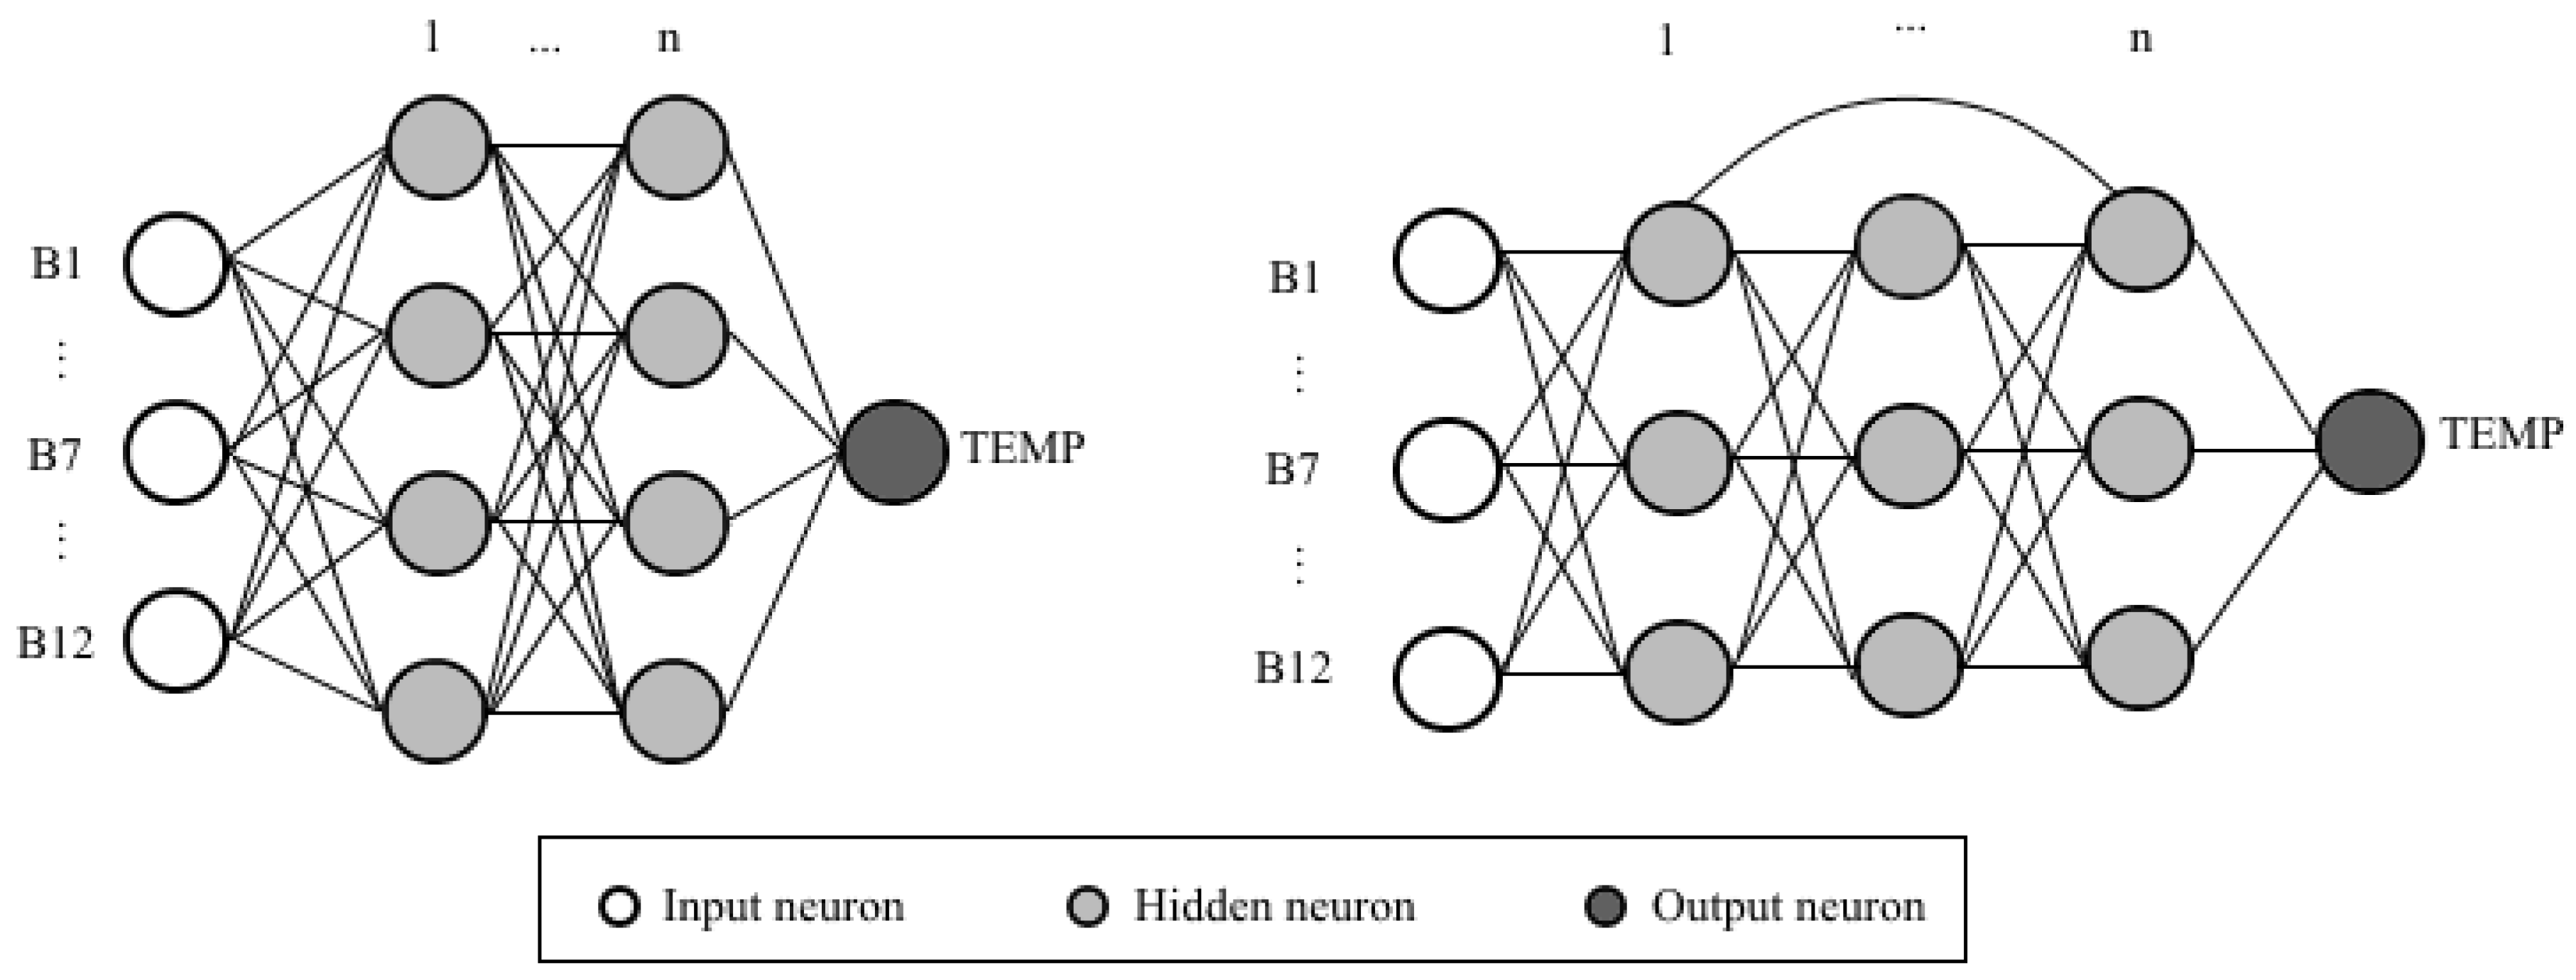
2.5.6. Architecture of the Neural Network
- -
- ReLu:
- -
- Sigmoid:
- -
- Tanh:
- -
- Mean Absolute Error:
- -
- Mean Squared Error:
- -
- Logcosh
3. Results and Discussion
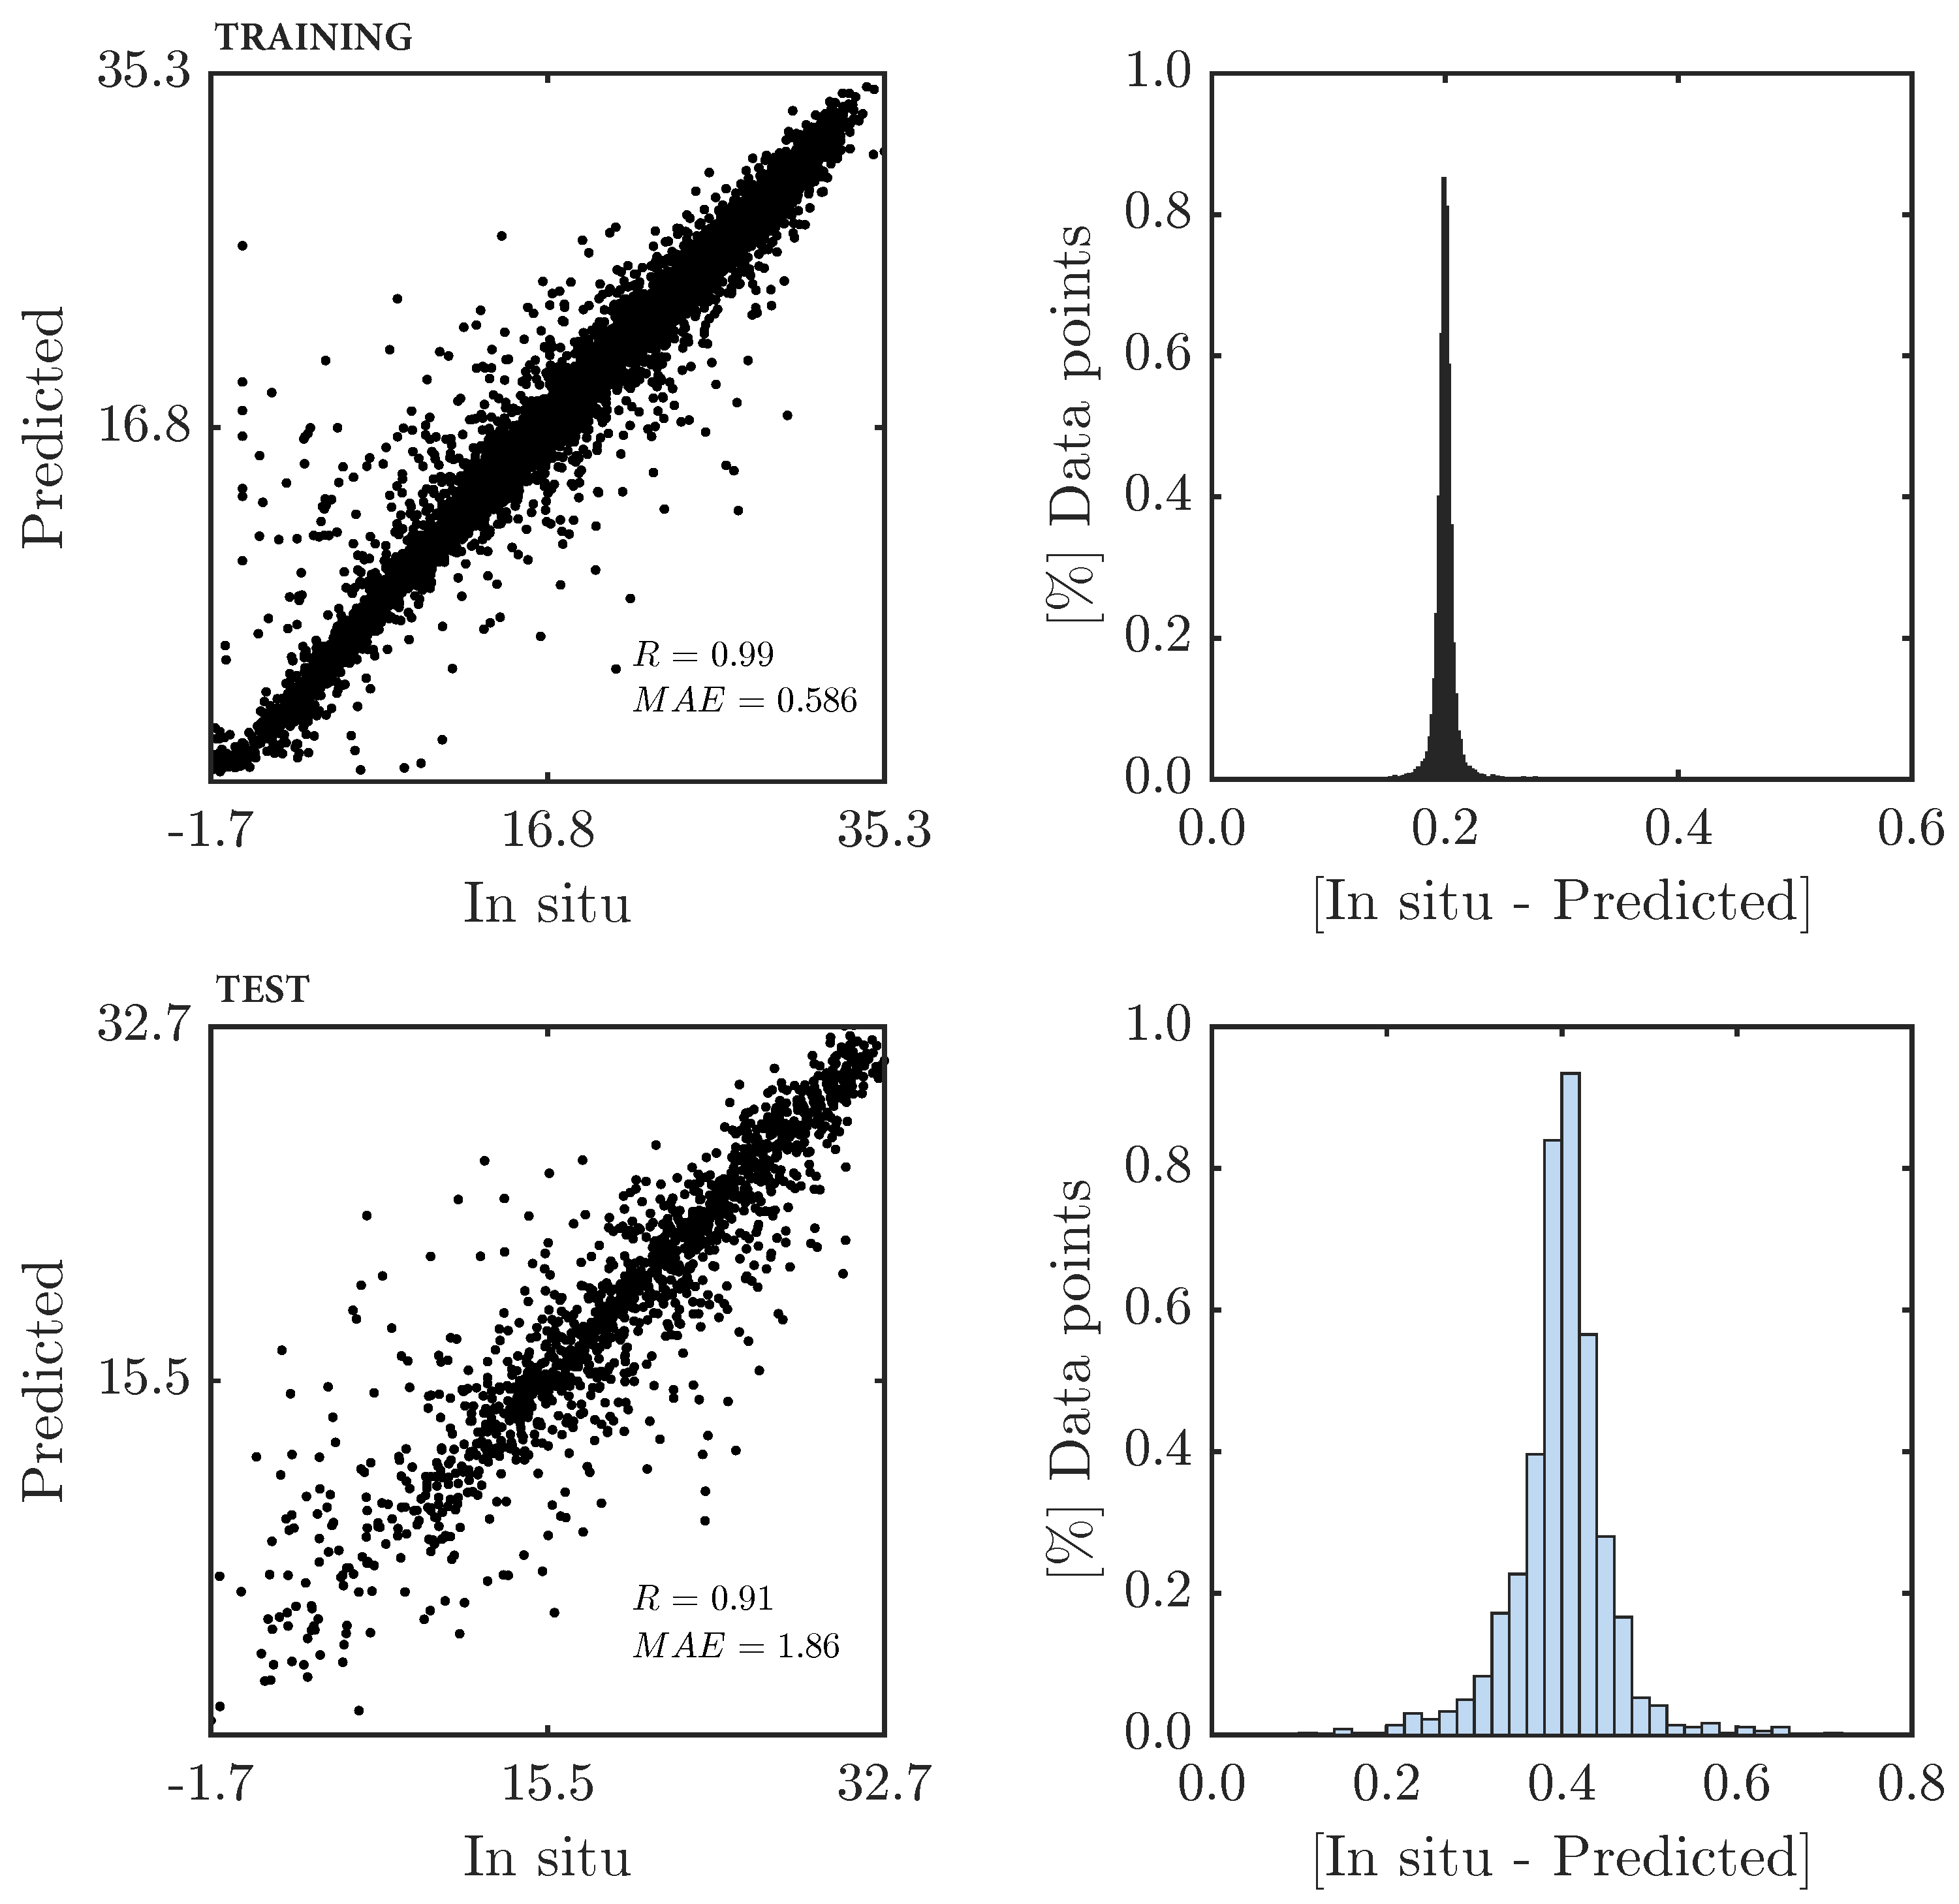
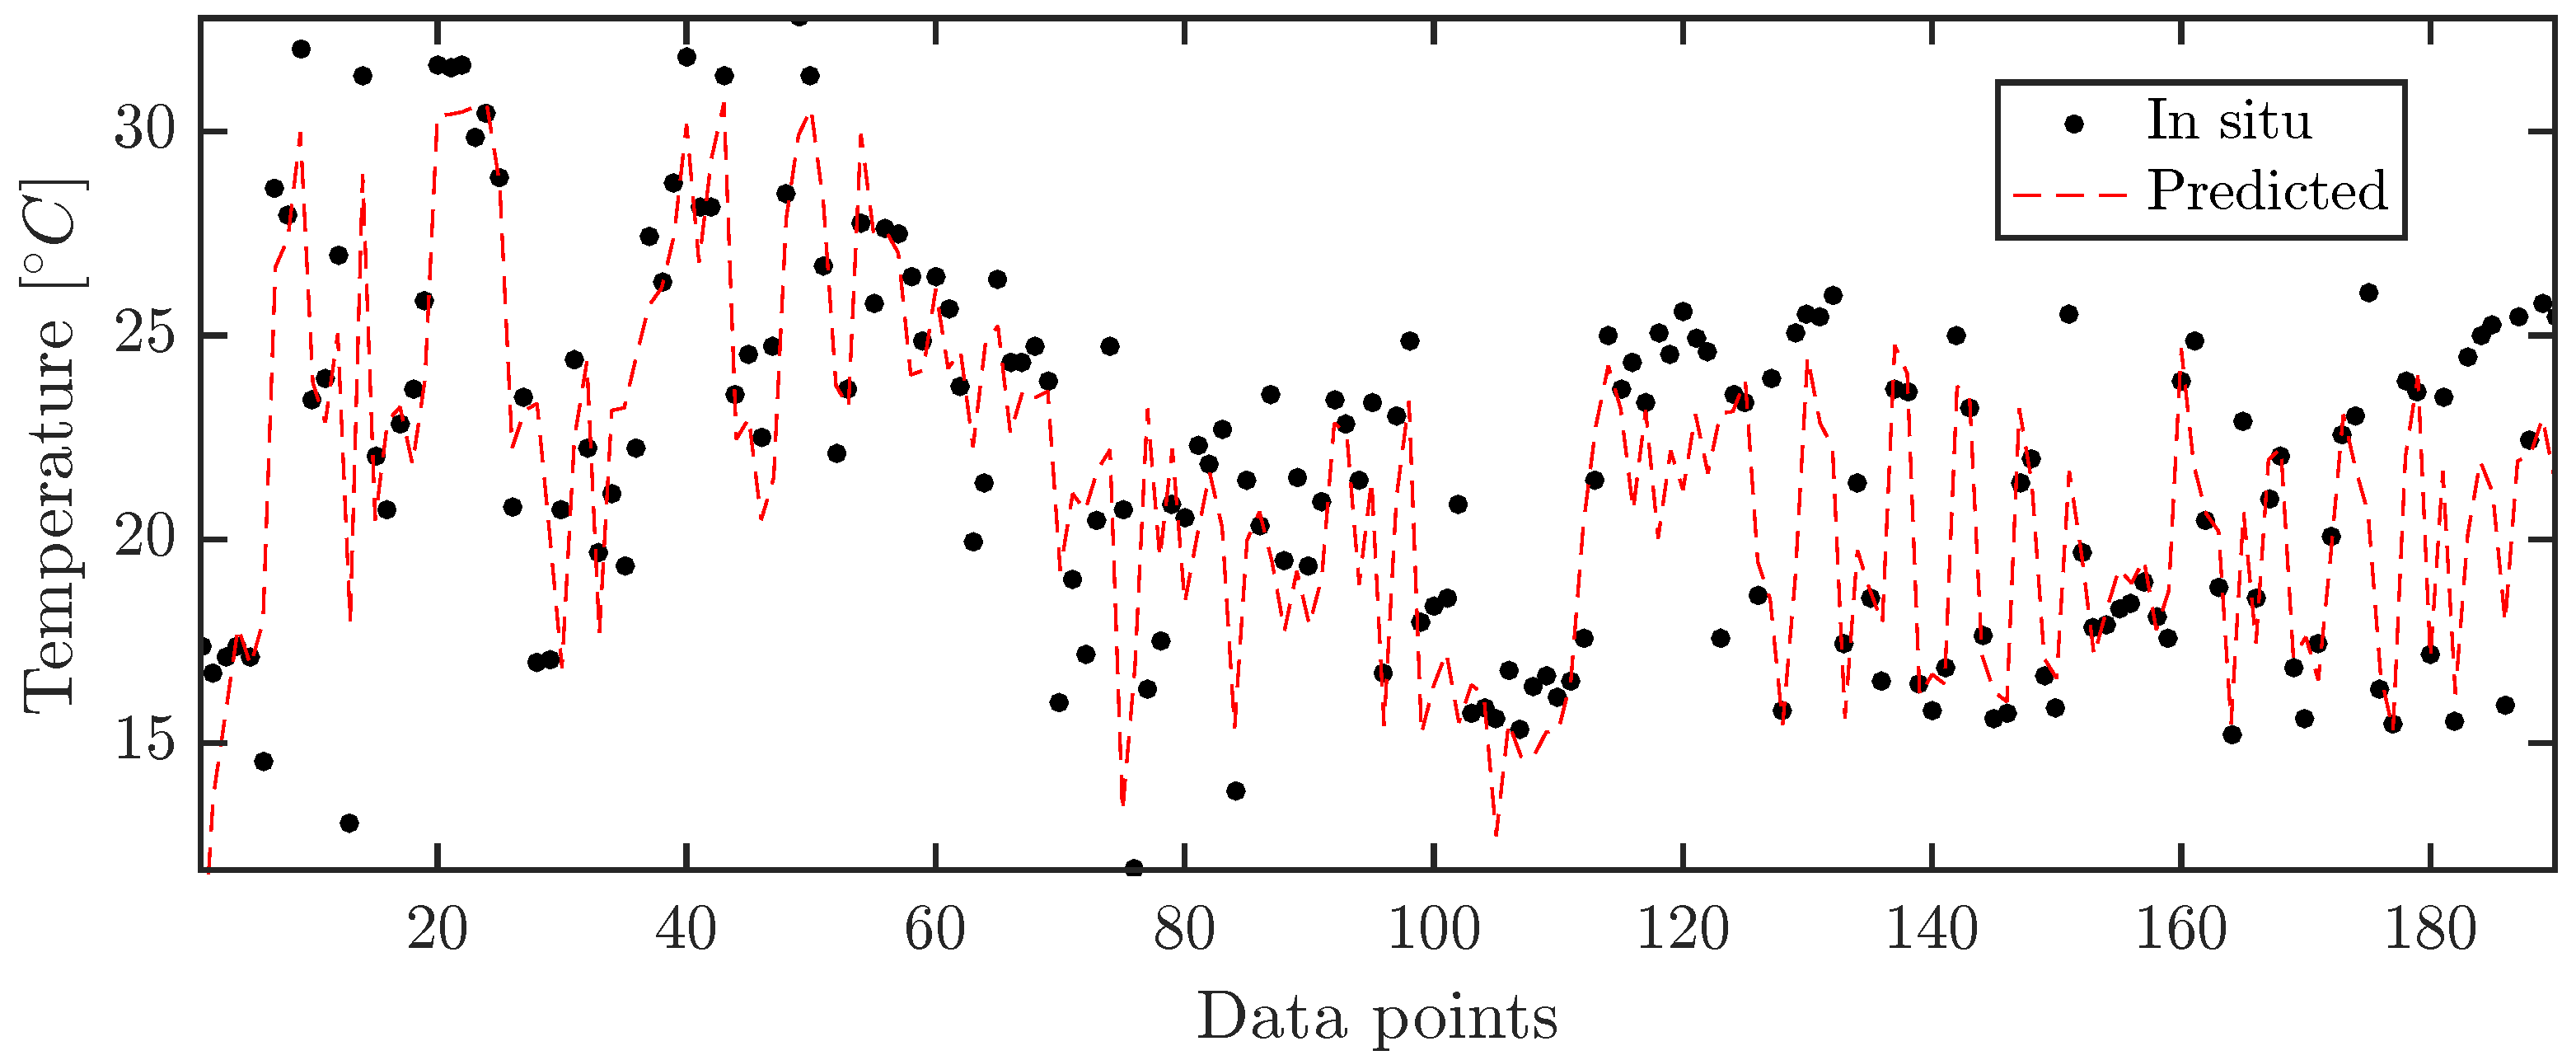
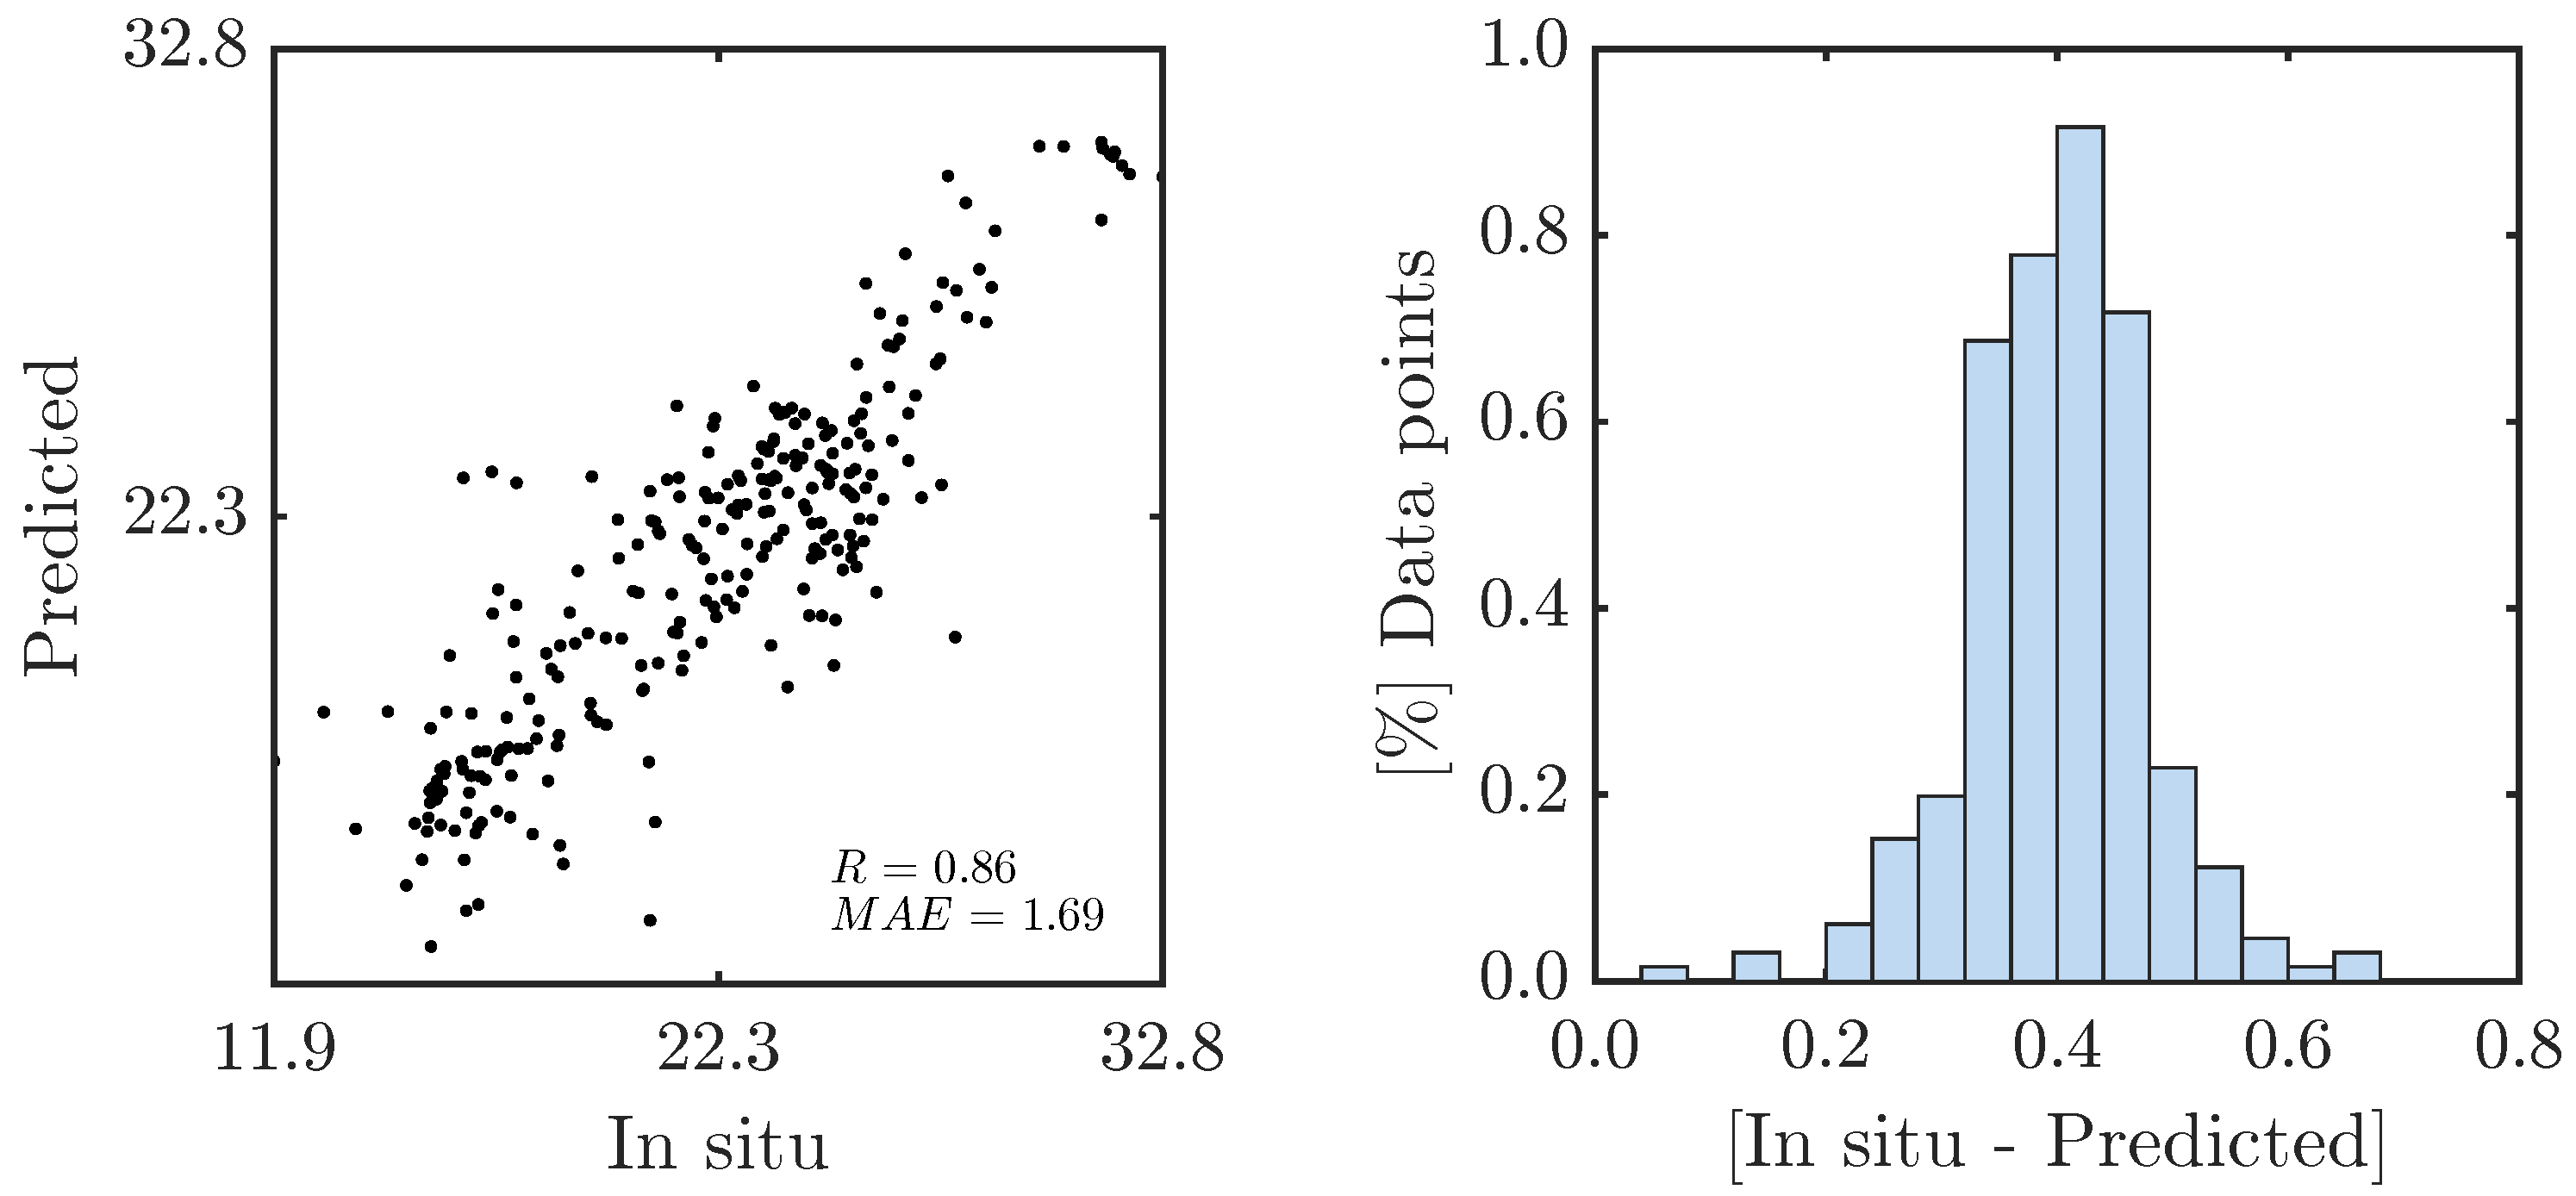
3.1. Temperature Interpolation
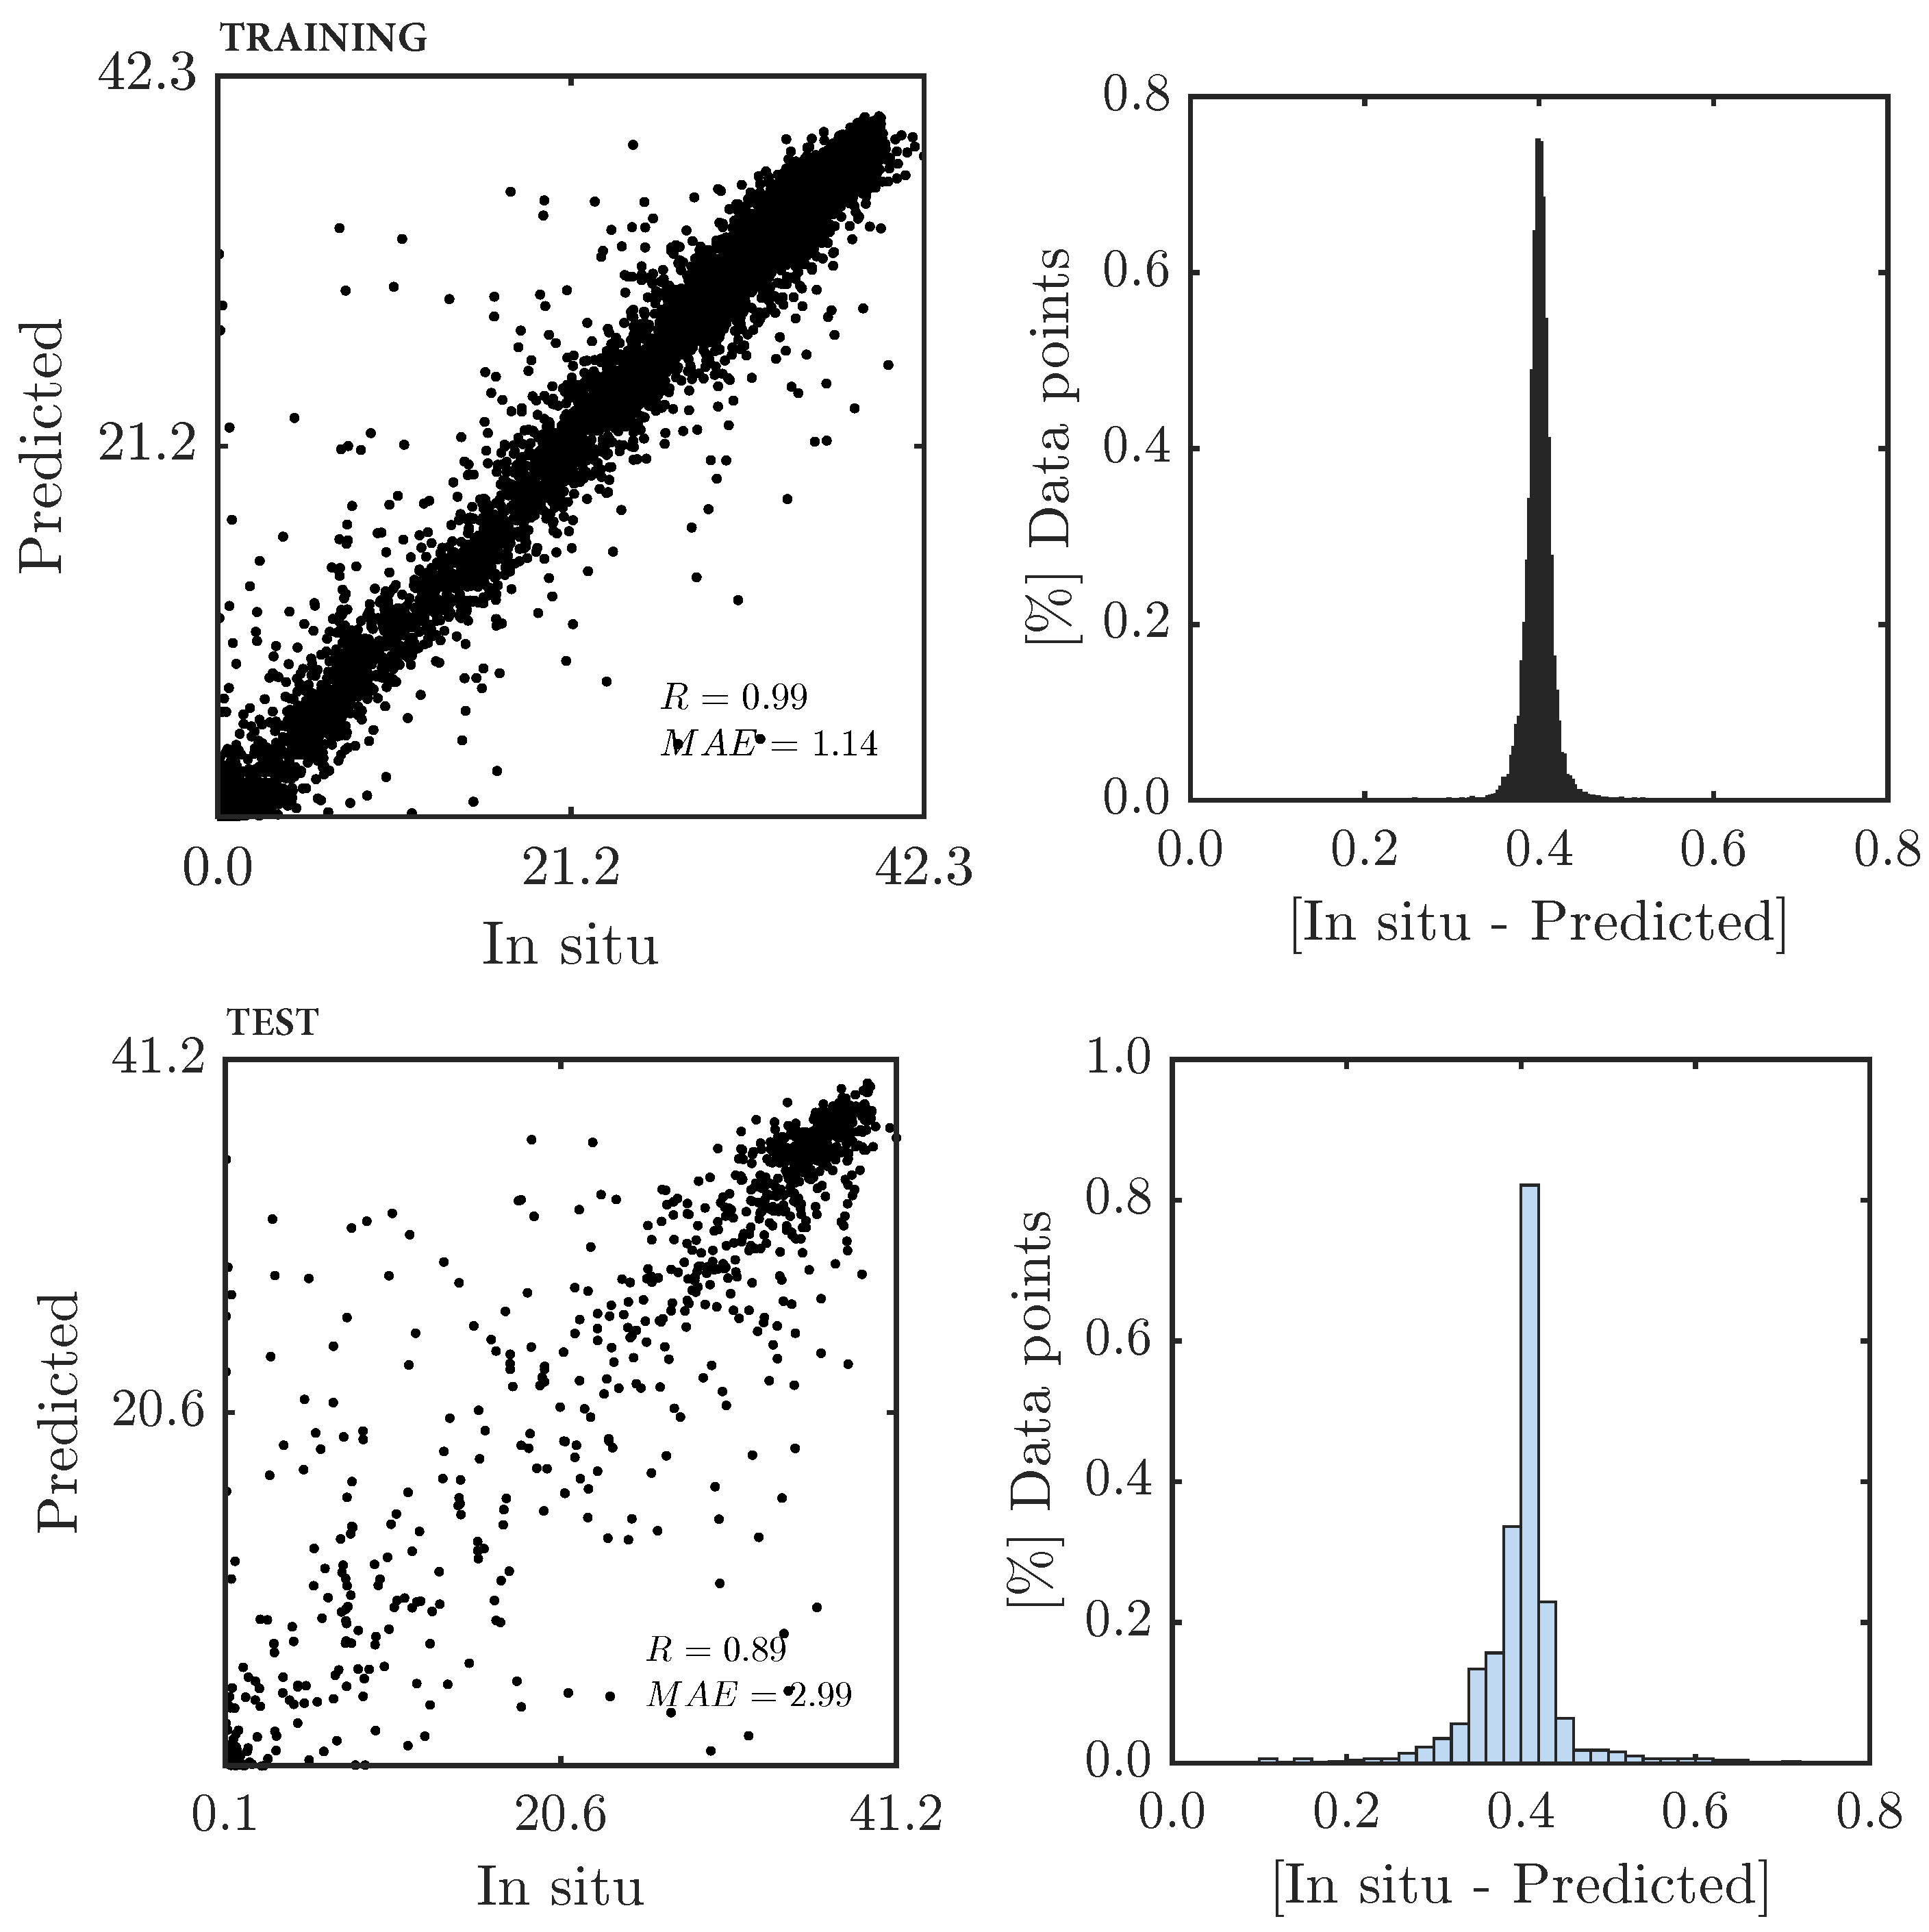
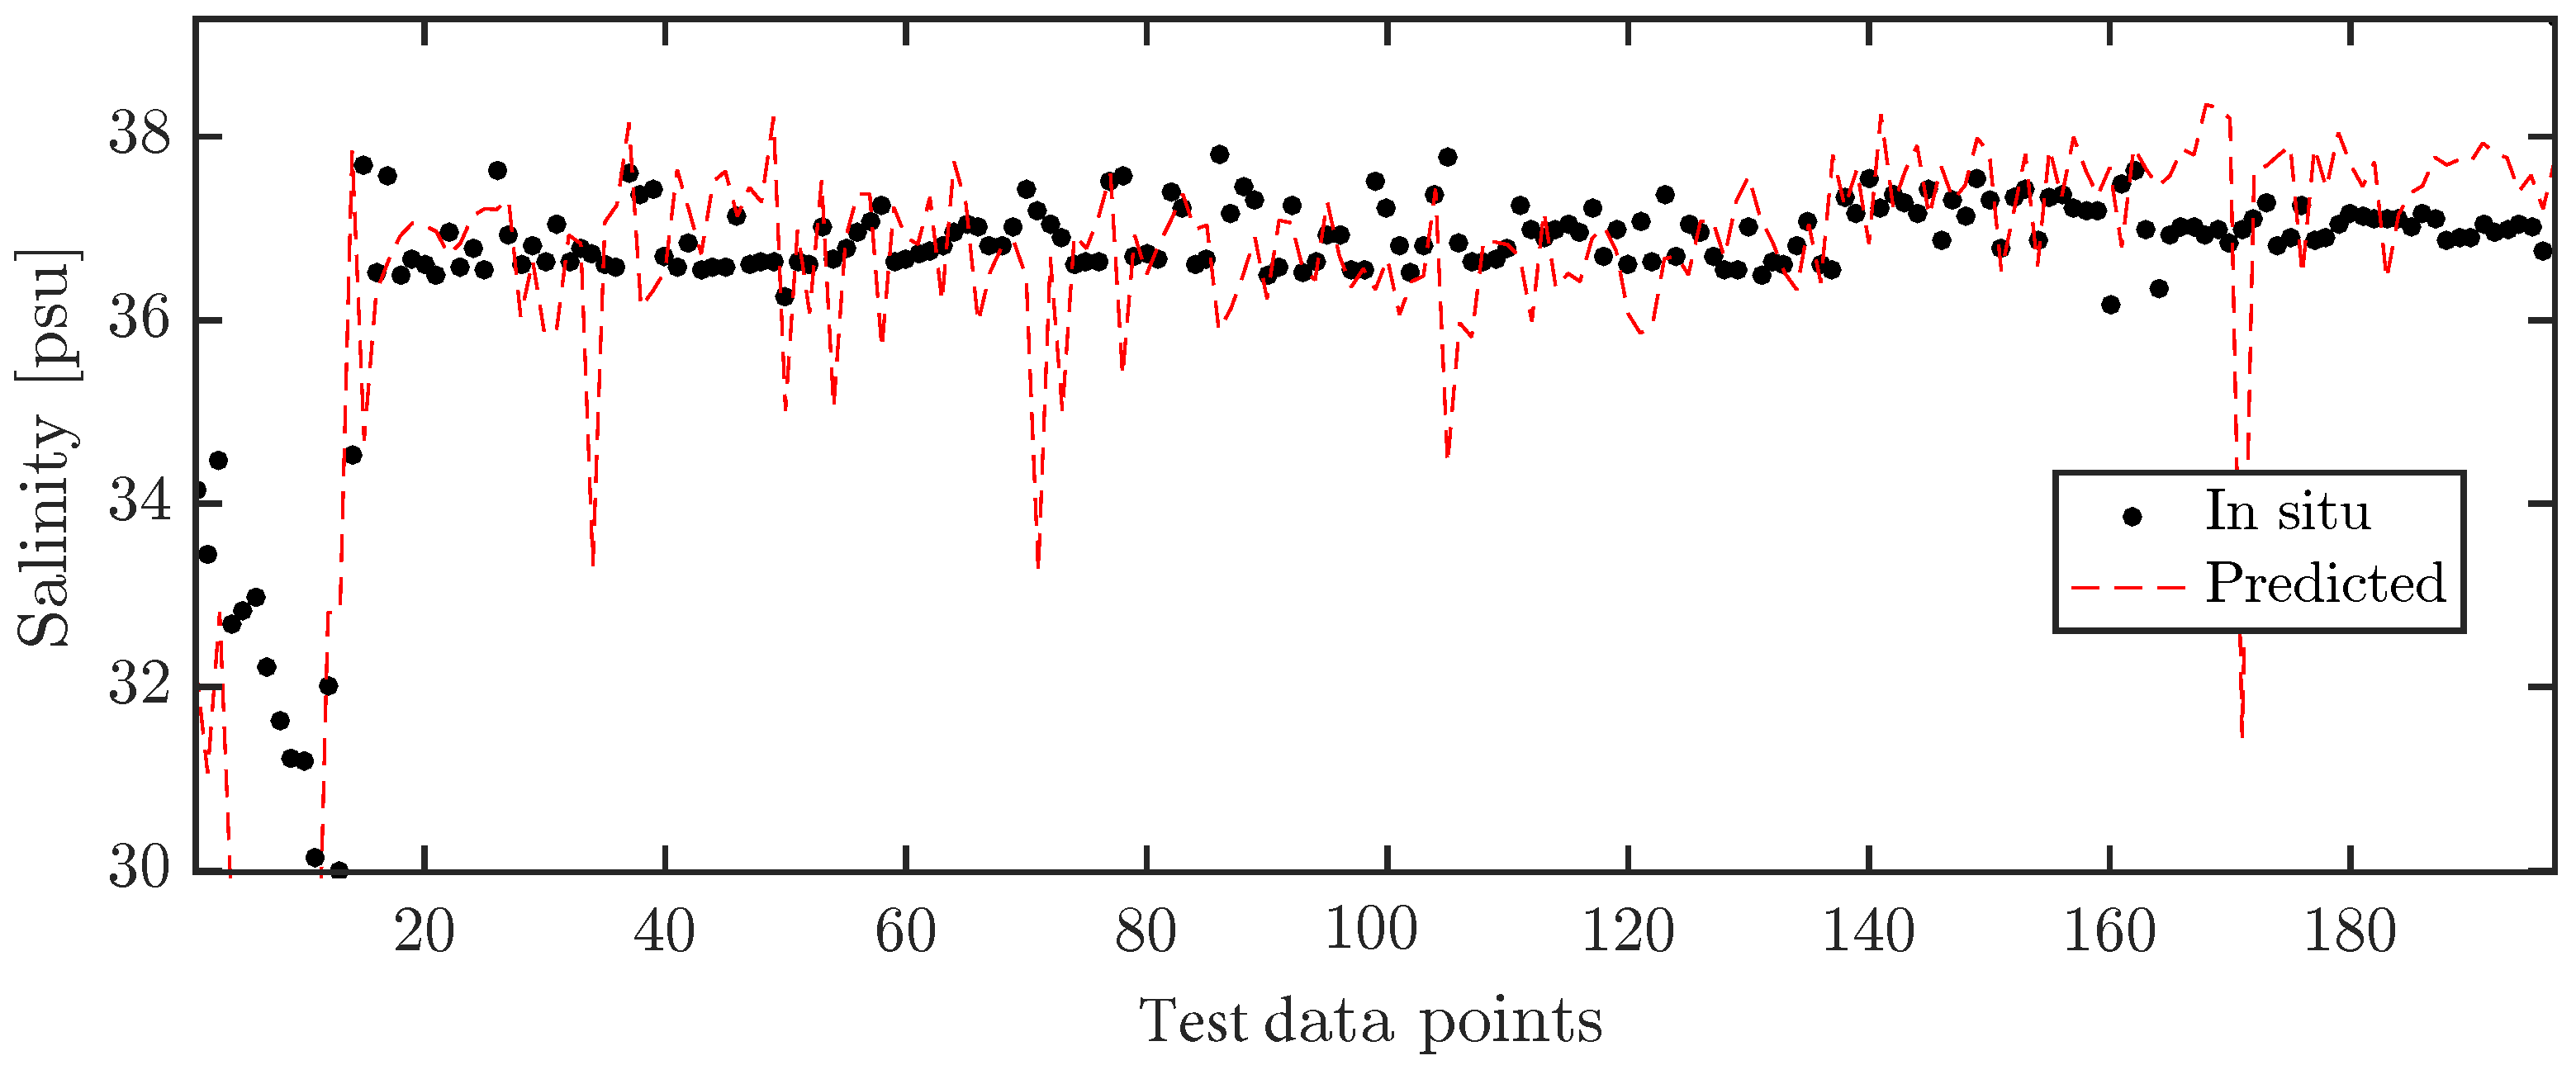
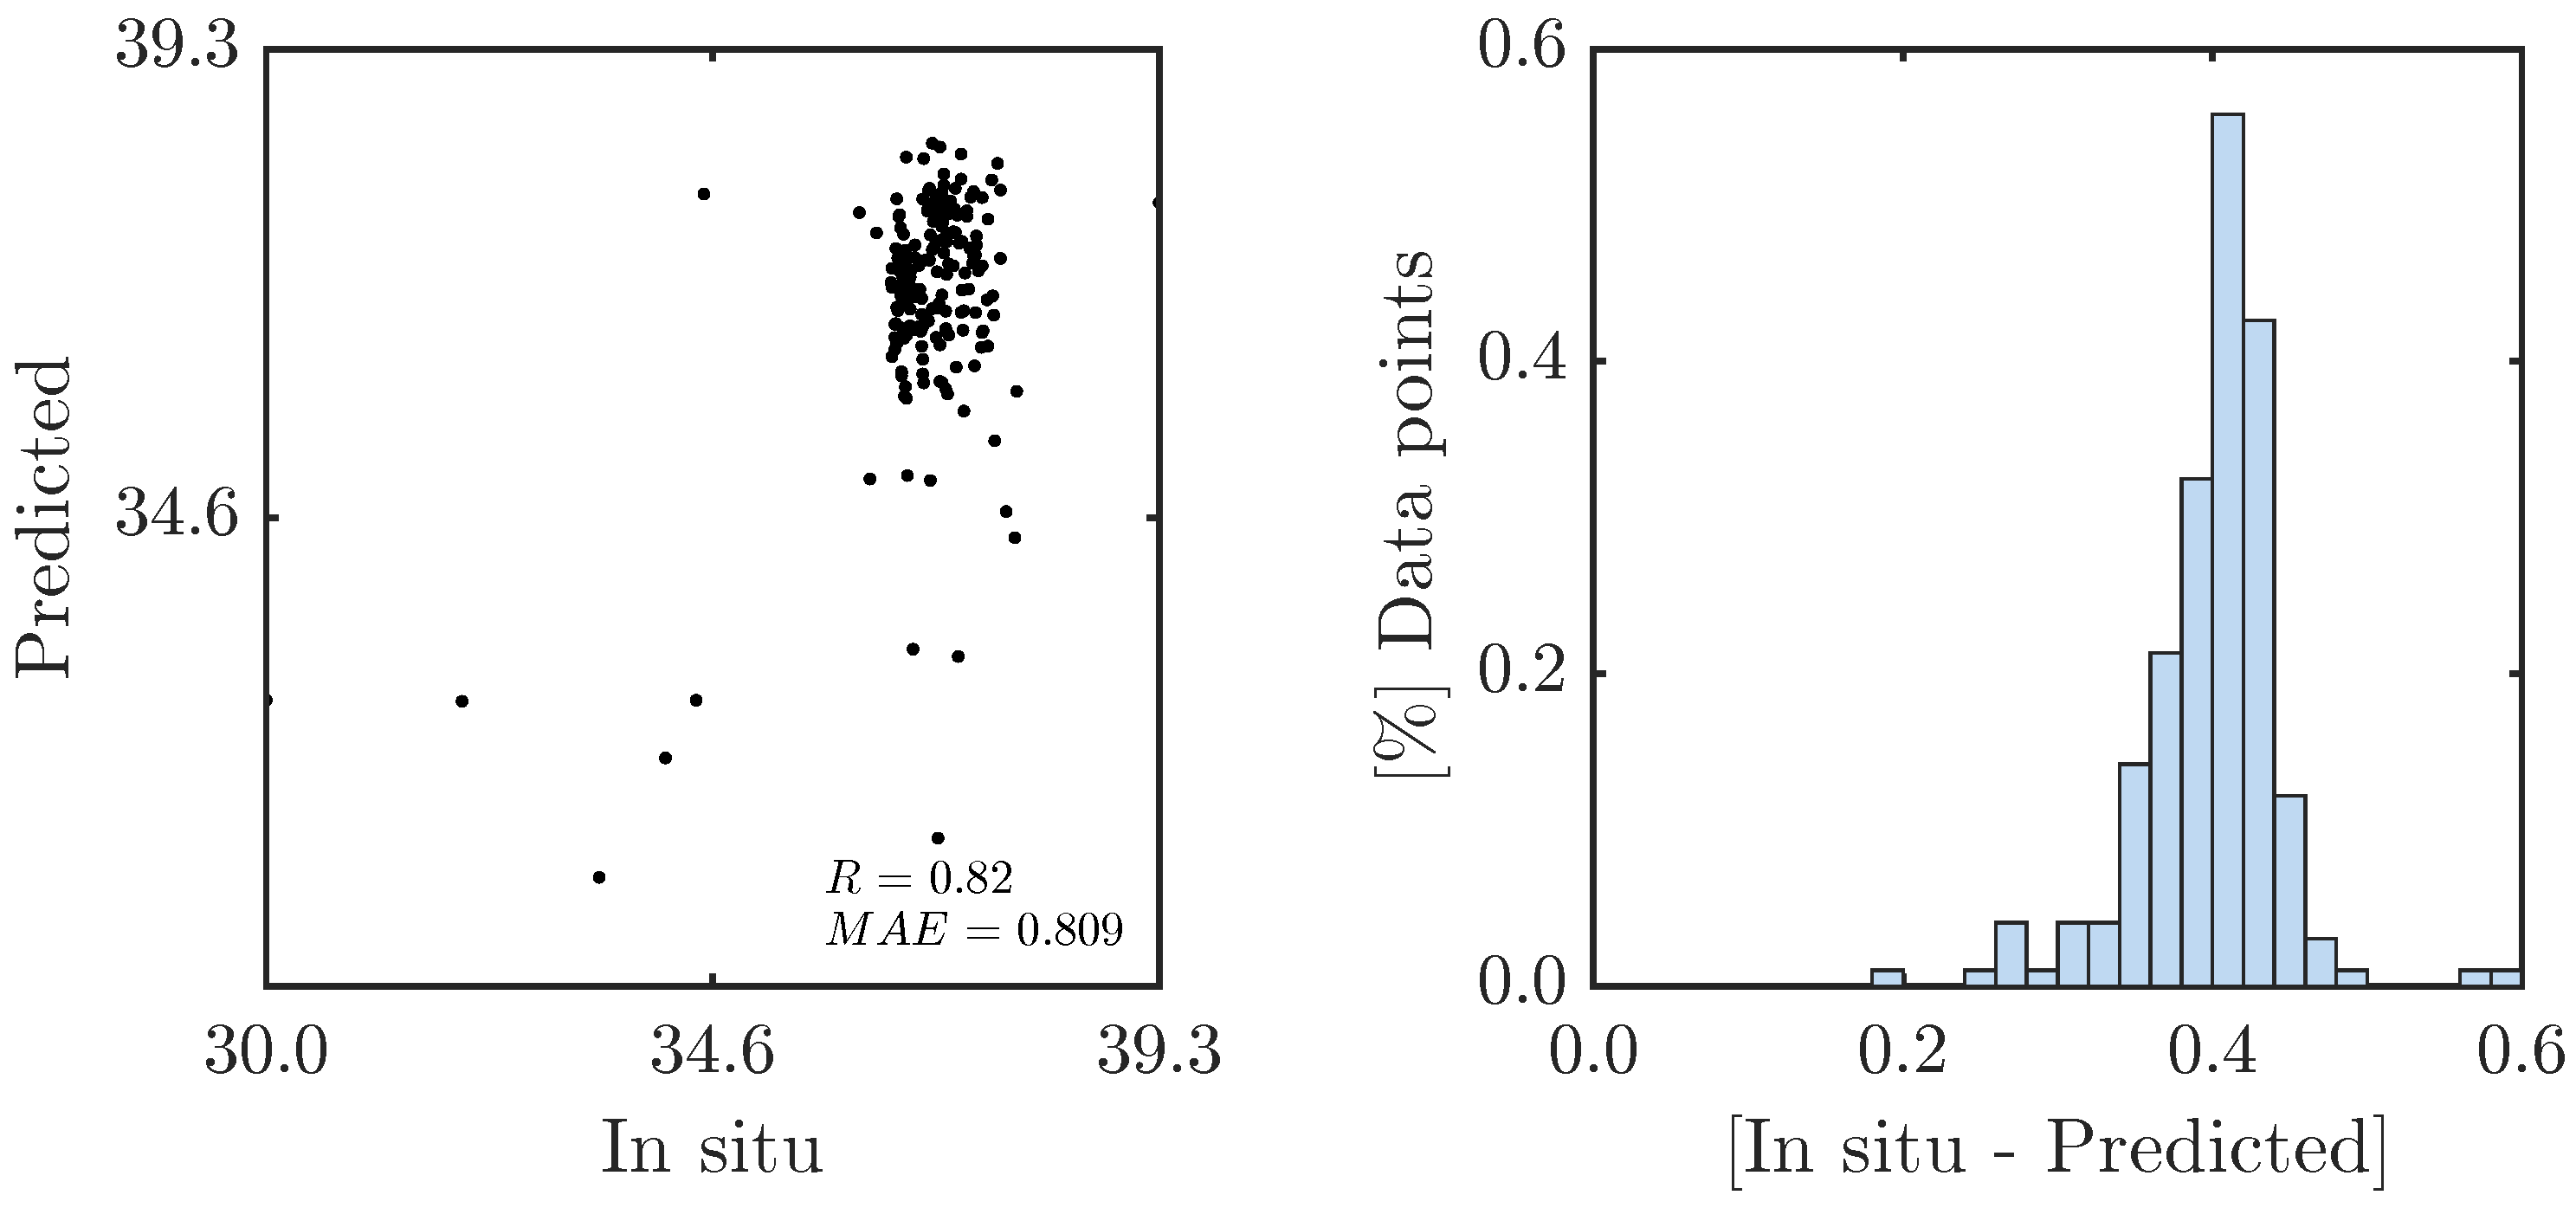
3.2. Salinity Interpolation
Dependence on Temperature Ranges
3.3. Sensitivity Analysis
3.4. Temperature Extrapolation
3.5. Salinity Extrapolation
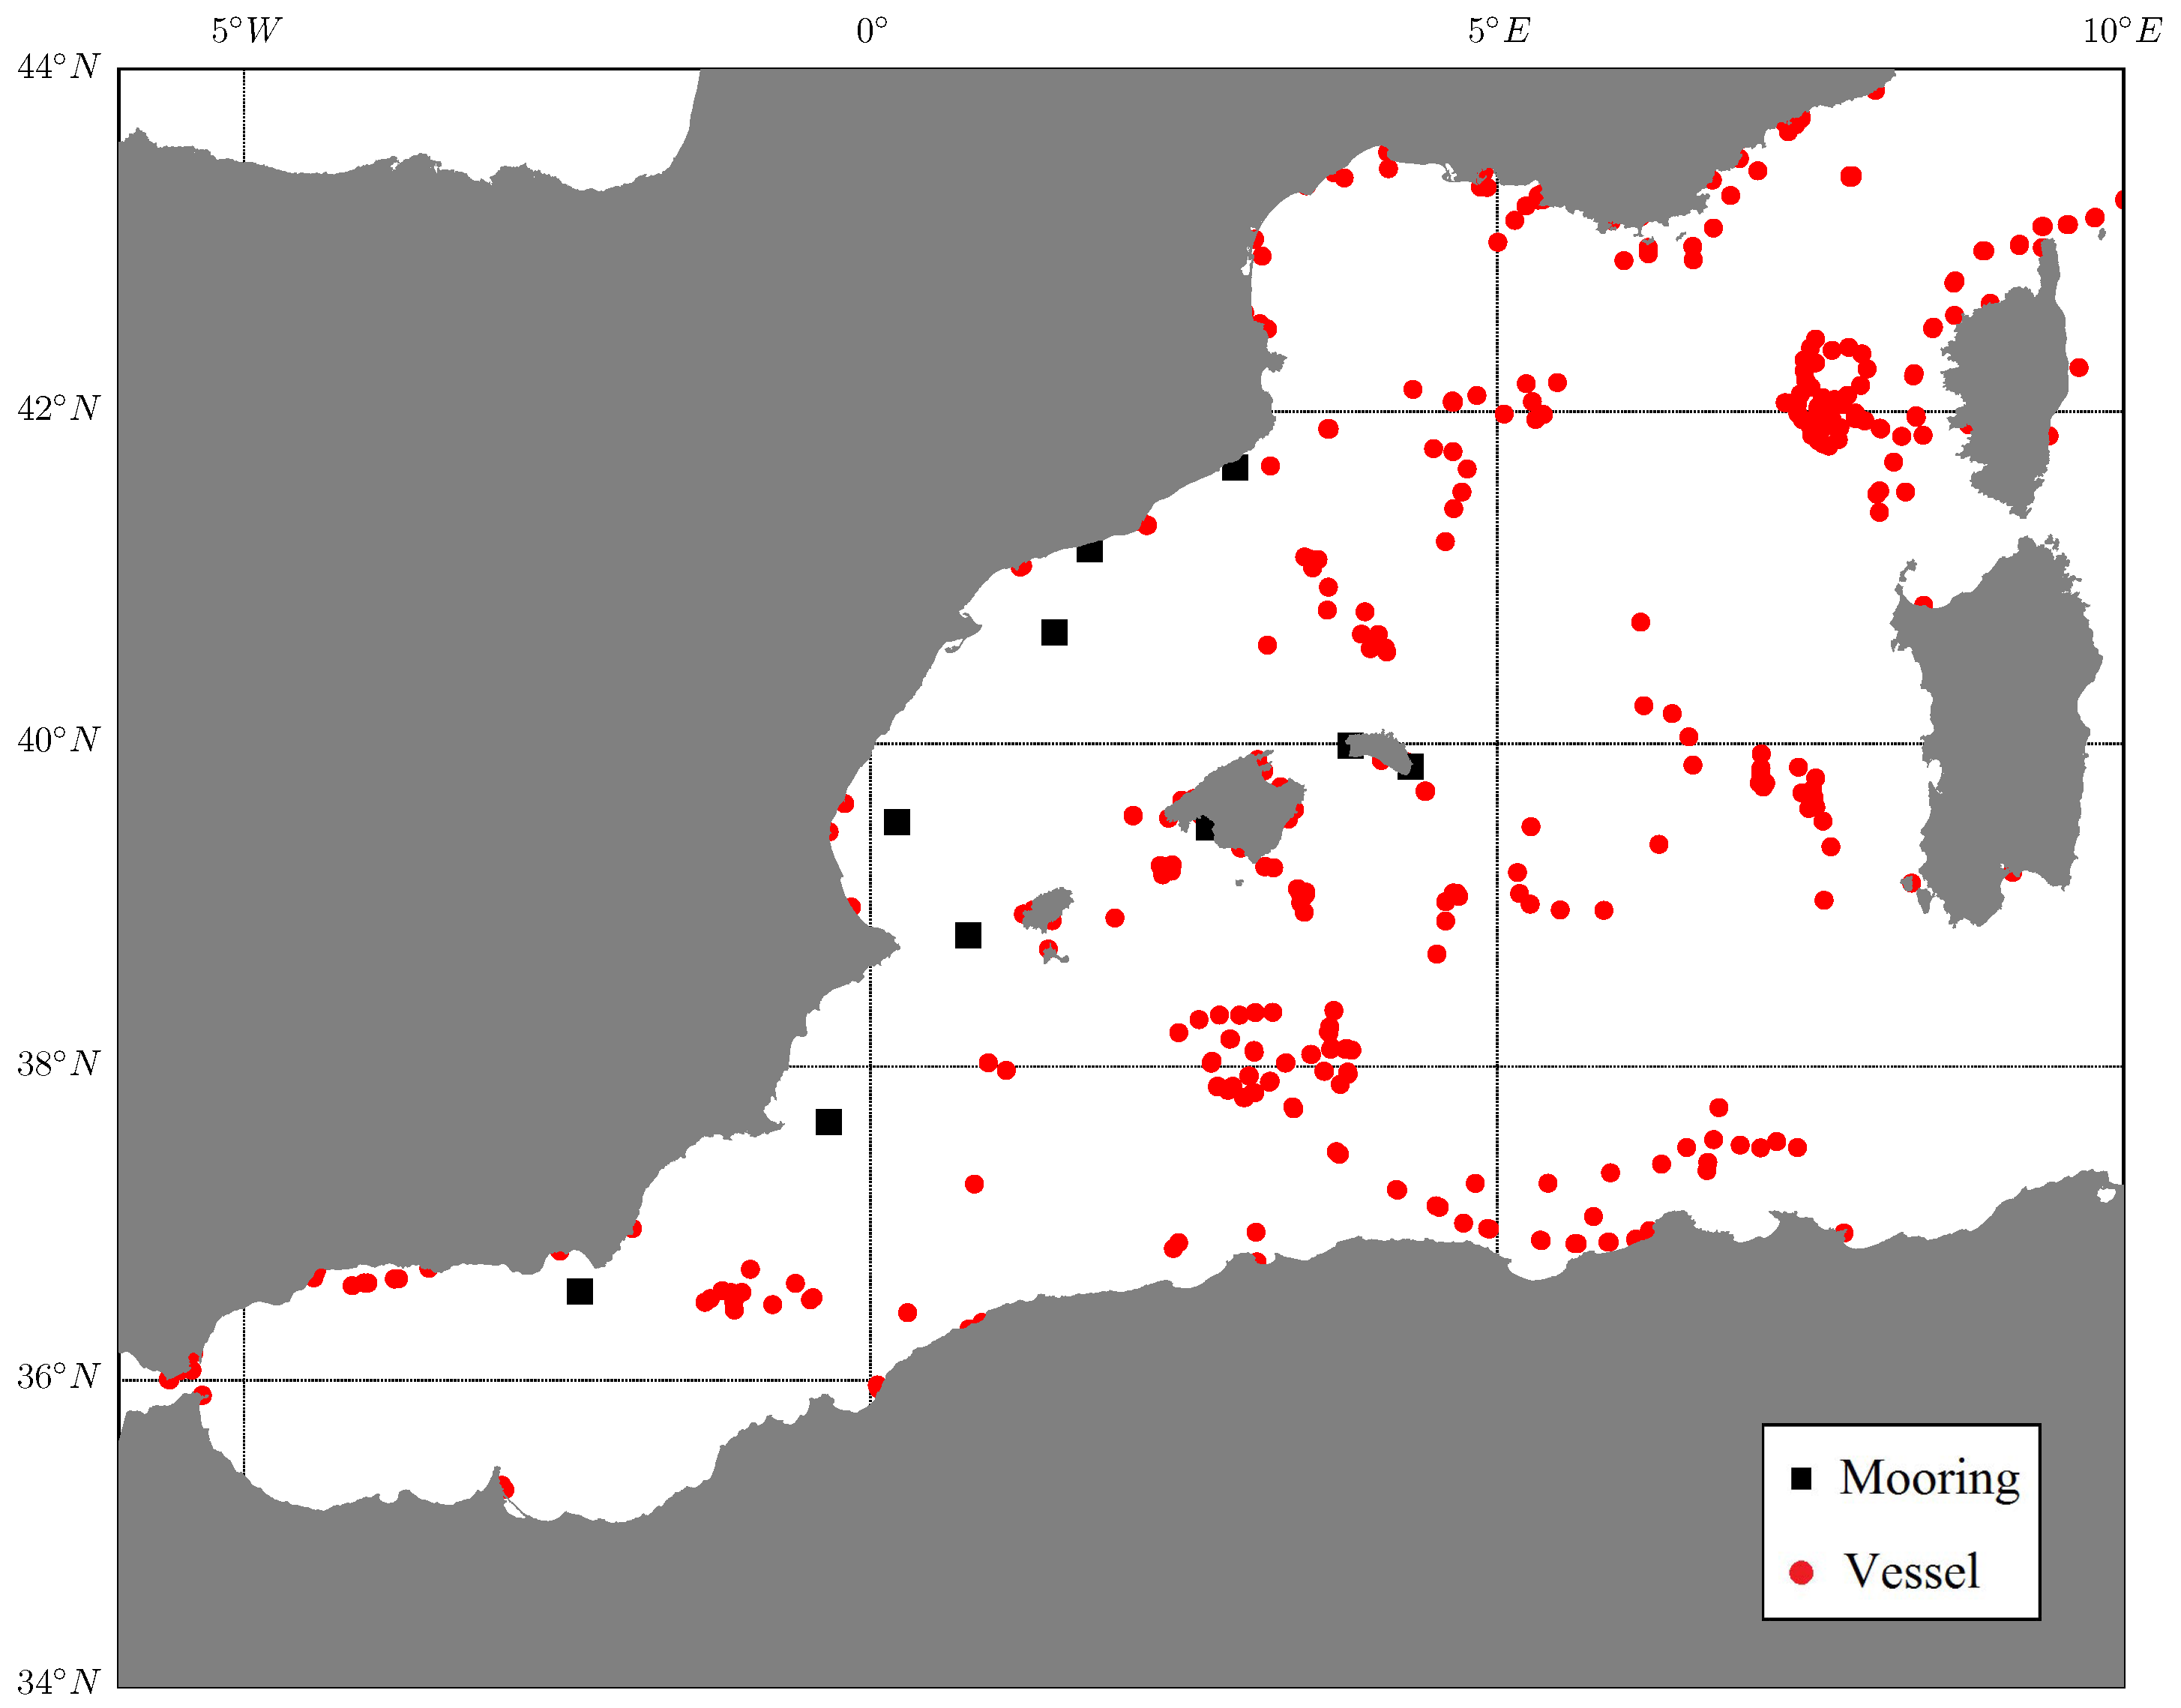
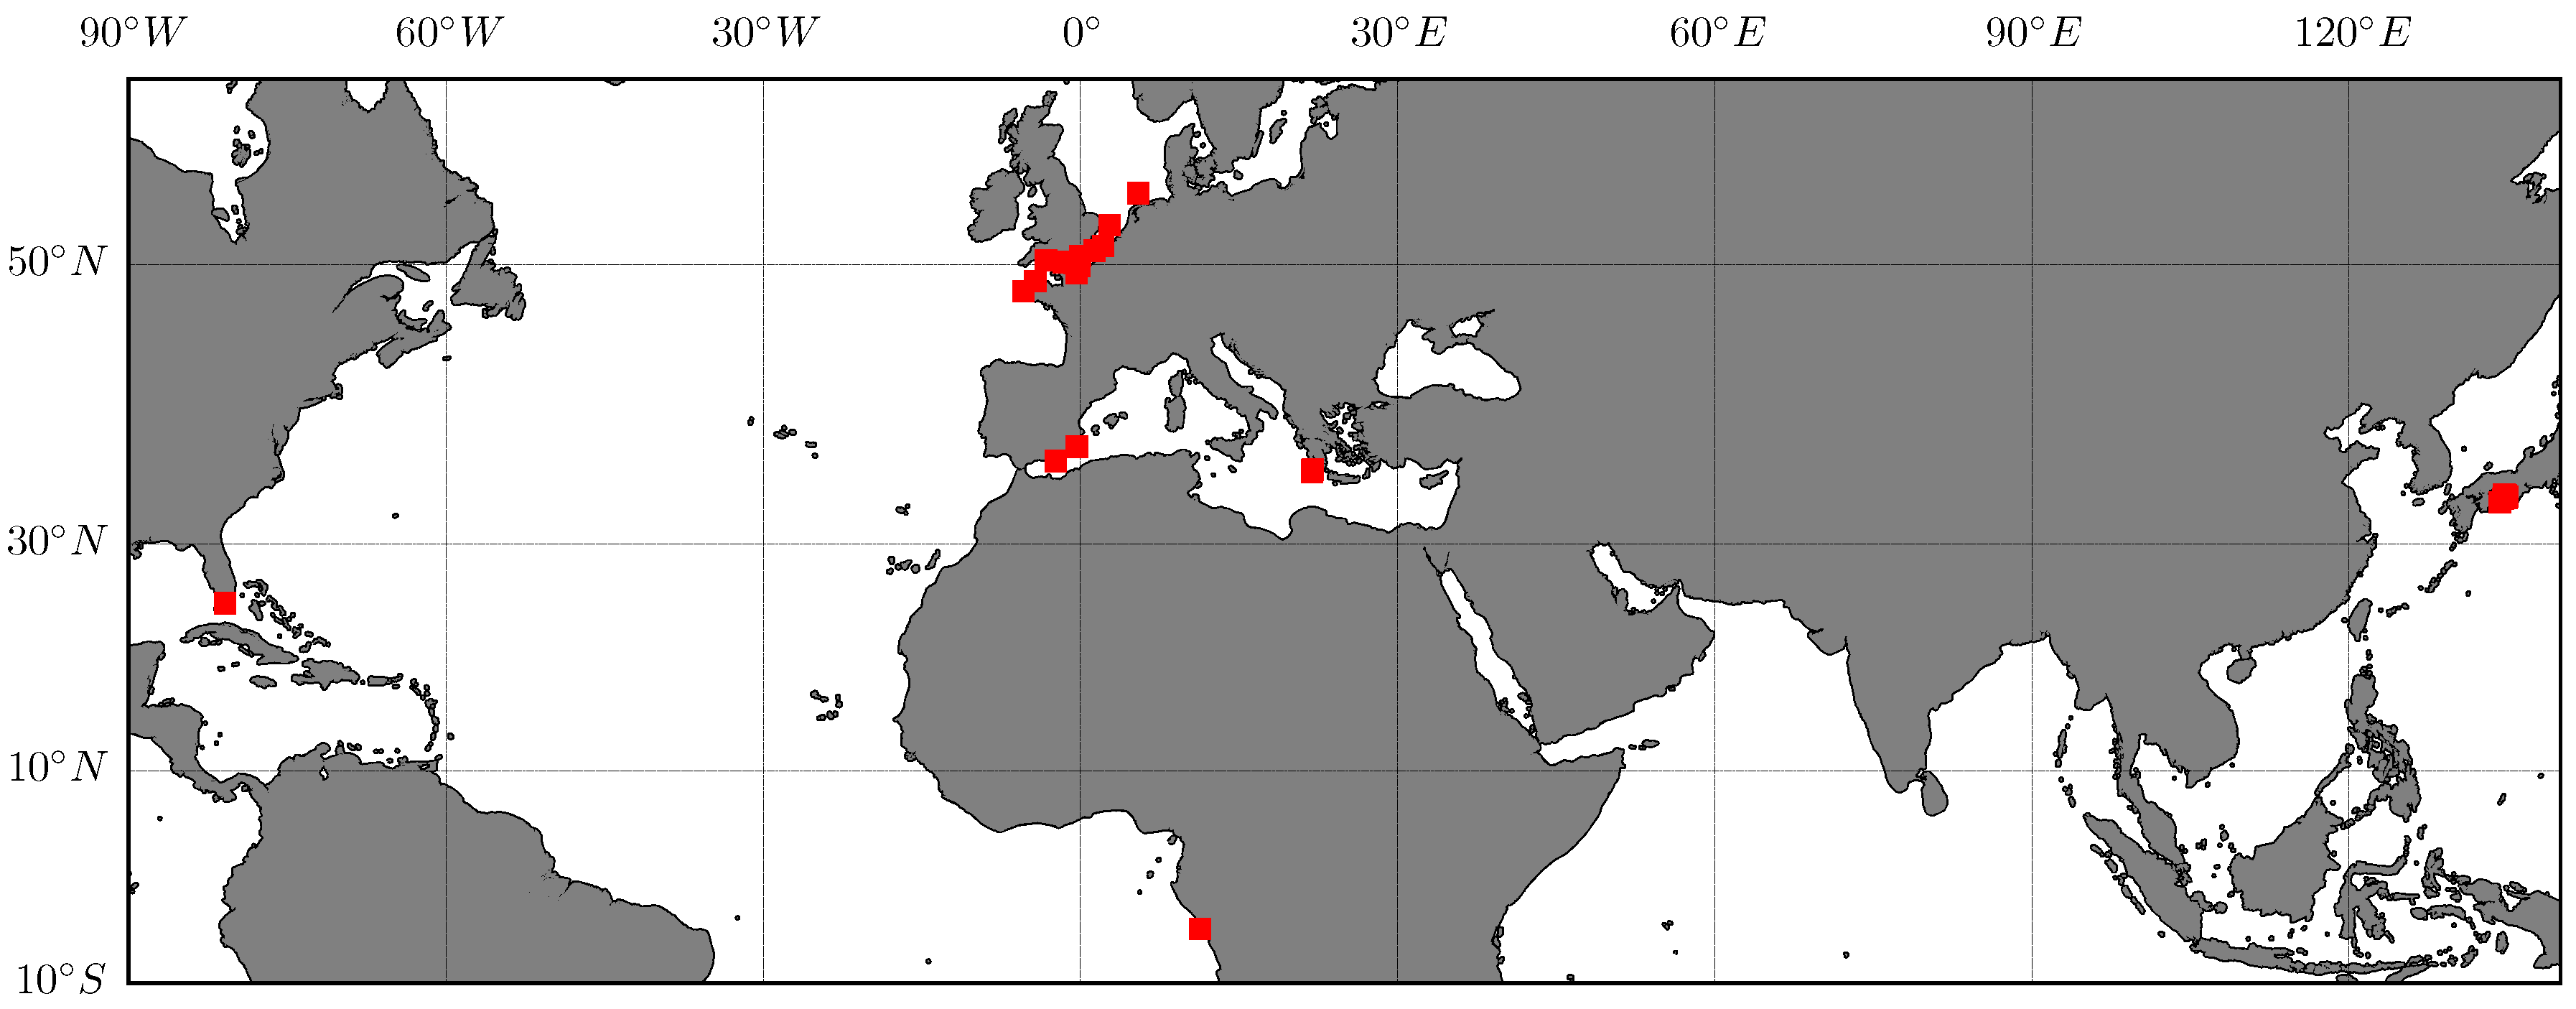
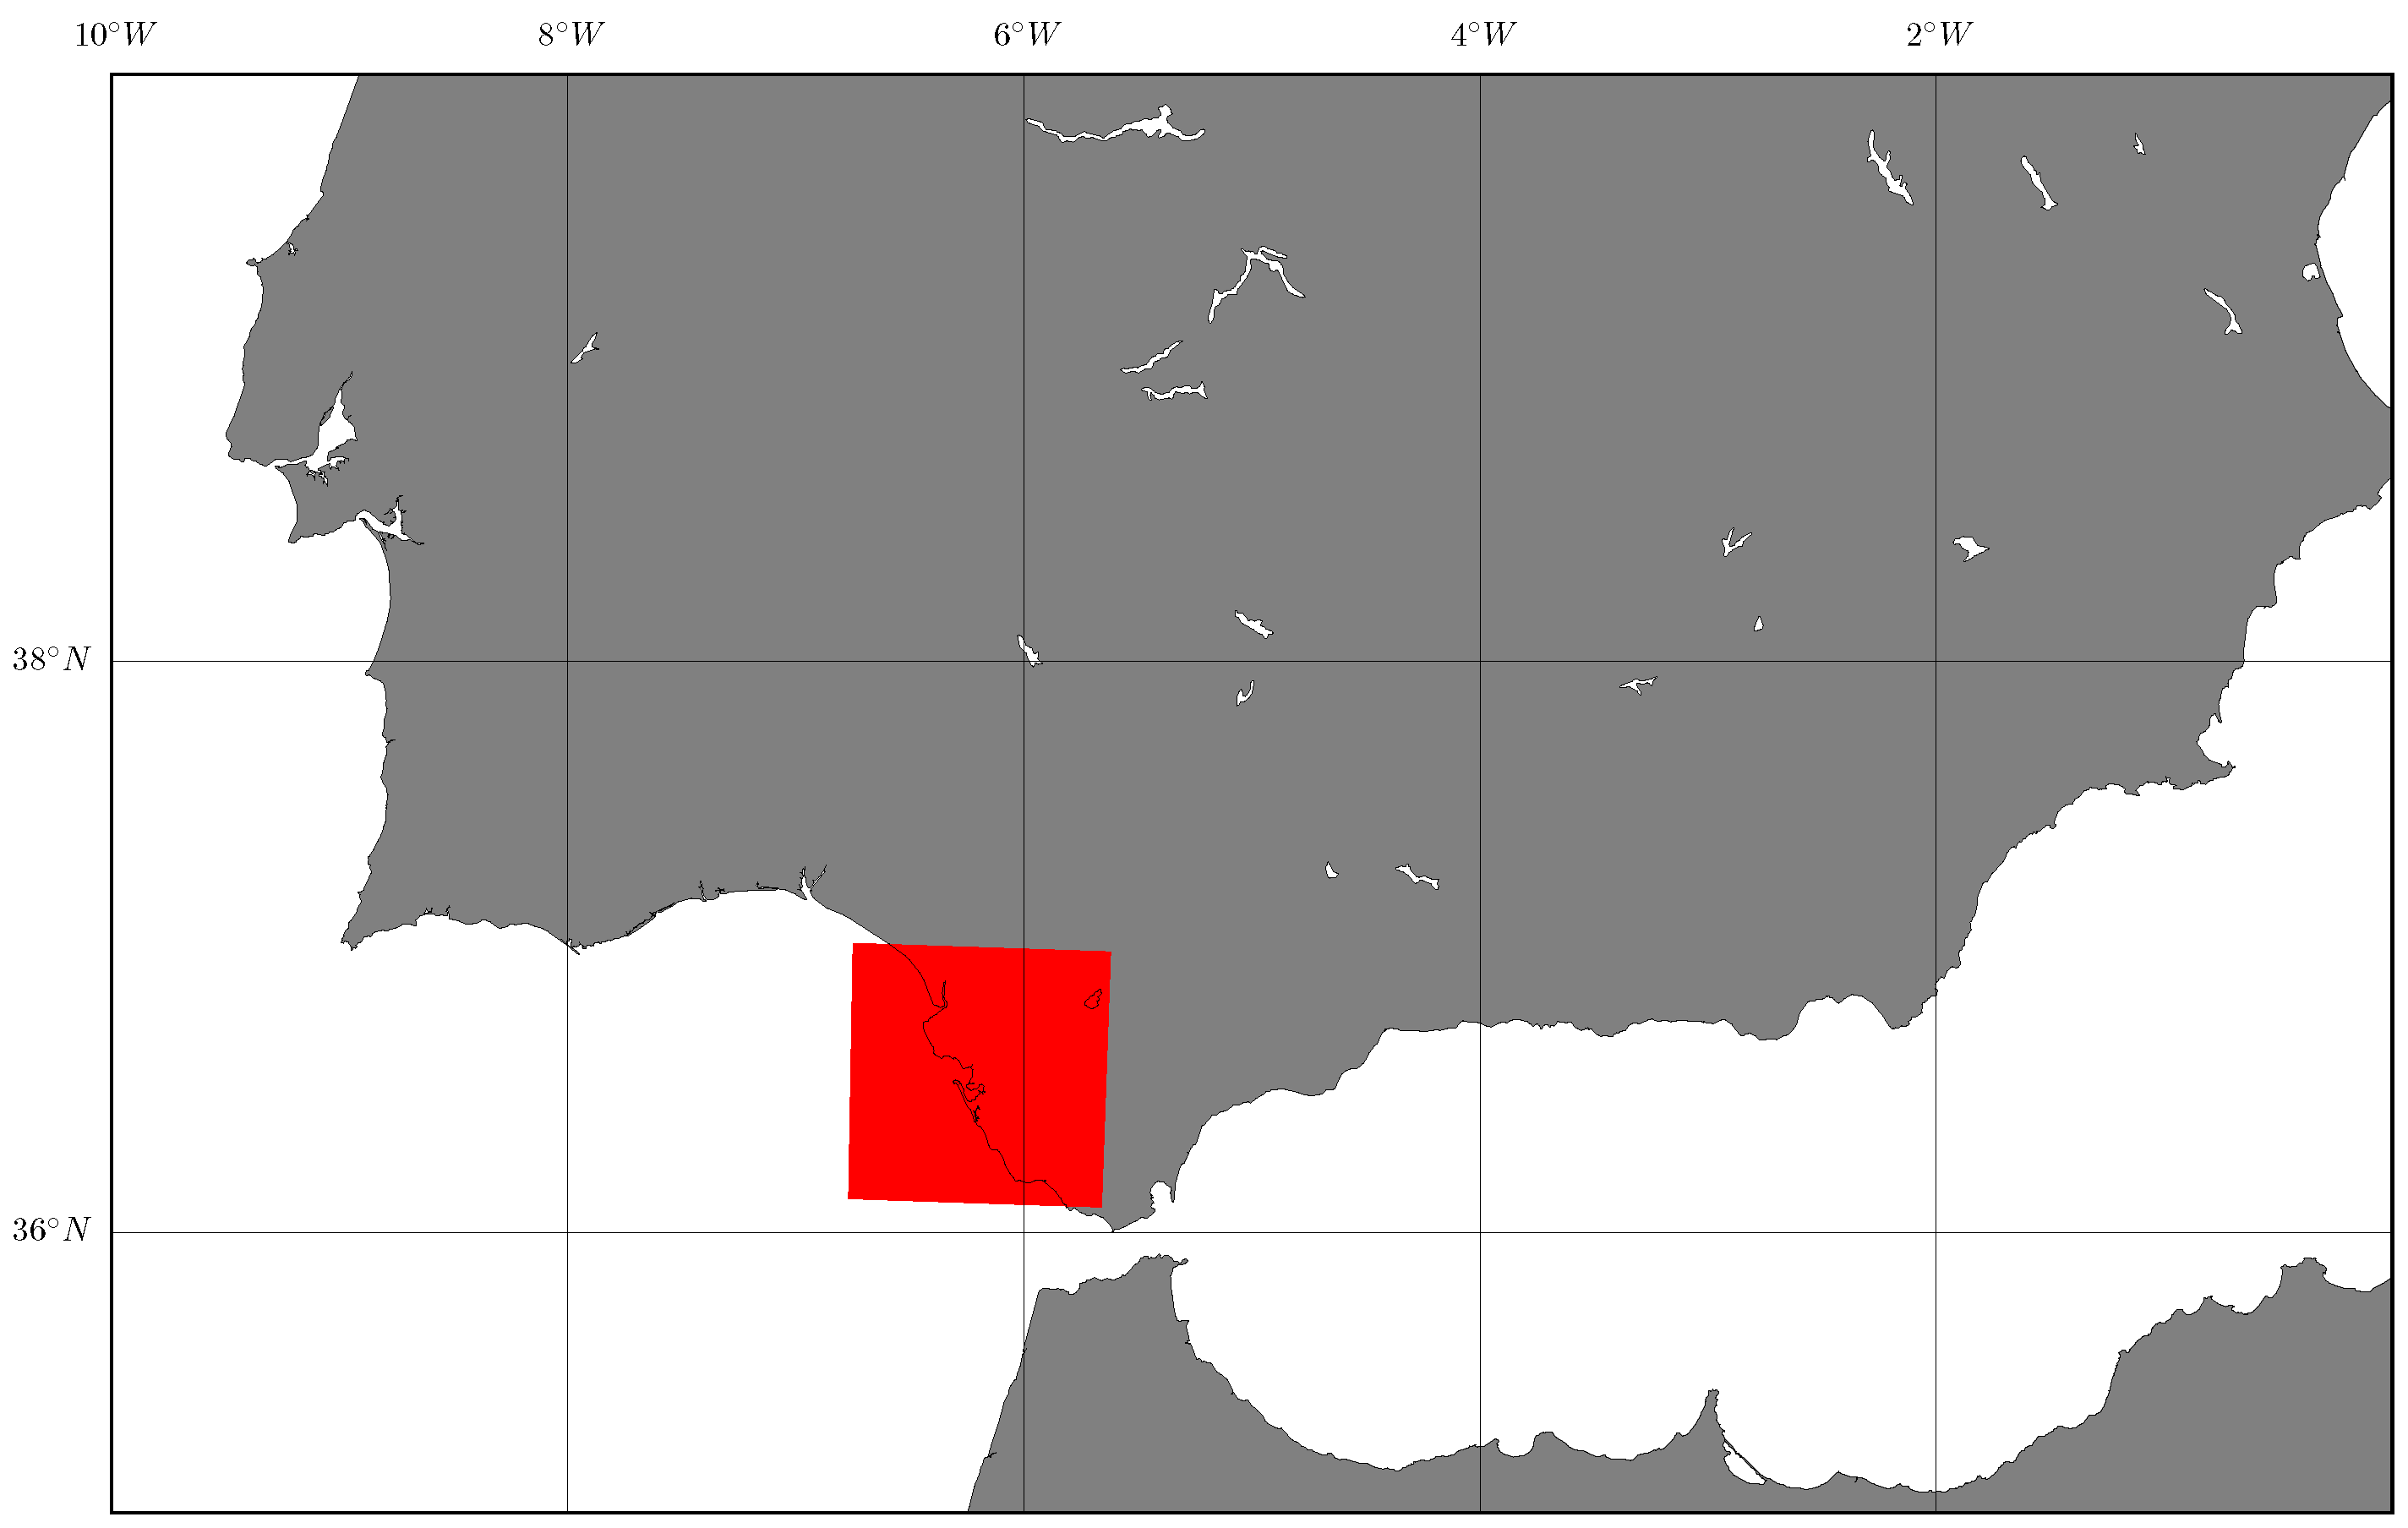
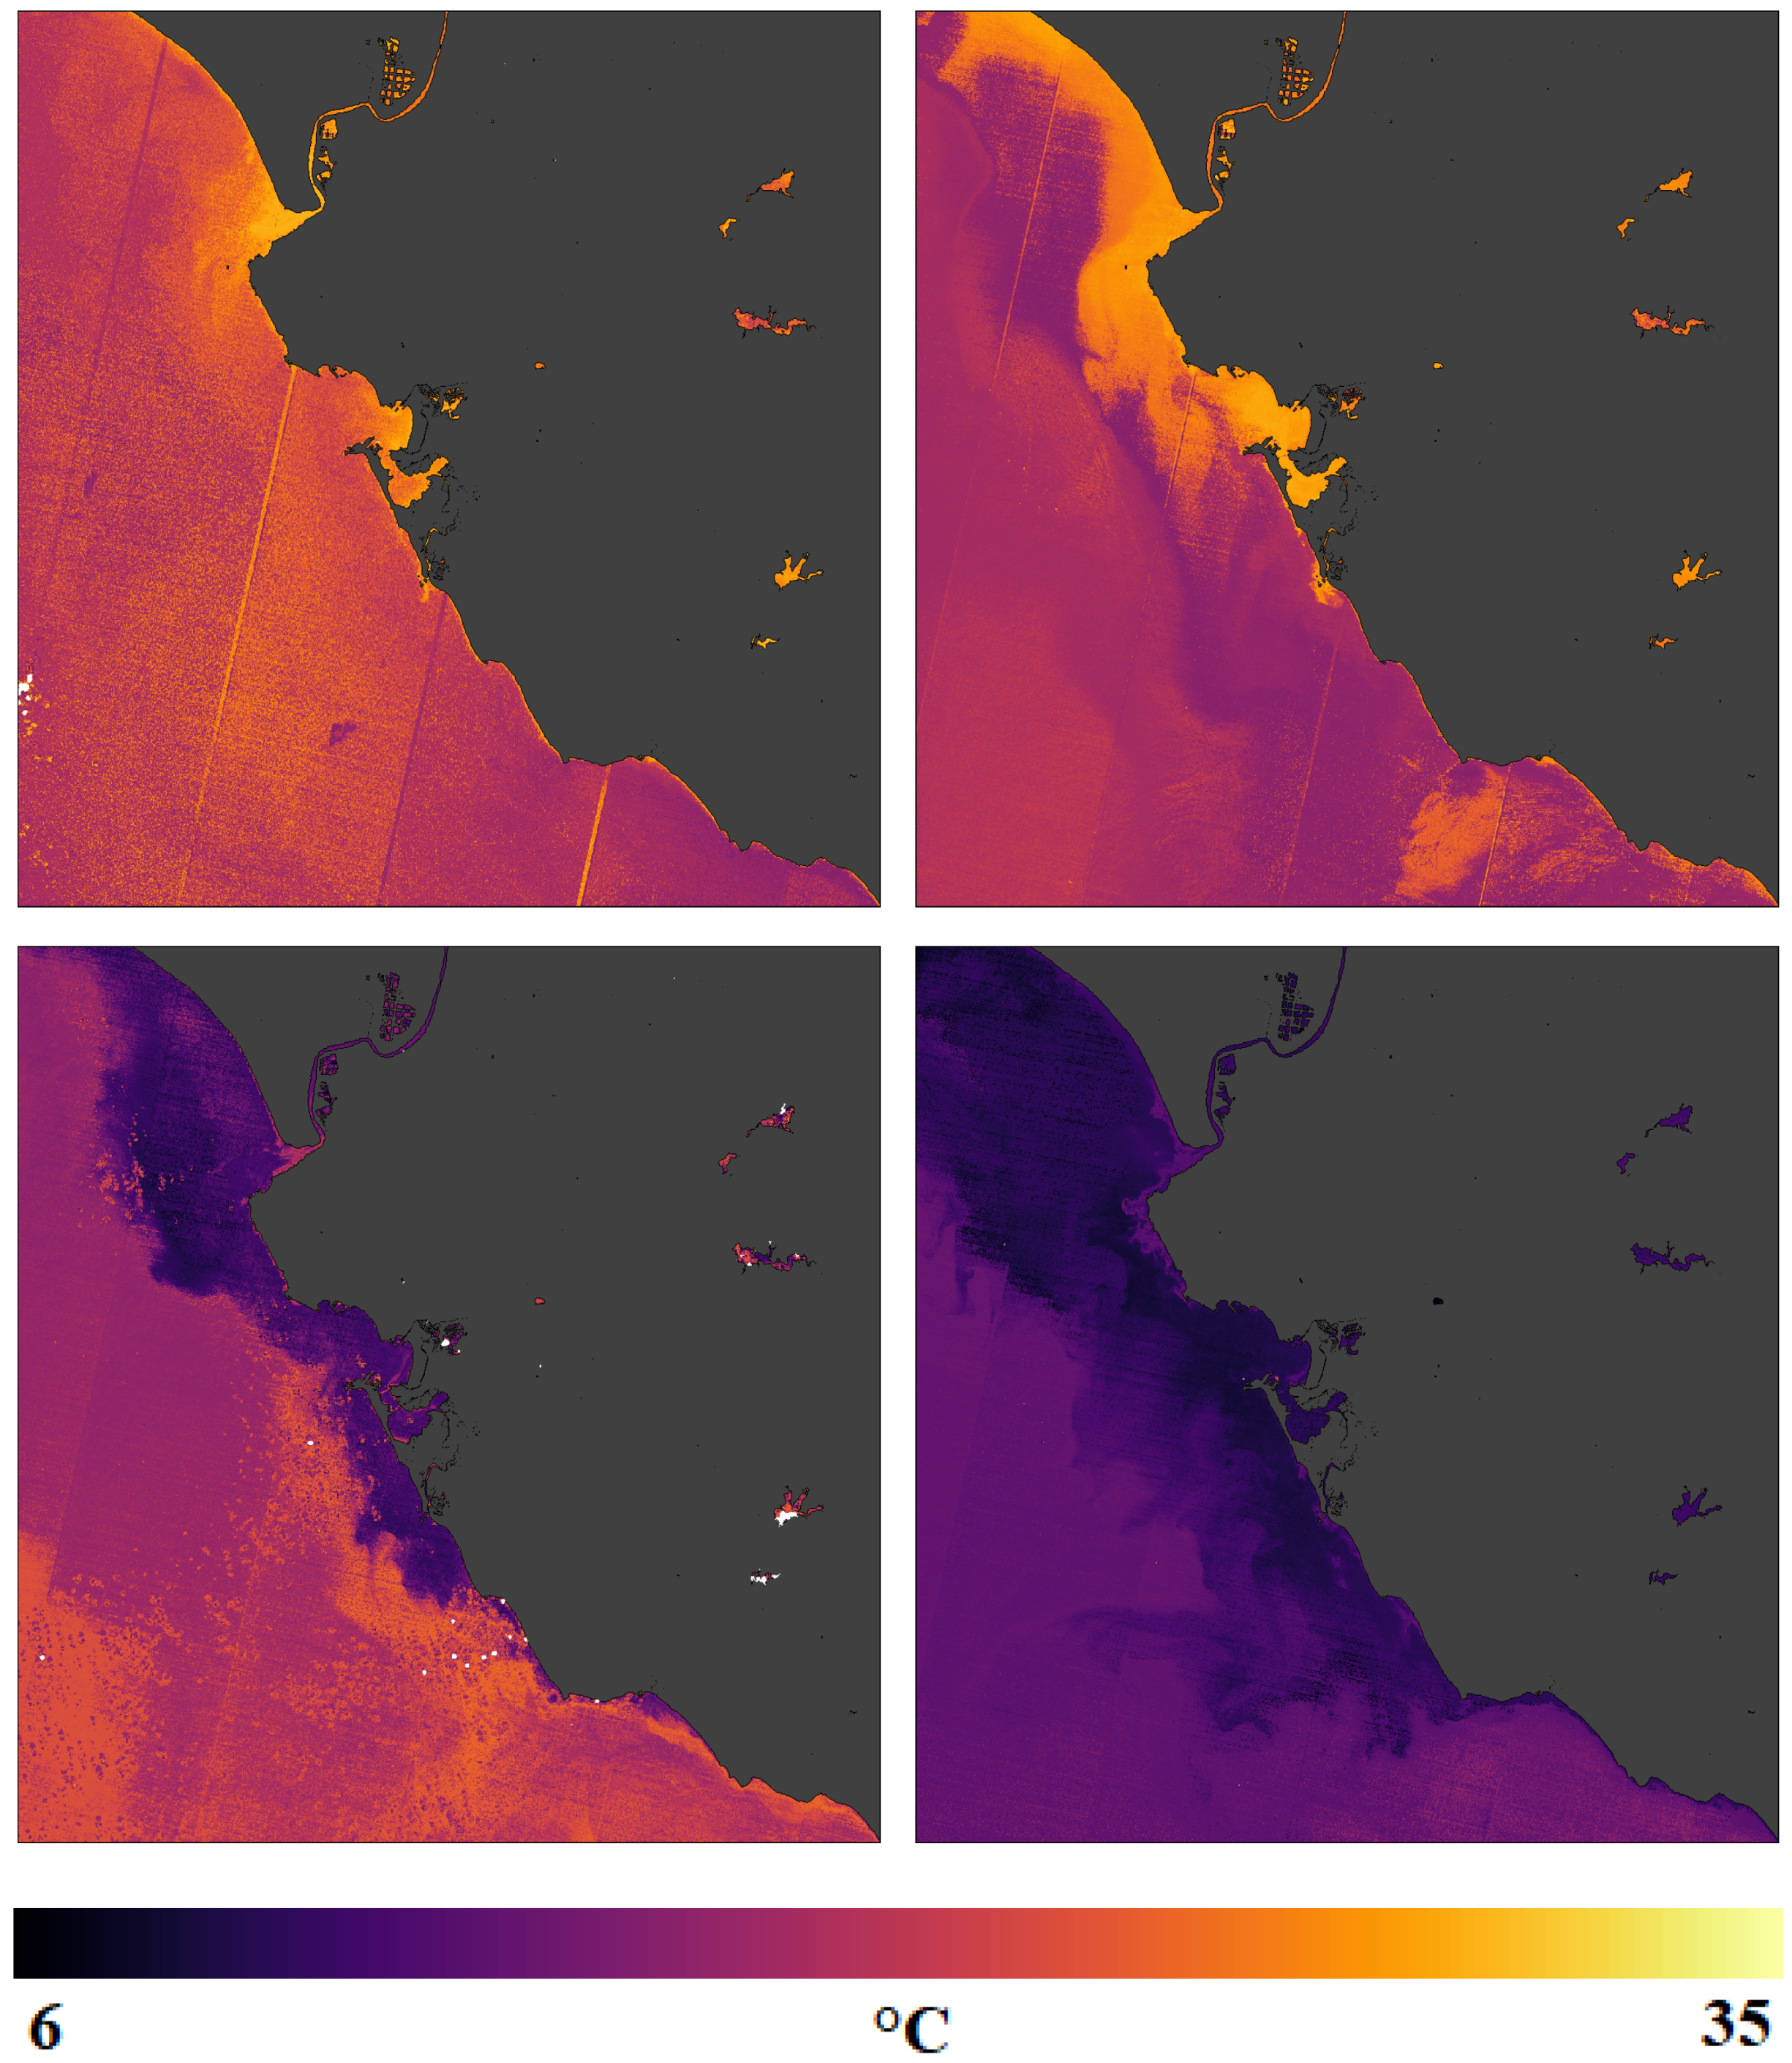
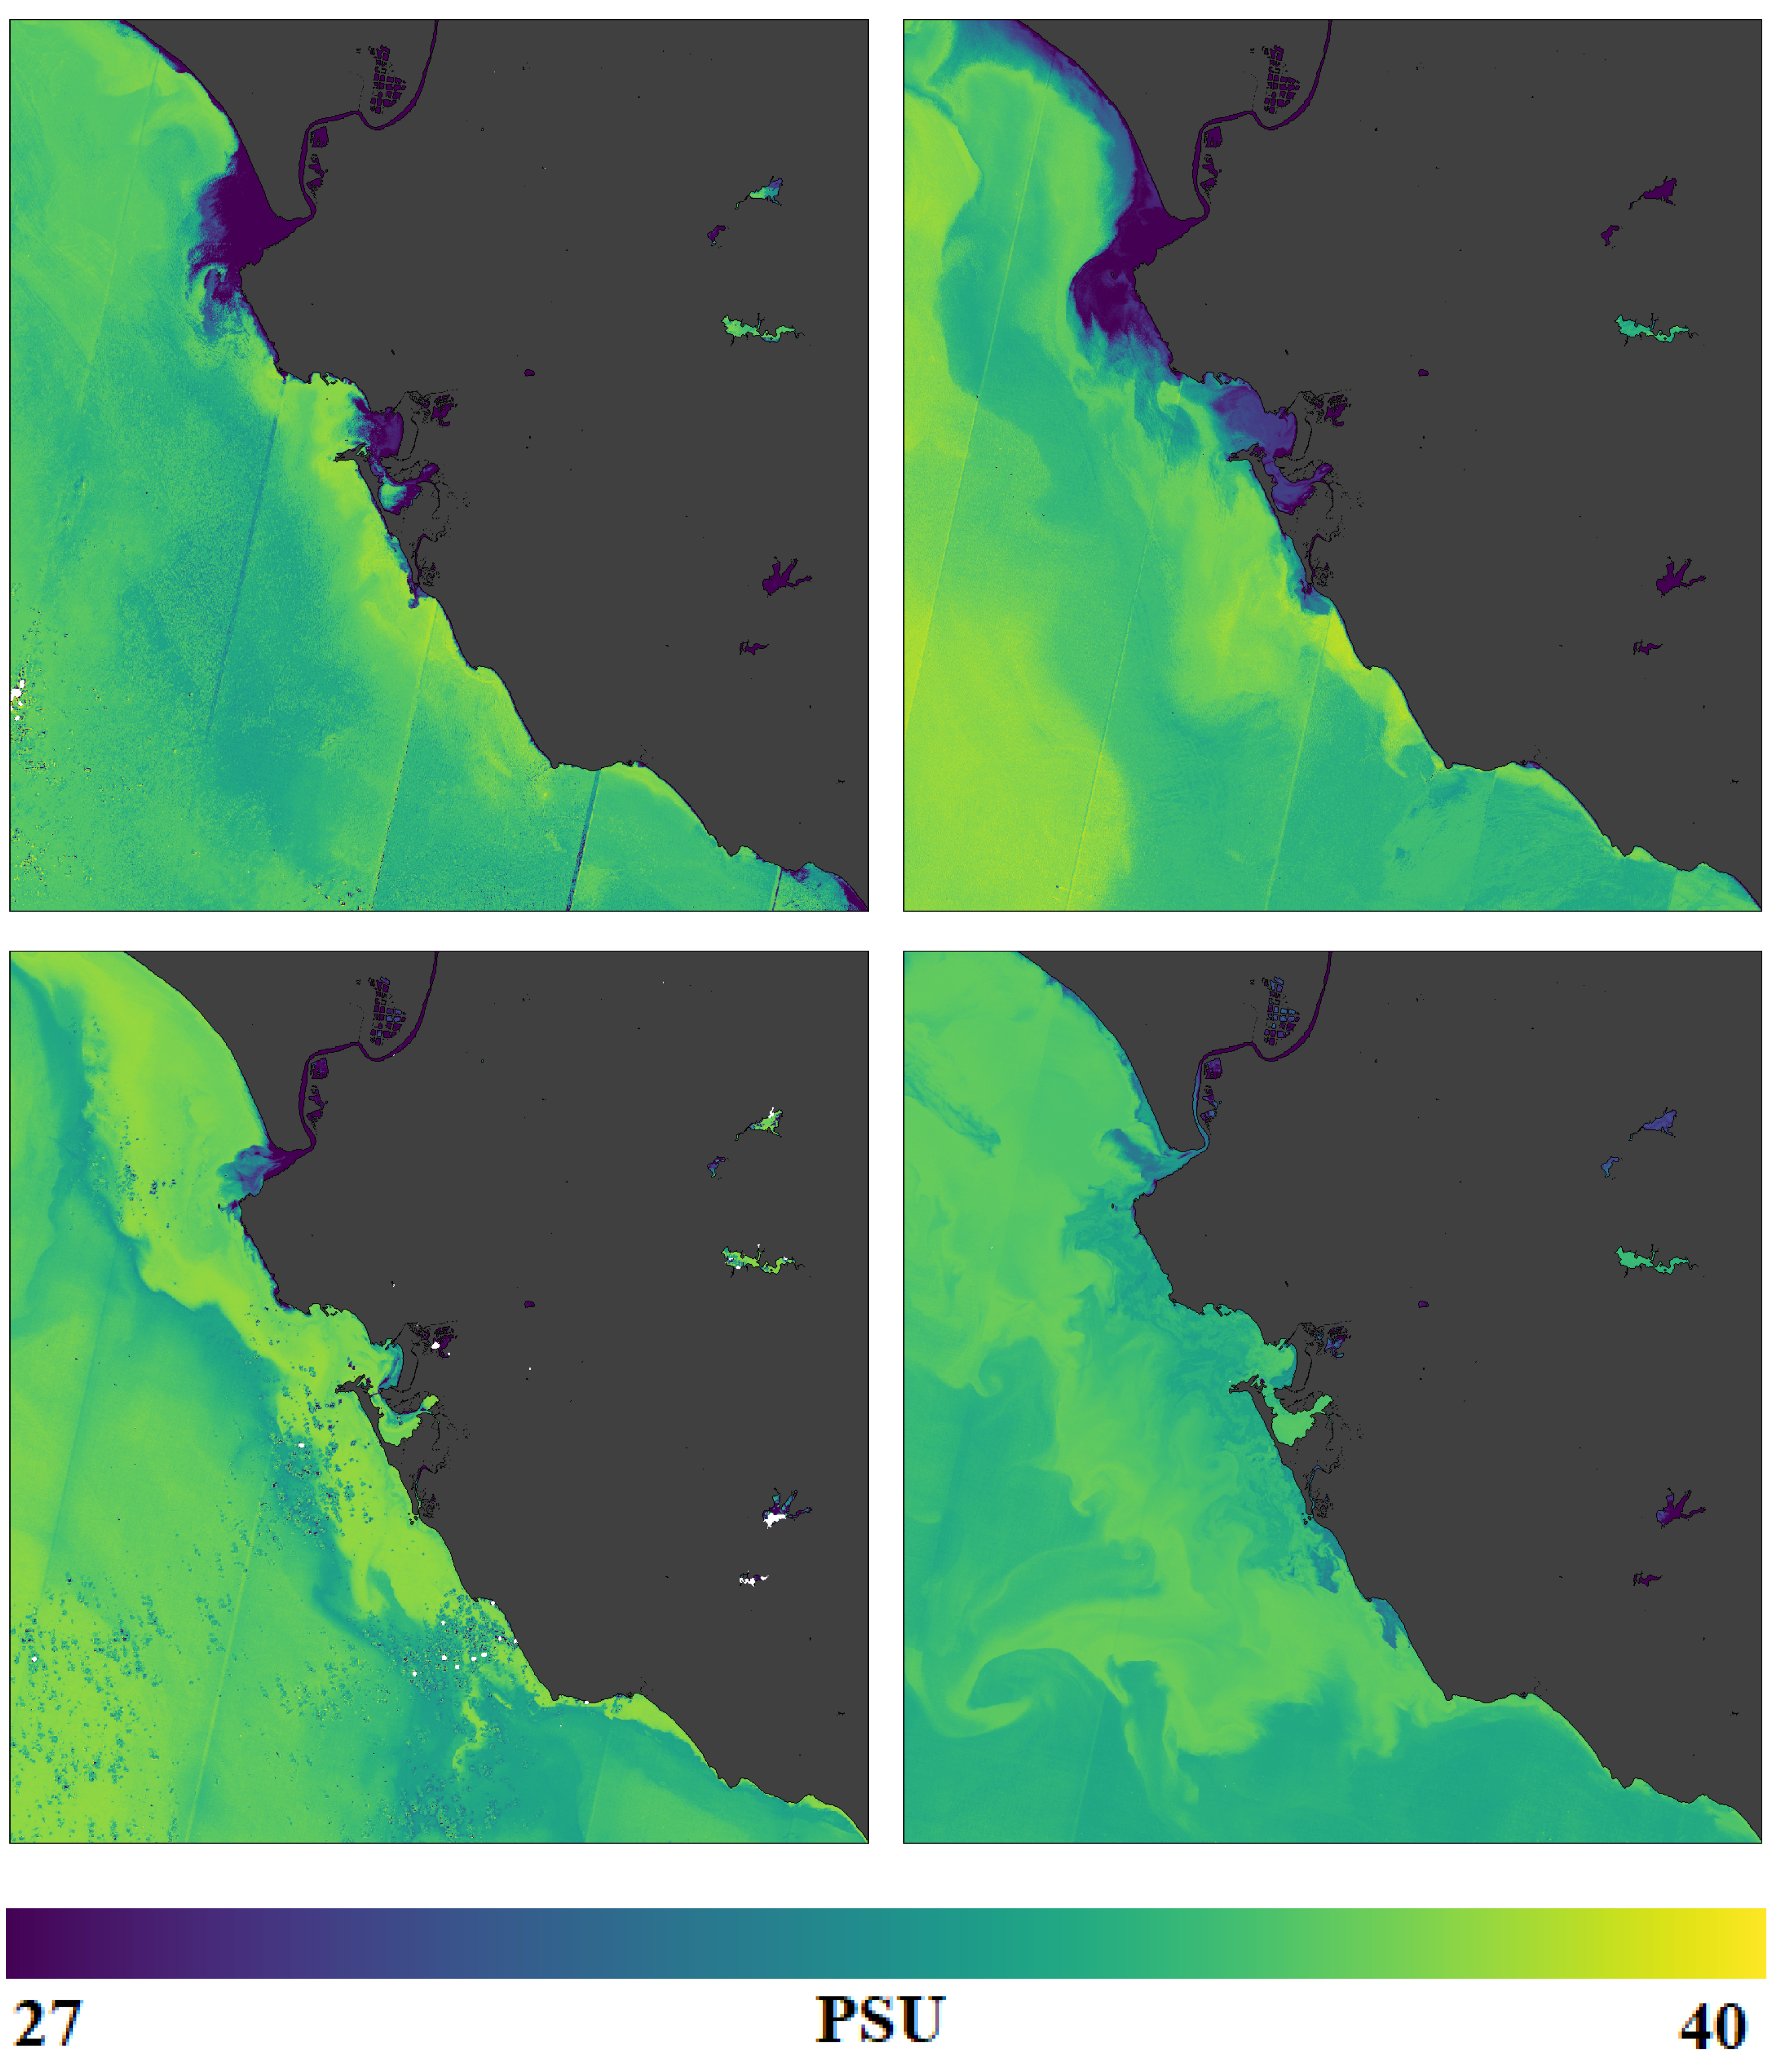
3.6. Evaluation: Mapping Sea Surface Salinity and Temperature at the Guadalquivir River Mouth and the Bay of CáDiz
4. Conclusions
Author Contributions
Funding
Acknowledgments
Conflicts of Interest
References
- Sang, Y.; Karayaka, H.B.; Yan, Y.; Yilmaz, N.; Souders, D. Ocean (Marine) Energy. Compr. Energy Syst. 2018, 1, 733–769. [Google Scholar]
- National Oceanic and Atmospheric Administration, U.S. Department of Commerce. Why do Scientists Measure Sea Surface Temperature? 2018. Available online: https://oceanservice.noaa.gov/facts/sea-surface-temperature.html (accessed on 1 June 2019).
- Chen, S.; Hu, C. Estimating sea surface salinity in the northern Gulf of Mexico from satellite ocean colour measurements. Remote Sens. Environ. 2007, 201, 115–132. [Google Scholar] [CrossRef]
- European Commission. Copernicus Marine Environment Monitoring Service. 2018. Available online: http://marine.copernicus.eu/ (accessed on 1 June 2019).
- Barre, H.M.J.P.; Duesmann, B.; Kerr, Y.H. SMOS: The Mission and the System. IEEE Trans. Geosci. Remote Sens. 2008, 46, 587–593. Available online: https://www.esa.int/Our_Activities/Observing_the_Earth/SMOS (accessed on 1 June 2019). [CrossRef]
- Le Vine, D.M.; Lagerloef, G.S.E.; Ral Colomb, F.; Yueh, S.H.; Pellerano, F.A. Aquarius: An Instrument to Monitor Sea Surface Salinity From Space. IEEE Trans. Geosci. Remote Sens. 2007, 45, 2040–2050. Available online: https://www.nasa.gov/mission_pages/aquarius/overview (accessed on 1 June 2019). [CrossRef]
- Parkinson, C.L. Aqua: An Earth-Observing Satellite mission to examine water and other climate variables. IEEE Trans. Geosci. Remote Sens. 2003, 41, 173–183. Available online: https://oceancolor.gsfc.nasa.gov/data/aqua/ (accessed on 1 June 2019). [CrossRef]
- Gregg, W.W.; Patt, F.S.; Woodward, R.H. Development of a Simulated Data Set for the SeaWiFS Mission. IEEE Trans. Geosci. Remote Sens. 1997, 35, 421–435. Available online: https://oceancolor.gsfc.nasa.gov/SeaWiFS (accessed on 1 June 2019). [CrossRef]
- Pichel, W.; Sapper, J.; Duda, C.; Maturi, E.; Jarva, K.; Stroup, J. CoastWatch Operational Mapped AVHRR Imagery. In Proceedings of the IGARSS ’94—1994 IEEE International Geoscience and Remote Sensing Symposium, Pasadena, CA, USA, 8–12 August 1994; Volume 2, pp. 1219–1221. Available online: https://coastwatch.noaa.gov (accessed on 1 June 2019).
- Shibata, A.; Imaoka, K.; Kachi, M.; Fujimoto, Y.; Mutoh, T. AMSR/AMSR-E Sea Surface Temperature Algorithm Development. In Proceedings of the IGARSS 2003—IEEE International Geoscience and Remote Sensing Symposium, Toulouse, France, 21–25 July 2003. [Google Scholar] [CrossRef]
- Gentemann, C.L.; Meissner, T.; Wentz, F.J. Accuracy of satellite sea surface temperatures at 7 and 11 GHz. IEEE Trans. Geosci. Remote Sens. 2010, 48, 1009–1018. [Google Scholar] [CrossRef]
- Aparna, S.G.; D’Souza, S.; Arjun, N.B. Prediction of daily sea surface temperature using Artificial Neural Networks. Int. J. Remote Sens. Remote Sens. Lett. 2018, 39, 4214–4231. [Google Scholar] [CrossRef]
- Garcia-Gorriz, E.; Garcia-Sanchez, J. Prediction of sea surface temperatures in the western Mediterranean Sea by neural networks using satellite observations. Geophys. Res. Lett. 2007, 34. [Google Scholar] [CrossRef]
- Patil, K.; Deo, M.C. Prediction of sea surface temperatures by combining numerical and neural techniques. J. Atmos. Ocean. Technol. 2016, 33, 1715–1726. [Google Scholar] [CrossRef]
- Brewin, R.J.W.; Mora, L.; Billson, O.; Jackson, T.; Russell, P.; Brewin, T.G.; Shutler, J.D.; Miller, P.I.; Taylor, B.H.; Smyth, T.J.; et al. Evaluating operational AVHRR sea surface temperature data at the coastline using surfers. Estuarine Coast. Shelf Sci. 2017, 196, 276–289. [Google Scholar] [CrossRef]
- Marghany, M.; Hashim, M.; Cracknell, A.P. Modelling Sea Surface Salinity from MODIS Satellite Data. In Proceedings of the International Conference on Computational Science and its Applications, Fukuoka, Japan, 23–26 March 2010; pp. 545–556. [Google Scholar]
- Geiger, E.F.; Grossi, M.D.; Trembanis, A.C.; Kohut, J.T.; Oliver, M.J. Satellite–derived coastal ocean and estuarine salinity in the Mid–Atlantic. Cont. Shelf Res. 2013, 63, S235–S242. [Google Scholar] [CrossRef]
- Olmedo, E.; Taupier–Letage, I.; Turiel, A.; Alvera-Azcárate, A. Improving SMOS Sea Surface Salinity in the Western Mediterranean Sea through Multivariate and Multifractal Analysis. Remote Sens. 2018, 10, 485. [Google Scholar] [CrossRef]
- Srokosz, M.; Banks, C. Salinity from space. Weather 2019, 74, 21–40. [Google Scholar] [CrossRef]
- Mavrocordatos, C.; Berrutti, B.; Aguirre, M.; Drinkwater, M. The Sentinel-3 Mission and its Topography Element. In Proceedings of the 2007 IEEE International Geoscience and Remote Sensing Symposium, Barcelona, Spain, 23–28 July 2007; pp. 3529–3532. Available online: https://earth.esa.int/web/guest/missions/esa-eo-missions/sentinel-3 (accessed on 1 June 2019).
- European Commission. Insitu Near Real Time Observations. 2018. Available online: http://marine.copernicus.eu/services-portfolio/access-to-products/?option=com_csw&view=details&product_id=INSITU_GLO_CARBON_NRT_OBSERVATIONS_013_049 (accessed on 1 June 2019).
- European Commission. Insitu Reprocessed Observations. 2018. Available online: http://marine.copernicus.eu/services-portfolio/access-to-products/?option=com_csw&view=details&product_id=INSITU_GLO_TS_REP_OBSERVATIONS_013_001_b (accessed on 1 June 2019).
- Martimort, P.; Arino, O.; Berger, M.; Biasutti, R.; Carnicero, B.; Del Bello, U.; Fernandez, V.; Gascon, F.; Greco, B.; Silvestrin, P.; et al. Sentinel-2 Optical High Resolution Mission for GMES Operational Services. In Proceedings of the 2007 IEEE International Geoscience and Remote Sensing Symposium, Barcelona, Spain, 23–27 July 2007; pp. 2677–2680. Available online: https://sentinel.esa.int/web/sentinel/missions/sentinel-2 (accessed on 1 June 2019).
- Google. Google Earth Engine. 2018. Available online: https://code.earthengine.google.com (accessed on 1 June 2019).
- Gorelick, N.; Hancher, M.; Dixon, M.; Ilyushchenko, S.; Thau, D.; Moore, R. Google Earth Engine: Planetary-scale geospatial analysis for everyone. Remote Sens. Environ. 2017, 202, 18–27. [Google Scholar] [CrossRef]
- Nielsen, M.A. Neural Networks and Deep Learning. Determination Press, 2015. Available online: http://neuralnetworksanddeeplearning.com (accessed on 1 June 2019).
- Kastner, F.; Jansen, B.; Kautz, F.; Hubner, M. Exploring Deep Neural Networks for Regression Analysis. In Proceedings of the Eighth International Conference on Performance, Safety and Robustness in Complex Systems and Applications, Tsukuba, Japan, 22–26 April 2018. [Google Scholar]
- Ioffe, S.; Szegedy, C. Batch Normalization: Accelerating Deep Network Training by Reducing Internal Covariate Shift. arXiv 2015, arXiv:1502.03167. [Google Scholar]
- Schmidhuber, J. Deep learning in neural networks: An overview. Neural Networks 2015, 61, 85–117. [Google Scholar] [CrossRef] [PubMed]
- Veit, A.; Wilber, M.; Belongie, S. Residual Networks Behave Like Ensembles of Relatively Shallow Networks. arXiv 2016, arXiv:1605.06431. [Google Scholar]
- Srivastava, R.K.; Greff, K.; Schmidhuber, J. Highway Networks. arXiv 2015, arXiv:1505.00387. [Google Scholar]
- De España, G.; del Estado, P. Available online: https://portus.puertos.es/ (accessed on 1 June 2019).
- European Space Agency. Available online: https://sentinel.esa.int/documents/247904/685211/Sentinel-2_L1C_Data_Quality_Report (accessed on 1 June 2019).


| Mission/Project | Measured Property | Sensor Type | Spatial Resolution | Revisit Time | Organisation |
|---|---|---|---|---|---|
| SMOS | Soil moisture, ocean salinity | MIRAS | 35 km | 3 days | ESA |
| Aquarius | Ocean salinity | Radiometer | 150 km | 7 days | NASA |
| MODIS–Aqua | Ocean colour and temperature | Spectro–radiometer | 1 km | 2 days | NASA |
| SeaWiFs | Ocean salinity | VNIR | 1.1 km | 2 days | NASA |
| Sentinel-2 | Coastal areas and water bodies monitoring | Multi-spectral | 60 m | 5 days | ESA |
| Sentinel-3 | Ocean colour | Radiometer and spectrometer | 300 m | 2 days | ESA |
| CoastWatch | Ocean temperature | VIIRS, AVHRR, ABI, ... | 1 km | - | NOAA |
| Estimated Property | Method | Notes | Location |
|---|---|---|---|
| SST [10,11] | Retrieval algorithm for MODIS–Aqua | Very low resolution (50 km). Noise and geophysical errors more representative in higher radiometric frequencies. | Worldwide |
| SST [12,13] | NN from previous days info/from relevant meteorological components | Low resolution (4 km). Long-term data needed (45 years). Localised results. | Indian Ocean/Western Mediterranean Sea |
| SST [14] | NN from numerical model | Very low resolution (20 km). Combines numerical and neural techniques. Focuses on error time-series. | Indian Ocean |
| SST [15] | AVHRR-derived compared with local information | Low resolution (1 km). Dependent on limited in situ data sources. Innovative approach to mitigate drawbacks from remote sensed information. | North-East Atlantic Ocean |
| SSS [16] | Algorithm from MODIS data | Low resolution (1 km). High accuracy of algorithm tested. | South China Sea |
| SSS [17] | MODIS–Aqua, neural network | Low resolution (1 km). Relevant for estuarine processes. Relatively high errors. Relationships between SST and SSS. | Mid-Atlantic Ocean |
| SSS [3] | NN MODIS and SeWiFs. | Low resolution (1 km). Match in situ-satellite range ±6 h. Site-specific. | Gulf of Mexico |
| SSS [18] | SMOS-derived (6 years), data interpolation. | Improved resolution (SMOS), but still low for coastal applications (5 km). Error-reducing. High accuracy compared to in situ data. | Western Mediterranean Sea and North Atlantic Ocean. |
| In Situ Observation | (Lat, Lon) () | Location | z (m) | d (km) | # |
|---|---|---|---|---|---|
| Off-shore buoys | |||||
| MO_TS_MO_61141 | (, ) | Ibiza | 800 | 40 | |
| (, ) | Cabo de Gata (Almeria) | 536 | 188 | ||
| (, ) | Tarragona | 688 | 178 | ||
| (, ) | Valencia | 260 | 143 | ||
| (, ) | Cabo de Palos (Cartagena) | 230 | 210 | ||
| Near-shore buoys | |||||
| (, ) | Mallorca | 30 | 77 | ||
| MO_TS_MO_LA-MOLA | (, ) | Menorca (East) | 10 | 13 | |
| MO_TS_MO_SON-BLANC | (, ) | Menorca (West) | 6 | 29 | |
| (, ) | Gerona | 192 | 38 | ||
| (, ) | Barcelona | 20 | 318 | ||
| Total | 1234 | ||||
| Data | Resolution (m) | Wavelength (nm) | Description |
|---|---|---|---|
| B1 | 60 | 443.9 | Aerosols |
| B2 | 10 | 496.6 | Blue |
| B3 | 10 | 560 | Green |
| B4 | 10 | 664.5 | Red |
| B5 | 20 | 703.9 | Red Edge 1 |
| B6 | 20 | 740.2 | Red Edge 2 |
| B7 | 20 | 782.5 | Red Edge 3 |
| B8 | 10 | 835.1 | NIR |
| B8a | 20 | 864.8 | Red Edge 4 |
| B9 | 60 | 945 | Water vapour |
| B10 | 60 | 1373.5 | Cirrus |
| B11 | 20 | 1613.7 | SWIR1 |
| B12 | 20 | 2202.4 | SWIR2 |
| QA60 (*) | 60 | - | Cloud mask |
| Data | Description |
|---|---|
| Cloud pixel percentage | Granule-specific cloudy pixel percentage. |
| Cloud coverage assessment | Cloudy pixel percentage for the whole archive. |
| Mean Incident Azimuth angle for every band () | Mean value containing viewing incidence azimuth angle average for each band. |
| Mean Incident Zenith angle for every band () | Mean value containing viewing incidence zenith angle average for each band. |
| Mean Solar Azimuth angle | Mean value containing sun zenith angle average for all bands. |
| Reflectance conversion correction | Earth-Sun distance correction factor. |
| SST Range (C) | SSS Correl. (R) |
|---|---|
| 0–5 | |
| 5–10 | |
| 10–15 | |
| 15–20 | |
| 20–25 | |
| 25–30 | |
| 30–35 |
© 2019 by the authors. Licensee MDPI, Basel, Switzerland. This article is an open access article distributed under the terms and conditions of the Creative Commons Attribution (CC BY) license (http://creativecommons.org/licenses/by/4.0/).
Share and Cite
Medina-Lopez, E.; Ureña-Fuentes, L. High-Resolution Sea Surface Temperature and Salinity in Coastal Areas Worldwide from Raw Satellite Data. Remote Sens. 2019, 11, 2191. https://doi.org/10.3390/rs11192191
Medina-Lopez E, Ureña-Fuentes L. High-Resolution Sea Surface Temperature and Salinity in Coastal Areas Worldwide from Raw Satellite Data. Remote Sensing. 2019; 11(19):2191. https://doi.org/10.3390/rs11192191
Chicago/Turabian StyleMedina-Lopez, Encarni, and Leonardo Ureña-Fuentes. 2019. "High-Resolution Sea Surface Temperature and Salinity in Coastal Areas Worldwide from Raw Satellite Data" Remote Sensing 11, no. 19: 2191. https://doi.org/10.3390/rs11192191
APA StyleMedina-Lopez, E., & Ureña-Fuentes, L. (2019). High-Resolution Sea Surface Temperature and Salinity in Coastal Areas Worldwide from Raw Satellite Data. Remote Sensing, 11(19), 2191. https://doi.org/10.3390/rs11192191