Article

On-Orbit Radiance Calibration of Nighttime Sensor of LuoJia1-01 Satellite Based on Lunar Observations

1
School of Remote Sensing and Information Engineering, Wuhan University, Wuhan 430079, China
2
State Key Laboratory of Information Engineering in Surveying, Mapping and Remote Sensing, Wuhan University, Wuhan 430079, China
3
College of Urban and Environmental Sciences, Hubei Normal University, Huangshi 435002, China
4
State Key Laboratory of Water Resources and Hydropower Engineering Science, Wuhan University, Wuhan 430072, China
5
Institute of Spacecraft System Engineering, CAST, Beijing 100094, China
*
Author to whom correspondence should be addressed.
Remote Sens. 2019, 11(18), 2183; https://doi.org/10.3390/rs11182183
Submission received: 8 August 2019 / Revised: 10 September 2019 / Accepted: 13 September 2019 / Published: 19 September 2019

Abstract

:
The high-resolution nighttime light (NTL) data of the LuoJia1-01 NTL remote sensing satellite has enriched the available data of NTL remote sensing applications. The radiance calibration used as a reference to convert the digital number (DN) recorded by the nighttime sensor into the radiance of the corresponding ground object is the basic premise to the effective application of the NTL data. Owing to the lack of on-board calibration equipment and the absence of an absolute radiometric calibration light source at night, it is difficult for LuoJia1-01 to carry out on-orbit radiance calibration. The moon, as an exoatmospheric stable radiation source, is widely used for the radiometric calibration of remote sensing satellite sensors and to monitor the stability of the visible and near-infrared sensors. This study, based on lunar observation of the LuoJia1-01 NTL sensor, focused on on-orbit radiometric calibration and included monitoring changes in the nighttime sensor radiometric response for nearly a year by using the Robotic Lunar Observatory (ROLO) lunar irradiance model (Version 311 g). The results showed that: (1) the consistency of the radiometric calibration results based on the ROLO model and the laboratory calibration results of LuoJia1-01 exceeded 90%; (2) the nighttime sensor of LuoJia1-01 radiometric response underwent approximately 6% degradation during the observation period of nearly one year (353 days).

Graphical Abstract

1. Introduction

A remote sensing satellite equipped with a nighttime light (NTL) sensor can sense city lights at night, including low-intensity signals emitted by small-scale residences, flowing traffic, and fishing boats. NTL remote sensing data captured by NTL remote sensing satellites provide a great opportunity to monitor light pollution in ecosystems [1], and these data have been widely used to study human activities to substantially improve our understanding of the magnitude of humanity’s presence [2]. These data are useful for modeling human impact on the environment and have been used for evaluating the regional economy, monitoring urbanization dynamics [3,4,5], perceiving power distribution and consumption in regional development [6,7,8], assessing population and population density change [9,10], estimating cargo handling capacity [11], estimating CO2 emissions [12,13], extracting land available for urban construction [14], and evaluating the evolution of the pattern of spatial expansion of urban land [15,16].
The reliable application of NTL remote sensing data depends on the high-precision radiometric calibration of the sensor. The radiometric calibration is divided into laboratory calibration, on-board calibration, and on-orbit calibration [17]. Laboratory calibration is used to calibrate all the performance parameters by using a uniform light to calibrate the sensor before the satellite launch. However, the mechanical stress experienced during a satellite launch, as well as the influence of the environment in space, causes the radiometric response of the sensor detectors to change with time. Thus, to compensate for the change in the radiometric response, calibration and correction of the sensor are required to ensure acceptable imaging quality throughout the life cycle of the satellite sensor. On-board calibration entails calibrating the radiometric response characteristics of remote sensing sensors with high precision using onboard calibration equipment (such as an on-board diffuser and internal calibration lamp). For example, the 15 reflective solar bands (RSBs) of the Suomi-NPP (the Suomi-National Polar-orbiting Partnership) satellite use an on-board solar diffuser to realize the radiance calibration of the spectral band of the visible-infrared imaging radiometer suite [18]. On-orbit calibration measures the surface radiometric characteristics and atmospheric parameters synchronously at the transit time of the satellite to calibrate the radiance of the remote sensing sensor. Hu et al. [19] used a ground active light source synchronized with the satellite to calibrate the DNB (day/night band) radiometric response of the Suomi-NPP satellite at the high gain band. However, the on-orbit calibration method requires synchronous observation of the satellite, which is both material and labor-intensive. Furthermore, the measurement is easily restricted by clouds and high atmospheric aerosol loads, the calibration data that can be obtained are limited, and convenience and timeliness of calibration are low. These problems motivated our research, which focused on the development of high-efficiency and low-cost on-orbit calibration technology.
In the early years of the 21st century, Kieffer et al. [20] analyzed the spectral and reflectance characteristics of the moon for an extended period. They found the reflectance properties of the surface of the moon to be virtually invariant over time and the spectral features of the moon to be broad and shallow. The TRUTHS and CLARREO space missions [21,22] led to the proposal to periodically observe the moon to address on-orbit radiometric calibration and monitor the stability of the sensors of remote sensing satellites. A highly accurate radiometrically calibrated photometric model of the moon is the basis for realizing radiometric calibration based on the lunar observation of remote sensing satellite sensors. Many researchers have established lunar radiometric photometric models based on the ground-based lunar radiometric measurement, such as the MT2009 model (Miller and Turner, 2009) and the Robotic Lunar Observatory (ROLO) model [23,24]. The MT2009 model was established based on the spectral reflectance dataset obtained from the periodic observation of the moon [25], but the data sources of the MT2009 model are inconsistent without traceability to the same standard. In addition, the influence of positive and negative phase angles and libration on lunar irradiance is not taken into account, resulting in great uncertainty and greatly restricted application [26]. The ROLO irradiance model was established based on periodic radiometric observation of the lunar channel-imaging instrument. During the ROLO observation period, approximately 85,000 individual lunar observation images of 32 channels at wavelengths ranging from 347 to 2390 nm were acquired. The model is thus based on a large volume of data and consistent data sources. In addition, the establishment of the model fully considers the effects of the libration, phase angle (1.55° < g < 97°), geometric distance, and other characteristics of the moon, with good applicability and a wide range of application.
A lunar calibration method for remote sensing satellite sensors using lunar spectral irradiance measurement of the ROLO model has been established by the USGS (U.S. Geological Survey), and has been successfully applied to the GMS-5 (Geostationary Meteorological Satellite) [27,28], GOES (Geostationary Operational Environmental Satellite) [29,30,31], Suomi-NPP [18,32,33,34,35,36,37,38,39], SeaWIFS (The Sea-Viewing Wide Field-of-View Sensor) [40,41,42,43], and other instruments for on-orbit radiometric calibration and stability monitoring. Fujisada et al. [28] calibrated the radiance of the GMS-5 remote sensing sensor based on pairs of GMS-5 lunar observation and ROLO images captured under the same observation conditions. Butler et al. [29] evaluated the degradation rate of the visible channel of the GOES satellite sensor based on the ROLO model. Sun et al. [44] used the ROLO model to evaluate the on-orbit radiometric response decay of MODIS (The Moderate Resolution Imaging Spectro-radiometer) and corrected the radiometric response degradation of band 8. Xiong et al. [18] used the ROLO model to calibrate the Suomi-NPP VIIRS (Visible Infrared Imaging Radiometer Suite) reflective solar band (RSB) in orbit. Based on long-term lunar observation by SeaWIFS, Barnes et al. [40] analyzed the changes in the oversampling, libration, geometric distance, and phase angle characteristics of the moon with time. Wu et al. [45] obtained the instrumental radiometric response decay of FY-3C/MERSI (MEdium Resolution Spectral Imager) by using MERSI cold sky lunar observation data and determined the ratio of MERSI to the stable channel. In addition, some scholars assessed the accuracy of the radiometric model of the moon. For example, Zhang et al. [26,46,47] utilized ground-based hyperspectral lunar observation data to estimate the accuracy of the MT2009 model and the ROLO model. Their results indicated that the ROLO model is highly accurate in the visible near-infrared band, with an absolute uncertainty of 5–10% and relative stability of 1–3% (the standard deviation of the empirical formula with 18 parameters of the ROLO model).
LuoJia1-01 is a 6-kg cube scientific experimental satellite, equipped with a 129-m resolution NTL remote sensing sensor and navigation enhancement load, as shown in Figure 1. The frame push-broom imaging mode, the main imaging mode of the LuoJia1-01 NTL camera [48], use its camera system to capture the NTL on the ground [49]. The sensor parameters are listed in Table 1. It uses an electronic rolling shutter. Each instantaneous exposure images one row of a single frame. The 2048 rows of detectors are exposed sequentially, and a full-frame of data is recorded after all the detectors in a row have been exposed. The sensor has two operation modes: the Standard mode (STD) with a frame rate of 48 fps (Frames per Second), and the high dynamic range (HDR) mode with a frame rate of 24 fps. In HDR mode, the sensor can capture a low- and high-gain image at each exposure and combines low-level gain with short exposure time for daytime imaging. The low-gain image is effective, and the high-gain image is saturated in daytime imaging scenarios. Low-level gain and long exposure time are used for nighttime imaging. In nighttime imaging scenarios, both low- and high-gain imaging are effective [17].
The spectral response of LuoJia1-01 is shown in Figure 2.
LuoJia1-01 performs lunar imaging in HDR mode. The imaging process mainly consists of formulating the lunar imaging plan, calculating the posture and time, and conducting imaging according to the commands of the ground station. The specific procedures are as follows:
  • Before imaging, the satellite maneuvers to a predetermined position and points to the moon;
  • The satellite sensor is turned on for lunar imaging, and the satellite attitude is adjusted to point to the moon during the imaging process;
  • After the imaging is completed, the satellite adjusts its attitude and returns to the conventional ground-based observations mode.
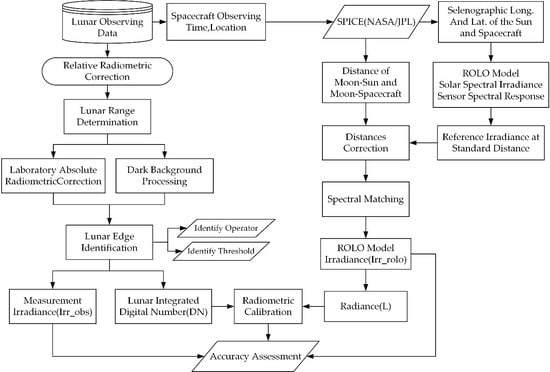
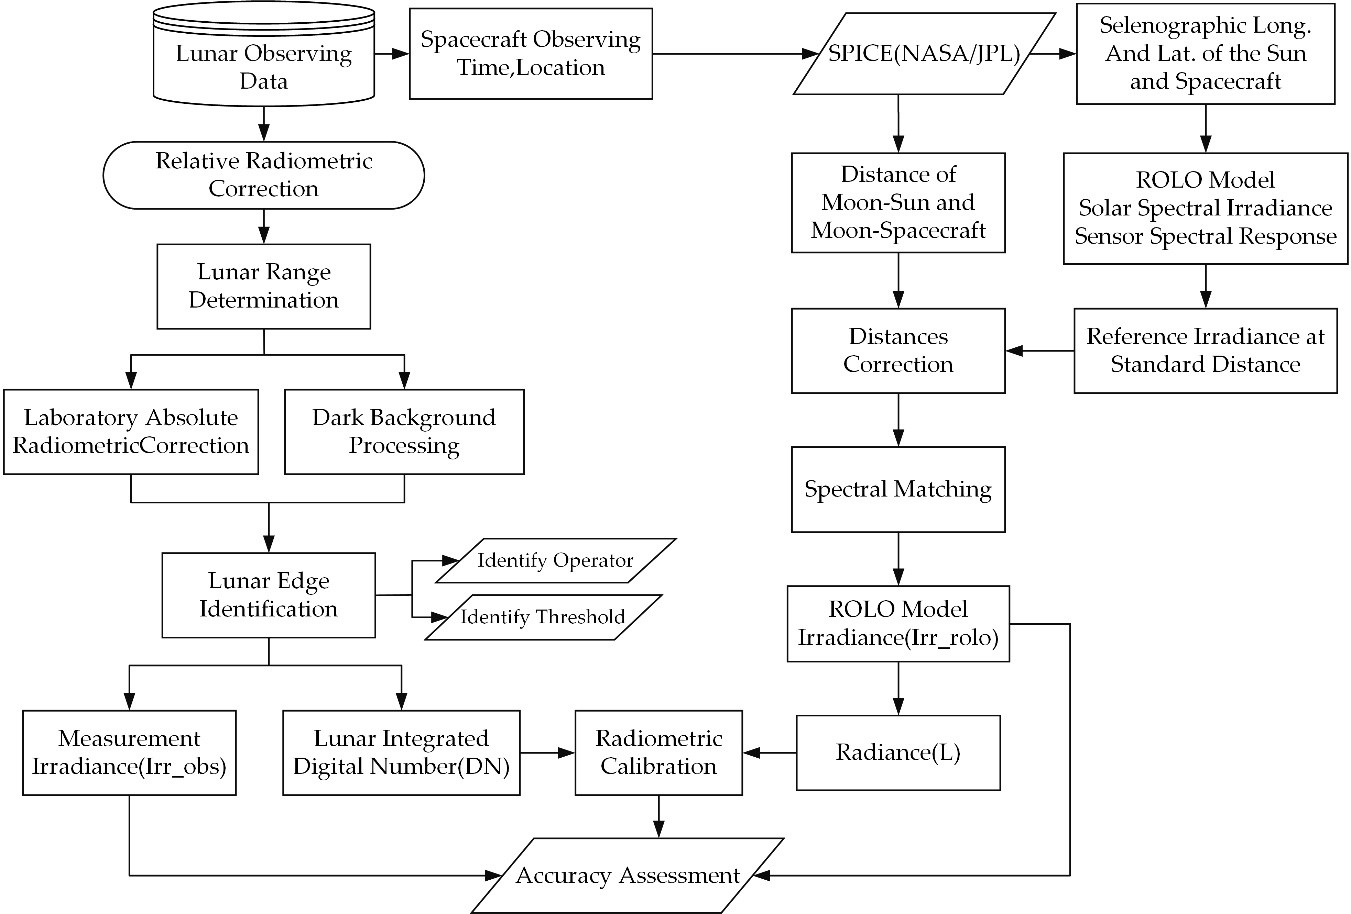
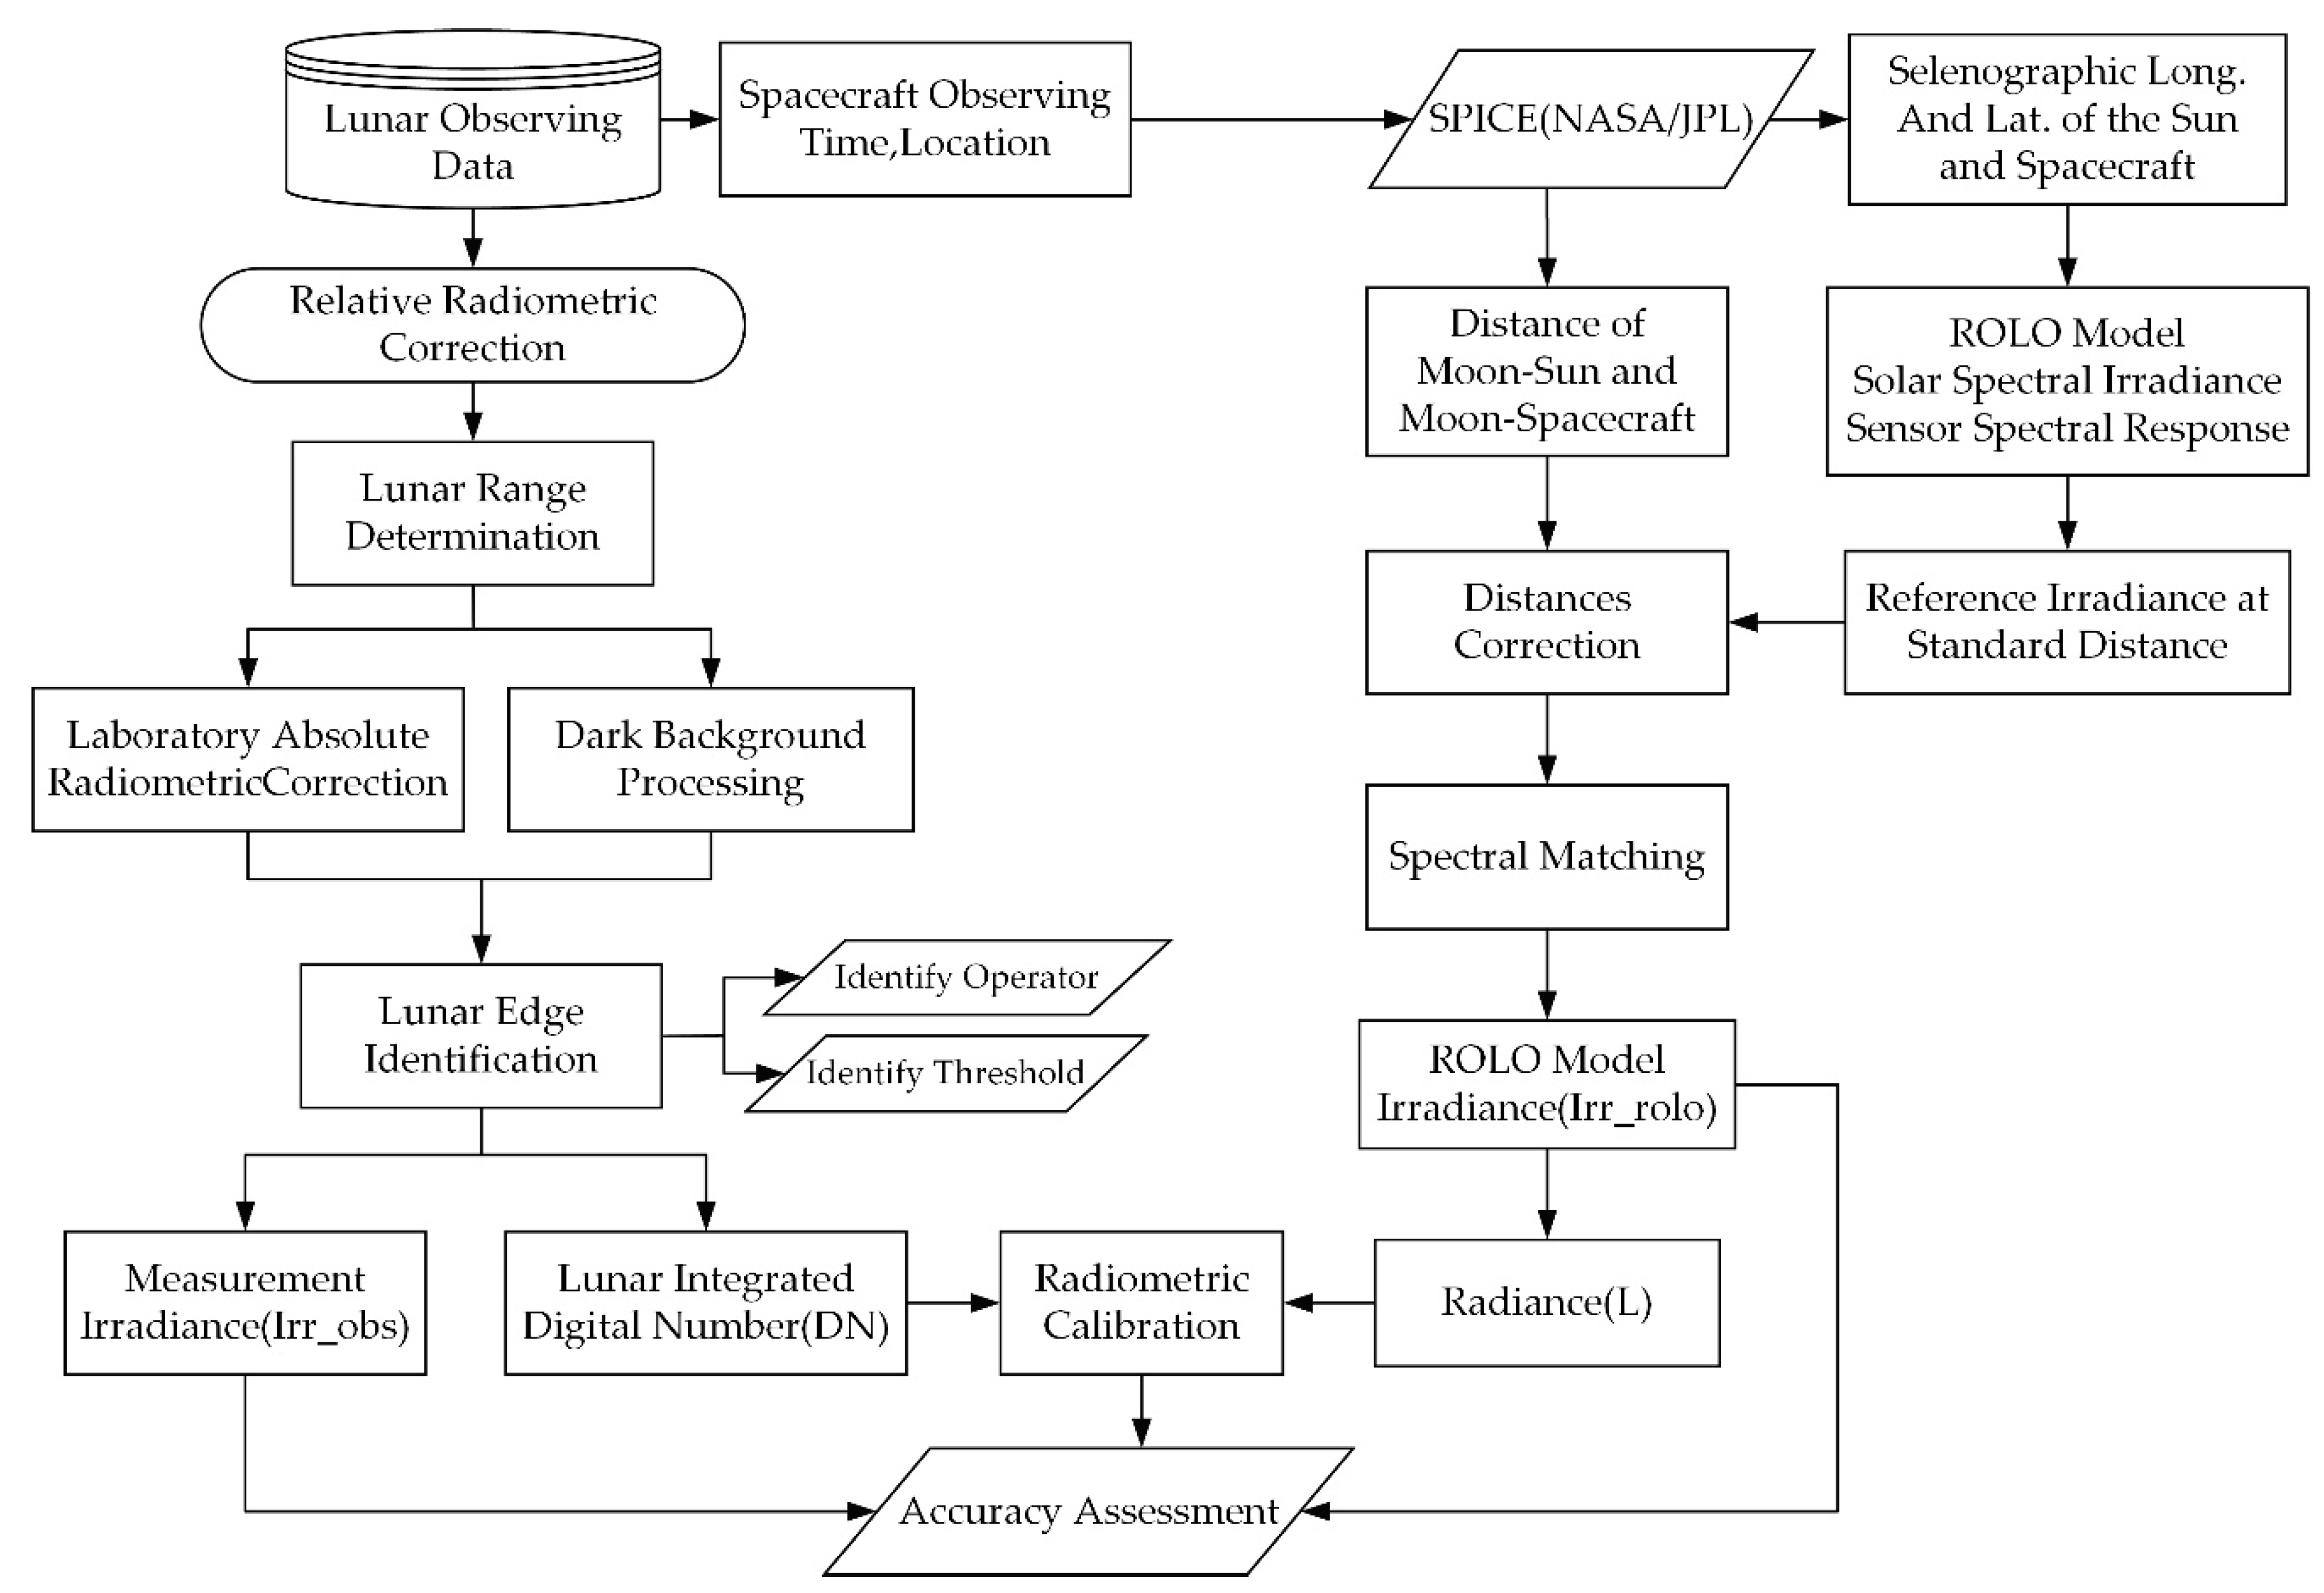
However, without on-board calibration equipment, it is difficult to directly calibrate the radiance of the LuoJia1-01 NTL sensor in the absence of a uniform ground absolute radiometric light source at night. This study, which is based on lunar observation by the LuoJia1-01 satellite, led to the development of a method to realize on-orbit radiance calibration and to monitor the radiometric response stability of the NTL sensor. The on-orbit calibration accuracy of the NTL remote sensing sensor was evaluated by using LuoJia1-01 laboratory measurement irradiance and ROLO model irradiance.

2. Methodology

The key steps for lunar radiometric calibration based on lunar observations include radiometric correction, determination of the scope of the moon, lunar edge identification, geometric distance correction, spectral matching, and lunar irradiance calculations. Both the radiance calculated by the ROLO irradiance model and the lunar disk digital number (DN) value of lunar observation were used to calibrate the radiometric response parameters of the NTL sensor. The accuracy of the radiance calibration was evaluated by comparing the extent to which the results of the ROLO calibration were consistent with those of the laboratory calibration. A detailed flow chart of the procedure to assess the calibration accuracy is shown in Figure 3.

2.1. Radiometric Correction

The raw data generated during lunar observation include systematic errors, such as those resulting from the inconsistency of the detectors of the NTL sensors and the vignette of the satellite optical system, which need to be removed by radiometric correction. This correction includes both relative radiometric correction and absolute radiometric correction. The response inconsistencies of different pixels and the vignetting of the NTL sensor can be corrected by relative radiometric correction, which, for the LuoJia1-01 satellite, is expressed as:
DN rel corr ( i ) = a ( i ) × DN org ( i ) + b ( i )
where i is the sensor detector index, a ( i ) and b ( i ) are the relative radiometric correction coefficients of the ith detector of the NTL sensor, DN org ( i ) is the original DN value of the imaging of the ith detector, and DN rel corr ( i ) is the DN value after relative radiometric correction of the ith detector.
The absolute radiometric correction serves to convert the DN value of the NTL sensor after relative radiometric correction to the corresponding radiance of ground objects. The laboratory calibration model of LuoJia1-01 conforms to a piecewise linear model relationship, and the corrected radiance is:
L = { DN rel corr ( i ) B 11 ( i ) B 10 ( i )   , DN rel corr ( i ) < DN Threshold DN rel corr ( i ) B 21 ( i ) B 20 ( i )   , DN rel corr ( i ) DN Threshold
where DN Threshold is the inflexion pixel value of the piecewise linear model; B 10 ( i )   and   B 11 ( i ) are the gain and offset of the pixel value, respectively, where DN rel corr ( i ) is less than the inflection value; B 20 ( i ) ,   B 21 ( i ) are, respectively, the gain and the offset of the pixel value, where DN rel corr ( i ) is greater than the inflection value; and L is the radiance of the pixel after the absolute radiometric correction.

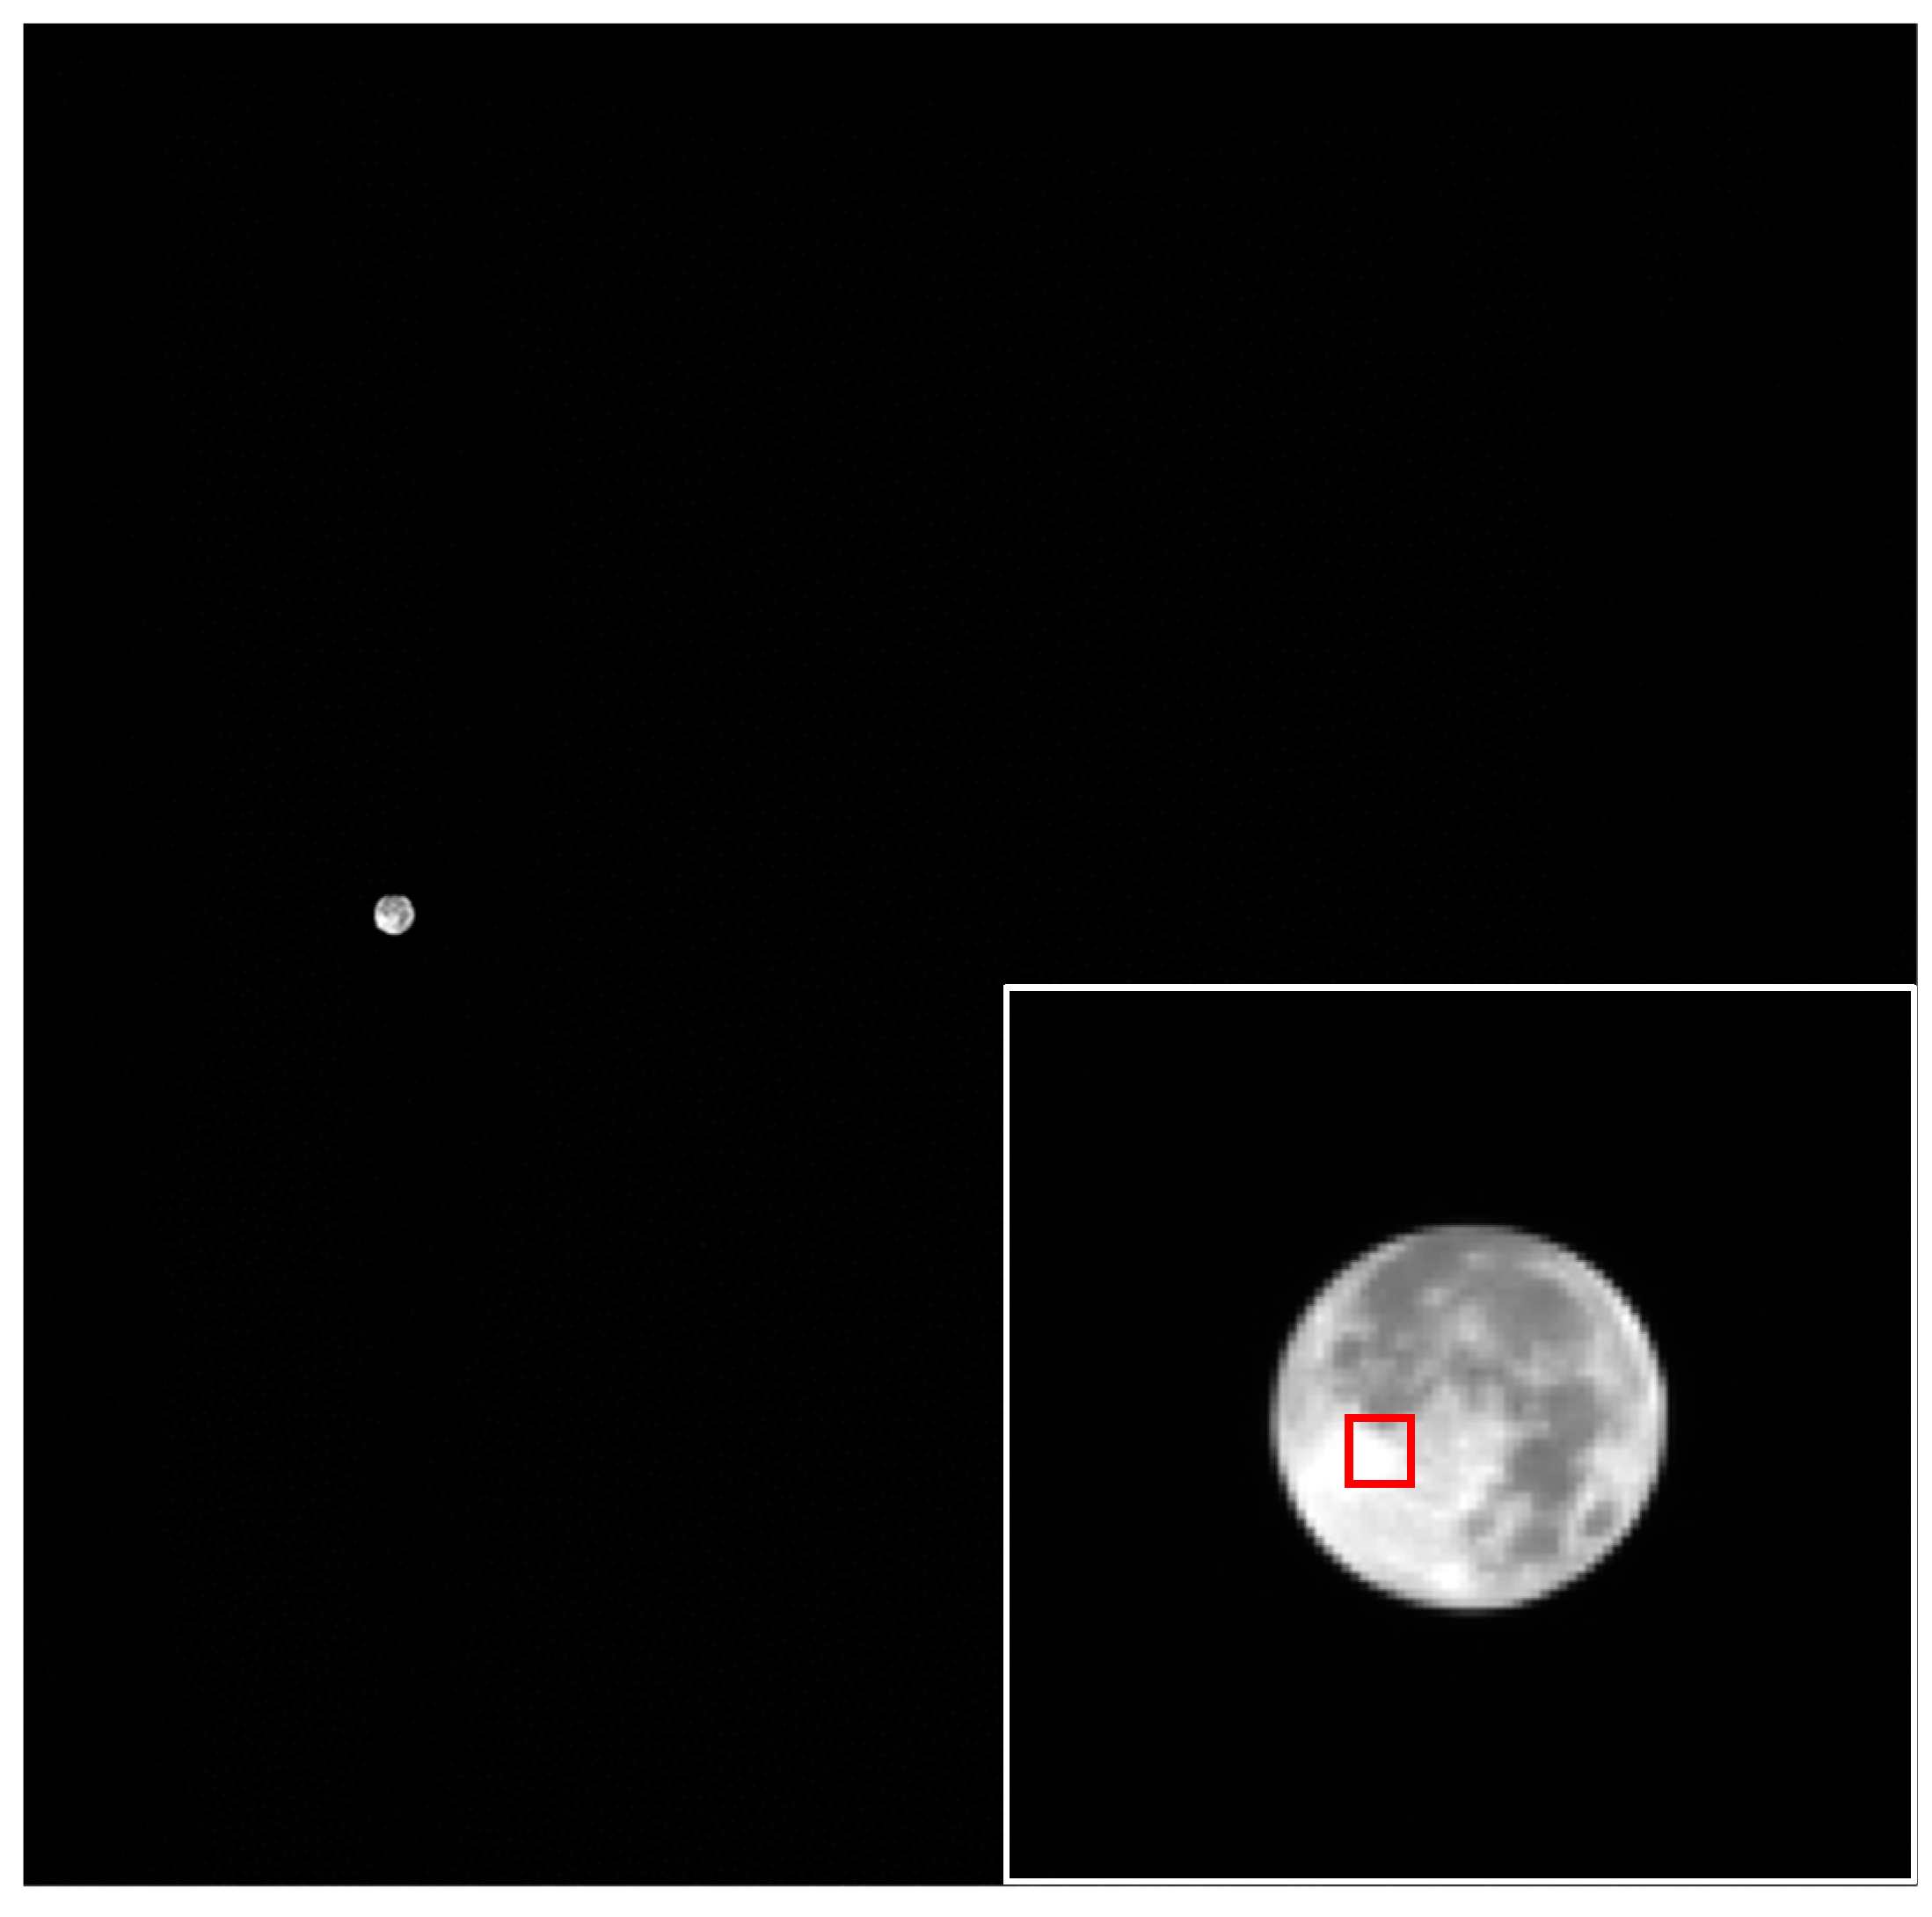
2.2. Determination of the Scope of the Moon

For satellite sensors with large observation widths, the coverage of the moon in the observation images is small, which is inconvenient for direct processing. For example, the size of a LuoJia1-01 NTL remote sensing image is 2048 × 2048, and the pixel coverage of the moon is (44−52) × (44−52); thus, all the pixels of the moon cover less than 1/40 of the entire image range, and direct processing would introduce a large amount of computation. Therefore, it is necessary to determine the scope of the moon accurately. The pixel values of the moon are generally larger than those of the surrounding deep space background; thus, the maximum pixel value based on statistical distribution occurs on the moon. Equation (3) can be used to obtain the maximum pixel value of the gray image, the coordinates of which are taken as the position of the moon (Equation (4)), and the scope of the moon can be expressed as a rectangular region composed of 40 pixels from the position of the moon extended to the east, west, north, and south, as shown in Equation (5).
MaxPixel = max ( P )
[ Maxrow , Maxline ] = Location ( P = = MaxPixel )
MoonExtent = A ( Maxrow 40 : Maxrow + 40 , Maxline 40 : Maxline + 40 )
where P is the gray matrix of the pixel value of the entire frame of the lunar image, MaxPixel is the maximum pixel value of the entire frame of the lunar image, Maxrow and Maxline are, respectively, the row and column in which the maximum pixel value of the image is located, and MoonExtent is the approximate lunar scope that is determined.

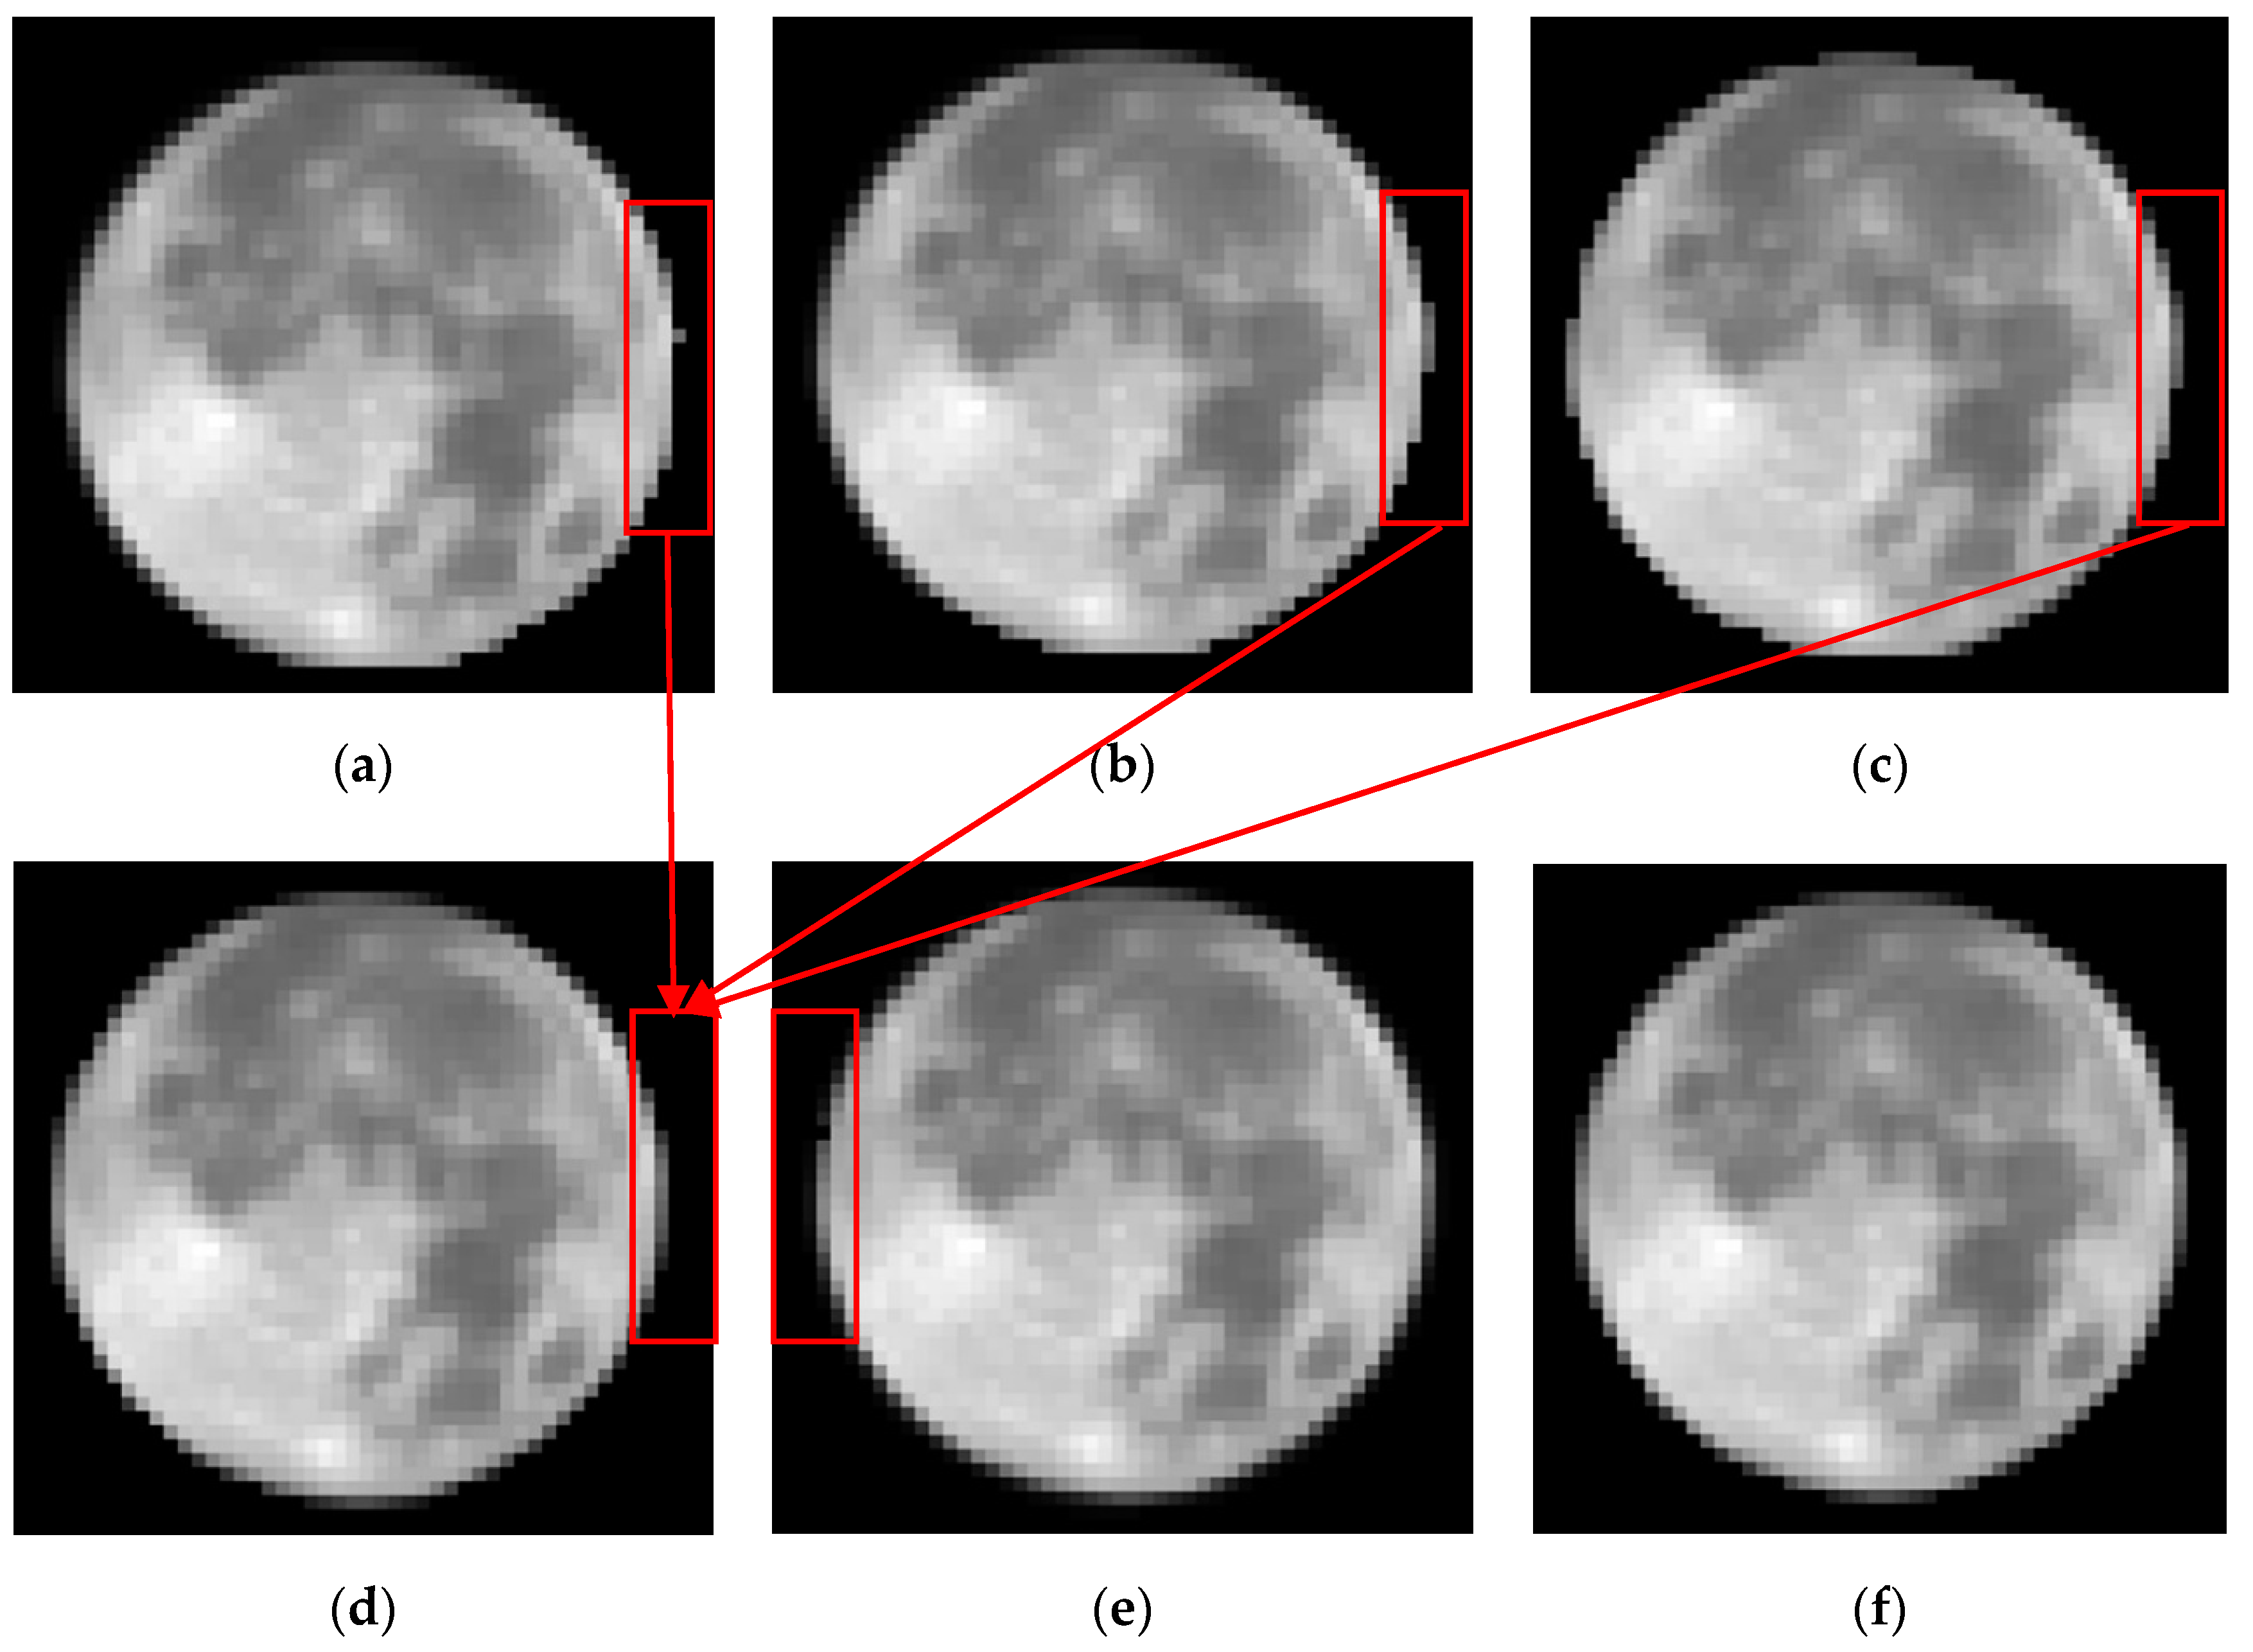
2.3. Identification of the Edge of the Moon

Within the rectangular image after determination of the scope of the moon, the moon occupies a circular area, yet the pixels in the area intersecting the rectangular range and outside the circular range are not zero, making it difficult to directly identify the real edge of the moon. The calculation of the irradiance of the moon is based on the entire lunar disk, and uncertainty with respect to the edge would introduce great uncertainty to the calculation of the lunar radiance. If the extracted area of the lunar disk is smaller than the area of the real moon, the calculated irradiance of the moon would be slightly too small, thereby leading to the loss of real moon information, otherwise, the calculated irradiance of the moon would be somewhat large, which would introduce an additional error. Therefore, it is necessary to accurately identify the real edge of the moon to ensure that the calculation results are accurate and reliable.
At present, among many edge detection operators, the Roberts operator is simple and easy to operate. This operator is also sensitive to noise and usually produces a wide response in the area adjacent to the region containing the image edge, resulting in low edge positioning accuracy. The Laplace operator has a stronger response to isolated pixels and is only suitable for noise-free images. The Prewitt operator suppresses the noise and removes some of the false edges resulting from the pixel average, but the real edges are also smoothed. The Canny operator has strong denoising ability and can produce thinner edges, but easily cancels out the edge information during the smoothing operation. The Prewitt and Canny operators can remove the influence of noise more effectively, but smooth the real edge of the lunar disk, resulting in a recognition range smaller than the real moon. The Gaussian distribution mean square R of the LOG (Laplacian of Gaussian) operator is proportional to the width of the low-pass filter, i.e., the larger the value of R, the more significant the smoothing effect and the more effective the noise removal. However, the greater the loss of image details, the lower the edge accuracy becomes; thus, a tradeoff exists between the edge positioning accuracy and noise elimination, and it is difficult to obtain a balance. The Sobel operator can effectively eliminate the influence of noise. Moreover, the pixel position is weighted, and the positioning accuracy is high [48]. Therefore, it is suitable to identify the edge of the moon after comprehensively considering the influence of noise on the observation image and the demand for precise positioning of the edge.
The Sobel operator contains two groups of 3 × 3 matrices, which are horizontal and vertical template matrices, respectively. The radiance difference approximations of these respective matrices can be obtained by convolving with the image. The two edge detection templates are as follows:
G x = [ 1 0 + 1 2 0 + 2 1 0 + 1 ] * A   ,   G y = [ + 1 + 2 + 1 0 0 0 1 2 1 ] * A
where A is the gray matrix of the radiometric radiance value of the entire frame of the lunar image, G x and G y are, respectively, the horizontal template and the vertical template of the Sobel operator.
The horizontal and vertical grayscale values of each pixel of the image were calculated by Equation (7):
G = ( G x 2 + G y 2 )
We defined the arc of the lunar terminator by those pixels in the Sobel-filtered, where the value is over 50% of the maximum value [18].

2.4. Determination of Lunar Irradiance

The ROLO model uses polynomial fitting to convert the lunar observation data into the equivalent reflectance of the entire lunar disk related to the lunar illumination and observation geometry. The calculation formula is:
lnA k = i = 0 3 a ik g i + j 3 b jk Φ 2 j 1 + c 1 θ + c 2 ϕ + c 3 Φ θ + c 4 Φ ϕ + d 1 k e g / p 1 + d 2 k e g / p 2   + d 3 k cos ( ( g p 3 ) / p 4 )
where A k is the disk-equivalent reflectance (where k is the band index), g is the absolute phase angle, θ and ϕ are the selenographic latitude and longitude of the spacecraft, respectively, and Φ is the selenographic longitude of the sun (the terms “selenographic latitude” and “selenographic longitude” were used by Kieffer et al. [23]). In addition, a, b, c, d, and p are the fitting coefficients of the ROLO model and are determined by multi-step fitting of multiple data points in each channel of the ground-based lunar observation data by Kieffer et al. [23]. Further, i = 0 3 a ik g i represents the dependence of the basic photometric function on the phase angle, b jk Φ 2 j 1 is the dependence on the illuminated face of the moon, and c 1 θ + c 2 ϕ + c 3 Φ θ + c 4 Φ ϕ represents the influence of libration. Lastly, d 1 k e g / p 1 + d 2 k e g / p 2 represents the opposition effect, d 3 k cos ( ( g p 3 ) / p 4 ) simply addresses a correlation seen in the irradiance residuals, possibly associated with mare/highland distribution not covered by the second polynomial.

2.4.1. Correction of ROLO Model Fitting Reflectance

The reflectance spectrum of the moon is characterized by weak, broad features, whereas the reflectance spectra obtained from the ROLO fitting model have modest excursions in the wavelength between bands. Therefore, linear interpolation of the spectral reflectance fitted by the ROLO model was required. Kieffer [23] used 95% of the lunar soil and 5% of the breccia lunar rock to correct the equivalent disk reflectance of the 32 channels, improving the authenticity of the fitted spectral reflectance. The spectral reflectance correction is as follows:
R = ( Bia wav + Off wav * λ ) * R
where λ is the wavelength, R is the ROLO model reflectance, R is the adjusted reflectance, and Off wav and Bia wav are adjustment factors for each ROLO filter.

2.4.2. Calculation of Lunar Irradiance

The sun is an isotropic radiometric source, and the solar radiation received by the moon is inversely proportional to the square of the distance between the sun and the moon. Therefore, a distance correction of the lunar-equivalent reflectance was required to obtain the lunar irradiance at the standard distance. The formula is as follows:
fd = ( D M V 384400 km ) 2 * ( D S M 1   AU ) 2
I k = A k Ω m E k π * fd
where D S M is the sun–moon distance (AU),   D M V is the moon–spacecraft distance (km), and 384,400 km is the mean radius of the moon’s orbit around the earth. Further, Ω m is the solid angle of the moon at 384,400 km ( 6 . 4177 * 10 5 sr ) , E k is the solar irradiance at 1AUs (derived from the model of Wehrli), I k is the lunar irradiance at a standard distance.

2.4.3. Spectral Matching

The spectral response functions of a ROLO ground-based lunar observation instrument and the remote sensing satellite sensor are different, resulting in the same spectral radiance input and different radiance output. Therefore, it was necessary to match the spectrum of the ROLO ground-based lunar observation instrument and remote sensing satellite sensor to reduce the spectral difference and obtain the irradiance at the effective wavelength of the remote sensing satellite sensor.
Irr rolo = λ 1 λ 2 I k ( λ ) * SRF ( λ ) d λ λ 1 λ 2 SRF ( λ ) d λ
where Irr rolo is the spectral irradiance of the ROLO model at the effective wavelength, and SRF ( λ ) is the spectral response of LuoJia1-01 at wavelength λ .

2.4.4. Calculation of the Irradiance of Lunar Observation

After edge identification and radiometric correction, the radiance of each pixel was obtained. The integral of the radiance of each pixel at the solid angle was calculated to obtain the observed irradiance:
Irr obs = Ω p i = 1 N p L i f
where Irr obs is the observed lunar irradiance, Ω p is the solid angle of each pixel, N p is the number of pixels in the lunar disk, L i is the radiance after laboratory absolute radiometric correction of the ith pixel, and f is the oversampling factor.

2.5. Assessment Methods

The response relation model between the radiance of each frame calculated by the ROLO model and the DN value observed by the remote sensing sensor was established. The radiance calibration coefficient of the remote sensing sensor could be obtained by using the least-squares method, as shown by the following equation:
Slope = Lrolo DN = Irr rolo / Ω M Ω P ( i = 1 N p ( DN rel corr ( i ) B 1 ( i ) ) )
where B 1 ( i ) is the offset of a single-pixel in the absolute calibration of the laboratory measurement, and Slope represents the coefficient of variation of the model radiance and the observed lunar pixel value.
The accuracy of the lunar calibration was evaluated by comparing the deviation of the irradiance Irr obs of the lunar observation of the LuoJia1-01 NTL sensor and the irradiance Irr rolo of the ROLO model, as a reference. Equation (15) was used for this purpose.
Δ Irr = ( Irr rolo Irr obs ) * 100 %
where Δ Irr denotes the consistency between the lunar calibration results of the sensor and the radiometric calibration results obtained in the laboratory. Based on a long-term sequence of lunar observations by the sensor, this value could be used to track the on-orbit radiometric response degradation of the sensor.
Because the absolute radiometric calibration uncertainty of the ROLO model is large, the error of using the absolute value to evaluate the calibration deviation is large. However, its relative stability can reach 1–2% [50]. Therefore, the change in radiometric response of the sensor was expressed by Equation (16). A linear fitting formula was used to calculate the total radiometric response degradation of the instrument D total (Equation (17)).
D ( t ) = Irr obs ( t ) Irr rolo ( t ) · Irr rolo ( t 0 ) Irr obs ( t 0 ) · 100 %
D total = ( lf end     lf start ) lf start * 100 %
where Irr obs ( t 0 ) and Irr obs ( t ) , respectively, are the satellite observation lunar irradiance at the initial moment t 0 and moment t , Irr rolo ( t 0 ) and Irr rolo ( t ) , respectively, are the irradiance observed by the ROLO model at the initial moment t 0 and moment t , and D ( t ) is the change in the radiometric response of the instrument at the moment t . Here, lf is the linear fitting formula, and start and end are the start time and the end time, respectively, of lunar observation.

3. Results

The data used in this section are lunar observation data generated by LuoJia1-01. These data were used to calibrate the radiance detected by the NTL sensor of LuoJia1-01 based on the ROLO lunar irradiance model. The calibration accuracy was verified by four sets of data, and preliminary evaluation of the stability of the LuoJia1-01 NTL sensor was conducted for nearly one year.

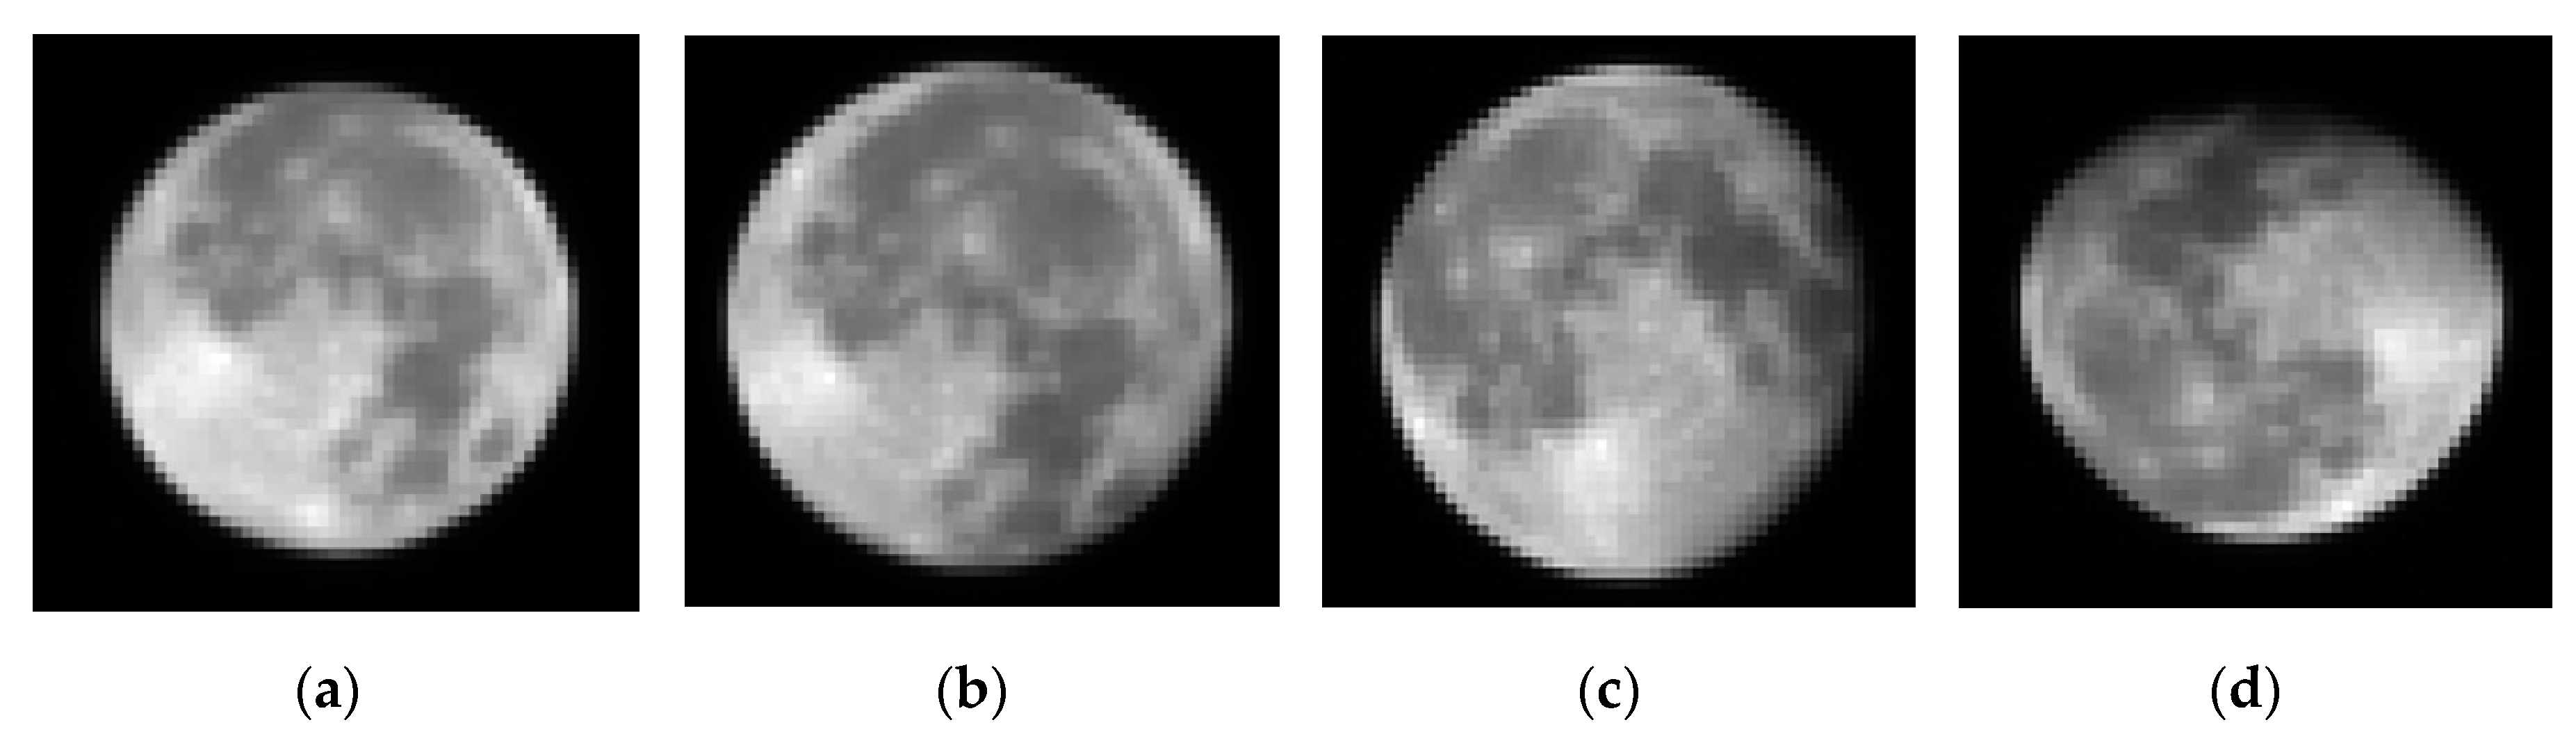
3.1. Data Introduction

Several lunar observations were performed by LuoJia1-01. The duration of each observation was approximately 60 seconds (the first 14 seconds of data were transmitted to the ground station), the frame frequency was 0.1 second, and 146 frames of valid data were obtained in a single observation. The spatial position of the satellite in several successive frames of lunar observation did not change significantly. Therefore, 10–22 frames, each of which was obtained from images with almost constant spatial position, were selected for experimental processing and analysis.
The geometric relationship, between the moon, the sun, and the sensor, is such that when the lunar phase angle is large, the illuminated area of the moon is small, and the radiance is small, which would introduce uncertainties. Therefore, the lunar phase angle is confined to a limited range of values [2.8°–33.9°], which ensures that the illuminated part of the moon is larger than 90%. Finally, the lunar data recorded by LuoJia1-01 on 27 June, 2018, 23 November, 2018, 22 March, 2019, and 21 May, 2019 were selected. Figure 4 shows lunar data acquired by LuoJia1-01 corresponding to the four observation datasets, and the detailed parameters of the lunar observation are provided in Table 2.

3.2. Radiometric Correction

The LuoJia1-01 laboratory calibration coefficients were applied to the raw lunar images based on Equations (1) and (2). The correction results are shown in Figure 5 (ENVI 1% linear stretch display), which eliminates the influence of systematic errors, such as detector dark current, hot pixels, striping from detector non-uniformity, and vignetting artifacts [17], from the original image. The pixels of the moon and the surrounding background after relative correction were uniformly distributed. The lunar radiance distribution of L1a after absolute radiometric correction is shown in Figure 6, in which the radiance of the non-moon region was practically zero, and the radiance of the lunar region was distributed in the range 0 0 . 1 ( W * m 2 * nm 1 * sr 1 ) .

3.3. Determination of the Scope and Identification of the Edge of the Moon

According to Equations (3)–(5), the maximum radiance of the image after the radiometric correction was 9 . 25 * 10 2 ( W * m 2 * nm 1 * sr 1 ) . The lunar image and the extracted scope of the moon are shown in Figure 7. The approximate position coordinate of the largest pixel value was (983,401) (as is shown in the red box in Figure 7). The approximate rectangular range of the moon was (930:1030,360:460) (as is shown in the white box in Figure 7), and a rectangular zone of 80 × 80 was obtained.
Figure 7 indicates that the extracted scope of the moon was approximately 1/30 of the image. Yet, all the information about the moon was retained because the edge left 20–30 pixels of space background. The amount of data was greatly reduced, thereby improving the accuracy of lunar edge identification.
Most of the background pixels of the corrected moon images were zero, but a few pixels were not zero because of the influence of space count (instrument response to zero radiance), which complicates lunar edge identification. The Sobel operator with good edge positioning accuracy and anti-noise effect was chosen to extract the real edge of the moon, and the results were compared with those of the other edge extraction operators. Figure 8 shows that the edge on the right-hand side of the moon recognized by the Roberts, Log, and Canny operators was smoothed. The left edge obtained with the Laplace operator had a few missing pixels, which means the information of the moon was incomplete. The edges identified by the Sobel and Prewitt operators were basically consistent with the contour of the moon, and the moon was retained to the maximum extent. Comparing the edge recognition effect, the Sobel operator could accurately identify the edge of the moon. Two three-dimensional histograms were presented to show the radiance distribution of the moon before Figure 9a and after edge identification Figure 9b, and the figure shows that the structural features of the lunar surface were greatly preserved.

3.4. Determination of Lunar Irradiance

The oversampling factor can be determined by the relative motion of the satellite in the east-west and north-south direction during imaging [46]. The sunsynchronous satellite in the north-south direction relies on the motion of the satellite to image, with 2048 lines included in each imagery, and with each row nearly requiring 0.05ms. During the completion of a row of lunar observations, the satellite moves 5.57*10−10° along with the sun in the north-south direction. The moon appears to be a stationary object relative to the sensor, and the oversampling has not existed in a single row. There are nearly 50 lines for the entire lunar disk that take 2.4*10−3s. The satellite moves 2.74*10−8° along with the sun. The relative motion between the spacecraft and the moon in the east-west direction is mainly due to the 23.45° ± 5.15° angles between the lunar orbital plane and the orbital plane of the earth, i.e., within 2.4*10−3s of imaging, the moon rotates around the earth 3.67*10−7°. Thus, the projected displacement in the north-south and east-west direction is negligible. There is no need for oversampling correction in the single line and the whole lunar observation, but the whole image has a movement from north to south to west. Furthermore, the oversampling factor can be determined from the size in the image itself [23]. The diameter in the east-west direction differs by less than one pixel from the diameter in the north-south direction of LuoJia1-01. Therefore, the observed images were not corrected for oversampling and f   =   1 for LuoJia1-01 in Equation (13).
As in Equation (8), the calculation of equivalent-disk reflectance required the lunar phase angle g, the selenographic latitude θ, and the selenographic longitude ϕ of the spacecraft, the selenographic longitude Φ of the sun, where the lunar phase angle g is the angle between the “sun–moon” and “spacecraft–moon” vectors, the lunar phase angle observed by LuoJia1-01, which ranged from 2.8° to 33.9°, and the illuminated area of the moon to be over 90%. The other parameters were obtained by a celestial coordinate transformation. The sun–moon distance and moon–spacecraft distance were calculated based on the J2000 coordinates of the sun, the moon, and the sensor, and then, the distance correction factors could be obtained based on Equation (10), and the lunar irradiance at the standard distance could be determined based on Equation (11). The relevant parameters of the lunar observation geometry and process variables are listed in Table 3.
The equivalent-disk reflectance of the 32 channels, which was calculated based on the ROLO irradiance model (Equation (8)) at g = 7 ° , Φ = 7 ° , θ = 0 ° , and ϕ = 0 ° (shown as a blue curve in Figure 10), had modest excursions in wavelength between bands. A reflectance curve (represented by the black curve in Figure 10) mixed by 95% of the lunar soil (Apollo 16 sample 62231) (as shown by the orange curve in Figure 10) [23] and 5% of breccia rock (Apollo 16 sample 67455) (represented by the deep blue curve in Figure 10) [23] was used to adjust the ROLO equivalent-disk reflectance curve. The adjusted reflectance curve is the red curve in Figure 10, and the average correction ratio of the 32 channels was 3.5%.

3.5. Radiance Calibration and Sensor Stability Evaluation

Once the lunar radiance and the lunar disk DN are known, the radiance calibration model (Equation (14)) could be solved to obtain the radiance conversion coefficients of LuoJia1-01. The fitting model, which refers to the measurements on 27 June, 2018, 23 November, 2018, 22 March, 2019, and 21 May, 2019, is shown in Figure 11. The ROLO radiance and DN showed a linear positive correlation, and the values of the correlation coefficient R 2 were 0.9586, 0.9314, 0.8919, and 0.9339 respectively, indicating that the radiance and DN were highly correlated with excellent fitting and high reliability.
The results of the radiance calibration model were in good agreement with the laboratory calibration. The consistency of the irradiance I r r r o l o of the ROLO and the irradiance I r r o b s of LuoJia1-01, which is presented in Table 4, was greater than 90% in all the cases. The result was consistent with the 5%–10% uncertainty in the absolute accuracy of the ROLO model [50,51]. All frames of each dataset were used to calculate the radiance calibration coefficients, and the volatility of the calibration results between frames within each dataset was also evaluated. The standard deviation of the calibration results for each frame of the four datasets were 1.39%, 1.08%, 0.56%, and 0.20%, respectively, with slight fluctuation and excellent stability of each dataset with different frames.
Although the uncertainty of the absolute radiometric accuracy of the ROLO model was large, its relative stability could reach 1–2%. MODIS, VIIRS/NPP, and other instruments all adopt this method to monitor the change in radiometric response [50,51]. Therefore, this absolute calibration deviation could be normalized to evaluate the radiometric response degradation of the LuoJia1-01 NTL sensor (Equations (16) and (17)). Figure 12 intuitively shows that, during the experiment, the spectral channel of LuoJia1-01 underwent obvious radiometric response degradation, with the degradation of 6.56% during nearly one year from 27 June 2018 to 21 May 2019.
The Luojia1-01 is a sun-synchronous satellite, with an orbit altitude of 650-km, at which the influence of radiation attenuation caused by atmospheric absorption and scattering, and radiometric superposition caused by atmospheric background radiation during lunar observation are largely avoided [49]. Furthermore, the characteristics of Luojia1-01 reduce the fundamental limitation to the absolute accuracy achievable with the ROLO dataset caused by atmospheric correction.
The moon calibration plan requires a specific phase angle to be selected for lunar observation. This is because, the lunar phase varies in some ranges during actual operation, which would introduce uncertainty in the calculation of the irradiance. In addition, the lunar phase angle would affect the illuminated area of the observed image, and the surface reflectance in different regions would also be different on account of the uneven distribution of highlands and maria on the moon. Therefore, the lunar phase angle also exerts a certain influence on the reflectance of the observed surface of the moon. The phase angle in this study ranges from 2.8° to 33.9°, i.e., 2.83°, 10.57°, 24.30°, and 33.86°, respectively, and changes in a large range of different datasets. Because these edge pixels lie upon the illuminated arc of the full circle of the lunar terminator, when the phase angle is large, the edge recognition of the observed image with weak intensity illumination is rough and contributes considerable uncertainty to the irradiance determined from “full disk” images of the moon.
The dependence of the phase angle could be expressed by comparing the radiometric calibration consistency Δ I r r and the lunar phase angle g. As shown in Figure 13, as the phase angle increased, the change in radiometric response decayed in an approximately linear manner. The phase angle dependence of Δ I r r , which is the largest at 6.56% (31.15°), was measured by performing a linear fit using Δ I r r ( g ) = p 1 * g + p 0 (where p 1 is the variation of Δ I r r ( g ) over a phase angle dependence of 1°) [52]. In this study, we corrected the phase angle dependence by using the value of p 1 , after which we measured the change in radiometric response. The results are presented in Table 5.
The impact of the correction on the result was large, and it could be quantified by comparing the extent to which the standard deviation of the residuals corresponds to the change in the radiometric response of the four datasets before and after the correction of the lunar phase angle dependence. After correction, the residual standard deviation σ reduced from 4.65% to 2.88%. In addition, the change in the radiometric response of the LuoJia1-01 NTL sensor could be measured with slightly higher precision, i.e., the change in the radiometric response of the instrument over nearly one year was corrected from 6.56% to 6.31%, eliminating the additional uncertainty and improving the accuracy of the lunar radiometric calibration.

4. Discussion

As seen in Table 6, the spectral width of most of the original ROLO visible near-infrared channels was 10–30nm. Therefore, the application of the ROLO irradiance model was more effective for radiometric calibration of multi-spectral images with narrower channels. However, in the case of many on-orbit remote sensing instruments with wider spectral channels, such as the GMS-5 visible spectrum channel width of 350nm and the LuoJia1-01 spectrum channel width of 445nm, spectral matching could not be directly performed based on close proximity to the central wavelength, and the similarity of the spectrum should also be taken into account. Currently, spectral matching of on-orbit instruments could be achieved only by using simple inter-band interpolation techniques, especially for single-channel instruments, such as that on LuoJia1-01. The interpolation result with 1-nm intervals originated from the reflectance of the central wavelength of the 32 channels based on the ROLO lunar observation, which was spectrally matched with the spectral response of the LuoJia1-01, and the influence of the interval between the ROLO multichannel bands was not considered. Further research would be dedicated to determining the weight of spectral matching of the different channels of on-orbit instruments to reduce the differences in the spectrum.
The reflectance of highlands and maria on the surface of the moon is inconsistent. The reflectance of the maria is low, and the values of edge and background pixels are not obvious. Furthermore, these edge pixels lie upon the illuminated arc of the full circle of the lunar terminator. The relative geometric position of the sun, the moon, and the sensor continuously change; consequently, the less-illuminated edge of the moon cannot be recognized by the edge recognition operator, and can only be fitted by the illuminated arc of the highlands of the moon of which the pixels differ significantly from the pixels of the surrounding background. For the data of orbit-354, the blurred appearance of the upper edge, that corresponds to maria, is obtained by fitting the recognized three-quarters arc by the Sobel operator, in which case correction for oversampling or under-sampling of the lunar observation of LuoJia1-01 is not required, with a relatively small error. If the lunar observation images are affected by oversampling or under-sampling, the obscured edge of the less illuminated part of the maria not only affects edge recognition of the image, it also causes the oversampling factor to become overly large or small, thereby contributing a large amount of uncertainty to the experimental results.

5. Conclusions

Based on a ROLO prototype, this study established a radiometric calibration model using the radiance and the DN value observed by the LuoJia1-01 NTL sensor. The study solved the problem associated with the on-orbit absolute radiometric calibration of the LuoJia1-01 NTL sensor that arises because of the lack of on-satellite calibration equipment and the absence of an absolute radiometric calibration light source at night. In addition, both, the deviation of the irradiance observed from the ROLO model and the irradiance detected by LuoJia1-01 lunar observation, were used to detect the change in the on-orbit radiometric response. The model proposed in this paper was based on the radiometric stability of the moon and the high-precision ROLO model that quantifies the influences of the libration, the phase angle, the geometric distance, and other characteristics of the moon. The results demonstrated that the on-orbit radiometric calibration of the LuoJia1-01 using the moon as a stable radiation source was highly consistent with the result of the laboratory calibration:
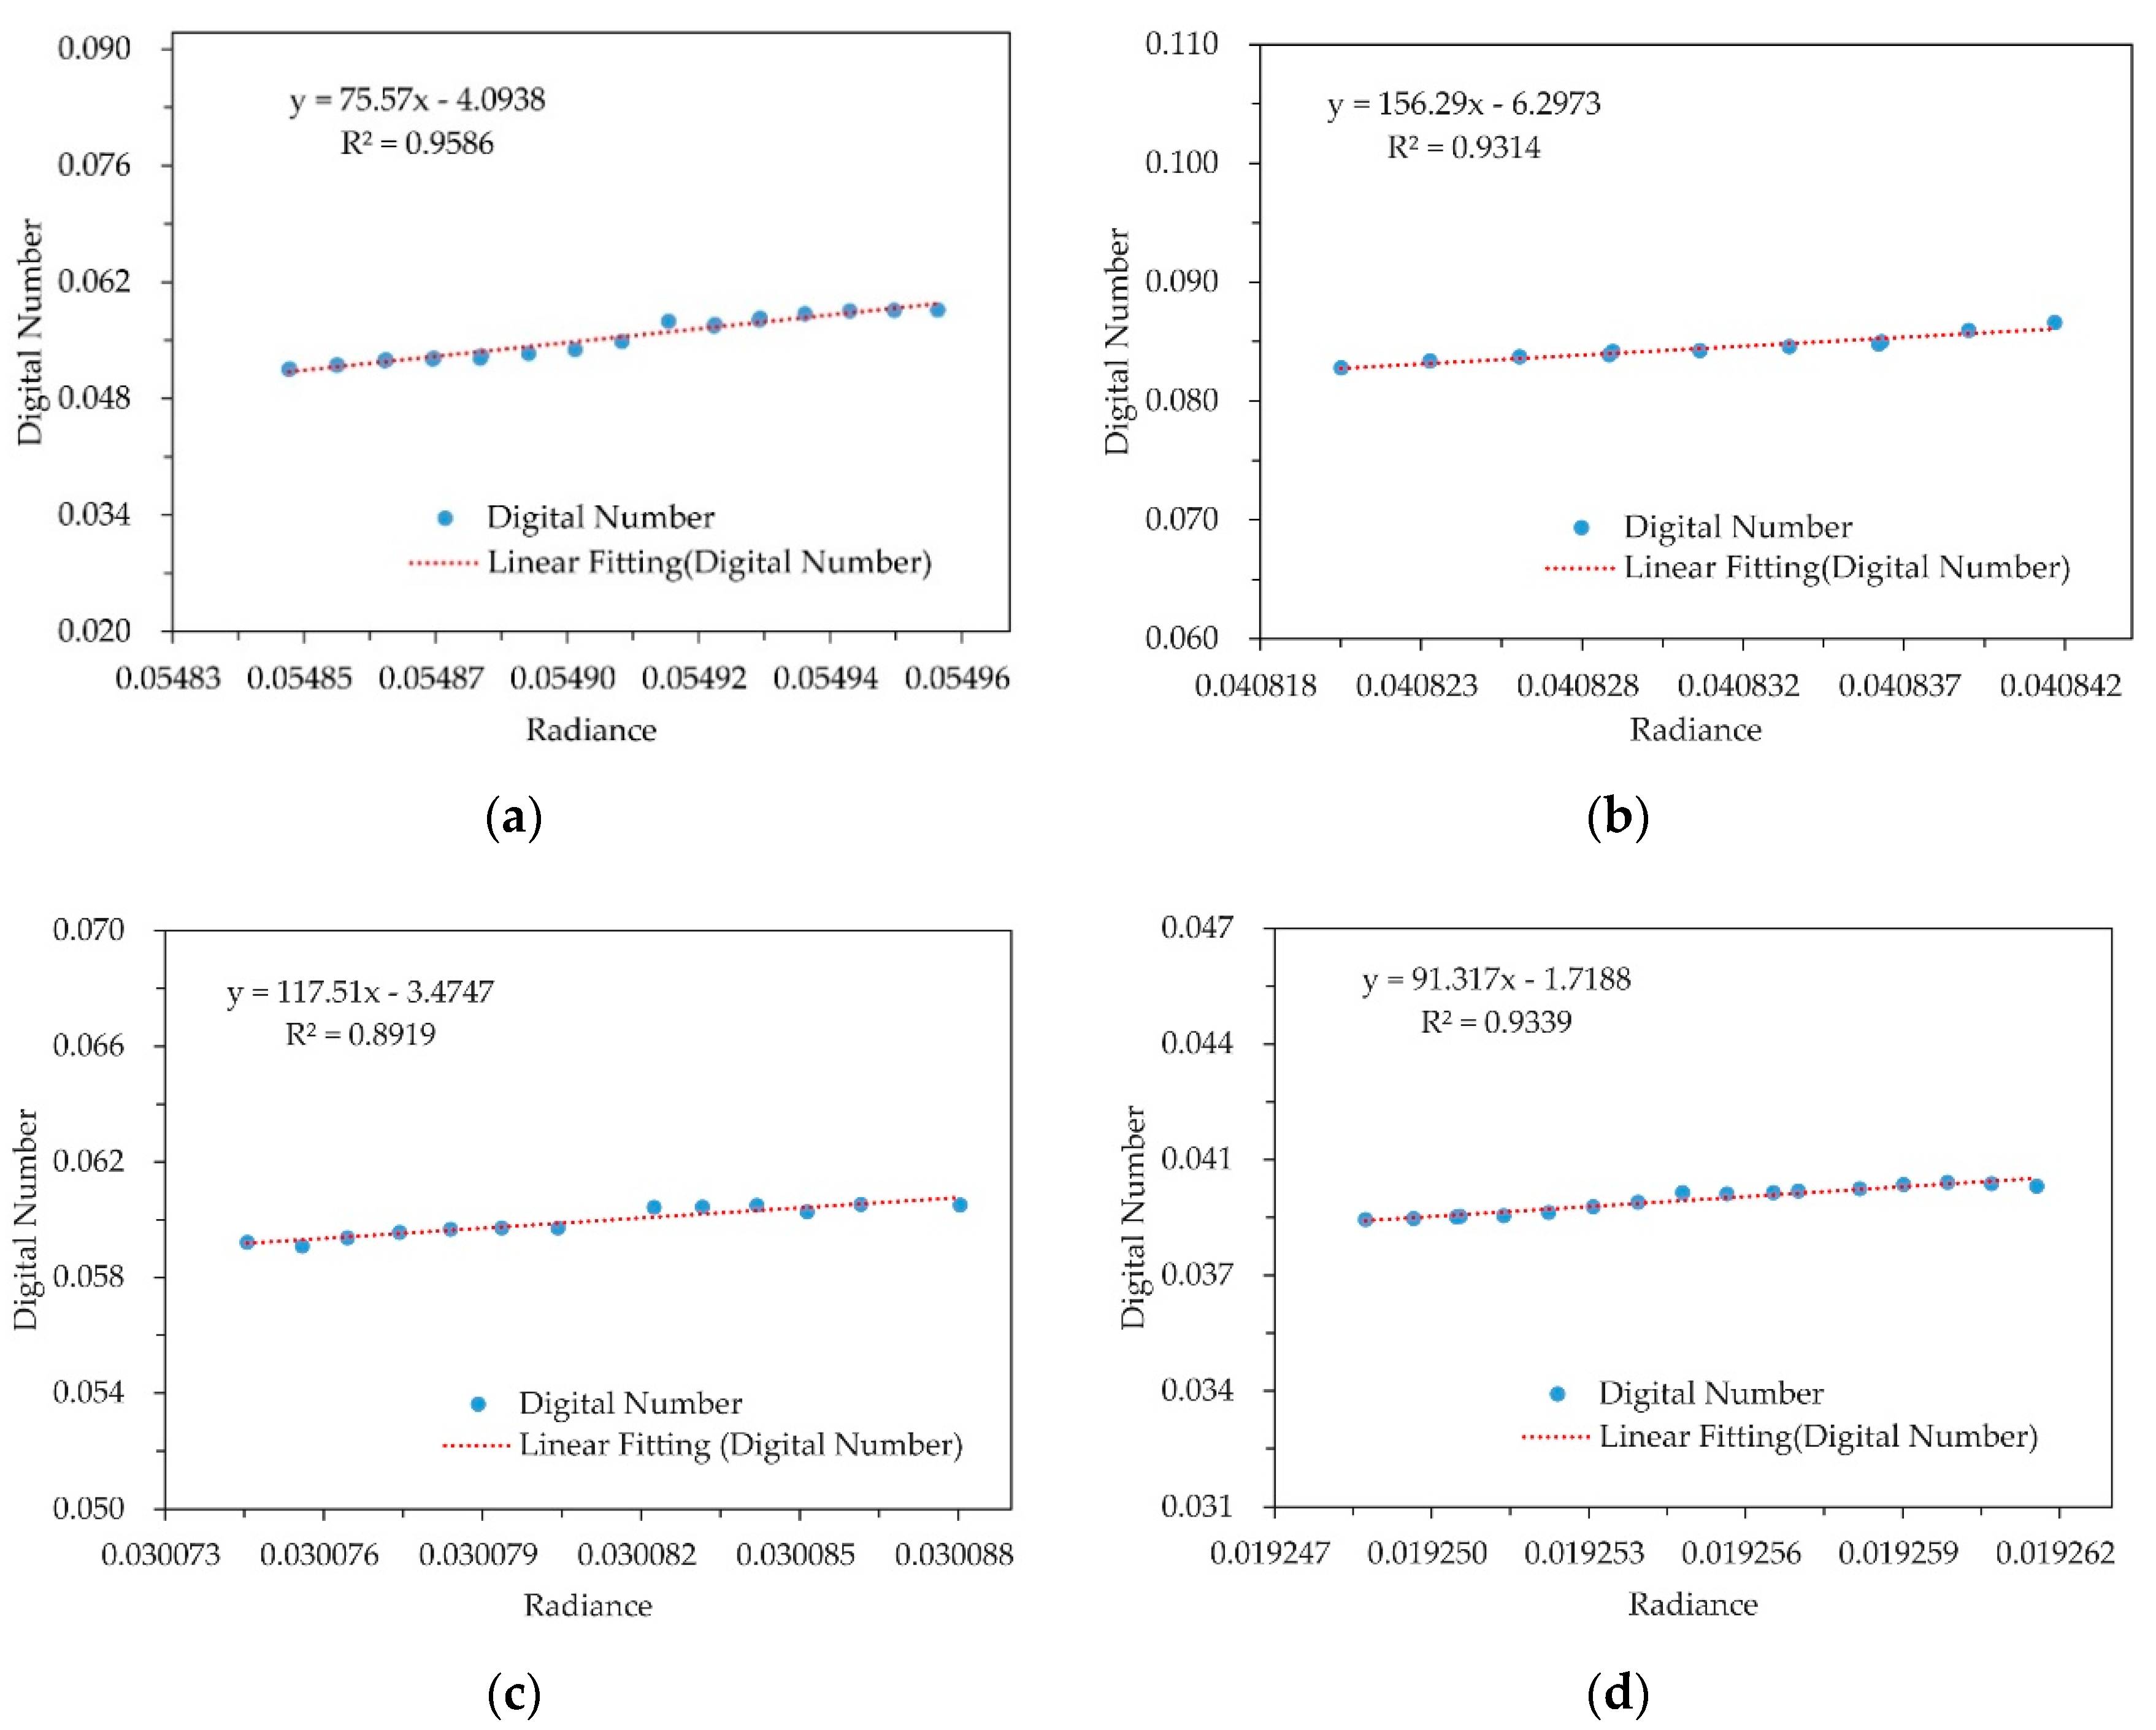
  • The radiance and the DN values of the different frame images of the four datasets showed a positive linear correlation.
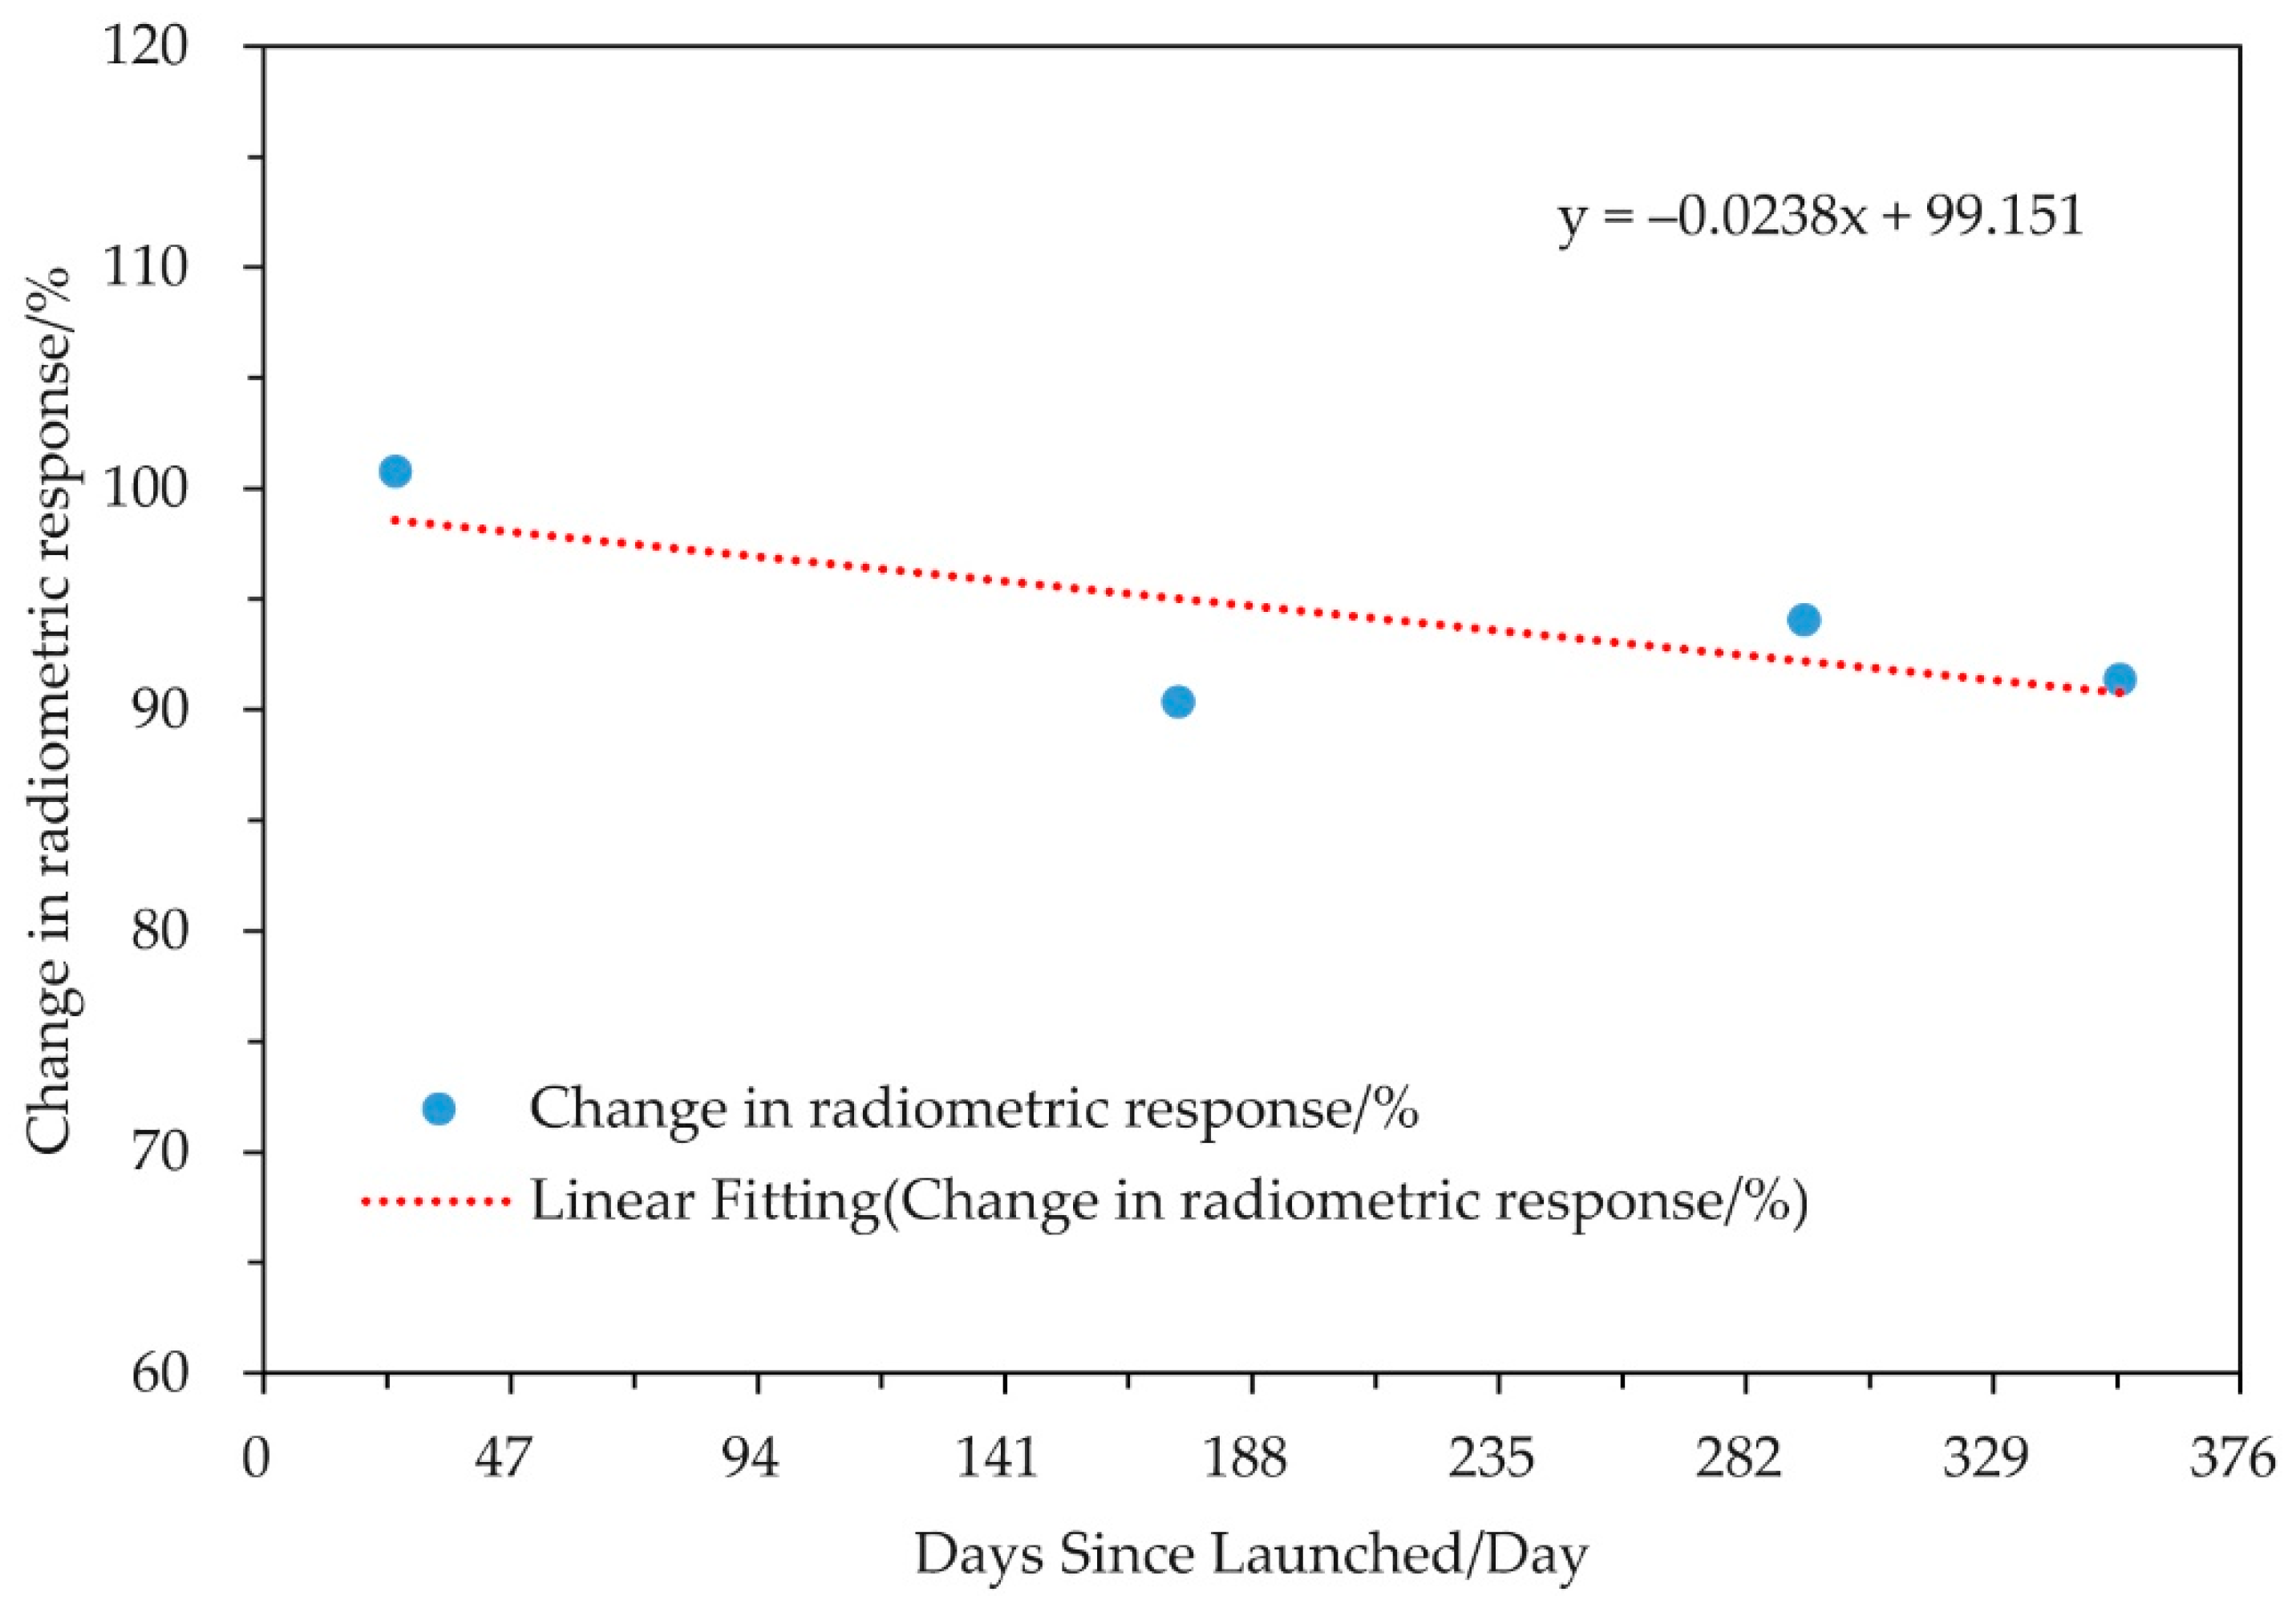
  • The consistency of lunar observation irradiance and model irradiance of the four groups of experimental data was 100.77%, 90.35%, 94.06%, and 91.36%, respectively, all of which exceeded 90%.
  • The LuoJia1-01 spectral channel underwent obvious radiometric response degradation, which was determined to be 6.31% for nearly one year from 27 June 2018 to 21 May 2019.
This study showed that on-orbit radiometric calibration based on lunar observation was an effective method for the calibration of the sensors. Specific solutions were proposed for the problems caused by the large observation breadth of the LuoJia1-01 sensors, small moon coverage area, and a large volume of data that requires direct processing. Furthermore, our solution effectively reduced the uncertainty caused by the dependence on the lunar phase angle. It would be worthwhile to further investigate and quantitatively apply the data acquired by the LuoJia1-01 NTL sensor.

Author Contributions

Y.H.J. and M.X. conceived and designed the experiments; Y.S. and L.L. performed the experiments; Y.H.J., L.L., W.Z. and Y.J. analyzed the data; Z.L. analyzed the experiment; L.L. contributed analysis tools; Y.S. and Y.H.J. wrote the paper.

Funding

This research was funded by the Key Research and Development Program of the Ministry of Science and Technology, grant number 2016YFB0500801; National Natural Science Foundation of China, grant numbers 41971412, 41601490; Chinese Universities Scientific Fund, grant number 2042019kf0209.

Acknowledgments

The authors thank the anonymous reviewers for their constructive comments and suggestions.

Conflicts of Interest

The authors declare no conflict of interest.

References

  1. Zheng, Q.; Weng, Q.; Wang, K. Developing a new cross-sensor calibration model for DMSP-OLS and Suomi-NPP VIIRS night-light imageries. ISPRS J. Photogramm. Remote Sens. 2019, 153, 36–47. [Google Scholar] [CrossRef]
  2. Huang, X.; Schneider, A.; Friedl, M.A. Mapping sub-pixel urban expansion in China using MODIS and DMSP/OLS nighttime lights. Remote Sens. Environ. 2016, 175, 92–108. [Google Scholar] [CrossRef]
  3. Pandey, B.; Joshi, P.K.; Seto, K.C. Monitoring urbanization dynamics in India using DMSP/OLS night time lights and SPOT-VGT data. IJAEO 2013, 23, 49–61. [Google Scholar] [CrossRef]
  4. Zheng, Z.H.; Chen, Y.B.; Wu, Z.F.; Ye, X.Y.; Guo, G.H.; Qian, Q.L. The desaturation method of DMSP/OLS nighttime light data based on vector data: Taking the rapidly urbanized China as an example. Int. J. Geogr. Inf. Sci. 2019, 33, 431–453. [Google Scholar] [CrossRef]
  5. Ye, H.Y.; Huang, Z.Q.; Huang, L.L.; Lin, L.J.; Luo, M. Effects of urbanization on increasing heat risks in South China. Int. J. Clim. 2018, 38, 5551–5562. [Google Scholar] [CrossRef]
  6. Hu, T.; Huang, X. A novel locally adaptive method for modeling the spatiotemporal dynamics of global electric power consumption based on DMSP-OLS nighttime stable light data. Appl. Energy 2019, 240, 778–792. [Google Scholar] [CrossRef]
  7. Wang, X.; Liu, G.; Coscieme, L.; Giannetti, B.F.; Hao, Y.; Zhang, Y.; Brown, M.T. Study on the emergy-based thermodynamic geography of the Jing-Jin-Ji region: Combined multivariate statistical data with DMSP-OLS nighttime lights data. Ecol. Model. 2019, 397, 1–15. [Google Scholar] [CrossRef]
  8. Shi, K.F.; Yang, Q.Y.; Fang, G.L.; Yu, B.L.; Chen, Z.Q.; Yang, C.S.; Wu, J.P. Evaluating spatiotemporal patterns of urban electricity consumption within different spatial boundaries: A case study of Chongqing, China. Energy 2019, 167, 641–653. [Google Scholar] [CrossRef]
  9. Kumar, P.; Sajjad, H.; Joshi, P.K.; Elvidge, C.D.; Rehman, S.; Chaudhary, B.S.; Tripathy, B.R.; Singh, J.; Pipal, G. Modeling the luminous intensity of Beijing, China using DMSP-OLS night-time lights series data for estimating population density. PCE 2019, 109, 26–34. [Google Scholar] [CrossRef]
  10. Zhao, N.; Samson, E.L.; Liu, Y. Population bias in nighttime lights imagery. Remote Sens. Lett. 2019, 10, 913–921. [Google Scholar] [CrossRef]
  11. Liu, A.S.; Wei, Y.; Yu, B.L.; Song, W. Estimation of Cargo Handling Capacity of Coastal Ports in China Based on Panel Model and DMSP-OLS Nighttime Light Data. Remote Sens. 2019, 11, 582. [Google Scholar] [CrossRef]
  12. Zhao, J.C.; Ji, G.X.; Yue, Y.L.; Lai, Z.Z.; Chen, Y.L.; Yang, D.Y.; Yang, X.; Wang, Z. Spatio-temporal dynamics of urban residential CO2 emissions and their driving forces in China using the integrated two nighttime light datasets. Appl. Energy 2019, 235, 612–624. [Google Scholar] [CrossRef]
  13. Wang, S.J.; Shi, C.Y.; Fang, C.L.; Feng, K.S. Examining the spatial variations of determinants of energy-related CO2 emissions in China at the city level using Geographically Weighted Regression Model. Appl. Energy 2019, 235, 95–105. [Google Scholar] [CrossRef]
  14. Ouyang, Z.T.; Lin, M.M.; Chen, J.Q.; Fan, P.L.; Qian, S.S.; Park, H. Improving estimates of built-up area from night time light across globally distributed cities through hierarchical modeling. Sci. Total Environ. 2019, 647, 1266–1280. [Google Scholar] [CrossRef] [PubMed]
  15. Zhong, Y.; Lin, A.W.; Zhou, Z.G. Evolution of the Pattern of Spatial Expansion of Urban Land Use in the Poyang Lake Ecological Economic Zone. Int. J. Environ. Res. Public Health 2019, 16, 117. [Google Scholar] [CrossRef] [PubMed]
  16. Zhou, Y.Y.; Li, X.C.; Asrar, G.R.; Smith, S.J.; Imhoff, M. A global record of annual urban dynamics (1992–2013) from nighttime lights. Remote Sens. Environ. 2018, 219, 206–220. [Google Scholar] [CrossRef]
  17. Zhang, G.; Li, L.; Jiang, Y.; Shen, X.; Li, D. On-Orbit Relative Radiometric Calibration of the Night-Time Sensor of the LuoJia1-01 Satellite. Sensors 2018, 18, 4225. [Google Scholar] [CrossRef]
  18. Xiong, X.; Sun, J.; Fulbright, J.; Wang, Z.; Butler, J.J. Lunar Calibration and Performance for S-NPP VIIRS Reflective Solar Bands. ITGRS 2016, 54, 1052–1061. [Google Scholar] [CrossRef]
  19. Hu, S.; Ma, S.; Yan, W.; Lu, W.; Zhao, X. Feasibility of a specialized ground light source for night-time low-light calibration. Int. J. Remote Sens. 2018, 39, 2543–2559. [Google Scholar] [CrossRef]
  20. Kieffer, H.H. Photometric Stability of the Lunar Surface. Icarus 1997, 130, 323–327. [Google Scholar] [CrossRef]
  21. Kadowaki, N.; Larouche, M.; Girard, F.; Grandmont, F.; Veilleux, J.; Taylor, J.; Bourque, H.; Moreau, L. Instrument demonstration effort for the CLARREO mission. In Proceedings of the International Conference on Space Optics—ICSO 2010, Rhodes Island, Greece, 4–8 October 2010. [Google Scholar] [CrossRef]
  22. Karafolas, N.; Sodnik, Z.; Cugny, B.; Barnes, A.; Lobb, D.; Smith, D.; Russell, J.; Brindley, H.; Green, P.; Fox, N.; et al. Traceable radiometry underpinning terrestrial and heliostudies (truths): A bencmark mission for climate. In Proceedings of the International Conference on Space Optics—ICSO 2014, Tenerife, Spain, 6–10 October 2014. [Google Scholar] [CrossRef]
  23. Kieffer, H.H.; Stone, T.C. The Spectral Irradiance of the Moon. Astron. J. 2007, 129, 2887–2901. [Google Scholar] [CrossRef]
  24. Cao, C.; Bai, Y.; Wang, W.; Choi, T. Radiometric Inter-Consistency of VIIRS DNB on Suomi NPP and NOAA-20 from Observations of Reflected Lunar Lights over Deep Convective Clouds. Remote Sens. 2019, 11, 934. [Google Scholar] [CrossRef]
  25. Barreto, A.; Cuevas, E.; Damiri, B.; Guirado, C.; Berkoff, T.; Berjón, A.J.; Hernández, Y.; Almansa, F.; Gil, M. A new method for nocturnal aerosol measurements with a lunar photometer prototype. Atmos. Meas. Tech. 2013, 6, 585–598. [Google Scholar] [CrossRef] [Green Version]
  26. Zhang, L.; Zhang, P.; Hu, X.Q.; Chen, L.; Wang, Y.; Wang, W. Comparison of lunar irradiance models and validation of lunar observation on Earth. J. Remote Sens. 2017, 21, 864–870. [Google Scholar] [CrossRef]
  27. Grant, I.F.; Kieffer, H.H.; Stone, T.C.; Anderson, J.M. Lunar calibration of the GMS-5 visible band. In Proceedings of the IEEE 2001 International Geoscience and Remote Sensing Symposium, Sydney, NSW, Australia, 9–13 July 2001. [Google Scholar] [CrossRef]
  28. Fujisada, H.; Grant, I.F.; Kieffer, H.H.; Anderson, J.M. Lunar calibration of geostationary visible-band imagers. In Proceedings of the Sensors, Systems, and Next-Generation Satellites II, Barcelona, Spain, 21 December 1998. [Google Scholar] [CrossRef]
  29. Butler, J.J.; Wu, X.; Xiong, J.; Stone, T.C.; Yu, F.; Han, D. Vicarious calibration of GOES Imager visible channel using the Moon. In Proceedings of the Earth Observing Systems XI, San Diego, CA, USA, 14–16 August 2006. [Google Scholar] [CrossRef]
  30. Barnes, W.L.; Maxwell, M.S.; Kieffer, H.H. Calibrating the GOES Imager visible channel using the moon as an irradiance source. In Proceedings of the Earth Observing Systems III, San Diego, CA, USA, 3 October 1998. [Google Scholar] [CrossRef]
  31. Stone, T.C.; Butler, J.J.; Kieffer, H.H.; Grant, I.F. Potential for calibration of geostationary meteorological imagers using the Moon. In Proceedings of the Earth Observing Systems X, San Diego, CA, USA, 31 July 2005. [Google Scholar] [CrossRef]
  32. Butler, J.J.; Sun, J.; Xiong, X.; Butler, J.; Gu, X. NPP VIIRS on-orbit calibration and characterization using the moon. In Proceedings of the Earth Observing Systems XVII, San Diego, CA, USA, 15 October 2012. [Google Scholar] [CrossRef]
  33. Butler, J.J.; Xiong, X.; Gu, X.; Fulbright, J.P.; Wang, Z.; Xiong, X. Suomi-NPP VIIRS lunar radiometric calibration observations. In Proceedings of the Earth Observing Systems XIX, San Diego, CA, USA, 26 September 2014. [Google Scholar] [CrossRef]
  34. Butler, J.J.; Xiong, X.; Gu, X.; Wang, Z.; Fulbright, J.; Xiong, X. Update on the performance of Suomi-NPP VIIRS lunar calibration. In Proceedings of the Earth Observing Systems XX, San Diego, CA, USA, 8 September 2015. [Google Scholar] [CrossRef]
  35. Butler, J.J.; Xiong, X.; Gu, X.; Wang, Z.; Xiong, X.; Efremova, B.V.; Chen, H. Using the Moon to evaluate the radiometric calibration performance of S-NPP VIIRS thermal emissive bands. In Proceedings of the Earth Observing Systems XIX, San Diego, CA, USA, 18–20 August 2014. [Google Scholar] [CrossRef]
  36. Lv, Y.; Le, J.; Chen, H.; Wang, J.; Shao, J.; Hu, S.; Ma, S.; Yan, W.; Huang, Y. Using two different targets for the calibration of S-NPP VIIRS day night band under lunar illumination. In Proceedings of the Selected Papers of the Chinese Society for Optical Engineering Conferences held October and November 2016, Jinhua, China, 8 March 2017. [Google Scholar] [CrossRef]
  37. Meynart, R.; Neeck, S.P.; Shimoda, H.; Xiong, X.; Lachérade, S.; Aznay, O.; Fougnie, B.; Fulbright, J.; Wang, Z. Comparison of S-NPP VIIRS and PLEIADES lunar observations. In Proceedings of the Sensors, Systems, and Next-Generation Satellites XIX, Toulouse, France, 12 October 2015. [Google Scholar] [CrossRef]
  38. Wang, Z.; Xiong, X.; Li, Y. Improved Band-to-Band Registration Characterization for VIIRS Reflective Solar Bands Based on Lunar Observations. Remote Sens. 2015, 8, 27. [Google Scholar] [CrossRef]
  39. Li, X.; Ma, R.; Zhang, Q.; Li, D.; Liu, S.; He, T.; Zhao, L. Anisotropic characteristic of artificial light at night—Systematic investigation with VIIRS DNB multi-temporal observations. Remote Sens. Environ. 2019, 233, 111357. [Google Scholar] [CrossRef]
  40. Barnes, W.L.; Eplee, J.R.E.; Butler, J.J.; Barnes, R.A.; Patt, F.S.; Meister, G.; McClain, C.R. SeaWiFS lunar calibration methodology after six years on orbit. In Proceedings of the Earth Observing Systems IX, Denver, CO, USA, 26 October 2004. [Google Scholar] [CrossRef]
  41. Butler, J.J.; Eplee, J.R.E.; Xiong, J.; Bailey, S.W.; Barnes, R.A.; Kieffer, H.H.; McClain, C.R. Comparison of SeaWiFS on-orbit lunar and vicarious calibrations. In Proceedings of the Earth Observing Systems XI, San Diego, CA, USA, 7 September 2006. [Google Scholar] [CrossRef]
  42. Butler, J.J.; Sun, J.; Xiong, J.; Eplee, J.R.E.; Xiong, X.; Stone, T.; Meister, G.; McClain, C.R. MODIS and SeaWIFS on-orbit lunar calibration. In Proceedings of the Earth Observing Systems XIII, San Diego, CA, USA, 20 August 2008. [Google Scholar] [CrossRef]
  43. Barnes, R.A.; Eplee, R.E.; Patt, F.S.; Kieffer, H.H.; Stone, T.C.; Meister, G.; Butler, J.J.; McClain, C.R. Comparison of SeaWiFS measurements of the Moon with the U.S. Geological Survey lunar model. Appl. Optics 2004, 43, 5838–5854. [Google Scholar] [CrossRef]
  44. Sun, J.-Q.; Xiong, X.; Barnes, W.L.; Guenther, B. MODIS Reflective Solar Bands on-Orbit Lunar Calibration. ITGRS 2007, 45, 2383–2393. [Google Scholar] [CrossRef]
  45. Wu, R.H.; Zhang, P.; Yang, Z.D.; Hu, X.Q.; Ding, L.; Chen, L. Monitor radiance calibration of the remote sensing instrument with reflected lunar irradiance. J. Remote Sens. 2015, 20, 278–289. [Google Scholar] [CrossRef]
  46. Niu, M.H.; Chen, F.C.; Chen, G.L. Study on Lunar Calibration for Visible Channel of Geostationary Remote Sensing Radiometer. Chin. J. Quantum Electron. 2019, 36, 108–115. [Google Scholar] [CrossRef]
  47. Wang, Y.; Huang, Y.; Wang, S.; Li, Z.; Zhang, Z.; Hu, X.; Zhang, P. Ground-based Observation System Development for the Moon Hyper-spectral Imaging. PASP 2017, 129, 13. [Google Scholar] [CrossRef]
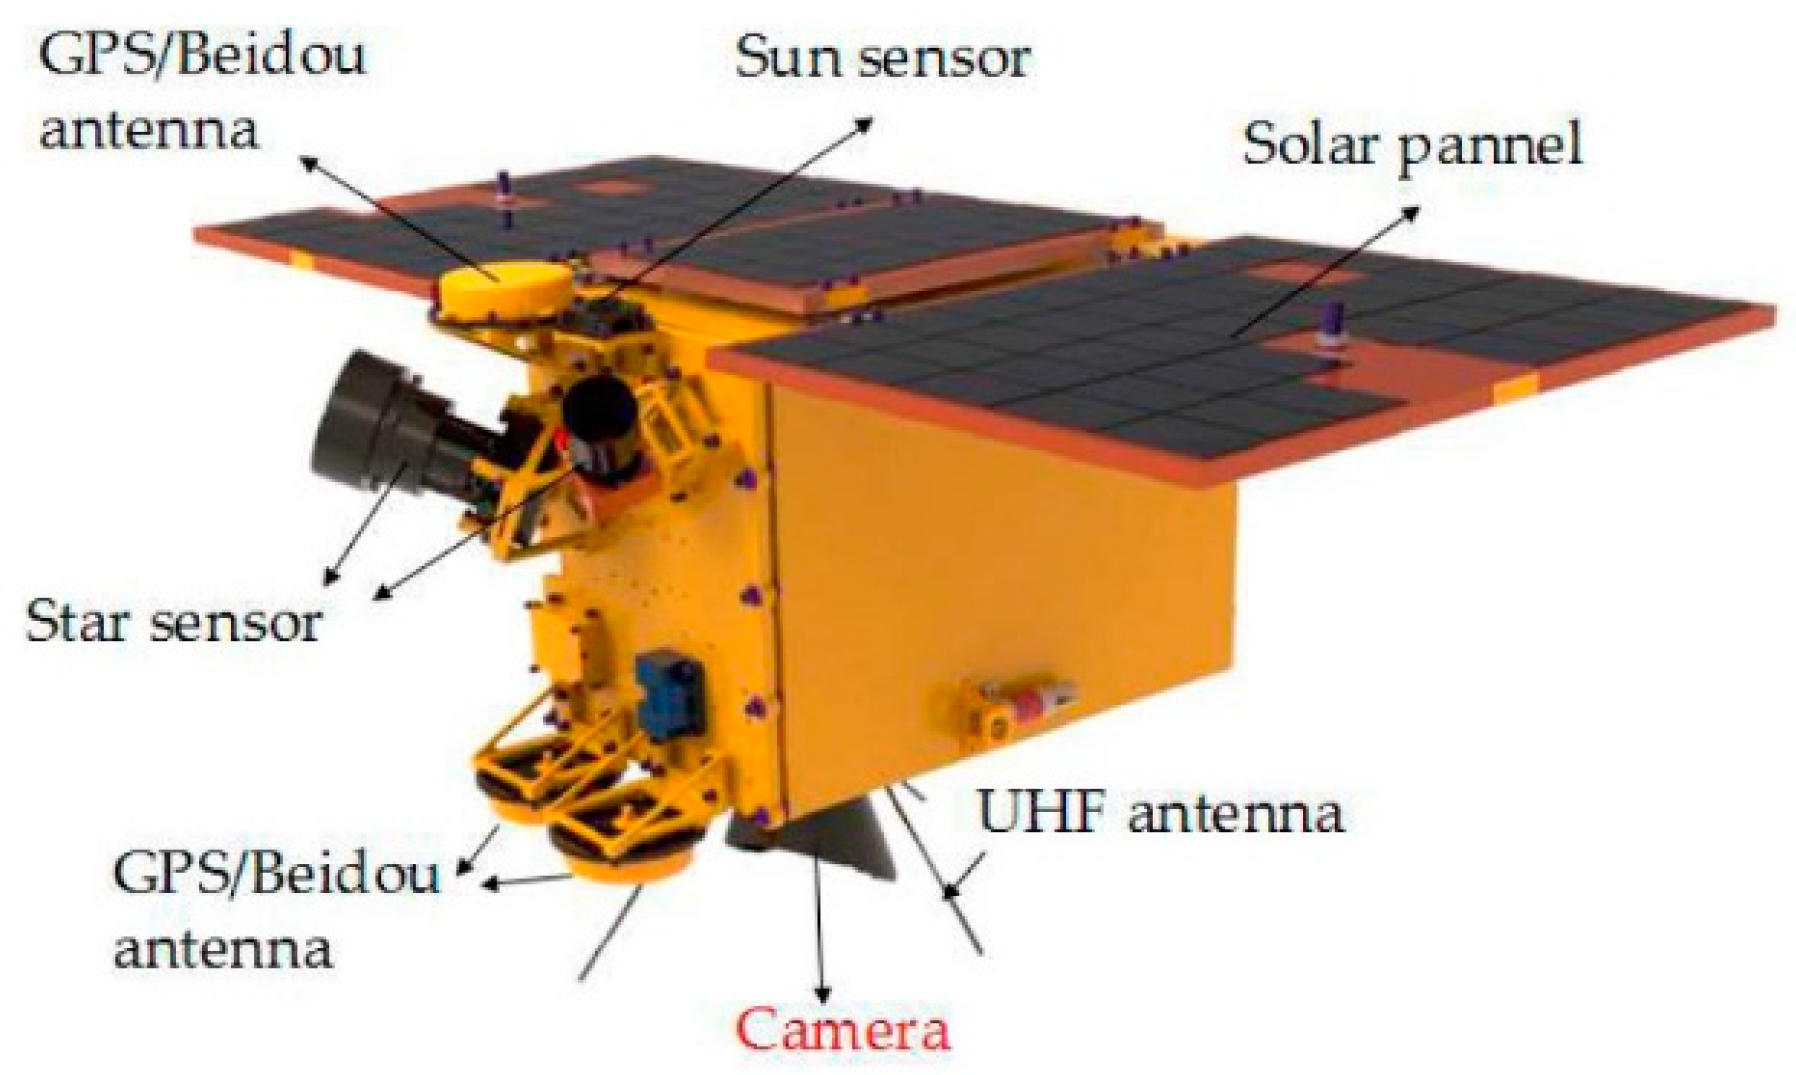
  48. Su, Z.; Zhong, X.; Zhang, G.; Li, Y.; He, X.; Wang, Q.; Wei, Z.; He, C.; Li, D. High Sensitive Night-time Light Imaging Camera Design and In-orbit Test of Luojia1-01 Satellite. Sensors 2019, 19, 797. [Google Scholar] [CrossRef] [PubMed]
  49. Zhang, K.; Zhong, X.; Zhang, G.; Li, D.; Su, Z.; Meng, Y.; Jiang, Y. Thermal Stability Optimization of the Luojia 1-01 Nighttime Light Remote-Sensing Camera’s Principal Distance. Sensors 2019, 19, 990. [Google Scholar] [CrossRef] [PubMed]
  50. Velikodsky, Y.I.; Opanasenko, N.V.; Akimov, L.A.; Korokhin, V.V.; Shkuratov, Y.G.; Kaydash, V.G.; Videen, G.; Ehgamberdiev, S.A.; Berdalieva, N.E. New Earth-based absolute photometry of the Moon. Icarus 2011, 214, 30–45. [Google Scholar] [CrossRef]
  51. Butler, J.J.; Stone, T.C.; Xiong, J.; Kieffer, H.H. Use of the Moon to support on-orbit sensor calibration for climate change measurements. In Proceedings of the Earth Observing Systems XI, San Diego, CA, USA, 8 September 2006. [Google Scholar] [CrossRef]
  52. Govaerts, Y.M.; Clerici, M.; Clerbaux, N. Operational calibration of the Meteosat radiometer VIS band. IEEE Trans. Geosci. Remote Sens. 2004, 42, 1900–1914. [Google Scholar] [CrossRef]
Figure 1. LuoJia1-01 satellite (UHF is short for Ultra High Frequency).
Remotesensing 11 02183 g001
Figure 2. Normalized relative spectral response of LuoJia1-01.
Remotesensing 11 02183 g002
Figure 3. Flow chart of the radiometric radiance calibration of lunar observations.
Remotesensing 11 02183 g003
Figure 4. Observation data captured by Luojia1-01: (a) Orbit 53, (b) Orbit 237, (c) Orbit 217, (d) Orbit 354.
Remotesensing 11 02183 g004
Figure 5. Raw image (a) and the relative radiometric corrected image (b).
Remotesensing 11 02183 g005
Figure 6. Lunar radiance distribution after absolute radiometric correction.
Remotesensing 11 02183 g006
Figure 7. Lunar image and the extracted lunar range.
Remotesensing 11 02183 g007
Figure 8. Edge recognition effects of the moon after processing by different edge identification operators: (a) Roberts, (b) Canny, (c) Log, (d) Sobel, (e) Laplace, and (f) Prewitt.
Remotesensing 11 02183 g008
Figure 9. Radiance distribution (a) before and (b) after edge recognition.
Remotesensing 11 02183 g009
Figure 10. Reflectance adjustment curves.
Remotesensing 11 02183 g010
Figure 11. Relationship between the radiance and the digital number (DN) for four datasets, where the x-axis represents the radiance of 10–22 frames of images based on the Robotic Lunar Observatory (ROLO) model, which are randomly selected from each dataset where the spatial position of the satellite does not change significantly, and the y-axis indicates the DN as a function of the radiance on: (a) 27 June, 2018; (b) 23 November, 2018; (c) 22 March, 2019; (d) 21 May, 2019.
Remotesensing 11 02183 g011
Figure 12. The fitted curve of radiometric response change against on-orbit time.
Remotesensing 11 02183 g012
Figure 13. Relationship between the change in radiometric response and the lunar phase angle.
Remotesensing 11 02183 g013
Table 1. Sensor parameters of LuoJia1-01.
Sensor ParameterValue
Number of active detectors2048 × 2048
Detector size11 µm × 11 µm
Imaging modeStandard (STD) mode High dynamic range (HDR) mode
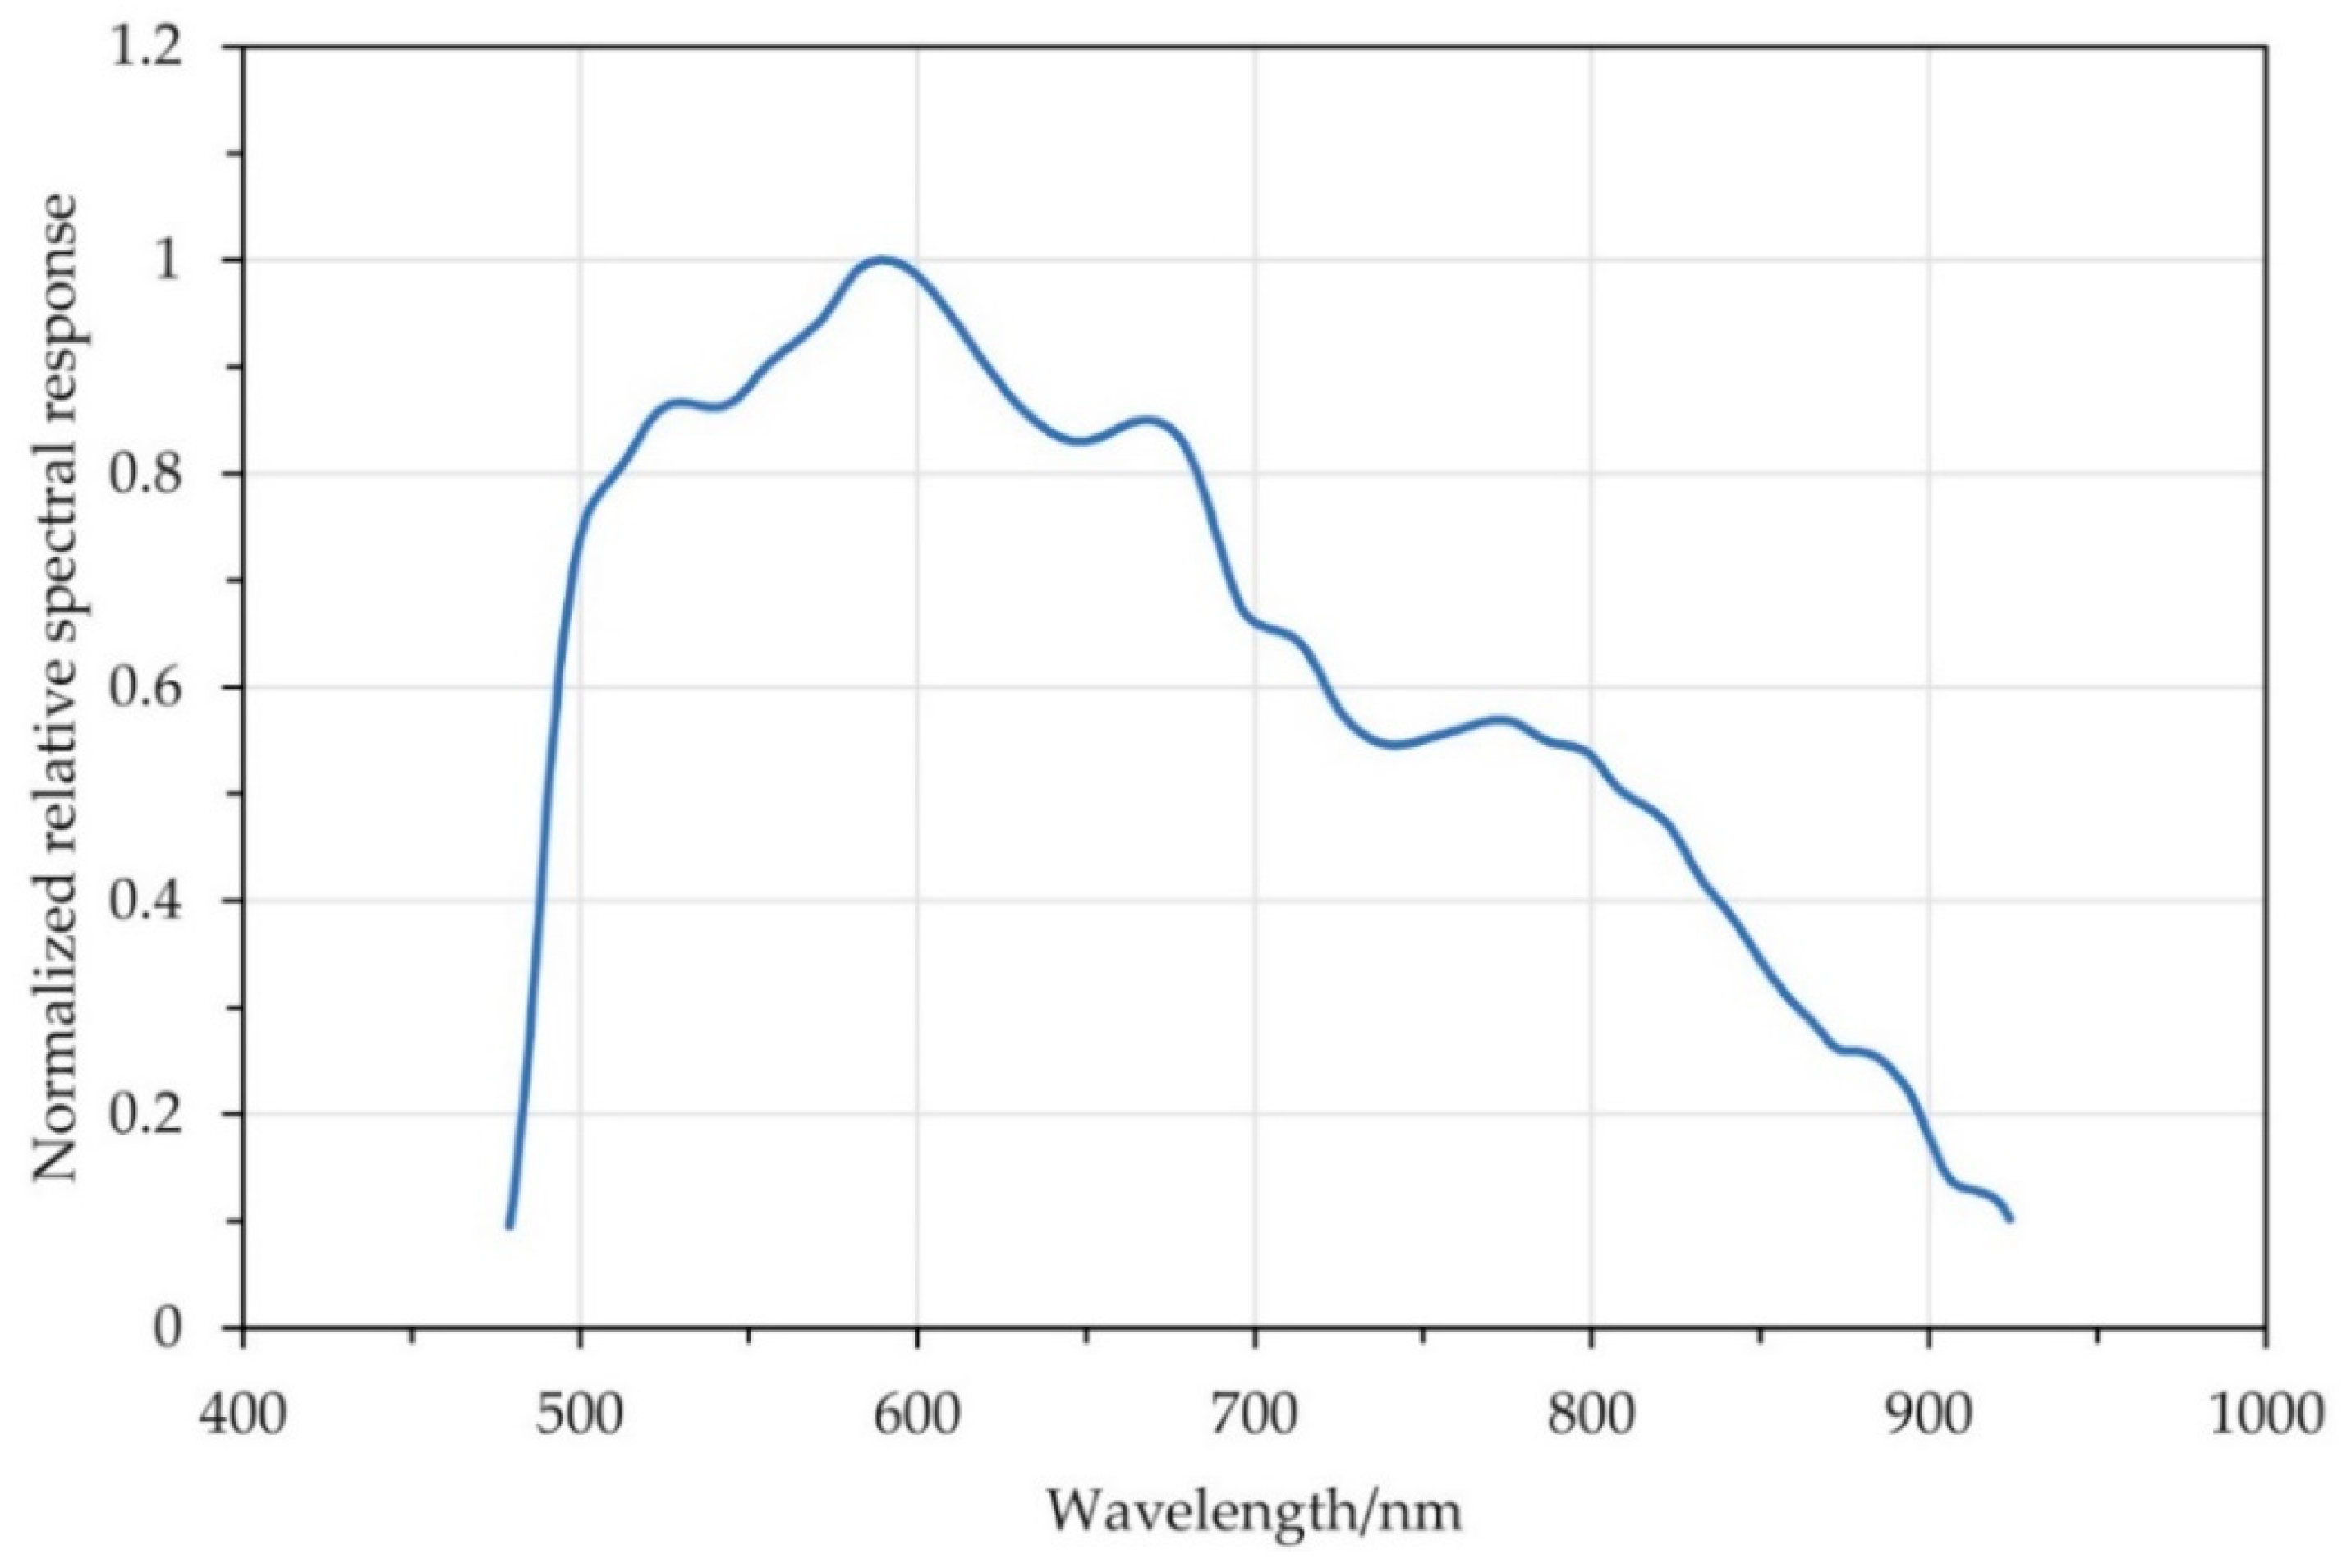
Spectral range460–980 nm
Resolution129 m
Shutter typeElectronic rolling
Quantization bits12-bit, processing to 15bit
Frame rate24 fps @HDR mode 48 fps @STD mode
Noise Equivalent Radiance5e−5 W/m2/sr
Table 2. Information related to the data captured during Luojia1-01 lunar observation.
Orbit NumberFrameImaging Time (UTC)Exposure Time (ms)GainFrame Time (s)Spacecraft Height (km)Phase Angle (°)
531462018-6-27T
23:43:35.1291
0.050.600.10655.492.83
237732018-11-23T
22:45:5.187615
0.051.290.10644.0110.57
2171462019-3-22T
17:40:30.16378
0.051.290.10635.9524.30
3541462019-5-21T
15:3:0.148440
0.051.290.10662.6833.86
Table 3. Parameters of lunar observation geometry and process variables.
Observe Data53237217354
Observing Time (UTC)2018-6-27T 23:43:232018-11-23T 22:45:52019-3-22T 17:40:182019-5-21T 15:03:00
Spacecraft position X (J2000,km)−1372.54 2067.28 −5952.30 −2341.16
Spacecraft position Y (J2000,km)−1335.73 583.59 2538.92 −3014.05
Spacecraft position Z (J2000,km)6747.30 6665.14 2697.62 −5898.73
Selenographic longitude of the spacecraft (°)36.48 161.73 130.48 155.94
Selenographic latitude of the spacecraft (°)73.51 55.78 13.00 −35.78
Selenographic longitude of the sun (°)4.47 −12.90 −17.91 −28.52
Selenographic latitude of the sun (°)−0.811.32−1.44 −1.17
Moon–Sun distance (AU)1.02 0.99 1.00 1.01
Adjusted distance factor1.16 0.89 0.89 1.04
Phase (°)2.83 10.57 24.30 33.86
Semi-major axis44464844
Semi-minor axis44464844
Oversample factor1111
Number of pixels summed1750168119641541
Pixel solid angle (sr)4*10−84*10−84*10−84*10−8
Table 4. Consistency of the laboratory calibration and the model calibration.
Orbit Number53237217354
The accuracy of lunar calibration/%100.7790.3594.0591.36
The standard deviation of calibration results of each dataset/%1.391.080.560.20
Table 5. Change in radiometric response before and after the correction of the phase angle dependence.
Days Since Launched25174293353
Change in radiometric response/%100.7790.3594.0691.36
Relative change in radiometric response/%100.0089.6693.3490.67
Change in radiometric response/% (Phase adjusted)97.9995.6793.2992.09
Relative change in radiometric response/% (Phase adjusted)100.0098.3995.5493.56
Table 6. Central wavelength and bandwidth of the Robotic Lunar Observatory (ROLO) ground-based observation instrument.
Wavelength (nm)350355.1405412.3414.4441.6465.8475
BandWidth (nm)32.531.616.212.517.89.62018.4
Wavelength (nm)486.9544549.1553.8665.1693.1703.6745.3
BandWidth (nm)7.918.88.718.18.316.816.78.7
Wavelength (nm)763.7774.8865.3872.6882928.4939.3942.1
BandWidth (nm)16.816.913.918.41617.618.821.5
Wavelength (nm)1059.51243.21538.71633.61981.52126.32250.92383.6
BandWidth (nm)27.123.348.623.438.554.748.258.2

