Article

Deriving Aerosol Absorption Properties from Solar Ultraviolet Radiation Spectral Measurements at Thessaloniki, Greece

Aristotle University of Thessaloniki, Laboratory of Atmospheric Physics, 54124 Thessaloniki, Greece
*
Author to whom correspondence should be addressed.
Current address: Aosta Valley Regional Environmental Protection Agency (ARPA), 11020 Saint-Christophe, Italy.
Remote Sens. 2019, 11(18), 2179; https://doi.org/10.3390/rs11182179
Submission received: 31 August 2019 / Revised: 16 September 2019 / Accepted: 17 September 2019 / Published: 19 September 2019

Abstract

:
The gap in knowledge regarding the radiative effects of aerosols in the UV region of the solar spectrum is large, mainly due to the lack of systematic measurements of the aerosol single scattering albedo (SSA) and absorption optical depth (AAOD). In the present study, spectral UV measurements performed in Thessaloniki, Greece by a double monochromator Brewer spectrophotometer in the period 1998–2017 are used for the calculation of the aforementioned optical properties. The main uncertainty factors have been described and there is an effort to quantify the overall uncertainties in SSA and AAOD. Analysis of the results suggests that the absorption by aerosols is much stronger in the UV relative to the visible. SSA follows a clear annual pattern ranging from ~0.7 in winter to ~0.85 in summer at wavelengths 320–360 nm, while AAOD peaks in summer and winter. The average AAOD for 2009–2011 is ~50% above the 2003–2006 average, possibly due to increased emissions of absorbing aerosols related to the economic crisis and the metro-railway construction works in the city center.

Graphical Abstract

1. Introduction

Atmospheric aerosols can be of natural or anthropogenic origin and their impact on human health is well established [1,2,3]. Furthermore, they play an important role in determining the levels of solar radiation reaching the Earth surface [4,5,6,7]. Decreasing aerosols over Europe and North America due to improvement of the air quality in the last two decades led to increased solar radiation at the Earth surface, while increasing emissions of anthropogenic aerosols over South-East Asia affected the levels of solar radiation in the opposite direction [8,9]. Although changes in aerosol load and properties may induce important changes in climate [10,11], their interactions with solar radiation, as well as with different atmospheric constituents have not been fully understood yet [12,13,14]. Despite progress in the description of aerosols in global climate models in the recent past, uncertainties related to their efficiency to absorb solar radiation still constitute one of the largest sources of uncertainty in current modeling estimates of aerosol climate forcing [15].
The absorption efficiency of an aerosol layer is usually quantified either using the mean columnar single scattering albedo of the layer (in many studies simply called single scattering albedo, and from now on is referred as SSA) or the absorption optical depth (AAOD). Particular aerosol types, such as sulfate, mainly scatter solar radiation in the ultraviolet (UV) and visible (VIS) wavelengths, while other, such as organic aerosols, absorb a larger fraction of solar radiation [16,17]. Recent studies report that depending on their origin and environmental conditions, the chemical composition of aerosols may vary significantly, leading in some cases in importantly different behavior in the UV relative to the VIS region of the solar spectrum [18,19,20]. UV irradiance may differ by 20% or more over areas with similar aerosol load (similar optical depth levels) because of the different absorption efficiency of aerosols [21,22]. Additionally, a number of studies dealing with the short- and long-term variability of solar UV radiation claim that observed changes in the UV under clear skies cannot be explained solely by changes in the aerosol optical depth (AOD) and total ozone, and assume a parallel change in the absorption efficiency of the aerosol mixture [23,24,25,26,27].
In the last twenty years, large global networks of sun photometers have been established, providing systematic measurements of the SSA and the AAOD in the visible and near infrared (NIR) regions of the solar spectrum [28,29], which in turn have been exploited for the improved description of the radiative effects of aerosols in radiative transfer models [30,31]. However, measurements of the SSA and/or the AAOD in the UV are still sparse [20,32,33,34,35,36,37,38,39,40] and, in most cases highly uncertain, especially in the UV-B region [41,42]. Calculation of the SSA and the AAOD using satellite measurements [43,44] is more uncertain than the calculation from ground-based measurements, mainly because satellite instruments cannot accurately probe the lower troposphere [41,45]. The implementation of a more sophisticated algorithm for the retrieval of the SSA in the UV by the SKYRAD network of sun-photometers is expected to increase the spatial and temporal availability of data in the following years [38,46,47].
Due to large gaps in knowledge and lack of systematic measurements of the SSA or the AAOD in the UV, climatological values of the SSA in the visible are commonly used for modeling of the surface solar UV irradiance, as well as for forecasting of health-related UV quantities [21]. Alternatively, climatological values of the SSA in the visible are extrapolated to UV wavelengths and used in satellite algorithms for the retrieval of the surface UV irradiance [48,49], or in modeling studies [31]. Validation of satellite UV records reveals AOD related biases which are possibly due to the use of inaccurate SSA in the algorithm [50]. Zempila et al. [51] compared ground based clear-sky UV doses with the corresponding products from the Ozone Monitoring Instrument (OMI) [52] over Thessaloniki, Greece and found biases of ~2%, which could be explained by inaccurate description of the aerosol absorption efficiency in the satellite algorithm. Similar conclusions arose from the validation of spectral UV records from the same satellite dataset [53]. Raptis et al. [54] studied the effect of using different SSA values for the simulation of the levels of spectral UV irradiance in Athens, Greece. They showed that using the SSA either measured at 440 nm or climatological values extrapolated from visible wavelengths, instead of the SSA measured at 332 nm with an Ultraviolet Multi Filter Radiometer [36] for the simulation of UV-B irradiance leads to an average overestimation of ~5% at 60°. Even larger differences, of ~10%, were found when satellite climatological values were used to model UV irradiance.
The present study aims to shed some more light on the issues described above, by analyzing a 20-year record of SSA and AAOD in the UV for Thessaloniki, which constitutes one of the longest records globally. The study is focused on providing information regarding the radiative effect of aerosols in the UV (without providing detailed information regarding their type or chemical composition). The procedures which ensure the quality of the data are analytically described, while there has also been an effort to quantify the sensitivity of the used algorithm on different parameters and the relative overall uncertainty budget.

2. Materials and Methods

The methodology for the calculation of the SSA is detailed in Bais et al. [32]. It is based on the calculation of ratios between nearly simultaneous ground based measurements of direct and global UV irradiance at 5 different wavelengths (from 310 to 360 nm with a step of 10 nm), which are compared with the corresponding ratios simulated by a radiative transfer model (RTM) for the particular solar zenith angle (SZA) but for different SSA values. A more detailed description of the instrumentation and the used methodology is provided in the following:
The measurements used in this study are regularly performed at the Laboratory of Atmospheric Physics (LAP), Aristotle University of Thessaloniki, Greece. A double monochromator Brewer spectrophotometer with serial number 86 (Brewer#086) performs automated spectral measurements of the global solar UV irradiance in the range 290–363 nm, with a step and a resolution of ~0.5 nm since 1993 [55]. Since 1997, the direct component of solar irradiance is systematically measured at eight fixed wavelengths (every 10 nm starting from 290 nm) within the global irradiance scans. The measurements of the global and direct irradiance at the particular wavelengths are nearly simultaneous (temporal difference of less than 5 sec) and are routinely used for the correction of the cosine error in the global UV measurements [56].
Calibration of the direct sun measurements is performed using the methodology described in Bais [57]. On a yearly basis, when atmospheric conditions are appropriate (AOD at 340 nm lower than ~0.2 and SZA below 25°) the global (through the diffuser), the diffuse (through the diffuser), and the direct (through the quartz window) solar irradiance are measured sequentially at each wavelength in the range 290–363 nm within less than a minute. The sequential measurements of the three quantities are achieved with the use of a shadowing disk. Then, a calibration transfer function (CTF) is calculated and used to transfer the calibration of the global to the direct UV measurements. The raw ratios of the nearly simultaneous direct and global UV measurements are directly multiplied with the CTF in order to retrieve the ratio between the direct and the global UV irradiance (DG). By directly applying the CTF, a single calibration factor is used instead of different calibration factors for the direct and the global components, minimizing this way the uncertainties related to the calibration of the measurements.
The calibration of the global UV measurements is a well-established procedure, performed inside the laboratory with 1000 watt standard lamps of spectral irradiance [58]. The calibrated direct sun spectral measurements are then suitable for the calculation of the AOD and the Angstrom Exponent in the UV [59]. Quality of the direct sun measurements is confirmed by comparing the calculated AOD with the AOD at the same wavelengths from a co-located CIMEL sun-photometer [28,60] and a co-located, single monochromator, Brewer spectrophotometer with serial number 005 (Brewer#005) [61], as well as with the AOD retrieved from spectral direct sun high resolution scans (with a step of 0.5 nm) also performed by Brewer#086 [62]. This way, important non-linearity issues were detected during the year 1997, as well as for measurements performed at SZAs below 50° in the period 1998–2002. Thus, these data were excluded from the analysis. Measurements of the particular type were optimized in 2002, by improving the instrumental settings for the measurements of the particular type, optimizing the high voltage of the photomultiplier tube and using proper neutral density filters during measurements in order to keep the signal within the desired levels [63], and the non-linearity problem was thereafter solved.
The systematic calibration of global UV measurements ensures their good quality, which has been also certified by the participation of the instrument in field campaigns and inter-comparisons with other instruments [64]. Additional quality control is achieved by comparing measurements with synchronous spectral measurements of Brewer#005, as well as comparison of integrated quantities with measurements of other narrowband and broadband instruments [24,58,65].
Simulations using the uvspec radiative transfer model of libRadtran v2.0 package [66] are performed for the atmospheric conditions of each spectral scan performed by Brewer#086. Model inputs are, the SZA, the AOD from DG measurements, total ozone from Brewer#005 interpolated to the mean time of each spectral scan, and summer and winter mid-latitude standard atmospheric profiles [67] for months April–September and October–March respectively. When measurements of total ozone are not available for a particular day, climatology values are used. The disort pseudospherical approximation [68] running with 32 streams, and a default aerosol profile [69] are also used for the simulations. Simulations are performed only for the spectra measured when the sun disk is unoccluded. Cloud filtering is achieved using measurements from a co-located CM-21 pyranometer [70]. DG measurements for which AOD exceeds 2 are also rejected since, in their vast majority, they either correspond to cloudy skies which were not detected by the cloud filtering, or problematic measurements not detected by the quality control.
For each of the six wavelengths (310–360 nm with a 10 nm step), the DG irradiance ratio is simulated for SSA ranging from 0.3 to 1 with a step of 0.01. Then, each of the measured DG ratios is matched to the closest value of the modeled ratio. At the lowest and highest SSA limits (0.3 and 1) the calculated SSA values are excluded from the analysis when the measured DG ratios differ from the closest modeled ratios by more than 1.5%. The AAOD is finally calculated by multiplying (1-SSA) for each wavelength and each spectral scan with the corresponding value of the AOD. Only SSA and AAOD for SZAs smaller than 70° have been used in the analysis since uncertainties increase fast for higher SZAs. Climatological analysis of the SSA and AAOD is performed only for wavelengths from 320 to 360 nm. Measurements at 310 nm are only used to assess the spectral dependence—not for climatological analysis—and only for SZAs smaller than 55° and AOD (at 340 nm) above 0.3, because of the very high uncertainties at larger SZAs and lower AOD.
The level 2, version 3 AOD at 340 nm from a co-located CIMEL sun-photometer [60] for the common period of measurements with Brewer#086 has been used for two purposes: (1) For the validation of the AOD from Brewer#086, and (2) as RTM input (instead of the AOD from Brewer#086) for the re-calculation of the SSA in order to further evaluate the reliability of the particular product from Brewer#086. The closest measurements performed by CIMEL within ± 15 mins from the corresponding measurements of Brewer#086 have been used. The SSA and AAOD at VIS and NIR wavelengths from CIMEL are used for comparison with the corresponding Brewer#086 products in the UV. Level 2 SSA and AAOD from CIMEL are available only for AOD (at 440 nm) above 0.4 and SZA above 50°. Thus, in addition to the level 2 data, we also used the level 1.5 products whenever the level 2 size distribution was available in order to enrich the dataset as also suggested by Bond et al. [71].
Different limitations were applied to the Brewer products used for different parts of the analysis depending on the uncertainties described in the following section and the availability of the AERONET products. More specifically:
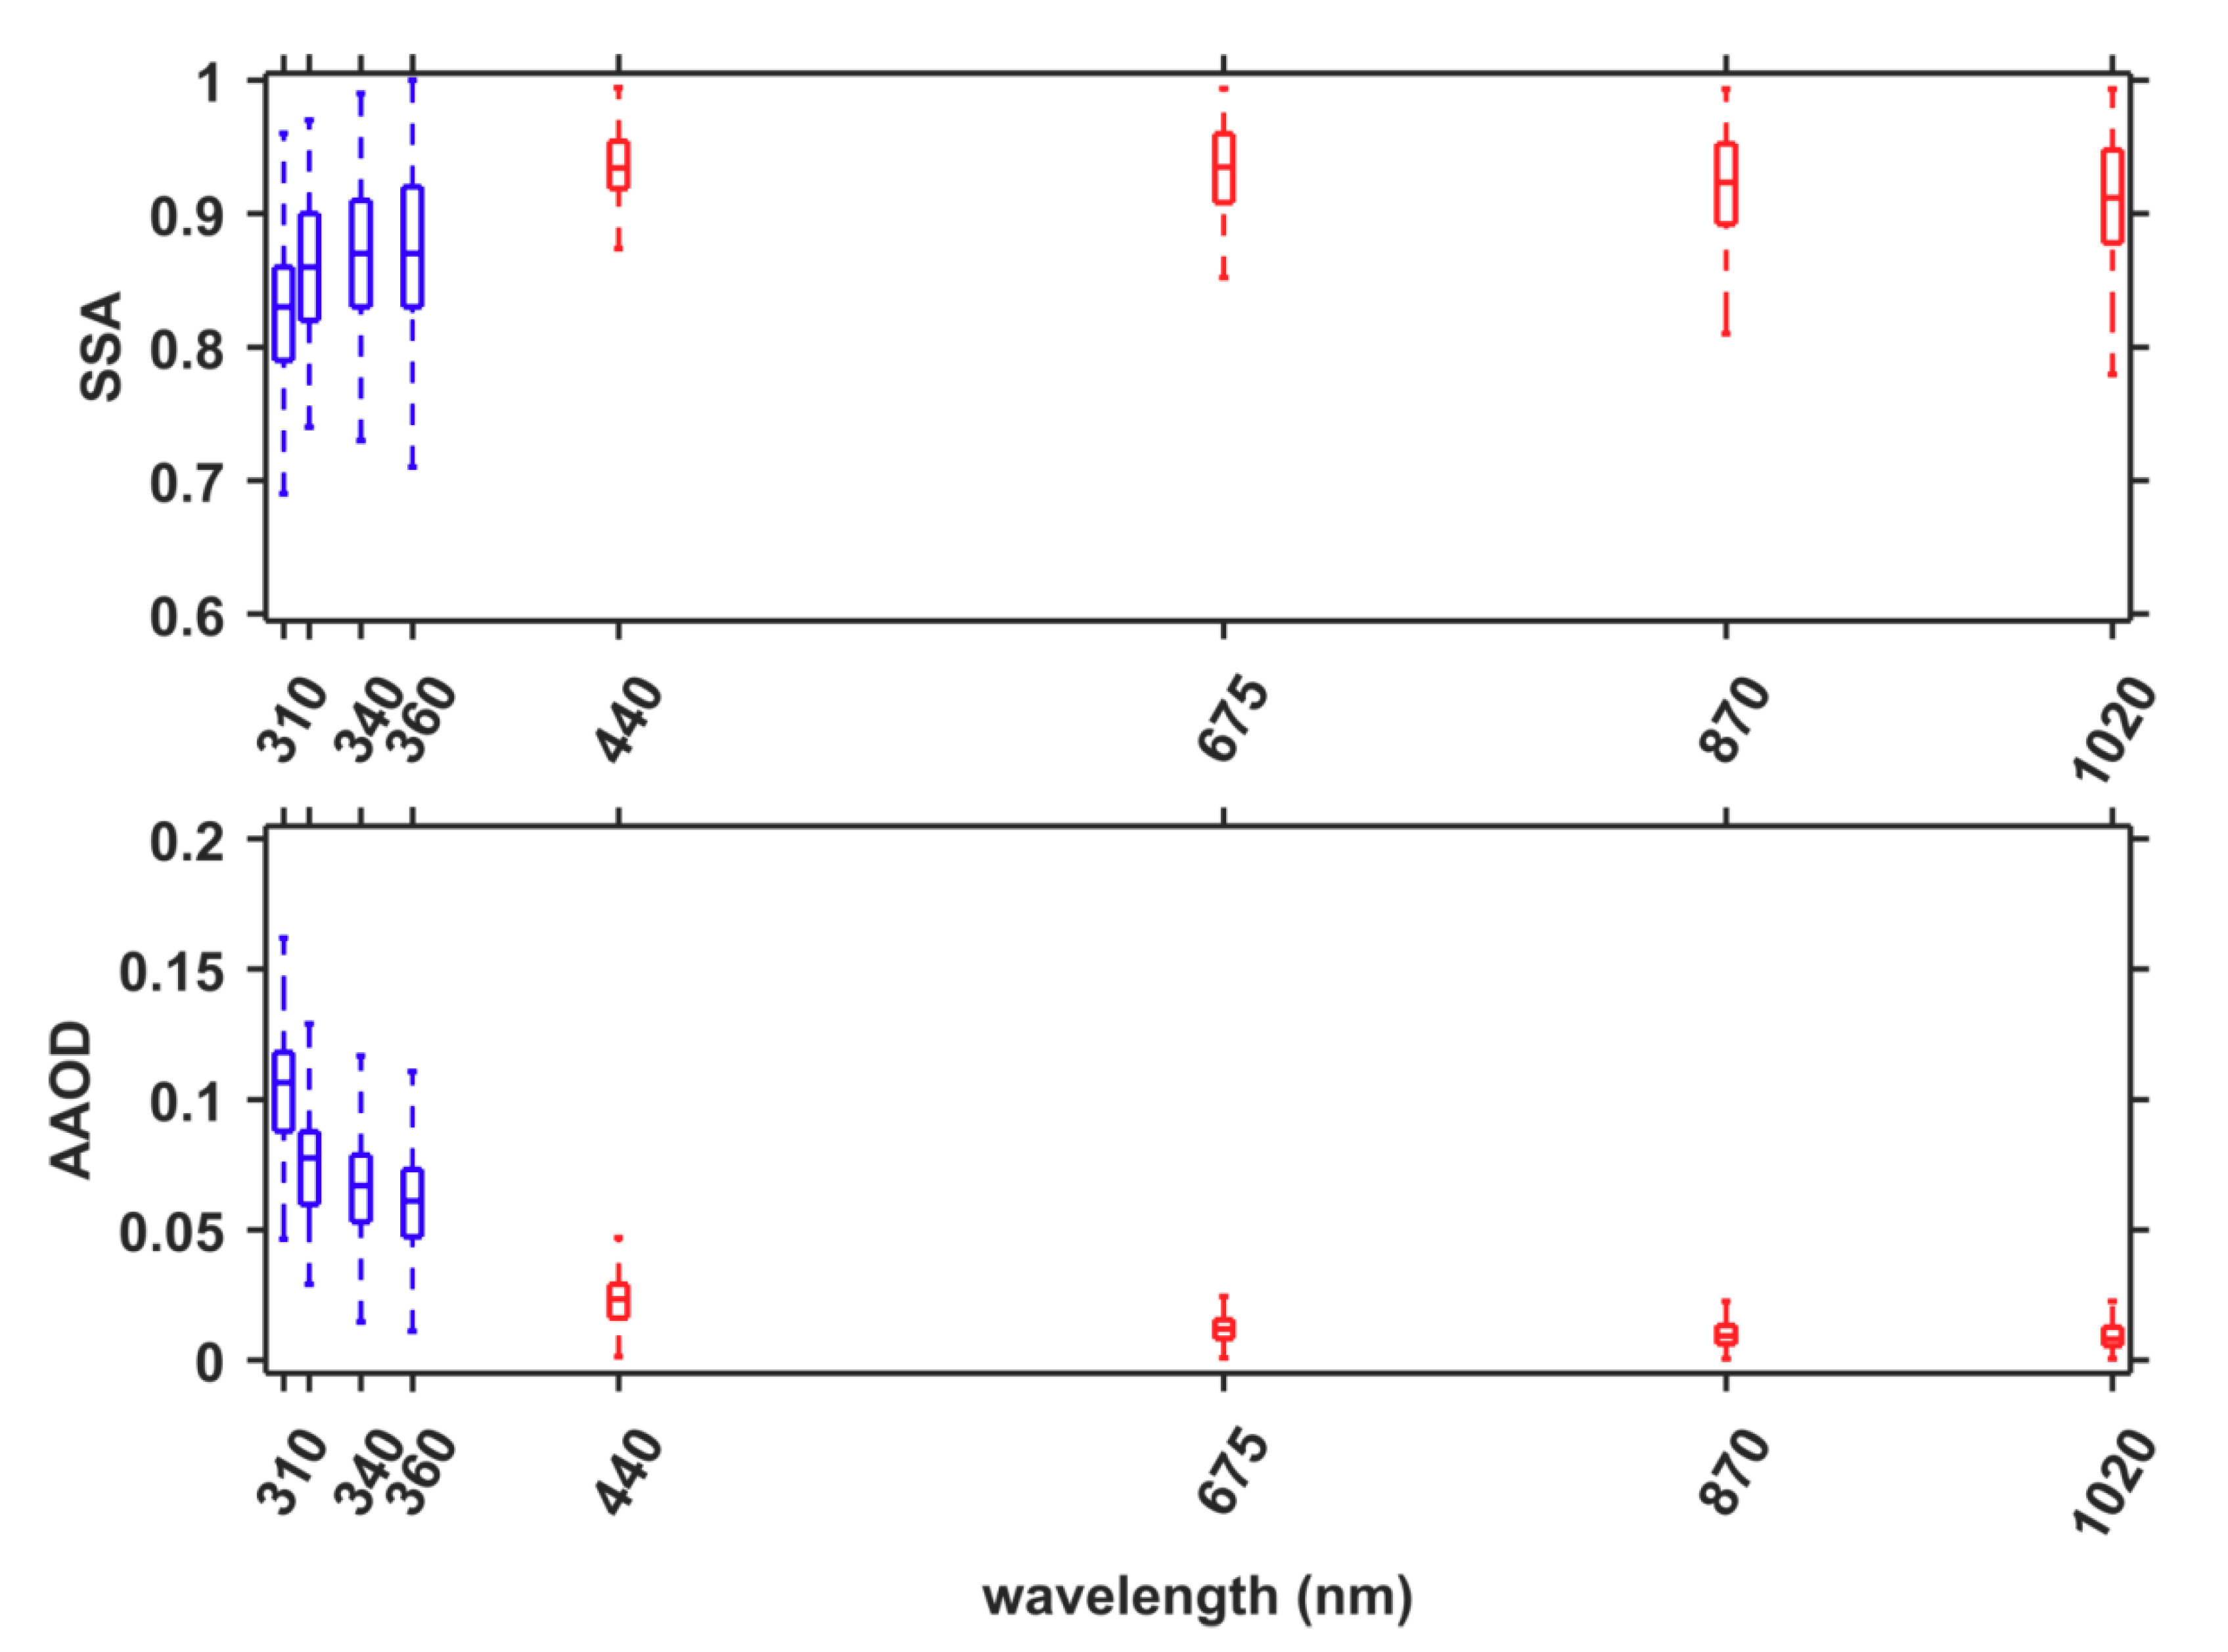
  • In order to investigate the spectral dependence of the SSA and AAOD over Thessaloniki (Section 4), close-in-time (within ± 15 min) SSA and AAOD measurements from Brewer#086 and CIMEL have been analyzed for the period 2005–2017. Only measurements at a narrow range of SZAs (45°–55°) were used, because measurements from CIMEL are available only for SZA larger than 45°, even for the enriched dataset, while the Brewer measurements at 310 nm can be highly uncertain at SZAs larger than 55°. Measurements for AOD below 0.3 were also excluded from the analysis to further reduce the uncertainties.
  • All available measurements of Brewer#086 for SZAs smaller than 70° have been used to study the diurnal variability of the SSA and the AAOD (Section 5.2) in the UV. Measurements before 2003 have not been used in this part of the study, since data for the period 1998–2002 are reliable only for SZAs 50–70° as discussed above. Measurements at 310 nm have also not been used because they are highly uncertain. In order to study the diurnal variability hourly averages were calculated.
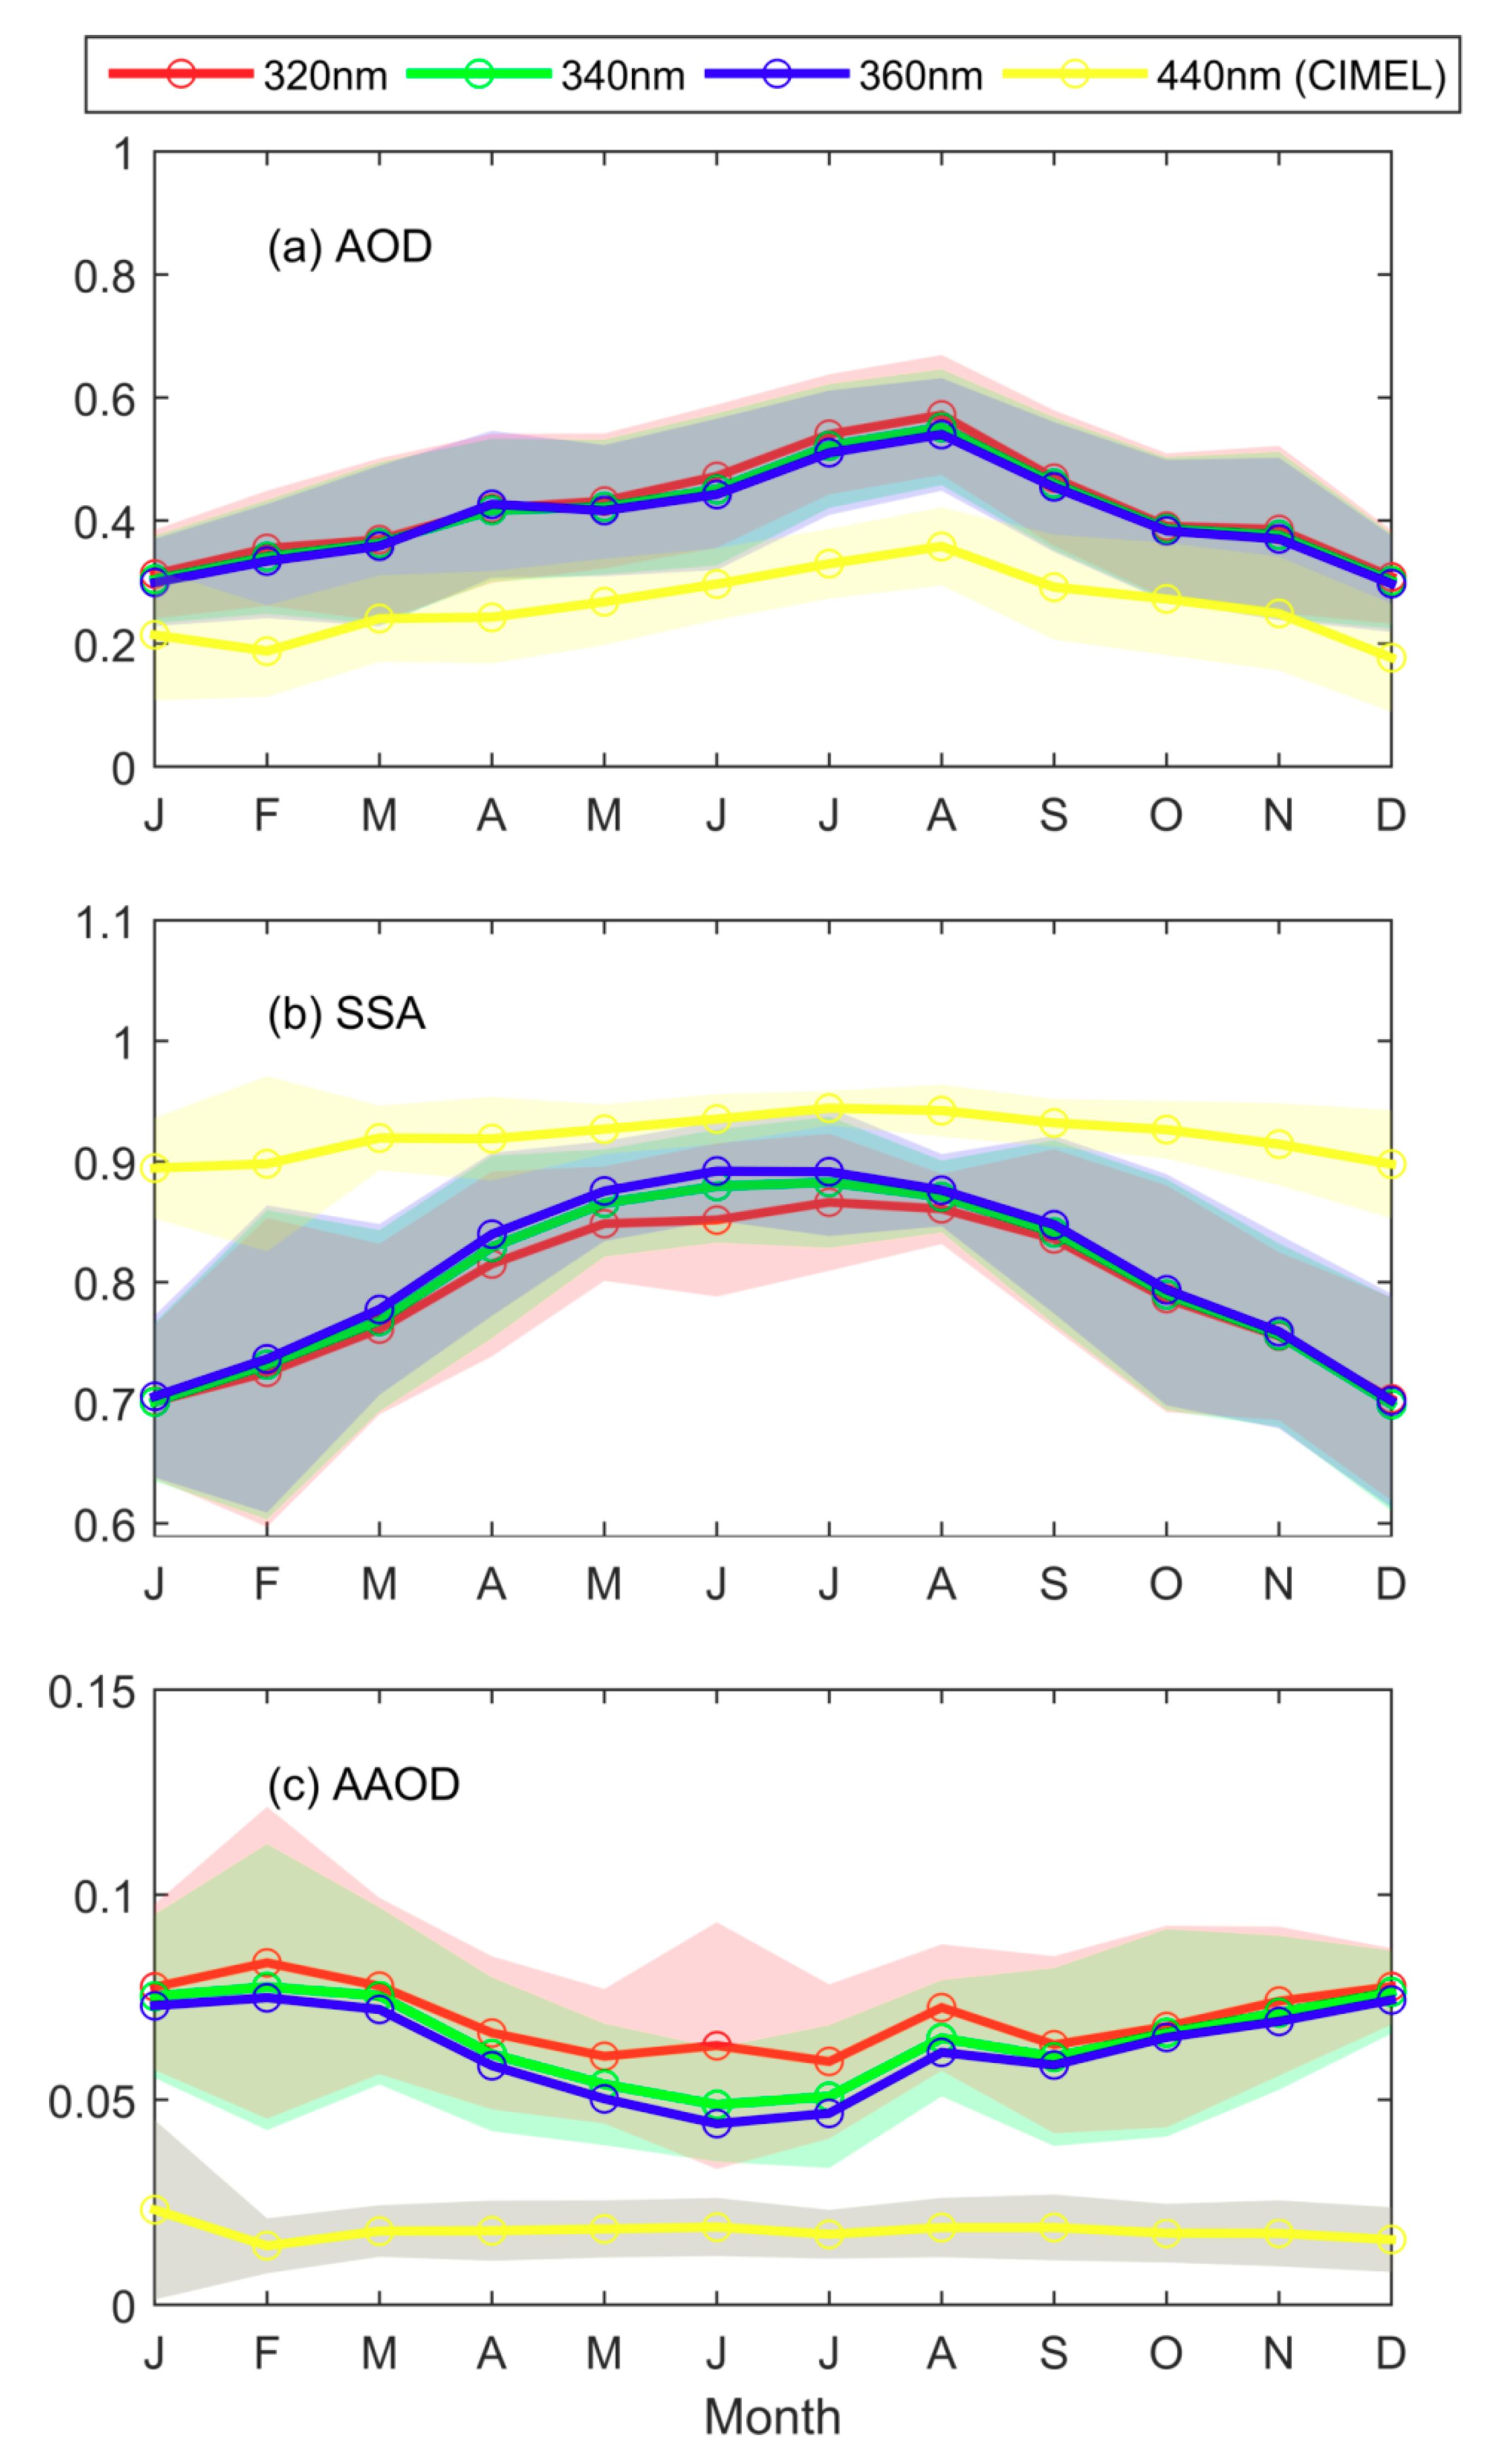
  • For the study of the annual variability (Section 5.1), the hourly averages calculated for the study of the diurnal variability, but only for the period 2005–2017 and for hours 10–14 (LT) were used. The reason for not taking into account measurements for the years 2003 and 2004 is that continuous AERONET data, which were also used, are available only since 2005. The reason for using only measurements between 10 and 14 LT is that throughout the year the SZA cut-off limit of 70° corresponds to different times of the day (in the morning and the evening). Thus, using all measurements for SZAs smaller than 70° would introduce biases because SSA and AAOD change in the day as a function of the local time (see Section 5.2). Daily averages were calculated from the hourly averages, and then, monthly means were calculated when at least ten days of measurements were available. Monthly means were averaged over the whole period of study to get monthly climatological values.
  • Only measurements for SZAs 50–70° have been used to study the long-term variability for the period 1998–2017 (Section 5.3) since data for the period 1998–2002 are reliable only for the particular range of SZAs. Again, measurements at 310 nm have been excluded from the analysis.

3. Uncertainties in the Retrieval of the SSA and the AAOD

The methodology for the quantification of the uncertainties in SSA and AAOD from Brewer#086, as well as the results of the analysis, are discussed below. The uncertainties in the final products are mainly due to uncertainties in the measurements of Brewer#086, as well as uncertainties in other atmospheric parameters used as inputs for the RTM.

3.1. Uncertainties in the DG Ratio

A major uncertainty factor for the calculation of the DG ratios is the accuracy in the calculation of the CTF used for the transfer of the absolute calibration from global irradiance to direct irradiance measurements. In the context of the present study, measurements for the calculation of the CTF were repeated in a number of days in 2017, at different SZAs and under different atmospheric conditions. As long as the measurements for the calculation of the CTF are performed at SZAs smaller than 50° and for AOD (at 340 nm) below 0.2, the results are consistent to within 4% for wavelengths between 310 and 360 nm. Measurements performed in the past under similar conditions (small SZA, low AOD) within periods of a few months confirm the above findings. The corresponding standard uncertainty is thus estimated to 1.7%, which is lower than the uncertainty (of 3%) reported by Bais [57]. This difference is mainly due to the improved characterization of the Brewer#086 for the effects of dead-time and temperature, and the use of the corresponding updated correction factors.
Accurate correction for the effects of temperature and dead time is of exceptional significance when the temperature and the recorded signal are very high (as usually happens with measurements for the determination of the CTF). Instrumental temperatures of ~40 °C are not unusual in summer, inducing changes of ~4% in the response of the particular instrument relative to the response at the reference temperature of 25 °C [72,73]. In the past, direct sun measurements were not corrected for the effect of temperature since it is not easy to accurately characterize the instrument [74], while the used correction factors for the global measurements were not accurate, especially for temperatures below ~20 °C [72]. Updated methods were used for the characterization of both, the global [72] and the direct sun measurements [73], and the new correction factors were then applied to the dataset. Dead time is important when the recorded signal is very high. Thus, neutral density filters are used to keep the signal within the desired levels, wherein errors in the correction for the effect of dead time are not significant. However, before the re-evaluation of the dataset, there were periods during which the error in the dead time constant used for the correction of the measurements was of the order of 10 ns, leading to errors up to ~5% in the irradiance when the recorded signal was very high. Detailed discussion regarding the dead time effect, and the improvements in the characterization and correction procedures can be found in Fountoulakis et al. [63].
Circumsolar irradiance (e.g., Blanc et al. [75]) is a major factor of uncertainty in the direct sun measurements, especially at low wavelengths and large SZAs, thus it affects the DG ratio. Measurements of the sky radiance near the solar disc revealed that, for AOD (at 340 nm) below 0.3, the circumsolar component contributes less than 1% in the direct-sun UV measurements above 310 nm, even at large SZAs, which is also confirmed by the results for visible wavelengths reported by Blanc et al. [75]. The effect of circumsolar irradiance is more important for higher AOD [76]. However, for AOD of the order of 0.5, or higher, even an overestimation of 3% of the direct component due to the contribution of circumsolar radiation has small impact relative to the overall uncertainties in the calculation of the SSA as discussed in the following.
Additional uncertainties in the DG ratio may come up from the technical characteristics of the instrument if proper corrections are not applied [77,78,79]. The wavelength shift [80] of both the direct and global measurements used for the calculation of the DG ratio is the same, thus, the effect on the DG ratios is negligible. Proper characterization of the entrance optics for the effects of temperature [72,74] and polarization [81] keeps the uncertainties related to these factors below 1%. Application of updated corrections for non-linearity due to the effect of dead-time [63] keeps the relative errors below 2%, even for the highest levels of the recorded signal.
The overall uncertainties in the calculation of the DG ratios are dominated by the uncertainties in the calculation of the CTF. Based on the above discussion, it is estimated that the standard uncertainty in the calculation of the DG ratios is ~2%. The corresponding errors in SSA due to increased or decreased DG ratios by 2% were calculated for the entire dataset. The estimated errors for AOD > 0.3 are 0.03 or lower (relative errors up to 5%) while for AOD between 0.1 and 0.3 they can be up to 0.1 (relative errors up to 20%). Errors of ~0.2 (relative errors up to 40%) were found for AOD below 0.1. The aforementioned errors in SSA induce absolute errors of up to 0.02 in the calculation of the AAOD. The corresponding relative errors are below 20% for AAOD larger than 0.05 and reach 100% for AAOD below 0.02. AOD below 0.1 represents however a very small fraction of the dataset. For example, at 340 nm, the daily average AOD is below 0.1 for ~1.5% of the days in the period 1998–2017. For ~27% of the days daily average AOD is between 0.1 and 0.3, while it is larger than 0.3 for ~71.5% of the days.
At 310 nm, increased noise at larger SZAs [63,82] may introduce additional uncertainties. Furthermore, the contribution of diffuse light entering the field of view of the instrument in the measured solar beam can be important, also affecting the retrieval of the AOD. Since uncertainties in the DG ratios related to these effects cannot be easily quantified, DG ratios at 310 nm for SZAs larger than 55° are not included in the analysis.

3.2. Uncertainties in AOD

Kazadzis et al. [36] report that the most important source of uncertainty in the retrieval of the SSA is the AOD used as input in the RTM. In another study Kazadzis et al. [59] estimated that standard (1-sigma) uncertainty in the retrieval of the AOD from Brewer#086 is 0.05 for the AOD at 320–360 nm and 0.07 for AOD at 310 nm. Higher uncertainty for 310 nm is mainly due to the uncertainty in the retrieval of total ozone [83]. However, after improvements in the characterization of the instrument and re-evaluation of Brewr#086 dataset these uncertainties are now estimated to be lower. Comparison of the AOD at 340 nm from Brewer#086 with close in time (within ±15 min) measurements of the CIMEL for the period 2005–2017 results in very good agreement between the two instruments (correlation coefficient = 0.99, mean offset = 0.009, R2 = 0.98, RMSE = 0.034). Given that the uncertainty in the AOD from CIMEL is of the order of 0.02 in the VIS and larger in the UV [60], these numbers confirm the good quality of the AOD derived from Brewer#086. The offset of 0.009 is due to the nearly perfect agreement of the two instruments in the summer and slightly higher differences during the rest of the year, reaching 0.02 (still within the uncertainty of CIMEL) in winter. Based on the above analysis we estimate that the uncertainty in the AOD from Brewer#086 is 0.035 for 320–360 nm and 0.055 for 310 nm.
Errors in the calculation of the AOD are not however completely independent of errors in the calculation of the DG ratio because errors in the calculation of the CTF affect both toward different directions (e.g., higher CTF means higher DG ratio and lower AOD). Then the propagating errors in the calculation of the SSA are again toward different directions (e.g., underestimation of the SSA due to higher DG ratio and overestimation of the SSA due to lower AOD). Despite this partial counter-balancing, the uncertainties due to errors in DG ratio and AOD are treated as independent in the present analysis, since uncertainties in AOD are higher and not solely due to errors in the CTF. Furthermore, it is very difficult to isolate the effect of CTF and perform an independent investigation.
In order to investigate the effect of these uncertainties, the SSA and the AAOD were re-calculated for 2015 using different AOD input (± 0.035 and ± 0.055 relative to the reference AOD, for 320–360 nm and 310 nm respectively). Analysis for wavelengths 320–360 nm yielded wavelength-independent results for the SSA. When AOD is above 0.3 the error in SSA is below 0.2 at 310 nm and 0.1 at 320–360 nm. For very high AOD, above ~0.6, the error in the SSA, even for 0.055 error in AOD is less than 0.05 (<10%). The increased optical path as the SZA increases makes the effect of errors in AOD slightly more significant. When AOD is very low, below 0.1, relative errors are generally above 40% and in extreme cases exceed 100%. In absolute numbers, errors in SSA are below 0.1 for AOD above 0.3 (for an error of 0.035 in AOD). When AOD is between 0.1 and 0.3 and it is overestimated by 0.035 or 0.055, errors in SSA are up to 0.2 or 0.3 respectively. Errors are smaller when AOD is underestimated by the same amount. Errors in SSA become more important when the AOD is below 0.1, reaching ~0.5.
The absolute errors in AAOD corresponding to the aforementioned errors in AOD increase on average with increasing SZA and not (at least significantly) with decreasing AOD. Errors of 0.035 and 0.055 in AOD correspond to errors in AAOD ranging from 0.01 to 0.04 and 0.02 to 0.07 respectively. The fractional errors range from 5 to 100% and 10 to 150% respectively, reaching their maxima at the maximum SZA. These errors are minimal for maximum AAOD and become more important as AAOD decreases.
As a second step for the evaluation of the quality of the SSA and AAOD from Brewer measurements, the two products at 340 nm were recalculated using the AOD from CIMEL as input to the RTM. The derived quantities were then compared to those calculated using the AOD from Brewer#086. This way we investigated whether the differences between the AOD from Brewer#086 and CIMEL could introduce biases in the time-series of the SSA and the AAOD. The results are presented in Figure 1. Brewer#086 measures systematically lower AOD by ~0.01 at SZAs below 55°. Differences are larger (0.02–0.03) for SZAs near 70°. These differences in AOD are generally not important for the calculation of the SSA when AOD is higher than 0.3 or the SZA is smaller than 60°, introducing slightly lower SSA values (~5%) when AOD from Brewer#086 is used. The corresponding differences in SSA when AOD is ~0.1 and SZA is near 70° are of the order of −20%. Differences in the calculation of AAOD are on average below 10% for SZAs smaller than 55 ° and increase up to ~30% for SZAs near 70°.
Considering that CIMEL is a well-calibrated instrument, developed specifically for AOD measurements, and that the agreement between AOD from Brewer#086 and CIMEL is within the uncertainties of the later, the results presented in Figure 1 provide a very strong indication that the quality of the SSA and AAOD from Brewer#086 has been optimized after re-evaluating the direct and global UV datasets.
Long term drifts in the sensitivity of Brewer#086 could however introduce drifts in the measured AOD and corresponding biases in the time-series of the SSA and AOOD. Thus, as an additional quality criterion, the long-term changes of the annual mean ratio between the AOD at 340 nm from Brewer#086 and CIMEL for the period 2005–2017 (for which measurements from CIMEL are available), and the AOD at 320 nm from Brewer#086 and Brewer#005 for the period 1998–2017 (for which measurements from both, Brewer#005 and Brewer#086 are available) were evaluated. In both cases the detected trends in the annual mean ratio of close-in-time AOD measurements (within ± 15 mins) were insignificant and smaller than 0.01/decade.

3.3. Uncertainties Due to Default Ozone and Aerosol Profiles and Effect on Retrieved SSA

3.3.1. Extinction Coefficient Profiles

A default climatological aerosol profile (default vertical profiles of aerosol optical properties) [69] was used as input in the RTM calculations. In order to evaluate the effect of using a default profile, the SSA was re-calculated for 16 days (504 spectra) in the period 2013–2015 using extinction coefficient profiles measured by a Raman/elastic backscatter LIDAR operating at LAP [84,85,86,87,88,89]. For each of these days, one of the following aerosol species was dominant: dust, biomass burning, and continental. The differences in the calculated SSA when different profiles are used instead of the default are in all cases within ±0.04. The use of the default profile leads to a systematic overestimation of the SSA for highly absorbing mixtures (i.e., SSA below ~0.6) and low AOD (below 0.3). In this case the overestimation may be up to ~10%, which however is well below the overall uncertainties for low AOD. Based on this analysis, and assuming that the investigated sample is representative of the overall uncertainties related to the used aerosol extinction profile, we estimate a standard uncertainty of 0.02 in SSA (~2% for high AOD and ~5% for AOD below 0.3). The corresponding uncertainty in AAOD is 0.01. For SZAs larger than the limit of 70° assumed in the present study the effect of using the default profile is slightly larger.

3.3.2. SSA Profiles

The use of a default SSA atmospheric profile for the RTM simulations also introduces uncertainties. The SSA in the used profile slightly decreases with increasing altitude (by ~4% in the first 10 km), which however is not always representative for what really happens, especially in the UV region. In order to investigate the uncertainties related to the use of a climatological profile, the simulations were repeated using SSA profiles derived from the LIDAR measurements. The SSA profiles from LIDAR were retrieved using a simple method, providing extinction and SSA profiles which, although highly uncertain, are closer to reality than the default aerosol profile used for the RTM calculations, especially for cases where more than one of the predominant aerosol types are present.
Twelve different aerosol profiles of the SSA and the extinction coefficient at 340 nm were chosen and used. The used profiles represent cases when dust (4 of 12) or smoke (5 of 12) aerosol layers are present over and/or under less absorbing aerosols, as well as typical conditions when only continental aerosols are prevailing (3 of 12). The classification of different aerosol types was performed based on the minimum Mahalanobis distance from an ensemble of reference clusters (e.g., Papagiannopoulos et al. [90]). A more analytical description of the used methodology is provided in Appendix A. Although the SSA profiles from the LIDAR are uncertain, and not suitable for climatological analysis, they provide strong evidence that when a layer of highly absorbing (e.g., dust or smoke) aerosols is present over or/and under less absorbing (e.g., continental aerosols) the SSA can change significantly with altitude. When the constructed SSA profiles (combined either with the default or the corresponding measured extinction coefficient profiles) are used in the simulations, the difference in the calculated SSA is within ± 0.02 as long as the reference SSA is above 0.6 and AOD above 0.2. When the reference SSA is below 0.6 and AOD near 0.2, the default SSA profile leads to underestimation of the (effective) SSA (up to 0.05). In all studied cases the AOD was above 0.2. Due to the small number of cases with AOD below 0.3 (only 13 cases) only the uncertainties for large AOD are estimated. Although the present study is limited to SZAs below 70°, it is worth mentioning that the effect of the SSA profile becomes significantly more important for SZAs above 70°, especially for low AOD and SSA, when differences of up to ~0.1 were found.

3.3.3. Tropospheric Ozone Profiles

Default ozone profiles [67] were scaled to the measured total ozone in the RTM calculations. Part of solar UV radiation scattered by aerosols in the troposphere is then absorbed by ozone. Inaccurate description of this effect in the RTM simulations might lead to under- or over-estimation of the absorption by aerosols. Although the relative distribution of aerosol and ozone in the troposphere can affect the DG ratio, we could not find any study quantifying this effect. Thus, in order to investigate the sensitivity of the algorithm to changes in the profile of tropospheric ozone, a number of simulations were repeated for variable aerosol conditions in 2017 using tropospheric ozone profiles from a MAX-DOAS instrument operating at LAP [91,92]. These ozone profiles were retrieved based on external data sets for the stratospheric component [93]. As ozone profiles from the MAX-DOAS extend up to ~4–6 km, the average ozone mixing ratio at the highest available level was scaled to the corresponding value in the default ozone profile. Then, the new profile was again scaled to the total ozone measured by the collocated Brewer#005. In all cases, the differences in the calculated SSA were of the order of 0.01 (even for 310 nm), well below the overall uncertainties. Thus, this source of uncertainty was not taken into account in the calculation of the overall uncertainty budget. The methodology for the quantification of the uncertainties in SSA and AAOD from Brewer#086, as well as the results of the analysis, are discussed below. The uncertainties in the final products are mainly due to uncertainties in the measurements of Brewer#086, as well as uncertainties in other atmospheric parameters used as inputs for the RTM.

3.4. Other Uncertainties in the Calculation of the SSA

3.4.1. Total Ozone

The effect of the total ozone uncertainties in the retrieval of the AOD, mainly at 310 nm, has been taken into account in the estimation of the overall AOD uncertainties [59]. We additionally tried to quantify the effect of the uncertainties in total ozone on the simulations for the retrieval of the SSA. Simulations for 2015 were repeated keeping all the parameters the same, except total ozone. Based on the studies of Carlund et al. [83] and Fragkos et al. [94] an overall uncertainty of 2.3% in the retrieval of total ozone was estimated (due to uncertainties in the used cross sections, stratospheric temperature variations, calibration and measurement uncertainties). The change of the calculated SSA due to a change of 2.3% in the total ozone column used in the simulations is in all cases (even at 310 nm) lower than 0.01 (thus not detectable).

3.4.2. Surface Albedo

The available measurements of the surface albedo at 440 nm from AERONET (version 3-level 2) for the period 2005–2017 were analyzed resulting to a median value of ~0.08 which varies randomly by about ±0.03 throughout each year. A number of studies show that over urban environments surface albedo is gradually decreasing from VIS to the UV-B (e.g., Feister and Grewe [95]). In Corr et al. [33] it is shown that if a spectrally dependent surface albedo which decreases by ~0.035 from 368 to 332 nm is used in the RTM, the average SSA at 332 nm is higher by ~0.03 relative to the corresponding SSA for a spectrally flat surface albedo. The results of the later study refer, however, to measurements for average AOD of 0.2–0.3. By performing RTM simulations we confirmed that a difference of 0.03 in the albedo corresponds to a difference of ~1% in the DG ratio, which is not important for AOD above 0.3 but may lead to differences of up to 5%–8% in SSA when AOD is ~0.1. Since measurements of the surface albedo in the UV for Thessaloniki are not available, and the variability in the surface albedo for VIS is ±0.03, we decided to use a spectrally independent albedo of 0.04. Although surface albedo is larger when the city or the surroundings are covered by snow, these occasions are rare (zero to a few days in a year) in Thessaloniki, and usually coincide with overcast sky. Assuming a maximum error of 0.03 in the used value of the albedo, an uncertainty of 5% is estimated for AOD below 0.03. For higher AOD the uncertainty is though below 1%. In all cases the uncertainty in AAOD is 0.01.

3.4.3. Absorbing Gases

The two main absorbing gasses in the UV region, excluding ozone, are sulfur dioxide (SO2) and nitrogen dioxide (NO2). The former was not taken into account in the simulations for the calculation of the SSA. For the later, default monthly averages for the period 2012–2016 [91] were used for the simulations, as well as for the retrieval of the AOD. The effect of the particular gases in the retrieval of AOD [96] has been already taken into account in the estimation of the overall uncertainty budget for AOD. In order to estimate the effect of not (accurately) taking into account the absorption by the particular gases in the simulations for the calculation of the SSA, the direct to global ratio for different NO2 and SO2 optical depths was calculated assuming SZAs between 20° and 70° and AOD between 0 and 1. For total columns of NO2 between 0 and 10 DU and SO2 between 0 and 5 DU (total columns of SO2 and NO2 over Thessaloniki are generally smaller), the change in the ratio is always below 1%, and the corresponding uncertainties in the calculation of the SSA are negligible.

3.4.4. Aerosol Asymmetry Parameter

A constant asymmetry factor of 0.7 has been used for the simulations. This value was chosen after analyzing the asymmetry factor at 440 nm from AERONET for the period 2005–2017, and calculating an average value of 0.69 ± 0.03. Given that the asymmetry parameter is generally increasing with decreasing wavelength in the visible, a slightly higher value of 0.7 is used for the UV. Discussion regarding the uncertainties due to the use of a default value for the particular parameter can be found in Khatri et al. [46] and Kazadzis et al. [36], concluding in both studies that the relative uncertainties are negligible. Their results are confirmed if we accept that the uncertainties are solely due to the spread in real values of the asymmetry parameter at 440 nm (in this case the standard deviation is 0.03 introducing negligible uncertainty). However, there are two additional sources of uncertainty [97]:
(1)
There are no available measurements allowing to accurately quantify how the asymmetry parameter changes as a function of wavelength in the UV spectral region. Although for the calculation of the SSA in the UV we use a representative value for 440 nm, the corresponding asymmetry parameter for wavelengths 310–360 nm may differ significantly.
(2)
There are measurement uncertainties and biases (e.g., finite field of view of the CIMEL), as well as uncertainties due to the assumptions and the simplifications in the AERONET algorithm (e.g., assumption of spheroids, used refractive indexes and uncertainties in particle size distribution), which are introduced in the retrieval of the asymmetry parameter [98,99].
Accurate quantification of the above uncertainties is a very hard task and is out of the scope of the present study. The later Assuming that the standard uncertainty in asymmetry parameter can be as large as 0.1, the relative uncertainties for SSA and AAOD would be of the order of 0.04 and 0.03 respectively. The later quantities show that uncertainties due to the used asymmetry factor may be important. Due to the lack of more reliable estimates of the uncertainty related to the used asymmetry parameter, we use the later values for the calculation of the overall uncertainty budget.

3.5. Overall Uncertainties in the Retrieval of the SSA and the AAOD

A summary of the uncertainties in the calculation of the SSA and the AAOD due to the effect of all factors discussed above is provided in Table 1. The uncertainties for 310 nm are discussed independently from those for 320–360 nm, and are reported only for SZAs smaller than 55°. Separate quantification has also been performed for two classes of AOD values, above and below 0.3. Standard uncertainties due to errors in the DG ratios and AOD have been assumed equal to the error in the calculation of the SSA introduced by the ± 1σ uncertainties in the DG ratios and the AOD. Since the relative uncertainties may be extremely large (and in some cases misleading regarding their actual impact), only the absolute uncertainties are reported in Table 1.

4. Wavelength Dependence

The limitations applied on the data used in this section (see Section 2) lead to decreased uncertainties relative to those reported in Table 1, especially for the AAOD. The standard uncertainty in AAOD for the data presented in Figure 2 is ~0.03 for wavelengths 320–360 nm and ~0.05 for 310 nm. Results for four selected Brewer wavelengths (310, 320, 340, and 360 nm) are shown in Figure 2, while results for all available VIS and NIR wavelengths (440, 675, 870, and 1020 nm) are presented for CIMEL.
From Figure 2 it is clear that the absorption efficiency of aerosols over Thessaloniki increases fast in the UV, resulting to much higher AAOD relative to that for VIS wavelengths. This increase of the AAOD with decreasing wavelength is typical for aerosol mixtures dominated by accumulation mode fine dust particles [100,101,102]. At 310 nm the median AAOD (~0.11) is an order of magnitude higher than the corresponding value for 675 nm (~0.01). In all cases, the differences between the AAOD in the UV and VIS are larger than the standard uncertainty in the retrieval of the AAOD.
The higher absorption efficiency in the UV results in lower SSA values. The median SSA is 0.92–0.93 for VIS wavelengths, and 0.91–0.92 for NIR. The corresponding values in the UV-A region are ~0.86–0.87, while at 310 nm the median is ~0.84. SSA decreases from 440 to 360 nm (by 0.05–0.06) and with a lower rate from 360 to 320 nm. Important decrease is again noticed from 320 to 310 nm (~0.02). However, in all cases the differences between UV and VIS are of similar magnitude with the uncertainties in the retrieval of the SSA. The median values shown here are not representative for the whole year, as most winter time measurements are not included due to the SZA limitation. Additionally, the number of available measurements for summer is larger than for other seasons due to much lower cloudiness. The results presented in Figure 2 are in good agreement with the results reported in other studies [33,36,38].

5. Short- and Long-Term Variability

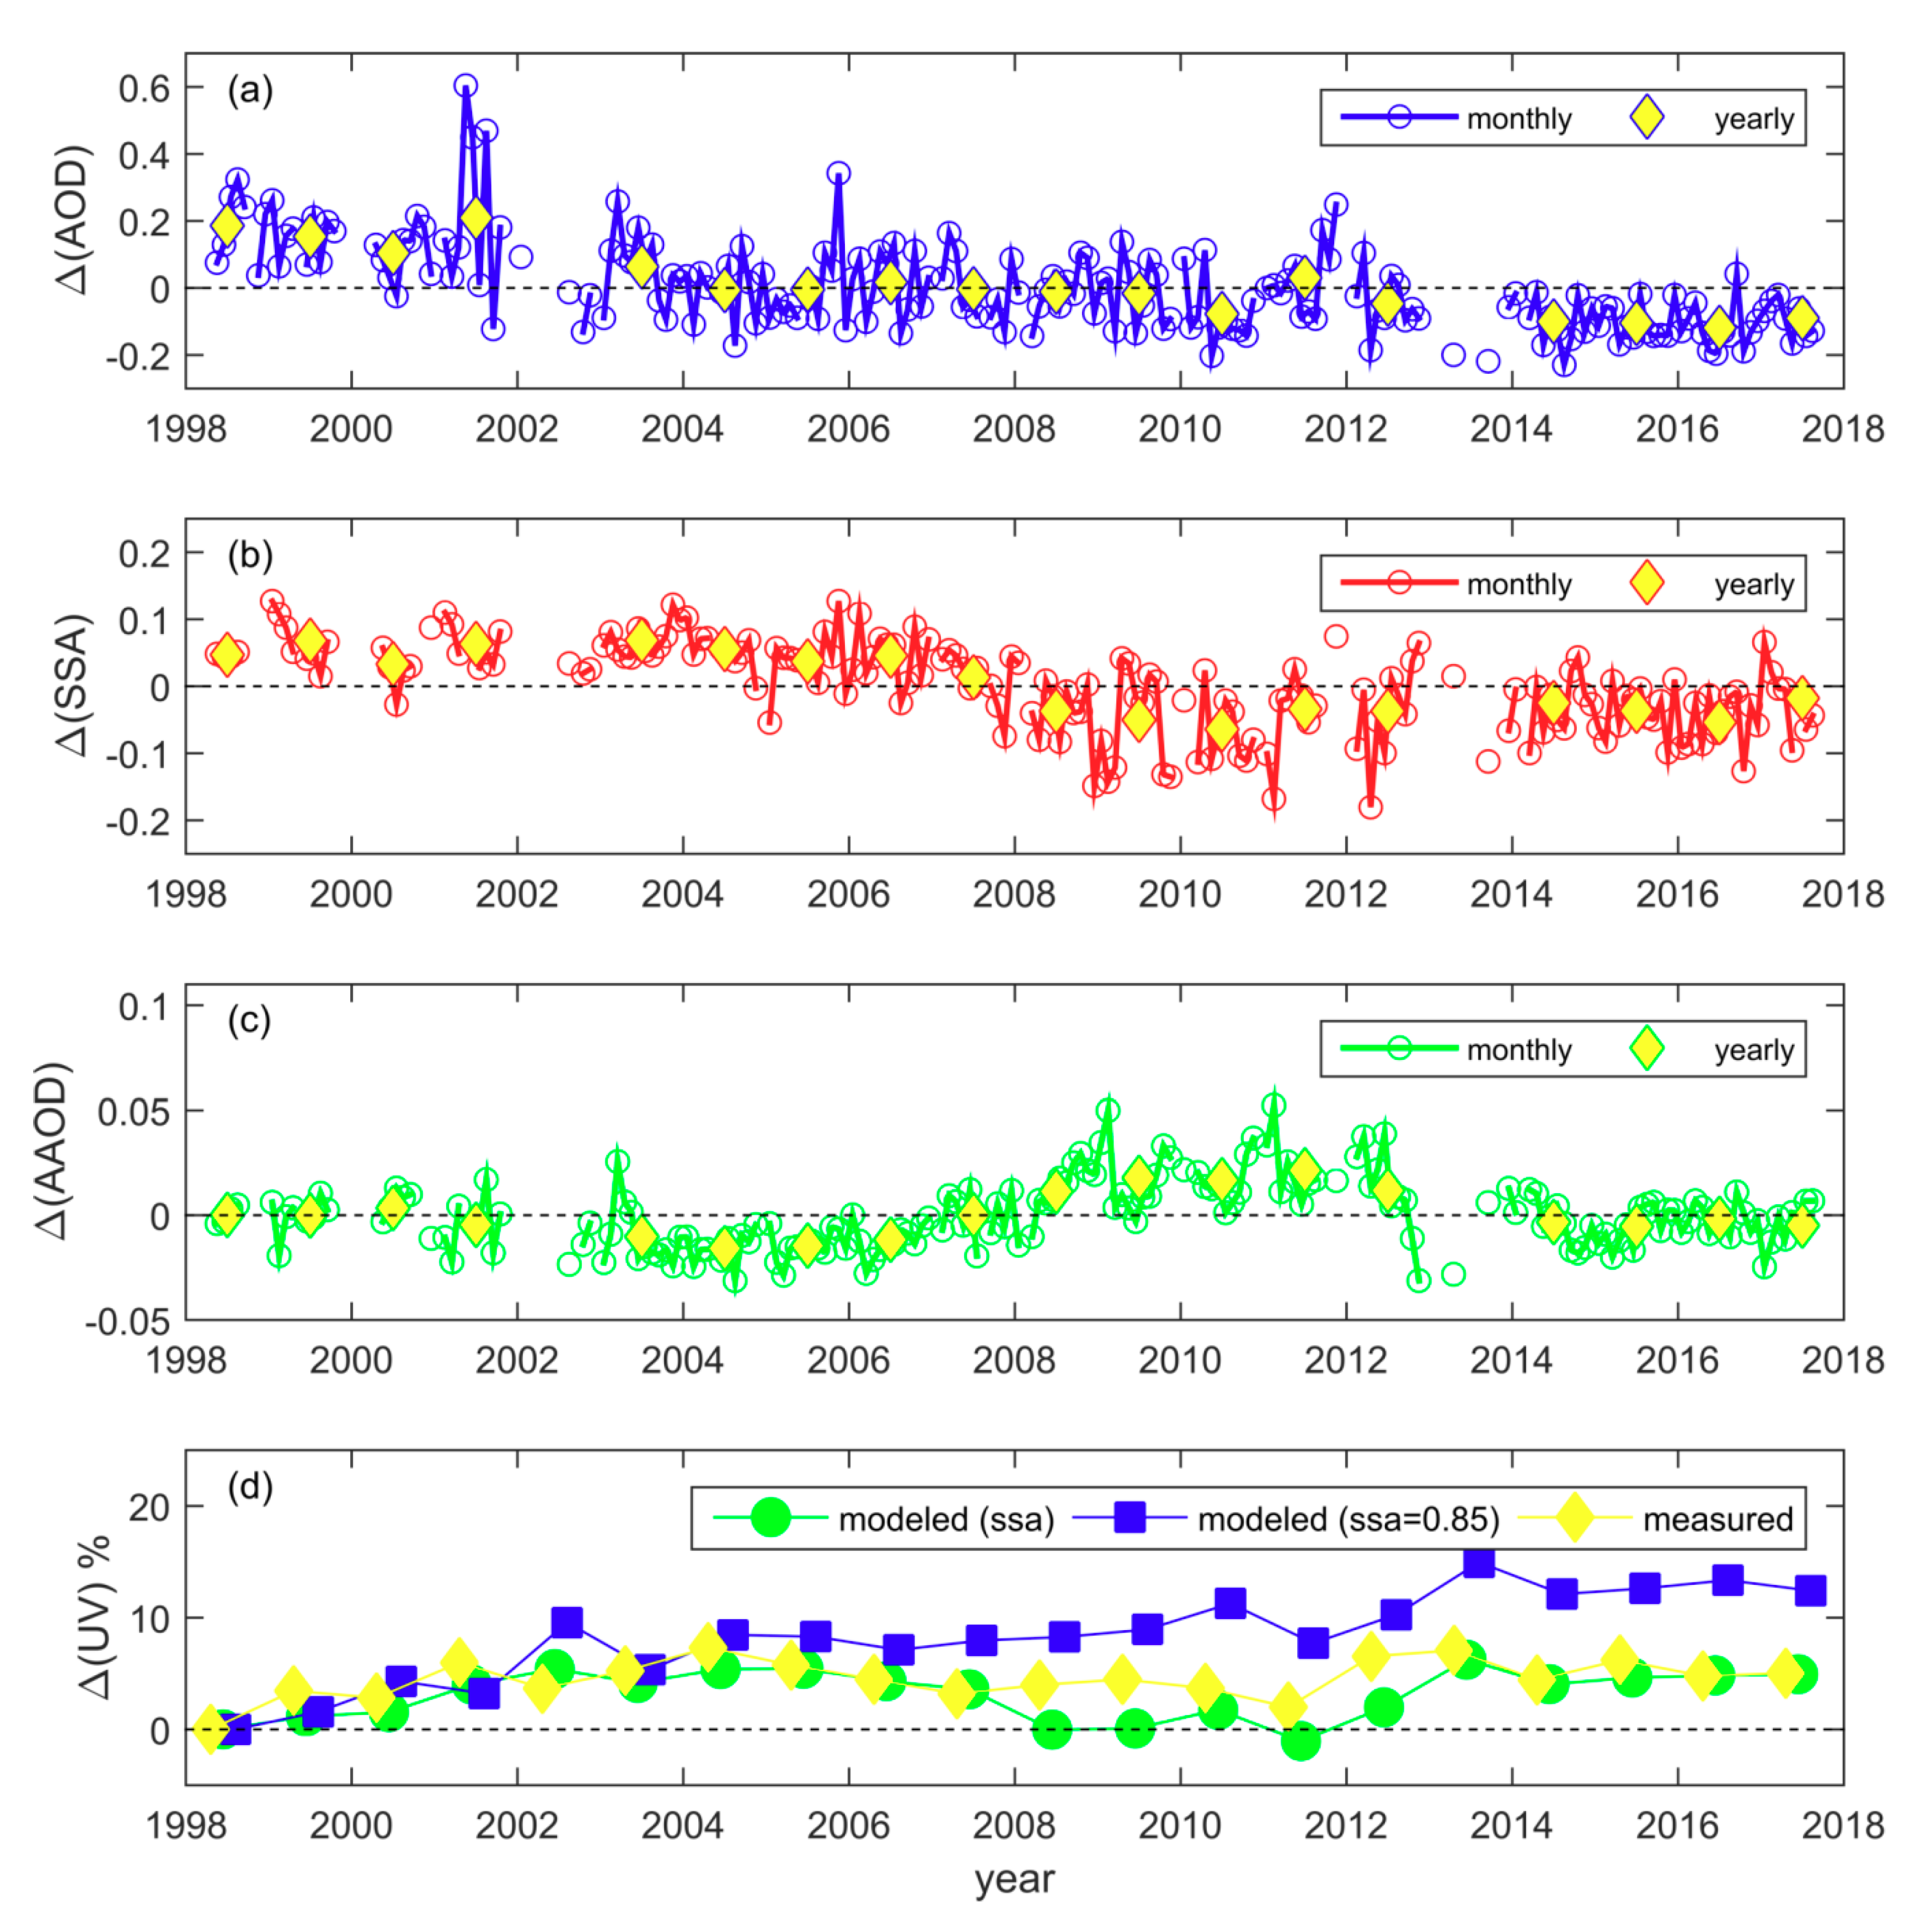
5.1. Annual Variability

In Figure 3, the monthly climatological values for the AOD, the SSA, and the AAOD are presented for 2005–2017, as well as the corresponding measurements at 440 nm from the CIMEL for the same period. The monthly averages presented have been derived from all available measurements of CIMEL and Brewer#086 (i.e., no temporal matching has been applied). The optical properties from the enriched level 2 CIMEL dataset have been retrieved the same way as the optical properties from Brewer#086.
The monthly AOD in UV wavelengths over Thessaloniki is minimum in winter and maximum in the summer, ranging from ~0.35 to 0.5. Comparison between 360 and 440 nm shows that the spectral dependence of the AOD is stronger in the summer resulting to less pronounced annual cycle for longer wavelengths. This is also evident from the comparison between different UV wavelengths, although differences are small, well below the standard deviation of the monthly averages. This behavior could be related to increased fine aerosol during summer. These results are generally in agreement with the results of previous studies [62,84,86,87].
The monthly average SSA is greater in summer than in winter. In winter, the difference between the SSA in the UV and the VIS is much larger than the standard uncertainty in the retrieval of the former, proving that the SSA in the UV is much lower during this particular season. Again, the annual cycle of SSA in the UV is more pronounced than the annual cycle for 440 nm. The SSA at 440 nm ranges from ~0.9 (in winter) to ~0.93 (in summer). The SSA at 360 nm ranges from ~0.7 in winter to ~0.87 in summer, while for 320 nm, the SSA is different only in summer (~0.86).
In the case of AAOD the spectral dependence is stronger than for SSA and AOD, though within the uncertainty of the AAOD retrieval. The pattern of the annual variability of the AAOD in the UV exhibits two maxima, one in December–January (AAOD ~0.07–0.08), and one in August (AAOD ~0.06–0.07). The maximum in August corresponds to high SSA and to the maximum monthly average AOD in the year, which means that it is mainly due to the very high AOD although aerosols are not as absorbing as in winter. The very high AOD in summer results mainly from the meteorological conditions prevailing over the city during this season as has been analytically discussed in previous studies [62,103,104]. The winter maximum of AAOD corresponds to the lowest AOD and SSA values in the year, indicating an increased amount of highly absorbing particles in the aerosol mixture during this particular season. There is no obvious annual pattern for 440 nm, for which the average AAOD varies randomly between 0.015 and 0.023. The high AAOD levels in winter are possibly due to increased emissions of highly absorbing aerosols from domestic heating [105].

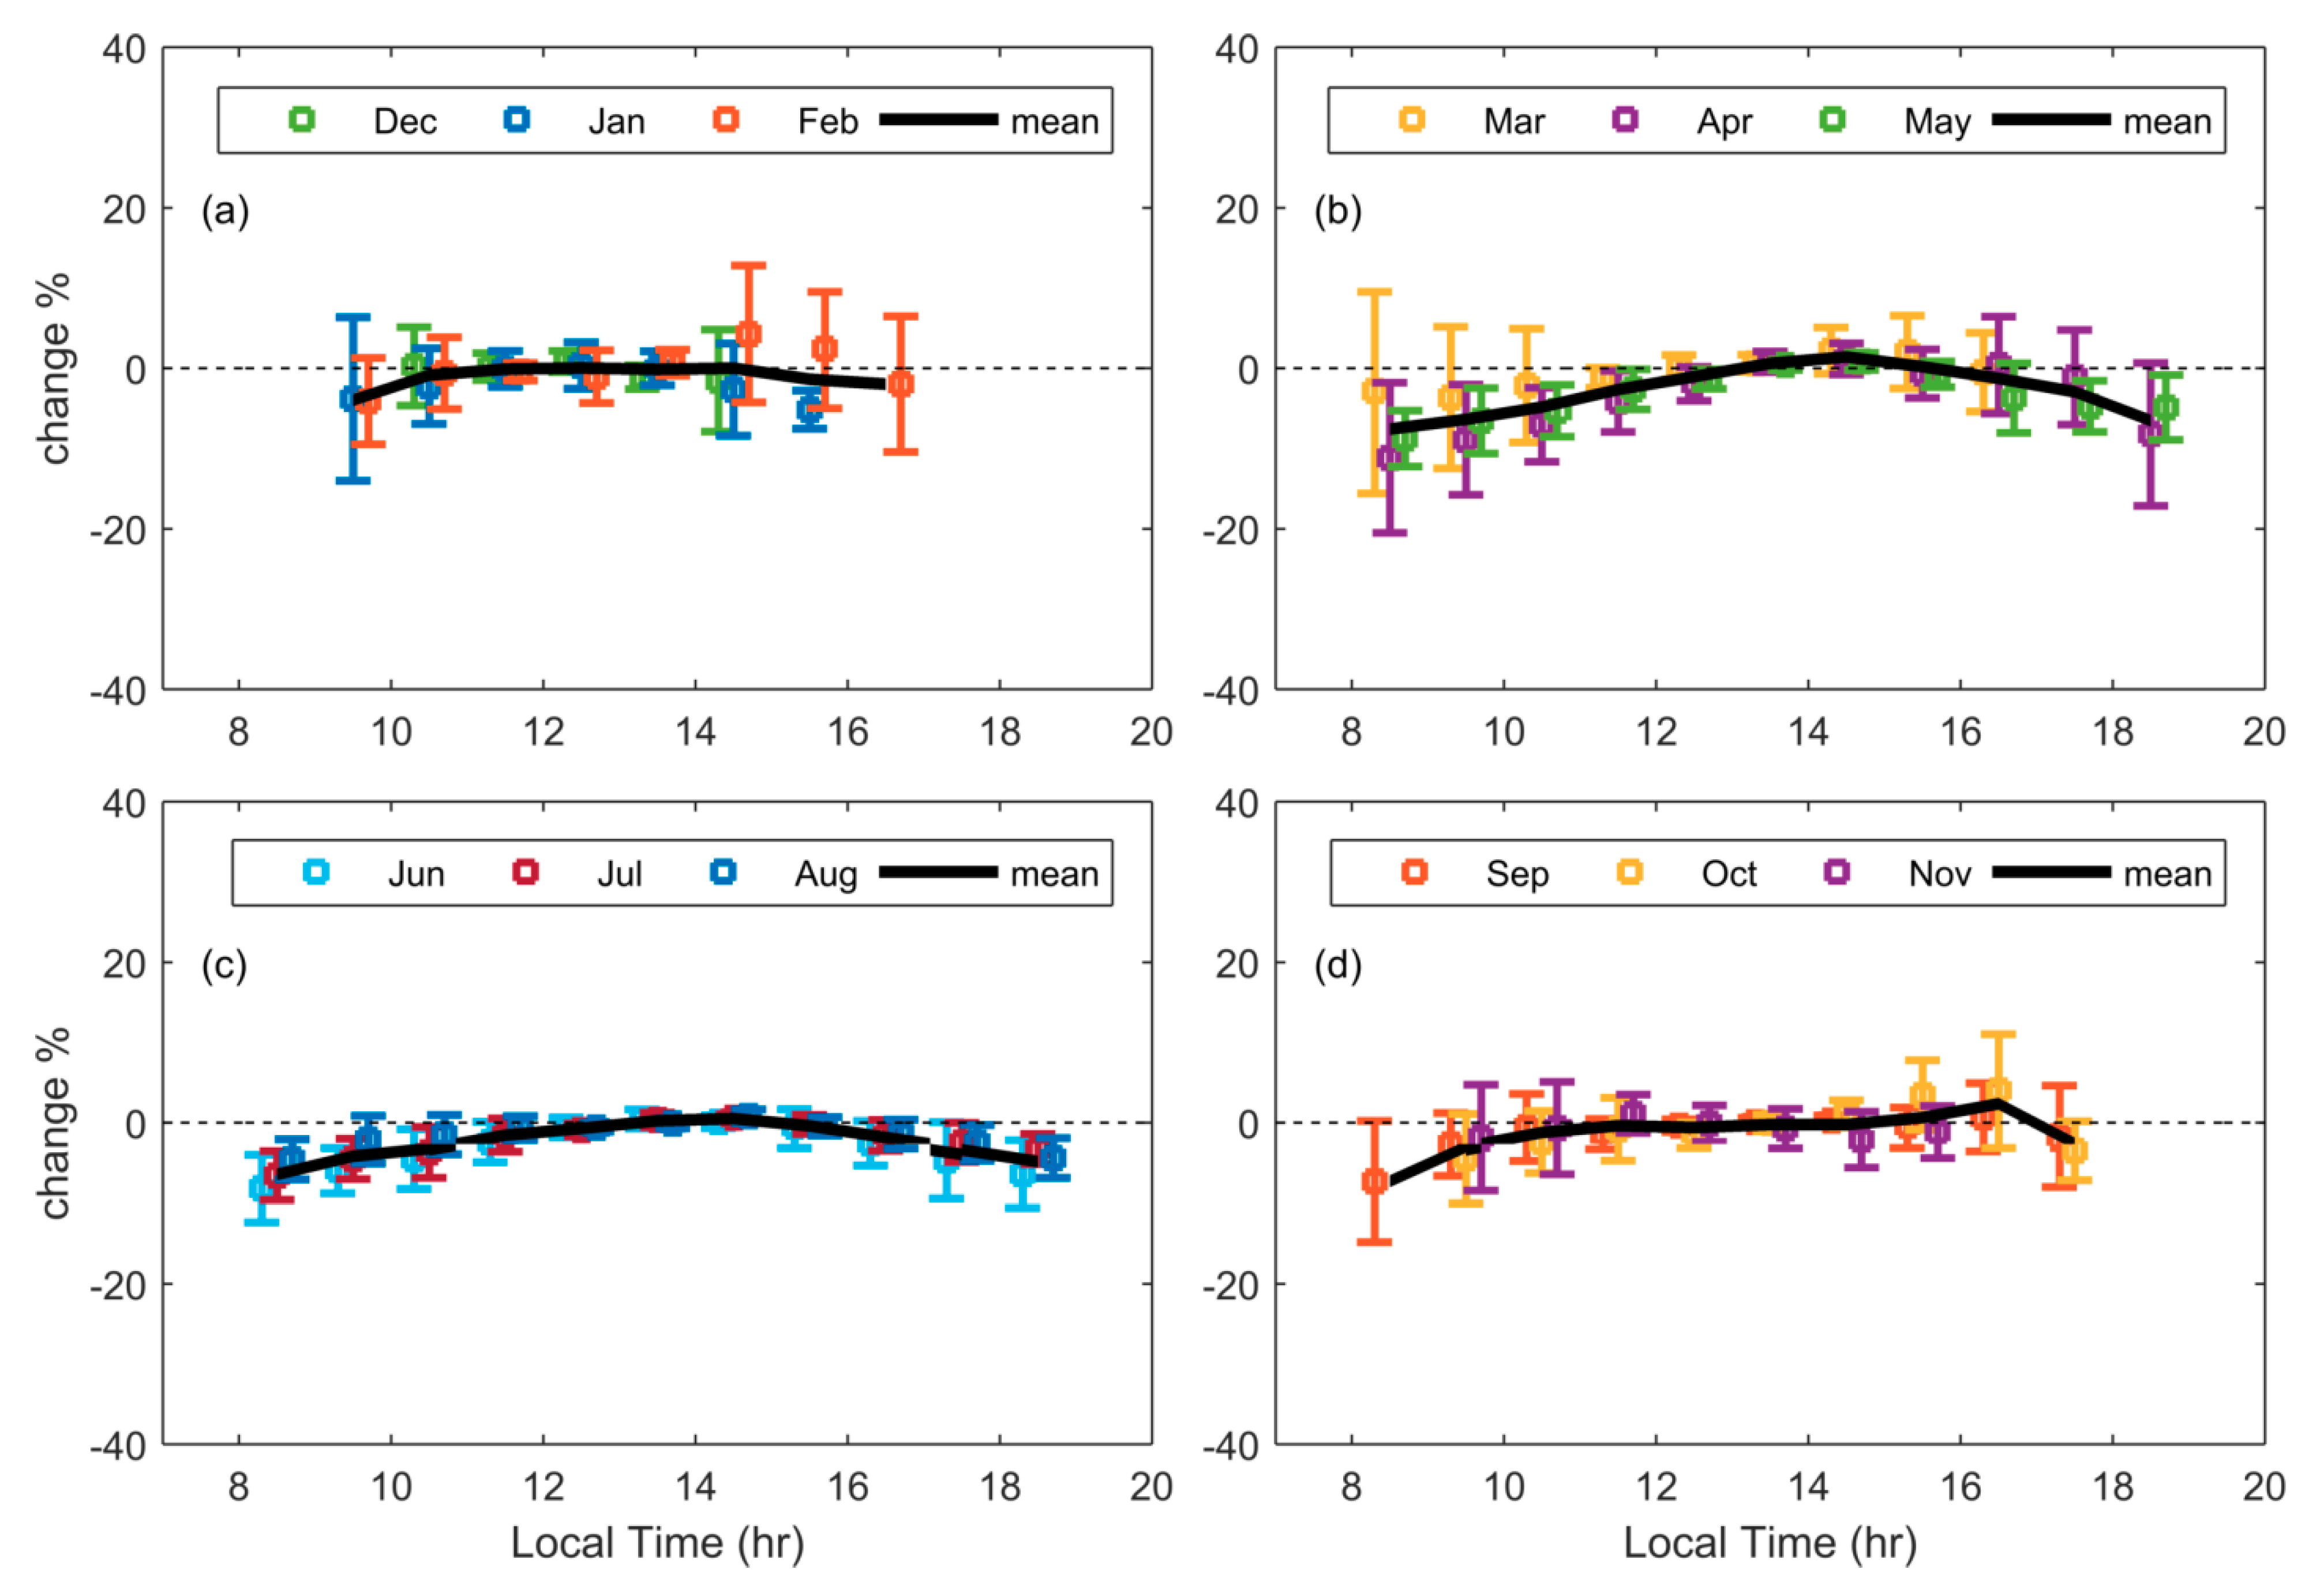
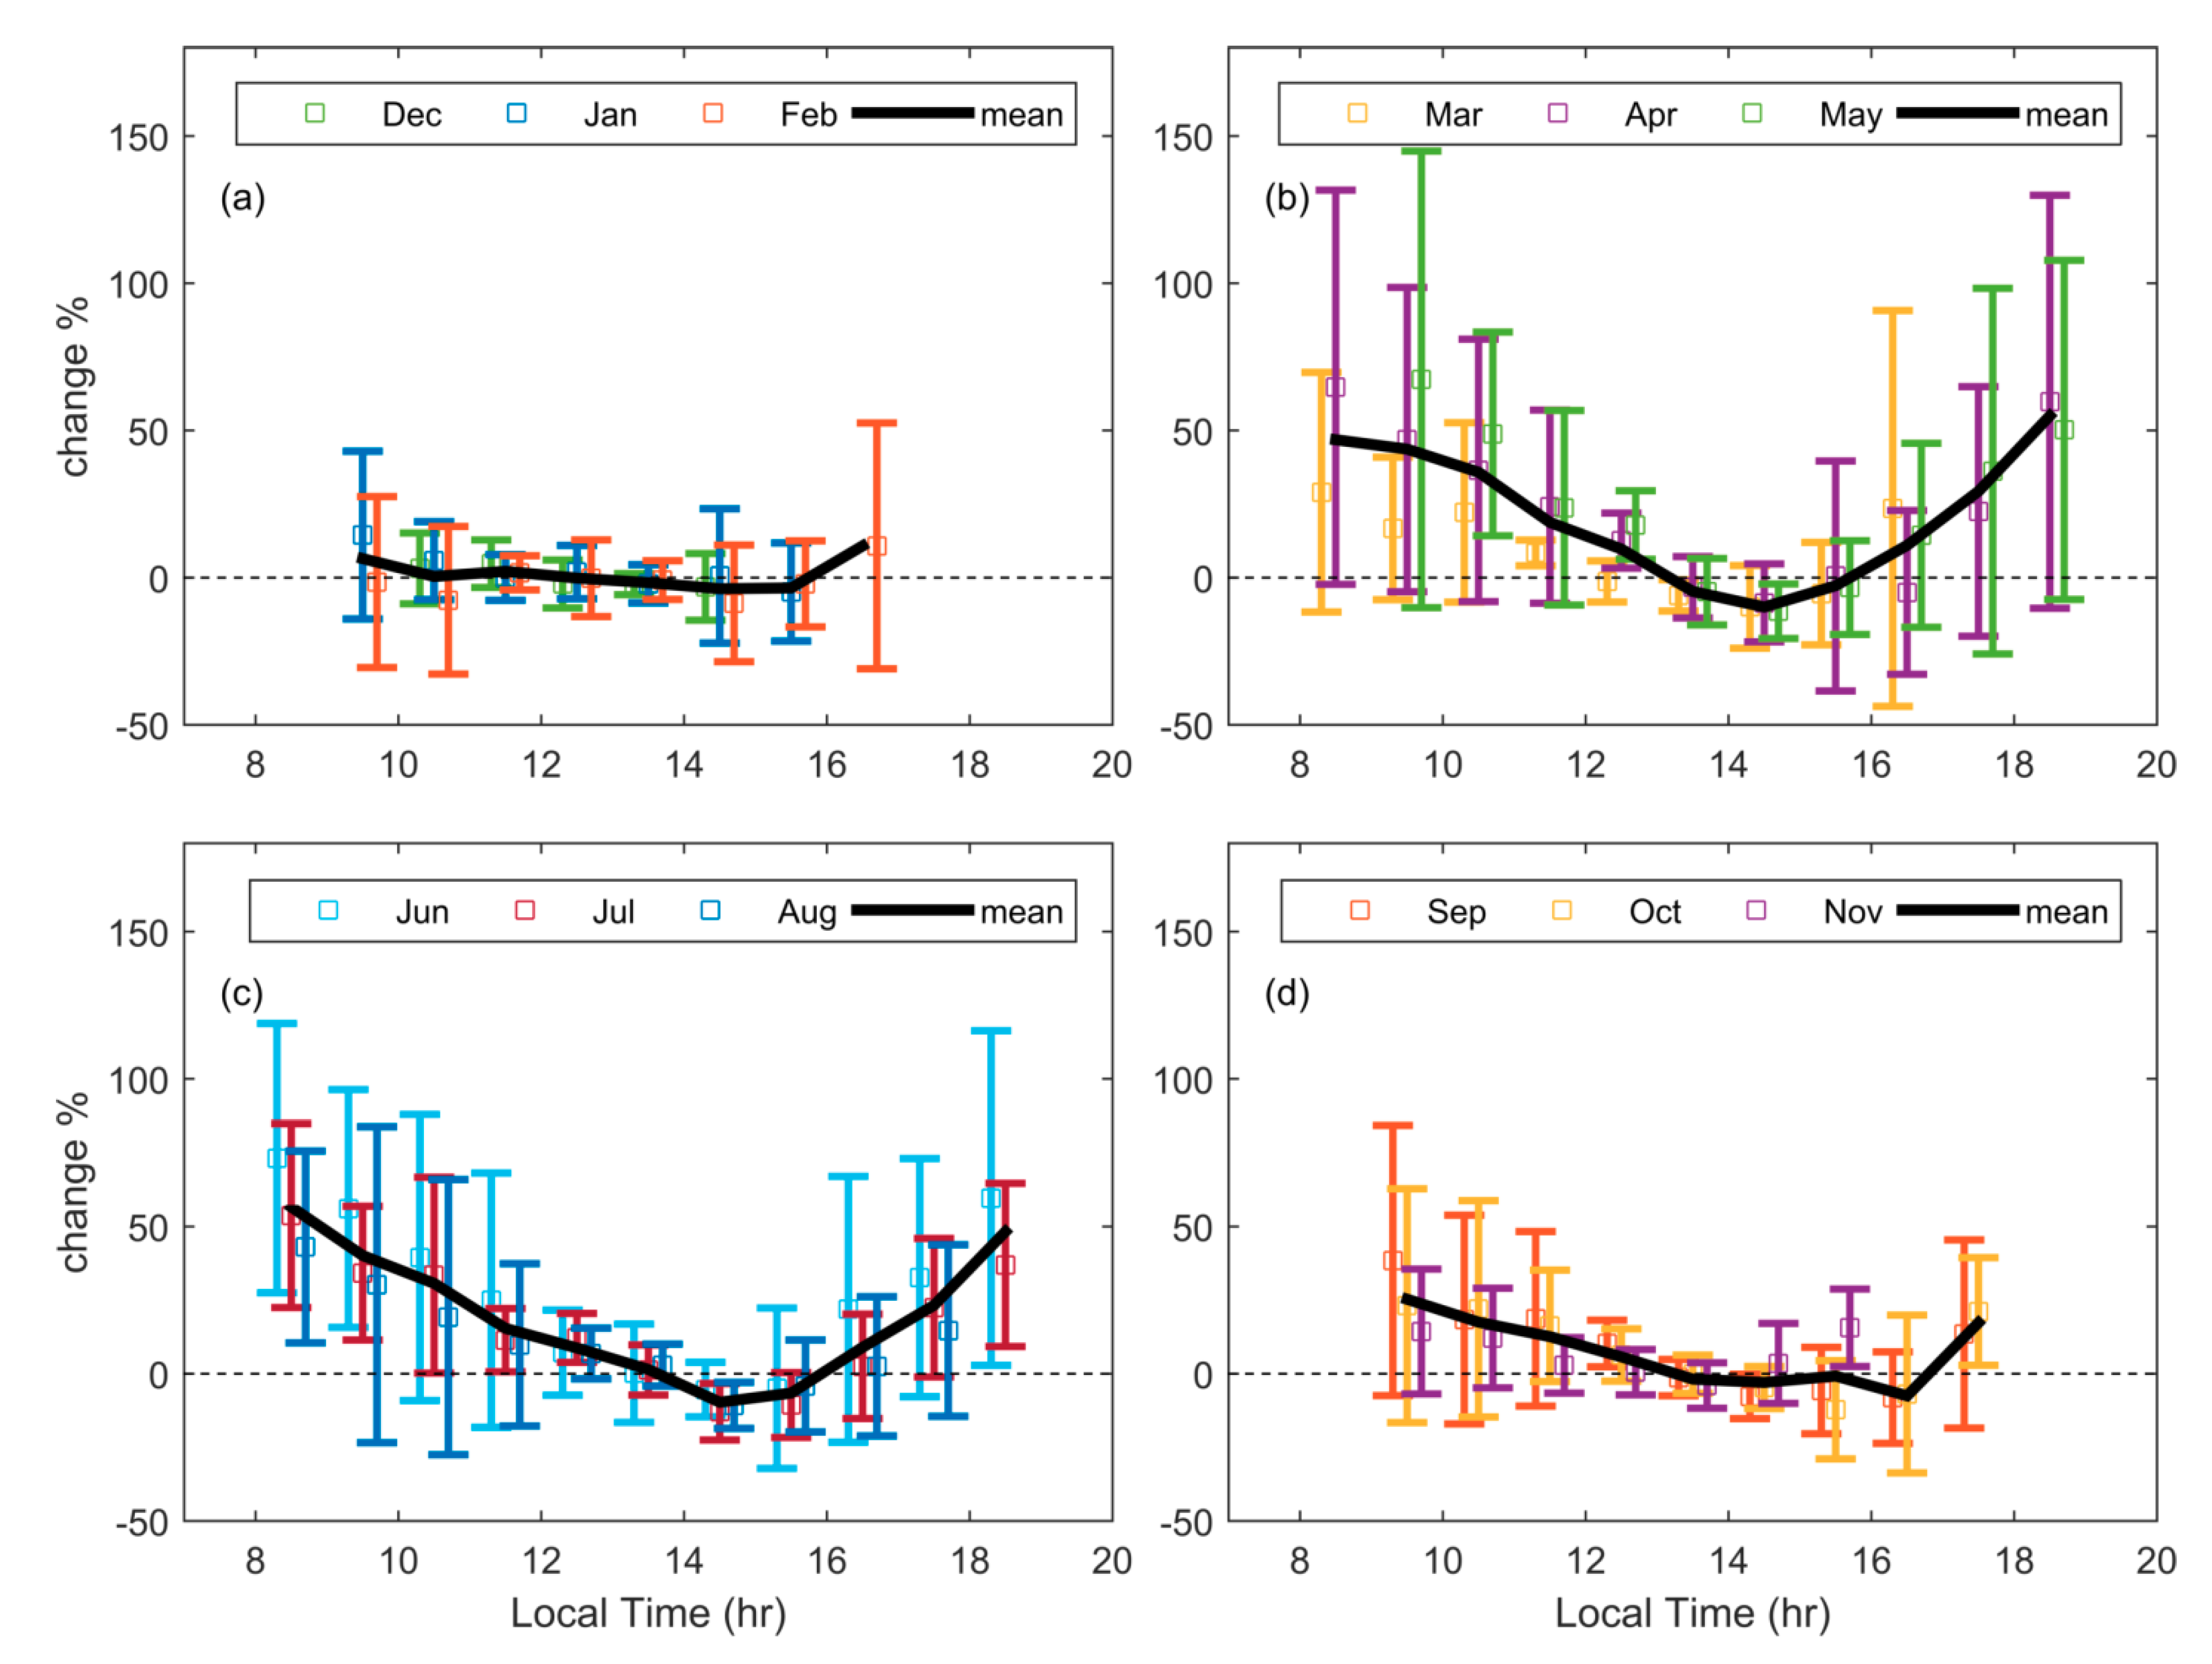
5.2. Diurnal Variability

The diurnal cycle of absorbing aerosols has been studied with respect to local time (LT) instead of universal time (UTC), in order to correlate the results with the local activities. The used range of SZAs (less than 70°) allows the study of the variability between 8:00 and 19:00 LT in summer and 9:00–17:00 in winter. For each day, the difference (in %) of each hourly value (average for each hour of the day, e.g., 8:00–8:59, 9:00–9:59, …) from the noon value (average of data within ±1 h around the local noon) was calculated and were subsequently used to derive monthly hourly differences. Finally, the monthly values were averaged over the whole 15-year period to derive the climatological diurnal cycle for each month. The analysis was performed for data of Brewer#086 at 320–360 nm for the period 2003–2017. Similar analysis using data from CIMEL is not feasible due to the limited range of SZAs for which measurements are available. The pattern of diurnal variability does not change significantly for wavelengths between 320 and 360 nm. Thus, only the results for 340 nm are presented in Figure 4 and Figure 5. Values on the x-axis correspond to the exact hour of the day (e.g., 8 corresponds to 8:00).
The diurnal variability of the SSA (Figure 4) follows a standard pattern throughout the year: Average values are low in the morning (8:00–11:00 LT), they increase by ~5%–8% until ~15:00 LT and slightly decrease in the evening by 1%–5%. The diurnal variability of the AAOD (Figure 5) is almost identical in spring and summer: A gradual decrease of ~50%–60% from 8:00 to 15:00 LT, and then an increase of similar magnitude in the following four hours. In winter and autumn, the average % change in AAOD is smaller than in spring and summer for the same hours. This behavior is possibly related to seasonal differences in the relative contribution of the main sources of absorbing aerosols.
Measurements at the center of Thessaloniki show that on an annual basis the main contributing source of aerosol pollution is vehicular traffic [105]. Comparison of the results shown in Figure 5 with traffic patterns in Thessaloniki [106] or other European cities (e.g., Järvi et al. [107]), clearly shows that the diurnal variability of the AAOD in spring and summer resembles the traffic pattern at the center of Thessaloniki. In winter however, highly absorbing organic aerosols emitted by oil combustion or biomass burning for domestic heating are an important fraction of the aerosol mixture [105,108] and possibly have a strong effect on the diurnal variability of AAOD. The very large standard deviation in the results of Figure 5 indicates, however, that during individual days the diurnal course may differ significantly from the average. Furthermore, aerosols which strongly absorb UV radiation (such as biomass burning aerosols or Saharan dust) are frequently transferred from remote areas [62,86,103,104,109], and possibly disturb the diurnal cycle of SSA and AAOD, which as discussed above, seems to be mainly attributed to aerosols emitted from local sources. Finally, it should be mentioned that the same patterns for the SSA and the AAOD are found also for smaller time periods (e.g., 2009–2013) and/or only for AOD larger than 0.3.

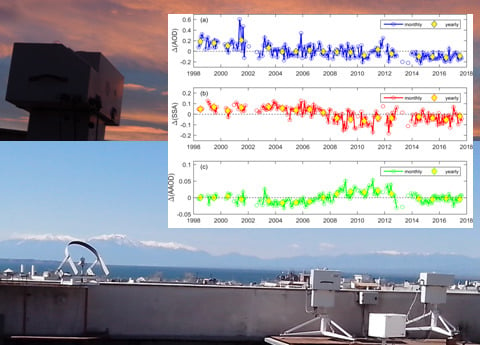
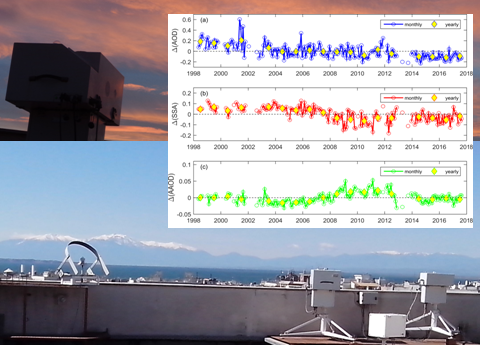
5.3. Long-Term Variability

Monthly and annual mean anomalies of the aerosol optical properties for the period 1998–2017 are presented in Figure 6. Again, only results for 320 nm are shown since the results for all wavelengths in the range 320–360 nm are very similar to each other. As already mentioned in Section 2, only data for SZAs between 50° and 70° were used in order to have a homogeneous dataset for the full period 1998–2017. Daily climatological values were calculated from the daily averages, as discussed in Section 5.1, and subtracted from the measurements to derive daily anomalies. Daily anomalies were then averaged for each month and monthly anomalies were calculated, only when at least ten daily values were available. Then annual mean anomalies were derived only when monthly means were available for at least six months. The results for AOD, AAOD, and SSA are presented in panels (a)–(c) of Figure 6, respectively.
AOD decreases by ~0.1 from 1998 until the mid-2000. In the same period the annual mean SSA does not change significantly. However, when data only for the period March–November are used, SSA increases by ~0.03, in agreement with the results of Kazadzis et al. [26]. In the same period, the AAOD decreases by ~0.02 (when data for all months of the year are considered). From mid-2000 until 2017, AOD decreases again by ~0.1, while the SSA decreases by ~0.07.
The AAOD increases fast from 2006 to 2009. The highest AAOD levels of the entire period of study have been recorded between 2009 and 2011 (~0.02 above the average level for the entire period and ~50% above the 2003–2006 average). AAOD is also high in 2008 and 2012. For 2013 there is not enough data to get safe conclusions, while from 2014 and on, AAOD returns to its average 1998–2002 levels. The elevated AAOD levels in the period 2009–2011 are mainly due to the very high AAOD values in winter (~50% above the average level for 1998–2017). This is in agreement with the results of several recent studies reporting increased emissions of biomass burning and wood smoke aerosols [106,108,110], as well as high concentrations of other pollutants [111] in the particular period relative to the period before 2009. The increases in aerosol reported by all these studies are attributed to the increasing use of wood and pellets instead of oil and natural gas for domestic heating, after the beginning of the economic crisis in Greece [112]. However, increased AAOD levels by ~10%–20% relative to the long-term average have been calculated even for the warm months (April–September) of the same period. Part of this increase may be related to the increased road dust emissions due to the metro-railway construction works in Thessaloniki after 2008 [105,113]. The return of the AAOD to the 1998–2002 average levels (still higher by ~0.01 relative to the 2003–2006 average) after 2012 could be due to reduced traffic activity (and consequently reduced emissions), related again to economic factors [114]. However, further investigation, which is out of the scope of the present study, is necessary in order to identify the causes of the above results more accurately.
Using the calculated monthly averages of AOD and SSA as inputs in the RTM, the spectral UV irradiance at 320 nm was calculated for the entire period of study. Simulations of irradiance at 320 nm were also performed using a default value of 0.85 for the SSA and the monthly averages for AOD. For each of the two simulated datasets, the difference between the irradiance for each month and the corresponding month of 1998 was calculated. Then, the monthly differences were averaged for each year. The time series of annual means for the two simulated datasets are presented in Figure 6d and compared with clear-sky measurements of Brewer#086 at the same wavelength for 60° SZA (59°–61° average). The annual anomalies for the measured irradiance were calculated using the methodology of Fountoulakis et al. [24] and were also normalized to 1998 values. Despite the differences in the methodology to derive the annual differences for the modeled and the measured irradiances, the short- and long-term variability of the measured irradiance follows quite accurately the modeled irradiance when the calculated SSA is used as input. In both cases an increase of ~5% in UV is evident for the twenty-year period of the study. Though, when the default SSA is used in the simulations, a long-term increase in irradiance of ~12% is derived. Figure 6d clearly shows that modeling and reconstruction of solar UV radiation from ancillary data may be misleading regarding the changes of UV radiation over polluted environments, if changes in the SSA are not taken into account.

6. Conclusions

In the present study the SSA and the AAOD over Thessaloniki, Greece, for the period 1998–2017 have been calculated. The methodology described in Bais et al. [32] has been followed, which is based on the calculation of the ratio between nearly simultaneous direct and global spectral UV irradiance measurements from a double monochromator Brewer spectrophotometer, and comparison with the corresponding ratios calculated using a RTM. The uncertainties in the radiative transfer inputs, as well as those of the direct to global irradiance ratios have been assessed in order to quantify the corresponding uncertainties in the derived SSA and AAOD. For 320–360 nm the standard uncertainty in the SSA is 0.11 for AOD at 340 nm above 0.3 and exceeds 0.30 when AOD is below 0.1. The estimated uncertainty in the calculation of the AAOD is 0.05, independent of AOD. Uncertainties are greater for 310 nm. We conclude that the main contributor to the overall uncertainty budget is the uncertainty in the determination of AOD.
The uncertainties in the calculation of the SSA and AAOD from Brewer#086 are much larger relative to the uncertainties of the corresponding level 2 products of AERONET (0.03 for SSA and 30% for AAOD) [115], mainly due to the higher uncertainty in the AOD measured by Brewer#086 in the UV (0.035 at 340 nm) relative to the uncertainty in the AOD measured by CIMEL in the VIS (0.02 at 440 nm) and the more stringent filtering applied to AERONET level 2 products. SSA and AAOD in the UV are not available by AERONET, and even in the VIS region the availability of the particular products is low due to applied filtering.
The uncertainties in the SSA and AAOD from Brewer#086 are comparable with the uncertainties reported for wavelengths below 360 nm in other studies [36,38]. Thus, the results of the analysis show that well-maintained and calibrated Brewer spectrophotometers are able to provide measurements of the SSA and the AAOD in polluted environments (such as Thessaloniki), which are of similar quality to those of other instruments explicitly designed for aerosol measurements. It is however also obvious that there is a need to improve the accuracy of measurements of AOD in the UV, in order to achieve more reliable SSA and AAOD, since their uncertainties are currently very large. The recent progress in the QA/QC procedures of Brewer measurements [116], and in particular the improvement of the AOD retrieval [117], may result to further reduction of uncertainties in the future.
Despite the large uncertainties, no significant bias or dependence (e.g., change with time or SZA) when the AOD from Brewer#086 is compared to other instruments. This provides strong evidence for the reliability of the results presented in Section 4 and Section 5, considering that AOD is the most important uncertainty factor for the calculation of the SSA and the AAOD. When the AOD from CIMEL is used for the calculation of the SSA and the AAOD instead of the AOD from the Brewer, differences depend slightly on SZA (within the uncertainty of the CIMEL) and are nearly normally distributed around their averages. The average differences are below 0.02 for the SSA and 0.01 for the AAOD. Additional comparison of the AOD and the spectral UV irradiance from Brewer#086 with measurements of Brewer#005 for the entire period of study ensures that there is no important change in the behavior of the former two quantities which could affect studies of the long-term changes of the SSA and the AAOD. It is also worth mentioning that the year to year variability of the annually averaged difference between the AOD at 340 nm from CIMEL and Brewer#086 for the period 2006–2017 never exceeds 0.01, which also provides strong evidence that the increasing annual averages of the AAOD observed in the period 2008–2013 are real.
Analysis of SSA and AAOD from Brewer#086 and CIMEL confirmed the findings of other studies reporting that the absorption efficiency of aerosols over urban environments increases significantly in UV relative to VIS wavelengths [33,36,38]. More specifically, it is shown that the SSA decreases from ~0.92 at 440 nm to ~0.87 at 360 nm. From 360 to 320 nm the SSA still decreases, though the decrease is slow and well below the uncertainty in the retrieval of the SSA. From 320 to 310 nm the SSA continues decreasing fast (from ~0.86 to 0.84). Thus, linear extrapolation from VIS to UV wavelengths would lead to overestimation of the SSA. For AOD (at 340 nm) greater than 0.3 and SZA within 45–55° the median AAOD at 310 nm for the period 2005–2017 is an order of magnitude larger than the corresponding median AAOD at 675 nm, showing that the absorption efficiency of urban aerosols in the UV-B region is much larger than in VIS.
During the warm months of the year, the daily variability of AAOD follows the pattern of traffic in the city center, with maximum values in the morning and evening, and 30%–50% lower values between 14:00 and 16:00 LT. In the colder autumn and winter months, the diurnal variability is less pronounced, possibly because of the important contribution of domestic heating to the overall aerosol emissions, in addition to the emissions related to vehicular traffic. The monthly average SSA in the UV changes smoothly in the year, from ~0.7 in January to ~0.86–0.87 in August and then back to ~0.7 in December. This change is larger than the uncertainty showing a clear annual cycle of the SSA in the UV. In the annual cycle of the AAOD two peaks were found, one in December–January when AOD is minimum but the contribution of absorbing aerosols in the mixture is important, and one in August when the AOD is maximum. The relative contributions of different types of aerosols in different seasons, as well as the role of the particular meteorological conditions prevailing during each month are currently under investigation. The results will be discussed in another study focusing on these particular issues.
The reduction of ~20% of the AOD from mid-1990s to mid-2000s is accompanied by a reduction in AAOD of similar magnitude. Although the increase in AOD has ceased after the mid-2000s, the annual average SSA after 2008 is ~0.07 below the 1998–2006 average. Very high values of AAOD, of ~50% above the long-term average, have been recorded in the years 2009–2012. This increase is probably related to increased emissions of biomass and wood burning aerosols after the beginning of the economic crisis in Greece. Since 2014, AAOD returns to lower levels, possibly again as a result of the economic crisis, since vehicular traffic in Thessaloniki has been decreasing after 2012 due to increasing price of fuel [114].
Currently, most modeling studies of past and future changes of solar UV radiation assume constant SSA throughout the years, and in few cases changes in the AAOD have been considered [21,41]. The present study clearly shows the importance of taking into account long- and short-term changes in the absorption efficiency of the aerosol mixture. The study also provides strong evidence that, at least over Thessaloniki, aerosols absorb stronger in UV than in VIS wavelengths, and that this difference cannot be taken into account accurately by simple wavelength extrapolation of the aerosol properties. Finally, the fact that the detected variability of SSA and AAOD in the UV is of the same order of magnitude with the retrieval uncertainties highlights the need for further work in order to improve the accuracy of the retrievals of these products.

Author Contributions

Conceptualization: I.F. and A.F.B.; methodology: I.F., A.N., N.S., T.D., and A.F.B.; software: A.N., N.S., and I.F.; validation: I.F., A.N., N.S., T.D., and A.F.B.; formal analysis: I.F., A.N., N.S., and T.D., investigation: I.F., A.N., N.S., and T.D.; resources: A.F.B.; data curation: I.F., A.N., and N.S.; writing—original draft preparation: I.F.; writing—review and editing: A.N., N.S., T.D., and A.F.B.; visualization: I.F.; supervision: A.F.B.; project administration: A.F.B.; funding acquisition: A.F.B.”

Funding

This research is co-financed by Greece and the European Union (European Social Fund- ESF) through the Operational Program «Human Resources Development, Education and Lifelong Learning 2014–2020» in the context of the project “Optimization and application of methods for ground-based remote sensing of aerosols and ozone in the lower troposphere for investigating their variability” (MIS 5004486).

Acknowledgments

The authors would like to acknowledge the PI of LIDAR measurements D. Balis for providing of LIDAR measurements, as well as C. Meleti for providing the AOD from Brewer#005. S. Kazadzis is acknowledged for his fruitful advices regarding the processing and the analysis of the data. M.E. Koukouli and D. Karagkiozidis are also acknowledged for their contribution. Relative humidity profiles from the European Center for Medium-range Weather Forecast (ECMWF) Reanalysis Interim (ERA-Interim) have been used.

Conflicts of Interest

The authors declare no conflict of interest.

Appendix A

The methodology which has been applied in order to obtain constructed SSA profiles at 340 nm is described below.
For the construction of the SSA profiles, aerosol extinction (at 355 and 532 nm) and backscatter (355, 532, and 1064 nm) coefficient profiles have been used. Measurements from the LIDAR [84,85,86,87,88,89]—which is located at a distance of few meters from the Brewer#086—in the period 2012–2018 are used. Measurements at the 1064 nm channel are not available before 2012, making impossible the construction of SSA profiles using the particular methodology. The extinction profiles, which are essential for this method, are only available during night-time when there is no skylight at the particular wavelengths (e.g., Siomos et al. [88]). Thus, only nighttime profiles are used. Since the profiles should ideally correspond to the conditions under which Brewer#086 performs measurements, i.e., only during daytime, profiles with a temporal difference of more than 6 hours with the last available spectrophotometer measurement are excluded, under the assumption that the aerosol vertical distribution is not changing much within this time interval (12 cases in total). The aerosol classification scheme based on the minimum Mahalanobis distance from an ensemble of reference clusters is applied per case (e.g., Papagiannopoulos et al. [90]) and per vertical level with a resolution of 100m.
Each level is classified in one of the following reference clusters: Continental clean (CC), desert dust (D), mixed marine (MM), polluted continual including smoke (PC+S). Layers that are not classified in any category (untyped) correspond mainly to parts of the profiles where either the aerosols are too mixed or where the aerosol load is not significant. Each of the other four categories is modeled by predefined mixtures based on the OPAC database [101,102]. CC mixtures are assigned to the “continental clean” category of OPAC (water soluble and insoluble particles), D mixtures are assigned to the “desert” category (mineral and water soluble), MM mixtures to the “maritime polluted” category (sea salt, water soluble, and soot), and finally PC+S mixtures to the “urban” category (water soluble, insoluble, and soot). Each category is consisted by components in different mixing ratios, resulting to different optical properties per wavelength (see Hess et al. [101]). Some species are assumed to be hygroscopic (sea salt, water soluble) and their optical properties are adjusted according to the relative humidity per layer. Relative humidity profiles from the European Center for Medium-range Weather Forecast (ECMWF) Reanalysis Interim (ERA-Interim) were applied.
An SSA at 340 nm from OPAC is assigned to each classified layer. Un-typed layers are interpolated if there are adjacent to classified layers. The resulting SSA profiles are scaled so that the columnar equivalent SSA at 340 nm matches the value produced from Brewer#086 (see Section 2 of the paper). This way the uncertainties due to the non-simultaneous measurements are reduced. Furthermore, the actual mixing ratio of the aerosol components per classified layer can be different than the predefined climatological mixtures of OPAC. The lidar extinction coefficient profiles at 355 nm are also scaled to the corresponding AOD measured by Brewer#086.

References

  1. Abdel-Shafy, H.I.; Mansour, M.S.M. A review on polycyclic aromatic hydrocarbons: Source, environmental impact, effect on human health and remediation. Egypt. J. Pet. 2016, 25, 107–123. [Google Scholar] [CrossRef] [Green Version]
  2. Pavia, D.; Thomson, M.L.; Clarke, S.W.; Shannon, H.S. Effect of lung function and mode of inhalation on penetration of aerosol into the human lung. Thorax 1977, 32, 194. [Google Scholar] [CrossRef] [PubMed]
  3. Salma, I.; Balásházy, I.; Winkler-Heil, R.; Hofmann, W.; Záray, G. Effect of particle mass size distribution on the deposition of aerosols in the human respiratory system. J. Aerosol Sci. 2002, 33, 119–132. [Google Scholar] [CrossRef]
  4. Kazadzis, S.; Founda, D.; Psiloglou, B.E.; Kambezidis, H.; Mihalopoulos, N.; Sanchez-Lorenzo, A.; Meleti, C.; Raptis, P.I.; Pierros, F.; Nabat, P. Long-term series and trends in surface solar radiation in Athens, Greece. Atmos. Chem. Phys. 2018, 18, 2395–2411. [Google Scholar] [CrossRef] [Green Version]
  5. Manara, V.; Bassi, M.; Brunetti, M.; Cagnazzi, B.; Maugeri, M. 1990–2016 surface solar radiation variability and trend over the Piedmont region (Northwest Italy). Theor. Appl. Climatol. 2018, 136, 849–862. [Google Scholar] [CrossRef]
  6. Tang, W.; Yang, K.; Qin, J.; Niu, X.; Lin, C.; Jing, X. A revisit to decadal change of aerosol optical depth and its impact on global radiation over China. Atmos. Environ. 2017, 150, 106–115. [Google Scholar] [CrossRef]
  7. Turnock, S.T.; Spracklen, D.V.; Carslaw, K.S.; Mann, G.W.; Woodhouse, M.T.; Forster, P.M.; Haywood, J.; Johnson, C.E.; Dalvi, M.; Bellouin, N.; et al. Modelled and observed changes in aerosols and surface solar radiation over Europe between 1960 and 2009. Atmos. Chem. Phys. 2015, 15, 9477–9500. [Google Scholar] [CrossRef] [Green Version]
  8. Wild, M. Enlightening Global Dimming and Brightening. Bull. Am. Meteorol. Soc. 2012, 93, 27–37. [Google Scholar] [CrossRef]
  9. Zerefos, C.S.; Eleftheratos, K.; Meleti, C.; Kazadzis, S.; Romanou, A.; Ichocu, C.; Tselioudis, G.; Bais, A. Solar dimming and brightening over Thessaloniki, Greece, and Beijing, China. Tellus B 2009, 61, 657–665. [Google Scholar] [CrossRef]
  10. Charlson, R.J.; Schwartz, S.E.; Hales, J.M.; Cess, R.D.; Coakley, J.A.; Hansen, J.E.; Hofmann, D.J. Climate Forcing by Anthropogenic Aerosols. Science 1992, 255, 423. [Google Scholar] [CrossRef]
  11. Samset, B.H.; Sand, M.; Smith, C.J.; Bauer, S.E.; Forster, P.M.; Fuglestvedt, J.S.; Osprey, S.; Schleussner, C.-F. Climate Impacts from a Removal of Anthropogenic Aerosol Emissions. Geophys. Res. Lett. 2018, 45, 1020–1029. [Google Scholar] [CrossRef]
  12. Gustafsson, Ö.; Ramanathan, V. Convergence on climate warming by black carbon aerosols. Proc. Natl. Acad. Sci. USA 2016, 113, 4243. [Google Scholar] [CrossRef] [PubMed]
  13. Ma, P.-L.; Rasch, P.J.; Wang, M.; Wang, H.; Ghan, S.J.; Easter, R.C.; Gustafson, W.I., Jr.; Liu, X.; Zhang, Y.; Ma, H.-Y. How does increasing horizontal resolution in a global climate model improve the simulation of aerosol-cloud interactions? Geophys. Res. Lett. 2015, 42, 5058–5065. [Google Scholar] [CrossRef]
  14. Shrivastava, M.; Cappa, C.D.; Fan, J.; Goldstein, A.H.; Guenther, A.B.; Jimenez, J.L.; Kuang, C.; Laskin, A.; Martin, S.T.; Ng, N.L.; et al. Recent advances in understanding secondary organic aerosol: Implications for global climate forcing. Rev. Geophys. 2017, 55, 509–559. [Google Scholar] [CrossRef] [Green Version]
  15. IPCC. Climate Change 2013: The Physical Science Basis. Contribution of Working Group I to the Fifth Assessment Report of the Intergovernmental Panel on Climate Change; Cambridge University Press: Cambridge, UK; New York, NY, USA, 2013; p. 1535. [Google Scholar]
  16. Chubarova, N.; Nezval, Y.; Sviridenkov, I.; Smirnov, A.; Slutsker, I. Smoke aerosol and its radiative effects during extreme fire event over Central Russia in summer 2010. Atmos. Meas. Tech. 2012, 5, 557–568. [Google Scholar] [CrossRef] [Green Version]
  17. Hoffer, A.; Gelencsér, A.; Guyon, P.; Kiss, G.; Schmid, O.; Frank, G.P.; Artaxo, P.; Andreae, M.O. Optical properties of humic-like substances (HULIS) in biomass-burning aerosols. Atmos. Chem. Phys. 2006, 6, 3563–3570. [Google Scholar] [CrossRef] [Green Version]
  18. Feng, Y.; Ramanathan, V.; Kotamarthi, V.R. Brown carbon: A significant atmospheric absorber of solar radiation? Atmos. Chem. Phys. 2013, 13, 8607–8621. [Google Scholar] [CrossRef]
  19. Kirchstetter, T.W.; Thatcher, T.L. Contribution of organic carbon to wood smoke particulate matter absorption of solar radiation. Atmos. Chem. Phys. 2012, 12, 6067–6072. [Google Scholar] [CrossRef] [Green Version]
  20. Krotkov, N.A.; Bhartia, P.K.; Herman, J.R.; Slusser, J.R.; Scott, G.R.; Labow, G.J.; Vasilkov, A.P.; Eck, T.; Doubovik, O.; Holben, B.N. Aerosol ultraviolet absorption experiment (2002 to 2004), part 2: Absorption optical thickness, refractive index, and single scattering albedo. Opt. Eng. 2005, 44, 1–17. [Google Scholar]
  21. Bais, A.F.; McKenzie, R.L.; Bernhard, G.; Aucamp, P.J.; Ilyas, M.; Madronich, S.; Tourpali, K. Ozone depletion and climate change: Impacts on UV radiation. Photochem. Photobiol. Sci. 2015, 14, 19–52. [Google Scholar] [CrossRef]
  22. Palancar, G.G.; Lefer, B.L.; Hall, S.R.; Shaw, W.J.; Corr, C.A.; Herndon, S.C.; Slusser, J.R.; Madronich, S. Effect of aerosols and NO2 concentration on ultraviolet actinic flux near Mexico City during MILAGRO: Measurements and model calculations. Atmos. Chem. Phys. 2013, 13, 1011–1022. [Google Scholar] [CrossRef]
  23. Czerwińska, A.E.; Krzyścin, J.W.; Jarosławski, J.; Posyniak, M. Effects of urban agglomeration on surface-UV doses: A comparison of Brewer measurements in Warsaw and Belsk, Poland, for the period 2013–2015. Atmos. Chem. Phys. 2016, 16, 13641–13651. [Google Scholar] [CrossRef]
  24. Fountoulakis, I.; Bais, A.F.; Fragkos, K.; Meleti, C.; Tourpali, K.; Zempila, M.M. Short and long-term variability of spectral solar UV irradiance at Thessaloniki, Greece: Effects of changes in aerosols, total ozone and clouds. Atmos. Chem. Phys. 2016, 16, 2493–2505. [Google Scholar] [CrossRef]
  25. Fountoulakis, I.; Zerefos, C.S.; Bais, A.F.; Kapsomenakis, J.; Koukouli, M.-E.; Ohkawara, N.; Fioletov, V.; De Backer, H.; Lakkala, K.; Karppinen, T.; et al. Twenty-five years of spectral UV-B measurements over Canada, Europe and Japan: Trends and effects from changes in ozone, aerosols, clouds, and surface reflectivity. Comptes Rendus Geosci. 2018, 350, 393–402. [Google Scholar] [CrossRef]
  26. Kazadzis, S.; Kouremeti, N.; Bais, A.; Kazantzidis, A.; Meleti, C. Aerosol forcing efficiency in the UVA region from spectral solar irradiance measurements at an urban environment. Ann. Geophys. 2009, 27, 2515–2522. [Google Scholar] [CrossRef] [Green Version]
  27. Meleti, C.; Bais, A.F.; Kazadzis, S.; Kouremeti, N.; Garane, K.; Zerefos, C. Factors affecting solar ultraviolet irradiance measured since 1990 at Thessaloniki, Greece. Int. J. Remote Sens. 2009, 30, 4167–4179. [Google Scholar] [CrossRef]
  28. Holben, B.N.; Eck, T.F.; Slutsker, I.; Tanré, D.; Buis, J.P.; Setzer, A.; Vermote, E.; Reagan, J.A.; Kaufman, Y.J.; Nakajima, T.; et al. AERONET—A Federated Instrument Network and Data Archive for Aerosol Characterization. Remote Sens. Environ. 1998, 66, 1–16. [Google Scholar] [CrossRef]
  29. Nakajima, T.; Tonna, G.; Rao, R.; Boi, P.; Kaufman, Y.; Holben, B. Use of sky brightness measurements from ground for remote sensing of particulate polydispersions. Appl. Opt. 1996, 35, 2672–2686. [Google Scholar] [CrossRef]
  30. Chung, C.E.; Ramanathan, V.; Kim, D.; Podgorny, I.A. Global anthropogenic aerosol direct forcing derived from satellite and ground-based observations. J. Geophys. Res. Atmos. 2005, 110. [Google Scholar] [CrossRef]
  31. Kinne, S.; O’Donnel, D.; Stier, P.; Kloster, S.; Zhang, K.; Schmidt, H.; Rast, S.; Giorgetta, M.; Eck, T.F.; Stevens, B. MAC-v1: A new global aerosol climatology for climate studies. J. Adv. Modeling Earth Syst. 2013, 5, 704–740. [Google Scholar] [CrossRef]
  32. Bais, A.F.; Kazantzidis, A.; Kazadzis, S.; Balis, D.S.; Zerefos, C.S.; Meleti, C. Deriving an effective aerosol single scattering albedo from spectral surface UV irradiance measurements. Atmos. Environ. 2005, 39, 1093–1102. [Google Scholar] [CrossRef]
  33. Corr, C.A.; Krotkov, N.; Madronich, S.; Slusser, J.R.; Holben, B.; Gao, W.; Flynn, J.; Lefer, B.; Kreidenweis, S.M. Retrieval of aerosol single scattering albedo at ultraviolet wavelengths at the T1 site during MILAGRO. Atmos. Chem. Phys. 2009, 9, 5813–5827. [Google Scholar] [CrossRef] [Green Version]
  34. Eck, T.F.; Holben, B.N.; Slutsker, I.; Setzer, A. Measurements of irradiance attenuation and estimation of aerosol single scattering albedo for biomass burning aerosols in Amazonia. J. Geophys. Res. Atmos. 1998, 103, 31865–31878. [Google Scholar] [CrossRef]
  35. Ialongo, I.; Buchard, V.; Brogniez, C.; Casale, G.R.; Siani, A.M. Aerosol Single Scattering Albedo retrieval in the UV range: An application to OMI satellite validation. Atmos. Chem. Phys. 2010, 10, 331–340. [Google Scholar] [CrossRef]
  36. Kazadzis, S.; Raptis, P.; Kouremeti, N.; Amiridis, V.; Arola, A.; Gerasopoulos, E.; Schuster, G.L. Aerosol absorption retrieval at ultraviolet wavelengths in a complex environment. Atmos. Meas. Tech. 2016, 9, 5997–6011. [Google Scholar] [CrossRef] [Green Version]
  37. Krotkov, N.A.; Bhartia, P.K.; Herman, J.R.; Slusser, J.R.; Labow, G.J.; Scott, G.R.; Janson, G.T.; Eck, T.; Holben, B.N. Aerosol Ultraviolet Absorption Experiment (2002 to 2004), Part 1: Ultraviolet Multifilter Rotating Shadowband Radiometer Calibration and Intercomparison with CIMEL Sunphotometers; SPIE: Geneva, Switzerland, 2005; Volume 44, pp. 1–17. [Google Scholar]
  38. Mok, J.; Krotkov, N.A.; Torres, O.; Jethva, H.; Li, Z.; Kim, J.; Koo, J.H.; Go, S.; Irie, H.; Labow, G.; et al. Comparisons of spectral aerosol single scattering albedo in Seoul, South Korea. Atmos. Meas. Tech. 2018, 11, 2295–2311. [Google Scholar] [CrossRef] [Green Version]
  39. Nikitidou, E.; Kazantzidis, A.; De Bock, V.; De Backer, H. The aerosol forcing efficiency in the UV region and the estimation of single scattering albedo at a typical West European site. Atmos. Environ. 2013, 69, 313–320. [Google Scholar] [CrossRef]
  40. Sinyuk, A.; Torres, O.; Dubovik, O. Combined use of satellite and surface observations to infer the imaginary part of refractive index of Saharan dust. Geophys. Res. Lett. 2003, 30. [Google Scholar] [CrossRef] [Green Version]
  41. Bais, A.F.; Bernhard, G.; McKenzie, R.L.; Aucamp, P.J.; Young, P.J.; Ilyas, M.; Jöckel, P.; Deushi, M. Ozone–climate interactions and effects on solar ultraviolet radiation. Photochem. Photobiol. Sci. 2019, 18, 602–640. [Google Scholar] [CrossRef] [PubMed]
  42. Kazadzis, S.; Gröbner, J.; Arola, A.; Amiridis, V. The effect of the global UV irradiance measurement accuracy on the single scattering albedo retrieval. Atmos. Meas. Tech. 2010, 3, 1029–1037. [Google Scholar] [CrossRef] [Green Version]
  43. Torres, O.; Ahn, C.; Chen, Z. Improvements to the OMI near-UV aerosol algorithm using A-train CALIOP and AIRS observations. Atmos. Meas. Tech. 2013, 6, 3257–3270. [Google Scholar] [CrossRef] [Green Version]
  44. Torres, O.; Tanskanen, A.; Veihelmann, B.; Ahn, C.; Braak, R.; Bhartia, P.K.; Veefkind, P.; Levelt, P. Aerosols and surface UV products from Ozone Monitoring Instrument observations: An overview. J. Geophys. Res. Atmos. 2007, 112. [Google Scholar] [CrossRef] [Green Version]
  45. Jethva, H.; Torres, O.; Ahn, C. Global assessment of OMI aerosol single-scattering albedo using ground-based AERONET inversion. J. Geophys. Res. Atmos. 2014, 119, 9020–9040. [Google Scholar] [CrossRef]
  46. Khatri, P.; Takamura, T.; Nakajima, T.; Estellés, V.; Irie, H.; Kuze, H.; Campanelli, M.; Sinyuk, A.; Lee, S.-M.; Sohn, B.J.; et al. Factors for inconsistent aerosol single scattering albedo between SKYNET and AERONET. J. Geophys. Res. Atmos. 2016, 121, 1859–1877. [Google Scholar] [CrossRef] [Green Version]
  47. Koo, J.-H.; Kim, J.; Lee, J.; Eck, T.F.; Lee, Y.G.; Park, S.S.; Kim, M.; Jung, U.; Yoon, J.; Mok, J.; et al. Wavelength dependence of Ångström exponent and single scattering albedo observed by skyradiometer in Seoul, Korea. Atmos. Res. 2016, 181, 12–19. [Google Scholar] [CrossRef]
  48. Arola, A.; Kazadzis, S.; Lindfors, A.; Krotkov, N.; Kujanpää, J.; Tamminen, J.; Bais, A.; di Sarra, A.; Villaplana, J.M.; Brogniez, C.; et al. A new approach to correct for absorbing aerosols in OMI UV. Geophys. Res. Lett. 2009, 36. [Google Scholar] [CrossRef]
  49. Lindfors, A.V.; Kujanpää, J.; Kalakoski, N.; Heikkilä, A.; Lakkala, K.; Mielonen, T.; Sneep, M.; Krotkov, N.A.; Arola, A.; Tamminen, J. The TROPOMI surface UV algorithm. Atmos. Meas. Tech. 2018, 11, 997–1008. [Google Scholar] [CrossRef] [Green Version]
  50. Arola, A.; Kazadzis, S.; Krotkov, N.; Bais, A.; Gröbner, J.; Herman, J.R. Assessment of TOMS UV bias due to absorbing aerosols. J. Geophys. Res. Atmos. 2005, 110. [Google Scholar] [CrossRef] [Green Version]
  51. Zempila, M.M.; Fountoulakis, I.; Taylor, M.; Kazadzis, S.; Arola, A.; Koukouli, M.E.; Bais, A.; Meleti, C.; Balis, D. Validation of OMI erythemal doses with multi-sensor ground-based measurements in Thessaloniki, Greece. Atmos. Environ. 2018, 183, 106–121. [Google Scholar] [CrossRef] [Green Version]
  52. Levelt, P.F.; van den Oord, G.H.J.; Dobber, M.R.; Malkki, A.; Huib, V.; de Johan, V.; Stammes, P.; Lundell, J.O.V.; Saari, H. The ozone monitoring instrument. IEEE Trans. Geosci. Remote Sens. 2006, 44, 1093–1101. [Google Scholar] [CrossRef]
  53. Zempila, M.-M.; Koukouli, M.-E.; Bais, A.; Fountoulakis, I.; Arola, A.; Kouremeti, N.; Balis, D. OMI/Aura UV product validation using NILU-UV ground-based measurements in Thessaloniki, Greece. Atmos. Environ. 2016, 140, 283–297. [Google Scholar] [CrossRef]
  54. Raptis, I.-P.; Kazadzis, S.; Eleftheratos, K.; Amiridis, V.; Fountoulakis, I. Single Scattering Albedo’s Spectral Dependence Effect on UV Irradiance. Atmosphere 2018, 9, 364. [Google Scholar] [CrossRef]
  55. Bais, A.F.; Zerefos, C.S.; McElroy, C.T. Solar UVB measurements with the double-and single-monochromator Brewer ozone spectrophotometers. Geophys. Res. Lett. 1996, 23, 833–836. [Google Scholar] [CrossRef]
  56. Bais, A.F.; Kazadzis, S.; Balis, D.; Zerefos, C.S.; Blumthaler, M. Correcting global solar ultraviolet spectra recorded by a Brewer spectroradiometer for its angular response error. Appl. Opt. 1998, 37, 6339–6344. [Google Scholar] [CrossRef] [PubMed]
  57. Bais, A.F. Absolute spectral measurements of direct solar ultraviolet irradiance with a Brewer spectrophotometer. Appl. Opt. 1997, 36, 5199–5204. [Google Scholar] [CrossRef] [PubMed]
  58. Garane, K.; Bais, A.F.; Kazadzis, S.; Kazantzidis, A.; Meleti, C. Monitoring of UV spectral irradiance at Thessaloniki (1990? 2005): Data re-evaluation and quality control. Ann. Geophys. 2006, 24, 3215–3228. [Google Scholar] [CrossRef]
  59. Kazadzis, S.; Bais, A.; Kouremeti, N.; Gerasopoulos, E.; Garane, K.; Blumthaler, M.; Schallhart, B.; Cede, A. Direct spectral measurements with a Brewer spectroradiometer: Absolute calibration and aerosol optical depth retrieval. Appl. Opt. 2005, 44, 1681–1690. [Google Scholar] [CrossRef]
  60. Giles, D.M.; Sinyuk, A.; Sorokin, M.G.; Schafer, J.S.; Smirnov, A.; Slutsker, I.; Eck, T.F.; Holben, B.N.; Lewis, J.R.; Campbell, J.R.; et al. Advancements in the Aerosol Robotic Network (AERONET) Version 3 database—Automated near-real-time quality control algorithm with improved cloud screening for Sun photometer aerosol optical depth (AOD) measurements. Atmos. Meas. Tech. 2019, 12, 169–209. [Google Scholar] [CrossRef]
  61. Gröbner, J.; Meleti, C. Aerosol optical depth in the UVB and visible wavelength range from Brewer spectrophotometer direct irradiance measurements: 1991–2002. J. Geophys. Res. Atmos. 2004, 109. [Google Scholar] [CrossRef]
  62. Kazadzis, S.; Bais, A.; Amiridis, V.; Balis, D.; Meleti, C.; Kouremeti, N.; Zerefos, C.S.; Rapsomanikis, S.; Petrakakis, M.; Kelesis, A.; et al. Nine years of UV aerosol optical depth measurements at Thessaloniki, Greece. Atmos. Chem. Phys. 2007, 7, 2091–2101. [Google Scholar] [CrossRef] [Green Version]
  63. Fountoulakis, I.; Redondas, A.; Bais, A.F.; Rodriguez-Franco, J.J.; Fragkos, K.; Cede, A. Dead time effect on the Brewer measurements: Correction and estimated uncertainties. Atmos. Meas. Tech. 2016, 9, 1799–1816. [Google Scholar] [CrossRef]
  64. Gröbner, J.; Redondas, A.; Lakkala, K.; Serrano, A.; Vilaplana, J.M.; León-Luis, S.F.; Karppinen, T.; Fountoulakis, I.; Hülsen, G.; Egli, L.; et al. Spectral UV measurements within EUBREWNET. In Proceedings of the European Conference on Solar UV Monitoring UV Monitoring in the European Countries—Past, Present and Future, University of Veterinary Medicine, Vienna, Austria, 12–14 September 2018. [Google Scholar]
  65. Zempila, M.M.; van Geffen, J.H.G.M.; Taylor, M.; Fountoulakis, I.; Koukouli, M.E.; van Weele, M.; van der A, R.J.; Bais, A.; Meleti, C.; Balis, D. TEMIS UV product validation using NILU-UV ground-based measurements in Thessaloniki, Greece. Atmos. Chem. Phys. 2017, 17, 7157–7174. [Google Scholar] [CrossRef] [Green Version]
  66. Emde, C.; Buras-Schnell, R.; Kylling, A.; Mayer, B.; Gasteiger, J.; Hamann, U.; Kylling, J.; Richter, B.; Pause, C.; Dowling, T.; et al. The libRadtran software package for radiative transfer calculations (version 2.0.1). Geosci. Model Dev. 2016, 9, 1647–1672. [Google Scholar] [CrossRef] [Green Version]
  67. Anderson, G.P.; Clough, S.A.; Kneizys, F.X.; Chetwynd, J.H.; Shettle, E.P. AFGL Atmospheric Constituent Profiles (0–120 km); Technical Report No. AFGL-TR-86-0110; Optical Physics Division, Air Force Geophysics Laboratory: Hanscom afb Massachusetts 01731 1986. Available online: https://www.researchgate.net/publication/235054307_AFGL_Atmospheric_Constituent_Profiles_0120km (accessed on 18 September 2019).
  68. Buras, R.; Dowling, T.; Emde, C. New secondary-scattering correction in DISORT with increased efficiency for forward scattering. J. Quant. Spectrosc. Radiat. Transf. 2011, 112, 2028–2034. [Google Scholar] [CrossRef]
  69. Shettle, E.P. Models of aerosols, clouds and precipitation for atmospheric propagation studies, in Atmospheric Popagation in the UV, Visible, ir and mm-Region and Related System Aspects. Agard Conf. Proc. 1989. Available online: https://www.researchgate.net/publication/234312286_Models_of_aerosols_clouds_and_precipitation_for_atmospheric_propagation_studies (accessed on 18 September 2019).
  70. Vasaras, A.; Bais, A.F.; Feister, U.; Zerefos, C.S. Comparison of two methods for cloud flagging of spectral UV measurements. Atmos. Res. 2001, 57, 31–42. [Google Scholar] [CrossRef]
  71. Bond, T.C.; Doherty, S.J.; Fahey, D.W.; Forster, P.M.; Berntsen, T.; DeAngelo, B.J.; Flanner, M.G.; Ghan, S.; Kärcher, B.; Koch, D.; et al. Bounding the role of black carbon in the climate system: A scientific assessment. J. Geophys. Res. Atmos. 2013, 118, 5380–5552. [Google Scholar] [CrossRef]
  72. Fountoulakis, I.; Redondas, A.; Lakkala, K.; Berjon, A.; Bais, A.F.; Doppler, L.; Feister, U.; Heikkila, A.; Karppinen, T.; Karhu, J.M.; et al. Temperature dependence of the Brewer global UV measurements. Atmos. Meas. Tech. 2017, 10, 4491–4505. [Google Scholar] [CrossRef] [Green Version]
  73. Fountoulakis, I. Long Term Trends of the Spectral Solar UV Radiation. Ph.D. Thesis, Aristotle University of Thessaloniki, Thessaloniki, Greece, 2016. [Google Scholar]
  74. Berjón, A.; Redondas, A.; Sildoja, M.M.; Nevas, S.; Wilson, K.; León-Luis, S.F.; el Gawhary, O.; Fountoulakis, I. Sensitivity study of the instrumental temperature corrections on Brewer total ozone column measurements. Atmos. Meas. Tech. 2018, 11, 3323–3337. [Google Scholar] [CrossRef] [Green Version]
  75. Blanc, P.; Espinar, B.; Geuder, N.; Gueymard, C.; Meyer, R.; Pitz-Paal, R.; Reinhardt, B.; Renné, D.; Sengupta, M.; Wald, L.; et al. Direct normal irradiance related definitions and applications: The circumsolar issue. Sol. Energy 2014, 110, 561–577. [Google Scholar] [CrossRef]
  76. Gueymard, C.A. Parameterized transmittance model for direct beam and circumsolar spectral irradiance. Sol. Energy 2001, 71, 325–346. [Google Scholar] [CrossRef]
  77. Bernhard, G.; Seckmeyer, G. Uncertainty of measurements of spectral solar UV irradiance. J. Geophys. Res. Atmos. 1999, 104, 14321–14345. [Google Scholar] [CrossRef]
  78. Gröbner, J.; Blumthaler, M.; Kazadzis, S.; Bais, A.; Webb, A.; Schreder, J.; Seckmeyer, G.; Rembges, D. Quality assurance of spectral solar UV measurements: Results from 25 UV monitoring sites in Europe, 2002 to 2004. Metrologia 2006, 43, S66–S71. [Google Scholar] [CrossRef]
  79. Lakkala, K.; Arola, A.; Heikkilä, A.; Kaurola, J.; Koskela, T.; Kyrö, E.; Lindfors, A.; Meinander, O.; Tanskanen, A.; Gröbner, J.; et al. Quality assurance of the Brewer spectral UV measurements in Finland. Atmos. Chem. Phys. 2008, 8, 3369–3383. [Google Scholar] [CrossRef] [Green Version]
  80. Gröbner, J.; Wardle, D.I.; McElroy, C.T.; Kerr, J.B. Investigation of the wavelength accuracy of Brewer spectrophotometers. Appl. Opt. 1998, 37, 8352–8360. [Google Scholar] [CrossRef] [PubMed]
  81. Cede, A.; Kazadzis, S.; Kowalewski, M.; Bais, A.; Kouremeti, N.; Blumthaler, M.; Herman, J. Correction of direct irradiance measurements of Brewer spectrophotometers due to the effect of internal polarization. Geophys. Res. Lett. 2006, 33. [Google Scholar] [CrossRef] [Green Version]
  82. Savastiouk, V. Improvements to the Direct-Sun Ozone Observations Taken with the Brewer Spectrophotometer. Ph.D. Thesis, York University, Toronto, ON, Canada, 2005. [Google Scholar]
  83. Carlund, T.; Kouremeti, N.; Kazadzis, S.; Grobner, J. Aerosol optical depth determination in the UV using a four-channel precision filter radiometer. Atmos. Meas. Tech. 2017, 10, 905–923. [Google Scholar] [CrossRef]
  84. Amiridis, V.; Balis, D.S.; Kazadzis, S.; Bais, A.; Giannakaki, E.; Papayannis, A.; Zerefos, C. Four-year aerosol observations with a Raman lidar at Thessaloniki, Greece, in the framework of European Aerosol Research Lidar Network (EARLINET). J. Geophys. Res. Atmos. 2005, 110. [Google Scholar] [CrossRef] [Green Version]
  85. Balis, D.S.; Amiridis, V.; Zerefos, C.; Gerasopoulos, E.; Andreae, M.; Zanis, P.; Kazantzidis, A.; Kazadzis, S.; Papayannis, A. Raman lidar and sunphotometric measurements of aerosol optical properties over Thessaloniki, Greece during a biomass burning episode. Atmos. Environ. 2003, 37, 4529–4538. [Google Scholar] [CrossRef]
  86. Giannakaki, E.; Balis, D.S.; Amiridis, V.; Zerefos, C. Optical properties of different aerosol types: Seven years of combined Raman-elastic backscatter lidar measurements in Thessaloniki, Greece. Atmos. Meas. Tech. 2010, 3, 569–578. [Google Scholar] [CrossRef]
  87. Siomos, N.; Balis, D.S.; Voudouri, K.A.; Giannakaki, E.; Filioglou, M.; Amiridis, V.; Papayannis, A.; Fragkos, K. Are EARLINET and AERONET climatologies consistent? The case of Thessaloniki, Greece. Atmos. Chem. Phys. 2018, 18, 11885–11903. [Google Scholar] [CrossRef] [Green Version]
  88. Siomos, N.; Filioglou, M.; Poupkou, A.; Liora, N.; Dimopoulos, S.; Melas, D.; Chaikovsky, A.; Balis, D. Vertical separation of desert dust and biomass burning aerosol layers over Thessaloniki using the synergy of sunphotometer and lidar data. In Proceedings of Perspectives on Atmospheric Sciences; Springer: Cham, Switzerland, 2017; pp. 817–822. [Google Scholar]
  89. Voudouri, K.A.; Siomos, N.; Michailidis, K.; Papagiannopoulos, N.; Mona, L.; Cornacchia, C.; Nicolae, D.; Balis, D. Comparison of two automated aerosol typing methods and their application on an EARLINET station. Atmos. Chem. Phys. Discuss. 2018, 2018, 1–22. [Google Scholar] [CrossRef]
  90. Papagiannopoulos, N.; Mona, L.; Amodeo, A.; D’Amico, G.; Gumà Claramunt, P.; Pappalardo, G.; Alados-Arboledas, L.; Guerrero-Rascado, J.L.; Amiridis, V.; Kokkalis, P.; et al. An automatic observation-based aerosol typing method for EARLINET. Atmos. Chem. Phys. 2018, 18, 15879–15901. [Google Scholar] [CrossRef] [Green Version]
  91. Drosoglou, T.; Bais, A.F.; Zyrichidou, I.; Kouremeti, N.; Poupkou, A.; Liora, N.; Giannaros, C.; Koukouli, M.E.; Balis, D.; Melas, D. Comparisons of ground-based tropospheric NO2 MAX-DOAS measurements to satellite observations with the aid of an air quality model over the Thessaloniki area, Greece. Atmos. Chem. Phys. 2017, 17, 5829–5849. [Google Scholar] [CrossRef]
  92. Kouremeti, N.; Bais, A.F.; Balis, D.; Zyrichidou, I. Phaethon: A system for the validation of satellite derived atmospheric columns of trace gases. In Proceedings of Advances in Meteorology, Climatology and Atmospheric Physics; Springer: Berlin/Heidelberg, Germany, 2013; pp. 1081–1088. [Google Scholar]
  93. Wang, Y.; Puķīte, J.; Wagner, T.; Donner, S.; Beirle, S.; Hilboll, A.; Vrekoussis, M.; Richter, A.; Apituley, A.; Piters, A.; et al. Vertical Profiles of Tropospheric Ozone From MAX-DOAS Measurements During the CINDI-2 Campaign: Part 1—Development of a New Retrieval Algorithm. J. Geophys. Res. Atmos. 2018, 123, 637–610,670. [Google Scholar] [CrossRef]
  94. Fragkos, K.; Bais, A.F.; Balis, D.; Meleti, C.; Koukouli, M.E. The Effect of Three Different Absorption Cross-Sections and their Temperature Dependence on Total Ozone Measured by a Mid-Latitude Brewer Spectrophotometer. Atmos. Ocean 2015, 53, 19–28. [Google Scholar] [CrossRef]
  95. Feister, U.; Grewe, R. Spectral albedo measurements in the UV and visible region over different types of surfaces. Photochem. Photobiol. 1995, 62, 736–744. [Google Scholar] [CrossRef]
  96. Arola, A.; Koskela, T. On the sources of bias in aerosol optical depth retrieval in the UV range. J. Geophys. Res. Atmos. 2004, 109. [Google Scholar] [CrossRef] [Green Version]
  97. Kazadzis, S. Personal communication, 2019.
  98. Dubovik, O.; Smirnov, A.; Holben, B.N.; King, M.D.; Kaufman, Y.J.; Eck, T.F.; Slutsker, I. Accuracy assessments of aerosol optical properties retrieved from Aerosol Robotic Network (AERONET) Sun and sky radiance measurements. J. Geophys. Res. Atmos. 2000, 105, 9791–9806. [Google Scholar] [CrossRef] [Green Version]
  99. Torres, B.; Dubovik, O.; Toledano, C.; Berjon, A.; Cachorro, V.E.; Lapyonok, T.; Litvinov, P.; Goloub, P. Sensitivity of aerosol retrieval to geometrical configuration of ground-based sun/sky radiometer observations. Atmos. Chem. Phys. 2014, 14, 847–875. [Google Scholar] [CrossRef]
  100. Bergstrom, R.W.; Pilewskie, P.; Russell, P.B.; Redemann, J.; Bond, T.C.; Quinn, P.K.; Sierau, B. Spectral absorption properties of atmospheric aerosols. Atmos. Chem. Phys. 2007, 7, 5937–5943. [Google Scholar] [CrossRef] [Green Version]
  101. Hess, M.; Koepke, P.; Schult, I. Optical Properties of Aerosols and Clouds: The Software Package OPAC. Bull. Am. Meteorol. Soc. 1998, 79, 831–844. [Google Scholar] [CrossRef]
  102. Koepke, P.; Gasteiger, J.; Hess, M. Technical Note: Optical properties of desert aerosol with non-spherical mineral particles: Data incorporated to OPAC. Atmos. Chem. Phys. 2015, 15, 5947–5956. [Google Scholar] [CrossRef]
  103. Katragkou, E.; Kazadzis, S.; Amiridis, V.; Papaioannou, V.; Karathanasis, S.; Melas, D. PM10 regional transport pathways in Thessaloniki, Greece. Atmos. Environ. 2009, 43, 1079–1085. [Google Scholar] [CrossRef]
  104. Koukouli, M.E.; Balis, D.S.; Amiridis, V.; Kazadzis, S.; Bais, A.; Nickovic, S.; Torres, O. Aerosol variability over Thessaloniki using ground based remote sensing observations and the TOMS aerosol index. Atmos. Environ. 2006, 40, 5367–5378. [Google Scholar] [CrossRef]
  105. Diapouli, E.; Manousakas, M.; Vratolis, S.; Vasilatou, V.; Maggos, T.; Saraga, D.; Grigoratos, T.; Argyropoulos, G.; Voutsa, D.; Samara, C.; et al. Evolution of air pollution source contributions over one decade, derived by PM10 and PM2.5 source apportionment in two metropolitan urban areas in Greece. Atmos. Environ. 2017, 164, 416–430. [Google Scholar] [CrossRef]
  106. Vouitsis, I.; Amanatidis, S.; Ntziachristos, L.; Kelessis, A.; Petrakakis, M.; Stamos, I.; Mitsakis, E.; Samaras, Z. Daily and seasonal variation of traffic related aerosol pollution in Thessaloniki, Greece, during the financial crisis. Atmos. Environ. 2015, 122, 577–587. [Google Scholar] [CrossRef]
  107. Järvi, L.; Rannik, Ü.; Mammarella, I.; Sogachev, A.; Aalto, P.P.; Keronen, P.; Siivola, E.; Kulmala, M.; Vesala, T. Annual particle flux observations over a heterogeneous urban area. Atmos. Chem. Phys. 2009, 9, 7847–7856. [Google Scholar] [CrossRef] [Green Version]
  108. Saffari, A.; Daher, N.; Samara, C.; Voutsa, D.; Kouras, A.; Manoli, E.; Karagkiozidou, O.; Vlachokostas, C.; Moussiopoulos, N.; Shafer, M.M.; et al. Increased Biomass Burning Due to the Economic Crisis in Greece and Its Adverse Impact on Wintertime Air Quality in Thessaloniki. Environ. Sci. Technol. 2013, 47, 13313–13320. [Google Scholar] [CrossRef] [PubMed]
  109. Balis, D.S.; Amiridis, V.; Nickovic, S.; Papayannis, A.; Zerefos, C. Optical properties of Saharan dust layers as detected by a Raman lidar at Thessaloniki, Greece. Geophys. Res. Lett. 2004, 31. [Google Scholar] [CrossRef]
  110. Florou, K.; Papanastasiou, D.K.; Pikridas, M.; Kaltsonoudis, C.; Louvaris, E.; Gkatzelis, G.I.; Patoulias, D.; Mihalopoulos, N.; Pandis, S.N. The contribution of wood burning and other pollution sources to wintertime organic aerosol levels in two Greek cities. Atmos. Chem. Phys. 2017, 17, 3145–3163. [Google Scholar] [CrossRef] [Green Version]
  111. Zyrichidou, I.; Balis, D.; Koukouli, M.E.; Drosoglou, T.; Bais, A.; Gratsea, M.; Gerasopoulos, E.; Liora, N.; Poupkou, A.; Giannaros, C.; et al. Adverse results of the economic crisis: A study on the emergence of enhanced formaldehyde (HCHO) levels seen from satellites over Greek urban sites. Atmos. Res. 2019, 224, 42–51. [Google Scholar] [CrossRef]
  112. Fameli, K.-M.; Assimakopoulos, V.D. The new open Flexible Emission Inventory for Greece and the Greater Athens Area (FEI-GREGAA): Account of pollutant sources and their importance from 2006 to 2012. Atmos. Environ. 2016, 137, 17–37. [Google Scholar] [CrossRef]
  113. Paschalidou, A.K.; Kassomenos, P.A.; Kelessis, A. Tracking the association between metro-railway construction works and PM levels in an urban Mediterranean environment. Sci. Total Environ. 2016, 568, 1326–1332. [Google Scholar] [CrossRef] [PubMed]
  114. Sarigiannis, D.A.; Karakitsios, S.P.; Kermenidou, M.; Nikolaki, S.; Zikopoulos, D.; Semelidis, S.; Papagiannakis, A.; Tzimou, R. Total exposure to airborne particulate matter in cities: The effect of biomass combustion. Sci. Total Environ. 2014, 493, 795–805. [Google Scholar] [CrossRef] [PubMed]
  115. Dubovik, O.; King, M.D. A flexible inversion algorithm for retrieval of aerosol optical properties from Sun and sky radiance measurements. J. Geophys. Res. Atmos. 2000, 105, 20673–20696. [Google Scholar] [CrossRef] [Green Version]
  116. Rimmer, J.S.; Redondas, A.; Karppinen, T. EuBrewNet—A European Brewer network (COST Action ES1207), an overview. Atmos. Chem. Phys. 2018, 18, 10347–10353. [Google Scholar] [CrossRef]
  117. López-Solano, J.; Redondas, A.; Carlund, T.; Rodriguez-Franco, J.J.; Diémoz, H.; León-Luis, S.F.; Hernández-Cruz, B.; Guirado-Fuentes, C.; Kouremeti, N.; Gröbner, J.; et al. Aerosol optical depth in the European Brewer Network. Atmos. Chem. Phys. 2018, 18, 3885–3902. [Google Scholar] [CrossRef] [Green Version]
Figure 1. (a) absolute differences in aerosol optical depth (AOD) at 340 nm between Brewer#086 and CIMEL, (b) the corresponding differences in the calculated SSA and (c) the corresponding differences in the calculated aerosol absorption optical depth (AAOD). The same differences in % are presented in panels (df) respectively.
Remotesensing 11 02179 g001
Figure 2. Spectral dependence of the SSA (upper panel) and AAOD (lower panel). Data from Brewer#086 are shown in blue, while data from CIMEL are shown in red. On each box, the central mark indicates the median, and the bottom and top edges of the box indicate the 25th and 75th percentiles (inter-quartile range, IQR), respectively. The whiskers are stretched to the maximum and minimum within 1.5 times the IQR, and for a normal distribution represent ~99.3% of the data points.
Remotesensing 11 02179 g002
Figure 3. Long-term monthly averages of (a) AOD, (b) SSA, and (c) AAOD for the period 2005–2017. Data from Brewer#086 are shown for 320, 340, and 360 nm, and from CIMEL for 440 nm. The shaded areas represent the standard deviation envelope around the monthly averages.
Remotesensing 11 02179 g003
Figure 4. Average diurnal variability of the monthly mean SSA at 340 nm for (a) winter, (b) spring, (c) summer, and (d) autumn. The mean of the three months of each season is represented by the black thick line. Error bars represent the standard deviation for the monthly averages of each hourly value.
Remotesensing 11 02179 g004
Figure 5. Average diurnal variability of the monthly mean AAOD at 340 nm for (a) winter, (b) spring, (c) summer, and (d) autumn. The mean of the three months of each season is represented by the black thick line. Error bars represent the standard deviation for the monthly averages of each hourly value.
Remotesensing 11 02179 g005
Figure 6. Monthly and annual mean anomalies for (a) AOD, (b) SSA, and (c) AAOD at 320 nm. Panel (d) depicts the difference of the annual average anomalies of the global UV irradiance at 320 nm relative to 1998 from the measurements (yellow), as well as from the simulations using the measured SSA (green) and a default SSA of 0.85 (blue).
Remotesensing 11 02179 g006
Table 1. Standard uncertainties for single scattering albedo (SSA) and AAOD at 320–360 nm. SZA: solar zenith angle; DG: direct and the global UV irradiance. The overall standard uncertainties are highlighted in bold.
320–360 nm (SZA < 70°)
Uncertainty factorSSA (all)SSA (AOD > 0.3)AAOD (all)AAOD (AOD > 0.3)
DG ratio0.150.030.030.03
AOD0.250.100.040.04
Asymmetry parameter0.040.040.030.03
Default aerosol extinction profile0.020.020.010.01
Default SSA profile>0.020.010.010.01
Surface albedo0.020.020.010.01
Other parameters<0.01<0.01<0.01<0.01
Overall standard uncertainty (320–360 nm)>0.300.120.060.06
310 nm (SZA < 55°)
Uncertainty factorSSA (all)SSA (AOD > 0.3)AAOD (all)AAOD (AOD > 0.3)
DG ratio0.200.050.040.04
AOD0.400.200.070.07
Default aerosol extinction profile0.040.040.030.03
Asymmetry parameter0.040.040.030.03
Default SSA profile>0.020.010.010.01
Surface albedo0.020.020.010.01
Other parameters<0.01<0.01<0.01<0.01
Overall standard uncertainty (310 nm)>0.450.220.090.09

