Novel Multi-Scale Filter Profile-Based Framework for VHR Remote Sensing Image Classification


Abstract
1. Introduction
2. Proposed Method
2.1. Generation of MFPs
2.2. Reduction of Redundancy through PCA
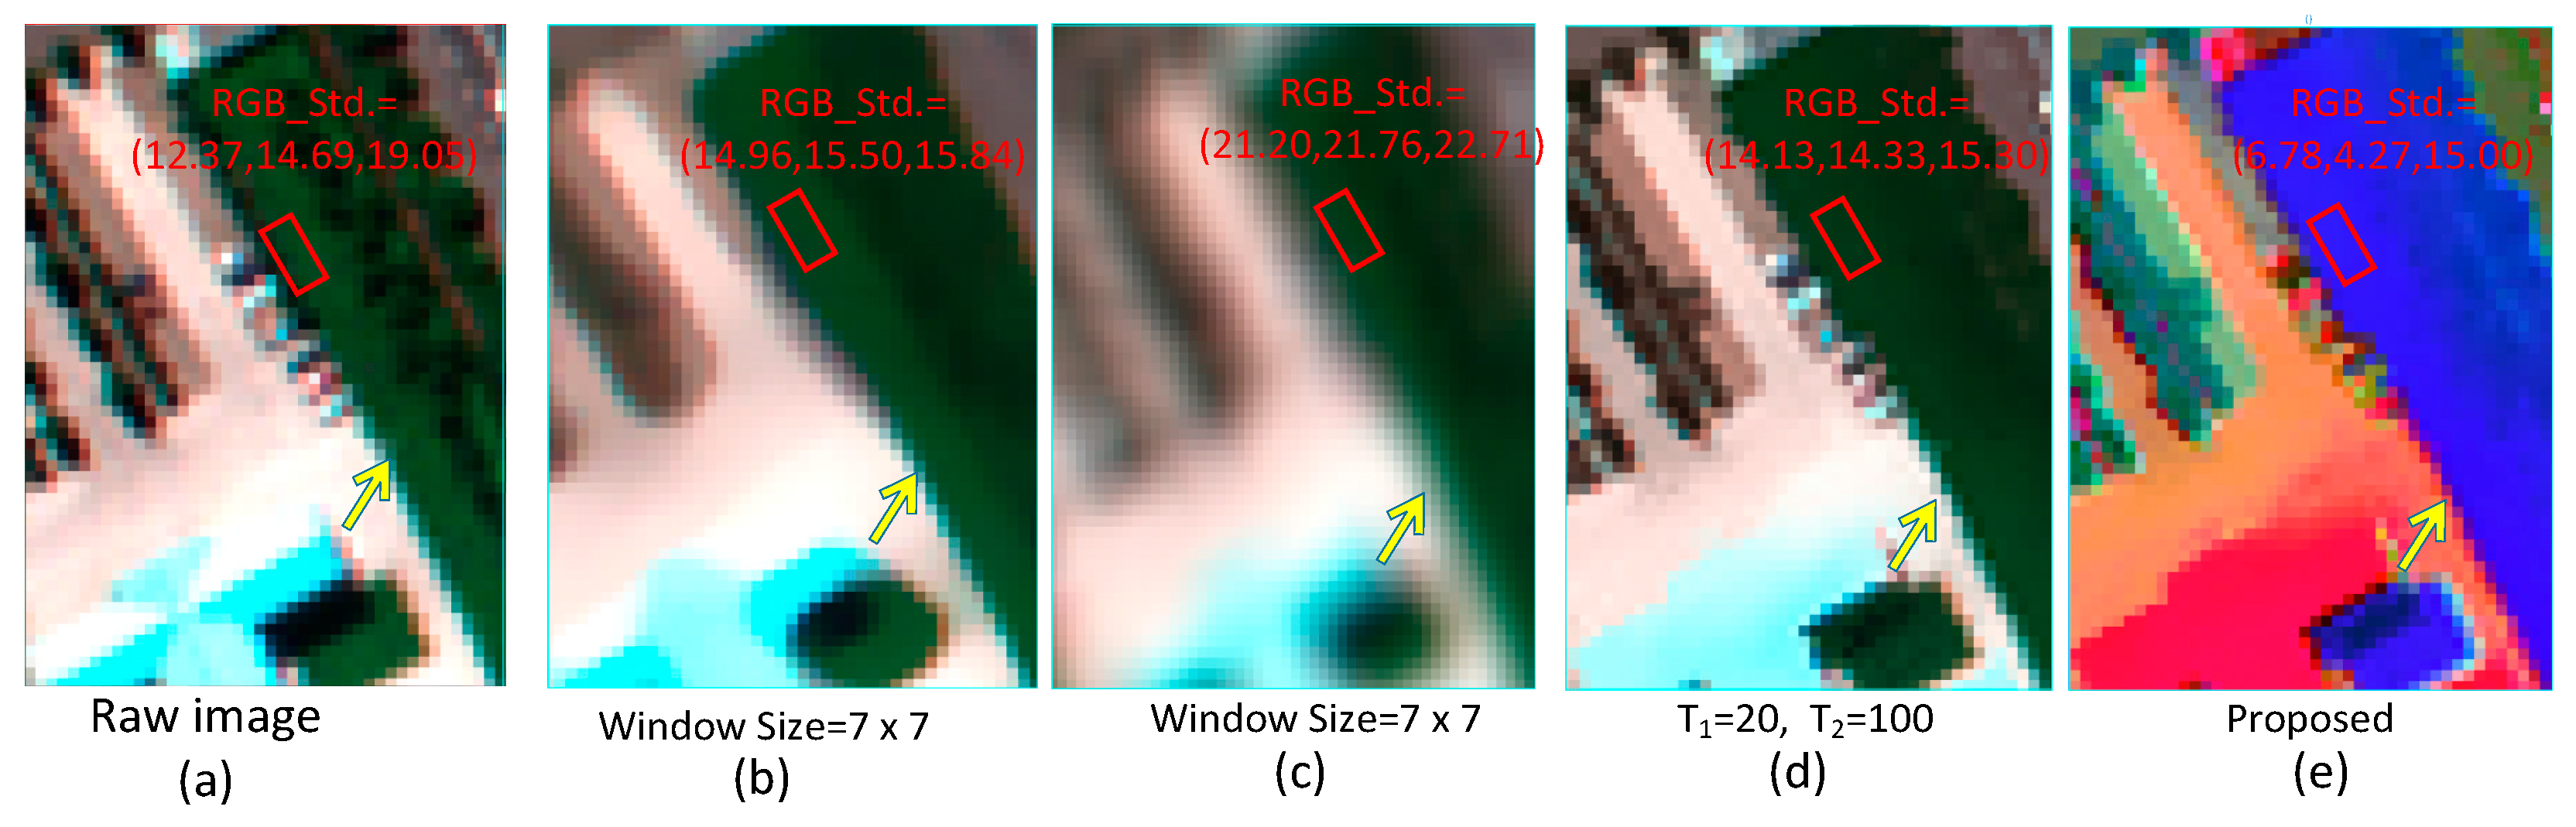
2.3. Post-Processing Classification with MFs
3. Experiments
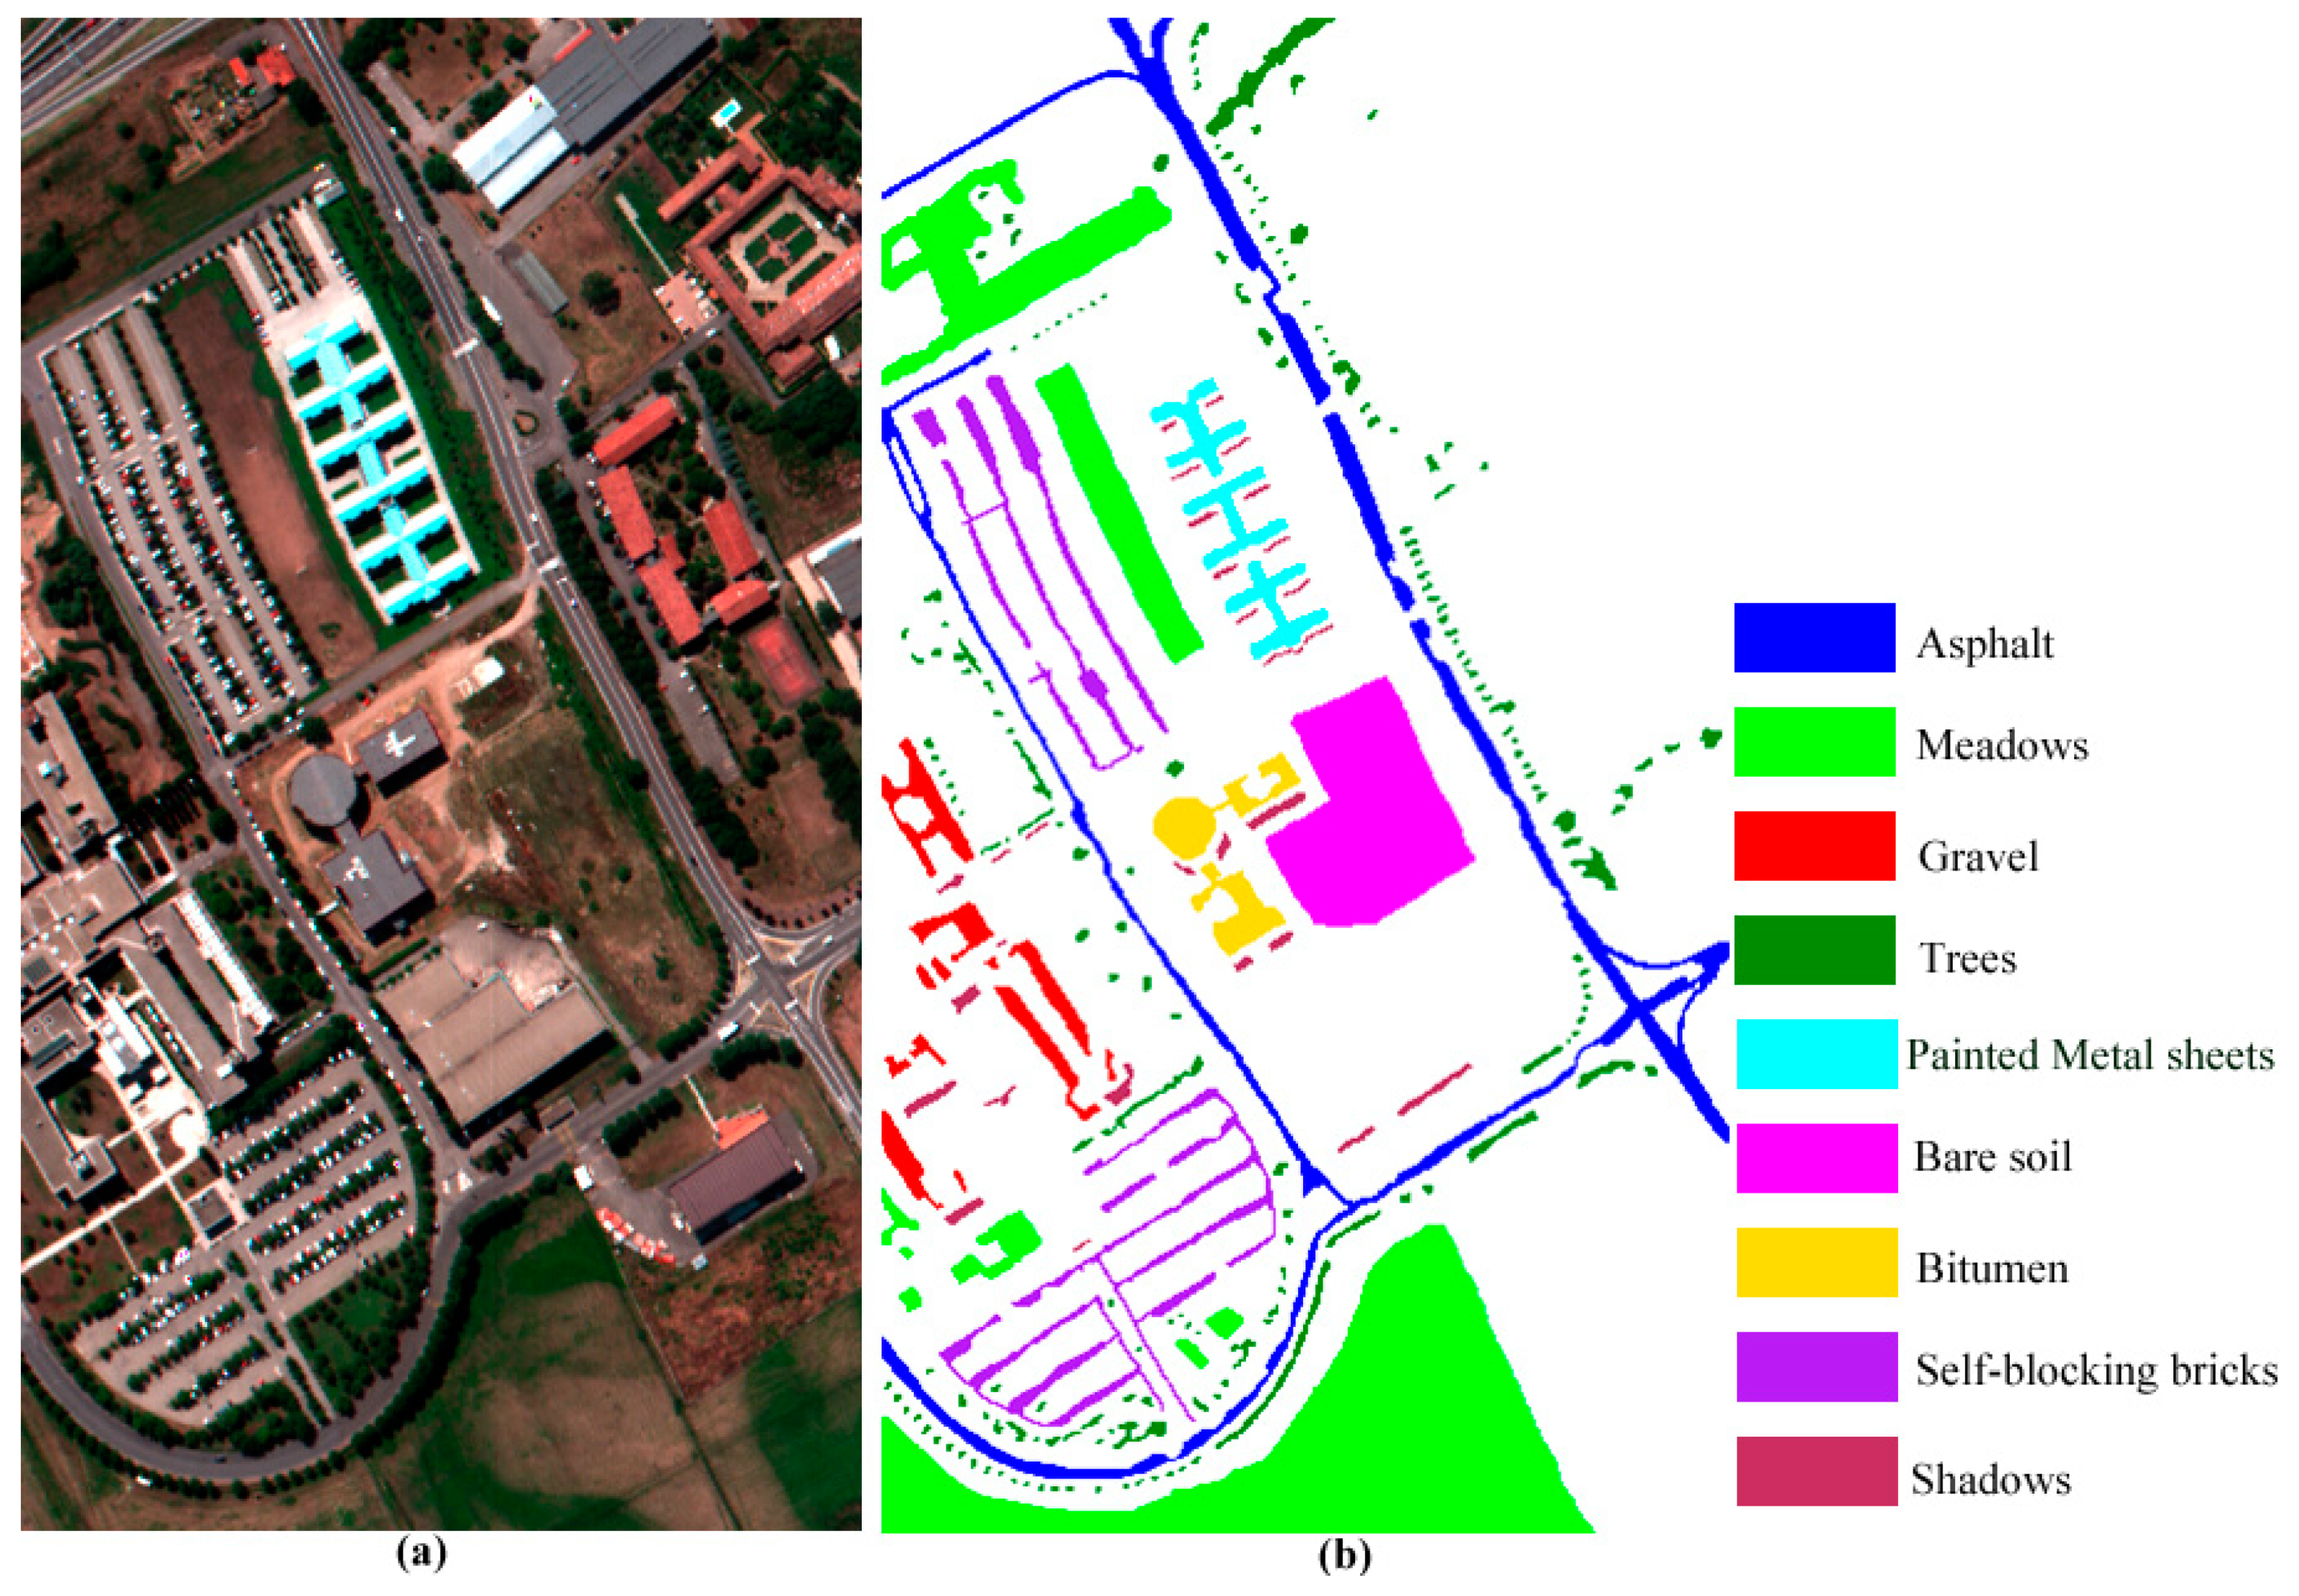
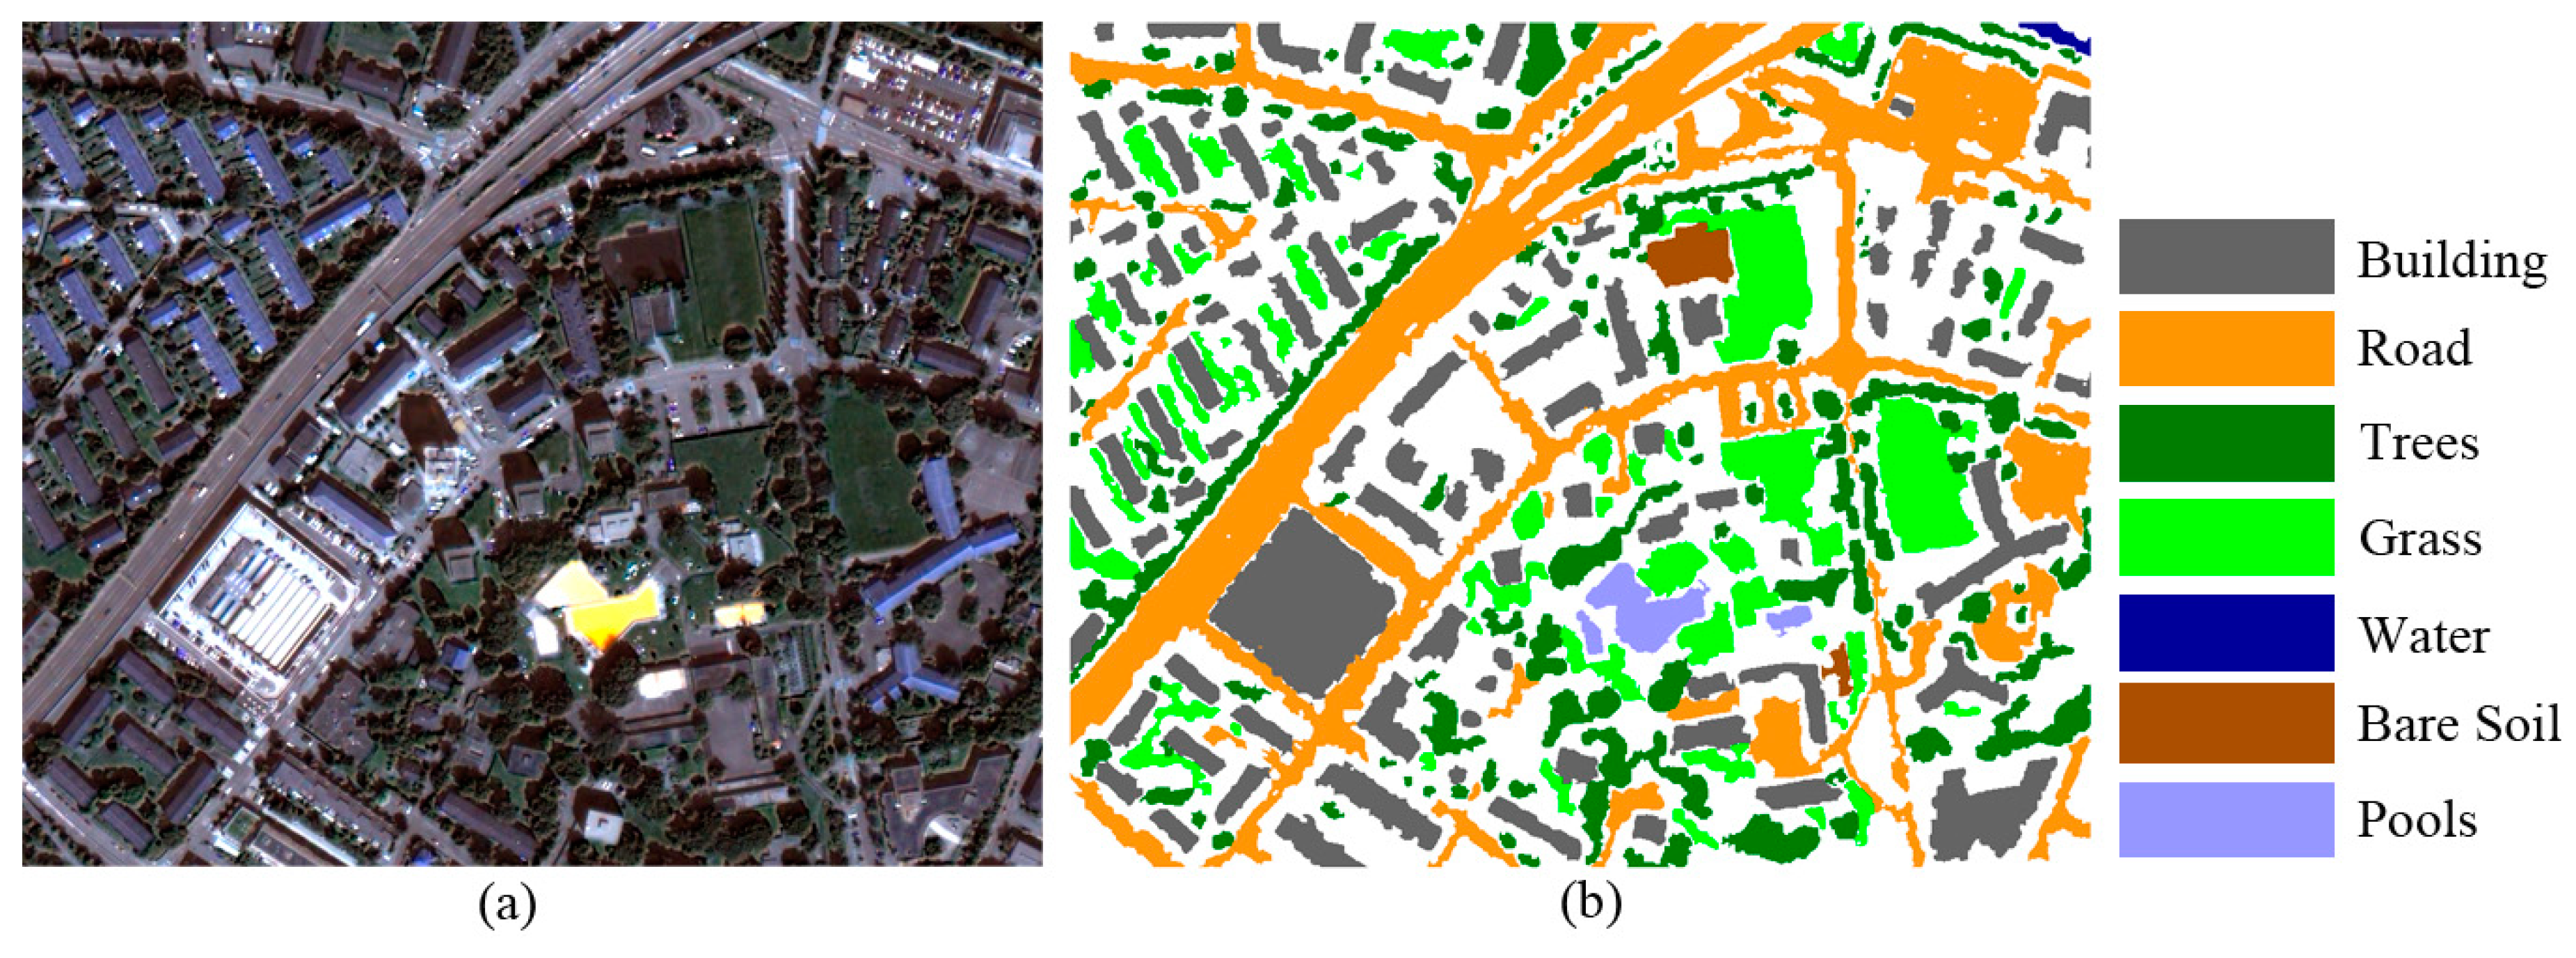
3.1. Datasets
3.2. Experimental Setting
- (1)
- In the first experiment, the JX01 dataset is adopted and classified using the SVM classifier, which is an extensively used pixel-wise classifier. The proposed MFPF is compared with the classification of raw and filtered images based on MF, MedF, and MMF [23].
- (2)
- In the second experiment, three classical and extensively used supervised classifiers, namely, SVM, k-nearest neighbor (KNN), and Random Tree (RT), are adopted to classify the Pavia University image scene. This task is initiated to test the robustness of the proposed approach further in terms of the different classifiers. The effectiveness of the proposed MFPF is further verified by comparing the different filters in terms of the three classifiers.
- (3)
- In the third experiment, based on the ZH-6 dataset, the adaptability of the proposed MFPF is further investigated by comparing several popular spatial–spectral feature-based approaches. Herein, the following four extensively used spatial–spectral feature-based methods and their corresponding parameter settings are used: EPFs [26]: , , , ; RFs [27]: , , iteration = 3; M_EMPs [25]: SE = {“disk”, “line”, “square”, “diamond”}, ; RGF [28]: , , iteration = 5.
3.3. Experimental Results
4. Discussion
5. Conclusions
Author Contributions
Funding
Acknowledgments
Conflicts of Interest
References
- Wang, Q.; Lin, J.; Yuan, Y. Salient band selection for hyperspectral image classification via manifold ranking. IEEE Trans. Neural Netw. Learn. Syst. 2016, 27, 1279–1289. [Google Scholar] [CrossRef] [PubMed]
- Kabisch, N.; Selsam, P.; Kirsten, T.; Lausch, A.; Bumberger, J. A multi-sensor and multi-temporal remote sensing approach to detect land cover change dynamics in heterogeneous urban landscapes. Ecol. Indic. 2019, 99, 273–282. [Google Scholar] [CrossRef]
- Li, J.; Huang, X.; Hu, T.; Jia, X.; Benediktsson, J.A. A novel unsupervised sample collection method for urban land-cover mapping using landsat imagery. IEEE Trans. Geosci. Remote Sens. 2019, 57, 3933–3951. [Google Scholar] [CrossRef]
- Wang, Q.; Gao, J.; Li, X. Weakly supervised adversarial domain adaptation for semantic segmentation in urban scenes. IEEE Trans. Image Process. 2019. [Google Scholar] [CrossRef] [PubMed]
- Ding, B.; Wen, G.; Huang, X.; Ma, C.; Yang, X. Data augmentation by multilevel reconstruction using attributed scattering center for sar target recognition. IEEE Geosci. Remote Sens. Lett. 2017, 14, 979–983. [Google Scholar] [CrossRef]
- Zhang, L.; Zhang, Y. Airport detection and aircraft recognition based on two-layer saliency model in high spatial resolution remote-sensing images. IEEE J. Sel. Top. Appl. Earth Obs. Remote Sens. 2016, 10, 1511–1524. [Google Scholar] [CrossRef]
- Wang, Q.; Wan, J.; Nie, F.; Liu, B.; Yan, C.; Li, X. Hierarchical feature selection for random projection. IEEE Trans. Neural Netw. Learn. Syst. 2018, 30, 1581–1586. [Google Scholar] [CrossRef]
- Lv, P.; Zhong, Y.; Zhao, J.; Ma, A.; Zhang, L. Change detection based on structural conditional random field framework for high spatial resolution remote sensing imagery. In Proceedings of the 2017 IEEE International Geoscience and Remote Sensing Symposium (IGARSS), Fort Worth, TX, USA, 23–28 July 2017; pp. 1059–1062. [Google Scholar]
- Xu, L.; Jing, W.; Song, H.; Chen, G. High-resolution remote sensing image change detection combined with pixel-level and object-level. IEEE Access 2019, 7, 78909–78918. [Google Scholar] [CrossRef]
- Gianinetto, M.; Rusmini, M.; Candiani, G.; Via, G.D.; Frassy, F.; Maianti, P.; Marchesi, A.; Nodari, F.R.; Dini, L. Hierarchical classification of complex landscape with vhr pan-sharpened satellite data and obia techniques. Eur. J. Remote Sens. 2014, 47, 229–250. [Google Scholar] [CrossRef]
- Lv, Z.; He, H.; Benediktsson, J.; Huang, H. A generalized image scene decomposition-based system for supervised classification of very high resolution remote sensing imagery. Remote Sens. 2016, 8, 814. [Google Scholar] [CrossRef]
- Huang, X.; Zhang, L. An svm ensemble approach combining spectral, structural, and semantic features for the classification of high-resolution remotely sensed imagery. IEEE Trans. Geosci. Remote Sens. 2012, 51, 257–272. [Google Scholar] [CrossRef]
- Huang, X.; Lu, Q.; Zhang, L. A multi-index learning approach for classification of high-resolution remotely sensed images over urban areas. ISPRS J. Photogramm. Remote Sens. 2014, 90, 36–48. [Google Scholar] [CrossRef]
- Demir, B.; Bruzzone, L. Histogram-based attribute profiles for classification of very high resolution remote sensing images. IEEE Trans. Geosci. Remote Sens. 2015, 54, 2096–2107. [Google Scholar] [CrossRef]
- Cheng, G.; Han, J.; Guo, L.; Liu, Z.; Bu, S.; Ren, J. Effective and efficient midlevel visual elements-oriented land-use classification using vhr remote sensing images. IEEE Trans. Geosci. Remote Sens. 2015, 53, 4238–4249. [Google Scholar] [CrossRef]
- Zhao, W.; Du, S.; Wang, Q.; Emery, W.J. Contextually guided very-high-resolution imagery classification with semantic segments. ISPRS J. Photogramm. Remote Sens. 2017, 132, 48–60. [Google Scholar] [CrossRef]
- Liu, L.; Jia, Z.; Yang, J.; Kasabov, N. A remote sensing image enhancement method using mean filter and unsharp masking in non-subsampled contourlet transform domain. Trans. Inst. Meas. Control 2017, 39, 183–193. [Google Scholar] [CrossRef]
- Huang, W.; Wang, R.; Gong, X.; Chen, Y. Iterative deblending of simultaneous-source seismic data with structuring median constraint. IEEE Geosci. Remote Sens. Lett. 2017, 15, 58–62. [Google Scholar] [CrossRef]
- Zhang, P.; Li, F. A new adaptive weighted mean filter for removing salt-and-pepper noise. IEEE Signal Process. Lett. 2014, 21, 1280–1283. [Google Scholar] [CrossRef]
- Lin, T.; Zhang, Y.; Müller-Petke, M. Random noise suppression of magnetic resonance sounding oscillating signal by combining empirical mode decomposition and time-frequency peak filtering. IEEE Access 2019, 7, 79917–79926. [Google Scholar] [CrossRef]
- Soille, P. Morphological Image Analysis: Principles and Applications; Springer Science & Business Media: Berlin, Germany, 2013. [Google Scholar]
- He, L.; Li, J.; Plaza, A.; Li, Y. Discriminative low-rank gabor filtering for spectral–spatial hyperspectral image classification. IEEE Trans. Geosci. Remote Sens. 2016, 55, 1381–1395. [Google Scholar] [CrossRef]
- ZhiYong, L.; Shi, W.; Benediktsson, J.A.; Gao, L. A modified mean filter for improving the classification performance of very high-resolution remote-sensing imagery. Int. J. Remote Sens. 2018, 39, 770–785. [Google Scholar] [CrossRef]
- Dalla Mura, M.; Benediktsson, J.A.; Waske, B.; Bruzzone, L. Morphological attribute profiles for the analysis of very high resolution images. IEEE Trans. Geosci. Remote Sens. 2010, 48, 3747–3762. [Google Scholar] [CrossRef]
- Lv, Z.Y.; Zhang, P.; Benediktsson, J.A.; Shi, W.Z. Morphological profiles based on differently shaped structuring elements for classification of images with very high spatial resolution. IEEE J. Sel. Top. Appl. Earth Obs. Remote Sens. 2014, 7, 4644–4652. [Google Scholar] [CrossRef]
- Kang, X.; Li, S.; Benediktsson, J.A. Spectral–spatial hyperspectral image classification with edge-preserving filtering. IEEE Trans. Geosci. Remote Sens. 2013, 52, 2666–2677. [Google Scholar] [CrossRef]
- Kang, X.; Li, S.; Benediktsson, J.A. Feature extraction of hyperspectral images with image fusion and recursive filtering. IEEE Trans. Geosci. Remote Sens. 2013, 52, 3742–3752. [Google Scholar] [CrossRef]
- Zhang, Q.; Shen, X.; Xu, L.; Jia, J. Rolling Guidance Filter; European Conference on Computer Vision; Springer: Cham, Switzerland, 2014; pp. 815–830. [Google Scholar]
- Li, M.; Zang, S.; Zhang, B.; Li, S.; Wu, C. A review of remote sensing image classification techniques: The role of spatio-contextual information. Eur. J. Remote Sens. 2014, 47, 389–411. [Google Scholar] [CrossRef]
- Li, C.; Yang, S.; Yang, Y.; Gao, H.; Zhao, J.; Qu, X.; Wang, Y.; Yao, D.; Gao, J. Hyperspectral remote sensing image classification based on maximum overlap pooling convolutional neural network. Sensors 2018, 18, 3587. [Google Scholar] [CrossRef] [PubMed]
- Shi, C.; Pun, C.-M. Adaptive multi-scale deep neural networks with perceptual loss for panchromatic and multispectral images classification. Inf. Sci. 2019, 490, 1–17. [Google Scholar] [CrossRef]
- Chen, Y.; Jiang, H.; Li, C.; Jia, X.; Ghamisi, P. Deep feature extraction and classification of hyperspectral images based on convolutional neural networks. IEEE Trans. Geosci. Remote Sens. 2016, 54, 6232–6251. [Google Scholar] [CrossRef]
- Wilkinson, G.G. Results and implications of a study of fifteen years of satellite image classification experiments. IEEE Trans. Geosci. Remote Sens. 2005, 43, 433–440. [Google Scholar] [CrossRef]
- Liu, D.; Xia, F. Assessing object-based classification: Advantages and limitations. Remote Sens. Lett. 2010, 1, 187–194. [Google Scholar] [CrossRef]
- Tang, Y.; Atkinson, P.M.; Wardrop, N.A.; Zhang, J. Multiple-point geostatistical simulation for post-processing a remotely sensed land cover classification. Spat. Stat. 2013, 5, 69–84. [Google Scholar] [CrossRef]
- Huang, X.; Lu, Q.; Zhang, L.; Plaza, A. New postprocessing methods for remote sensing image classification: A systematic study. IEEE Trans. Geosci. Remote Sens. 2014, 52, 7140–7159. [Google Scholar] [CrossRef]
- Lv, Z.; Zhang, X.; Benediktsson, J.A. Developing a general post-classification framework for land-cover mapping improvement using high-spatial-resolution remote sensing imagery. Remote Sens. Lett. 2017, 8, 607–616. [Google Scholar] [CrossRef]
- Lv, Z.; Liu, T.; Wan, Y.; Benediktsson, J.A.; Zhang, X. Post-processing approach for refining raw land cover change detection of very high-resolution remote sensing images. Remote Sens. 2018, 10, 472. [Google Scholar] [CrossRef]
- Bouwmans, T.; Sobral, A.; Javed, S.; Jung, S.K.; Zahzah, E.-H. Decomposition into low-rank plus additive matrices for background/foreground separation: A review for a comparative evaluation with a large-scale dataset. Comput. Sci. Rev. 2017, 23, 1–71. [Google Scholar] [CrossRef]
- Jolliffe, I.T.; Cadima, J. Principal component analysis: A review and recent developments. Philos. Trans. R. Soc. A Math. Phys. Eng. Sci. 2016, 374, 20150202. [Google Scholar] [CrossRef] [PubMed]
- Tzeng, D.Y.; Berns, R.S. A review of principal component analysis and its applications to color technology. Color Res. Appl. 2005, 30, 84–98. [Google Scholar] [CrossRef]
- Li, S.; Hao, Q.; Gao, G.; Kang, X. The effect of ground truth on performance evaluation of hyperspectral image classification. IEEE Trans. Geosci. Remote Sens. 2018, 56, 7195–7206. [Google Scholar] [CrossRef]


| Class | Raw Image without Filter | MMF [23] T1 = 15, T2 = 100 | Proposed MFPF | ||
|---|---|---|---|---|---|
| Road | 96.10 | 97.80 | 97.70 | 96.60 | 95.00 |
| Grass | 93.60 | 93.50 | 93.40 | 97.10 | 98.20 |
| Building | 99.30 | 99.50 | 99.50 | 99.50 | 99.50 |
| Shadow | 89.10 | 84.30 | 80.90 | 81.40 | 87.80 |
| Trees | 93.40 | 93.90 | 93.70 | 93.00 | 93.40 |
| Water | 95.00 | 96.20 | 93.90 | 98.60 | 99.00 |
| Soil | 57.00 | 56.90 | 57.00 | 57.30 | 70.40 |
| OA | 88.52 | 88.31 | 87.79 | 88.22 | 92.43 |
| AA | 89.08 | 88.89 | 88.01 | 89.07 | 91.88 |
| KA | 0.851 | 0.848 | 0.842 | 0.847 | 0.900 |
| Classifier | Raw Image without Filter | MMF [23] T1 = 25, T2 =100 | Proposed MFPF | |||
|---|---|---|---|---|---|---|
| SVM (S = 130) | OA | 63.04 | 72.03 | 74.00 | 75.50 | 83.57 |
| AA | 64.99 | 72.33 | 76.05 | 77.14 | 83.25 | |
| Ka | 0.539 | 0.641 | 0.666 | 0.684 | 0.775 | |
| KNN (S = 500) | OA | 66.91 | 73.60 | 80.30 | 83.92 | 94.18 |
| AA | 67.69 | 71.47 | 77.27 | 81.38 | 94.14 | |
| Ka | 0.588 | 0.667 | 0.750 | 0.793 | 0.924 | |
| RT (S = 450) | OA | 65.64 | 71.68 | 78.96 | 79.13 | 92.36 |
| AA | 66.48 | 72.01 | 77.00 | 77.50 | 92.59 | |
| Ka | 0.573 | 0.645 | 0.733 | 0.734 | 0.901 |
| Class | Raw Image without Filter | MMF [23] T1 = 25, T2 = 100 | Proposed MFPF | ||
|---|---|---|---|---|---|
| Asphalt | 87.80 | 94.40 | 96.30 | 96.10 | 97.30 |
| Meadows | 86.30 | 90.00 | 93.70 | 94.40 | 99.30 |
| Gravel | 42.80 | 48.00 | 66.20 | 71.80 | 90.00 |
| Tress | 55.90 | 59.70 | 58.90 | 67.90 | 92.30 |
| Painted | 82.60 | 73.70 | 82.40 | 85.00 | 97.40 |
| Bare soil | 34.10 | 44.80 | 54.80 | 59.70 | 75.60 |
| Bitumen | 55.20 | 57.70 | 71.60 | 79.90 | 99.40 |
| Self-blocking bricks | 72.10 | 77.70 | 89.90 | 87.50 | 98.80 |
| Shadows | 92.50 | 97.20 | 81.60 | 90.20 | 97.30 |
| OA | 66.91 | 73.60 | 80.30 | 83.92 | 94.18 |
| AA | 67.69 | 71.47 | 77.27 | 81.38 | 94.14 |
| KA | 0.588 | 0.667 | 0.750 | 0.793 | 0.924 |
| Class | Raw Image without Filter | EPFs [26] | RFs [27] | M_EMPS [25] | RGF [28] | Proposed MFPF |
|---|---|---|---|---|---|---|
| Building | 87.00 | 89.30 | 90.30 | 68.30 | 91.90 | 93.40 |
| Road | 77.40 | 77.80 | 79.80 | 75.10 | 81.20 | 80.10 |
| Trees | 84.40 | 87.10 | 86.00 | 84.40 | 89.90 | 90.90 |
| Grass | 73.60 | 75.10 | 78.90 | 67.50 | 79.60 | 81.80 |
| Water | 4.90 | 5.61 | 5.61 | 5.87 | 6.22 | 11.00 |
| Bare soil | 6.18 | 6.64 | 8.38 | 7.90 | 7.92 | 10.20 |
| Pools | 32.9 | 33.90 | 30.70 | 35.20 | 35.10 | 34.80 |
| OA | 67.21 | 69.11 | 70.41 | 65.20 | 71.90 | 74.96 |
| AA | 52.35 | 53.64 | 54.26 | 49.19 | 55.98 | 57.45 |
| Ka | 0.579 | 0.601 | 0.618 | 0.550 | 0.638 | 0.674 |
© 2019 by the authors. Licensee MDPI, Basel, Switzerland. This article is an open access article distributed under the terms and conditions of the Creative Commons Attribution (CC BY) license (http://creativecommons.org/licenses/by/4.0/).
Share and Cite
Lv, Z.; Li, G.; Chen, Y.; Atli Benediktsson, J. Novel Multi-Scale Filter Profile-Based Framework for VHR Remote Sensing Image Classification. Remote Sens. 2019, 11, 2153. https://doi.org/10.3390/rs11182153
Lv Z, Li G, Chen Y, Atli Benediktsson J. Novel Multi-Scale Filter Profile-Based Framework for VHR Remote Sensing Image Classification. Remote Sensing. 2019; 11(18):2153. https://doi.org/10.3390/rs11182153
Chicago/Turabian StyleLv, Zhiyong, Guangfei Li, Yixiang Chen, and Jón Atli Benediktsson. 2019. "Novel Multi-Scale Filter Profile-Based Framework for VHR Remote Sensing Image Classification" Remote Sensing 11, no. 18: 2153. https://doi.org/10.3390/rs11182153
APA StyleLv, Z., Li, G., Chen, Y., & Atli Benediktsson, J. (2019). Novel Multi-Scale Filter Profile-Based Framework for VHR Remote Sensing Image Classification. Remote Sensing, 11(18), 2153. https://doi.org/10.3390/rs11182153