Abstract
Urban areas are subject to subsidence due to varying natural and anthropogenic causes. Often, subsidence is interpreted and correlated to a single causal factor; however, subsidence is usually more complex. In this study, we adopt a new model to distinguish different causes of subsidence in urban areas based on complexity. Ascending and descending Sentinel-1 data were analyzed using permanent scatterer interferometry (PS-InSAR) and decomposed to estimate vertical velocity. The estimated velocity is correlated to potential causes of subsidence, and modeled using different weights, to extract the model with the highest correlations among subsidence. The model was tested in Alexandria City, Egypt, based on three potential causes of subsidence: rock type, former lakes and lagoons dewatering (FLLD), and built-up load (BL). Results of experiments on the tested area reveal singular patterns of causal factors of subsidence distributed across the northeast, northwest, central south, and parts of the city center, reflecting the rock type of those areas. Dual causes of subsidence are found in the southwest and some parts of the southeast as a contribution of rock type and FLLD, whereas the most complex causes of subsidence are found in the southeast of the city, as the newly built-up areas interact with the rock type and FLLD to form a complex subsidence regime. Those areas also show the highest subsidence values among all other parts of the city. The accuracy of the final model was confirmed using linear regression analysis, with an R2 value of 0.88.
1. Introduction
Monitoring and analyzing subsidence in urban areas provides actionable intelligence for the prevention of potential loss of life and property, given the high rates of urbanization in many parts of the world. A variety of factors could produce urban subsidence including natural and anthropogenic causes such as lithology [1,2,3,4], dewatering [4,5], tectonic activities [6,7], building loads [3,6,8], Mining activities [9], and groundwater consumption [6,10,11,12]. One of those factors could individually influence the surface subsidence. Thus, the causes of urban subsidence within a study area are normally interpreted individually, but subsidence may be caused by interaction of several factors acting together in the same area and, normally, the interaction between several subsidence causes increases potential subsidence-related hazards in urban areas such as building collapse, and could influence the inhabitants living in these urban areas.
The interaction between causal factors is clear in many cases [13]. Nevertheless, the interaction between different factors is normally treated descriptively in large areas as in Seleem et al. [8], or mathematically in very small areas such as at building scale [13], and relatively few studies integrate spatially two or more causes when interpreting a pattern of subsidence in a city scale or larger areas of interest [14]. Hence, in this study, we propose a new model to interpret and map the complex subsidence causality (CSC) based on the number of spatially dependent factors that contribute to subsidence in a given area of interest. This interpretation is helpful in defining potentially hazardous areas, for better management in existing urban areas, and planning new expansion. Since factors causing surface subsidence are varied in each area, this model was designed to be flexible in the matter of subsidence inputs based on the unique characteristics of a study area. The causes of subsidence and the integration and interaction and correlations between these causal factors, therefore, need to be analyzed in detail to reach this goal.
Accurate surface velocity estimations can reduce the uncertainty in models of subsidence phenomena. Microwave remote-sensing data gives the opportunity to measure surface motion precisely. This model depends on the permanent scatterer interferometric synthetic aperture radar (PS-InSAR) technique [15], to detect subsidence in the study area. PS-InSAR is a SAR based deformation monitoring technique designed to overcome temporal and geometrical decorrelation problems of differential interferometric SAR (D-InSAR), by identifying and exploiting stable targets in a temporal series of interferograms as permanent scatterers. This technique has the capability to detect surface deformation in wide area coverage at millimeter-level precision [16]. The reliability of results derived from the PS-InSAR technique was confirmed by continuous global positioning system (GPS) data measurements [17]. In this study, ascending and descending data of Sentinel-1 [18], were used to estimate surface motion in the line of sight (LOS) in Alexandria, Egypt. The two results of LOS were integrated to decompose the surface vertical velocity of Alexandria.
Alexandria was selected as a test area due to its location in a deltaic margin. Cities in delta margins are well known for their complex patterns of urban subsidence. The decrease in the Nile annual water and sediment discharge over the last two centuries related to barrages and dam construction on the lower River Nile has resulted in a subsidence rate increase across the city [4]. Subsidence and sea-level rise make this city vulnerable to coastal flooding, potentially exposing a large urban population to risk [19]. Subsidence in Alexandria has not been fully reported in literature; however, subsidence was partially studied using traditional geological measurements mainly in the eastern and southern parts of the city [4,7,19,20] and interferometric synthetic aperture radar (InSAR) techniques were used to study the central part of the city to measure sea level rise [17]. In our work, we tested several factors linked to subsidence, irrelevant causes of subsidence were eliminated; and the remaining were then modeled to map the CSC of Alexandria.
2. Materials and Methods
The CSC model consists of three main parts as illustrated in the red dashed boxes in Figure 1. The first part is the vertical motion estimation that depends on PS-InSAR surface velocity estimation. The second part is the subsidence causality inputs, which are varied based on the characteristics of the study area. The third part is the spatial integration of vertical velocity and subsidence causality factors. In this part, different ranks and weights are given to extract the best-fitting model to map the complex subsidence causality in the study area.
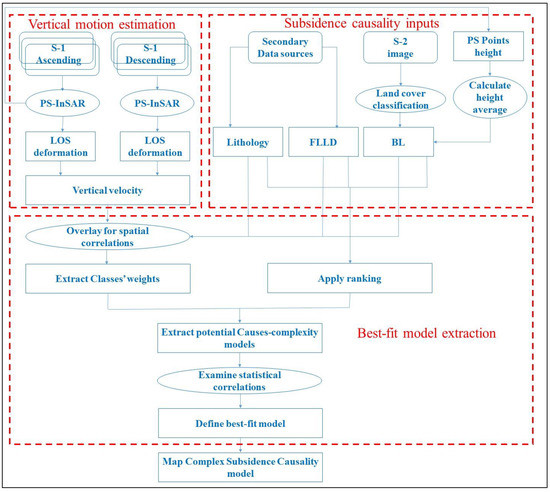
Figure 1.
The workflow of the complex subsidence causality (CSC) model.
Surface velocity is estimated in the LOS direction for ascending and descending geometries. Two LOS measures are integrated to decompose the vertical velocity. Potential subsidence causes are assessed based on literature and initial field investigations. Once confirmed, these spatially distributed factors are used as subsidence causality inputs. Potential causal factors for subsidence are correlated to the vertical velocity map in order to define weights for their classes, based on the mean vertical displacement. Different models are initiated with ranked causality factors, and correlated to a vertical motion map, to extract a best-fit model for CSC mapping in the study area. Detailed steps of the CSC model and subsidence causality inputs for Alexandria illustrated by the blue shapes in Figure 1, the details are presented in the following sub-sections.
2.1. Vertical Motion Estimation
2.1.1. Permanent Scatterer Interferometry Synthetic Aperture Radar (PS-InSAR) Processing
We used Sentinel 1A/B (S-1) data for PS-InSAR processing over Alexandria City. S-1 is a two-satellite constellation C-band radar sensor launched and managed by the European Space Agency (ESA) as a part of the Global Monitoring for Environment and Security (GMES) Space Component programme. The first S1 sensor (S-1A) was launched in 2014. The second sensor (S-1B) was launched in 2016. S-1 as a microwave satellite constellation has a short temporal resolution with revisits up to six days in Europe and its surrounding regions. This sensor has wide swath data (250 km) and geometric resolution of 5 m in range and 20 m in azimuth, to serve medium to high-resolution applications [21,22]. In this study, we used ascending and descending orbits for deformation interpretation over the city area; 124 images were collected from an ascending orbit, and 129 images from a descending orbit. Data were acquired between January 2015 and May 2019, with a temporal baseline average of 12 days.
The standard PS-InSAR technique was applied to detect surface deformation using SARPROZ [23]. In the interferometric analysis, the differential interferometric phase Δфdiff consists of deformation Δфdefo, topographic residuals Δфtopo, atmospheric delay Δфatmo, and residual noise Δфnoise signals as shown in e following formula:
Δфdiff = Δфdefo + Δфtopo + Δфatmo + Δфnoise
PS-InSAR analysis depends on creating a network between permanent scatterers to separate the topographic residuals and the atmospheric delay from the deformation signal [15]. It requires a coregistration of all so-called slave images to a master image. With terrain observation by progressive scans (TOPS) mode as the standard acquisition mode for S-1 data, a very precise coregistration accuracy of about 0.009 of a pixel is required [22]. We limited the estimation of the linear trend between ±160 mm and the estimation of the residual topographic error between ±220 m to include the high-rise buildings in the area.
PS-InSAR depends on a stable reference point to estimate relative velocity in respect to that reference point. Therefore, for a combined PS-InSAR analysis from different orbits, special care in selecting the reference points is required. Reference points for the two geometries were selected in a relatively stable area and close to each other within one kilometer between the two geometries reference points. Finally, we only selected PS points with a temporal coherence of 0.8 or higher.
2.1.2. Vertical Velocity Decomposition
After obtaining the line-of-sight (LOS) velocity of the ascending and descending geometries, the surface deformation in the whole study area was predicted via an interpolation, to create a continuous surface of deformation over the whole study area for the vertical velocity decomposition process. Several equations were used to calculate two-dimensional (2D), and 3D displacement for InSAR results [24,25,26,27]. In this study, vertical deformation was retrieved by using the matrix presented in Equations (2) and (3) [28]:
where
d is the deformation along LOS for ascending and descending , and is the vertical motion. The term refers to the projection of horizontal deformation in descending azimuth look direction, θ is the incident angle, and ∆α is the satellite heading difference between ascending and descending mode. The estimated horizontal motion in this matrix is in the east-west direction. The north-south horizontal motion is considered negligible because of the near-polar orbit of Sentinel-1 sensors that does not allow an accurate estimation of north-south displacement [29]. Negative values of the estimated vertical velocities represent surface subsidence in the study area. However, in this study we considered areas with vertical velocity less than −2 mm/y as subsidence areas in the further analysis.
2.2. Subsidence Causality Inputs
The spatial and temporal context in an area of interest should be considered when defining the CSC causality inputs that could explain surface motion. Alexandria is one of the oldest cities in Africa and the Mediterranean Sea. It is the second largest city in Egypt and the main harbor city of the country. Located in a semi-arid area, Alexandria has only two climatic seasons: a moderate winter with very little rainfall from November to April, and a hot dry summer from May to October. The population of the city is more than five million with a population density of about 1800/km2, based on Egyptian Statistical Office (CAPMS) data [8]. It was built by Alexander the Great on the site of Rhakotis village in 331 BC [30]. The present city is located between 30°50′ to 31°40′ North and 29°40′ to 32°35′ East, Alexandria extends from Abu Qir Bay in the East to Sidi Krier in the West with a waterfront of about 70 km. This city has a commercial, industrial, business, and cultural importance in the country as almost 40% of Egyptian industry is located in or surrounding the city [8].
Alexandria is located in a tectonically stable area. Geologically, it is based on a cemented Pleistocene sandstone ridge, and covered by a thin layer of Nile Delta’s Holocene sediments, except for the sandy tombolo that connects the paleo-island to the mainland. The carbonate sandstone ridge appears in some parts of the west in Alagami and east in Abu Qir. Geomorphologically, it consists of a low, near-horizontal topography within one meter above the mean sea level [31]. Most of the city lies on a long natural bay between the sea and Lake Mareotis at the western edge of the Nile Delta. Alexandria consists of three segments: beach resorts in the southwest, watersheds in the city center, and cape Abu Qir in the northeast [8,30]. The southern parts of the city were formerly wetlands [6,7].
This city experienced severe subsidence rates caused by short-term catastrophic events such as powerful earthquakes and tsunamis in the years 365 AD, 1303, and 1323 that resulted in a sudden failure of some parts of the city such as the eastern harbor [32]. In the last three decades, the city area has expanded rapidly. However, the major part of the urban expansion is unplanned with a lack of basic services and infrastructure for a large part of the population in those areas [8]. Figure 2 presents the study area of Alexandria city and its important features.
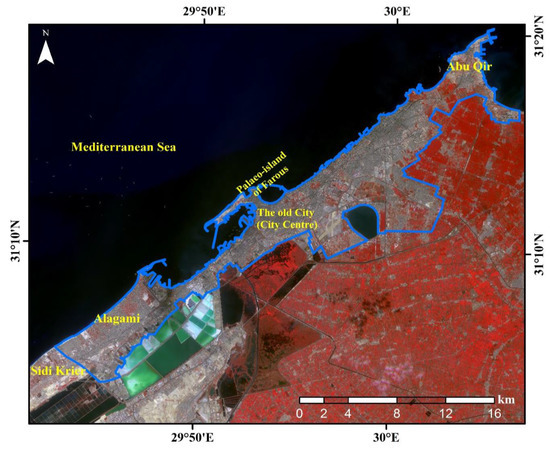
Figure 2.
Study area. Based on a background of a Sentinel-2 (S-2) infrared false color image acquired on 24 October 2018 (R: band 8, G: band 4, B: band 2), Figure 2 presents the study area with blue border, and main city areas names wrote in yellow color font. The S-2 infrared false color image shows vegetation in reddish colors, built-up areas in grayish colors, and salty swamps in greenish colors.
The literature and field investigation controlled the subsidence causality factors selection in Alexandria. Our model-test-study started with a hypothesis of eight subsidence causality factors in Alexandria: rock type, former lakes and lagoon dewatering (FLLD) in dried and reclaimed lands, active faults, seismic activities, building load (BL), groundwater extraction, mining activities, and underground infrastructure. Field investigations revealed no large underground infrastructure in Alexandria that could influence surface subsidence due to its sensitive nature, nor mining activities which may influence surface motion of the city. Field investigations also revealed no groundwater extraction for irrigation in the study area due to the high salinity of the subsurface water (see also [17]). In addition, the seismic activities in the city have only a small influence on surface deformation as no earthquakes with a magnitude above five or six have been measured during the last century. No active faults at less than the century-scale, that could have influenced the surface, were detected in the study area [17]. Hence, this study considered only three potential causes of surface subsidence in the city: rock type, FLLD, and BL. Rock type and FLLD data were collected from secondary data sources [20,30], as shown in Figure 3, on a true color image of S-2 of 24 October 2018. Figure 3a shows lithological map of the study area modified after the geological map produced by Egyptian geological survey in 1992 and Warne and Stanley [20]. While, Figure 3b presents former lakes and lagoon in Alexandria modified after Warne and Stanley [20], and Abdel-Salam [30]. However, BL needed to be developed as no existing data for this factor were available in Alexandria.
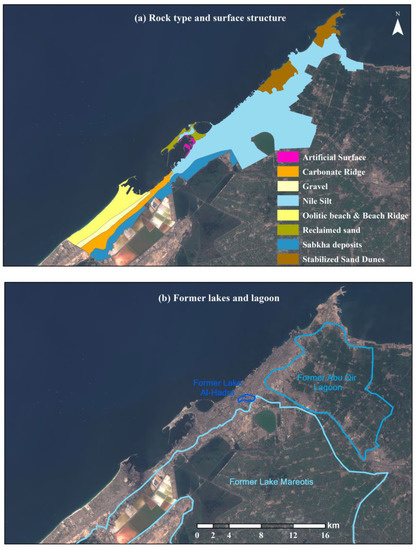
Figure 3.
Rock type and former lakes and lagoons (FLL) in the study area, (a) rock type and surface structure of the city, (b) former lakes and lagoons in Alexandria.
To map the BL of Alexandria, we used the highest resolution data from Sentinel-2. Bands 2, 3, 4, and 8 (10m) are used to map land cover by using an un-supervised K-means classification method. Different classes were defined and combined to five land cover types: water, vegetation, soil, moderate impervious surfaces (IS), and dense IS, as illustrated in Figure 4. This figure shows the high density of built-up areas in Alexandria, with less vegetated spaces within urban blocks, and areas of cultivated crops present in the northeast and southeastern parts of the city.
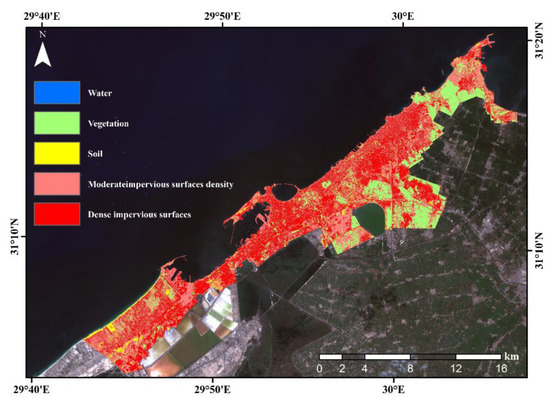
Figure 4.
Land cover classification of S-2 image of 24 October 2018 presented on its true color image.
We isolated the water surface land cover from further analysis and combined bare soil with vegetation land cover in a single class and gave it a rank of 1. Moderate IS land cover had a rank of 2; while, dense IS was ranked 3, as illustrated in Figure 5a. In turn, we used the extracted height values of the PS points in the PS-InSAR result of the ascending data to interpolate a digital surface model (DSM) for Alexandria, as a reference for relative building heights average in the study area. Since the extracted height in the PS-InSAR process is a relative height, heights were classified without considering the exact value of each PS point height. Five classes were extracted from very low to very high DSM by using the quantile method as presented in Figure 5b, and ranked from 1 to 5. The last step when producing the BL integrated the ranked land cover map with the ranked DSM to finalize the BL map presented in Figure 5c. The DSM ranks were double weighted before integration because building height affects subsidence much more land-cover classification.
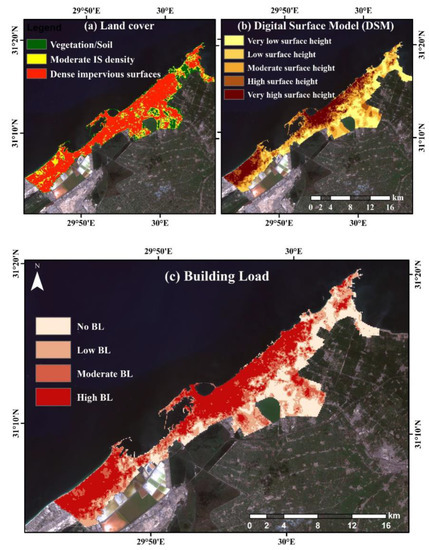
Figure 5.
Building load map presented on the Sentinel-2 true color image of 24 October 2018; (a) aggregated land cover map, (b) extracted building heights, and (c) the final building load map.
As illustrated in Figure 5c, high BL is spatially distributed in the historical built-up area in the city center, in the Alagami neighborhood in southwest Alexandria, in the densely built-up areas in Abu-Qir, and around new buildings in the southern parts of the city. The BL map of the city was used in combination with maps of the rock type and FLL to determine the spatial correlation of each potential subsidence causality factor and the vertical motion in the area of interest.
2.3. Best-Fit Model Extraction
Weights were assigned for classes of each factor depending on the vertical velocity average, based on the spatial distribution of potential subsidence causality factors, as the sum of weights for all classes is equal to 100. We designed a number of models tested for a correlation between the models and vertical velocity. Each model had a different set of input factor ranks as in our test area in Alexandria, as shown in Table 1.

Table 1.
Examined model parameters for causes probability.
Because we have only three potential subsidence causality factors in Alexandria, we designed seven models; the first one has equal ranks for the three factors. Factors had different ranks to distinguish their influence on surface vertical velocity. Models were calculated based on the formula presented in Equation (4):
where, L is the rock type factor, F is the FLLD factor, and B is BL factor. The value R is the rank for each factor in the model as presented in Table 1, and w is the weights of classes in each subsidence causality factor, based on the surface deformation detected within each discrete class.
Lw*R + Fw*R + Bw*R
This formula has three variables based on the three subsidence causality factors in Alexandria; however, this equation is flexible, and different variables can be added or removed, based on the number and type of subsidence causality factors in the area of study. The model results can now be correlated to the vertical surface motion in the study area. We suggest using two different methods to measure correlation: Pearson’s correlation coefficient, and Spearman’s rho. The model with highest correlation coefficient of those two methods is used to map the CSC in the area of interest.
3. Model Results for the Tested Area
3.1. PS-InSAR Line of Sight (LOS) Displacement Results
The relative deformation in the ascending orbit LOS varied between 6.07 mm/yr and −35.4 mm/yr, with an average velocity of −0.29 mm/yr; the descending LOS velocity was between 6.3 mm/yr and −37.4 mm/yr, with an average of −1.8 mm/yr as shown in Figure 6. Figure 6a presents motion in the LOS of the ascending orbit and 6b shows motion in the LOS of the descending orbit. The graduated blue colour in Figure 6 shows areas of stable to slight motion towards the sensor, as we considered stable areas as those having an annual average motion of ±2 mm. Areas of motion away from the sensor are shown as points on a spectrum ranging from light green, yellow, orange, to red, based on the deformation velocity.
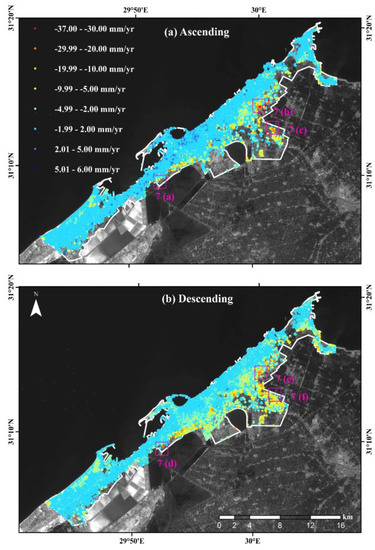
Figure 6.
Displacement in the line of sight (LOS) presented on the Sentinel-2 gray image of 24 October 2018 blue band; (a) velocity in the LOS of ascending geometry and (b) is motion in the LOS of descending geometry.
Figure 6 also indicates locations in the pink colour rectangles including representative PS points used in time series analysis as presented in Figure 7. Cumulative displacement in ascending LOS during the study area from January 2015 to May 2019, reached 156 mm away from the sensor. The highest cumulative displacement in the descending LOS was estimated to be −164 mm. High velocities away from the sensor in ascending and descending geometries are described as subsidence areas.
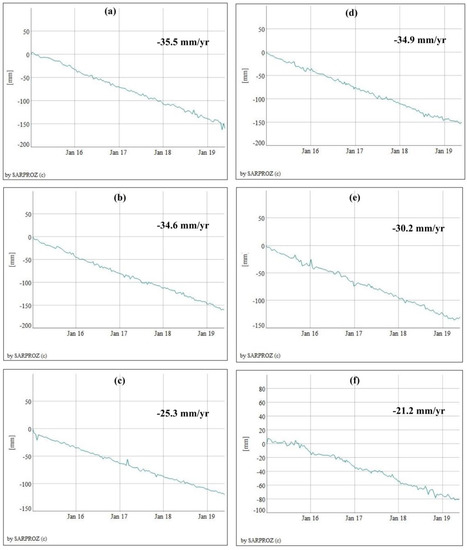
Figure 7.
Time series of selected permanent scatterers (PS) points: (a–c) are presenting displacement in the ascending LOS, (d–f) are showing displacement in the descending orbit LOS).
Figure 7a,d represent subsidence in Former Lake Mareotis with liner deformation away of the sensor in ascending and descending geometries respectively, with a cumulative displacement of −155.6 mm in ascending and −153.2 mm in descending. This velocity average results in an overall displacement away from the ascending orbit of −156 mm during the study period between January 2015 and May 2019; whereas, the cumulative displacement in the descending LOS reached −164 mm during the study period. Figure 7b,c show cumulative displacement time series of two representative points of the former Abu-Qir Lagoon in the ascending geometry, and Figure 7e,f show the other two representative PS points for identical areas in the descending geometry. Linear displacement was observed at the four points with a cumulative displacement of −151.7 mm, −111.1 mm, −132.6 mm, and −93.1 mm at the points shown in Figure 7b,c,e,f respectively. Overall, subsidence was found to be the main surface deformation feature in Alexandria as negative values were observed in high deformation areas, and no remarkable opposite deformation away from one sensor and towards the other sensor.
3.2. Vertical Velocity Map of Alexandria
Figure 8 shows the vertical displacement map decomposed from ascending and descending LOS geometries, Negative values indicate subsidence, and positive values indicate a stable to slight uplift motion. The average of the vertical velocity in the study area is −2.3 mm/yr. The surface of Alexandria is stable in the main city center, but with two small spots of subsidence in the historical sandy tombolo. The highest estimated subsidence value is −31.7 mm/yr; high subsidence areas are distributed mainly in the former Abu Qir Lagoon, the former Mareotis Lake’s dried and reclaimed area, and parts of the northeast Alagami area. Subsidence in Alexandria occurs mostly in the new urbanized areas. Hence, the evolution of Alexandria City was mapped as presented in the sub-data frame of Figure 8 valuate the correlation between urbanization processes and urban subsidence in the city.
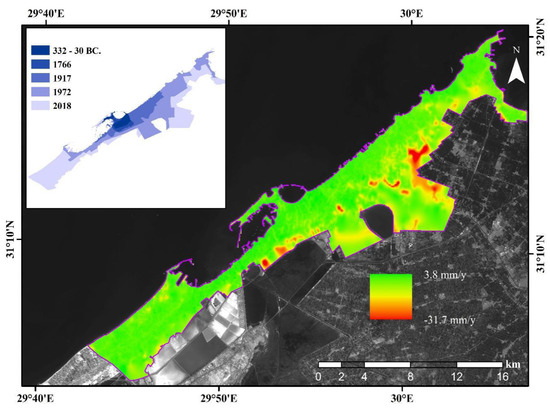
Figure 8.
Vertical displacement in Alexandria presented on the Sentinel-2 gray image of 24 October 2018 blue band, with the city area evolution along the history presented in the sub-data frame.
The insert map in Figure 8 presents the study area of Alexandria city, showing the evolution of the area’s extent from 332 B.C to 2018. The city extent from the era of Alexander the Great until 1917 was mapped according to [30]. The city extents in 1972 and 2018 were extracted from Landsat MSS data captured on 19 September 1972, and an S-2 image acquired on 24 October 2018. City areas that were constructed before 1917 were found to be relatively stable, relative to areas of urban expansion, starting at the beginning of the twentieth century as shown in Figure 9.
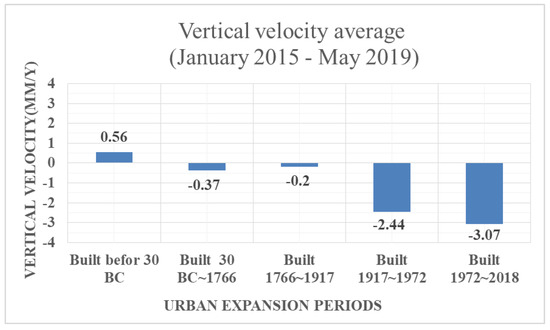
Figure 9.
Average of recent vertical motion based on the city area over history.
The historical part of the city, built between 332~30 BC, has vertical velocity average of 0.56 mm/yr, as compared to −0.37 mm/yr and −0.21 mm/yr in built-up areas constructed between 30 BC~1766, and 1766~1917. Areas built between 1917 and 1972 have a relatively unstable surface with average subsidence of −2.44 mm/yr. The subsidence average increased in newly urbanized areas after 1972 to −3.07 mm/yr.
3.3. Interpretation of Subsidence Causality Factors
To model complex subsidence causality, each subsidence factor is studied individually, and spatially correlated to the vertical velocity. This section summarizes the spatial correlation results of those factors and vertical velocities. Based on these correlations, the average vertical velocity is used as a reference to weight potential subsidence causality classes when modelling the spatial complexity of it in the City.
3.3.1. Rock Type
The type of rocks is found to have an influence on Alexandria’s surface deformation due to the city location on the North Western margin of the Nile Delta. Table 2 presents the highest, lowest, mean, and standard deviation values of deformation based on each lithological type. Artificial reclaimed surfaces on the Mediterranean Cost, carbonate ridges, and gravel in the west show stable surfaces compared to other city parts. Hence, those types of rock was assigned the lowest weight among other rock types combined with reclaimed sand with an average annual vertical velocity of −0.29 mm. Stabilized sand dunes (−0.46 mm/yr), and oolitic beach and beach ridge (−0.69 mm/yr), were given a slightly higher weights of 7 and 8 respectively, given their relative low annual subsidence average.
Table 2.
Deformation characteristics of each lithological type in Alexandria.
Sabkha deposits in the South Western part of Alexandria had the highest mean subsidence among all lithological types with a mean subsidence of −3.51 mm/yr. This high subsidence average value resulted in a high weight for Sabkha deposits of 35. The Nile silt in the eastern and central parts of the city has the second subsidence average with value of −3.09 mm/yr. Therefore, a relatively lower weight of 30 was given to this lithological type in contrast to the sabkha deposit.
3.3.2. Former Lakes and Lagoon Dewatering
In this study area, there are three dried and reclaimed areas from former lakes and lagoon. These include the former Alharda Lake, a part of the former Mareotis Lake in the South Western section of the study area, and a part of former Abu-Qir Lagoon in southeast Alexandria. Table 3 shows the minimum, maximum, mean, and standard deviation values of each of the former lakes and lagoons (FLL) in Alexandria, as well as these values for the overall area dried or reclaimed from former lakes and lagoons, alongside the same values for non-FLL areas in the study area. In contrast to other parts of the city, dried and reclaimed areas from FLL have a high average subsidence, about −4.69 mm/yr, as compared to −0.53 mm/yr in non-FLL areas as revealed in Table 3.
Table 3.
Deformation in former lakes and lagoons dewatering (FLLD) areas of Alexandria.
The dried and reclaimed areas from Abu-Qir Lagoon in the southeast of the study area have the highest average subsidence when compared to other dried and reclaimed FLL areas, about −6.7 mm/yr. Based on this average; those areas were given the highest weight, 45. These were followed by the dried and reclaimed areas of the former Lake Mareotis, with mean subsidence of −3.5 mm/yr, and a weight of 30. The remaining dried and reclaimed areas of the former Lake Alhadra showed the lowest annual average subsidence among dried and reclaimed FLL areas, −2.45 mm/yr, with a weight of 45. Areas with no dried or reclaimed FLL were given a weight of 5.
3.3.3. Building Load Impact
However, the highest subsidence value is located in a high building load area as shown in Table 4. The average of the estimated building load has a negative correlation to the vertical velocity as shown in Figure 10. Areas with no building in the study area have the highest annual average subsidence of −2.99 mm/yr. Mean subsidence gradually decreased to −2.62 mm/yr, and −1.8 mm/yr, for low and moderate building densities, respectively. A slight increase in average subsidence by about −1.86 mm/yr was detected. The mean subsidence values support our finding discussed in Section 3.2 that newly urbanized areas have the highest deformation.
Table 4.
Deformation in FLLD areas of Alexandria.
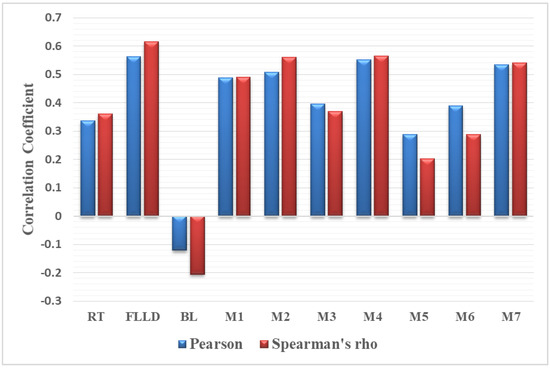
Figure 10.
Correlation coefficient values of rock type (RT), former lakes and lagoon (FLLD), building load (BL), and calculated models that described in Table 1.
We assumed that the BL weighting based on mean subsidence would not support BL weighting in Alexandria as most of the subsidence occurs in an area with high building loads. Hence, an exception was made in this study area, the weights were ascending, based on literature that correlates building density to surface subsidence in urban areas as shown in Table 4. Weights of 40, 30, 20, and 10 were given to BL classes of high, moderate, low, and no building loads on the surface, respectively.
3.4. Complexity of Subsidence Causality in Alexandria
Figure 10 illustrates the correlation coefficients for the seven models, as well as coefficients for the three potential subsidence causality factors presented in this study. The three potential causes and seven models were correlated to subsidence in the city, at the 0.01 level of significance. All showed positive correlation except the BL, which showed a negative correlation to subsidence with a Pearson’s correlation coefficient of −0.121, and a Spearman’s rho of −0.205. For the two other individual causal factors of subsidence, FLLD had the highest positive correlation with subsidence in Alexandria, with a Pearson’s correlation coefficient of 0.563 and a Spearman’s rho of 0.616. The correlation coefficients for rock type show a positive correlation to subsidence with relatively lower correlation in comparison to FLLD, with a Pearson’s correlation coefficient of 0.337, and a Spearman’s rho of 0.361.
Among all the processed models, the models with the highest BL rank, M5 (L*2+F*1+B*3), and M6 (L*1+F*2+B*3) show the lowest correlation coefficients. Additionally, low correlation coefficients were observed for models with low FLLD ranks, M5(L*2+F*1+B*3), and M3 (L*3+F*1+B*2). The models M1 (L*1+F*1+B*1), M2 (L*3+F*2+B*1), M4 (L*2+F*3+B*2), and M7 (L*2+F*3+B*1), had higher vertical deformation correlation coefficient values. We selected M4 (L*2+F*3+B*1), to model the final CSC for Alexandria, because M4 had highest correlation to subsidence, the Pearson’s correlation coefficient was 0.552 in and Spearman’s rho was 0.566 in.
Linear regression analysis was used to correlate the model results to average vertical deformation of the city to ensure the accuracy of M4 when mapping the CSC, as shown in Figure 11, a high R2 value of 0.88. confirms the applicability of this model when mapping the final CSC in Alexandria.
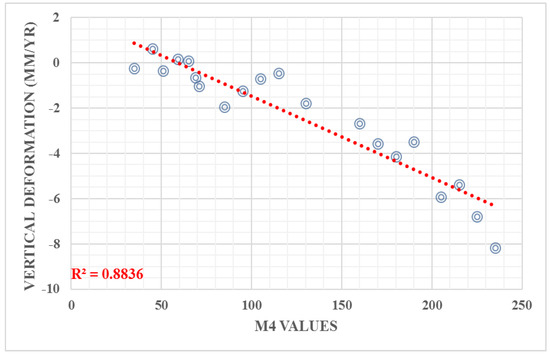
Figure 11.
Liner regression of M4 result compared to relative average PS-InSAR deformation. Vertical axis shows deformation in millimeters per year, and horizontal axis shows M4 result.
We considered areas as stable if they did not exceed two millimeters of subsidence per year. All pixels with velocity of less than −2 mm/yr represent areas with different degrees of subsidence, as shown in the small-data-frame of Figure 12. Subsidence areas were mainly distributed in the southern newly urbanized areas of the city, dried or reclaimed from former lakes and lagoons. Only subsidence areas with velocity less than −2 mm/yr were extracted from the M4 result. This was classified to tertiles by singular, dual, and complex causes of subsidence, illustrated in Figure 12.
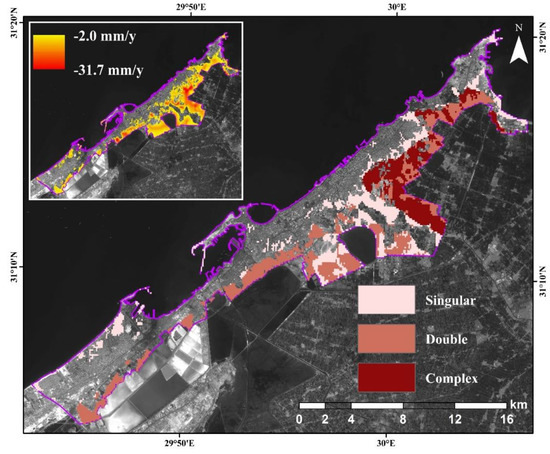
Figure 12.
Complex subsidence causality map of Alexandria presented on the Sentinel-2 gray image of 24 October 2018 blue band; the insert map shows corresponding annual subsidence velocity during the study period.
Singular reasons for subsidence are found in parts of the northwest (Alagami), newly reclaimed areas in the northeast of palaeo-island of Farous, the sandy tombolo of the old city, some parts of stabilized sand dunes in the eastern part of the city, and newly reclaimed areas in the far eastern side of Abu-Qir area. These all correspond with the rock type as discussed in Section 3.3.1.
Dual subsidence factors are present in the south of the city as the rock type interacts with the Nile silt and Sabkha deposits in dewatered FLL areas. An interaction between the three causal factors of subsidence mainly appear in the newly urbanized southeastern areas of the city that have newly dense building loads resting on Nile Silt soil and dewatered former lagoons. Additionally, the highest surface subsidence was spatially related to the complex casualty areas as shown in the small data frame of Figure 12.
4. Discussion
4.1. Quality of PS-InSAR Measurements
PS-InSAR results are relative to the reference point; hence, the absolute surface deformation is uncertain, as we were unable to obtain a record of the stable GPS station of the Centre d’Etudes Alexandrines during our study period. A previous PS-InSAR study conducted in Alexandria used GPS station data to validate its results in the period between 2003 and 2010 [17]. That study applied the PS-InSAR technique over the city center of Alexandria and validated the PS-InSAR results based on the vertical velocity of a continuous GPS station at the Centre d’Etudes Alexandrines; in this study, the vertical velocity was estimated to be 0.05 ± 0.29 mm/yr with respect to the global international terrestrial reference frame. Their validation results indicated a mean ground motion of −0.39 mm/y in their study area. We in turn used this mean deformation value to validate our results. We found that the average vertical deformation of the same study area was −1.4 mm/yr. Therefore, we adopted a potential error range of ±1~2 mm in our study vertical displacement results.
4.2. Sentinel-1 PS Density in Alexandria
The overall density of the PS-InSAR points in the images from the ascending orbit was 191 points per square kilometer within the Alexandria study area, increasing to 345 points/km2 in the denser parts of the city. In images from the descending orbit, the point density was 184 points/km2 within the study area increasing up to 319 points/km2 in denser built-up areas in comparison to the few attempts in the literature to use the PS-InSAR technique in Alexandria [8,17], this density of extracted PS-INSAR points in our study is significantly higher than any previous study. Only 14 points per square kilometer were obtained in [8], by utilizing 40 Advanced Synthetic Aperture Radar (ASAR) images between 2003–2010. In addition, our findings in results of vertical motion decomposition is considered much precise than the estimated surface deformation in the descending line-of-sight concluded in previous PS-InSAR studies in Alexandria [8,17]. Because, InSAR measurements from one particular imaging geometry (ascending or descending), needs to be interpreted with caution, as vertical motion, horizontal displacement, and tilt can introduce large errors in the final deformation results.
4.3. Subsidence Markers in Alexandria
Different levels of subsidence in various locations in the study area left visual marks on the city surface, since a field investigation confirmed the empirical results presented in this study. Figure 13 shows samples of visual cracks on buildings and roads captured at sites of subsidence as identified in our vertical displacement results. Different subsidence degrees can be easily inferred from road cracks shown in pictures shown in Figure 13b,c,h as subsidence varied between −3~−4 mm/yr in the first area and −10~−23 mm/yr in the other two areas. Moreover, the severity of subsidence in Alexandria is also evident in Figure 13d showing the tilt of a high building, marked by the purple arrow. Visible cracks appear on many buildings in subsidence areas as shown in Figure 13a,f,g,i.
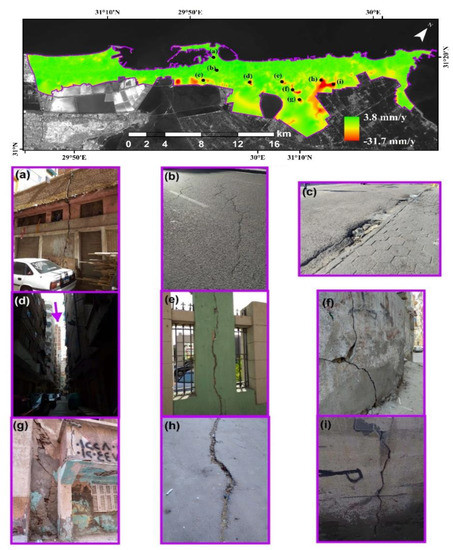
Figure 13.
Samples of cracks on buildings and roads in high subsidence areas of Alexandria: The subsidence map shows locations of sub-figures; Figures (a,e,f,g) represent building and fences cracks, Figures (b,c,h) illustrate roads cracks, and (d) shows an example of high building tilts in subsidence areas.
4.4. Subsidence Causes Interaction
This study was designed to interpret the complexity of subsidence causalities spatially based on spatial and statistical correlations. The conclusion of Seleem et al. [8] about the integration between geology, topography, and urban expansion in Alexandria was descriptive, without any spatial distribution or statistical correlation; the results of our study however, confirmed the existence of such interaction in subsidence causality in Alexandria City. of the findings of our study was also confirmed by a comparison with results reported in the literature [19,20,22,32,33].
Subsidence due to the Quaternary water-saturated substrate in the southeast of the city was reported in [22], which supports the outcome of our study regarding the role of FLLD in this area of the city. In addition, geological field measurements in the literature [20,33], confirm our findings, as their results showed subsidence in the southwestern part of the city due to surface dewatering in the area. Additionally, human activities in the western margin of the Nile Delta under the pressure of population increase and urbanization development [19,32] (East of Alexandria) increased the subsidence ratio by increasing build-up in vulnerable areas.
5. Conclusions
In this study, we presented a new model to interpret the interaction of different subsidence causes in cities and map their complexity within a study area. Alexandria was selected as a test site for this model. Three different causes of subsidence were examined: rock type, former lakes and lagoons (FLLD), and building load (BL). Ranks are given to the different types of causes based on their corresponding subsidence average, a combination of the three causes were modeled in different weights to select the best-fitting model.
FLLD were found to be more correlated to subsidence followed by rock type. Meanwhile, BL was found to have a negative correlation to subsidence in the city. The highest correlated model to subsidence has a high FLLD rank, a moderate rock type rank, and a low BL rank. This model showed a high linear regression to subsidence average with R2 of 0.88.
The method presented here is applicable to any urban area. It is flexible as changes can be made to the type of subsidence causality factors and their number depending on the specific history and attributes of an urban area. Removing irrelevant subsidence causes or adding new ones are expected to work effectively in this model. The limitation of this model, however, is that it could only explain the complex causality of subsidence and its spatial distribution, but it cannot tell us why subsidence occurred in those areas and not in others with same spatial characteristics.
Author Contributions
Conceptualization, B.M. and T.B.; Funding acquisition, T.B.; Investigation, A.Y.; Methodology, B.M.; Resources, A.Y.; Supervision, T.B.; Validation, B.M. and A.Y.; Writing—original draft, B.M.; Writing—review and editing, T.B.
Funding
This work was supported by the Natural Science Foundation of China under the Grant 61331016.
Acknowledgments
The authors would like to thank Daniele Perissin for providing the SarProZ software to support this research.
Conflicts of Interest
The authors declare no conflict of interest.
References
- Zhang, Y.; Liu, Y.; Jin, M.; Jing, Y.; Liu, Y.; Liu, Y.; Sun, W.; Wei, J.; Chen, Y. Monitoring Land Subsidence in Wuhan City (China) using the SBAS-InSAR Method with Radarsat-2 Imagery Data. Sensors 2019, 19, 743. [Google Scholar] [CrossRef] [PubMed]
- Delgado Blasco, J.M.; Foumelis, M.; Stewart, C.; Hooper, A. Measuring Urban Subsidence in the Rome Metropolitan Area (Italy) with Sentinel-1 SNAP-StaMPS Persistent Scatterer Interferometry. Remote Sens. 2019, 11, 129. [Google Scholar] [CrossRef]
- Chen, G.; Zhang, Y.; Zeng, R.; Yang, Z.; Chen, X.; Zhao, F.; Meng, X. Detection of Land Subsidence Associated with Land Creation and Rapid Urbanization in the Chinese Loess Plateau Using Time Series InSAR: A Case Study of Lanzhou New District. Remote Sens. 2018, 10, 270. [Google Scholar] [CrossRef]
- Stanley, J.D.; Clemente, P.L. Clay distributions, grain sizes, sediment thicknesses, and compaction rates to interpret subsidence in Egypt’s northern Nile Delta. J. Coast. Res. 2014, 293, 88–101. [Google Scholar]
- Cavalié, O.; Sladen, A.; Kelner, M. Detailed quantification of delta subsidence, compaction and interaction with man-made structures: The case of the NCA airport, France. Nat. Hazards Earth Syst. Sci. 2015, 15, 1973–1984. [Google Scholar]
- Yang, Q.; Ke, Y.; Zhang, D.; Chen, B.; Gong, H.; Lv, M.; Zhu, L.; Li, X. Multi-Scale Analysis of the Relationship between Land Subsidence and Buildings: A Case Study in an Eastern Beijing Urban Area Using the PS-InSAR Technique. Remote Sens. 2018, 10, 1006. [Google Scholar] [CrossRef]
- Stanley, J.D. Growth faults, a distinct carbonate-siliciclastic interface and recent coastal evolution, NW Nile Delta, Egypt. J. Coast. Res. 2005, 21, 309–318. [Google Scholar]
- Seleem, T.A.; Stergiopoulos, V.; Kourkouli, P.; Perrou, T.; Parcharidis, I. Correlation between land cover and ground vulnerability in Alexandria City (Egypt) using time series SAR interferometry and optical Earth observation data. In Proceedings of the Society of Photo-Optical Instrumentation Engineers (SPIE) Remote Seising, Warsaw, Poland, 3 October 2017. [Google Scholar]
- Malinowska, A.; Hejmanowski, R. Building damage risk assessment on mining terrains in Poland with GIS application. Int J. Rock Mech. Min. Sci. 2010, 47, 238–245. [Google Scholar] [CrossRef]
- Chaussard, E.; Wdowinski, S.; Cabral-Cano, E.; Amelung, F. Land subsidence in central Mexico detected by ALOS InSAR time-series. Remote Sens. Environ. 2014, 140, 94–106. [Google Scholar] [CrossRef]
- Galloway, D.L.; Sneed, M. Analysis and simulation of regional subsidence accompanying groundwater abstraction and compaction of susceptible aquifer systems in the USA. Boletín de la Sociedad Geológica Mexicana 2013, 65, 123–136. [Google Scholar] [CrossRef]
- Osmanoğlu, B.; Dixon, T.H.; Wdowinski, S.; Cabral-Cano, E.; Jiang, Y. Mexico City subsidence observed with persistent scatterer InSAR. Int. J. Appl. Earth Obs. Geoinf. 2011, 13, 1–12. [Google Scholar]
- Cui, Z.D.; Yang, J.Q.; Yuan, L. Land subsidence caused by the interaction of high-rise buildings in soft soil areas. Nat. Hazards 2015, 79, 1199–1217. [Google Scholar] [CrossRef]
- Bozzano, F.; Esposito, C.; Mazzanti, P.; Patti, M.; Scancella, S. Imaging Multi-Age Construction Settlement Behaviour by Advanced SAR Interferometry. Remote Sens. 2018, 10, 1137. [Google Scholar] [CrossRef]
- Ferretti, A. Permanent scatterers in SAR interferometry. IEEE Trans. Geosci. Remote Sens. 2001, 39. [Google Scholar] [CrossRef]
- Nolesini, T.; Frodella, W.; Bianchini, S.; Casagli, N. Detecting Slope and Urban Potential Unstable Areas by Means of Multi-Platform Remote Sensing Techniques: The Volterra (Italy) Case Study. Remote Sens. 2016, 8, 746. [Google Scholar] [CrossRef]
- Wöppelmann, G.; Le Cozannet, G.; De Michele, M.; Raucoules, D.; Cazenave, A.; Garcin, M.; Hanson, S.; Marcos, M. Is land subsidence increasing the exposure to sea level rise in Alexandria, Egypt? Geophys. Res. Lett. 2013, 40, 2953–2957. [Google Scholar] [CrossRef]
- Copernicus. Sentinel-1 2016–2017 data processed by ESA. 2018. [Google Scholar]
- Stanley, J.D.; Jorstad, T.F.; Goddio, F. Human impact on sediment mass movement and submergence of ancient sites in the two harbours of Alexandria, Egypt. Nor. J. Geol. 2006, 86, 337–350. [Google Scholar]
- Warne, A.G.; Stanley, D.J. Late Quaternary Evolution of the Northwest Nile Delta and Adjacent Coast in the Alexandria Region, Egypt. J. Coast. Res. 1993, 9, 26–64. [Google Scholar]
- Torres, R.; Snoeij, P.; Geudtner, D.; Bibby, D.; Davidson, M.; Attema, E.; Potin, P.; Rommen, P.; Floury, N.; Brown, M.; et al. Gmes sentinel-1 mission. Remote Sens. Environ. 2012, 120, 9–24. [Google Scholar] [CrossRef]
- Yague-Martinez, N.; Prats-Iraola, P.; Rodriguez Gonzalez, F.; Brcic, R.; Shau, R.; Geudtner, D.; Eineder, M.; Bamler, R. Interferometric processing of sentinel-1 tops data. IEEE Trans. Geosci. Remote Sens. 2016, 54, 2220–2234. [Google Scholar] [CrossRef]
- Perissin, D.; Wang, Z.Y.; Wang, T. The SarProZ InSAR tool for urban subsidence/manmade structure stability monitoring in China. In Proceedings of the ISRSE, Sydney Australia, 10–15 April 2011. [Google Scholar]
- Gudmundsson, S.; Sigmundsson, F.; Carstensen, J. Three-dimensional surface motion maps estimated from combined interferometric synthetic aperture Radar and GPS data. J. Geophys. Res. 2002, 107, 2250–2264. [Google Scholar] [CrossRef]
- Spata, A.; Guglielmino, F.; Nunnari, G.; Puglisi, G. SISTEM: A new approach to obtain three-dimensional displacement maps by integrating GPS and DInSAR data. In Proceedings of the Fringe Workshop, Frascati, Italy, 30 November–4 December 2009. [Google Scholar]
- Pepe, A. Advanced Differential Interferometric SAR Techniques, the Extended Minimum Cost Flow Phase Unwrapping (EMCF) Technique. Saarbrucken; VDM Verlang: Saarbrücken, Germany, 2009. [Google Scholar]
- Fuhrmann, T.; Garthwaite, M.C. Resolving Three-Dimensional Surface Motion with InSAR: Constraints from Multi-Geometry Data Fusion. Remote Sens. 2019, 11, 241. [Google Scholar] [CrossRef]
- Thienenvisser, K.V.; Muntendambos, A.G.; Samieiesfahany, S.; Hansen, R.F. On the effect of horizontal deformation on insar subsidence estimates. In Proceedings of the Fringe 2009 Workshop, Frascati, Italy, 30 November–4 December 2009. [Google Scholar]
- Pepe, A.; Calò, F. A Review of Interferometric Synthetic Aperture RADAR (InSAR) Multi-Track Approaches for the Retrieval of Earth’s Surface Displacements. Appl. Sci. 2017, 7, 1264. [Google Scholar] [CrossRef]
- Abdel-Salam, H. The historical evolution and present morphology of Alexandria, Egypt. Plan. Perspect. 1995, 10, 173–198. [Google Scholar] [CrossRef]
- Hanson, S.; Nicholls, R.; Ranger, N.; Hallegatte, S.; Corfee-Morlot, J.; Herweijer, C. A global ranking of port cities with high exposure to climate extremes. Clim. Chang. 2011, 104, 89–111. [Google Scholar] [CrossRef]
- Stanley, J.D.; Toscano, M.A. Ancient archaeological sites buried and submerged along Egypt’s Nile delta coast: Gauges of Holocene delta margin subsidence. J. Coast. Res. 2009, 25, 158–170. [Google Scholar] [CrossRef]
- Frihy, O.E. The Nile delta-Alexandria coast: Vulnerability to sea-level rise, consequences and adaptation. Mitig. Adapt. Strateg. Glob. Chang. 2003, 8, 115–138. [Google Scholar] [CrossRef]
© 2019 by the authors. Licensee MDPI, Basel, Switzerland. This article is an open access article distributed under the terms and conditions of the Creative Commons Attribution (CC BY) license (http://creativecommons.org/licenses/by/4.0/).