Article

Forest Damage Assessment Using Deep Learning on High Resolution Remote Sensing Data

by
Zayd Mahmoud Hamdi
1,2,
Melanie Brandmeier
1,* and
Christoph Straub
3
1
Department Science and Education, Esri Deutschland, Ringstr. 7, 85402 Kranzberg, Germany
2
Technical University of Munich, 21 Arcisstraße, 8033 Munich, Germany
3
Department of Information Technology, Bavarian State Institute of Forestry, Hans Carl-von-Carlowitz-Platz 1, 85354 Freising, Germany
*
Author to whom correspondence should be addressed.
Remote Sens. 2019, 11(17), 1976; https://doi.org/10.3390/rs11171976
Submission received: 16 July 2019 / Revised: 5 August 2019 / Accepted: 19 August 2019 / Published: 22 August 2019
(This article belongs to the Special Issue Remote Sensing: 10th Anniversary)

Abstract

:
Storms can cause significant damage to forest areas, affecting biodiversity and infrastructure and leading to economic loss. Thus, rapid detection and mapping of windthrows are crucially important for forest management. Recent advances in computer vision have led to highly-accurate image classification algorithms such as Convolutional Neural Network (CNN) architectures. In this study, we tested and implemented an algorithm based on CNNs in an ArcGIS environment for automatic detection and mapping of damaged areas. The algorithm was trained and tested on a forest area in Bavaria, Germany. . It is a based on a modified U-Net architecture that was optimized for the pixelwise classification of multispectral aerial remote sensing data. The neural network was trained on labeled damaged areas from after-storm aerial orthophotos of a ca. 109 k m 2 forest area with RGB and NIR bands and 0.2-m spatial resolution. Around 10 7 pixels of labeled data were used in the process. Once the network is trained, predictions on further datasets can be computed within seconds, depending on the size of the input raster and the computational power used. The overall accuracy on our test dataset was 92 % . During visual validation, labeling errors were found in the reference data that somewhat biased the results because the algorithm in some instance performed better than the human labeling procedure, while missing areas affected by shadows. Our results are very good in terms of precision, and the methods introduced in this paper have several additional advantages compared to traditional methods: CNNs automatically detect high- and low-level features in the data, leading to high classification accuracies, while only one after-storm image is needed in comparison to two images for approaches based on change detection. Furthermore, flight parameters do not affect the results in the same way as for approaches that require DSMs and DTMs as the classification is only based on the image data themselves, and errors occurring in the computation of DSMs and DTMs do not affect the results with respect to the z component. The integration into the ArcGIS Platform allows a streamlined workflow for forest management, as the results can be accessed by mobile devices in the field to allow for high-accuracy ground-truthing and additional mapping that can be synchronized back into the database. Our results and the provided automatic workflow highlight the potential of deep learning on high-resolution imagery and GIS for fast and efficient post-disaster damage assessment as a first step of disaster management.

Graphical Abstract

1. Introduction

One consequence of climate change is an increase in natural disasters such as storms, which can cause significant damage in forest areas. Windthrow caused by storms results in loss of timber and therefore economic loss, but also affects the forest ecosystem [1]. For example, in August 2017, the storm “Kolle” in Bavaria caused ca. 2.3 million m 3 of damaged timber volume [2]. In the future, more damage by storms is expected due to Climate Change [3], but also due to forest management activities in the past that resulted in a changing ratio of autochthonous to non-autochthonous species compositions [4,5] such as a shift from deciduous trees to more unstable conifers [6], for many regions in Europe. After a large-scale storm event, reliable information on the location and size of the affected forest stands is required for an efficient and timely harvest of the damaged trees. This is especially important to reduce the risk of subsequent biotic damages, (e.g. damaged spruce trees can be breeding material for the European spruce bark beetle Ips typographus (L.) [7]). Traditional methods of forest damage assessment include ground surveys using global navigation satellite systems (GNSS) [8] and remote sensing. Remote sensing methods are especially suited for early-stage detection and estimates when accessibility for ground-surveys is still not possible, as the area needs to be cleared to provide access and security [5]. Remote sensing analysis depends on the scale and accuracy needed, as well as the weather conditions: Landsat and Sentinel 2 data are freely available, but only provide a medium spatial resolution (decameters). Landsat was widely used in forestry, but only has a low temporal resolution, while Sentinel-2 has a five-day revisit time in ideal cases and was, for example, successfully used for forest type and tree species mapping (e.g., [9,10]). In addition to these passive sensing methods, airborne laser scanning (ALS) and radar images are widely used in forestry because they provide accurate information about canopy height and structure and the underlying terrain ([11]). Many studies related to forestry also use quantitative statistical method (e.g., [12]) and indices such as the leaf area index [13] to assess change in the forest phenology and structure. Most methods related to storm damage assessment in forests are based on change detection. One option is to analyze changes in the spectral and textural characteristics of optical remote sensing data (e.g., [7,14,15]). Another approach is to evaluate changes in elevation models. In this context, Honkavaara [16] compared an after-storm digital surface model derived from aerial photographs with a surface model obtained from ALS, and the work in [17] developed a workflow that is purely based on photogrammetric canopy height models. All these methods require two datasets: a pre- and a post-storm image, which is either costly (flight campaigns) or sometimes not available depending on atmospheric conditions and revisit times (Landsat, Sentinel-2). We introduce a novel approach that is only based on one after-storm image and uses algorithms from computer vision: deep convolutional neural networks (CNNs). CNNs were for the first time successfully applied by LeCun et al. (1998) [18] to recognize handwritten digits (LeNet convolutional neural network [18]) and have rapidly developed during the past decade. They have been used successfully in other fields of research such as medical image classification (e.g., [19]), object detection (e.g., [20]), land cover classification (e.g., [21,22]), and many more. In remote sensing related to forestry, the use of deep learning is a promising field of research. To our knowledge, there exist just a few publications on the automatic detection and classification of trees [23,24] based on a U-net architecture [19] and to map forest types and disturbance in the Atlantic rainforest [25]. In addition, there is a conference paper on forest species recognition based on CNNs [26], but in general, there is still a knowledge gap between computer science and remote sensing in general where deep learning is widely used and in other fields of research such as forestry. Thus, the approach in this paper further evaluates the potential of CNNs in applied forestry and has the potential of completely automatizing the task of forest damage assessment.

2. Materials and Methods

2.1. Data

Our study area is located in Bavaria, Germany, within the districts Passau and Freyung-Grafenau. After the storm Kolle on 18th of August 2017, the Bavarian State Institute of Forestry (Landesanstalt für Wald und Forstwirtschaft (LWF)) commissioned an aerial survey to obtain a detailed overview of the damaged forest areas. This flight campaign was finished on 30 August 2017. Aerial photographs were acquired with four spectral bands (blue, green, red, near infrared) and 20-cm spatial resolution using a digital mapping camera (DMC), which is a digital aerial survey camera system manufactured by Leica Geosystems Technologies. To produce stereo images, a forward overlap of 80 % and a side overlap of 50 % were defined. Orthophotos were computed using an already existing ALS-DTM of the Bavarian Surveying Administration for orthorectification. Based on this image data, the damaged forest areas were delineated manually at the LWF by aerial photo interpretation using the photogrammetric software Summit Evolution in combination with ArcGIS. The resulting polygons served as training and validation data for this study. We selected 12 labeled orthophotos with four spectral bands. Each orthophoto had a size of 10,000 × 10,000 pixels and contained both damaged and non-damaged forest zones, as well as other objects like buildings, roads, or meadows. Figure 1 shows an example of one 10 , 000 × 10 , 000 pixel orthophoto and the respective labeling polygons.

2.2. Data Preprocessing

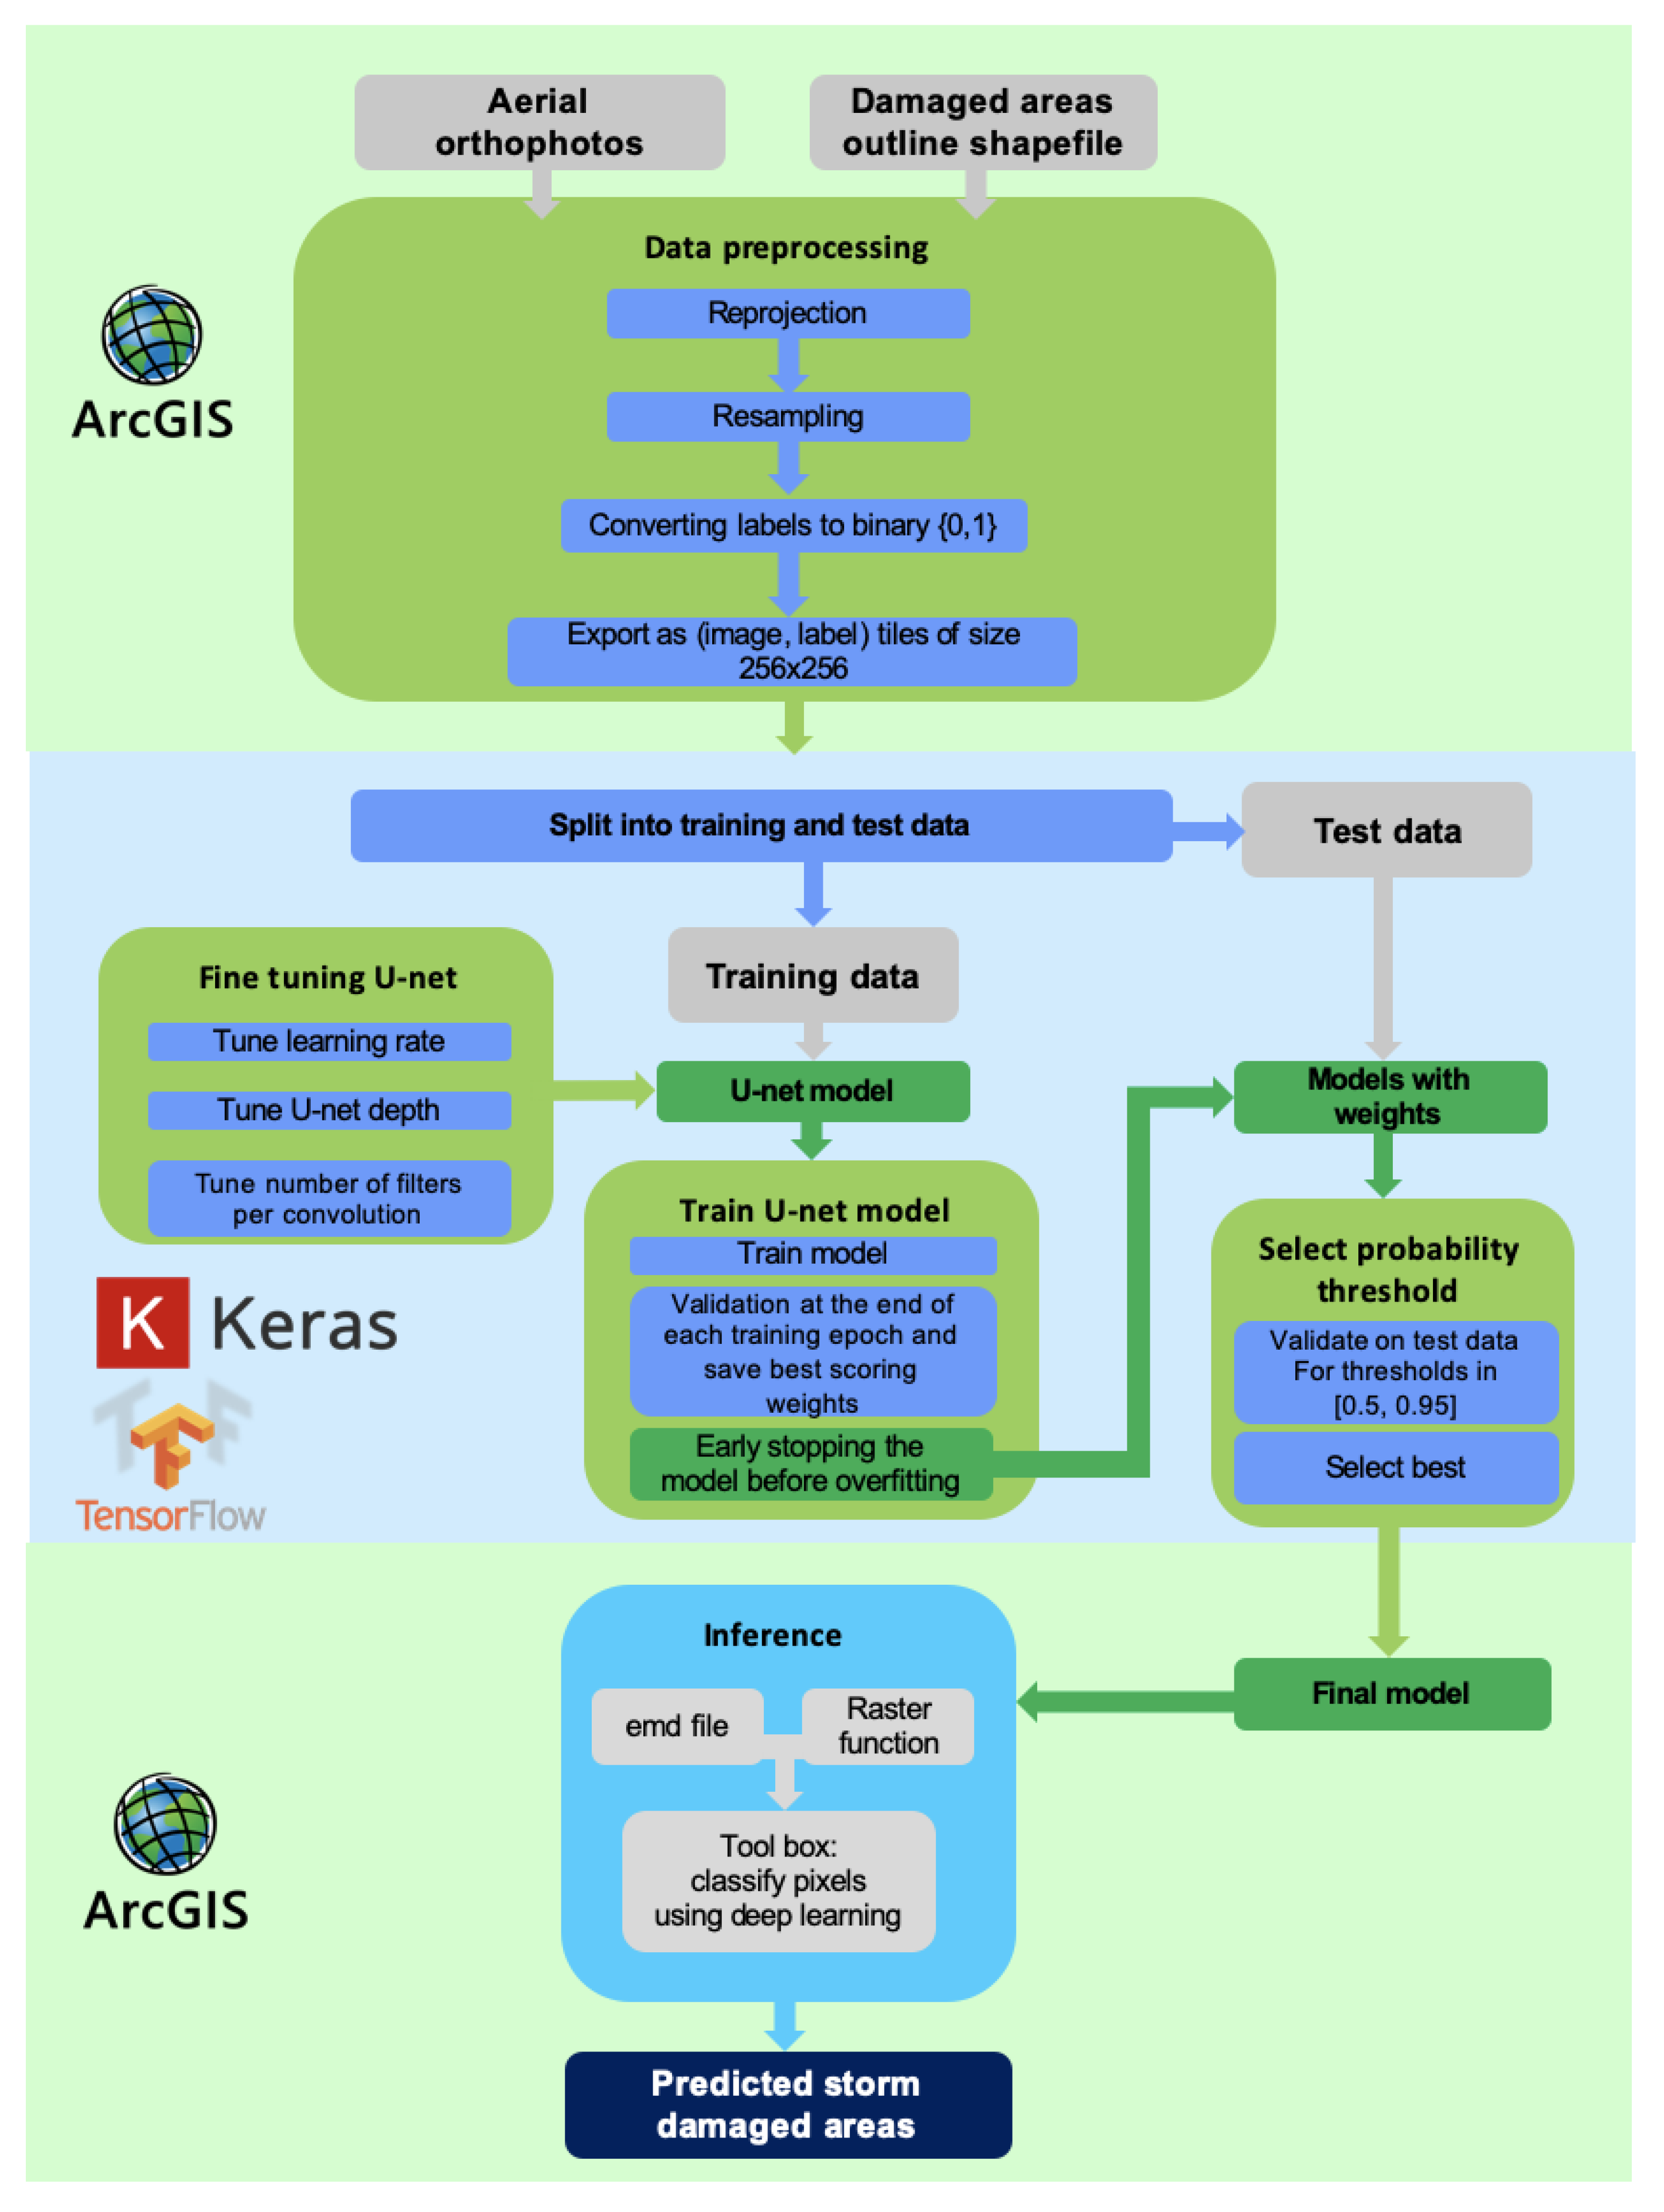
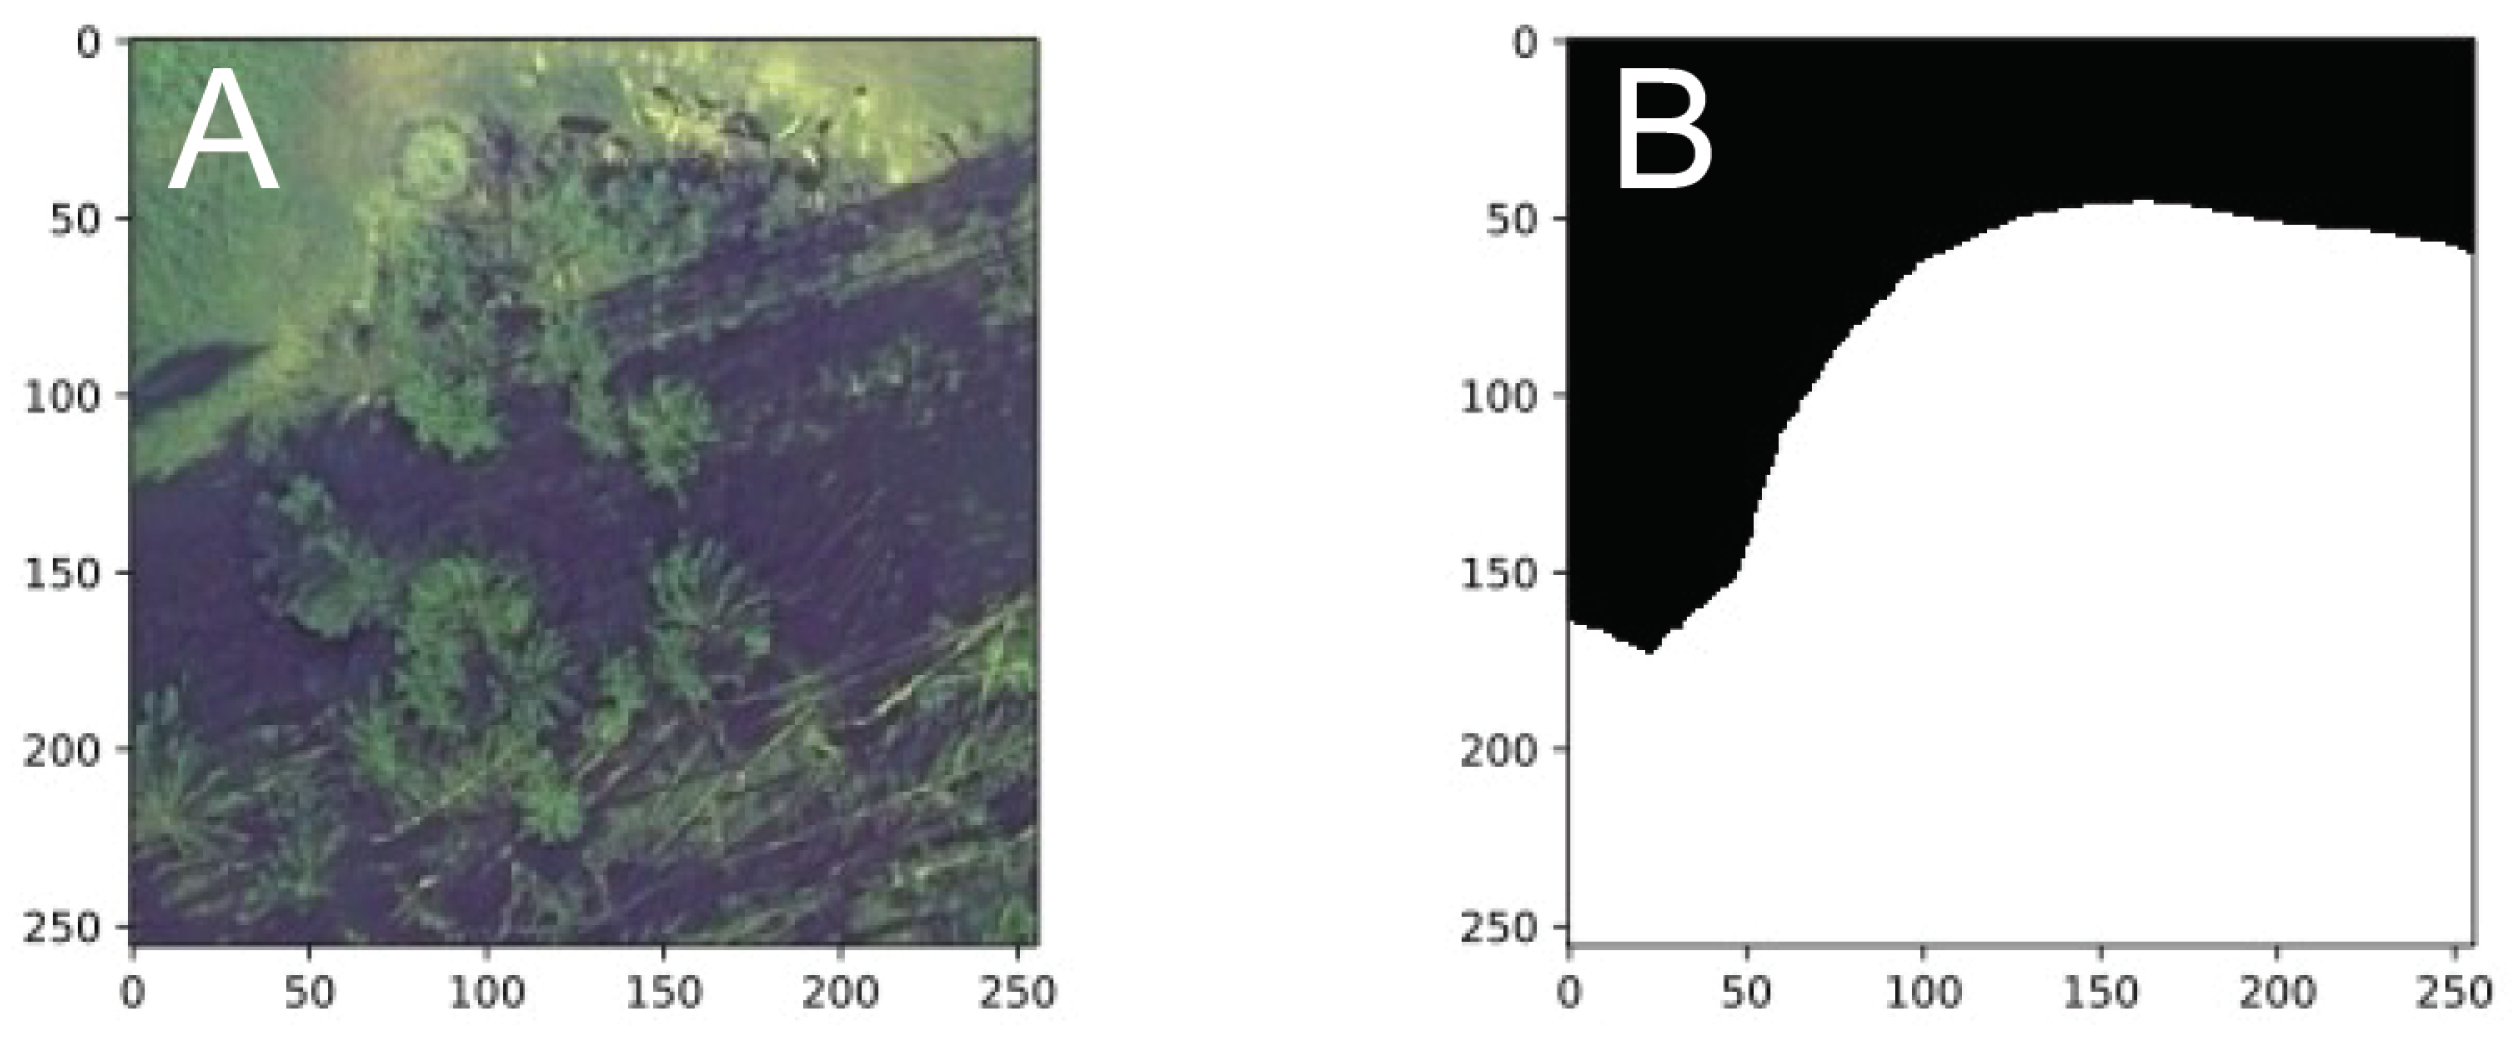
The overall workflow of preprocessing, network design, and prediction are shown in Figure 2. Due to the size of the orthophotos and due to memory limitations when doing computations, it is intuitive to process the orthophotos into relatively small labeled tiles (or rather small image cubes) and feed them into the CNN. Each orthophoto of size 10,000 × 10,000 pixels was divided into 1525 tiles of 256 × 256 pixels. The data (orthophoto and corresponding labels) were then split into three datasets: training ( 80 % ) , validation ( 20 % ) , and test (two full images of 10,000 × 10,000 pixels). The training data were used for optimizing the neural network, while the validation dataset was used to assess the performance during the training process. The test dataset was used to assess the performance of the final optimized neural network. The training and validation images were read into arrays with the shape ( 256 , 256 , 4 ) . Labels were read as an array of shape ( 256 , 256 , 1 ) with the values 1 or 0 indicating damaged or non-damaged (Figure 3).

2.3. CNN Architecture

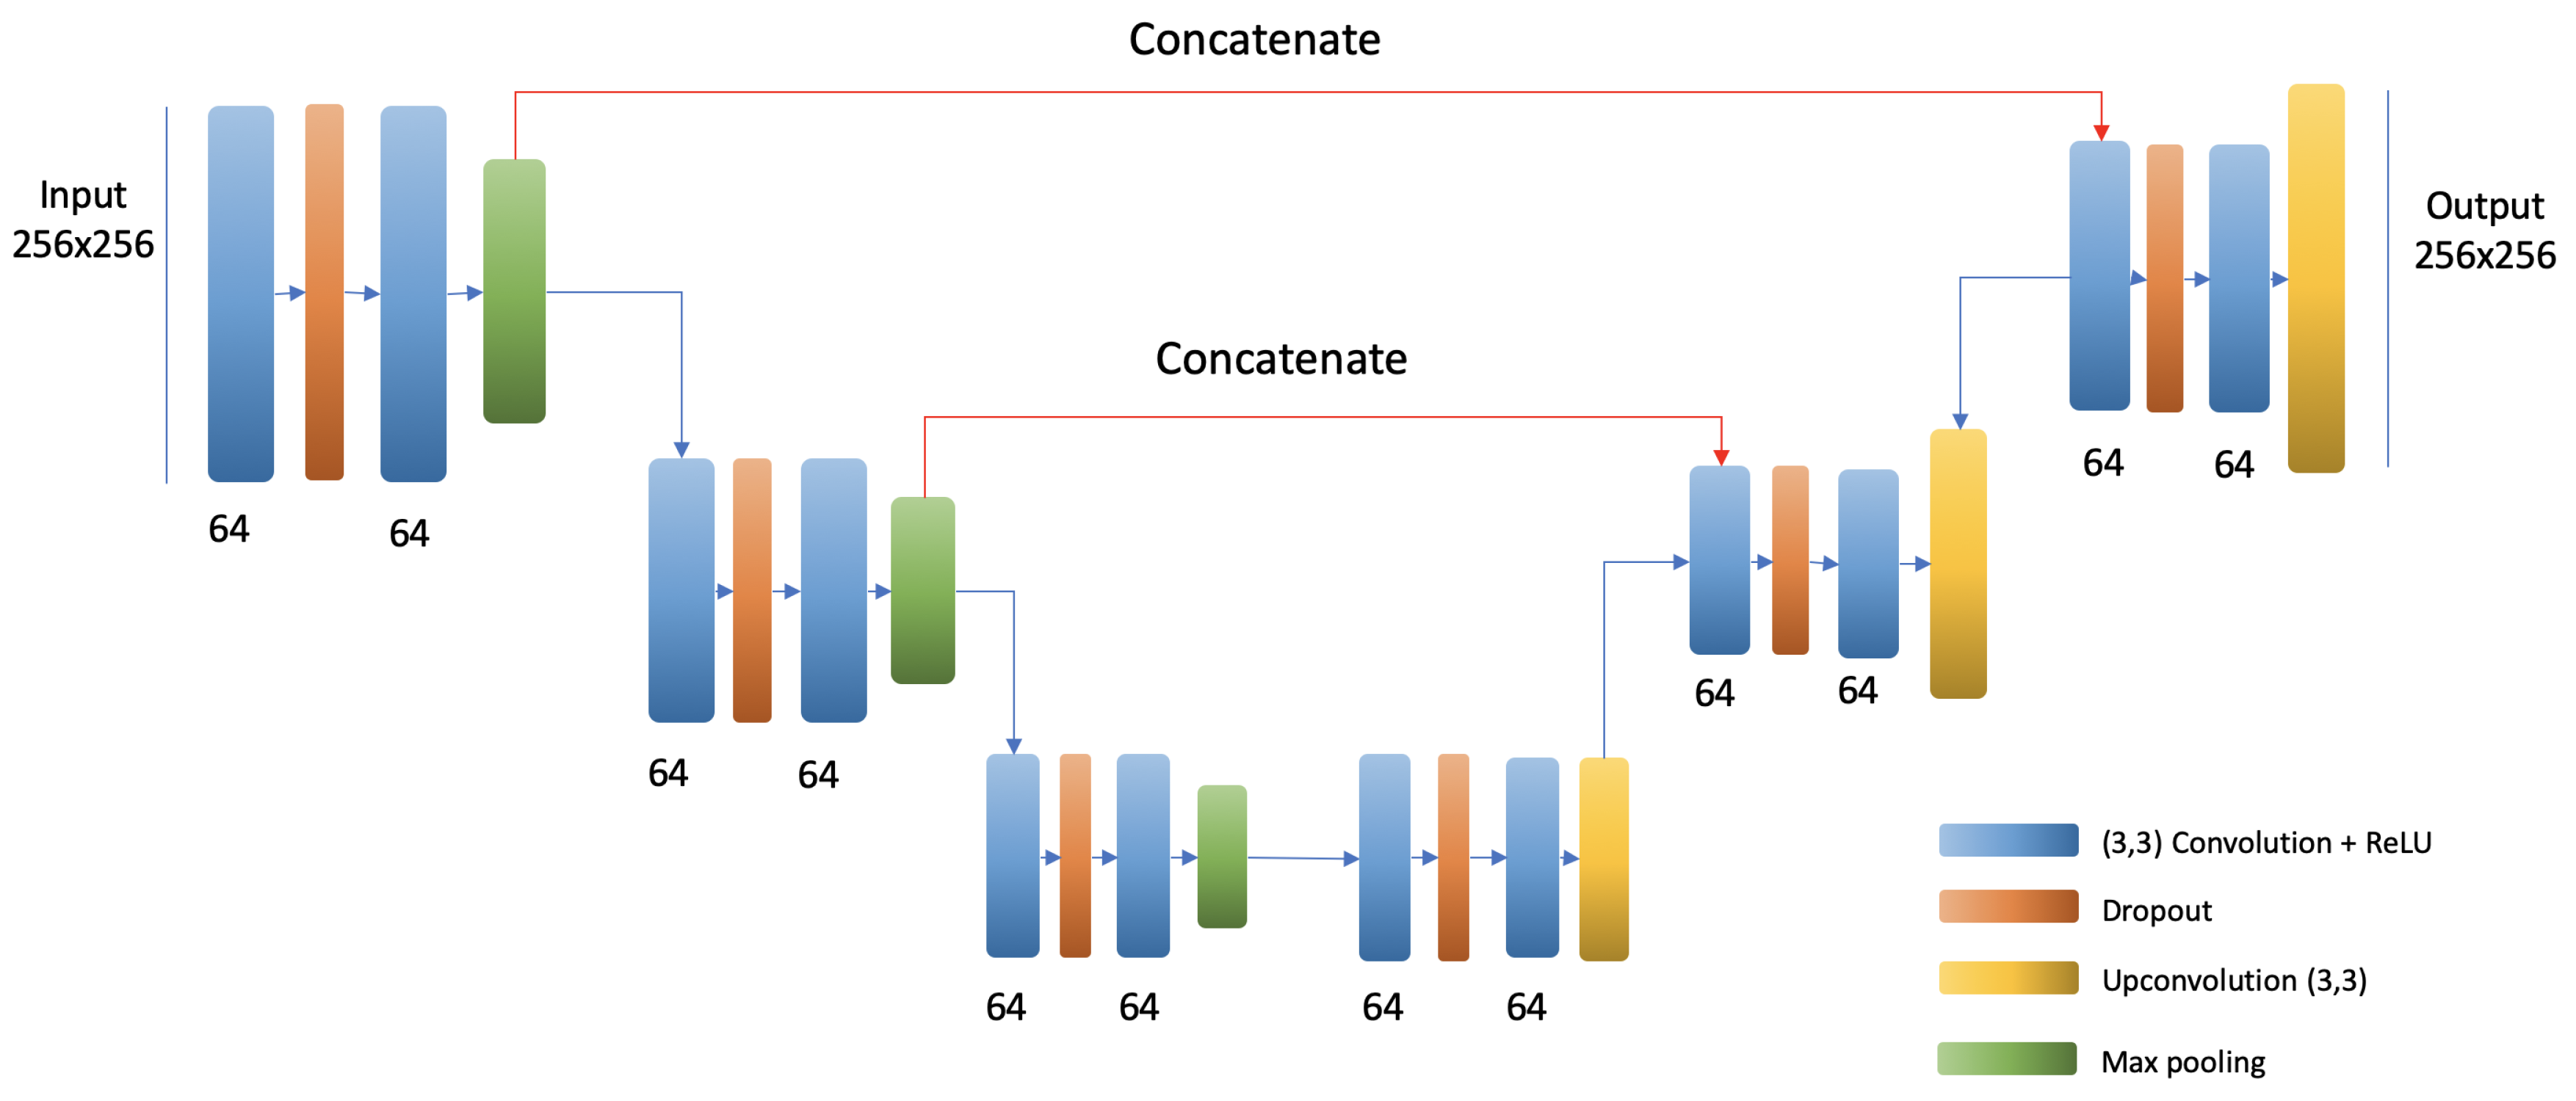
As stated in the Introduction, there exist many different CNNs for different applications, and it is important to find the appropriate solution for a specific task. Retraining existing powerful architectures such as VGG19 [27], ResNet, or Inception Net to solve other problems by transfer learning is one approach that is often used. However, this was not an option in our four-band setting and very particular segmentation task with features that might differ significantly from features learned by networks trained on common image datasets such as ImageNet. Thus, we opted to implement a U-Net architecture, which is a particular implementation of a CNN first developed by Ronneberger [19] for biomedical image segmentation. One major advantage of CNNs is the ability to extract spatial features and to detect patterns independently of their position on the input image. The U-Net architecture is shown in Figure 4 and is suited for our purpose as it does not require a large number of training samples (it was the winner of the International Symposium on Biomedical Imaging (ISBI)cell tracking challenge in 2015 using only 30 images of a size of 512 × 512 ) [19]. The analogy between the sensor technology used in biomedical imagery and remote sensing [28] suggests the suitability of this architecture for remote sensing applications. The architecture is divided into two parts, the encoder and the decoder paths (Figure 4). The encoder reduces the spatial dimensionality of the feature maps and learns to keep only the most important features. The decoder increases the spatial dimensionality and learns to recover the full spatial information. Due to the depth of the network, the information from the encoding path is concatenated in the decoding path, which helps to assemble a more precise output [19]. During our study, we tested different hyperparameters to find an optimal setting for our problem. The different parts of our final architecture, as well as the tested hyperparameter settings are described in the following.

2.4. Evaluation Metrics

To assess the performance of the neural network, several evaluation metrics were used. Evaluation metrics were computed during the forward pass, and were not subject to maximization, but were rather used as a performance indicator. This helped to optimize the hyperparameters of the model. In this study, we used a custom implementation of the intersection over union metric. It computes the intersection of the reference dataset and the predicted classification and divides it by the union of the two (Equation (1)). In addition, we calculated the overall accuracy of the model (Equation (2)).
I o U = T P T P + F P + F N
A c c u r a c y = T P + T N T P + F N + F P + T N
where T P , T N , F P , and F N are true positive, true negative, false positive, and false negative.
Due to the fact that the feed-forward neural network outputs a probability of a class rather than a class label, a threshold has to be set to obtain a confusion matrix and to be able to compute the evaluation metrics. This threshold being unknown during the training, a custom metric was implemented and operated according to the algorithm in Algorithm 1 to compute the mean intersection over union for thresholds between 0.5 and 1.
Algorithm 1 Pseudocode for calculating a custom metric for thresholding.
 1:  Create an empty array to hold the intersection over union values for all thresholds IoUs
 2:
 3:  Create array V of values between 0.5 and 1 with a step of 0.05
 4:
 5:  Feed forward to do the pixelwise classification prediction P ( C | X , W )
 6:
 7:  for Every element k of array V do
 8:
 9:        Compute confusion matrix elements for the threshold set at k
10:
11:       Compute the intersection over union for threshold k
12:
13:       Append the computed intersection over union for threshold k in array I o U s
14:
15:  end for
16:
17:  return the mean intersection over union m I o U m e a n ( I o U s )

2.5. Training and Fine-Tuning of the U-Net Model

We implemented the neural network using Keras [29] and the Tensorflow backend [30] using Python 3.5. A DGX-1 supercomputer was used for the training of the neural network. It contains eight high-end GPGPUs (general purpose graphic processing unit) from NVIDIA (Tesla P100) with 16 GB of RAM each. The training was based on backpropagation to update the neural network’s weights using the Adam Optimizer [31] on the computed loss function, which is the cross-entropy between the predicted pixel value of the label (probability of the class damaged) and the true pixel value of the label (0 for non-damaged and 1 for damaged). The training stopped when overfitting started to occur (when the neural network performed worse on the validation dataset and better on the training dataset from one epoch to the next; this indicates that the neural network is starting to fail to generalize). Fine-tuning of hyperparameters is very important for an optimal performance of the network on a specific problem. We tested different settings to optimize our architecture (Table 1). Several experiments were performed with different learning rates, numbers of filters, and numbers of encoding and decoding blocks and are summarized in Table 1. These experiments were monitored using TensorBoard and validated on the validation portion of the dataset.
Scenario 5 was selected as the optimal solution as it had the best values for IoU and accuracy while training on fewer epochs. The resulting architecture is shown in Figure 4 and described in the following.

2.5.1. Encoding Path

The encoding path of our network was composed of three encoding blocks; each block was composed of a convolutional layer with a filter of size (3, 3) and a ReLU activation function [32] , a dropout layer to force each neuron to learn more than only one feature, a second convolutional layer followed by ReLU activation, and a max pooling layer with the size (2,2), which replaced each 2 × 2 region on the feature map by the region’s maximum value and thus decreased the size of the feature map by keeping only the highest values.

2.5.2. Decoding Path

The decoding path was symmetrical to the encoding path and was divided into decoding blocks. Each decoding block was composed of a concatenation layer that merged the feature maps from the symmetrical encoding block, a convolutional layer with ReLU activation, a dropout layer, a second convolutional layer, and a deconvolutional layer with a filter size of ( 3 , 3 ) to increase the spatial dimensionality of the input. The dropout layer was used for regularization. The dropout rate was set to increase from one encoding block to the next by a step of 0.1 (starting from 0.1 ), resp. decreasing from one decoding block to the next, and was found to work well for our setting. After the second convolutional layer, the activation function used was SeLU. The intuition behind this choice was to use the same activation function used in the encoding path to concatenate homogeneous feature maps (the same value indicates the same signal in the data). The output layer was a deconvolutional layer with the sigmoid activation function to output pixel values in the interval [ 0 , 1 ] , which corresponded to the probability of the class “damaged”.

2.6. Comparison to a Support Vector Machine Classifier and a Random Forest Algorithm

To better understand the performance of the CNN, comparisons with pixel-wise classifications based on an SVM and an RF classifier were carried out using the 4 spectral bands of the orthophotos (see Section 2.1) as predictors. Due to computational reasons, it was not possible to utilize the entire original training dataset (as used for the CNN) for the SVM and the RF classifier. Thus, we used a subsample of 10,000 randomly-selected pixels for the training phase of both classifiers. These pixels were representative for the data space. Note that both classifiers used a pixel-based approach while the CNN was extracting features and thus considered the spatial correlation between neighboring pixels. For the SVM classifier, the radial basis function kernel (RBF) was applied. The RF classifier was run with a maximum tree depth of 5 and 100 estimators (i.e., decision trees).

3. Results

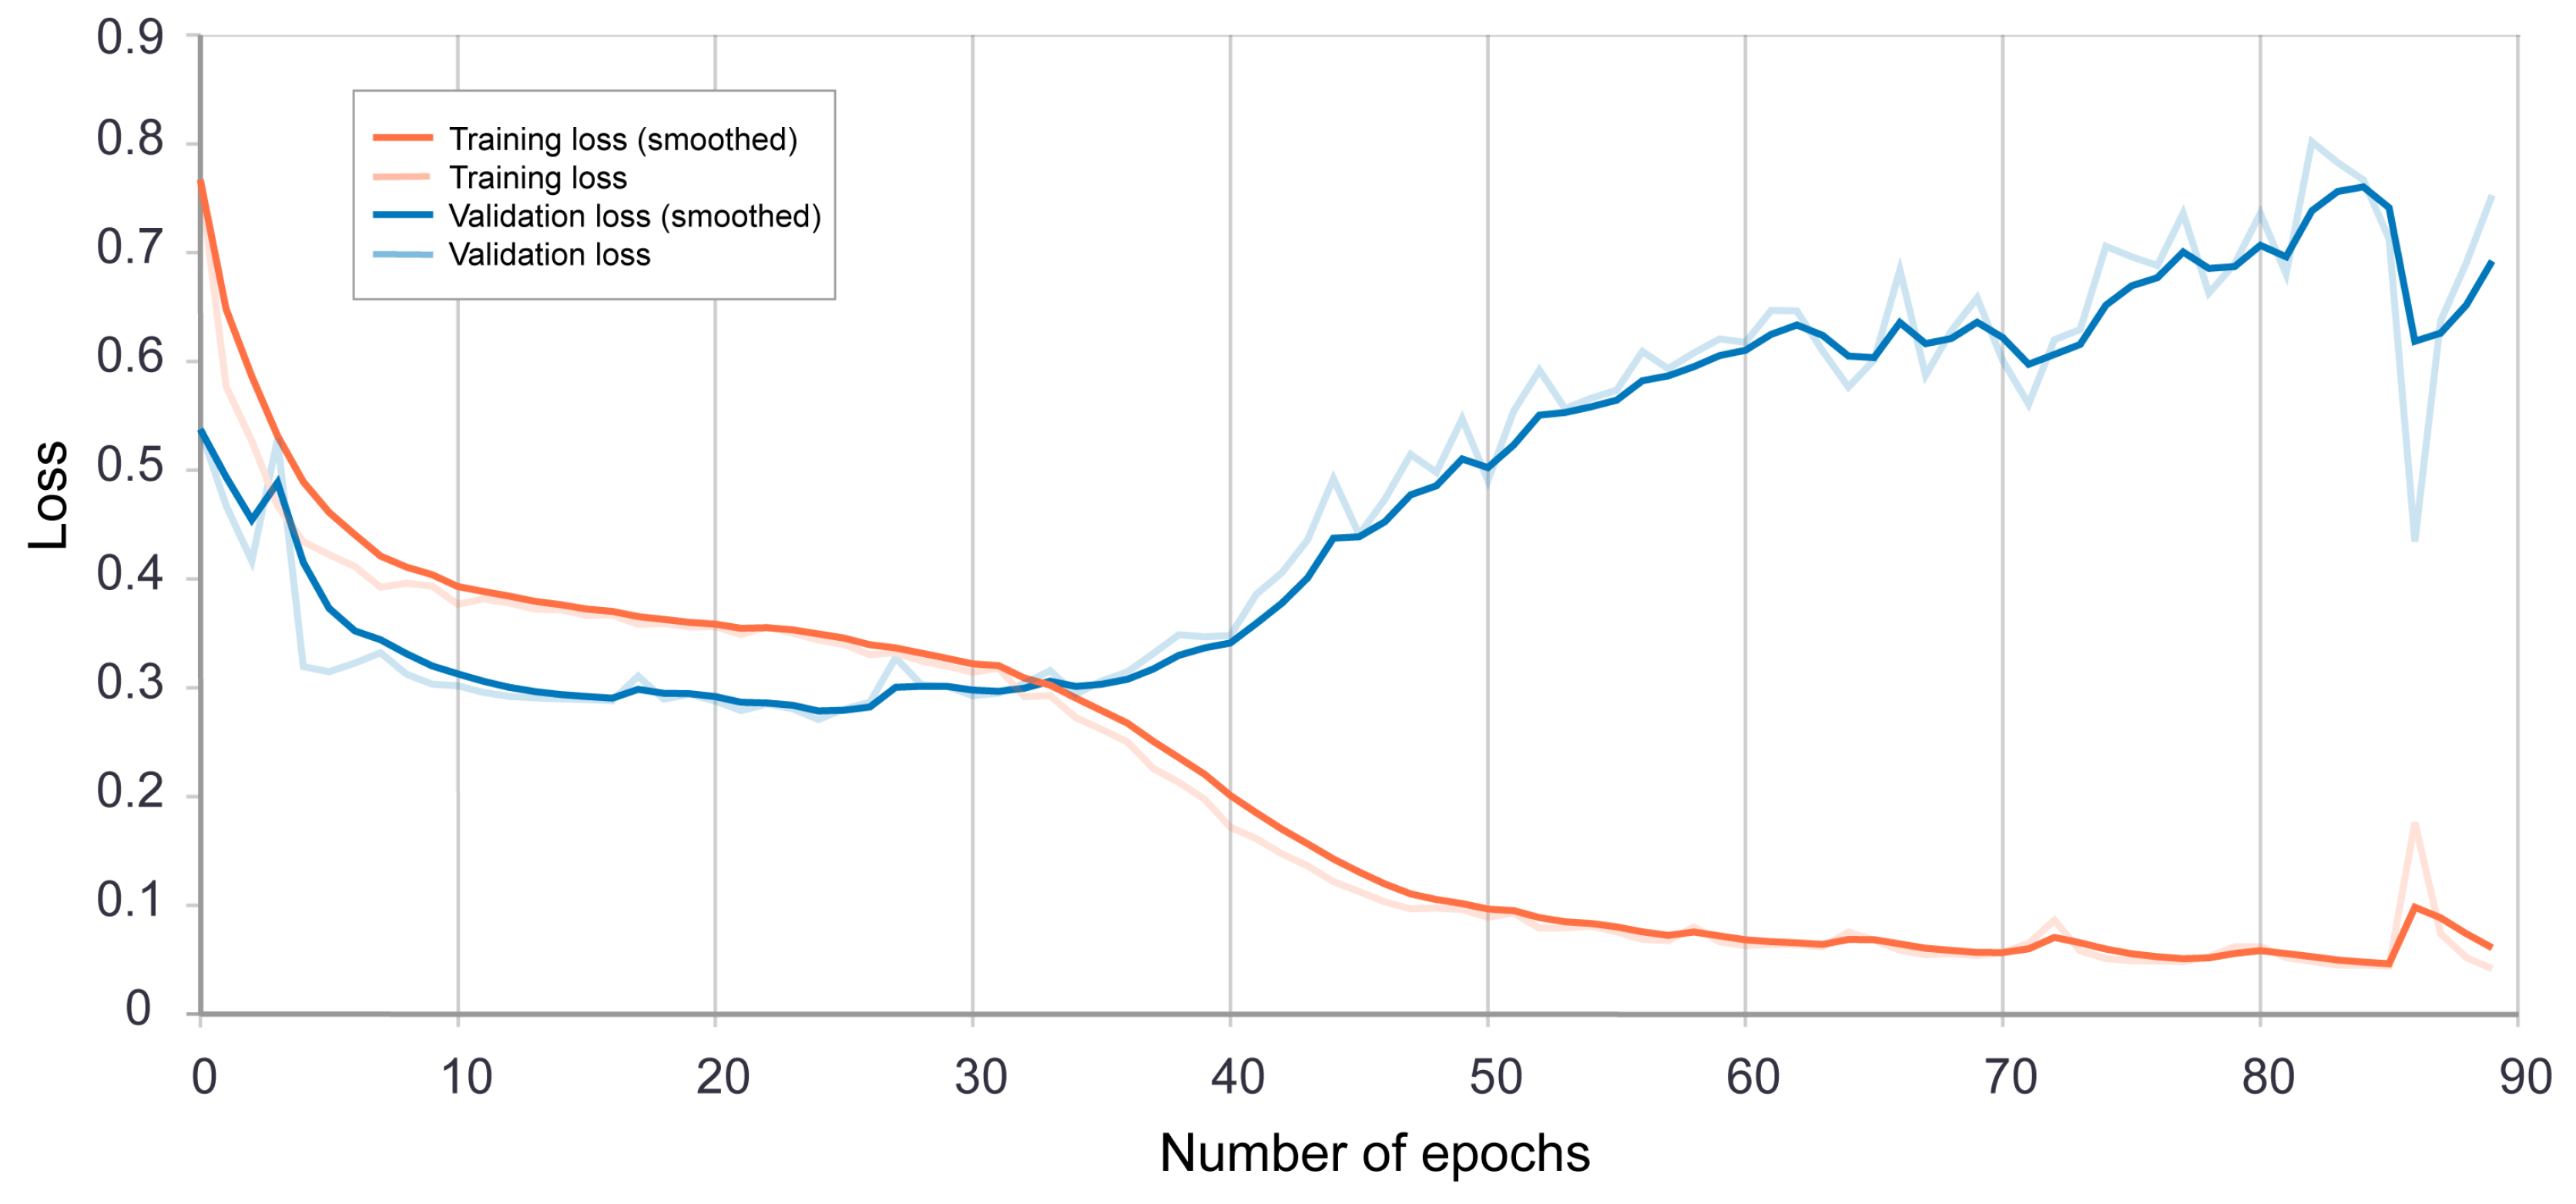
During the monitoring of the training of the neural network using TensorBoard [30], it was noticed that the validation loss was consistently lower than the training loss before the overfitting point, as shown in Figure 5. This is explained by the effect of the dropout layers as suggested by Veličković [33]. During the training process, the dropout layers randomly dropped some neurons, causing the feed-forward network to perform worse, while dropout was deactivated and all neurons were kept during the validation.
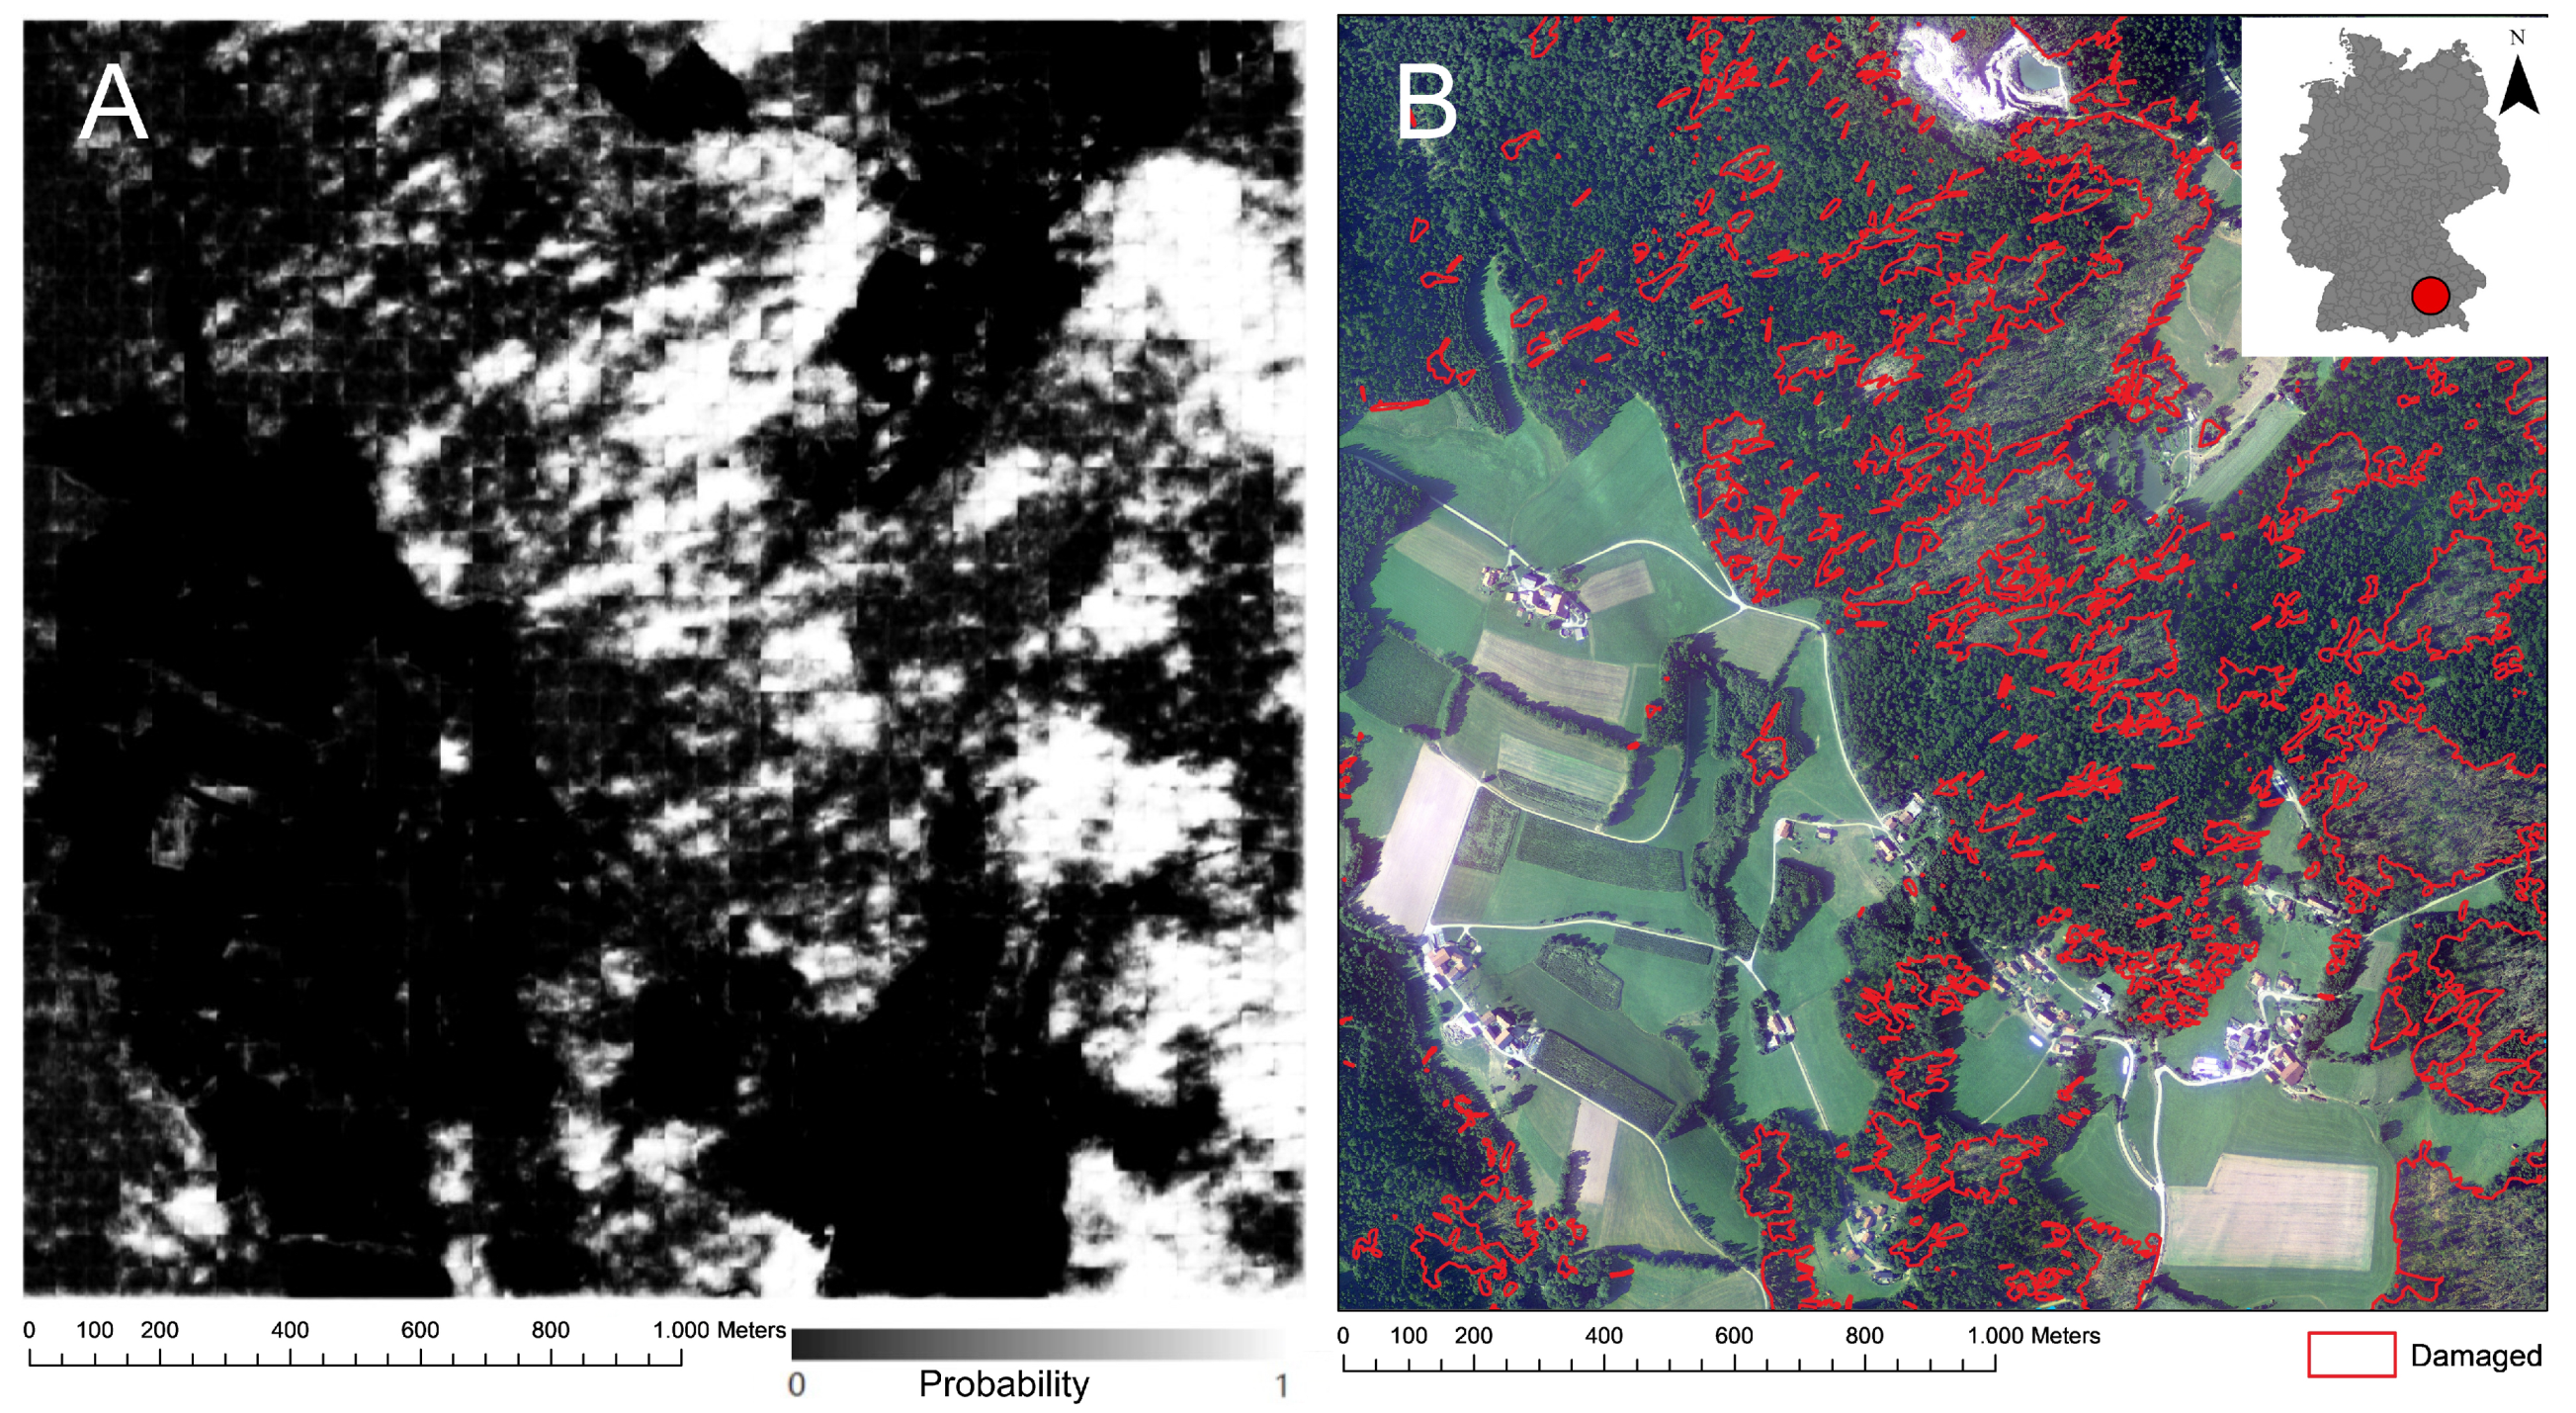
The implemented U-Net model with the optimized weights was used for the prediction on the test dataset (two test images of 10,000 × 10,000 pixels) directly in ArcGIS Pro. This was achieved by importing the saved model file into a toolbox. This process required an .emd file with specifications about the model and a raster function to update the pixels. However, once this was done, the tool could be applied on more scenes directly within the ArcGIS software and thus provide an efficient workflow for forest departments after future storm events. Figure 6 shows the prediction results obtained from the neural network on one test image. The probability of the class (damaged forest area) was assigned to each pixel. This probability was represented as the brightness of the pixel (a probability of zero corresponds to a black pixel and a probability of one to a white pixel), and a threshold needs to be chosen to delineate the damaged areas.
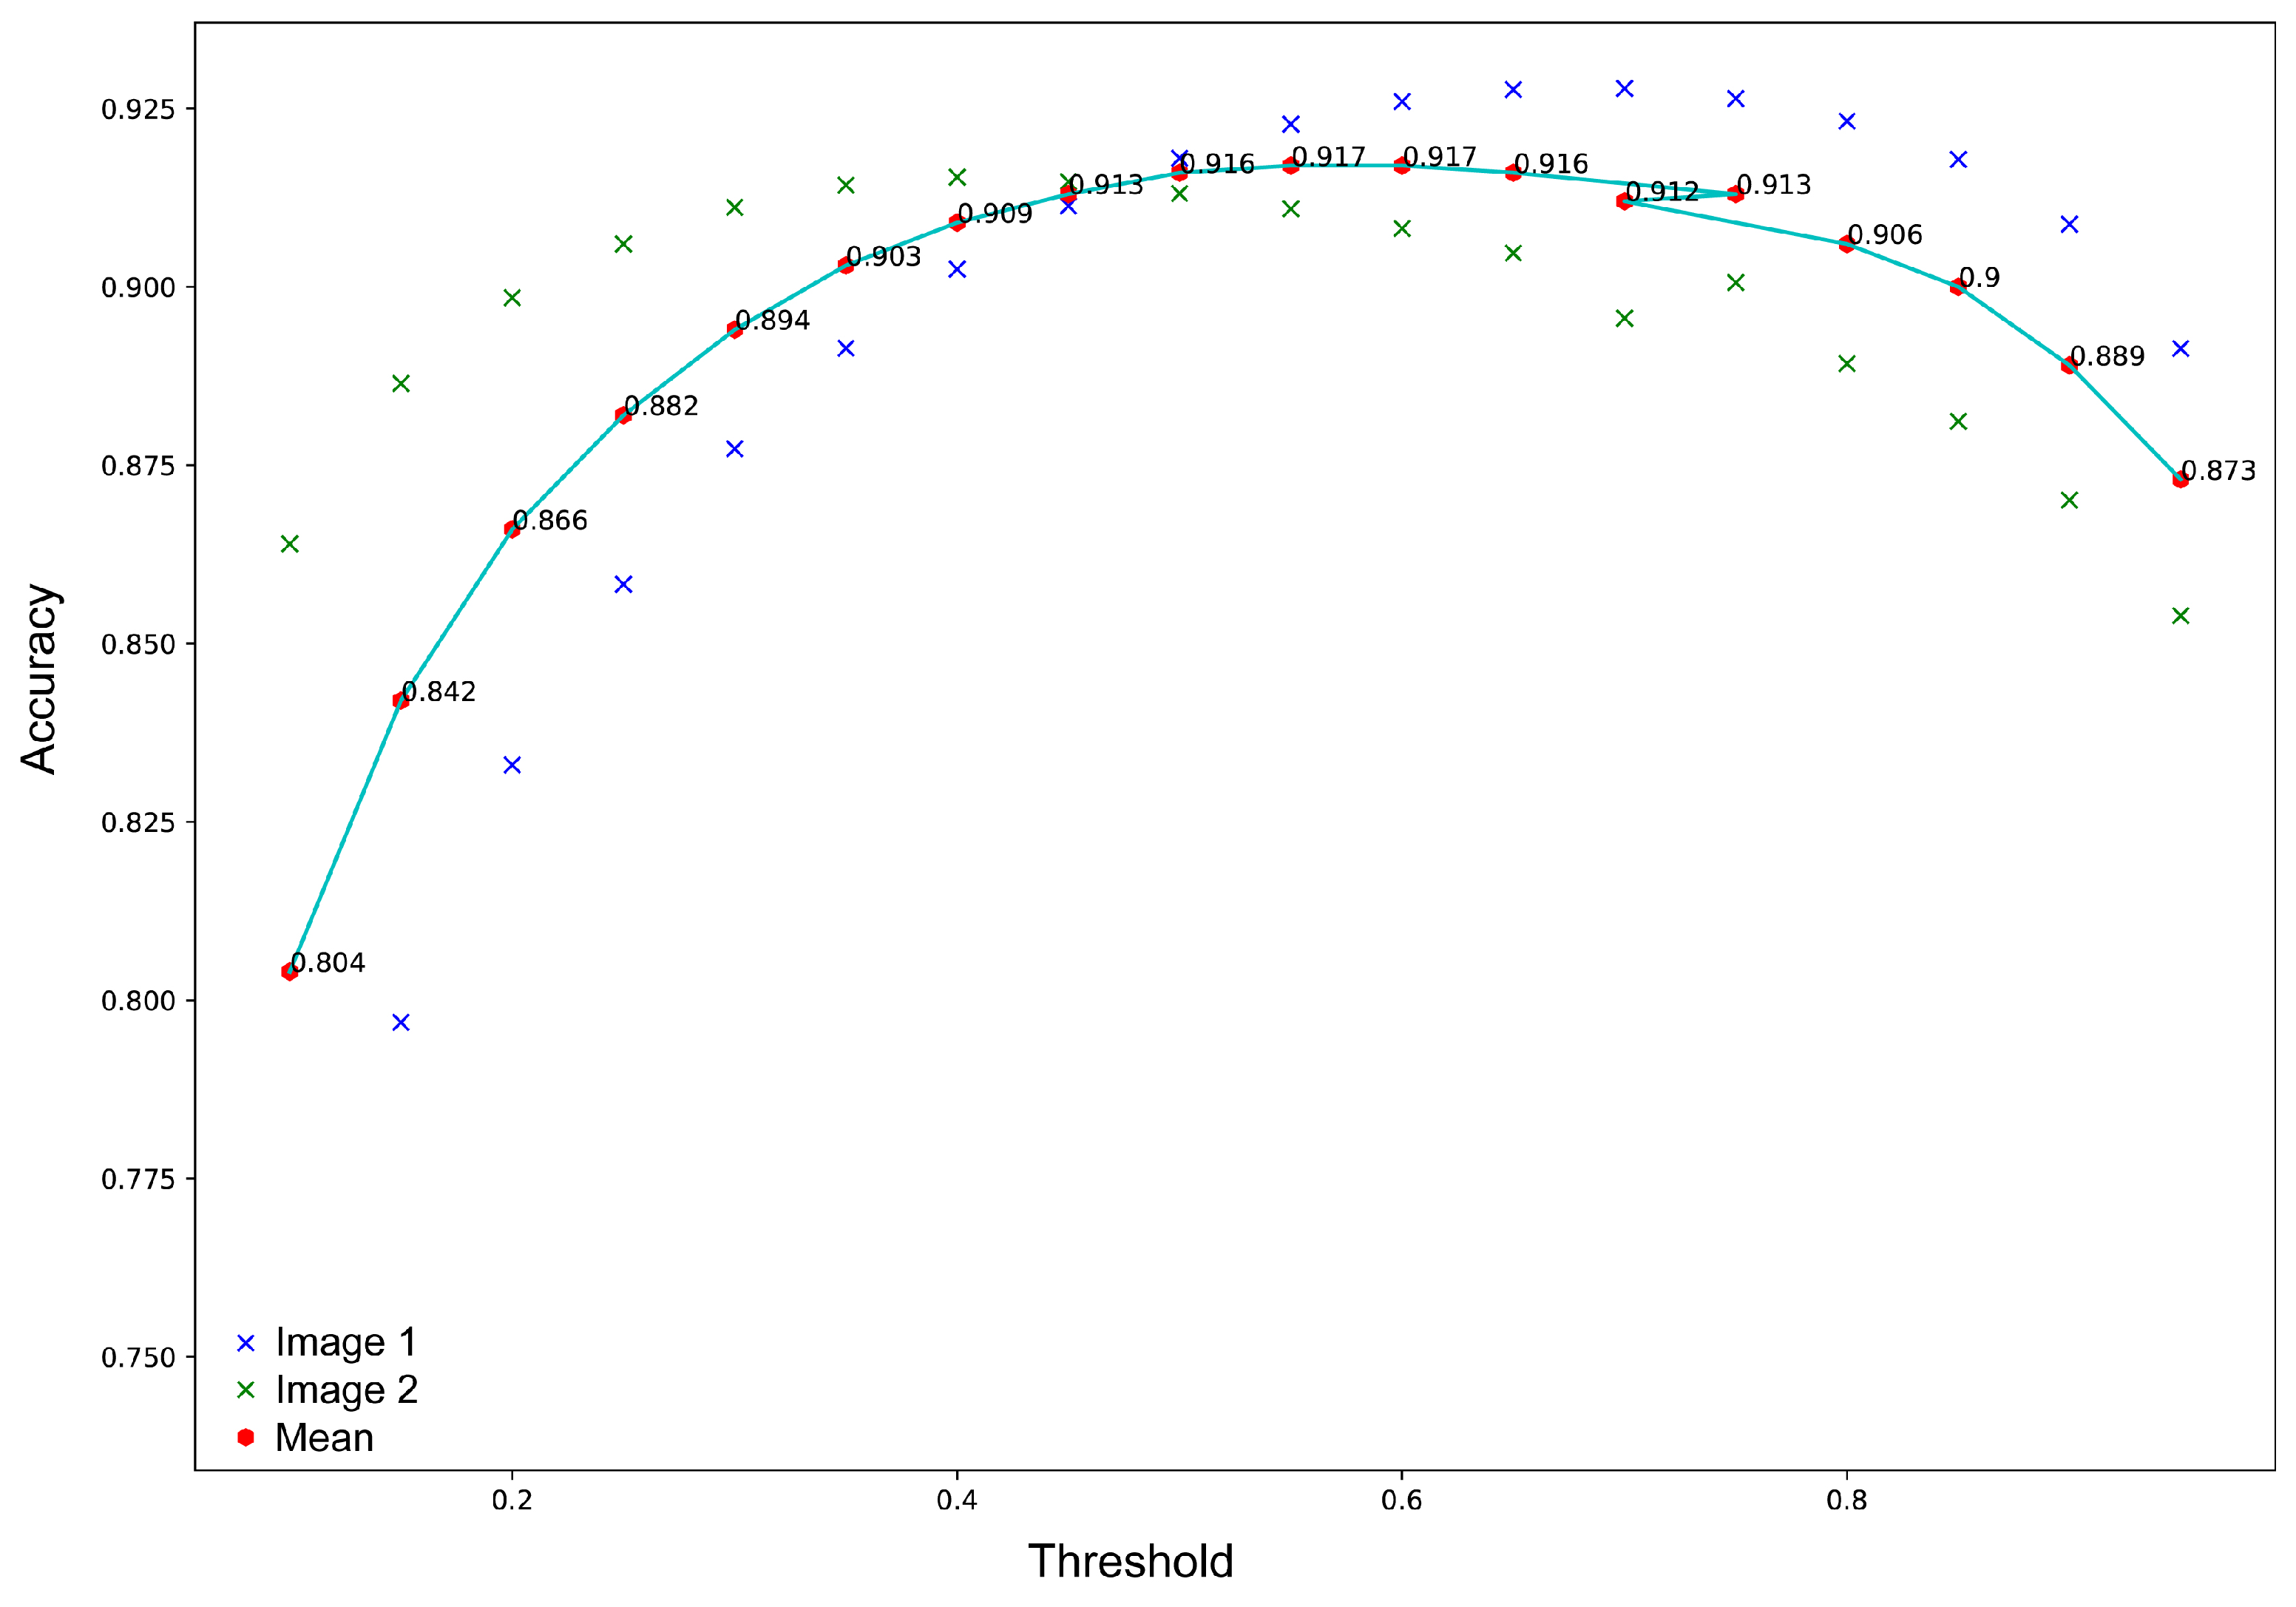
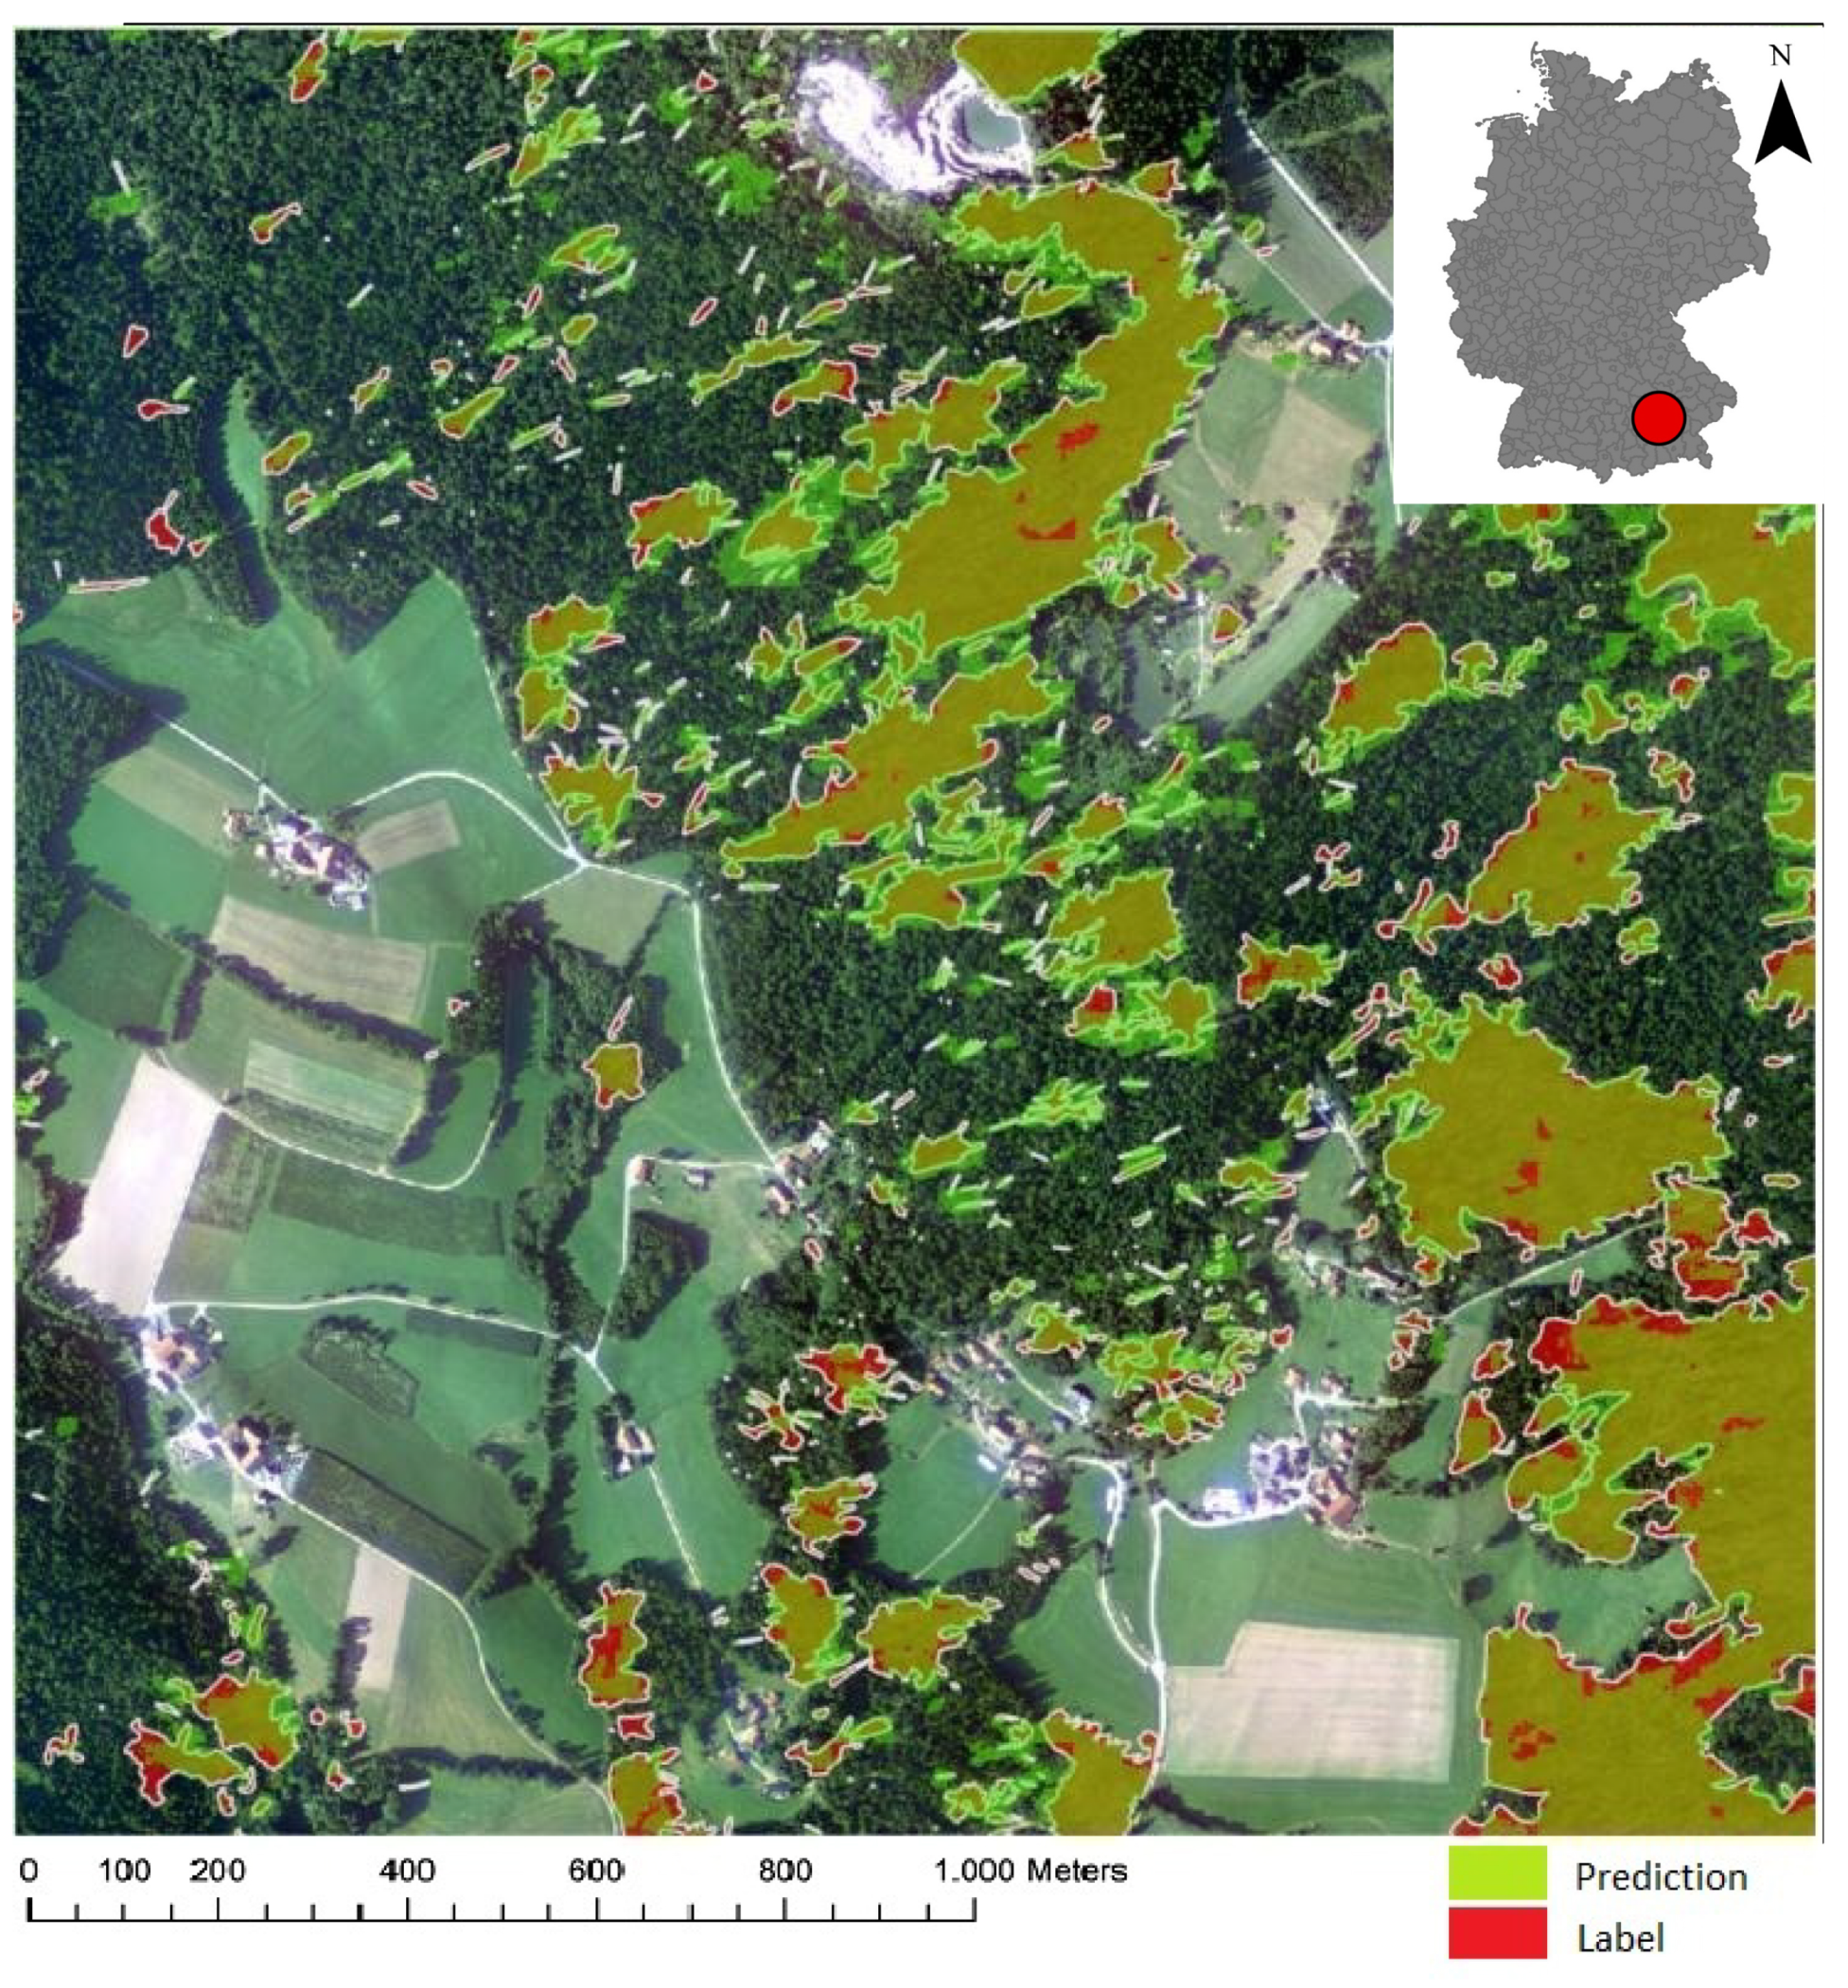
The final goal for forest management was to obtain a classifier capable of a segmentation that was the most comparable or even better than the manual digitization. Figure 7 shows the accuracy plotted against the probability threshold for two test images, respectively. The threshold leading to the highest accuracy (mean value for the two test images) was 0.5 . However, this threshold can be changed depending on whether we can afford to miss any fallen trees or whether the overall performance needs to be maximized, as chosen in this study. Figure 8 shows the prediction results of one test image for a threshold of 0.5 overlain on the ground-truth. Once the probability threshold was fixed, the trained network performed as a binary classifier for each pixel.
The algorithm achieved an accuracy of 92 % , and the sum of the non-detected damaged areas amounted to 0.1 km 2 , which represented 13 % of the manually-delineated damaged area. Classification results were also visually compared to manually-delineated labels. Most non-detected damaged forest areas were covered with shadow, a common problem in remote sensing (Figure 9A). The training dataset only contained a few shadowed areas to learn from, and therefore, these patterns were not properly recognized by the neural network. This problem could be overcome in the future by incorporating more labeled shadowed areas in the training dataset. However, in shadowed areas, where no information can be obtained from the aerial photographs, field observations would be necessary to supplement the aerial photo interpretation. Furthermore, we found some mislabeled data in the reference data where the algorithm outperformed the human mapping. The labeling mistakes included non-damaged forest areas that were labeled as damaged and damaged areas that were not labeled as such. Examples of mislabeled data are shown in Figure 9.
This indicated that the overall accuracy and intersection over union underestimated the model’s performance. Figure 9B shows non-damaged areas that were mislabeled as damaged, but were correctly labeled by the neural network. Figure 9C presents areas with fallen trees that were not contained in the labels created by LWF, but were correctly labeled by the neural network. The results of our model were used on a newly-configured mobile application based on Collector for ArcGIS that allows data collection in the field. Thus, our proposed method provided a streamlined workflow for forestry departments to manage windthrow in a fast and efficient way. The classification results on the same test dataset obtained for the SVM classifier and the RF classifier were 75.2 % and 72.1 % , respectively.

4. Discussion

We developed a novel approach for storm damage assessment based on deep learning and high-resolution airborne remote sensing data. The presented method automatized the process of windthrow delineation within a GIS environment.

4.1. Comparison to Other Forest Damage Assessment Approaches

In comparison to traditional machine learning algorithms (e.g., SVMs, decision trees), CNNs have the advantage of exploiting the correlation between neighboring pixels, which is crucial information in most computer vision tasks. Furthermore, traditional machine learning algorithms such as SVMs can only be trained on relatively small datasets, as the computation complexity increases with the number of samples [34], and hence, they have a worse generalization ability than deep neural networks, which can fit large amounts of data and perform well on unseen data. This is highlighted by our results, which gave an accuracy of 92 % for the U-Net architecture in comparison to 75 % and 72 % for a pixel-based classification based on an SVM and RF classifier. However, also using traditional machine learning, the work in [7] obtained an accuracy of over 90 % . They proposed a method for detecting windthrow areas larger than 0.5 ha using Rapid Eye data in a two-step approach: first, an object-based approach was done based on a large-scale mean shift algorithm, and a random forest classifier that detects damaged areas of an area ≥0.5 ha; and then, in a second step, further damage was detected at the pixel level. Their accuracy was comparable to our deep learning results, but required more manual tuning. The work in [35] also developed a new approach for identifying storm damage, as well as estimating the severity based on the normalized difference infrared index (NDII) and other indices applied to MODIS data. This approach was designed for rapid large-scale assessment, while we focused on automating detailed delineation of damaged areas. Including spectral characteristics, however, might be an interesting extension of the present study.
Besides optical data, radar and ALS data are widely used in forestry. The approach presented in [36], for example, used X-band COSMO-SkyMed Stripmap SAR images to detect changes in forests. The authors used the same approach on optical sensors and compared the results. The accuracies obtained were slightly above 80 % for areas ranging between 0.1 ha and 0.5 ha and around 50 % for areas greater than 0.01 ha. Compared to our approach, the proposed method, even though achieving good results, required two images (before and after the storm) and several manual steps such as an analysis for the selection of suitable bands or masking of non-forest areas, making it less scalable and relying on expert input and processing. Thus, there was a trade-off between full automation using deep learning and the expert-based approach, which allowed a better understanding about how parameters were derived or even deriving physical properties, as is often the case in forest applications. Finally, the work in [37] proposed a method for rapid detection of windthrown areas in forests using C-band Sentinel-1 SAR data. Based on the difference in backscatter quantified by the Eriksson windthrow index [38] between two images acquired before and after the storm, an accuracy of 85 % was achieved for areas greater than 0.5 ha. As these results also required choosing optimal parameters, the transferability of the method was somewhat more complex compared to the pretrained U-Net architecture, which can be applied without tuning additional parameters specific to the area of interest. An in-depth investigation of the performance of the proposed architecture on further datasets would be an interesting future project, especially with respect to the power of generalization, which can be increased by different data augmentation techniques.

4.2. Limitations of This Study

In general, the limitations of deep learning in comparison to other machine learning methods are the requirement of large and high-quality training data, as well as hardware limitations related to GPU computing power. The most notable advantage of deep learning is the grade of automatization and a high potential to generalize when using large amounts of representative training data, which might, however, not always be available; especially with respect to ground-truth labels that might be scarce or not exist at all.. Furthermore, the black-box nature makes these algorithms a good choice for classification as suggested in this study, but a challenge for modeling physical properties, as is often the case in forestry. This case study relied on high-resolution orthophotos with 20-cm spatial resolution obtained from an aerial survey. The great advantage of these data is that many details can be detected. However, if very large areas were affected by a storm, it might be too time consuming to conduct aerial surveys. In such cases, optical satellite data with a high temporal resolution and wide regional coverage should be considered as an alternative, even though satellite data usually have a lower spatial resolution. Thus, the developed method of this study could be tested in a future project to analyze the advantages and disadvantages of different optical satellite datasets with different spatial, temporal, and spectral resolution. Our method was successfully applied in this case study to delineate damaged forest areas caused by a summer storm, i.e., during leaf-on conditions. In a follow-up project, it still needs to be tested how accurately the method can detect storm damages during different phenological stages, especially for a winter storm with leaf-off conditions. During winter time, the low position of the Sun can cause more shadowed areas, especially in project areas with large height differences. Moreover, for a winter storm, it will be necessary to analyze how accurate broadleaved forest stands without foliage can be separated from the damaged areas. This classification would require additional training data.

5. Conclusions and Outlook

We presented an AI-based approach for automatizing the laborious task of determining the damaged areas in large forest areas while reducing processing times significantly. The integration of a modified U-Net architecture into the ArcGIS Platform offered a streamlined workflow for forest departments, and the results of the trained neural network can be directly used in the field on mobile devices, facilitating disaster management. The achieved accuracy of 92 % highlights the potential of deep learning for forest-related remote sensing tasks. In a follow-up study, we are planning to train a similar architecture on Planet Dove data that are available more rapidly after the storm, but at a lower spatial resolution and a low signal-to-noise ratio, to provide a rapid overview of the situation prior to a more detailed mapping.

Author Contributions

Conceptualization, M.B., C.S., and Z.M.H.; writing, original-draft, Z.M.H. and M.B.

Funding

This research received no external funding.

Acknowledgments

We would like to thank the Bavarian State Institute of Forestry (Bayerische Landesanstalt für Wald und Forstwirtschaft (LWF)) for providing the data for this study. Furthermore, we thank Esri Deutschland for funding the thesis and open-access publication.

Conflicts of Interest

The authors declare no conflict of interest.

Abbreviations

The following abbreviations are used in this manuscript:
CNNConvolutional neural network
GPUGraphics processing unit
IoUIntersection over union
ReLURectified linear unit
SeLUScaled exponential linear unit

References

  1. Gardiner, B.; Blennow, K.; Carnus, J.M.; Fleischer, P.; Ingemarson, F.; Landmann, G.; Lindner, M.; Marzano, M.; Nicoll, B.; Orazio, C.; et al. Destructive storms in European forests: past and forthcoming impacts. In Destructive Storms in European Forests: Past and Forthcoming Impacts; European Forest Institute: Joensuu, Finland, 2010. [Google Scholar]
  2. Triebenbacher, C.; Straßer, L.; Lemme, H.; Lobinger, G.; Metzger, J.; Petercord, R. Waldschutzsituation 2017 in Bayern. AFZ-DerWald 2018, 6, 18–21. [Google Scholar]
  3. Seidl, R.; Thom, D.; Kautz, M.; Martín-Benito, D.; Peltoniemi, M.; Vacchiano, G.; Wild, J.; Ascoli, D.; Petr, M.; Honkaniemi, J.; et al. Forest disturbances under climate change. Nat. Clim. Chang. 2017, 7, 395–402. [Google Scholar] [CrossRef] [PubMed] [Green Version]
  4. Böhm, P. Sturmschäden in Schwaben von 1950 bis 1980. Allg. Forstz. 1981, 36, 1380. [Google Scholar]
  5. Mokros, M.; Výbot’ok, J.; Merganic, J.; Hollaus, M.; Barton, I.; Koren, M.; Tomastík, J.; Cernava, J. Early Stage Forest Windthrow Estimation Based on Unmanned Aircraft System Imagery. Forests 2017, 8, 306. [Google Scholar] [CrossRef]
  6. Nabuurs, G.; Schelhaas, M. Spatial distribution of whole-tree carbon stocks and fluxes across the forests of Europe: where are the options for bio-energy? Biomass Bioenergy 2003, 24, 311–320. [Google Scholar] [CrossRef]
  7. Einzmann, K.; Immitzer, M.; Böck, S.; Bauer, O.; Schmitt, A.; Atzberger, C. Windthrow Detection in European Forests with Very High-Resolution Optical Data. Forests 2017, 8, 21. [Google Scholar] [CrossRef]
  8. Tomastík, J.; Saloň, Š.; Piroh, R. Horizontal accuracy and applicability of smartphone GNSS positioning in forests. Forestry 2016, 90, 187–198. [Google Scholar] [CrossRef]
  9. Wessel, M.; Brandmeier, M.; Tiede, D. Evaluation of Different Machine Learning Algorithms for Scalable Classification of Tree Types and Tree Species Based on Sentinel-2 Data. Remote Sens. 2018, 10, 1419. [Google Scholar] [CrossRef]
  10. Hościło, A.; Lewandowska, A. Mapping Forest Type and Tree Species on a Regional Scale Using Multi-Temporal Sentinel-2 Data. Remote Sens. 2019, 11, 929. [Google Scholar] [CrossRef]
  11. Hyyppä, J.; Holopainen, M.; Olsson, H. Laser scanning in forests. Remote Sens. 2012, 4, 2919–2922. [Google Scholar] [CrossRef]
  12. Anees, A.; Aryal, J. A statistical framework for near-real time detection of beetle infestation in pine forests using MODIS data. IEEE Geosci. Remote Sens. Lett. 2014, 11, 1717–1721. [Google Scholar] [CrossRef]
  13. Keenan, T.; Darby, B.; Felts, E.; Sonnentag, O.; Friedl, M.; Hufkens, K.; O’Keefe, J.; Klosterman, S.; Munger, J.W.; Toomey, M.; et al. Tracking forest phenology and seasonal physiology using digital repeat photography: a critical assessment. Ecol. Appl. 2014, 24, 1478–1489. [Google Scholar] [CrossRef] [Green Version]
  14. Jonikavičius, D.; Mozgeris, G. Rapid assessment of wind storm-caused forest damage using satellite images and stand-wise forest inventory data. iFor. Biogeosci. For. 2013, 6, 150–155. [Google Scholar] [CrossRef] [Green Version]
  15. Baumann, M.; Ozdogan, M.; Wolter, P.T.; Krylov, A.; Vladimirova, N.; Radeloff, V.C. Landsat remote sensing of forest windfall disturbance. Remote Sens. Environ. 2014, 143, 171–179. [Google Scholar] [CrossRef]
  16. Honkavaara, E.; Litkey, P.; Nurminen, K. Automatic Storm Damage Detection in Forests Using High-Altitude Photogrammetric Imagery. Remote Sens. 2013, 5, 1405–1424. [Google Scholar] [CrossRef]
  17. Renaud, J.P.; Vega, C.; Durrieu, S.; Lisein, J.; Magnussen, S.; Lejeune, P.; Fournier, M. Stand-level wind damage can be assessed using diachronic photogrammetric canopy height models. Ann. For. Sci. 2017, 74, 74. [Google Scholar] [CrossRef]
  18. Lecun, Y. Gradient-based learning applied to document recognition. Proc. IEEE. 1998, 86, 2278–2324. [Google Scholar] [CrossRef] [Green Version]
  19. Ronneberger, O.; Fischer, P.; Brox, T. U-Net: Convolutional Networks for Biomedical Image Segmentation. arXiv 2015, arXiv:1505.04597. [Google Scholar]
  20. Lu, C.; Chen, H.; Chen, Q.; Law, H.; Xiao, Y.; Tang, C.K. 1-HKUST: Object Detection in ILSVRC 2014. arXiv 2014, arXiv:1409.6155. [Google Scholar]
  21. Jin, B.; Ye, P.; Zhang, X.; Song, W.; Li, S. Object-Oriented Method Combined with Deep Convolutional Neural Networks for Land-Use-Type Classification of Remote Sensing Images. J. Indian Soc. Remote Sens. 2019, 47, 951–965. [Google Scholar] [CrossRef] [Green Version]
  22. Rezaee, M.; Mahdianpari, M.; Zhang, Y.; Salehi, B. Deep Convolutional Neural Network for Complex Wetland Classification Using Optical Remote Sensing Imagery. IEEE J. Sel. Top. Appl. Earth Obs. Remote Sens. 2018, 11, 3030–3039. [Google Scholar] [CrossRef]
  23. Onishi, M.; Ise, T. Automatic classification of trees using a UAV onboard camera and deep learning. arXiv 2018, arXiv:1804.10390. [Google Scholar]
  24. Freudenberg, M.; Nölke, N.; Agostini, A.; Urban, K.; Wörgötter, F.; Kleinn, C. Large Scale Palm Tree Detection In High Resolution Satellite Images Using U-Net. Remote Sens. 2019, 11, 312. [Google Scholar] [CrossRef]
  25. Wagner, F.H.; Sanchez, A.; Tarabalka, Y.; Lotte, R.G.; Ferreira, M.P.; Aidar, M.P.M.; Gloor, E.; Phillips, O.L.; Aragão, L.E.O.C. Using the U-net convolutional network to map forest types and disturbance in the Atlantic rainforest with very high resolution images. Remote Sens. Ecol. Conserv. 2019. [Google Scholar] [CrossRef]
  26. Hafemann, L.G.; Oliveira, L.S.; Cavalin, P. Forest species recognition using deep convolutional neural networks. In Proceedings of the 2014 22nd IEEE International Conference on Pattern Recognition, Stockholm, Sweden, 24–28 August 2014; pp. 1103–1107. [Google Scholar]
  27. Simonyan, K.; Zisserman, A. Very Deep Convolutional Networks for Large-Scale Image Recognition. arXiv 2014, arXiv:1409.1556. [Google Scholar]
  28. Frank, C.J.; Redd, D.G.T.M.R. Characterization of human breast biopsy specimens with near-IR Raman spectroscopy. Anal. Chem. 1994, 66, 319–326. [Google Scholar] [CrossRef]
  29. Chollet, F. Keras. GitHub repository. 2015. Available online: https://github.com/fchollet/keras (accessed on 20 August 2019).
  30. Jeffrey, D. TensorFlow: A System for Large-Scale Machine Learning; Google Brain: Mountain View, CA, USA, 2015. [Google Scholar]
  31. Kingma, D.P.; Ba, J. Adam: A Method for Stochastic Optimization. arXiv 2015, arXiv:1412.6980. [Google Scholar]
  32. Nair, V.; Hinton, G.E. Rectified linear units improve restricted boltzmann machines. In Proceedings of the 27th International Conference on Machine Learning (ICML-10), Haifa, Israel, 21–24 June 2010; pp. 807–814. [Google Scholar]
  33. Veličković, P. Be nice to your neurons: Initialisation, Normalisation, Regularisation and Optimisation. In Introduction to Deep Learning (COMPGI23); University College London: London, UK, 2017. [Google Scholar]
  34. Moré, J.J. The Levenberg-Marquardt algorithm: implementation and theory. In Numerical Analysis; Springer: Berlin, Germany, 1978; pp. 105–116. [Google Scholar]
  35. Wang, W.; Qu, J.J.; Hao, X.; Liu, Y.; Stanturf, J. Post-hurricane forest damage assessment using satellite remote sensing. Agric. For. Meteorol. 2010, 150, 122–132. [Google Scholar] [CrossRef]
  36. Remelgado, R.; Notarnicola, C.; Sonnenschein, S. Forest damage assessment using SAR and optical data: evaluating the potential for rapid mapping in mountains. EARSeL eProc. 2014, 13, 67–81. [Google Scholar]
  37. Rüetschi, M.; Small, D.; Waser, L.T. Rapid Detection of Windthrows Using Sentinel-1 C-Band SAR Data. Remote Sens. 2019, 11, 115. [Google Scholar] [CrossRef]
  38. Eriksson, L.E.B.; Fransson, J.E.S.; Soja, M.J.; Santoro, M. Backscatter signatures of wind-thrown forest in satellite SAR images. In Proceedings of the 2012 IEEE International Geoscience and Remote Sensing Symposium, Munich, Germany, 22–27 July 2012; pp. 6435–6438. [Google Scholar]
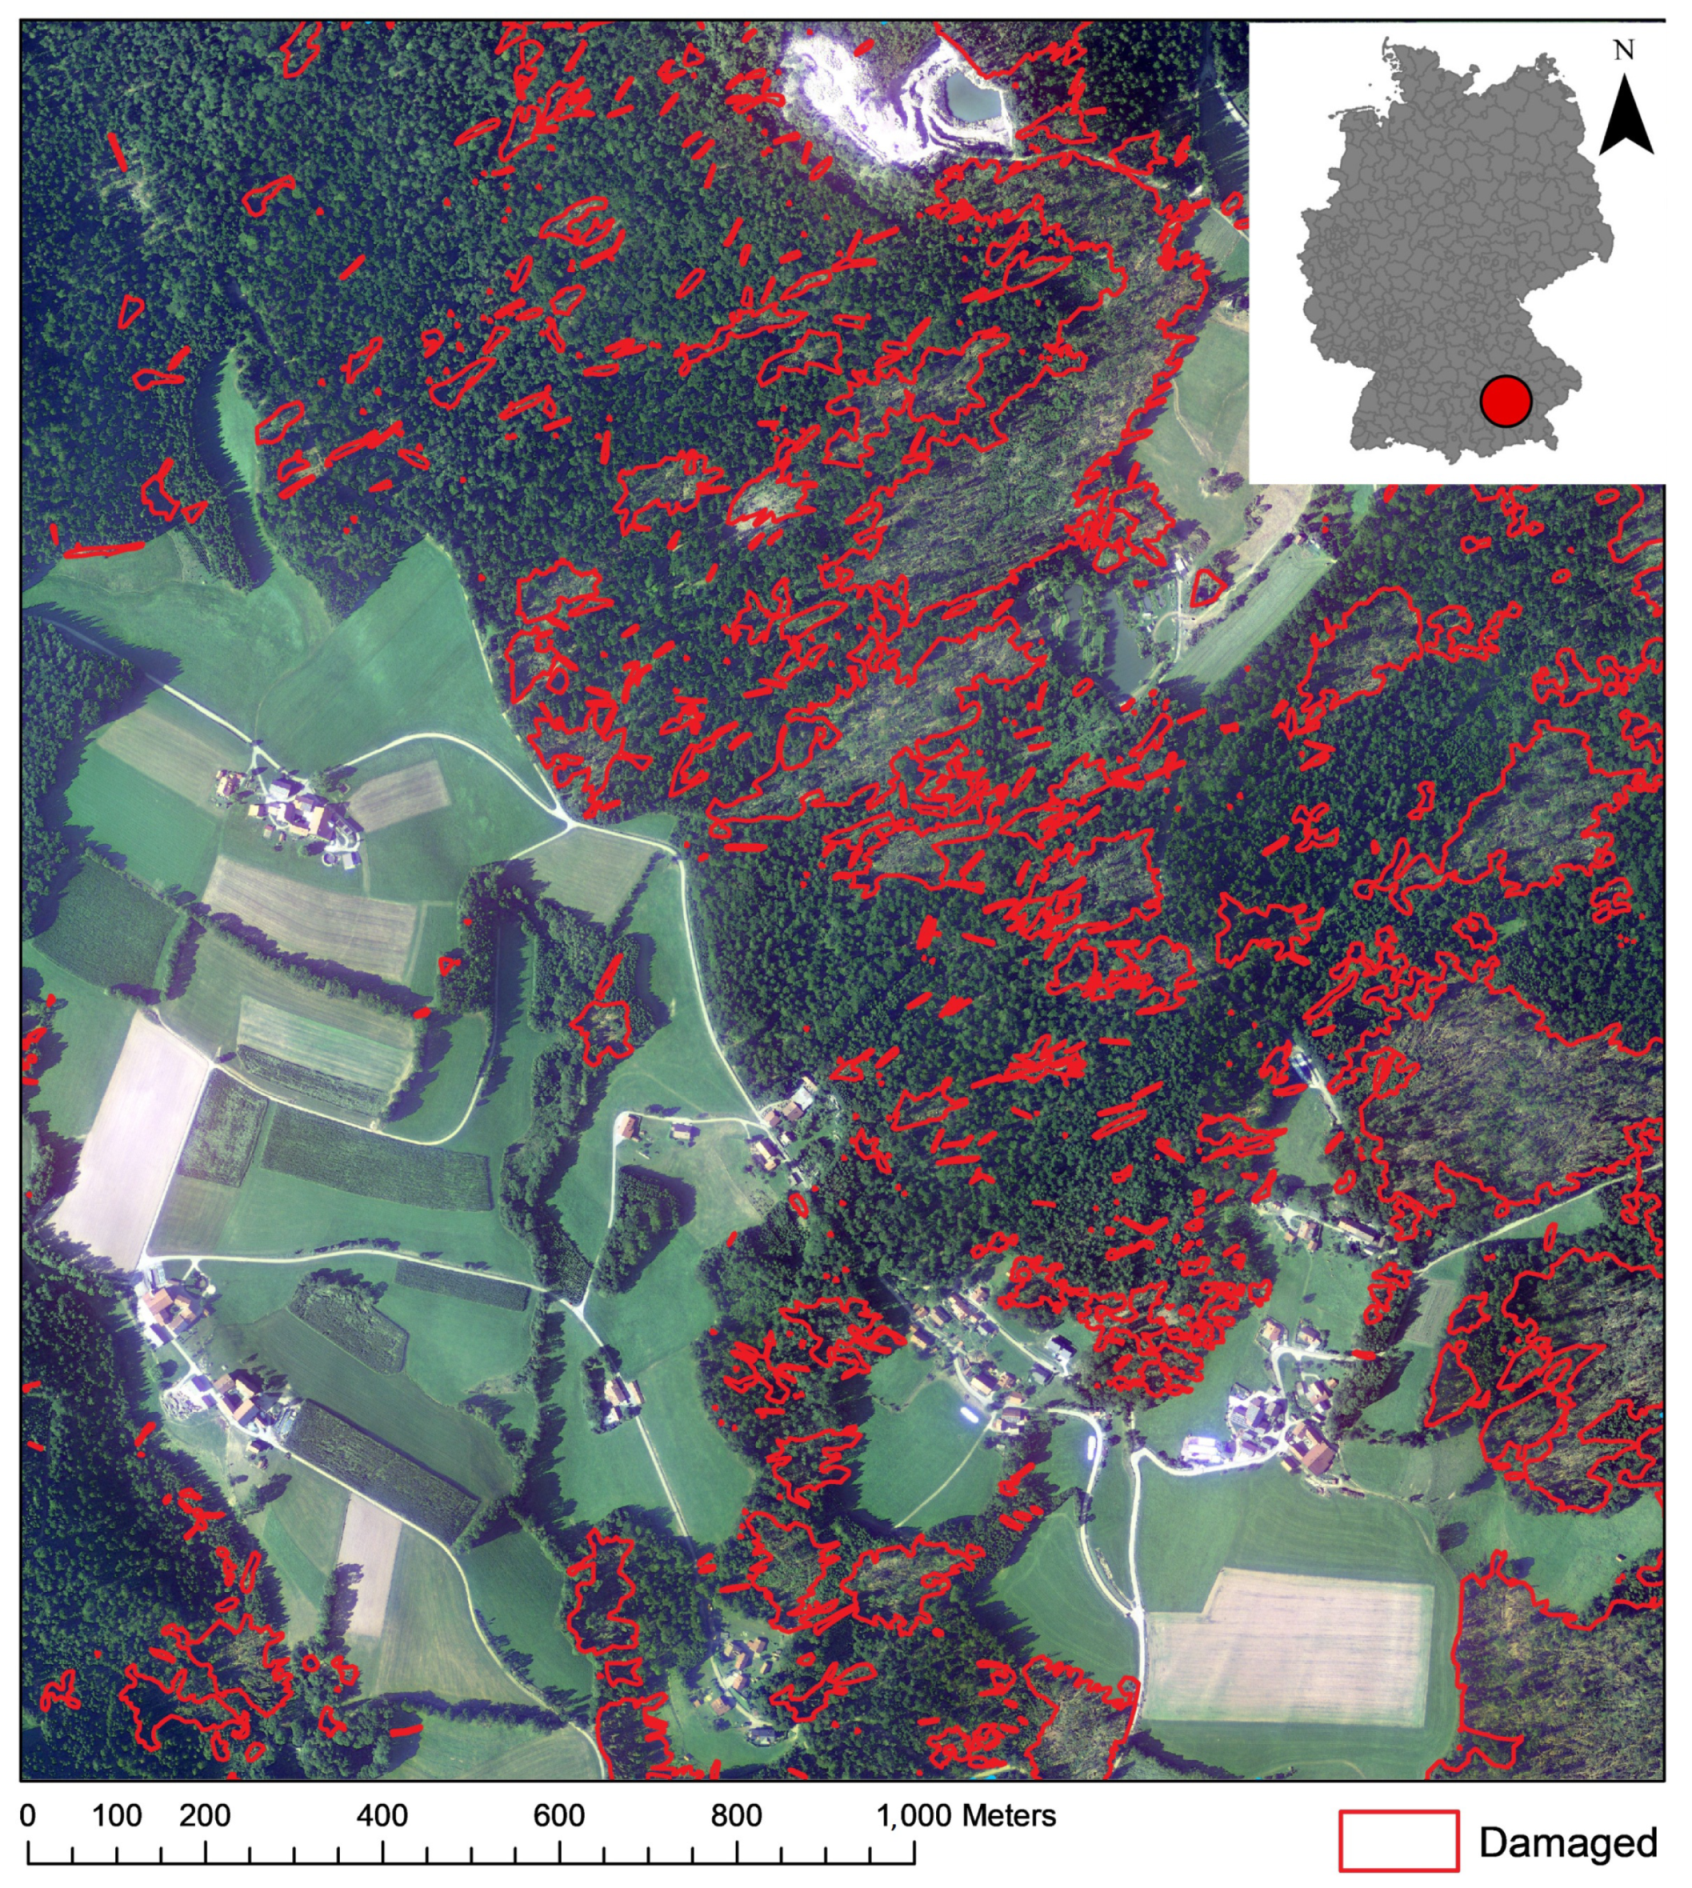
Figure 1. Example of an orthophoto with the corresponding damaged area. The study area is located in Bavaria, as shown in the overview. However, due to confidentiality agreements, we are not able to add more location detail.
Remotesensing 11 01976 g001
Figure 2. Flowchart showing the analytical workflow of the study.
Remotesensing 11 01976 g002
Figure 3. (A) Example of a tile; (B) corresponding label (black: non-damaged, white: damaged).
Remotesensing 11 01976 g003
Figure 4. U-net architecture (experimental setup with 3 encoding blocks).
Remotesensing 11 01976 g004
Figure 5. Loss function of the model (training and validation).
Remotesensing 11 01976 g005
Figure 6. (A) Prediction results on one test image compared to the ground labels shown in (B).
Remotesensing 11 01976 g006
Figure 7. Accuracy obtained for the two test images of a size of 10,000 × 10,000 for thresholds from 0.1 0.95 with steps of 0.05 .
Remotesensing 11 01976 g007
Figure 8. Classification results for one test image (threshold = 0.5 ) superimposed on the ground labels. The overall accuracy for this threshold was 92 % .
Remotesensing 11 01976 g008
Figure 9. (A) Example of shadowed area, not detected by the neural network. (B) Example of the exaggerated outline of the damaged area in the ground-truth. (C) Example of damaged small areas not labeled in the ground-truth. The Red lines delineate the ground-truth label, and the blue lines delineate the detection results.
Remotesensing 11 01976 g009
Table 1. Hyperparameter fine-tuning results.
ScenarioNumber of BlocksNumber of FiltersLearning RateMean IoUAccuracy
1364 , 64, 640.0010.30 82 %
2464, 64, 64, 640.0010.38 89 %
3564, 64, 64, 64, 640.0010.36 86 %
4664, 64, 64, 64, 64, 640.0010.32 86 %
5416, 32, 64, 1280.0010.42 94 %
6432, 64, 128, 2560.0010.38 88 %
7464, 128, 256, 5120.0010.31 84 %
8416, 32, 64, 1280.010.008 71 %
9416, 32, 64, 1280.00050.42 94 %
10416, 32, 64, 1280.000010.39 90 %