Article

An Integrated Indicator Framework for the Assessment of Multifunctional Green Infrastructure—Exemplified in a European City

1
Department Urban and Environmental Sociology, UFZ—Helmholtz Centre for Environmental Research, Permoserstraße 15, 04318 Leipzig, Germany
2
Chair for Strategic Landscape Planning and Management, TUM School of Life Sciences, Technical University of Munich (TUM), Emil-Ramann-Str. 6, 85354 Freising, Germany
*
Author to whom correspondence should be addressed.
Remote Sens. 2019, 11(16), 1869; https://doi.org/10.3390/rs11161869
Submission received: 20 June 2019 / Revised: 25 July 2019 / Accepted: 5 August 2019 / Published: 9 August 2019
(This article belongs to the Special Issue Remote Sensing-Based Urban Planning Indicators)

Abstract

:
The aim of this study is to provide an integrated indicator framework for the Assessment of Multifunctional Green Infrastructure (AMGI) to advance the evolution of the Green Infrastructure (GI) concept, and simultaneously deliver an approach do conduct a GI assessment using remote sensing datasets at multiple spatial and spectral scales. Based on this framework, we propose an explicit methodology for AMGI, while addressing the multi-dimensional pillars (ecology, socio-economy, socio-culture, and human health) for urban sustainability and the multifunctionality of GI. For the purpose of validation, we present the extensive process of employing our framework and methodology, and give an illustrative case exemplified in a European city, i.e., Leipzig, Germany. In this exemplification, we deployed three stages regarding how a single assessment can be conducted: from conceptual framework for priority setting, contextual assessment, to retrospective assessment. In this illustrative case study, we enclosed 18 indicators, as well as identified hot and cold spots of selected GI functions and their multifunctionality. A clear framework and methodology is crucial for the sustainable management of spatially oriented GI plans over time and for different stakeholder groups. Therefore, GI planners and policy makers may now refer to our integrative indicator framework and provided application methodology as common grounds for a better mutual understanding amongst scientists and stakeholders. This study contributes to discourses regarding the enhancement of the GI concept and is expected to provoke more discussion on the improvements of high-quality Remote Sensing (RS) data as well as the development of remote sensing-based methods at multiple spatial, temporal, and spectral scales to support GI plans.

Graphical Abstract

1. Introduction

Green Infrastructure (GI) has been identified as one of several key strategies for promoting urban sustainability [1,2,3,4]. Urban GI has evolved since its inception in the 1990s [5], and it has been defined and interpreted in different ways, such as representing ecological networks of natural and semi-natural areas, approaches for sustainable storm-water management in urban areas, or the strategic planning of networks of green and blue spaces that meet multiple environmental, social, and economic objectives in urban environments at various scales [1,3]. As strategic planning, GI is a whole landscape approach in which all urban green and blue spaces, and even technical green vegetation systems, such as green roofs and walls, have the potential to contribute to the urban GI, regardless of origin and ownership [6,7]. Recent research in Europe has contributed to further advancements in the theoretical foundations of urban GI and assesses the state-of-the-art of its planning in practice [6,8]. It turns out that multifunctional GI has been recognized as strong support for sustainability [4,9], which has enormous potential to disclose the greatest number of benefits such as the protection of natural resources, water management, climate regulation, and the promotion of human health and well-being. Therefore, urban multifunctional GI can be a valuable tool to strategically promote sustainable development by addressing various dimensions of sustainability [10,11,12], provided that sustainability can be strengthened via a multi-dimensional analysis on ecology, the social economy, social culture, and human health [13]. However, since GI has been recognized as a concept and strategic planning is relatively new—in the realm of the last 20 years—studies concerning a thorough assessment of urban multifunctional GI are rather rare [1,3], both in long-term and at multiple spatial scales.
Frameworks and methodologies have recently emerged that aim to assess multifunctional GI through indicators (e.g., [14,15,16,17,18]), given that a systematic combination of several indicators is the best way to represent the overall performance and functions of GI [3,19]. In this context, it has been recognized that a better understanding of multifunctional GI is crucial for urban sustainable development [20,21]. Indeed, there is a growing number of frameworks (e.g., [2,17,19,22,23,24,25,26]) and most studies have provided useful insights into GI assessment. For example, the Common International Classification of Ecosystem Services (CICES) supplies a set of indicators on the basis of a cascade structure (i.e., provision, regulation, and cultural services [27]) to support Ecosystem Services (ESS) assessment [17,28]. Furthermore, The Economics of Ecosystem Services and Biodiversity (TEEB) [28] have informed the true economic value of ESSs, developed from the Millennium Ecosystem Assessment (MEA) [29]. As an advancement, the indicator frameworks from the Total Economic Value model by Vandermeulen, et al. [30] and GI valuation toolkit by East Midlands Development Agency (EMDA) in 2008 have recognized a range of GI values. They include direct use values (e.g., the supply of food and water) and the indirect use values (e.g., air and temperature regulation and non-use values like the protection for future generations [31]).
However, these frameworks are mainly restricted to a fractional GI assessment, such as cultural services provided by GI or to a limited number of GI functions [4]. Less is known regarding their spatial extents and their coverage of qualitative assessment or quantitative measures. It is thus hardly possible to obtain a full picture of multifunctional GI and to undertake a multifunctional GI assessment from only one of them. Moreover, the roles of urban multifunctional GI for promoting ESS [1] and societal health and wellbeing [3], supporting the development of a green economy [6,21,32], as well as sustainable land and water management ought to be reflected in the indicator framework to guide GI planning, management, and policy-making. The challenge remains, as there is a lack of an integrated indicator framework with which scientists and practitioners can undertake an individual assessment of multifunctional green infrastructure (AMGI), particularly concerning primary aspects of urban GI such as ESS provided by GI [22], multiple benefits and functions of GI [3], and the potential monetary value of GI functions [33,34]. As such, AMGI requires a combination of qualitative or quantitative assessments with quantitative measures, using input from both ecological and social sciences [1,3]. In the absence of an integrated indicator framework for multifunctional GI as well as the methodology to conduct AMGI, the AMGI is inclined to be selectively conducted [35,36] and thus leads to a slow uptake of GI in practice [36,37]. Furthermore, it results in the bias that GI, as strategic planning, may address either few functions or limited dimensions of sustainability. It is crucial, therefore, to know the central indicator frameworks for GI assessment that could convey the aforementioned major aspects of the urban GI concept, while providing a methodology to undertake AMGI using an indicator framework, because such an indicator framework can only be valid and further circulated if it can be applied to various cases. We hence amalgamate central indicator frameworks and come up with our research question: How can a single AMGI be conducted using an indicator framework?
In this paper, we first analyze prominent indicator frameworks for AMGI to establish an integrated indicator framework that allows for the reflection of significant aspects of the urban GI concept: the ESS provided by GI, multiple benefits and functions of GI, as well as GI valuations towards a green economy. Based on this indicator framework, we develop an approach to undertake such an AMGI. Our aim is to introduce a new framework for GI assessment by enclosing multi-dimensional considerations for urban sustainable development. For the purpose of the illustration of our approach for urban GI assessment, we deploy the methodology in one European city, the City of Leipzig, Germany, and present the respective assessment results with all strengths and weaknesses. A cohesive, well-described assessment on multifunctional GI may stimulate further progress in developing GI strategies and adaptive evaluation methods to inform GI planning and implementation.

2. Materials

Our materials and datasets not only comprise indicator frameworks but also remote sensing data and products that bolster the potential and applications of our framework. For this reason, the underlying materials and data are twofold: one being the indicator frameworks and the other the exemplification in an urban area.

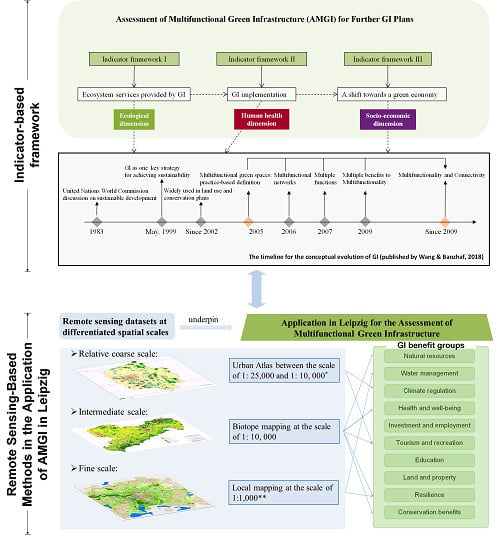
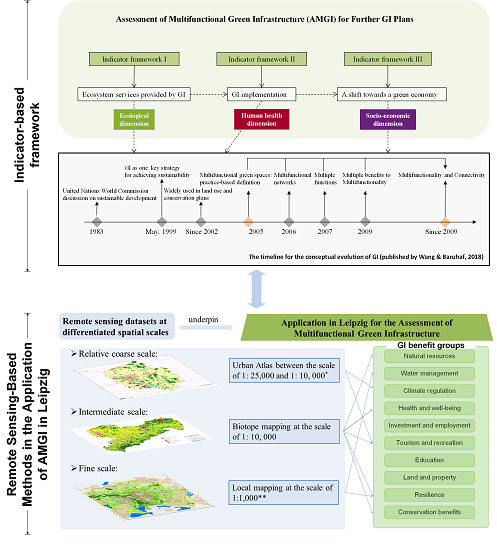
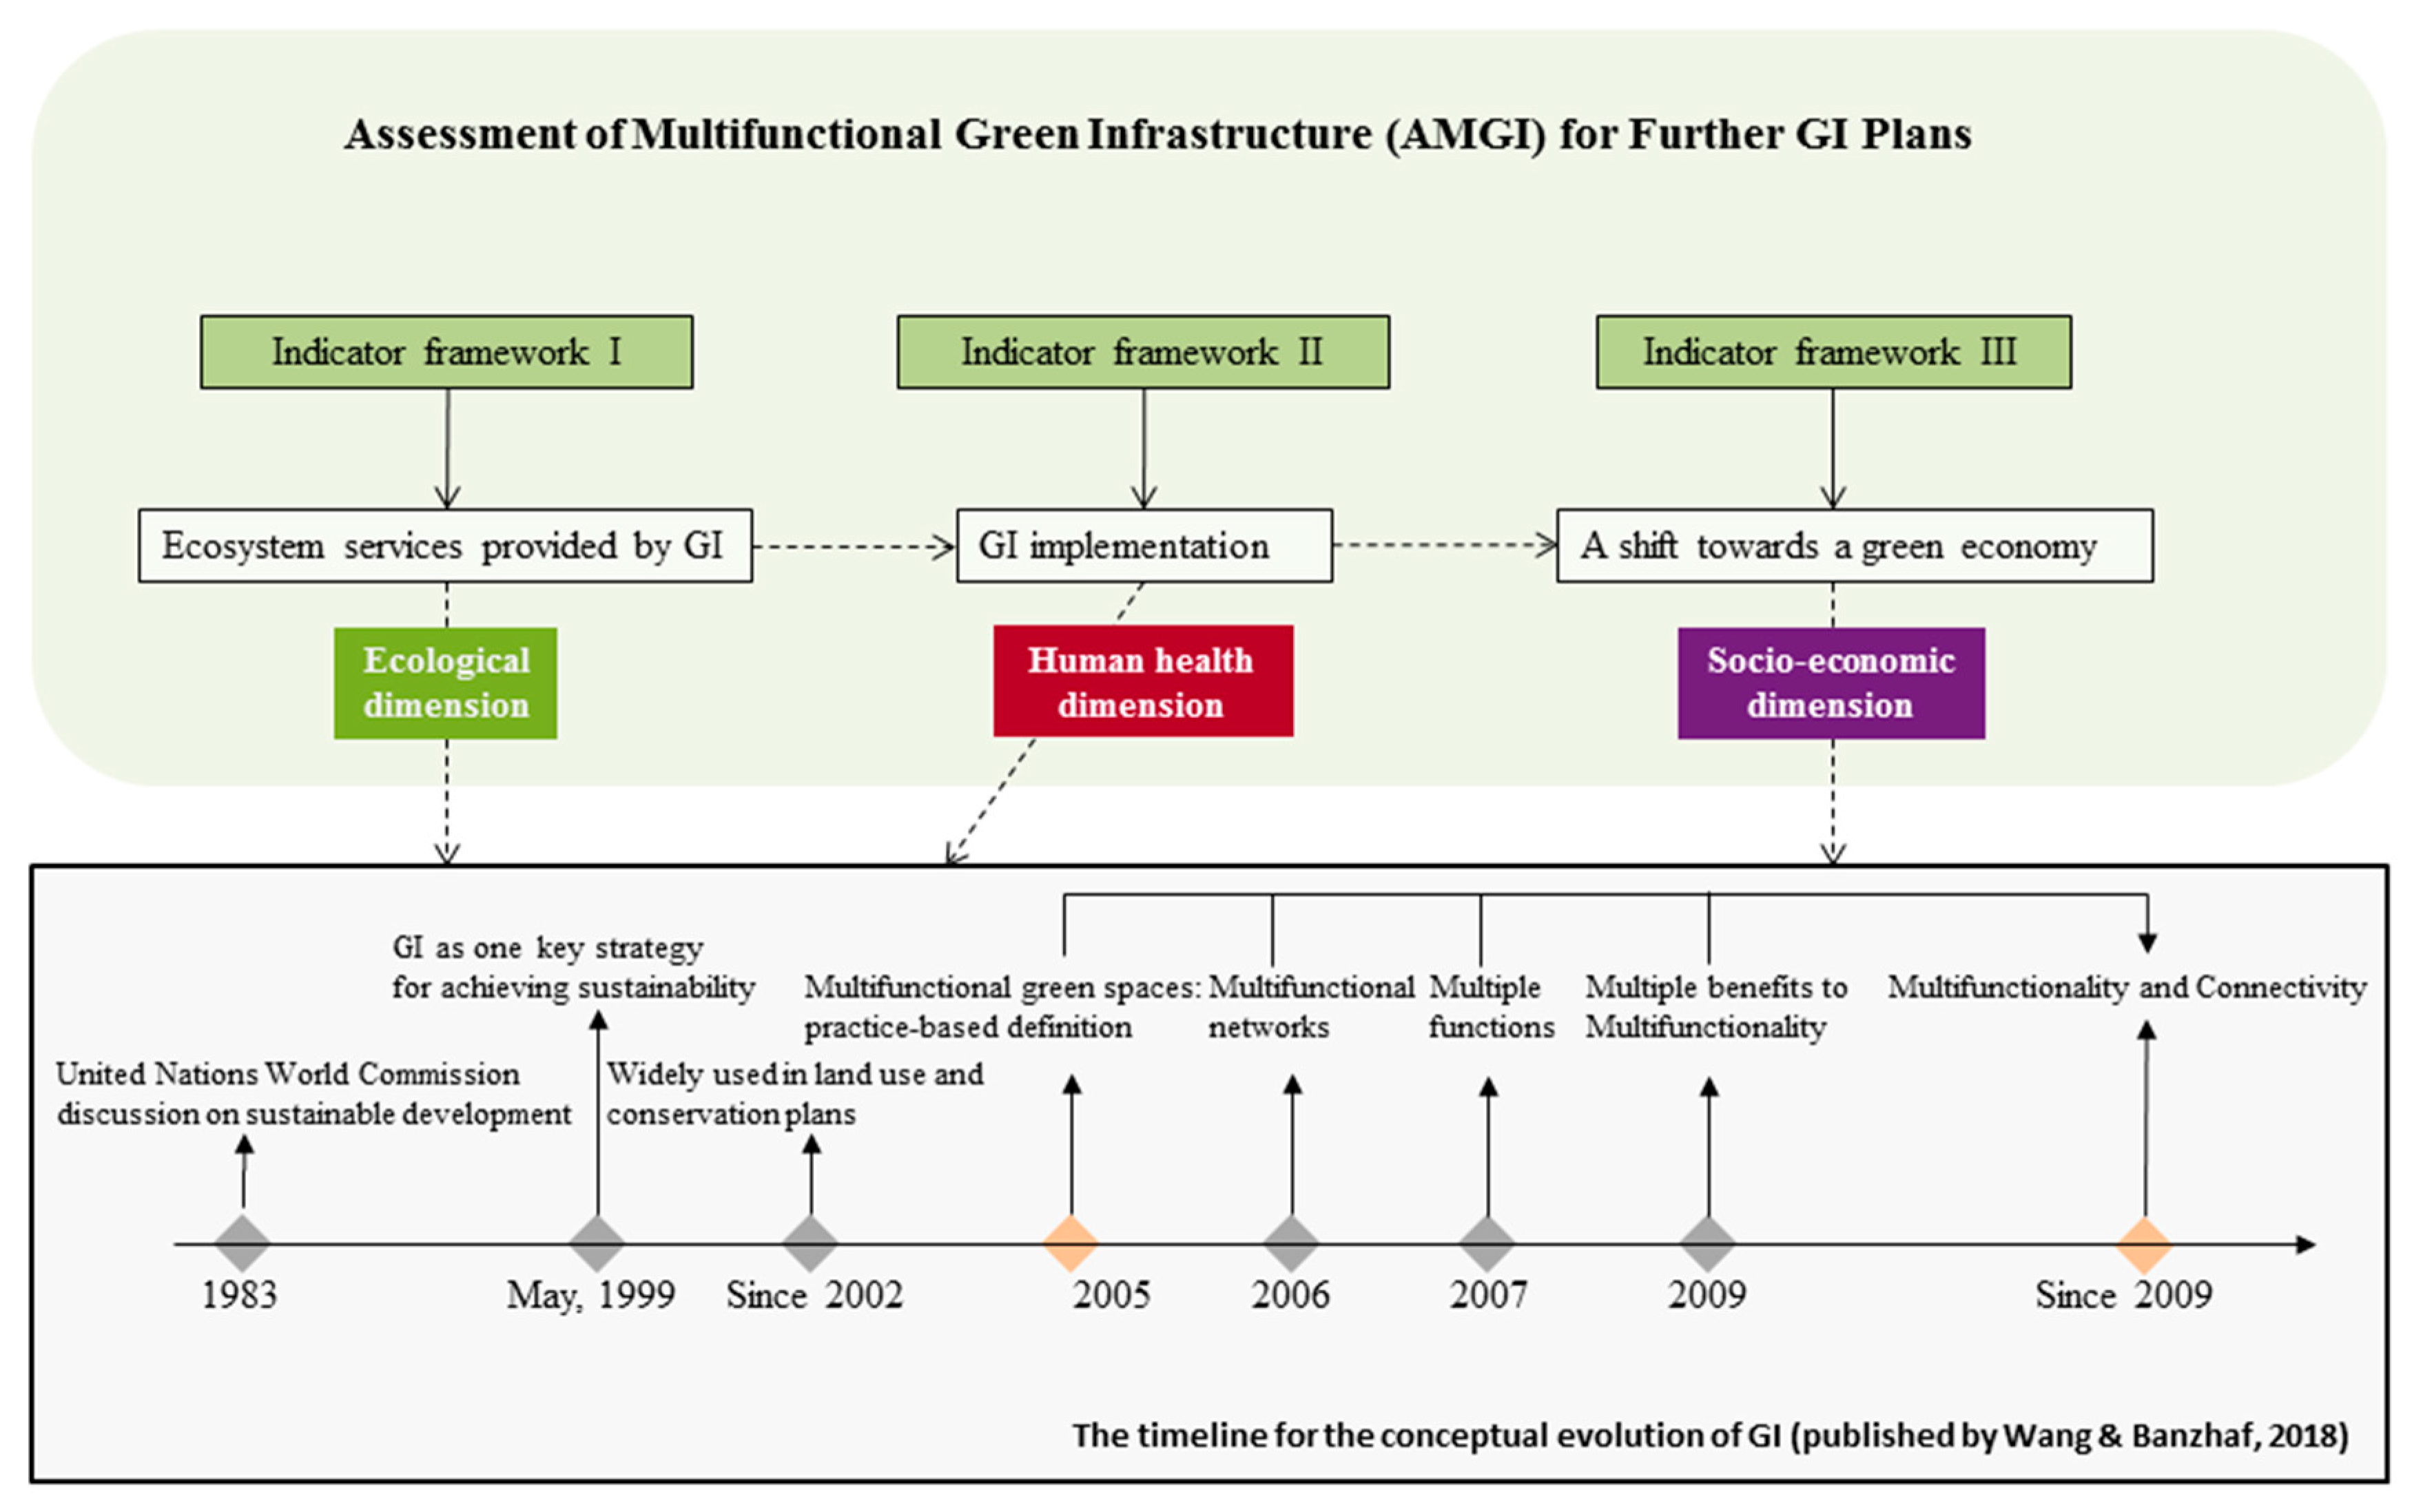
2.1. Selected Indicator Frameworks for AMGI

For the purpose of our methodology development, we selected three prominent frameworks that reflect the evolution of the GI concept (see Figure 1), while acknowledging that a great number of research has dealt with individual or groups of indicators to assess ESS (e.g., [12,38,39]). We shed light on the most noteworthy frameworks that encompass the primary aspects of GI and that were designed and applied for GI development. The selected three indicator-based frameworks (Figure 1) are:
• Indicator framework I for ESS assessment from MAES:
The indicator-based framework proposed for the Mapping and Assessment of Ecosystems and their Services in urban areas—Urban Ecosystems Forth Report (MAES, 2016, pp. 75–81) [22]. It is adapted and extracted from the Common International Classification of Ecosystem Services (CICES) with a more urban-focused purpose, namely urban GI and urban ecosystems [22].
• Indicator framework II for GI implementation from IEEP:
The indicator framework by the Institute for European Environmental Policy (IEEP) was selected since it is designed to assess various functions [2] provided by different GI types such as hedgerow, lawn/meadow, agroforestry, etc. We hereby refer to it as indicator framework II. It addresses the environmental, social, and economic benefits provided across differentiated GI types. Moreover, indicator framework II is supposed to support the assessment of urban GI that could be part of the GI strategy [40].
• Indicator framework III for supporting a shift towards a green economy from EMDA:
Supporting the transition towards a Green Economy is a major task for practitioners when putting frameworks into practice. The rationale for every GI investment requires a strict examination due to economic austerity [21,32,33]. The indicator framework III underscores the economic valuations of GI. We hence include indicator framework III, as it emphasizes the economic dimension of GI. It was first established in 2008 by the East Midlands Development Agency [25,41] and expanded the benefits of GI by initiating the awareness of its economic values [33,42]. It is then appreciated in the study of Green Infrastructure Implementation and Efficiency [2] to support the development of Green Infrastructure Strategy in cities. The EMDA addresses the economic valuation of GI as quantitative benefits to include the monetary aspect into GI assessment [26].
Given that indicator framework I emphasizes the ESS provided by urban GI; indicator framework II provides multiple GI benefit groups and incorporates human health aspects; indicator framework III adds to these frameworks by its focus on indicators for the economic valuation of GI benefits, they are selected as prominent frameworks for AMGI.

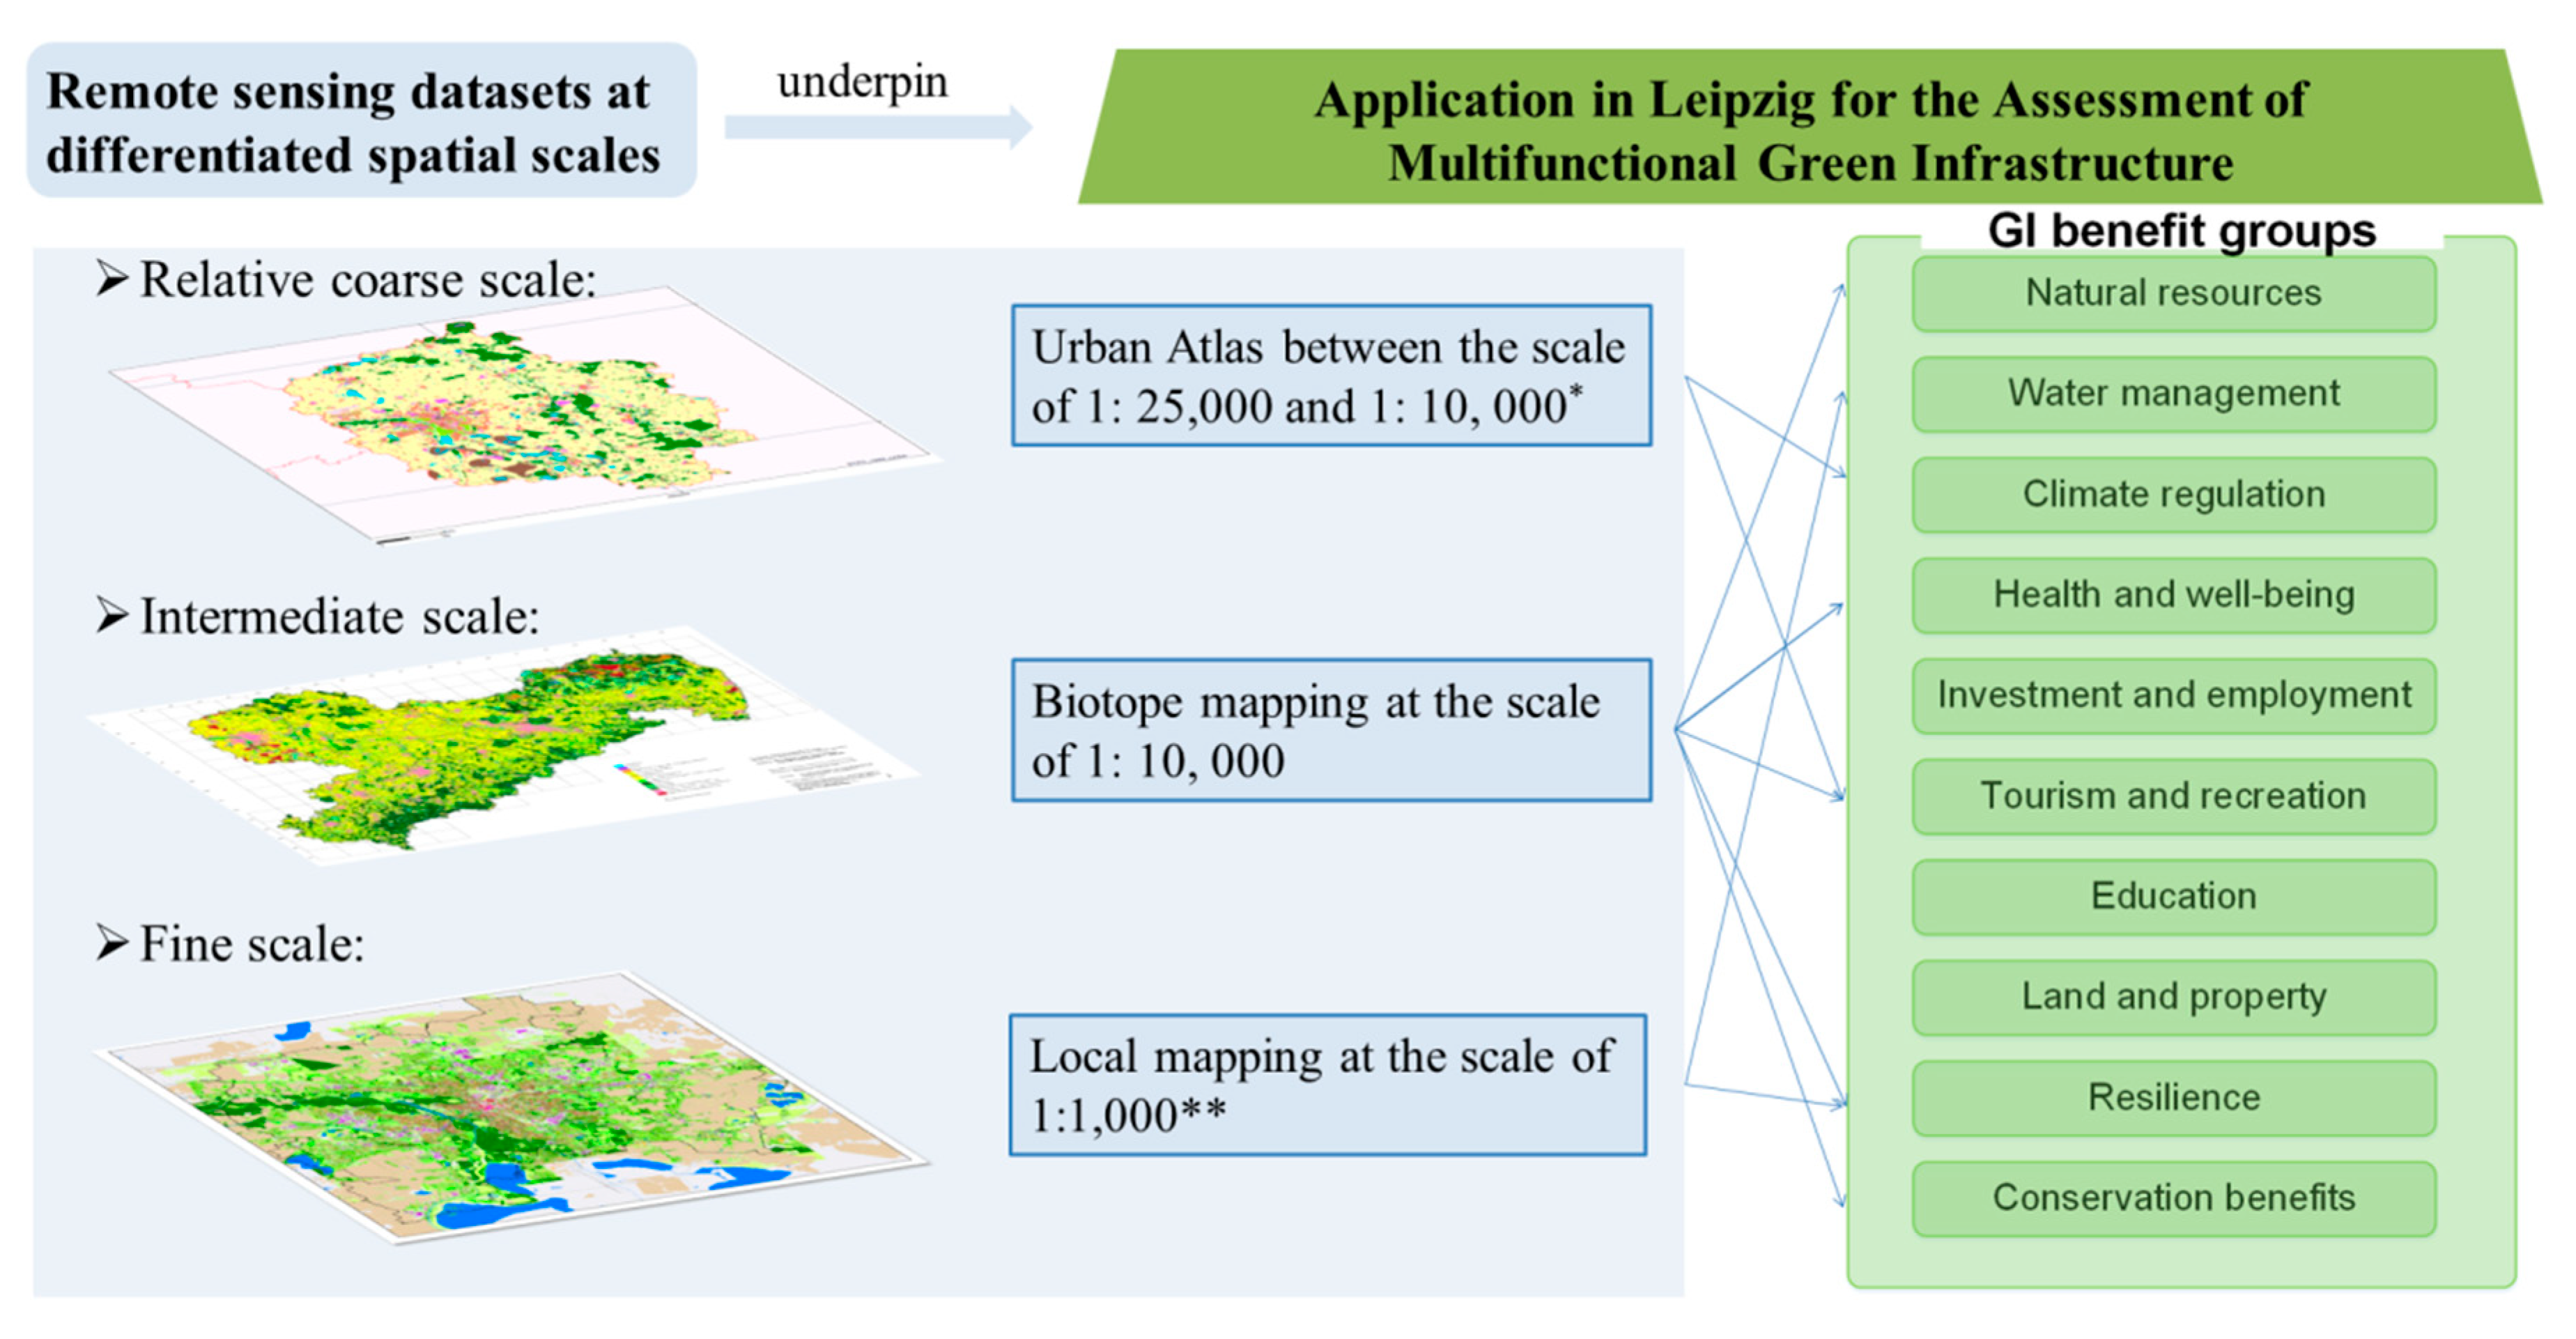
2.2. Remote Sensing Techniques as Essential Pillars for AMGI

At multiple scales, remote sensing plays a significant role for spatial analysis and thus also for our comprehensible methodology (Section 2.3) to undertake an AMGI. Since one single layer of earth observation data seldom provides the overall information on urban GI [4,43], analyzing the urban area at multiple scales by exploiting various Remote Sensing (RS) data is an excellent opportunity for the multifunctional GI assessment since these functions need to be understood at respective scales. Earth observation provides overall information on urban GI through the synergetic usage of different sensors [4,43]. Furthermore, indicators enclosed in the indicator framework are mostly based on remote sensing techniques. In order to extend applications of our indicator framework, we shed light on the significance of using multi-scale RS data.
In Europe, RS products for AMGI can be obtained at different scales: (i) at regional scale: the vector-based dataset Corine Land Cover (CLC) for 1990, 2000, 2006, 2012, and 2018 as well as the High Resolution Layers (HRL) which enclose categories such as forests, grasslands, imperviousness zones, permanent water bodies, and wetlands (raster-based as complementary to CORINE (Coordination of Information on the Environment) Land Cover datasets). Both of them cover Europe entirely, showing great advantages through regular updates (every six to 10 years); (ii) at the national level: e.g., Natura 2000 (N2K) for 2006 and 2012 across 28 EU nations; (iii) at the state or municipal level: e.g., Urban Atlas (UA) datasets and biotope mapping (based on aerial photography and ground investigations of individual habitats). For biotope mapping, internationally, there is a rising number of biotope mappings in countries such as South Korea [44], Turkey [45], China [46], and Norway [47]. For a country like Germany, where the biotope mapping has had a long-standing tradition of more than 45 years, RS orbital and aerial images are of great value, because they support the classification system of biotope types at one point in time over a large space. Thus, diversified sites and biotopes in urban areas are mapped and undergo long-term monitoring [48]. In Germany, biotope mapping is widely used for policy making with its long tradition in landscape planning and management [49]. For this reason, different satellite and aerial sensor systems may serve to enhance the potential applications of our indicator framework and methodology for AMGI. Multispectral orbital sensor systems like Landsat, Sentinel, Spot, Rapid Eye (30 m, 20 m 6.5 m ground resolution, respectively), and aerial camera systems (40–20 cm ground resolution) that take digital color-infrared orthophotos provide significant support for AMGI. Both their regular uptakes and the choices they offer for image analyses, with their various spatial resolutions to investigate urban structural compositions and undertake mapping and monitoring procedures, are important inputs. The AMGI can select the respective RS datasets with their exquisite spectral information from visible to near and shortwave infrared to identify GI types according to their spectral traits in urban areas. Thereby, more interrelations among different GI functions can be incorporated [4]. That is to say, these earth observation datasets are spatially explicit prerequisites for deriving indicators of multiple GI functions and thereby contributing to the AMGI. AMGI will benefit from multiple spatial scales and spectral information for which we only give limited insight into RS datasets in this paper. More research in the field of RS is being performed to merge very high resolution imageries with digital elevation and surface models for three-dimensional (3D) urban mapping [50] and GI assessment [3].

2.3. Earth Observation Datasets for the Exemplification in Leipzig, Germany

Three earth observation datasets have been used in our illustrative case of Leipzig:
(1)
The land-cover data originated from the European Urban Atlas land cover dataset—Copernicus Land Monitoring Service [50]. It was obtained from the European Environment Agency (EEA, http://www.eea.europa.eu/data-and-maps/data/urban-atlas). For the first time slot, Urban Atlas data (2006) [1] conveys 305 larger urban zones (including commuting zones around cities) in the 27 countries of the EU for all the European core cities and respective larger urban zones with more than 100,000 inhabitants. Its products are combined image classifications with 20 m (shot-wave-infrared (SWIR) mode) to 10 m (near-infrared (NIR) and visible spectral) multispectral analysis for urban GI, being pan-sharpened to 5 m to 2.5 m spatial resolutions. The more recent slot, i.e., UA data for 2012, covers all European cities with a minimum of 50,000 inhabitants. Our application in Leipzig used the Urban Atlas data from 2012 [50].
(2)
The Leipzig biotope mapping (2005) [51] extracted from the biotope map of Saxony. It is similarly structured to the Urban Atlas, as it includes both human-built classes as well as natural and semi-natural classes [51]. However, the data set is derived from 1:10,000 color-infrared orthophotos by the manual classification of biotopes with a minimal area of 0.25 ha [51]. This thematic information was produced by the “Sächsisches Landesamt für Umwelt Landwirtschaft und Geologie” (2008) [51]. Its classification system of biotope types gives abundant information on diversified sites and biotopes in urban areas [48]. Biotope mapping characterizes cities, especially urban areas, as a complex habitat mosaic [52], which are made up of various sub-units and forms. They are major components of our evaluating objects. This premise permits that its classification of urban spatial categories and matrix-patches mapping [53] may extensively facilitate the identification of several GI features such as deciduous forests and zoological gardens; whereas other datasets like Corine Land Cover cannot provide sufficient information on urban GI, due to their coarse spatial resolution or relatively rough taxonomy.
(3)
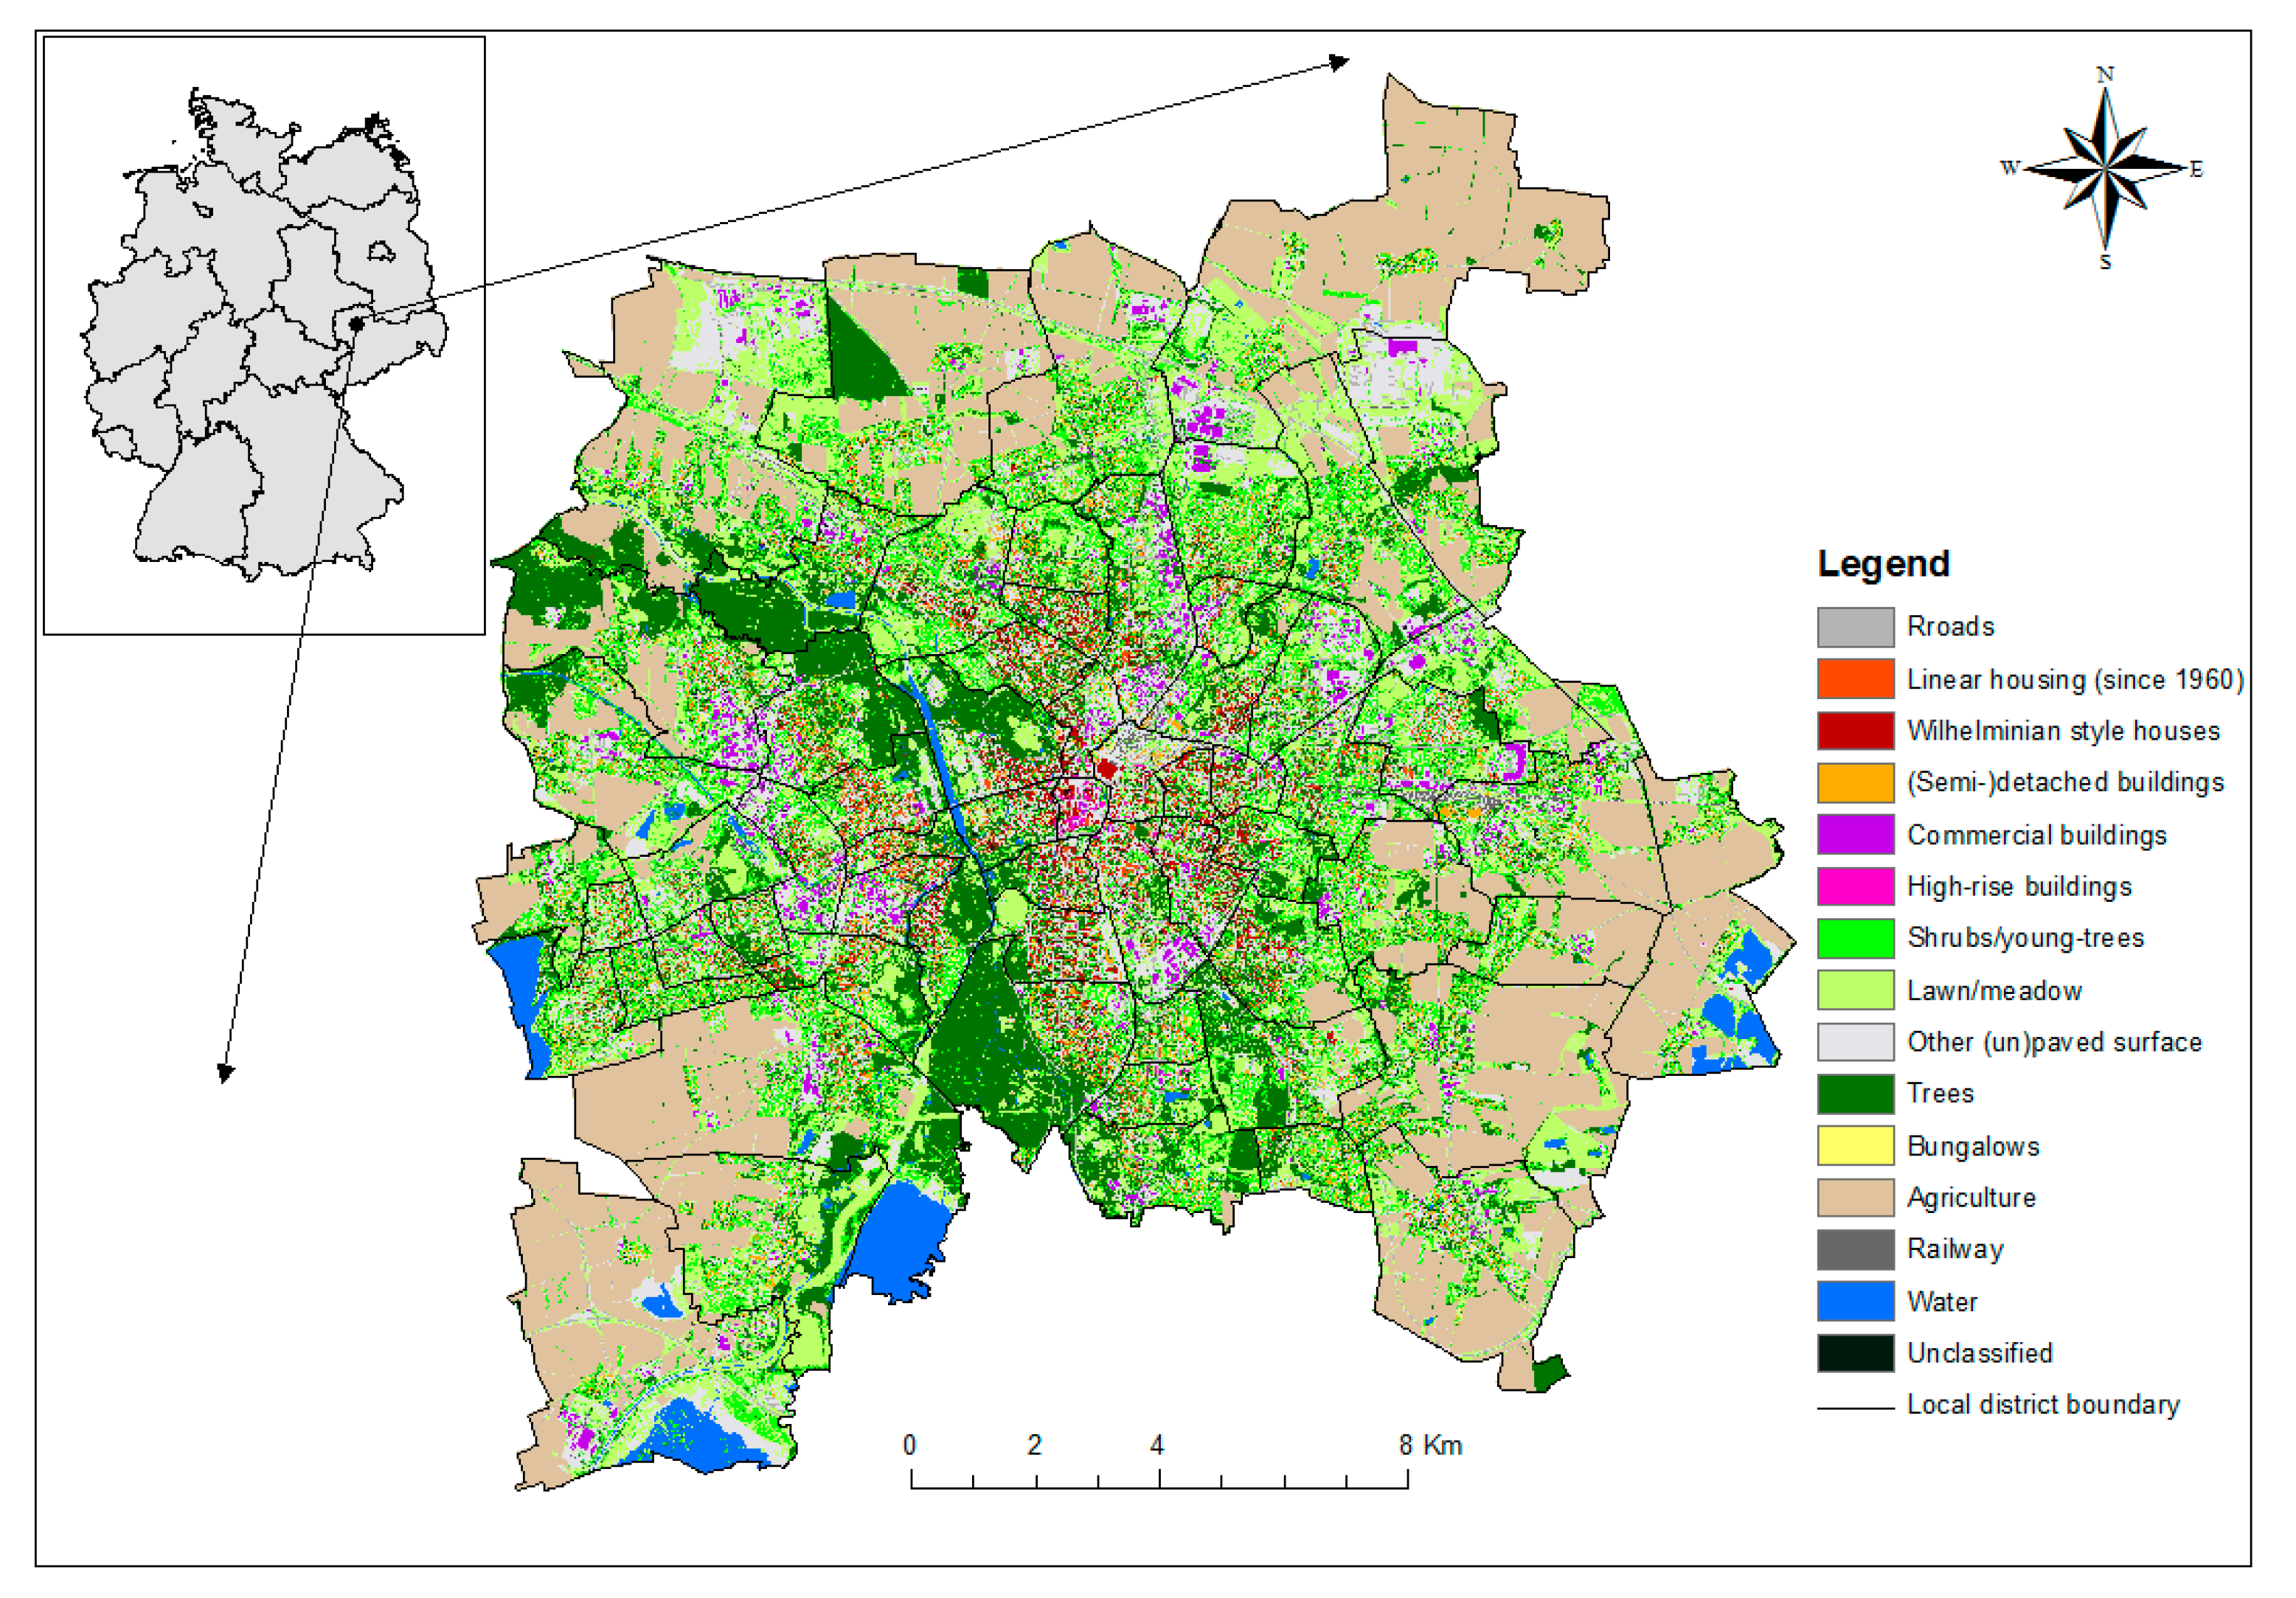
The local Land Use and Land Cover (LULC) structural analysis for Leipzig in the year of 2012 [54,55]. To gain the spatial information on urban LULC at a very high resolution, we employed four-band color infrared digital orthophotos (DOP), a digital elevation model (DEM), and a digital surface model (DSM). These datasets were processed by an Object-based Image Analysis (OBIA) approach. The complex methodology of this OBIA mapping process is depicted by Banzhaf et al. [43,54], in which the different datasets were all rescaled to 1 m ground resolution for the year 2012. As for the demographic data, we employed the population data for 2012 collected by the city council [56], which includes all urban residents with their first and second place of residency in Leipzig. By including those with a second residency, we also pay tribute to international students, commuters, etc., which best generates a picture of the real users. The respective usages of the three aforementioned earth observation datasets can be also found in following Table 2 (see Section 3.3).

3. Methods

The methodology section comprises the analysis of indicator frameworks and the other for the integrated framework application in Leipzig.

3.1. Analysis Method for Selected Indicator Frameworks

In the following, each indicator from these indicators frameworks is scrutinized with regards to (1) relevant spatial extent, (2) involved GI types (service provision units), (3) data availability, (4) their information regarding GI assessment (e.g., data sources and references/proven methods), and (5) whether it is a supply indicator or a demand indicator, by means of reviewing each indicator from its source listed in the respective framework (from the MAES, IEEP and EMDA) as well as other potentially updated studies in the Web of Science, Scopus, and Google Scholar databases.
Since indicator framework I only follows the structure provision, regulation and maintenance, and cultural ecosystem services, we have to classify all indicators into those ten GI benefit groups to allow for further comparison with the other two frameworks in the following sections. For classification reasons, we use the definitions of each GI benefit from indicator framework II and III. The corresponding relationships between ESS (provisioning, regulation and cultural services) and GI benefit groups are listed in Table 1 (code numbers refer to the respective indicators in Table A1).
Whenever the specific purpose of one of these 40 indicators was not clear or related to more than one dimension, we traced it back to its source and compared it carefully with the definition of relevant ecosystem services in CICES V5.1 [57] (the latest version released on January 2018) and the second [18] and forth [22] reports of MAES: Indicators for Ecosystem Assessments under Action 5 of the EU Biodiversity Strategy to 2020 and Urban Ecosystems. Apart from tracing back the framework as such, we also reviewed each indicator one by one concerning their reference sources to understand with which dimensions the respective indicator has addressed sustainability.
The structure transformation of indicator framework I facilitates its further comparison with the other two frameworks, since both indicator framework II and indicator framework III have already been sorted out as 10 GI benefit groups by Mazza et al. [2].

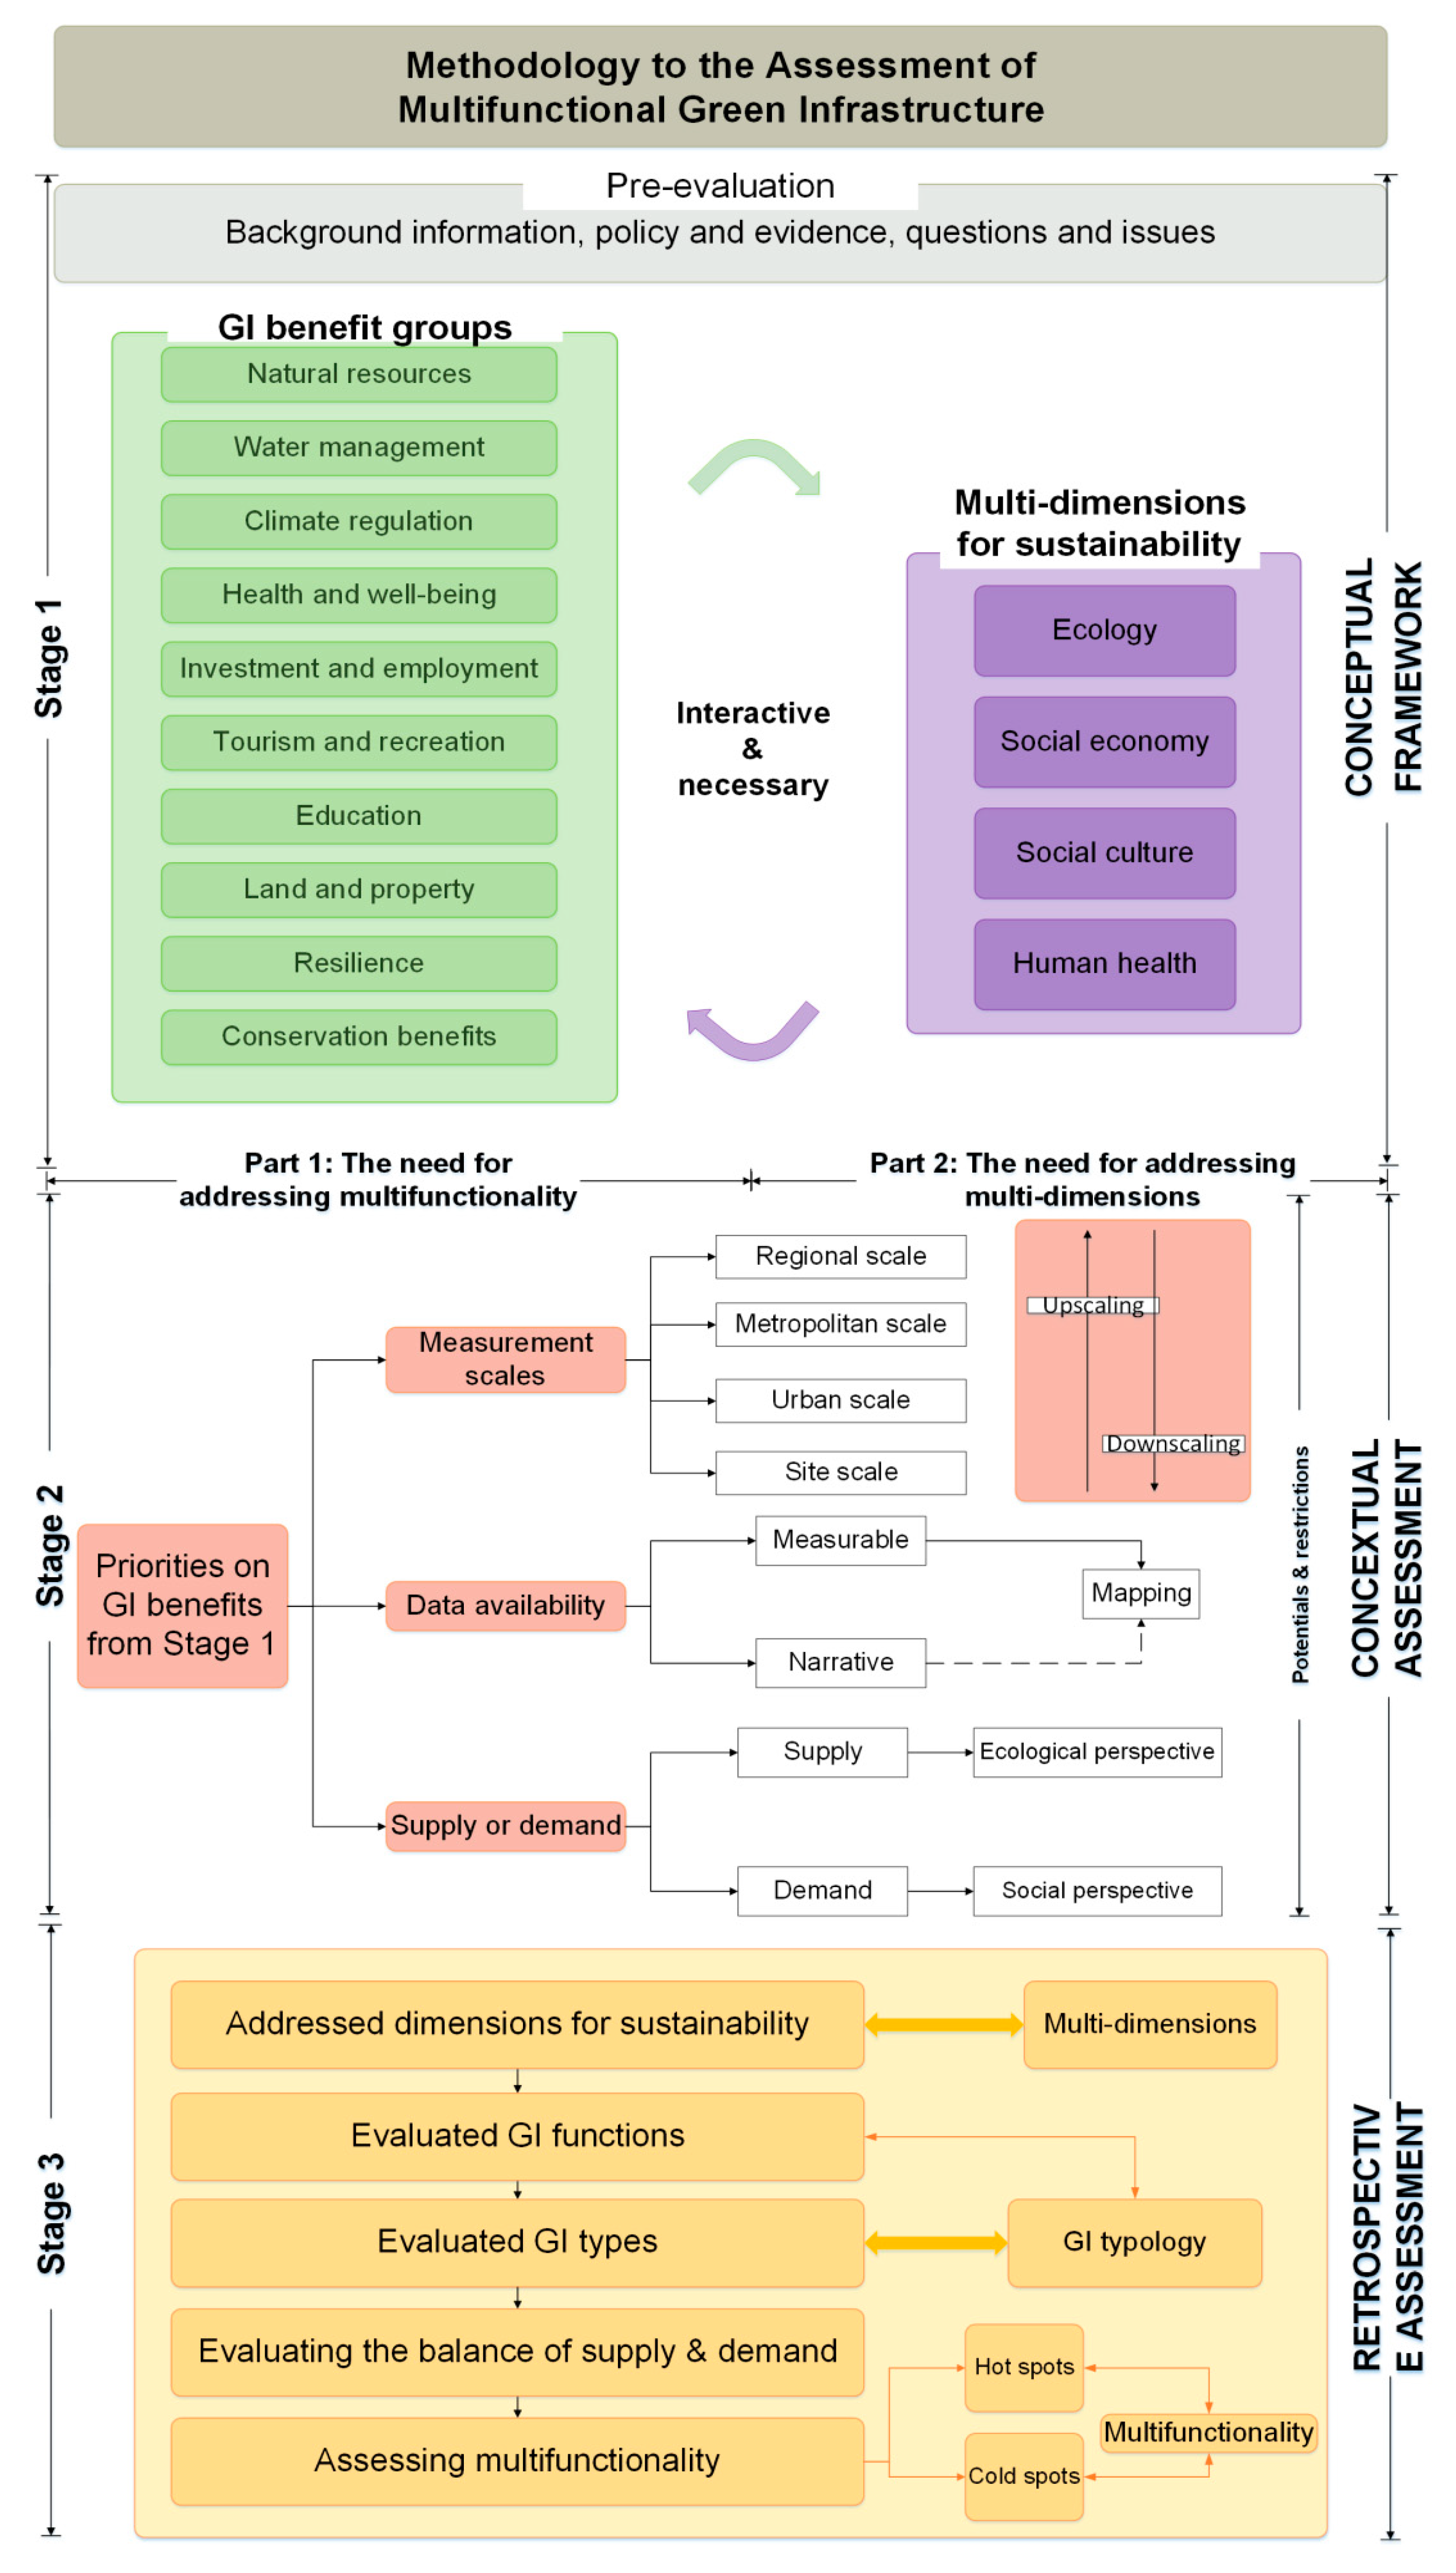
3.2. Methodology Application of the Indicator Framework for AMGI

Conducting an AMGI at multiple spatial scales is important to fully capture the benefits of GI and to understand the interlinkages between GI at these scales. Our selected frameworks I to III were organized by 10 GI benefit groups in Figure 2, through which we may develop our methodology to AMGI. These 10 benefit groups are defined in the GI by Mazza et al. [2].
Both the GI benefits and multi-dimensions of sustainability comprise the main content of conceptual framework. The background information for the collection of respective policy and evidence as well as research questions and planning issues in case studies are the first step of AMGI as the pre-evaluation for an AMGI. Furthermore, the reinforced pillars towards sustainability [13] comprise the dimensions ecology, social economy, social culture, and human health, and are also addressed in our approach. All of them underpin the pre-evaluation and priority settings.
However, it requires great effort to do the entire assessment at all scales simultaneously, since a large number of aspects (see Figure 2) should be considered: one has to prioritize focal scales depending on the purpose of the use of indicator-based framework. Is it to support a city-wide strategy or is it for planning tools at more detailed levels? Which criteria are vital, which spatial extent is meaningful, which data is available, or what have been investigated for an AMGI (either supply or demand of GI)? Conducting such an assessment is an intricate process, and therefore, we developed an integrative approach that allows us to derive three stages of evaluation, illustrated in a methodological workflow (Figure 2).
As Figure 2 shows, there are three stages while conducting an integrative assessment on multifunctional GI. They are:
(1)
Stage 1: for priority setting, there are needs for addressing multifunctionality and the multi-dimensions of sustainability.
As a prerequisite of this stage, the key strategy and policy documents on spatial planning ought to be assessed as evidence for priority settings. At this first stage, users of an indicator framework should figure out their needs from two aspects. First, they should decide on the needs for addressing multifunctionality. Users could select the priorities of GI functions from our ten benefit groups (in the green box: from natural resources to conservation benefits). Second, it is suggested to be aware of the addressed multi-dimensions for sustainability (in the purple box: ecology, social economy, social culture, human health dimensions). Multi-dimensional analysis can be completed referring to the advice we provided in Table A1, Table A2 and Table A3. In this conceptual framework phase, the emphasis on the multiple GI functions and multi-dimensions are interactive and necessary.
(2)
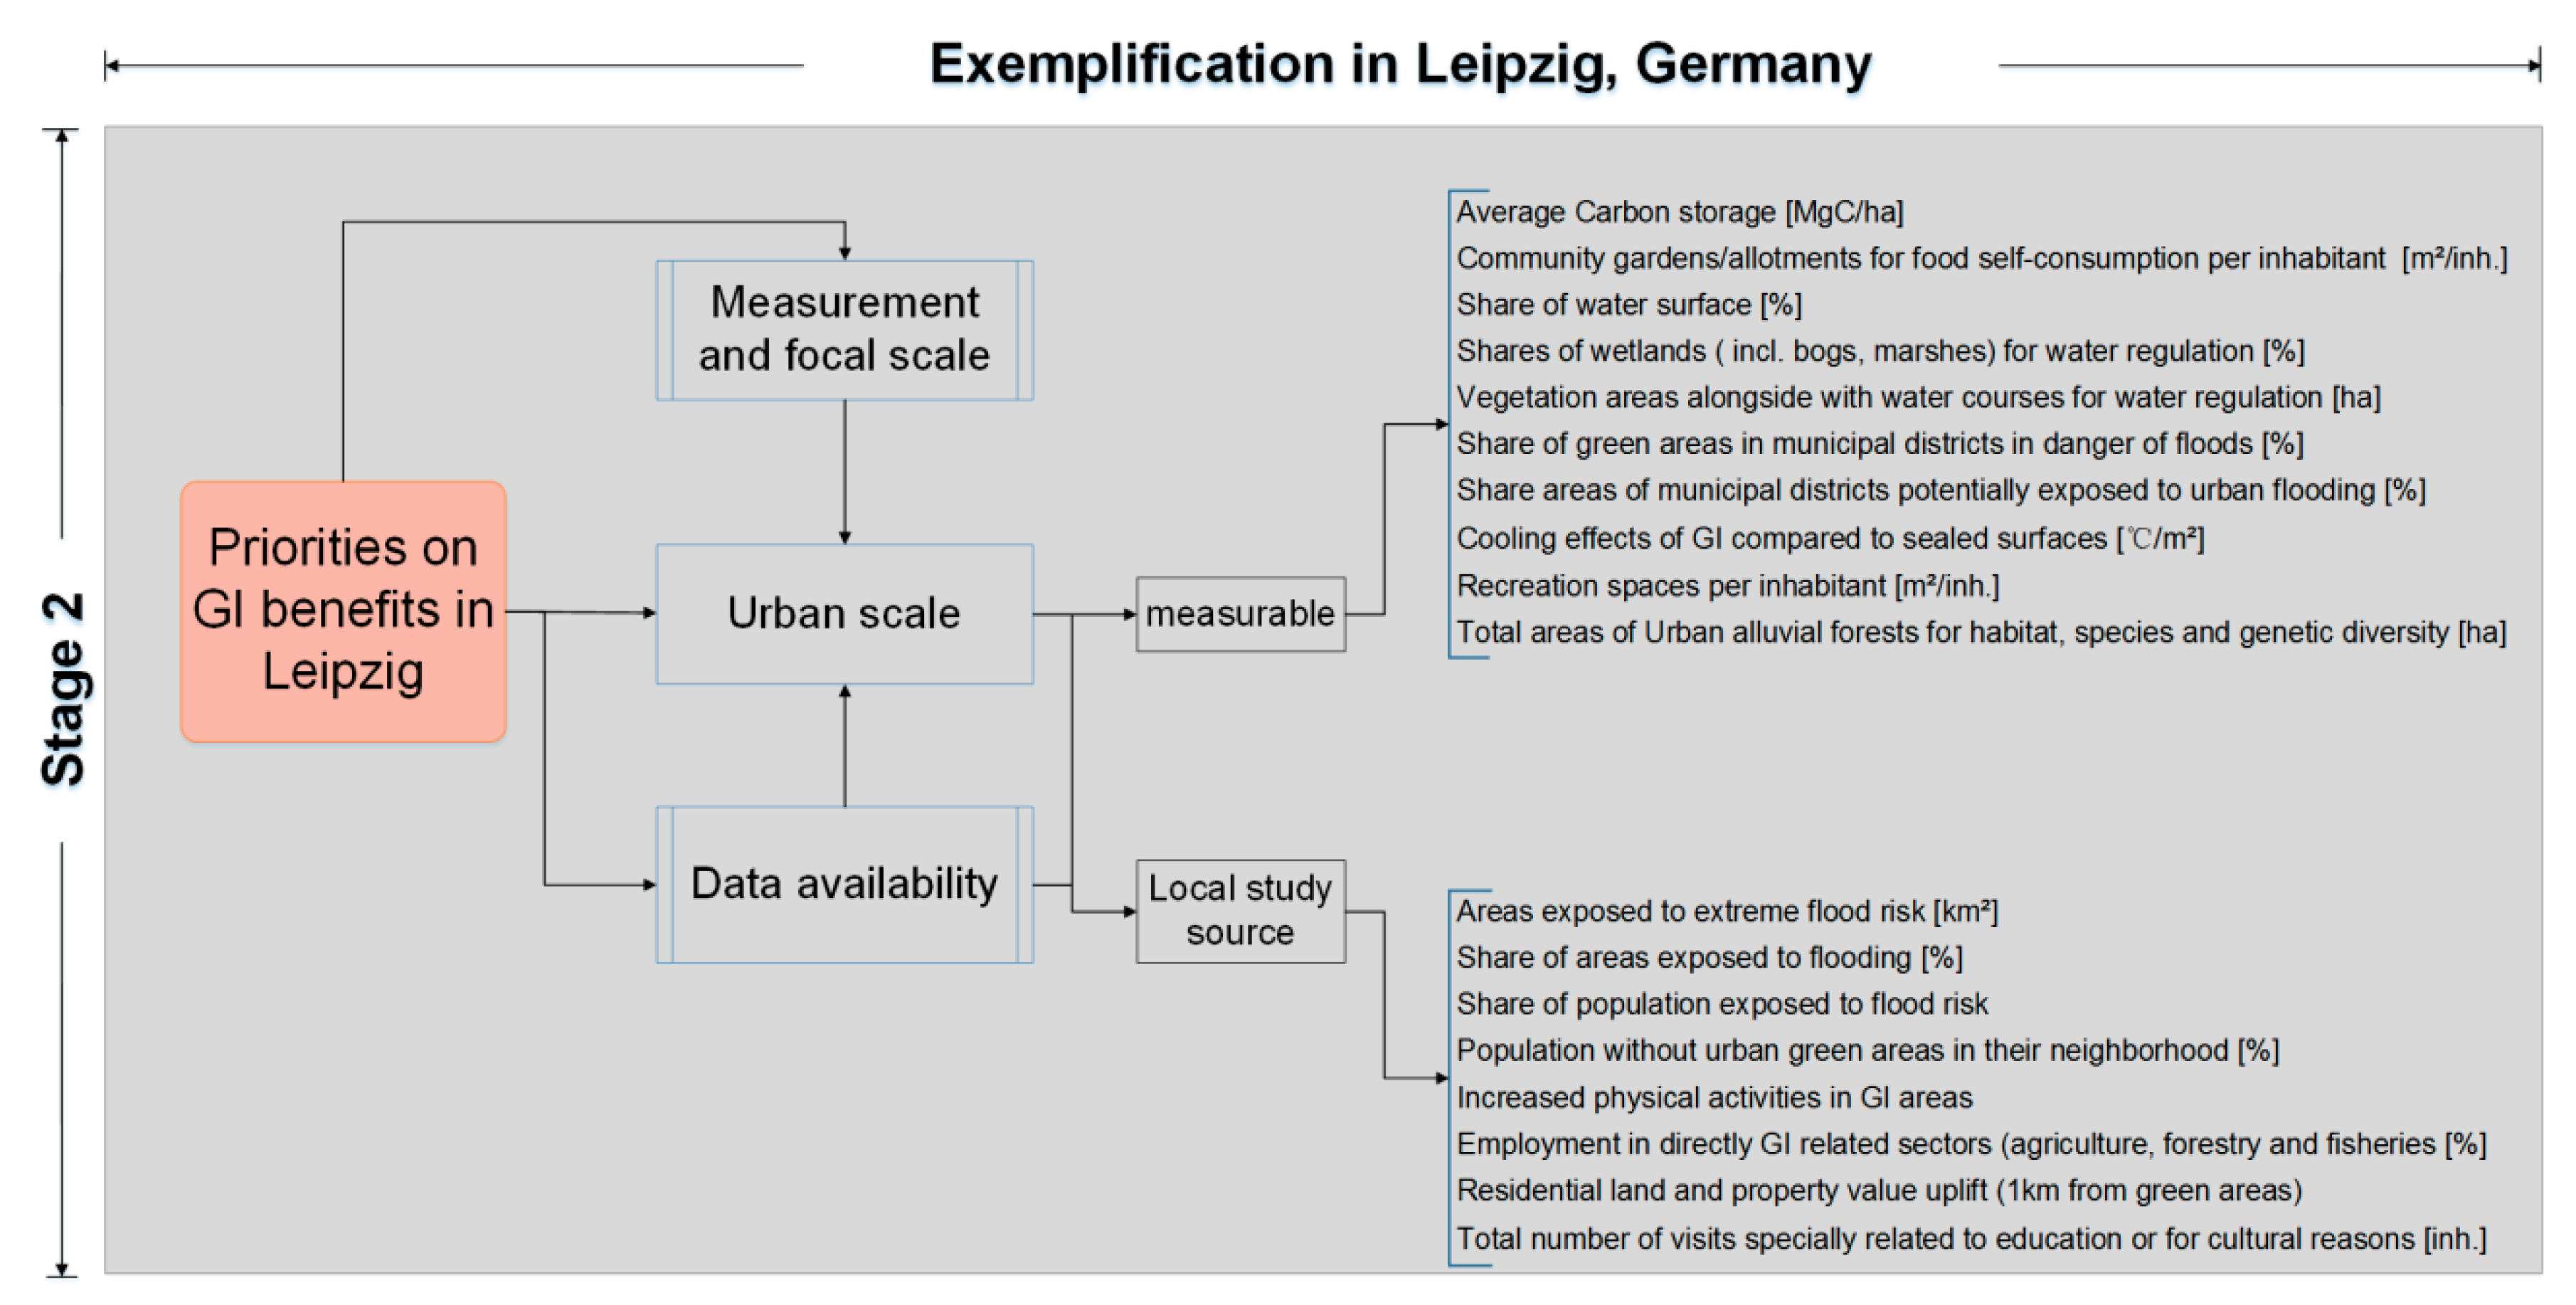
Stage 2: for contextual assessment, there are needs to frame the indicator selection
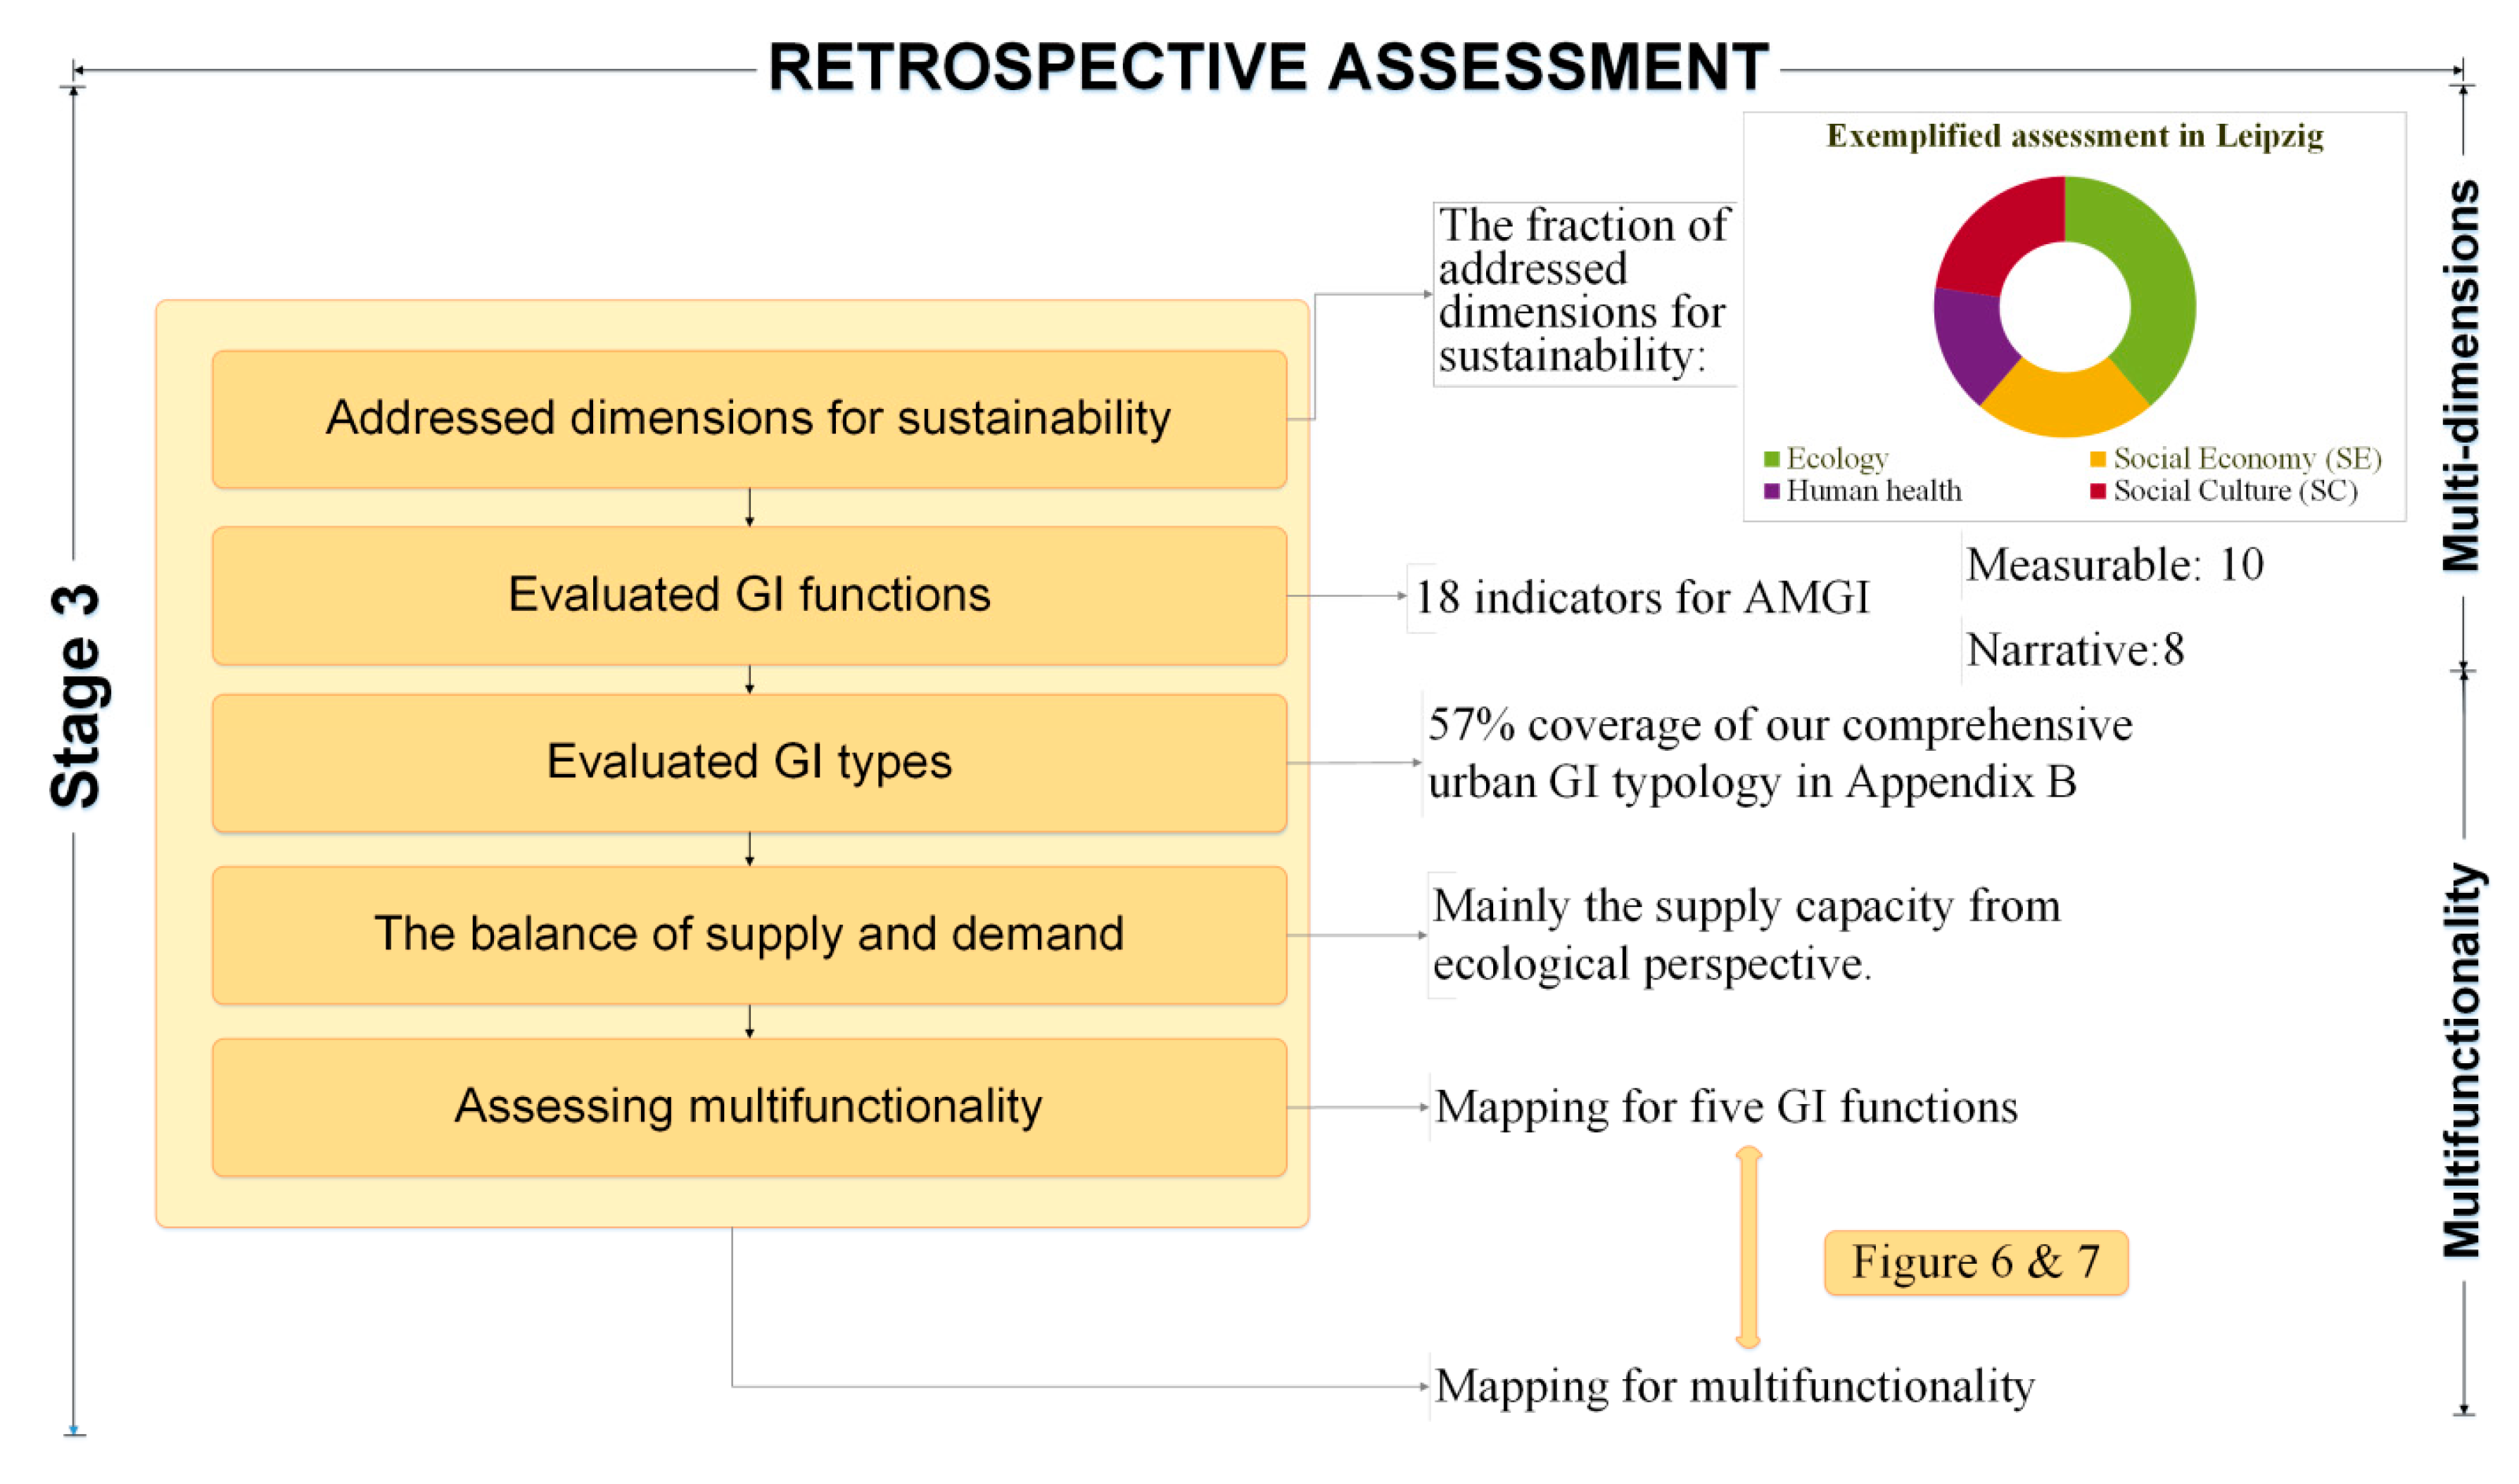
Once we have the priorities of GI functions and aimed dimensions for sustainability, there will be three key factors on indicator selection (in the red color box). They are determinants for users’ decision-making. To facilitate the decision-making while using our integrated framework, we provide related information in the Supplementary Materials. This information is not as comprehensive as to be applicable to all situations, because the selection of indicators depends on the research question, cultural context of the case study and related data availability. However, it still provides evident references and useful methodology that are of great significance.
In Stage 2, there must first be a scientific understanding for which spatial scale(s) is/are vital when assessing GI functions—focal scale. In our approach, we provide advice on four scales for spatially explicit indicators as references: regional, metropolitan, urban, and site scales (see the synthetic analysis in Supplementary Materials Text S1). For the purpose of covering integrative GI functions, GI assessment can be conducted at multi-scales, as long as users are aware of the potentials and restrictions (see Stage 2 in Figure 2). Due to indicator selections, these potentials and restrictions might be in the process of upscaling or downscaling, as well as limited by data availability in respective contexts. It is understandable to use the narrative method (qualitative assessment) to describe the GI functions or indicators when there is a lack of data in contextual assessment, or including upscaling or downscaling indicators as proxies. Although there is a thorough understanding of the balance between supply and demand, it might be vital for the sake of the study just to focus on one of the two aspects.
(3)
Stage 3: for retrospective assessment, there are five major elements/components being advised to be evaluated again to exploit the multifunctionality of GI in depth.
These five elements correspond to five procedural questions for retrospection. They are: which kinds of GI functions have been evaluated? Another question deals with what kinds of GI types have been involved in the stage of contextual assessment compared to our comprehensive GI typology (see Appendix B, ordered by the intensity of human influence on GI), which is adapted from the urban GI Components Inventory from the Green Surge project [58]. Overall, through which dimensions has sustainability been addressed? What is the balance between supply and demand indicators in the particular contextual assessment? It is still scientifically sound that in the end evaluations could not reach a good balance due to limited data availability? It could be acceptable on the condition that the extracted results are well distinguished by either referring to the supply or demand of ESS. After completing the above-mentioned analysis, users are able to conclude the evaluated GI functions, their relationships with involved GI types, and the addressed multi-dimensions, and thereby figure out the multifunctioning GI in respective contexts.
To better understand and visualize the multifunctionality of GI, we suggest using measurable indicators in Stage 2. Using those, GI functions can be overlapped to explore whether one spatial unit provides multiple GI functions at the same time. These areas could be defined as multifunctional GI. The areas with three or more types of functions [59,60] could be defined as multifunctional GI hotspots using the method by Peng et al. [59] In other words, those units, e.g., grids, with three or more GI functions spatially form a range of high possibility clusters of GI functions.
To have insights into each GI function, we also recommend identifying the hot and cold spots of evaluated GI functions from Stage 2 in a respective contextual assessment. Therefore, one new index, namely the Getis Ord Gi* statistics, as one of the most widely used indicators of local spatial autocorrelation [59,61,62,63], is advised to detect the spatial aggregation of each GI function in terms of their spatial weight matrix, by identifying the respective GI within values higher than others as the hot spots and significantly lower than others as cold spots:
G i * ( d ) = i = 1 n w i j ( d ) x j / j = 1 n x j
Gi* can be used to characterize the GI functions and their spatial correlations with the neighboring areas at a defined distance. In this equation, wij is symmetrically normed from one to zero as a spatial weight matrix, with one for all grids at a given distance d of cell i including the cell i itself, and zero for the other grids. In this case, the numerator is the sum of all the values of specific GI functions associated with the grids at the distance d of cell i, whereas the denominator is the sum of all the values of specific GI functions associated with all the grids. Gi* can be standardized as follows:
Z ( G i * ) = G i * E ( G i * ) Var ( G i * )
where E(Gi*) and Var(Gi*) are the mathematical expectation and variable coefficient of Gi*, respectively. For a grid, a significantly high positive Z score indicates that the values of its neighborhood grids are higher than the average with an apparent spatial concentration at a certain distance [61,62]. A Z score near zero refers to spatial dispersion. According to the indication of the Z score, the hot/cold spots of each GI function can be identified.

3.3. Remote Sensing-Based Methods in the Application in Leipzig

As preprocessing procedures for the AMGI in Leipzig, the Urban Atlas dataset (2012) [50], the biotope mapping (2005) [51] and local LULC dataset (2012) [54,55] were transformed into Geographic Coordinate System – European Terrestrial System – 1989 (GCS-ETRS-1989) with the Universal Transverse Mercator project (UTM-Zone-33N), given the small distortion and the popularity of the UTM system and the possibility of international comparison. All these georeferenced RS datasets were used to identify the enclosed GI features, thereby deriving respective indicators of various GI functions (Table 2). Based on these RS data, an overlay analysis of multifunctional GI areas was further undertaken to recognize the hot/cold spots areas. For the spatial analysis and methods for the identification, we followed the steps introduced in Section 3.2.
In the application of Leipzig, as shown in Figure 3, the Urban Atlas dataset (2012) [50] was used to obtain information on the population without urban green spaces within 500 m in their neighborhood using the RS-based method proposed by Poelman [64]. It was also used to resample the remotely sensed thermal data in Leipzig to evaluate the cooling effects of GI using the method introduced by Schwarz et al. [65]. In their paper, the thermal data refers to the land surface temperature acquired during the two overhead flights on 22 (7:30–9:00 p.m.) and 23 (5:00–6:30 a.m.), in September 2010 at 2000 m above the ground, within a spatial resolution of 5 m [65]. Substantial contributions to our application can be attributed to the biotope mapping (Figure 3), through which we could identify various GI types, urban recreational areas such as zoological and botanical gardens etc. to obtain respective indicators for the assessment of GI functions. As for the local LULC dataset, it was employed to assess GI benefits in water management, by providing its higher accuracy on the identification of water areas and green areas along with water courses.

4. Results

In this section, we analyze the three aforementioned prominent frameworks I to III according to their structures, benefit groups, and data availability, as well as respective qualitative and quantitative measurements. To do so, we classified the different indicator frameworks with respect to the four central dimensions. The results for the multi-dimensional analysis are illustrated for each framework in the respective Appendix A. Furthermore, the relevant spatial extents of the indicators in each indicator framework are analyzed and depicted in the Supplementary Materials Figure S1. In order to understand if there is a kind of balance between supply and demand indicators, we examined their share in each of the frameworks as well, as shown in Figure S2.
In the following, we will first present our analytical results for each of the frameworks and then provide the synthesis in integrated framework for AMGI.

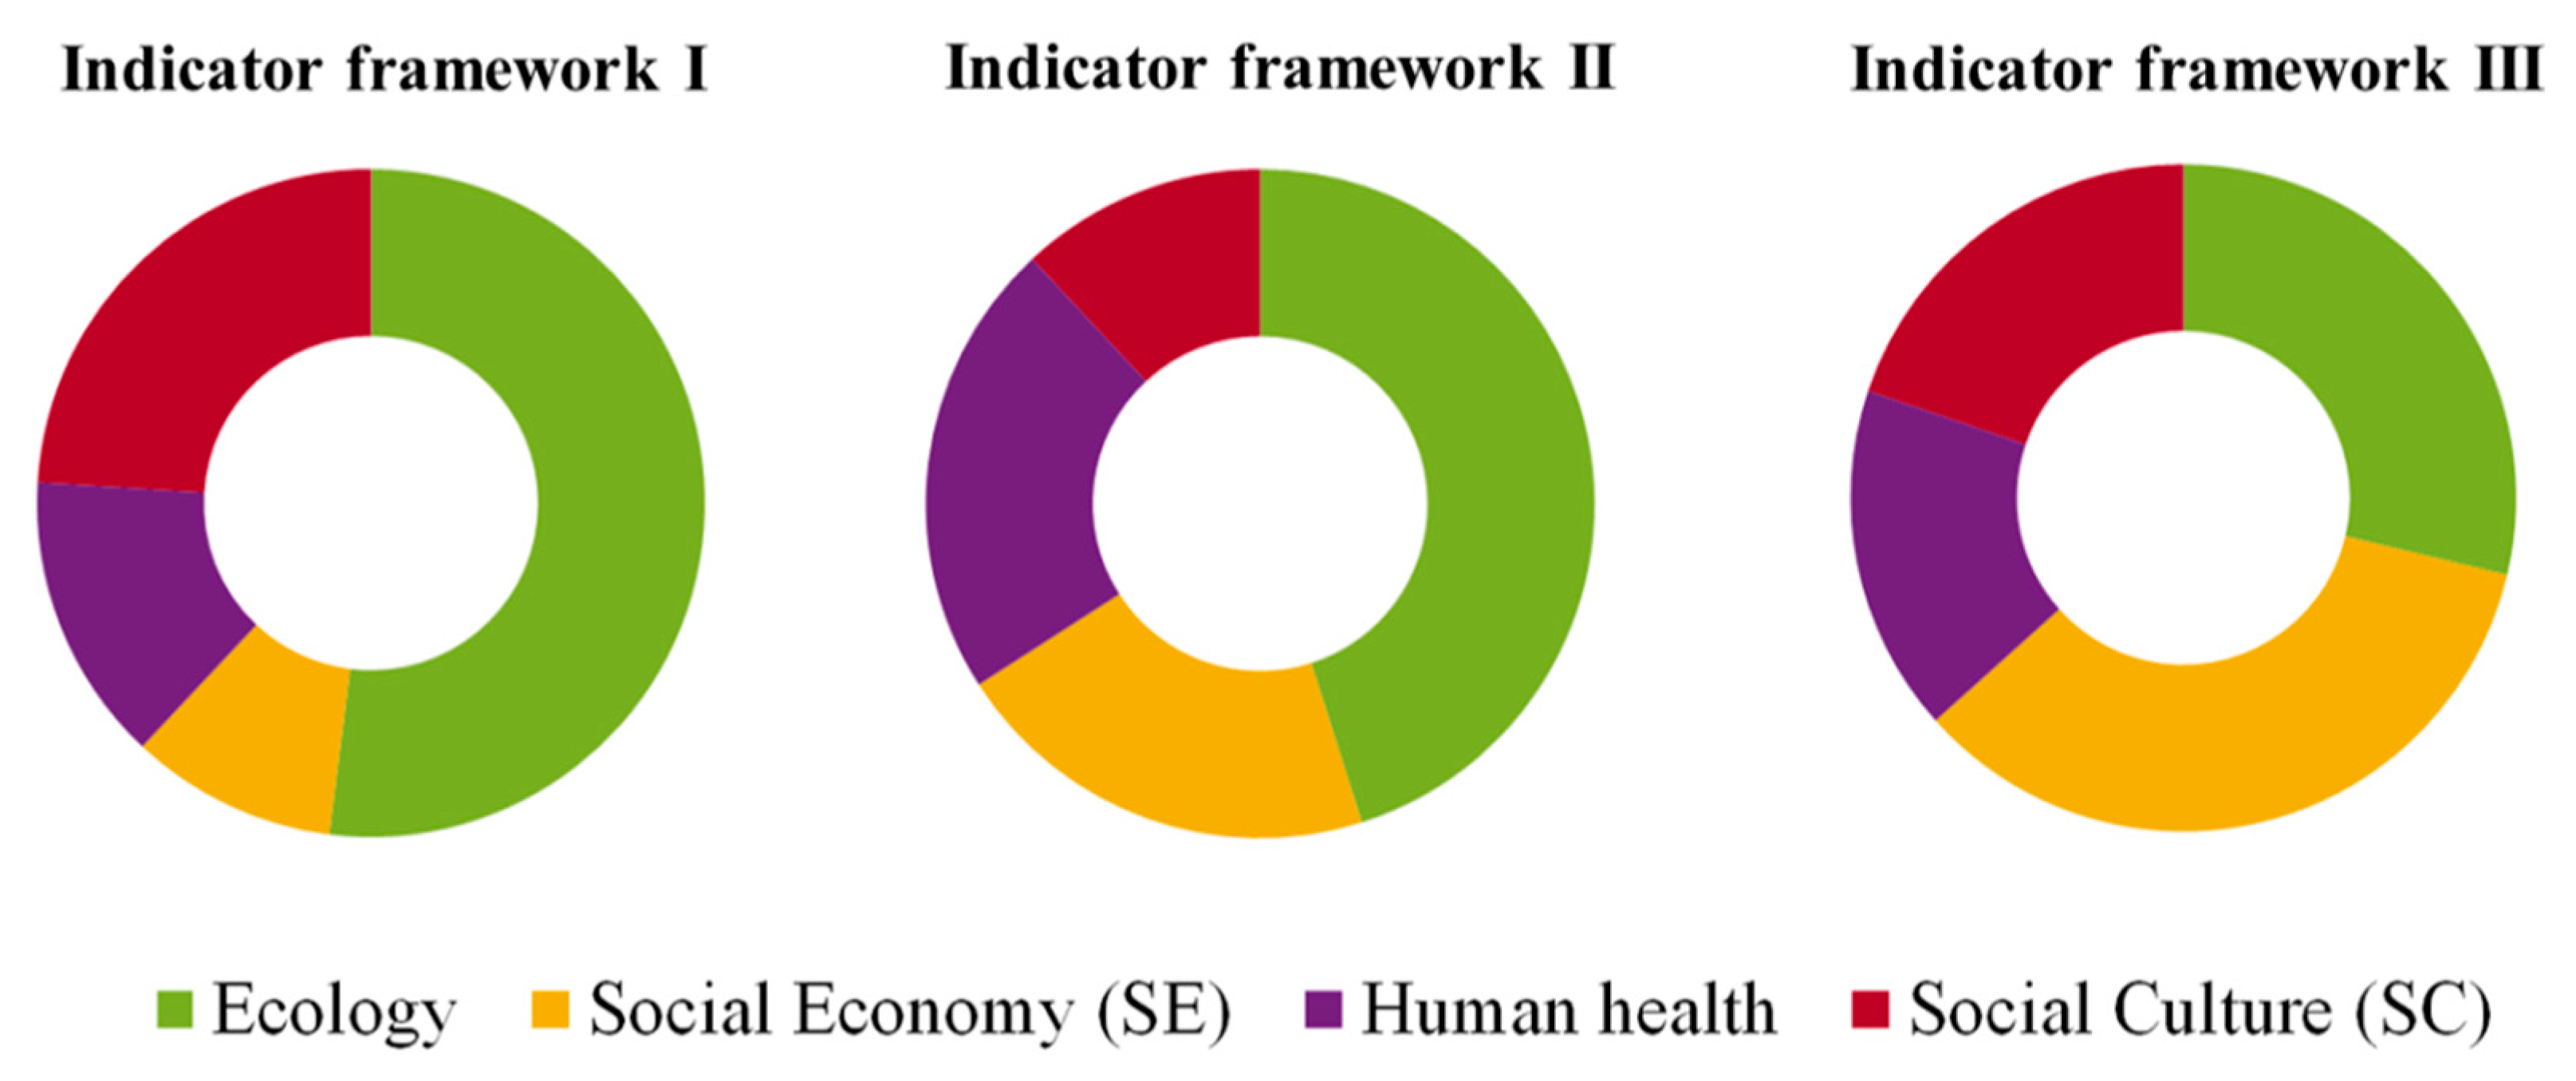
4.1. Multi-Dimensional Analysis of Indicator Frameworks I–III Towards Sustainability

4.1.1. Indicator Framework I for ESS Assessment from MAES

Indicator framework I (Table A1) is composed of 40 indicators. In total, one quarter of the indicators involves more than one dimension. To sum up, 52% of the indicators relate to the ecological dimension, 24% of the indicators relate to the socio-cultural dimension, 14% of the indicators refer to human health, and only 10% refer closely to the socio-economic dimension.

4.1.2. Indicator Framework II for GI Implementation from IEEP

The framework is composed of 39 indicators, which include not only those ESS provided by GI but also a range of GI benefit groups, e.g., GI benefits for human health and well-being, investment and employment, and so on (Table A2). As one example, employment resulting from GI initiatives is not an ESS, but a benefit provided by GI. Indicator framework II has great potential for the AMGI on the grounds that it contains a wide range of GI benefits and comprehensively reflects GI functions. Likewise, we list indicator framework II regarding the four dimensions of sustainability (Table A2). A total of 40% of indicators are involved in more than one dimension. In sum, 45% of indicators relate to the ecological dimension, 22% refer to health, i.e., human health, 21% relate to the socio-economic dimension, and only 12% closely refer to the socio-cultural dimension.

4.1.3. Indicator Framework III Supporting a Shift towards a Green Economy from EMDA

In Table A3, there are 37 indicators for GI valuation derived primarily from the indicator framework GI Valuation Toolkit [26]. The analysis of indicator framework III shows that 68% of all indicators belong to more than one dimension of urban sustainability. That is to say, compared to indicator framework I and II, it has the highest percentage of indicators addressing multi-dimensions of sustainability. In detail, 35% of indicators relate to the socio-economic dimension, 29% relate to the ecological dimension, 20% refer to human health, and 17% closely refer to the socio-cultural dimension.

4.2. Integrated Indicator Framework for AMGI

The three chosen indicator frameworks were compared to analyze their potential coverage of the four sustainability dimensions, as well as further relevant characteristics for the assessment of multifunctional GI. Figure 4 depicts their share of multiple dimensions for sustainable urban development. Indicator framework I clearly emphasizes the ecological dimension, while indicator framework II is relatively weak with regards to the socio-cultural dimension, but covers the dimension of human health well-being. Indicator framework III strongly supports the socio-economic dimension of GI. It may hence be concluded that the three indicator frameworks can contribute in specific ways to a more integrative indicator framework for AMGI while also showing limitations.
As one important conclusion, these three frameworks are complementary within their special focus on various scales and dimensions. Therefore, we make full use of their contributions and adapt their dimensions and aspects to our integrated indicator framework, which is a multi-scale and multi-dimensional indicator database (Appendix A). This synopsis enables us to integrate their beneficial contributions to just one framework as our indicator pool to undertake an AMGI.
The comparison results on the relevant spatial extents (Figure S1) as well as the percentages of supply/demand indicators (Figure S2) from indicator framework I to III, and the respective information (Text S1) are provided in Supplementary Materials to facilitate the potential applications of our methodology. Our approach is sensitive to criteria such as spatial scales and data availability, and therefore not applicable to all situations. However, it is the first time that such an explicit indicator framework has been proposed for AMGI while including multi-dimensional analysis for sustainability. This result helps ensure the constancy of GI assessment as well as combine and scale up the research on AMGI. A major restriction of potential applications of our integrated framework is data availability in certain cultural contexts.
As synoptic findings, we concluded that there is potential to conduct AMGI at multiple scales, but substantial data gaps remain to be filled before a fully integrated and complete GI assessment can be carried out. Conclusively, applied studies at multiple scales are needed to manifest the usefulness of our AMGI framework as well as reinforce it in practice. We hence deployed the process of indicator selection in the following section and thereby present the validation of indicators from our integrated framework, guided by the methodology flowchart in Section 3.2 (Figure 2).

4.3. Exemplification of an Assessment of Multifunctional Green Infrastructure (AMGI)

In this Section, we give an illustrative case of AMGI at urban scale to validate the methodology advised in Section 2. We conducted this case in the City of Leipzig, Germany, and got the following results (from Stage 1 to 3).
(1)
Stage 1: The needs for addressing multifunctionality and multi-dimensions of sustainability.
As a pre-evaluation, we give brief information on our study area to facilitate our workflow from Stage 1 to 3 according to the work flow in Figure 2. Our study site is Leipzig, Germany, which covers an area of 298 km2, is home to 596,517 inhabitants in 2018 [56] and is characterized by a multitude of high-density built-up areas in Figure 5. In the last five years, Leipzig has been the fastest growing city in Germany, signifying high pressure on urban GI through housing development and the need for more public infrastructure. Physiographically, the city has one of the most extensive alluvial forests in Europe. When further depicting the local GI, it is furnished by long-term urban community gardens and allotments with one of the highest spatial expansions in Germany. Both of them should be reflected in AMGI.
For our priority settings, we intend to address the needs of ten GI benefits regarding how to use our approach. In addition to considerations on data availability, our principle provides at least one example for each of the GI benefits to illustrate the usage of the proposed framework and methodological guideline.
(2)
Stage 2: Contextual assessment in the City of Leipzig, Germany
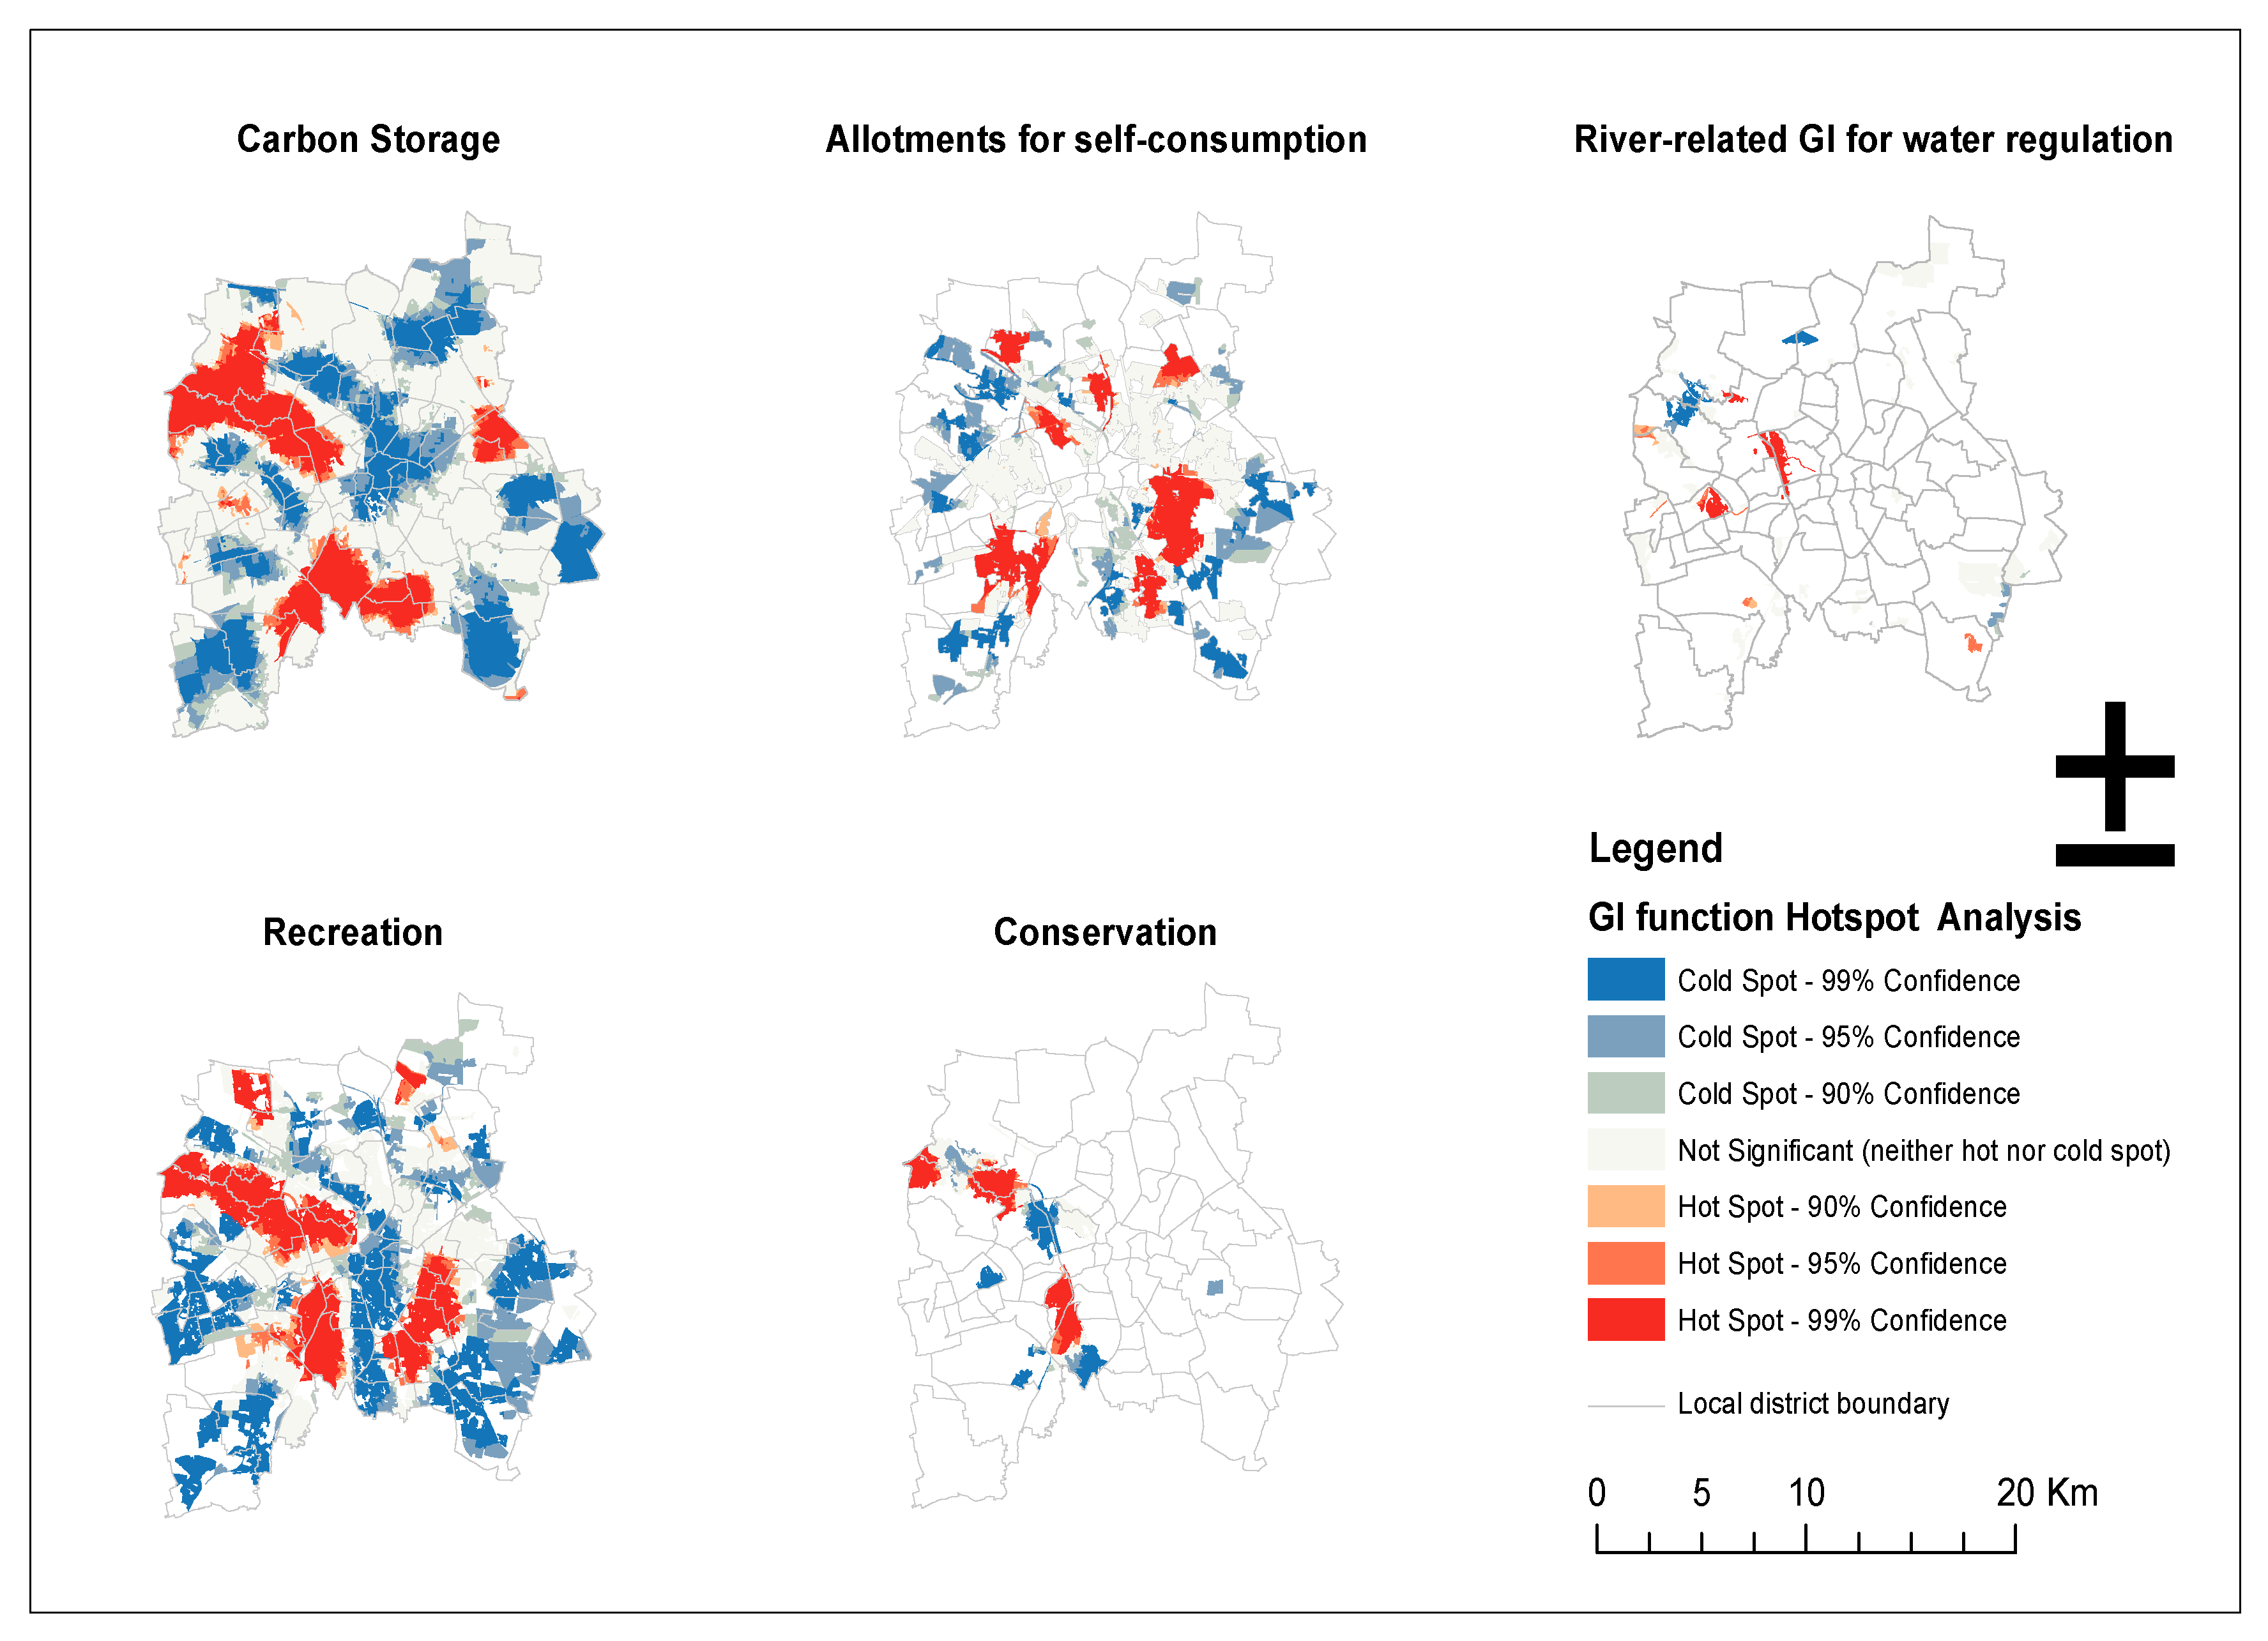
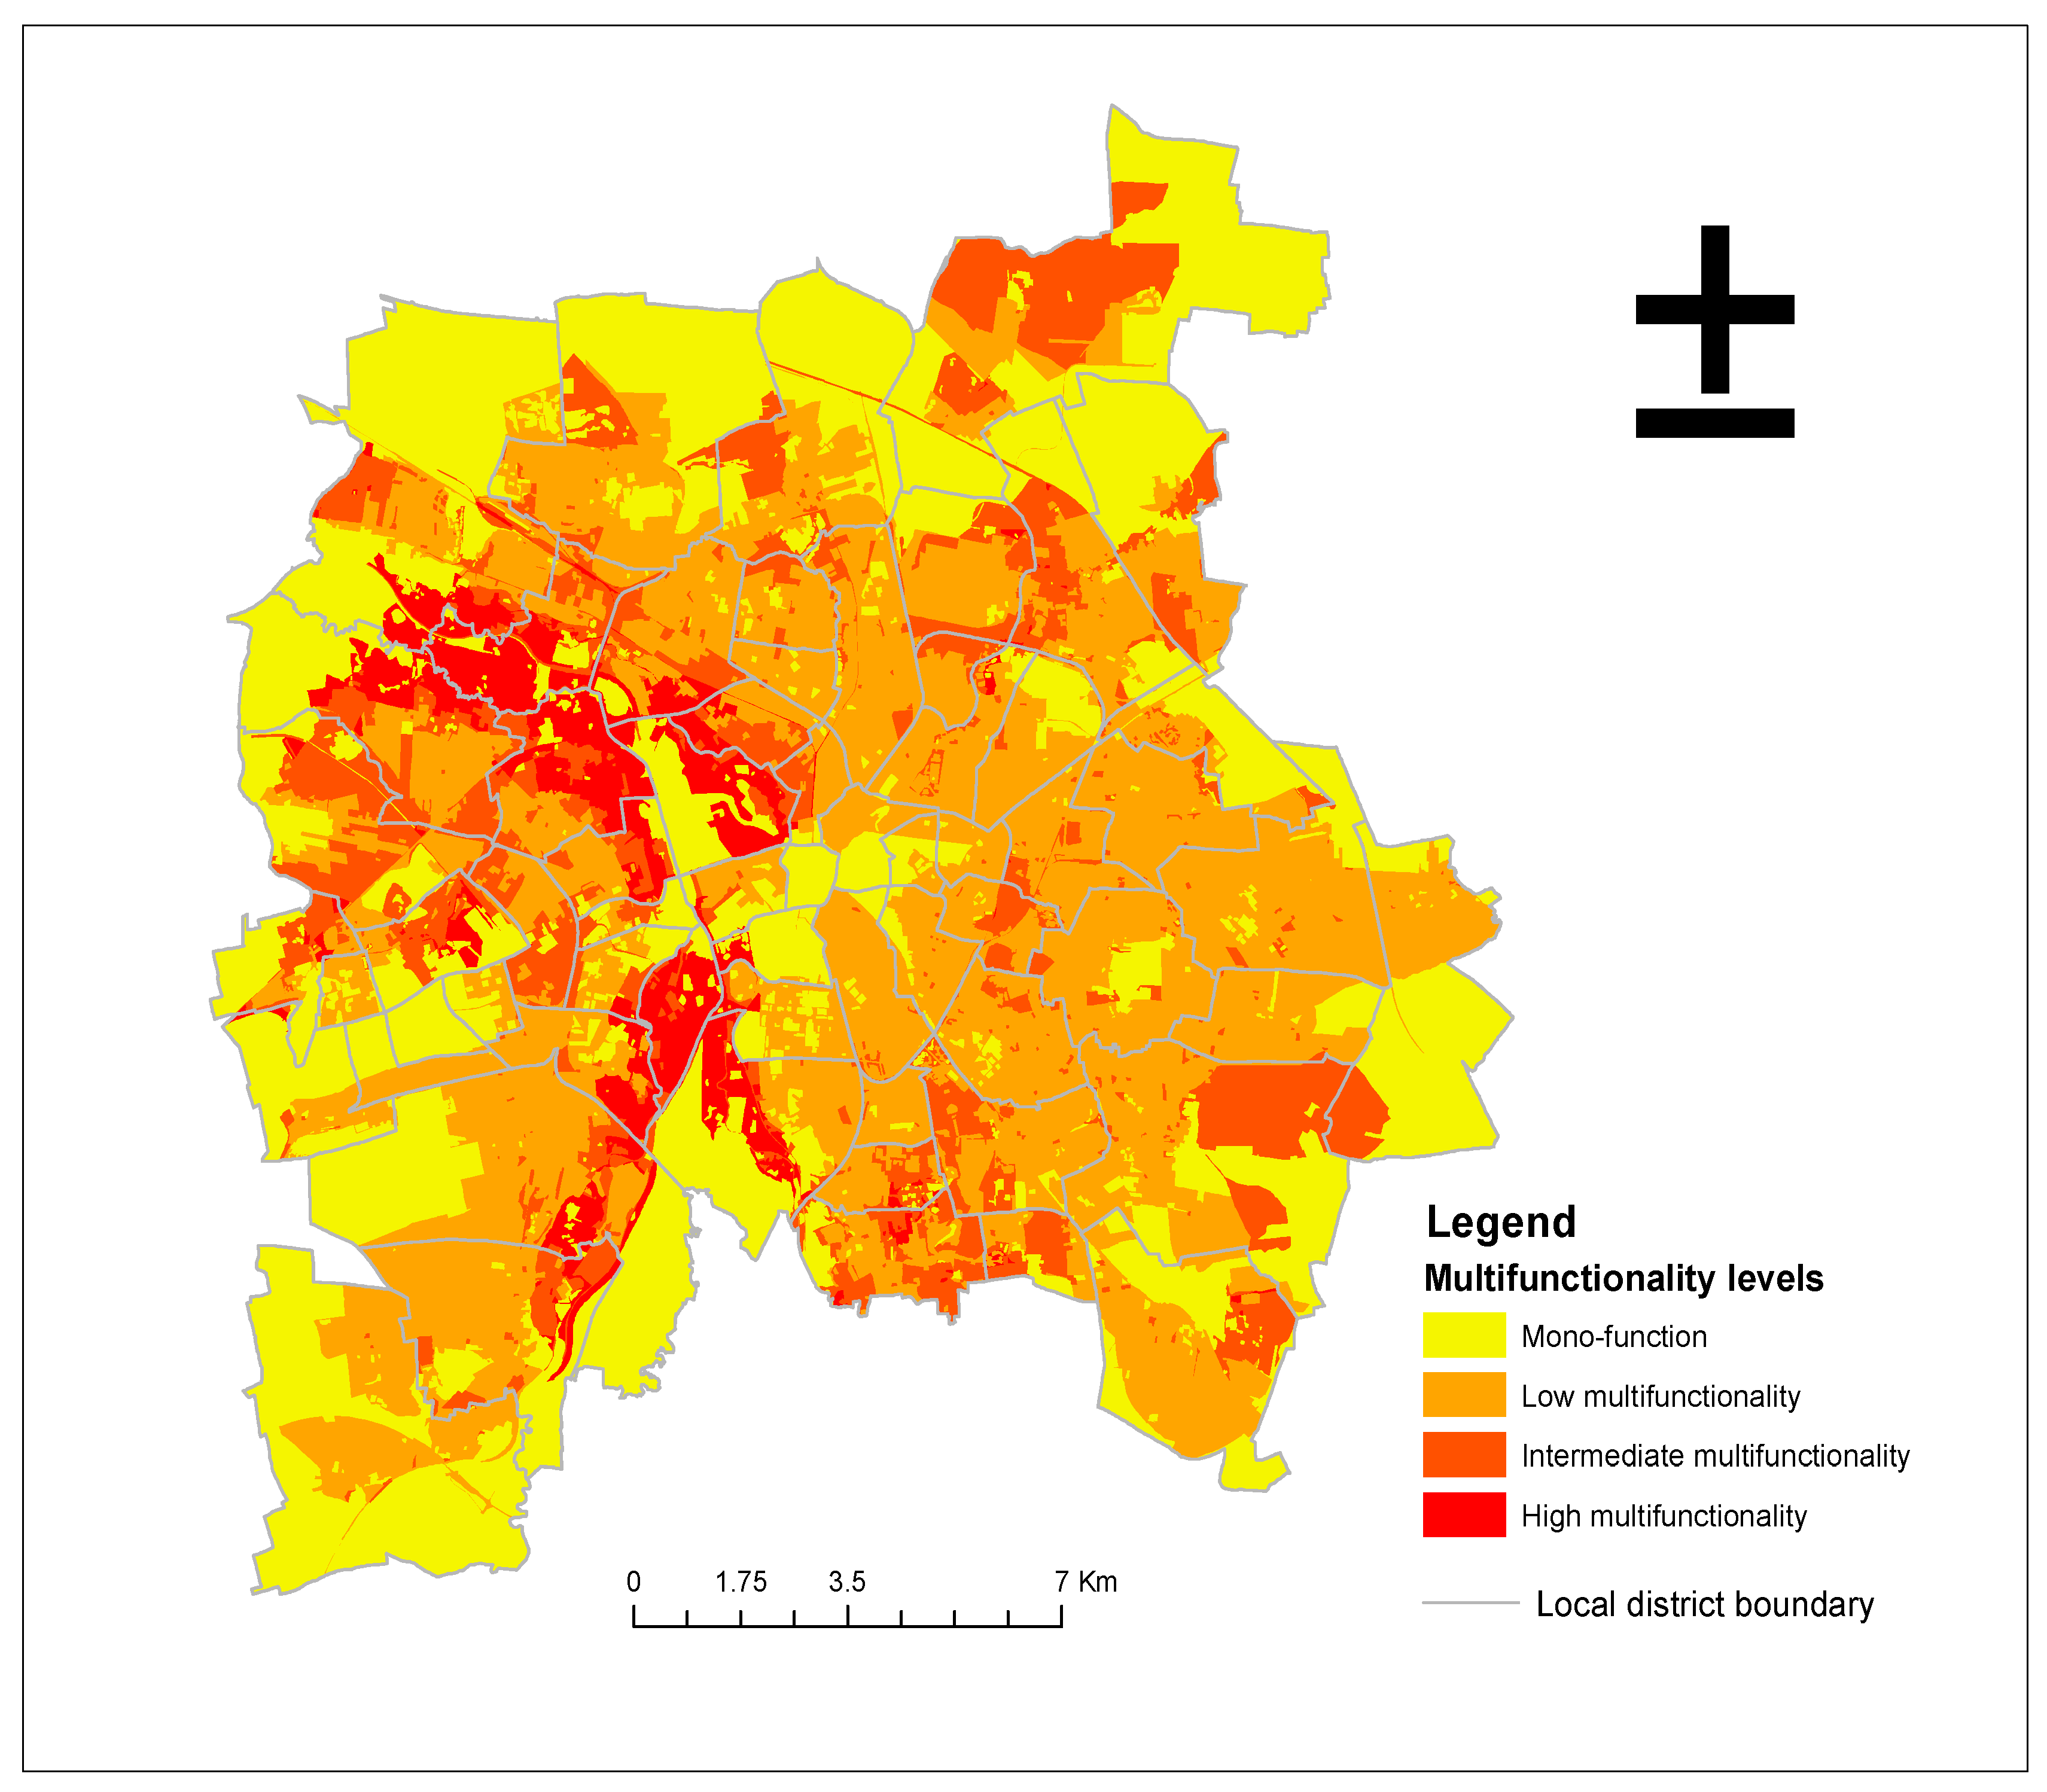
The assessment is conducted in Leipzig on the basis of preprocessing in Stage 1. We set our focus on the urban scale (Figure 5), and concentrate primarily on the capacity of GI benefits. The selected indicators and analysis can be found in Table 2. Indicators that are not available in the study area are marked as N/A, and we highlight potential methods and references, respectively. For example, indicators such as No. 00029 (number of visitors to protected sites per year) and No. 00030 (number of local users for hiking, camping, nature walks, and jogging) etc. are not available at the whole urban scale; however, we itemize newly developed methods, e.g., smartphone apps, namely the Mapping Nature’s services (MapNat) app [66].
The contextual assessment leads to a lean indicator framework as shown in Figure 6, guided by our workflow in Figure 3. The selected indicators are defined in Figure 6 and Table 2, evaluated either quantitatively as measurements or qualitatively as a description.
Regarding the contextual assessment, we summarized the evaluation results of GI benefits for the whole urban area (see Table 2), which are aggregated to the urban scale. We can conclude that GI provides natural resources, such as carbon storage 11.8 MgC/ha on average [67,68] and water surfaces account for 2.5% of the whole municipal space. GI function can be reflected from around 13 ha (0.04%) wetlands and 41 ha (0.14%) vegetation alongside water bodies to regulate surface runoff water. They are identified and mapped as river-related GI in Figure 6 to show the GI capacity of water regulation.
For the multifunctioning GI, there are several GI elements worth being highlighted in Leipzig. For example, there are around 28.2 m2 allotments and community gardens per inhabitant. They are not only for food self-supply but also form important parts of recreational spaces. Both of them are evaluated and reflected in Figure 7 and Figure 8. In total, there are around 70 m2 recreational spaces for each inhabitant, encompassing gardens, parks, urban forests, allotments, sports and leisure facilities, zoological and botanical gardens, and so forth, which are widely dispersed in the city. Another multifunctional GI is dedicated to the urban alluvial forests (see Figure 5 and Figure 8), in total 1033 ha in Leipzig. They are not only recreational areas for urban dwellers but, in addition, they have special value for habitat, species, and genetic diversity. In this case, they can be marked as having a special conservation function (i.e., neither associated with the actual use of ecosystems, nor to its potential use in the future) for sustainable development and future generations [26]. Its existence ought to be protected as its primary function (see in Figure 7).
Regarding resilience against exposure to urban flooding, we find a share of 57% of green spaces in local districts exposed to flooding. That is of special concern where rivers are running through adjacent to built-up areas, of which Leipzig possessed a multitude, such as White Elster, Pleiße, Parthe [69]. Complementarily, a local case study by Kubal et al. (2009) [70] concluded that there are about 45 km2 areas, i.e., 15% of the city exposed to extreme flood risk. As for the GI function related to local climate change, the urban GI provides nearly 0.25 °C/m2 of cooling effects [65], compared to the sealed surfaces. Thus, the further the distance to local GI, the larger the exposureo urban heat island effects. To reflect the GI function in the support of employment, we find that GI elements such as agriculture, forest and fisheries provide an employment rate of about 13.7% in the study area.
With respect to external benefits due to the development of GI, the increment values of both ground land [74] and apartment rent [73] imply a GI function on investment, since we observe an increase of both with an increasing proximity to GI. Hence, we detect hotspot areas of GI on the recreational function map (Figure 7). Likely, the ‘good’ (standard ground value from 280–400 €/m2) and ‘super good’ (above 400 €/m2) lands are nearby the parks and urban alluvial forests. Detailed results are presented in Table 2.
Among results in Figure 6, GI functions (the above-ground carbon storage, allotments producing food for self-consumption, river-related GI for water regulation, recreation function, and special conservation benefits of GI for habitat, species and generic diversity) can be further illustrated by calculating the Getis Ord Gi* index (see Section 3). The calculated results served to identify the spatial patterns of the hot/cold spots of each GI function in Figure 7. Both the hot spots and cold spots of GI functions are allocated all over the city. There are no regular patterns among different functions. The resulting maps show variation in GI functions over space. However, it can be concluded that there is a specific spatial concentration of the recreation function in the central western part of Leipzig, which proves that the multifunctionality of the urban forest alluvial plays a significant role for residents in Leipzig.
These five GI functions are overlaid to identify the multifunctionality of GI in this case study (Figure 8). The results show different intensities of multifunctionality: mono-function, low, intermediate and high levels of multifunctionality displayed in Figure 8. Combined with Figure 7, the spatial distributions of multifunctionality (Figure 8) present the complex urban ecosystems of different GI functions in relation to the spatially heterogeneous multifunctional GI. There are no inevitable connections between hot spot areas and multifunctional areas. What is important is that the multifunctional areas generally cross the local district boundaries. From the city center to outskirts, the level of multifunctionality is diverse and slightly inclined to the mono-function direction that is first assigned to agricultural land.
(3)
Stage 3: For the retrospective assessment, we re-evaluated our illustrative case according to guiding questions in Section 3 (Figure 9 in the yellow box).
Concerning retrospective assessment, the results are presented in Figure 9. For the four dimensions of urban sustainable development, the selected indicators convey four dimensions and their fractions do not show apparent bias: ecology (39%), socio-economy (23%), socio-culture (16%), and human health (23%) (see the fraction circle in Figure 9). However, they show great restrictions on the socio-economic dimension due to a lack of data availability. Overall, we employ 18 indicators in total, and the GI types encompassed in our AMGI analysis are checked and compared with our comprehensive GI typology adapted from the urban GI Components Inventory of the Green Surge project [58] and marked as YES/NO in the last column (Table A4).

5. Discussion

5.1. Evaluation of Our Integrated Indicator Framework

When comparing and analyzing indicator frameworks I to III, we revealed the potential contributions of these frameworks to the conceptual development of GI. It enabled us to develop an integrated framework and methodology for AMGI, accounting for the urban sustainability dimensions of ecology, socio-economy, socio-culture, and human health. Thus, our indicator-based framework advances a more complex analysis of GI through the incorporation of a multi-dimensional analysis towards sustainability as well as the provision of ten GI benefits that potentially facilitate the capture of multiple GI functions. The strength of our proposed framework is to provide an easy to handle pool of indicators (Appendix A) for a comprehensive urban GI typology (Appendix B), as well as an illustrative methodology (Figure 2) for further applications in AMGI. The integrated indicator framework and assessment methodology both form an informative toolbox to undertake an integrative GI assessment.
Previously, AMGI was regarded as an intricate process, because not only the diversity and uncertainty of the GI concept itself [1,3,75] but also the multiple functions of GI seemed hard to capture fully [1,3]. Compared with the conceptual framework for multifunctionality in GI planning for urban areas by Hansen and Pauleit [76], this study supplies an indicator-based framework and a holistic GI assessment methodology, while setting the multifunctionality of GI as one given assumption. Both the framework for multifunctionality in GI planning by Hansen and Pauleit [76] and our framework in this paper have reinforced the significance of GI planning from the ecological and social perspective. As one potential novelty, the latter has underscored these two perspectives by taking indicators as proxies and classifying each indicator in terms of ecological, socio-economic, socio-cultural, and human health dimensions. However, our indicator-based framework made the coverage of multiple GI functions and the incorporation of the latest conceptual evolution of GI the first priorities and thus little attention was paid to the synergies and trade-offs amongst different GI functions and the stakeholder preferences [76]. However, the latter are of great importance for multifunctionality assessment of GI and it ought to be further analyzed based on this integrated indicator framework.
Although we have stated that ESS provided by GI, the multiple benefits and functions of GI, and a potential shift towards a green economy are three major aspects of GI assessment, we could only address the former two in our exemplification. However, our framework would allow one to address the green economy dimension by including indicators such as employment in directly GI-related sectors (agriculture, forestry, and fisheries), and the increment economic values of residential land and property 1 km from green areas [77] to emphasize the significance of a shift towards a green economy [32]. As for the question whether the enclosed indicators are applicable, measurable, or even transferable, further analyses and potential compromises on indicator selections must be carried out with respect to different cultural contexts. For instance, to assess urban biodiversity, indicators such as the capacity of ecosystems to sustain insect pollinators’ activity has up to now only been available at European scale from the ecosystem services mapping at European scale (ESTIMAP) [77,78]. The respective method for ecological modeling for an urban evaluation, i.e., the urban version of the ESTIMAP-P [79] model for pollination, is still under development, because an adaption of LULC and the distance to semi-natural vegetation patches [79] call for a high quality of RS information to capture the spatial heterogeneity in urban settings. From this viewpoint, we state that RS information have been shown in this study to be extremely supportive for GI assessment and planning.

5.2. Implications from the AMGI Exemplified in One European City, Leipzig

The AMGI exemplified in one European city implies substantial contributions to the GI assessment and planning, and simultaneously may inspire RS experts and Geographic Information System (GIS) scholars from various disciplines.
For the GI assessment and planning, we provide a number of indicators to capture multiple GI functions in urban areas such as carbon storage from green areas, allotments and community gardens for food self-supply, river-adjacent GI for water regulation, and recreation spaces. The approach helped to identify the hot/cold spots for these different GI functions as well as the spatially aggregated multifunctional areas instead of isolated grid cells with high values of GI functions [59,80].
In hotspot areas, the values of respective GI functions are significantly higher than the average [81]. This information may facilitate the GI planning by easily identifying sites/areas within higher multifunctionality, whereas at locations recognized as cold spots, potential GI plans such as being accessible to recreation (walking, jogging) to promote human health and well-being, or planting street trees for urban heat island mitigation, may be advised to increase the multifunctionality of GI. In our exemplification of Leipzig, we observed a large percentage of multifunctional GI crossing municipal districts in Figure 8. For the GI assessment and planning in the City of Leipzig, it demonstrates an apparent demand of collaborations beyond local districts, especially for those local districts in the west of the city center like Grünau, Schönau, Neulidennau, and Leutzsch, to realize the multifunctionality of GI. Therefore, green space planning and management should go across the barriers of administrative boundaries and the spatial relations of multiple GI functions to establish multifunctional networks of GI.
Overall, the application of the AMGI framework enabled us to identify and assess 26 types of GI elements in total. Compared with our GI typology (listed according to the intensity of human influence/association with GI in Table A4), our analysis covers 57% GI types of the whole typology. Before, GI was analyzed either limited to some types with few connections to GI functions or only associated with one or two functions [3,4,82]. However, a limitation of our exemplification is that due to the conceptual and methodological focus of the study, we were not able to explore in more depth the synergies and trade-offs of GI in relation to various local policies and strategies. Moreover, the weighting of the various GI functions for a contextualized assessment of multifunctionality was not feasible, due to the lack of information on the preferences of different stakeholders [32,76]. Therefore, in our application, we mainly focus on the supply of ESS provided by GI, instead of the demand of ESS. Additionally, we primarily included indicators covering the ecological and socio-cultural dimensions, but very few from the socio-economic and human health dimensions. The latter was mainly due to limited data availability.
Nonetheless, it is exactly these restrictions reflected in our exemplification that show the substantial demand of interdisciplinary and transdisciplinary research and collaborations, particularly amongst RS experts and GIS scientists. When we tested the applicability of our assessment framework to a European city, we recognized the necessity for AMGI using remote sensing-based methods. Thus, this paper is expected to draw attention to the strengthening of the urban GI assessment using RS-based and GIS-based methods. From this point of view, the proposed integrated framework, and its application in this paper will help foster the creation of a common language for better mutual understanding amongst scientists and stakeholders, given that a clear framework is crucial for the sustainable management of spatially-oriented GI plans over time and along various stakeholder groups. It is quite challenging for a GI assessment and planning but essential to further explorations to enhance the synergies and reduce the trade-offs [76] of multiple GI functions.

5.3. Application Potential of Our Integrated Indicator Framework and Methodology

Exemplifying the assessment approach can help to better understand our indicator framework and methodology, which foster or hinder the AMGI in different contexts. For the purpose of a clear illustration and full exploration of our framework while exemplifying in Leipzig, we selected at least one indicator for each GI benefit. In the process of running the whole methodology (from stage 1 to 3) in one European city, we found that the application of our integrated framework calls for a comprehensive review of local studies (e.g., [65,67,70]) and an extensive understanding of spatial datasets for the AMGI. For example, our selection of earth observation datasets, i.e., Urban Atlas data, biotope mapping, and local LULC data, was built on an underlying analysis considering their contributions to AMGI and taking the spatial resolution of each and their respective classification of urban spatial categories (at least to their secondary classes) into account. Therefore, the methodology in this paper can be applied to other European cities and also inspires other cities with similar remote sensing information.
Publicly available RS datasets, e.g., CORINE and Urban Atlas datasets [50] delivered by the European Environment Agency (EEA) and the European Commission DG Joint Research Centre (JRC) (https://land.copernicus.eu/), aid in the transferability of our methodology of GI assessment at a broader extent, since these datasets cover almost 39 countries in Europe. Moreover, biotope mapping has been shown to make a substantial contribution for AMGI at urban scale, given that it has contributed to an evaluation of GI benefits in natural resource, tourism and recreation, and conservation benefits. Therefore, for the areas where there is biotope mapping on the basis of investigations of individual habitats [48], there is higher potential behind the use of our methodology. For the cities where there are spatial datasets at high spatial resolution, likely the LULC data of Leipzig (2012) derived from OBIA approach [54,55] , our framework and assessment methodology would show value, since both of them are ready to be applied to other cities and have proven to be valid to identify the hotspots of respective GI functions as well as the multifunctional areas. Moreover, the indicator Getis Ord Gi* we chose in the methodology for the identification of hot/cold spots of GI functions is not limited to the urban scale. It could be used at various scales such as regional, metropolitan, and local scales as well. Accordingly, the earth observation data and the simple and efficient method for hotspot analysis both contribute to the potential applications of our framework and methodology.

5.4. Improving the Integrated Framework on AMGI and Its Limitations

To inspire and provoke more studies for improving AMGI in practice, we argue that there are two dimensions of the multifunctionality of GI. The first dimension is the multiple functions within one specific area. The second dimension refers to the functions of GI at multiple scales and varied interconnected roles of GI as networks to enhance structural and functional connectivity. This paper only covered the first dimension by considering as many GI functions as possible without exploring the synergies among multiple GI functions. Thus, a limitation of this study is exploring the structural and functional connectivity. Nonetheless, this paper provides an essential basis for it by presenting an integrative indicator framework for AMGI as well as exemplifying its usage in Leipzig. As for potential synergies and trade-offs, a comparative analysis should be undertaken, including different spatial changes over a certain time span. It limits our research findings that we could not include long-term synergies and trade-offs. The spatial and temporal changes of multifunctional GI would be a significant direction to work on in the near future.
This promising direction requires high-quality earth observation datasets, such as the upcoming Copernicus data, e.g., RS data on biosphere (the fraction of photosynthetically active radiation absorbed by the vegetation) and on oceanography (Lake Surface Water temperature (LSWT) at the spatial scales from 1 km, 300 m or even smaller), to disclose substantial GI functions that are not yet available in applications albeit already proposed in our integrated framework.
It necessitates the combination of remote sensing-based methods and GIS-based methods at various spatial, temporal, and spectral scales to support multifunctional GI analysis. For instance, incorporating leaf area index (LAI) at a global scale, i.e., remote sensing-based method using improved Moderate Resolution Imaging Spectroradiometer (MODIS) LAI product at 1 km spatial resolution [83]. Likewise, evaluating leaf area density (LAD) at local scale, i.e., RS and GIS-based method using high-resolution terrestrial LiDAR—Terrestrial light detection and ranging (LiDAR) [84] to retrieve the three-dimensional (3D) structure properties of vegetation. Therefore, remote sensing-based methods would considerably contribute to the obtaining of respective indicators and the evaluation of GI functions in reduced water-off and cooling effects. Integrating the 3D information to enrich indicators for GI assessment and planning is likely to be one of the key topics in further multifunctional GI research.

6. Conclusions

Our study delivers an initial approach to conduct AMGI within a spatially explicit methodology. While providing an integrated indicator framework, we intend to draw attention to address ESS provided by GI, the multiple benefits and functions of GI, and a potential shift towards a green economy while conducting an AMGI at various spatial, temporal and spectral scales. We hence advise one fulfills an assessment using our framework and methodology following the three stages: (i) conceptual framework for priority settings to evaluate the needs for addressing multi-dimensions for sustainability and multifunctionality; (ii) contextual assessment considering focal scale, data availability; (iii) retrospective assessment: trace back to the whole process when the respective AMGI is completed. As an illustrative case, we present the exemplification of AMGI in Leipzig, Germany. In this case, we presented the application of our proposed framework, providing at least one example for each GI benefit. With our methodology, we make quite the positive experience using remotely sensed information for which we recommend that scholars could turn to our approach. Our toolbox is an appealing basis for multifunctional GI assessment. It can serve as the baseline for AMGI applications in other cultural contexts. Our research intends to push forward multi-scale research for the assessment of multiple GI functions and also to sow one seed of promoting multiple remote sensing-based methods when acquiring spatial indicators for GI functions and, by doing so, to advance urban GI further.

Supplementary Materials

The following are available online at https://www.mdpi.com/2072-4292/11/16/1869/s1, Figure S1: Relevant spatial extents of indicators from indicator framework I to III, Figure S2: The percentages of supply and demand indicators from indicator framework I to III, Text S1: Synthetic evaluation of indicator framework I to III.

Author Contributions

Conceptualization, J.W., S.P., and E.B.; Writing, J.W.; Review and editing, S.P. and E.B.; Visualization, J.W.; Supervision, S.P. and E.B.

Funding

This research received no external funding.

Acknowledgments

This article is part of the integrated project “Urban Transformations: Sustainable urban development towards resource efficiency, quality of life and resilience” (2014–2020; http://www.ufz.de/stadt). It is being conducted by the Helmholtz Centre for Environmental Research—UFZ within the German Helmholtz Association. The first author would like to express her gratitude for the research support from China Scholarship Council.

Conflicts of Interest

The authors declare no conflict of interest.

Appendix A

Multi-dimensional analysis of indicator frameworks I—III towards sustainability.
  • Table A1: Indicator framework I for ESS assessment from MAES classified in terms of four dimensions.
  • Table A2: Indicator framework II for GI implementation from IEEP classified in terms of four dimensions.
  • Table A3: Indicator framework III for a shift towards green economy from EMDA classified in terms of four dimensions.

Appendix A.1. Indicator Framework I for ESS Assessment from Commong International Classification of Ecosystem Services (CICES) and Mapping and Assessment Ecosystem Services (MAES)

Table A1. Indicator framework I for Ecosystem Services (ESS) assessment from MAES classified in terms of four dimensions, i.e., ecological dimension (green color), socio-economic dimension (yellow color), socio-cultural dimension (purple color) and human health (red color) dimension. (Regarding the references for each indicator listed in the indicator framework I refer to the 4th report MAES [22] (pp. 71-81).)
Code No. (00) for Indicator Framework IIndicators Adapted from CICES & MAESEcologySocio-Economy (SE)Socio-Culture (SC)Human Health (HH)
Provisioning
01Production of food (ton ha−1 year−1)
02Surface of community gardens /small plots for self-consumption (ha)
03Drinking water provision (m3 ha−1 year−1)
04Drinking water consumption (m3 year−1)
05Water provision (m3 ha−1 year−1)
06Water consumption per sector (m3 year−1)
Regulation and Maintenance
07Pollutants removed by vegetation (in leaves, stems and roots) (kg ha−1 year−1)
08Dry deposition velocity (mm s−1)
09Population exposed to high concentrations of pollutants (% on surface area)
10Carbon storage in soil (ton C ha−1)
11Carbon sequestration (ton ha−1 year−1)
12Leaf Area Index
13Temperature decrease by tree cover (°C m−2)
14Cooling capacity of urban green trees
15Cooling capacity of UGI
16Cooling capacity of urban green spaces
17Population exposed to high temperatures (% per unit area)
18Leaf Area Index + distance to roads (m)
19Noise reduction rates applied to UGI within a defined road buffer dB(A) m−2 vegetation unit
20Soil water storage capacity (mm)
21Soil water infiltration capacity (cm)
22Water retention capacity by vegetation and soil (ton km−2)
23Intercepted rainfall (m3 year−1)
24Surface runoff (mm)
25Share of green areas in zones in danger of floods (%)
26Population exposed to flood risk (% per unit area)
27Areas exposed to flooding (ha)
28Capacity of ecosystems to sustain insect pollinators activity (dimensionless)
29Relative abundance (number over area or over a length)
Cultural
30Accessibility to public parks, gardens and play-grounds (more than 50 ha)—(inhabitants within 10 km from a park)
31Accessibility to public parks gardens and play-grounds (between 10 ha and 50 ha)—(inhabitants within 1 km from a park)
32Accessibility to public parks gardens and play-grounds (between 2.5 ha and 10 ha)—(inhabitants within 500 m from a park)
33Accessibility to public parks gardens and play-grounds (between 0.75 ha and 2.5 ha or smaller but important green spaces)—(inhabitants within 250 m from a park).
34Weighted recreation opportunities provided by Urban Green Infrastructure
35Nature-based recreation opportunities (includes Natura 2000; includes bathing water quality) (dimensionless)
36 Proximity of green infrastructure to green travel routes (km)
37Green related social service provided to population (dimensionless)
38Regression models of ES hotspots and cold spots based on georeferenced data (i.e., pictures or geo tagged locations)
39Accessibility of parks from schools (number of public parks and gardens within a defined distance from a school)
40Cultural and natural heritage sites (e.g., United Nations Educational, Scientific, Cultural Organization (UNESCO) world heritage sites) (number per unit area, % per unit area)
In sumCount 265127
Percentage52%10%24%14%

Appendix A.2. Indicator Framework II for GI Implementation from Institute for European Environmental Policy (IEEP)

Table A2. Indicator framework II for GI implementation from IEEP and classified in terms of four dimensions, i.e., ecological dimension (green color), socio-economic dimension (yellow color), socio-cultural dimension (purple color), and human health (red color) dimension.
Code No.(0000) for Indicator Framework IIGI Functional Indicators EcologySocio-Economy (SE)Socio-Culture (SC)Human Health (HH)
Natural resources
0001Forests for wood supply
0002Total area of cropland/grassland suitable for livestock
0003Total area of low input cropland
0004Soil carbon content
0005Species composition, aggregated in functional groups (e.g., biomass of decomposers, proportion of different trophic groups) as an indicator of process capability
0006Abundance and species richness of biological control agents (e.g., predators, insects, etc.)
0007Changes in disease burden as a result of changing ecosystems
0008Range of biological control agents (e.g., in km, regular/aggregated/random, per species)
0009Abundance and species richness of wild pollinators
0010Range of wild pollinators (e.g., in km, regular/aggregated/random, per species)
0011Proximity to natural habitat for pollination
0012Groundwater recharge
0013Total area of inland water bodies and inland wetlands
Water management
0014Water infiltration capacity/rate
0015Water storage capacity in mm/m
0016Floodplain water storage capacity in mm/m
0017Water quality in aquatic ecosystems (sediment, turbidity, phosphorous, nutrients, etc.)
0018Biological indicators: e.g., index of biological integrity
0019Nitrogen retention
0020Nitrogen removal
Climate regulation
0021Total amount of carbon sequestered/stored=sequestration/storage capacity per hectare * total area (GtCO2)
0022Evapotranspiration rate
0023Canopy stomatal conductance
0024Wind attenuation potential
Health and well-being
0025Atmospheric cleansing capacity in tons of pollutants removed per hectare
0026Downward pollutant flux, calculated as the product of dry deposition velocity and pollutant concentration
0027Reduced stress levels and improving mental health
0028Increased physical activities
0029Natural sound absorption capacity
Investment and employment
0030Scenery, amenity, environmental quality
0031Employment resulting from GI initiatives
0032Amount of workplace individuals benefiting from GI investment or existing GI
Tourism and recreation
0033Scenery, amenity, environmental quality, products, flagship species, and habitats
0034Exercise, scenery, amenity for public recreation
Education
0035Educational visits: flagship species and habitats, endemic species
Land and property
0036Exercise, scenery, amenity for up valuation of individual property
Resilience
0037Particular emphasis on regulating and supporting services
Conservation benefits
0038Existence value of habitat, species, and genetic diversity
0039Bequest and altruist value of habitat, species, and genetic diversity for future generations
In sumCount2612713
Percentage45%21%12%22%

Appendix A.3. Indicator Framework III Supporting A Shift Towards Green Economy from East Midlands Development Agency (EMDA)

Table A3. Indicator framework III for a shift towards green economy from EMDA classified in terms of four dimensions, i.e., ecological dimension (green color), socio-economic dimension (yellow color), socio-cultural dimension (purple color), and human health (red color) dimension.
Code No.(00000) for Indicator Framework IIIIndicators for GI Quantitative BenefitsEcologySocio-Economy (SE)Socio-Culture (SC)Human Health (HH)
Natural resources
00001Production of food in tons, m3 and/or hectares
00002Quantity of certified production of food
00003Number of wild species used as food/ornamental resources etc.
00004Employment sustained by agricultural sectors
00005Increased yield attributable to soil quality
00006Increased yield attributable to biological control
00007Increased yield attributable to pollination
00008Population served by renewable water resource
00009Total annual freshwater consumption by sector
Water management
00010Deprived households at risk of flooding
00011Reduced surface water run-off
00012Population served by high water quality
Climate regulation and adaption
00013Total amount of carbon removed and contribution to the achievement of climate change targets
00014Reduced peak summer surface temperatures
00015Building energy savings—heating and cooling
00016Deprived households at risk of storm damage
00017Deprived land at risk of storm damage
Health and well-being
00018Total amount of pollutants removed and contribution to air quality targets
00019Human health impacts expressed in disability adjusted life years (Daily = years of life lost + years lived with disability)
00020Persons/year where defined threshold in dB is not exceeded due to natural sound absorbers
Investment and employment
00021Perception surveys on the attractiveness of an area for workers/investors
00022Number of products whose branding relates to cultural identity
00023Temporary employment impacts of GI provision
00024Ongoing employment impacts of maintenance
00025Summary of employment sustained by sectors (e.g., agriculture, forestry, tourism and recreation
00026Impact on workers’ effectiveness on the job
Tourism and recreation
00027Employment supported by tourism
00028Amount of nature tourism
00029Number of visitors to protected sites per year
00030Number of local users for hiking, camping, nature walks jogging, winter sports, water sports, angling, horse riding, hunting, cycling
Education
00031Total number of visits, specially related to education or cultural reasons
00032Total number of educational excursions
00033Number of TV programs, studies, books, etc. featuring sites and the surrounding area
Land and property
00034Residential land and property value uplift (1 km from green space)
00035Commercial land/property value uplift (1 km from green space)
Resilience
00036Scoring according to portfolio of services and functions provided
Conservation benefits
00037Non-use benefits estimated by contingent valuation method or choice experiment
n sumCount19231311
Percentage29%35%20%17%

Appendix B

Table A4. A comprehensive GI typology for AMGI, adapted from Green Surge Milestone 23.
The Gray to Green ContinuumHuman Influence/Association with Green Infrastructure (GI)Class NumberGI ClassesType NumberGI Types/Ecosystem Service UnitAnalyzed GI Types in Our AMGI (YES/NO)
Remotesensing 11 01869 i001Associated to GI01blue spaces
001water courseYES
002water bodyYES
003estuaryNO
004deltaNO
005sea coastNO
Heterogeneous cultivation—biotic02arable land
006arable landYES
007bioenergy agriculture/agroforestryYES
03grassland
008pastureYES
009heathlandNO
010moorlandYES
04orchard
011tree meadow/meadow orchardYES
012horticultureYES
05forest
013managed forest, deciduous and coniferous YES
014woodland (low-density forest forming open habitats)YES
06shrubland
015vegetation dominated by shrubs, including grasses, herbsYES
natural, semi-natural areas—biotic07Private gardens
016front and backyard gardenNO
08River-related green
017riverbank greenYES
09Wetlands018fen, marsh, bog and wet flush vegetationYES
10parks or public green spaces
019large central park (historical park)YES
020pocket parkYES
021botanical gardenYES
022zoological gardenYES
023neighborhood green spaceYES
024institutional green spaceNO
025cemetery and churchyardYES
026sport and leisure facilityYES
027campsiteYES
11allotments and community gardens
028community garden (tended collectively by a group of people on private or public land)YES
029allotment (small plots for individuals which collectively make up a larger green space)YES
Man-made biotic close to gray infrastructure12building greens
030balcony greenNO
031ground-based green wallNO
032façade-bound green wallNO
033extensive green roofNO
034intensive green roofNO
035atriumNO
13commercial, industrial, institutional urban green space (UGS) and UGS connected to gray infrastructure
036bioswaleNO
037rain gardenYES
038railroad bankNO
039playground, school groundsYES
040ruderal areaYES
14Street trees
041tree alley, street tree, aligned hedgeYES
natural, semi-natural areas—abiotic15Natural abiotic surface
042rockNO
043sand duneNO
Not—GI16Human-induced abiotic surface
044sealed surface, impervious surface, built-up areaNO
045derelict land/abandoned areaNO
046sand pit, quarry, open cast mineNO

References

  1. European Environment Agency (EEA). Green Infrastructure and Territorial Cohesion. The Concept of Green Infrastructure and Its Integration into Policies Using Monitoring Systems; Technical Report 18; European Environment Agency: Copenhagen, Denmark, 2011; Available online: http://www.eea.europa.eu/publications/green-infrastructure-and-territorial-cohesion (accessed on 5 December 2016).
  2. Mazza, L.; Bennett, G.; De Nocker, L.; van Diggelen, R. Green infrastructure implementation and efficiency, Final Report for the European Commission, DG Environment on Contract ENV.B.2/SER/2010/0059; Institute for European Environmental Policy: Brussels, Belguim; London, UK, 2011. [Google Scholar]
  3. European Commission (EC). The Multifunctionality of Green Infrastructure. In Science for Environment Policy. In Depth Reports. March 2012. Available online: https://ec.europa.eu/environment/nature/ecosystems/docs/Green_Infrastructure.pdf (accessed on 20 February 2017).
  4. Wang, J.; Banzhaf, E. Towards a better understanding of Green Infrastructure: A critical review. Ecol. Indic. 2018, 85, 758–772. [Google Scholar] [CrossRef]
  5. Firehock, K. A Short History of the Term Green Infrastructure and Selected Literature. Available online: http://www.gicinc.org/PDFs/GI%20History.pdf.ed (accessed on 30 August 2018).
  6. Davies, C.; Hansen, R.; Rall, E.; Pauleit, S.; Lafortezza, R.; DeBellis, Y.; Santos, A.; Tosics, I. Green Infrastructure Planning and Implementation (GREEN SURGE). The Status of European Green Space Planning and Implementation Based on an Analysis of Selected European City-Regions, FP7-ENV.2013.6.2-5-603567; 2013-2017; Copenhagen, Denmark, 2015; 1–134. [CrossRef]
  7. Wang, J.; Xu, C.; Pauleit, S.; Kindler, A.; Banzhaf, E. Spatial patterns of urban green infrastructure for equity: A novel exploration. J. Clean Prod. 2019, 117858. [Google Scholar] [CrossRef]
  8. Hansen, R.; Rolf, W.; Santos, A.; Luz, A.; Száraz, L.; Tosics, I.; Vierikko, K.; Rall, E.; Davies, C.; Pauleit, S. Advanced urban green infrastructure planning and implementation: Innovative approaches and Strategies from European cities. Green Surge Proj. Deliv. Available online: https://greensurge.eu/ (accessed on 12 May 2018).
  9. Breuste, J.; Artmann, M.; Li, J.X.; Xie, M.M. Special Issue on Green Infrastructure for Urban Sustainability. J. Urban Plan. Dev. 2015, 141, 3. [Google Scholar] [CrossRef]
  10. Artar, M.; Gormus, S.; Cengiz, S. Landscape Assessments in Bartin (Tr) Via Green Infrastructure Approach. J. Environ. Prot. Ecol. 2016, 172, 737–746. [Google Scholar]
  11. Barau, A.S. Perceptions and contributions of households towards sustainable urban green infrastructure in Malaysia. Habitat. Int. 2015, 47, 285–297. [Google Scholar] [CrossRef]
  12. Meerow, S.; Newell, J.P. Spatial planning for multifunctional green infrastructure: Growing resilience in Detroit. Landsc. Urban Plan. 2017, 159, 62–75. [Google Scholar] [CrossRef]
  13. United Nations. Indicators of Sustainable Development: Framework and Methodologies; United Nations: New York, NY, USA, 1996. [Google Scholar]
  14. McDonald, L.; Allen, W.; Benedict, M.; O’connor, K. Green infrastructure plan evaluation frameworks. J. Conserv. Plan. 2005, 1, 12–43. [Google Scholar]
  15. Wright, H. Understanding green infrastructure: The development of a contested concept in England. Local Env. 2011, 16, 1003–1019. [Google Scholar] [CrossRef]
  16. Maes, J.; Teller, A.; Erhard, M.; Liquete, C.; Braat, L.; Berry, P.; Egoh, B.; Puydarrieux, P.; Fiorina, C.; Santos-Martín, F. Mapping and Assessment of Ecosystems and their Services—An. Analytical Framework for Ecosystem Assessments Under Action 5 of the EU Biodiversity Strategy to 2020; Publications Office of the European Union: Brussels, Belgium, 2013. [Google Scholar]
  17. Maes, J.; Liquete, C.; Teller, A.; Erhard, M.; Paracchini, M.L.; Barredo, J.I.; Grizzetti, B.; Cardoso, A.; Somma, F.; Petersen, J.E.; et al. An indicator framework for assessing ecosystem services in support of the EU Biodiversity Strategy to 2020. Ecosyst. Serv. 2016, 17, 14–23. [Google Scholar] [CrossRef]
  18. Maes, J.; Teller, A.; Erhard, M.; Murphy, P.; Paracchini, M.L.; Barredo, J.I.; Grizzetti, B.; Cardoso, A.; Somma, F.; Petersen, J.E. Mapping and Assessment of Ecosystems and their Services: Indicators for ecosystem assessments under Action 5 of the EU Biodiversity Strategy to 2020; Publications Office of the European Union: Brussels, Belgium, 2014. [Google Scholar]
  19. Naumann, S.; Davis, M.; Kaphengst, T.; Pieterse, M.; Rayment, M. Design, Implementation and Cost Elements of Green Infrastructure Projects; Final Report; European Commission: Brussels, Belgium, 2011; p. 138. [Google Scholar]
  20. Zhang, Z.; Meerow, S.; Newell, J.P.; Lindquist, M. Enhancing landscape connectivity through multifunctional green infrastructure corridor modeling and design. Urban For. Urban Green. 2019, 38, 305–317. [Google Scholar] [CrossRef]
  21. Pauleit, S.; Andersson, E.; Anton, B.; Buijs, A.; Haase, D.; Hansen, R.; Kowarik, I.; Stahl Olafsson, A.; Van der Jagt, S. Urban green infrastructure–connecting people and nature for sustainable cities. Urban For. Urban Green. 2019. [Google Scholar] [CrossRef]
  22. Maes, J.; Teller, A.; Erhard, M.; Liquete, C.; Braat, L.; Berry, P.; Egoh, B.; Puydarrieux, P.; Fiorina, C.; Santos-Martín, F. Mapping and Assessment of Ecosystems and their Services-Urban Ecosystems; 4th Report; Publications Office of the European Union: Brussels, Belgium, 2016. [Google Scholar]
  23. Gordon, B.L.; Quesnel, K.J.; Abs, R.; Ajami, N.K. A case-study based framework for assessing the multi-sector performance of green infrastructure. J. Environ. Manag. 2018, 223, 371–384. [Google Scholar] [CrossRef] [PubMed]
  24. Niemeijer, D.; de Groot, R.S. A conceptual framework for selecting environmental indicator sets. Ecol. Indic. 2008, 8, 14–25. [Google Scholar] [CrossRef]
  25. Cordier, M.; Agundez, J.A.P.; Hecq, W.; Hamaide, B. A guiding framework for ecosystem services monetization in ecological-economic modeling. Ecosyst. Serv. 2014, 8, 86–96. [Google Scholar] [CrossRef]
  26. East Midlands Development Agency. A Guide and Toolkit Green Infrastructure: Playind an Important Role in Achieving Sustainable Economic Growth; East Midlands Development Agency: Nottingham, UK, 2010. [Google Scholar]
  27. Haines-Young, R.; Potschin, M. The links between biodiversity, ecosystem services and human well-being. Ecosyst. Ecol. A New Synth. 2010, 110–139. [Google Scholar] [CrossRef]
  28. Rocha, S.M.Z.; Maes, J.; Thijssen, M. Mapping and Assessment of Ecosystems and their Services; Publications Office of the European Union: Brussels, Belgium, 2015; Volume 5, pp. 1–58. [Google Scholar]
  29. TEEB. Mainstreaming the Economics of Nature: A Synthesis of the Approach, Conclusions and Recommendations of TEEB; United Nations Environment Programme: Nairobi, Kenya, 2010. [Google Scholar]
  30. Reid, W.R.; Monney, H.A.; Cropper, A.; Capistrano, D.; Carpenter, S.R.; Chopra, K. Millennium Ecosystem Assessment, Ecosystems and Human Well-Being: Synthesis; Island Press: Washington, DC, USA, 2005. [Google Scholar]
  31. Vandermeulen, V.; Verspecht, A.; Vermeire, B.; Van Huylenbroeck, G.; Gellynck, X. The use of economic valuation to create public support for green infrastructure investments in urban areas. Lands. Urban Plan. 2011, 103, 198–206. [Google Scholar] [CrossRef]
  32. Ten Brink, B.; Tekelenburg, T. Biodiversity: How much is Left? The Natural Capital Index Framework; National Institute for Public Health and the Environment: Bilthoven, The Netherlands, 2002. [Google Scholar]
  33. Pauleit, S.; Ambrose-Oji, B.; Andersson, E.; Anton, B.; Buijs, A.; Haase, D.; Elands, B.; Hansen, R.; Kowarik, I.; Kronenberg, J.; et al. Advancing urban green infrastructure in Europe: Outcomes and reflections from the GREEN SURGE project. Urban For. Urban Green. 2019, 40, 4–16. [Google Scholar] [CrossRef]
  34. Green Infrastructure North West. Building Natural Value for Sustainable Economic Development: The Green Infrastructure Valuation Toolkit User Guide. Available online: http://www.greeninfrastructurenw.co.uk/resources/Green_Infrastructure_Valuation_Toolkit_UserGuide.pdf (accessed on 30 May 2018).
  35. Madad, A.; Gharagozlou, A.; Majedi, H.; Monavari, S. A quantitative representation of the urban green building model, focusing on local climatic factors by utilizing monetary valuation. Ecol. Econ. 2019, 161, 61–72. [Google Scholar] [CrossRef]
  36. Hansen, R.; Frantzeskaki, N.; McPhearson, T.; Rall, E.; Kabisch, N.; Kaczorowska, A.; Kain, J.-H.; Artmann, M.; Pauleit, S. The uptake of the ecosystem services concept in planning discourses of European and American cities. Ecosyst. Serv. 2015, 12, 228–246. [Google Scholar] [CrossRef] [Green Version]
  37. Rall, E.L.; Kabisch, N.; Hansen, R. A comparative exploration of uptake and potential application of ecosystem services in urban planning. Ecosyst. Serv. 2015, 16, 230–242. [Google Scholar] [CrossRef]
  38. Nielsen, A.B.; Hedblom, M.; Olafsson, A.S.; Wiström, B. Spatial configurations of urban forest in different landscape and socio-political contexts: Identifying patterns for green infrastructure planning. Urban Ecosyst. 2016, 1–14. [Google Scholar] [CrossRef]
  39. Herzog, C.P. A multifunctional green infrastructure design to protect and improve native biodiversity in Rio de Janeiro. Landsc. Ecol. Eng. 2016, 12, 141–150. [Google Scholar] [CrossRef]
  40. Fish, R.; Church, A.; Willis, C.; Winter, M.; Tratalos, J.A.; Haines-Young, R.; Potschin, M. Making space for cultural ecosystem services: Insights from a study of the UK nature improvement initiative. Ecosyst. Serv. 2016, 21, 329–343. [Google Scholar] [CrossRef] [Green Version]
  41. Mell, I. Global green infrastructure: Lessons for successful policy-making, investment and management; Routledge: London, UK, 2016. [Google Scholar]
  42. Kronenberg, J.; Andersson, E. Integrated Valuation: Integrating Value Dimensions and Valuation Methods. GREEN SURGE project (Milestone MS32). Available online: https://greensurge.eu/ (accessed on 12 May 2018).
  43. Wang, J.; Banzhaf, E. Derive an Understanding of Green Infrastructure for the Quality of Life in Cities by Means of Integrated RS Mapping Tools. In Proceedings of the Urban Remote Sensing Event, Joint 2017, Dubai, UAE, 6–8 March 2017. [Google Scholar] [CrossRef]
  44. Hong, S.-K.; Song, I.-J.; Byun, B.; Yoo, S.; Nakagoshi, N. Applications of biotope mapping for spatial environmental planning and policy: Case studies in urban ecosystems in Korea. Landsc. Ecol. Eng. 2005, 1, 101–112. [Google Scholar] [CrossRef]
  45. Mansuroglu, S.; Ortacesme, V.; Karaguzel, O. Biotope mapping in an urban environment and its implications for urban management in Turkey. J. Environ. Manag. 2006, 81, 175–187. [Google Scholar] [CrossRef] [PubMed]
  46. Zhao, Z.-b.; Xue, L.; Zhang, J.; WEI, H.-Y. Urban Biotope Mapping and Nature Conservation Planning in Typical Area of Xi’an City of China. Sci. Geogr. Sin. 2007, 27, 561. (In Chinese) [Google Scholar]
  47. Elvenes, S.; Dolan, M.F.; Buhl-Mortensen, P.; Bellec, V.K. An evaluation of compiled single-beam bathymetry data as a basis for regional sediment and biotope mapping. ICES J. Mar. Sci. 2013, 71, 867–881. [Google Scholar] [CrossRef] [Green Version]
  48. Werner, P.; Zahner, R. Urban patterns and biological diversity: A review. Urban Biodivers. Des. 2010, 145. [Google Scholar] [CrossRef]
  49. Grunewald, K.; Syrbe, R.U.; Bastian, O. Landscape management accounting as a tool for indicating the need of action for ecosystem maintenance and restoration - Exemplified for Saxony. Ecol. Indic. 2014, 37, 241–251. [Google Scholar] [CrossRef]
  50. European Environment Agency (EEA). Global Monitoring for Environment and Security (GMES): Copernicus Land Monitoring Service: Urban Atlas data. 2017. Available online: https://www.eea.europa.eu/data-and-maps/data/copernicus-land-monitoring-service-urban-atlas#tab-gis-data (accessed on 17 May 2018).
  51. Sächsisches Landesamt für Umwelt Landwirtschaft und Geologie. (CIR Biotope Type and Land-Use Map Saxony 2005) CIR-Biotoptypen-und Landnutzungskartierung Sachsen 2005. 2008. (In German)
  52. Mazerolle, M.J.; Villard, M.-A. Patch characteristics and landscape context as predictors of species presence and abundance: A review 1. Écoscience 1999, 6, 117–124. [Google Scholar] [CrossRef]
  53. Mathieu, R.; Freeman, C.; Aryal, J. Mapping private gardens in urban areas using object-oriented techniques and very high-resolution satellite imagery. Landsc. Urban Plan. 2007, 81, 179–192. [Google Scholar] [CrossRef]
  54. Banzhaf, E.; Kollai, H.; Kindler, A. Mapping urban grey and green structures for liveable cities using a 3D enhanced OBIA approach and vital statistics. Geocarto Int. 2018, 1–18. [Google Scholar] [CrossRef]
  55. Banzhaf, E.; Kollai, H. Land Use/Land Cover for Leipzig, Germany, for 2012 by an Object-Based Image Analysis. PANGAEA 2018. [Google Scholar] [CrossRef]
  56. Stadt Leipzig, Statistics: Willkommen beim Leipzig-Informationssystem. Available online: https://statistik.leipzig.de/ (accessed on 5 March 2019).
  57. Haines-Young, R.; Potschin, M.B. Common International Classification of Ecosystem Services (CICES) V5.1 and Guidance on the Application of the Revised Structure. European Environment Agency (EEA). Available online: https://cices.eu/ (accessed on 7 June 2018).
  58. Kabisch, N.; Strohbach, M.; Haase, D. Internal Project Report on Inventory of Urban Green Space Demand for the Two Scale Levels, ULLS and European Urban Atlas Cities. 2015; p. 16. Available online: https://greensurge.eu/ (accessed on 12 May 2018).
  59. Peng, J.; Hu, X.; Qiu, S.; Hu, Y.; Meersmans, J.; Liu, Y. Multifunctional landscapes identification and associated development zoning in mountainous area. Sci. Total Environ. 2019, 660, 765–775. [Google Scholar] [CrossRef] [PubMed] [Green Version]
  60. Willemen, L.; Hein, L.; Van Mensvoort, M.E.; Verburg, P.H. Space for people, plants, and livestock? Quantifying interactions among multiple landscape functions in a Dutch rural region. Ecol. Indic. 2010, 10, 62–73. [Google Scholar] [CrossRef]
  61. Chainey, S. Advanced Hotspot Analysis: Spatial Significance Mapping Using Gi*; UCL Jill Dando Institute of Crime Science, University College London: London, UK, 2010. [Google Scholar]
  62. Manepalli, U.R.; Bham, G.H.; Kandada, S. Evaluation of hotspots identification using kernel density estimation (K) and Getis-Ord (Gi*) on I-630. In Proceedings of the 3rd International Conference on Road Safety and Simulation, Indianapolis, IN, USA, 14–16 September 2011; pp. 14–16. [Google Scholar]
  63. Getis, A.; ORD, J. The analysis of spatial association by use of distance statistics. Geogr. Anal. 1992, 24, 189–206. [Google Scholar] [CrossRef]
  64. Poelman, H. A Walk to the Park? Assessing Access to Green Areas in Europe’s Cities. 2018. Available online: https://ec.europa.eu/regional_policy/sources/docgener/work/2016_03_green_urban_area.pdf (accessed on 17 October 2018).
  65. Schwarz, N.; Schlink, U.; Franck, U.; Grossmann, K. Relationship of land surface and air temperatures and its implications for quantifying urban heat island indicators—An application for the city of Leipzig, Germany. Ecol. Indic. 2012, 18, 693–704. [Google Scholar] [CrossRef]
  66. Priess, J.; Elger, R.; Hauck, J. The ESM-App–A New Smartphone Application to Map Ecosystem Services. In Proceedings of the 7th International Congress on Environmental Modelling and Software, San Diego, CA, USA, 15–19 June 2014; pp. 15–19. [Google Scholar]
  67. Strohbach, M.W.; Haase, D. Above-ground carbon storage by urban trees in Leipzig, Germany: Analysis of patterns in a European city. Landsc. Urban Plan. 2012, 104, 95–104. [Google Scholar] [CrossRef]
  68. Derkzen, M.L.; van Teeffelen, A.J.A.; Verburg, P.H. Quantifying urban ecosystem services based on high-resolution data of urban green space: an assessment for Rotterdam, the Netherlands. J. Appl. Ecol. 2015, 52, 1020–1032. [Google Scholar] [CrossRef]
  69. Stadt Leipzig, City of Leipzig: Flood Control. Available online: https://english.leipzig.de/environment-and-transport/environmental-protection-and-nature-conservation/flood-control/ (accessed on 5 March 2019).
  70. Kubal, C.; Haase, D.; Meyer, V.; Scheuer, S. Integrated urban flood risk assessment—Adapting a multicriteria approach to a city. Nat. Hazards Earth Syst. Sci. 2009, 9, 1881–1895. [Google Scholar] [CrossRef]
  71. Statistisches Landesamt Sachsen, Sachsen Statistisk. Available online: https://www.statistik.sachsen.de (accessed on 5 March 2019).
  72. Statistik der Bundesagentur für Arbeit, Zahlen, Daten, Fakten: Strukturdaten Und-Indikatoren; Agentur für Arbeit Leipzig, Nürnberg. Available online: https://statistik.arbeitsagentur.de/Statistikdaten/Detail/201406/iiia4/zdf-sdi/sdi-075-0-201406-pdf.pdf (accessed on 30 July 2018).
  73. Wohnungsbörse Leipzig, Mietspigel Leipzig Online. Available online: https://www.wohnungsboerse.net/mietspiegel-Leipzig/7390 (accessed on 5 June 2019).
  74. Stadt Leipzig Sozialamt, Leipzigspigel. Available online: https://www.leipzig.de/fileadmin/mediendatenbank/leipzig-de/Stadt/02.5_Dez5_Jugend_Soziales_Gesundheit_Schule/50_Sozialamt/Veroeffentlichungen/Leipziger-Mietspiegel-2016.pdf (accessed on 5 June 2019).
  75. Benedict, M.A.; McMahon, E.T. Green Infrastructure: Smart Conservation for the 21st Century; Island: Washington, DC, USA, 2006. [Google Scholar]
  76. Hansen, R.; Pauleit, S. From Multifunctionality to Multiple Ecosystem Services? A Conceptual Framework for Multifunctionality in Green Infrastructure Planning for Urban Areas. Ambio 2014, 43, 516–529. [Google Scholar] [CrossRef] [PubMed] [Green Version]
  77. Zulian, G.; Paracchini, M.L.; Maes, J.; Liquete, C. ESTIMAP: Ecosystem services mapping at European scale; Joint Research Centre Report EUR: Ispra, Italy, 2013; Volume 26474. [Google Scholar]
  78. Maes, J.; Zulian, G.; Thijssen, M. Enhancing Resilience of Urban Ecosystems Through Green Infrastructure (EnRoute); Inception Report; Publications Office of the European Union: Luxembourg, 2017. [Google Scholar]
  79. Maes, J.; Zulian, G.; Günther, S.; Thijssen, M.; Raynal, J. Enhancing Resilience of Urban Ecosystems Through Green Infrastructure (EnRoute); Final Report; EUR 29630 EN; Publications Office of the European Union: Luxembourg, 2019. [Google Scholar]
  80. Brown, G. Social–ecological hotspots mapping: A spatial approach for identifying coupled social–ecological space. Landsc. Urban Plan. 2008, 85, 27–39. [Google Scholar]
  81. De Vreese, R.; Leys, M.; Fontaine, C.; Dendoncker, N. Social mapping of perceived ecosystem services supply—The role of social landscape metrics and social hotspots for integrated ecosystem services assessment, landscape planning and management. Ecol. Indic. 2016, 66, 517–533. [Google Scholar] [CrossRef]
  82. Madureira, H.; Andresen, T. Planning for multifunctional urban green infrastructures: Promises and challenges. Urban Des. Int. 2014, 19, 38–49. [Google Scholar] [CrossRef]
  83. Zhu, Z.; Bi, J.; Pan, Y.; Ganguly, S.; Anav, A.; Xu, L.; Samanta, A.; Piao, S.; Nemani, R.; Myneni, R. Global data sets of vegetation leaf area index (LAI) 3g and fraction of photosynthetically active radiation (FPAR) 3g derived from global inventory modeling and mapping studies (GIMMS) normalized difference vegetation index (NDVI3g) for the period 1981 to 2011. Remote Sens. 2013, 5, 927–948. [Google Scholar]
  84. Li, S.; Dai, L.; Wang, H.; Wang, Y.; He, Z.; Lin, S. Estimating leaf area density of individual trees using the point cloud segmentation of terrestrial LiDAR data and a voxel-based model. Remote Sens. 2017, 9, 1202. [Google Scholar] [CrossRef]
Figure 1. Potential contributions of selected indicator frameworks I to III for Assessment of Multifunctional Green Infrastructure (AMGI) (dashed arrows indicate the potential contributions; arrows show proven developments).
Remotesensing 11 01869 g001
Figure 2. Flowchart on using the integrated indicator framework to conduct an AMGI.
Remotesensing 11 01869 g002
Figure 3. Remote sensing datasets from relative coarse, intermediate, to fine scale as supportive tools for the AMGI in Leipzig.
Remotesensing 11 01869 g003
Figure 4. Indicator framework I to III in terms of ecological, socio-cultural, socio-economic, and human health dimensions.
Remotesensing 11 01869 g004
Figure 5. The location and Land Use and Cover map of the illustrative case at urban scale, in the City of Leipzig, Germany.
Remotesensing 11 01869 g005
Figure 6. Results from indicator selections for the illustrative case in Leipzig, Germany.
Remotesensing 11 01869 g006
Figure 7. Spatial distributions of hot/cold spots of GI functions.
Remotesensing 11 01869 g007
Figure 8. Spatial distribution of GI multifunctionality in Leipzig, Germany.
Remotesensing 11 01869 g008
Figure 9. The results of Stage 3 exemplified in Leipzig.
Remotesensing 11 01869 g009
Table 1. Transformation of the structure of Indicator Framework I from Mapping and Assessment Ecosystem Services (MAES) into ten GI benefit groups (Indicator codes refer to Table A1).
MAES ClassesGI Benefit GroupsIndicator Codes from Indicator Framework I
ProvisionNatural resources01, 02, 05, 28, 29
Water management03, 04, 06
Regulation and maintenanceClimate regulation07, 08, 10 to 16, 18, 20, 21
Health and well-being *09, 17, 19, 26
Resilience22, 23, 24, 25, 27
CulturalTourism and recreation30 to 38
Education39
Conservation benefits40
(* GI benefit health and well-being relates to the indicators merely on human exposure, in alignment with the definition from the final report on GI implementation and Efficiency by Mazza et al. [2], although we are aware that health and well-being has a close connotation to cultural services. With regard to the definitions for GI benefits, we are in line with the source of indicator frameworks [2].)
Table 2. A lean indicator framework to exemplify AMGI, adapted and selected from integrated framework.
Indicator & UnitData BaseData TypeMethod/SourceValues
Average Carbon storage (MgC/ha)Biotope mappingPolygonAnalysis and extraction from Strohbach and Haase (2012) [67], and Derkzen et al. (2015) [68]11.80
Community gardens/allotments for food self-consumption per inhabitant (m2/inhabitant (inh.). )Biotope mappingPolygonCalculation and aggregation *28.20
Share of water surface (%)Local Land Use and Cover mapPolygonCalculation and aggregation *2.50
Shares of wetlands for water regulation (%) Biotope mappingPolygonCalculation and aggregation *0.04
Vegetation areas alongside with water courses for water regulation (ha)Biotope mappingPolygonIdentification and calculation0.14
Share of green areas in municipal districts in danger of floods (%)Biotope mappingPolygonCalculation and aggregation56.65
Share areas of municipal districts potentially exposed to urban flooding (%)Biotope mappingPolygonCalculation and aggregation42.83
Cooling effects of GI compared to sealed surfaces (°C/m2)Urban AtlasRasterAnalysis and extraction from Schwarz et al. (2012) [65]0.25
Recreation spaces per inhabitant (m2/inh.)Biotope mappingPolygonCalculation and aggregation *69.51
Total areas of urban alluvial forests for habitat, species and genetic diversity (ha)Biotope mappingPolygonIdentification and calculation *1033.00
Areas exposed to extreme flood risk (km2)Local case study-Data from Kubal et al. (2009) [70]45.00
Share of areas exposed to flooding (%)Local case studyPolygonData from Kubal et al. (2009) [70]8.00
Share of population exposed to flood riskBiotope mappingPolygonCalculation and aggregation46.18
Population without urban green spaces in their neighborhood (%)Urban Atlas, PolygonMethod newly introduced by Poelman [64]2.37
Increased physical activities in GI areasField surveysPointObservation and surveyN/A
Employment in directly GI related sectors (agriculture, forestry, and fisheries (%)Sachsen Statistics [71]-Statistik der Bundesagentur für Arbeit [72]13.70
Residential land and property increment value (1 km from green areas)Wohnungsbörse Leipzig [73]-Literature [74]N/A
Total number of visits specially related to education or for cultural reasons (inh.)Statistics-LiteratureN/A
* This indicator was adapted and further used for GI function mapping to identify the spatial distribution of hotspots of GI functions.

