Article

Dust Properties and Radiative Impacts at a Suburban Site during 2004–2017 in the North China Plain

1
Key Laboratory of Middle Atmosphere and Global Environment Observation, Institute of Atmospheric Physics, Chinese Academy of Sciences, Beijing 100029, China
2
Collaborative Innovation Center on Forecast and Evaluation of Meteorological Disasters, Nanjing University of Information Science & Technology, Nanjing 210044, China
3
University of Chinese Academy of Sciences, Beijing 100049, China
*
Author to whom correspondence should be addressed.
Remote Sens. 2019, 11(16), 1842; https://doi.org/10.3390/rs11161842
Submission received: 8 July 2019 / Revised: 6 August 2019 / Accepted: 6 August 2019 / Published: 7 August 2019
(This article belongs to the Section Atmospheric Remote Sensing)

Abstract

:
Aerosols and their radiative effects are of primary interest in climate research because of their vital influence on climate change. Dust aerosols are an important aerosol type in the North China Plain (NCP), mainly as a result of long-range transport, showing substantial spatiotemporal variations. By using measurements from the Aerosol Robotic Network (AERONET) between September 2004 and May 2017, and the space-borne Moderate Resolution Imaging Spectroradiometer (MODIS) and Cloud-Aerosol Lidar and Infrared Pathfinder Satellite Observations (CALIPSO) aerosol products, we investigated the properties of dust aerosols and their radiative effects at Xianghe (XH)—a suburban site in the NCP. Dust events occurred most frequently during spring (a total of 105 days) relative to the other three seasons (a total of 41 days) during the periods concerned. The dust aerosol optical depth (AOD) at 675 nm was at a maximum in spring (0.60 ± 0.44), followed (in decreasing order) by those in autumn (0.58 ± 0.39), summer (0.54 ± 0.15), and winter (0.53 ± 0.23). Cooling effects of dust aerosol radiative forcing (RF) at the bottom and top of the atmosphere tended to be strongest in spring (−96.72 ± 45.69 and −41.87 ± 19.66 Wm−2) compared to that in summer (−57.08 ± 18.54 and −25.54 ± 4.45 Wm−2), autumn (−72.01 ± 27.27 and −32.54 ± 15.18 Wm−2), and winter (−79.57 ± 32.96 and −37.05 ± 17.06 Wm−2). The back-trajectory analysis indicated that dust air mass at 500 m that arrived at XH generally originated from the Gobi and other deserts of northern China and Mongolia (59.8%), and followed by northwest China and Kazakhstan (37.2%); few dust cases came from northeast China (3.0%). A single-peaked structure with the maximum occurring at ~2 km was illustrated by all dust events and those sorted by their sources in three directions. Three typical dust events were specifically discussed to better reveal how long-range transport impacted the dust properties and radiative effects over the NCP. The results presented here are expected to improve our understanding of the physical properties of dust aerosols over the NCP and their major transport path and significant impacts on the regional solar radiation budget.

Graphical Abstract

1. Introduction

Dust aerosols are one of the important components of the global atmosphere that can influence the Earth’s climate via direct, semi-direct, and indirect effects [1,2,3]. Dust is estimated to contribute to approximately 25% of the global average aerosol optical depth (AOD) in the mid-visible wavelengths [4]. Asian dust is a seasonal meteorological phenomenon that affects much of East Asia sporadically during the springtime months. Dust originates in the Gobi and other deserts of Mongolia, northern China and Kazakhstan, where dense clouds of fine and dry soil particles are sporadically emitted into the atmosphere under favorable weather conditions [5]. These dust clouds are then carried eastward by prevailing winds and passed over downwind regions, including the eastern parts of China, Korea, Japan, and the Pacific Ocean [6,7].
The physical and optical properties of dust and anthropogenic aerosols are quite different [8]. Early measurements during the 1970s showed that dust was strongly absorbed, with an imaginary refractive index of 0.0053 to 0.008 at 550 nm; however, more recent analyses have indicated that dust is absorbed much less, with an imaginary refractive index of 0.0001 to 0.0046 at 550 nm in the Saharan desert region and 0.0024 ± 0.0034 over the Arabian Peninsula [9]. Dust absorption is mainly determined by the iron oxide content, which is highly variable due to the heterogeneous mineralogical content in soils [10,11]. Therefore, one would expect different dust absorption levels in different desert regions. Anthropogenic aerosols are major fine mode particles, and their absorption shows much weaker wavelength dependence [12]. Differences in the emissions of anthropogenic absorption components, such as black carbon, should undoubtedly make differences in aerosol absorption.
The North China Plain (NCP), where rapid economic and population growth have occurred during the past few decades, has become one of the most densely populated regions in the world [13]. Anthropogenic fine particles, as a result of industrial and agricultural activities and rapid urbanization, are likely mixed with long-range transported coarse dust particles in spring, leading to the rather complex nature of physical and optical aerosol properties. Increasing evidence suggests that the emission of fine anthropogenic aerosols and the long-range transport of coarse dust particles over the NCP are not only a serious atmospheric environmental issue but also significantly influence the energy budget and East Asia monsoon [14]. Using the ground-based observations of aerosols and solar radiation at Xianghe (XH), an Aerosol Robotic Network (AERONET) station and a Baseline Surface Radiation Network (BSRN) in the NCP, Li [15] reported that the annual daily mean surface aerosol radiative effects under clear skies approached −24 Wm−2, which was comparable to the cloud radiative effects (41 Wm−2). Heavy aerosol loading and notable temporal variation over the NCP were revealed by AOD measurements at four AERONET sites and eight radiation stations and showed that coarse dust particles contributed to 68% (±5%) of the AOD at 550 nm in dust source regions [16]. The external linear mixing of both fine- and coarse-mode components dominates variations in the complex refractive index and single scattering albedo (SSA) in spring and winter when the fine-mode fraction is less than approximately 0.6 [17,18].
Radiative effects originating from dust and anthropogenic fine aerosols should be different as a result of their differences in physical and optical properties. Previous studies were performed on such investigations in the NCP [19,20,21]. However, the long-term statistics of dust properties and their radiative effects, especially their potential differences among various dust sources, are still insufficient. Further understanding these issues, which was also the main objective of this study, is deeply needed for model validation. To achieve this, long-term aerosol measurements (from September 2004 to May 2017) at XH were used to investigate the properties of dust events in the NCP, which was aided by ground-based BSRN measurements, satellite observations and back-trajectory analysis.
The paper is organized as follows. Section 2 briefly describes the site, data and methodology. Section 3 presents the results, which are composed of dust aerosol optical properties, dust vertical distribution, dust radiative effects, and detailed case explorations of three typical dust events. The main conclusions are summarized in Section 4.

2. Site, Data and Methodology

2.1. Site

An aerosol-radiation-cloud platform was established at XH (39.75°N, 116.96°E; 36 m above sea level) in September 2004 as part of the “East Asian Study of Tropospheric Aerosols: An International Regional Experiment” project [22]. This platform has taken continuous measurements of various radiative and aerosol quantities since then. XH is one of the counties of Hebei Province (HB) that is located between the two megacities of Beijing (BJ) and Tianjin (TJ) at distances of ~70 and ~90 km, respectively; it is ~110 and ~500 km away from the nearest coastlines of the Bohai Sea and Yellow Sea, respectively. The site is surrounded by cropland, densely occupied residences and light industry. XH experiences both natural aerosols and anthropogenic urban and rural pollutants depending on the wind direction [23]. Based on our existing objective knowledge of dust sources and considering their gross geographic areas, this study discusses the dust that arrived at XH from three of the largest possible sources/directions of China: I) northwest, II) north, and III) northeast (as shown in Figure 1). As aforementioned, the first two directions are the dominate dust sources of China [5]. Meanwhile, dust deserts also largely distributed in northeast China, such as Horqin, Nenjiang, and Hulunbeier which can produce high dust emission [24,25,26]. Compared to the first two directions (northwest and north), the dust from the northeast might be readily mixed with the anthropogenic aerosols associated with the heavy industrial emission in northeast China.

2.2. Data

2.2.1. Ground-Based Measurements

A Cimel-318 sunphotometer, which is the standard instrument of AERONET, was used to provide nearly continuous aerosol data at XH from September 2004. High-quality and long-duration aerosol measurements with good continuity from this site are suitable for the climatological analysis of dust aerosols over the NCP. Cimel is used to measure the direct solar spectral radiation at 10 wavelengths from 340 to 1020 nm and the sky radiance at four wavelengths (440, 675, 870, and 1020 nm). The Cimel-based AOD uncertainty was 0.01 to 0.02 [27]. The extinction Ångström exponent (EAE), which is a measure of the wavelength dependence of the AOD, is inversely related to the particle size. The aerosol inversion algorithm developed by Reference [28] was further improved to take into account the nonspherical shapes of aerosol particles [29], which provides physical and optical aerosol properties, such as the aerosol size distribution, aerosol complex refractive index, SSA, asymmetry factor and absorption Ångström exponent (AAE). The AAE is a measure of the wavelength dependence of the absorption AOD. We analyzed the instantaneous parameters derived from the latest AERONET Version 3 cloud cleared and quality assured Level 2 inversion algorithm, namely, AOD675 nm, SSA675 nm, EAE440–870 nm, AAE440–870 nm, and the radiative forcing (RF) of dust at the bottom (BOA) and top (TOA) of the atmosphere (hereafter abbreviated as AOD, SSA, EAE, AAE, RFBOA and RFTOA, respectively), to study how dust events evolve and impact the radiative effect. The Version 3 Level 2 inversion data, which are now available from September 2004 to May 2017 on the AERONET website, were used in this study.
RFBOA and RFTOA are from the inversion algorithm product which uses the Discrete Ordinate Radiative Transfer module based on the retrieved aerosol size distribution and complex refractive index [30]. Instantaneous RFBOA and RFTOA during the dust periods were analyzed in this study. Additionally, the dust RF efficiency (RFE, which is defined as RF divided by AOD) at the BOA and TOA (RFEBOA and RFETOA) are also analyzed. To confirm the veracity of AERONET inversion algorithm calculations, the BSRN data from the XH site was taken as the benchmark for comparison. XH is equipped with both independent and redundant pyranometers to measure surface radiation for quality control purposes. Surface solar radiation is measured with Kipp and Zonne’s CM21 and CM11 radiometers at a 1-minute temporal resolution [17]. The data were quality-checked using the BSRN quality control procedure [31] and then submitted to the BSRN data archive.

2.2.2. Space-Borne Measurements

Moderate Resolution Imaging Spectroradiometer (MODIS) red-green-blue (RGB) images from the Terra/Aqua satellites are used to display the horizontal dust distributions for the case studies. Terra rotates in a descending orbit, with its equatorial crossing time at 10:30 a.m., while Aqua crosses the equator in an ascending orbit at 1:30 p.m. The MODIS instrument, which can provide near-global daily observations of the Earth over a wide spectral range (from 0.41 to 15 μm), has been widely used to derive the spectral AOD over land. Note that all AOD observations were provided by the ground-based Cimel and only MODIS-based RGB images were used in this study.
The Cloud-Aerosol Lidar and Infrared Pathfinder Satellite Observations (CALIPSO)-based aerosol measurements were used to demonstrate the vertical dust distributions. The primary instrument on the CALIPSO satellite is the Cloud-Aerosol Lidar with Orthogonal Polarization (CALIOP), a near-nadir viewing two-wavelength polarization-sensitive instrument. CALIOP is an active sensor that takes the range-resolved measurements of atmospheric constituents; it does not require assumptions about the vertical distribution and surface reflectance of these constituents, which are fundamental to most passive measurements [32,33]. Dust aerosol types from CALIOP-based Lidar Level 2 Aerosol Profile data product of Version 4.20 were used in this study. Aerosol types are determined by CALIOP using integrated attenuated backscatter measurements, volume depolarization ratio measurements, surface type, and the layer altitude [34].

2.3. Back-Trajectory Calculation

To understand the dust source origin, a three-day back-trajectory calculated by the Hybrid Single Particle Lagrangian Integrated (HYSPLIT) trajectory model [35] was used to explore the source of the air mass. The HYSPLIT model, which was developed by the National Oceanic and Atmospheric Administration Air Resources Laboratory, is one of the most extensively used atmospheric transport and dispersion models. It is a complete system for computing simple air parcel trajectories and complex transport, dispersion, chemical transformation, and deposition simulations [36,37]. One of its most common applications is back-trajectory analysis, which is used to determine the origin of air masses and establish source-receptor relationships [38,39].

2.4. Determination of Dust Aerosols

Dust aerosols have been widely determined by deploying a threshold value of EAE and AOD at various wavelength to the ground-based and space-borne measurements [9,40,41]. Dust aerosols are generally characterized by an EAE typically less than 0.6 over desert sites [42,43,44]. The contributions of fine-mode aerosols other than dust are also not negligible, even in dust regions [17]. To minimize the contributions of fine-mode aerosols based on previous studies [9,42], retrievals with EAE < 0.6 and AOD > 0.2 were classified as dust aerosol and analyzed in this study. Although the size of sea salt is comparable to that of dust, long-range transport of sea salt is negligible at XH based on the back-trajectory calculations of this study, especially in spring and winter when the prevailing wind is from north and northwest directions [45]. Therefore, we tended to use EAE as the sole parameter selecting dust events.

3. Results

3.1. Dust Aerosol Optical Properties

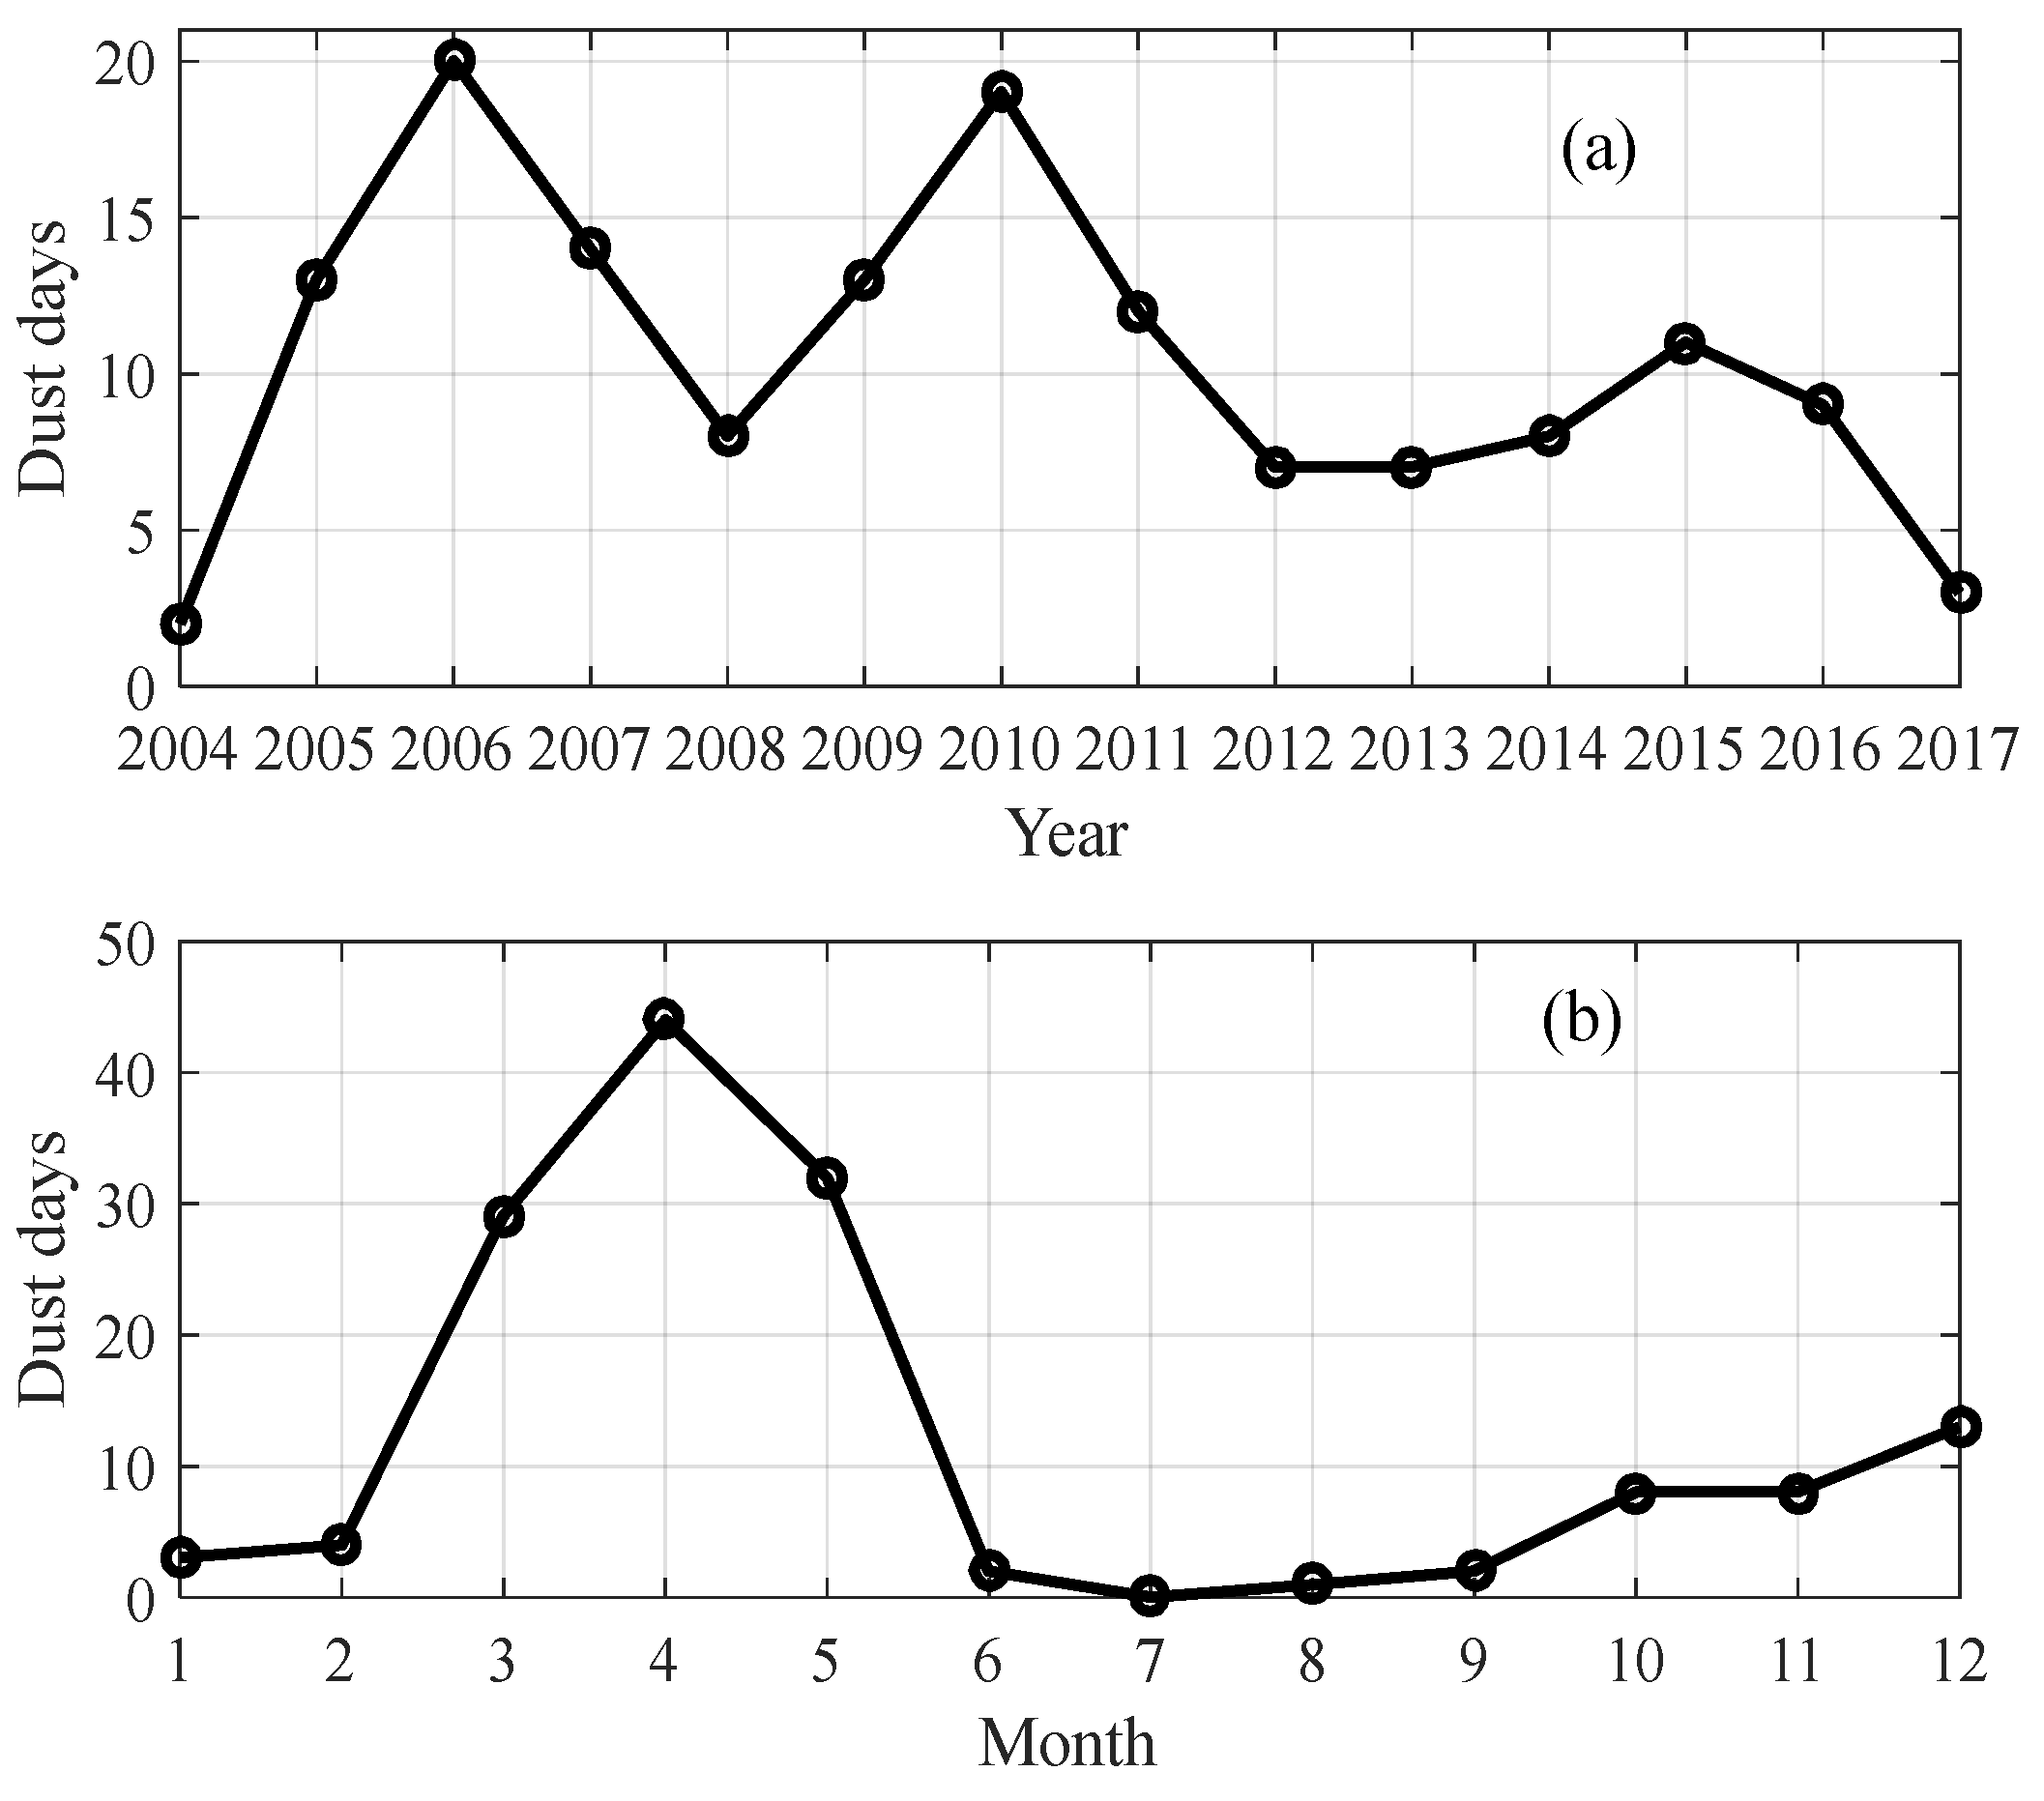
Figure 2 presents the annual and monthly statistics of dust days. A total of 146 dust days occurred during 2004–2017. The maximum number of dust days was 20 in 2006. A decreasing variability pattern was roughly presented after 2010. Note that the small dust numbers in 2004 and 2017 are associated with their incomplete periods of the Level 2 inversion data. In view of the monthly variations, a typical characteristic was that dust events appeared most frequently during springtime. Dust also tended to occur in the end months of a year (October, November, and December), although their frequencies were generally less than those in spring. Few dust cases occurred near summertime (between June and September).
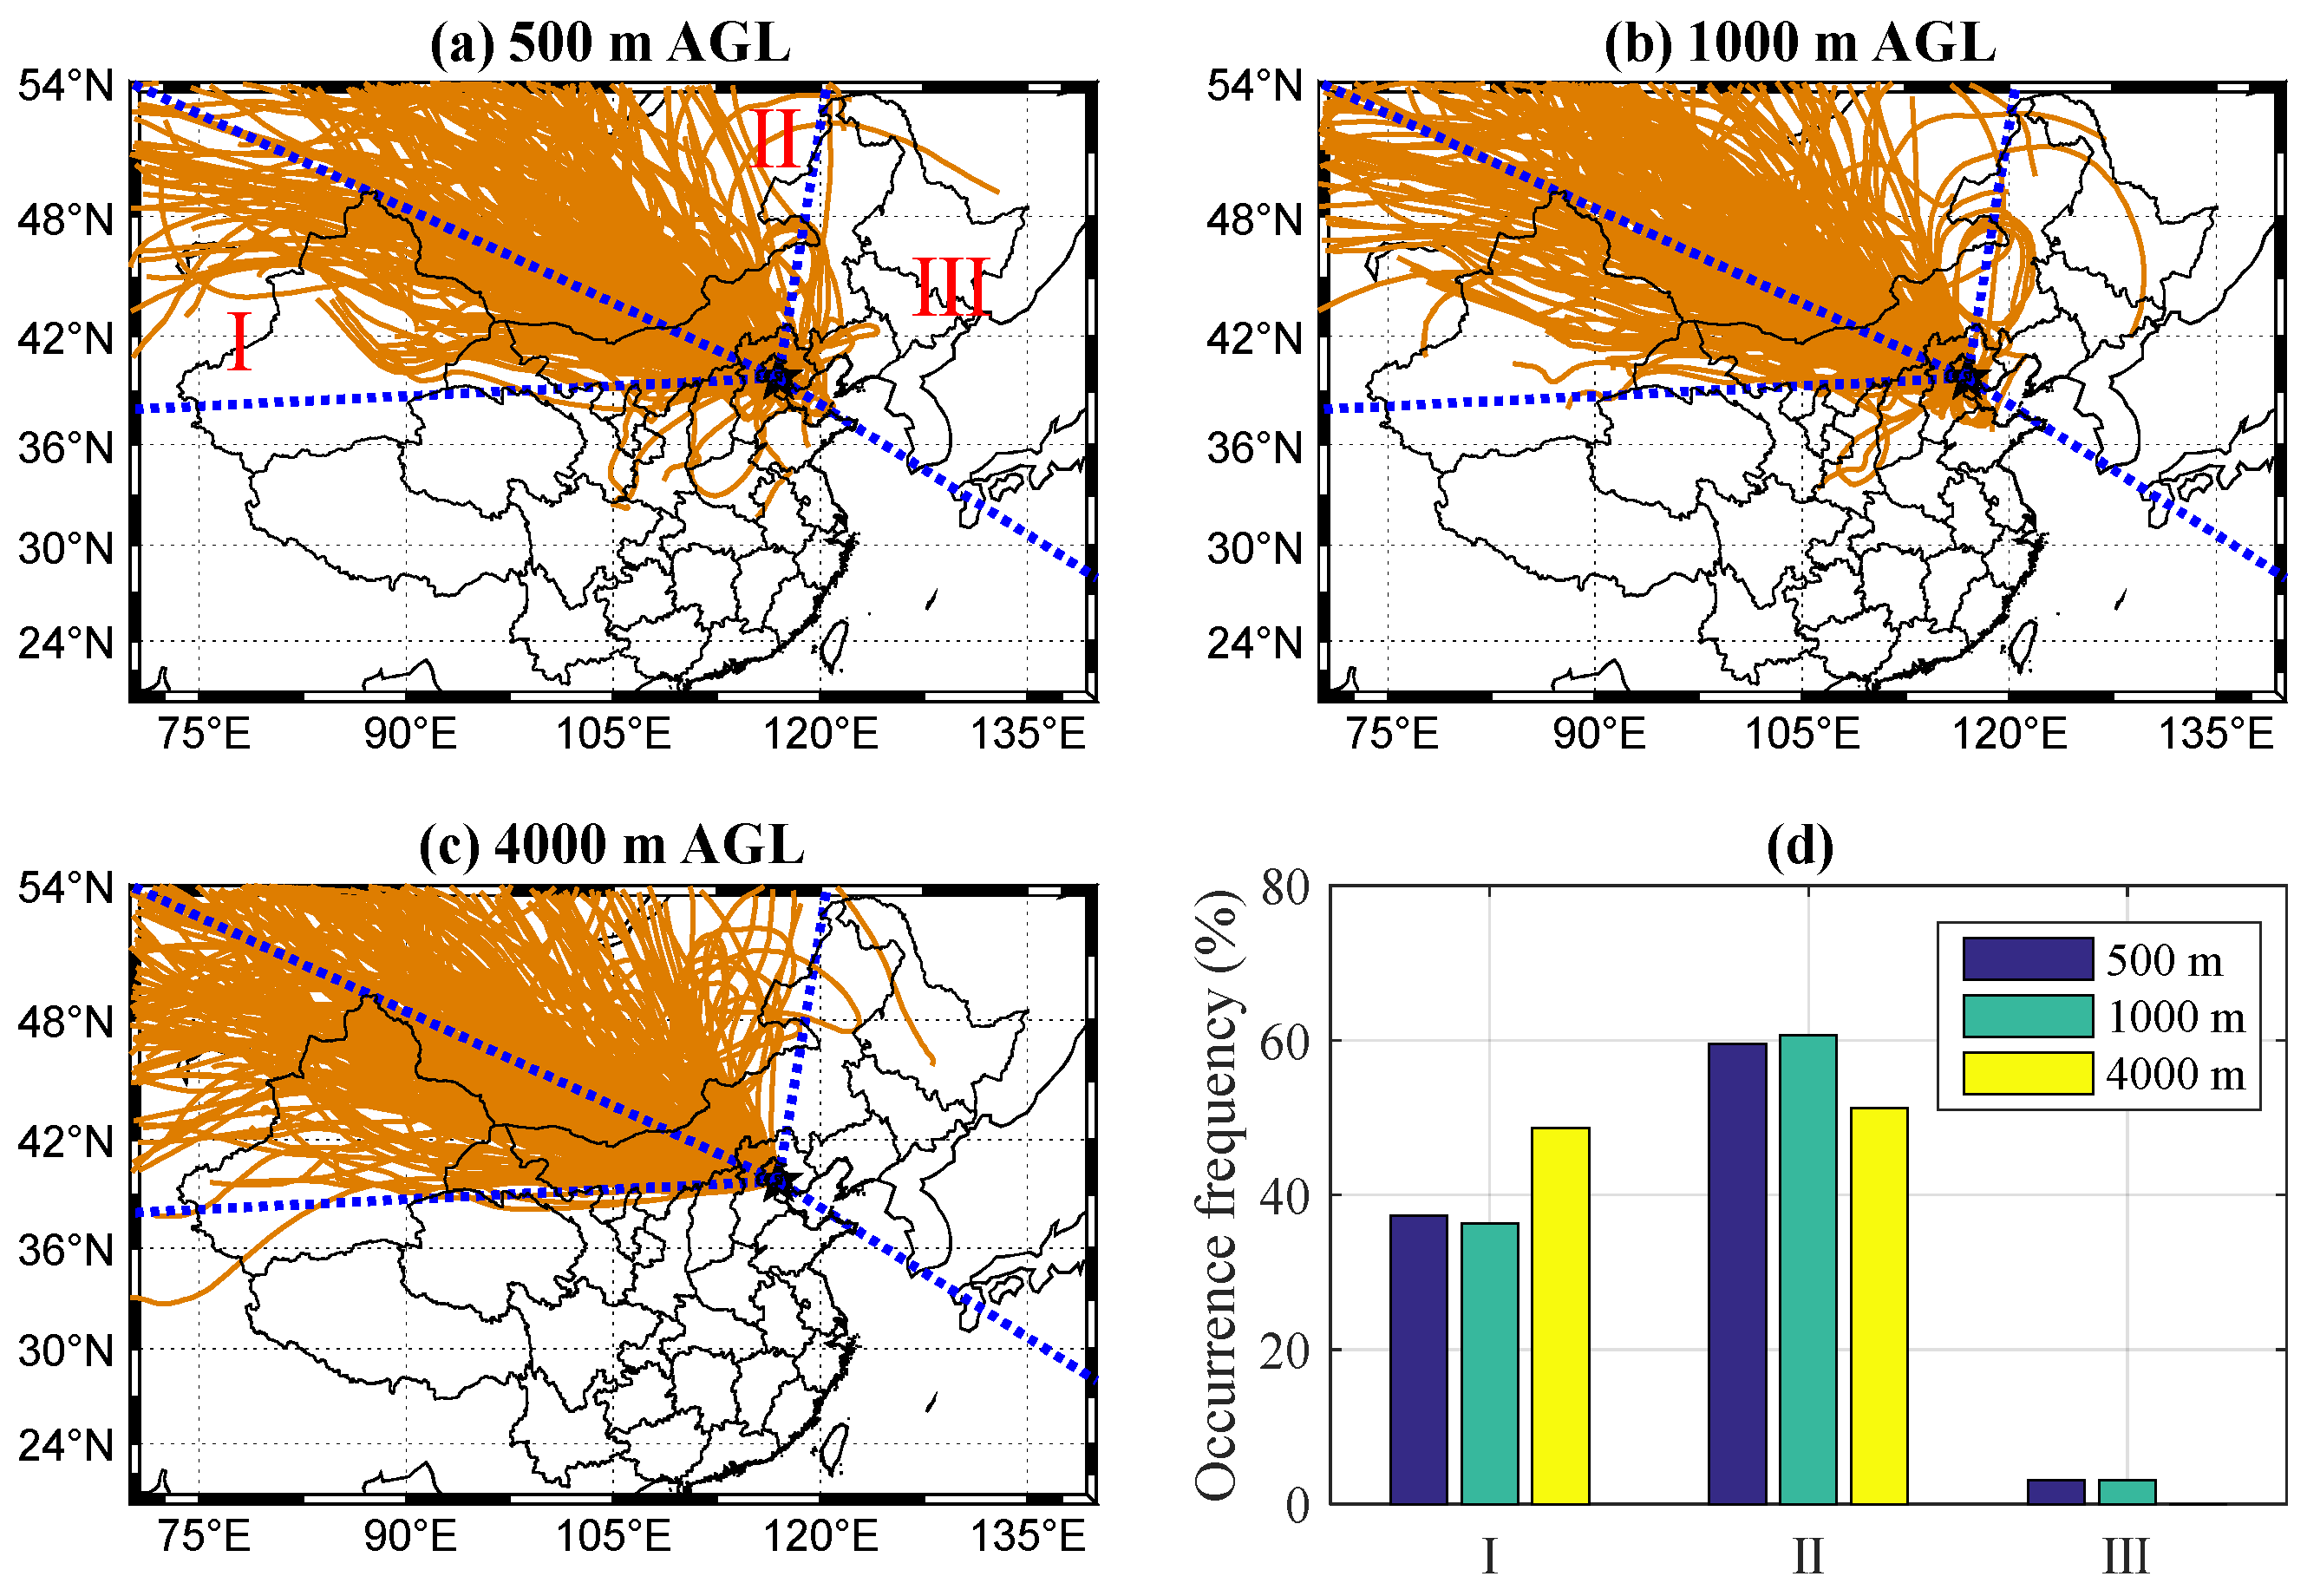
Figure 3a–c shows the back-trajectory at 500, 1000 and 4000 m above ground level (AGL) for 301 dust instantaneous measurements collected during all dust days between 2004 and 2017. The overall pattern generally agreed among the three height levels for dust arriving at XH. It was observed that dust often crossed northern China and Mongolia, the Gobi and other deserts of northwest China, and Kazakhstan, which are considered the main sources of Asian dust [46]. It should also be noted that very few outliers originated from northeast China. Given that many lines overlap, Figure 3d shows the frequency of the air mass at the three altitude levels divided into three directions (i.e., I: northwest; II: north; III: northeast). Most of the air mass synchronously originated from the north at all three altitude levels, followed by the northwest; the smallest portion of the air mass was observed in the northeast. The air mass at 500 m originated from the northwest, north, and northeast accounted for 37.2%, 59.8%, and 3.0%, respectively. The climatic wind vector at 850 hPa also indicated the dominant wind directions at XH were not from northeast [45], resulting in the least dust transport from this direction. Further investigation of typical dust cases from every direction will be presented in the upcoming section.
Figure 4 shows the dust properties on all dust days sorted by their sources from three directions. The numeric values of dust days were 54, 89, and 3 from the northwest, north, and northeast, respectively. The AOD decreased clearly from 0.69 to 0.54 as the dust direction varied from northwest to northeast, resulting in a mean AOD of 0.58 for all dust cases from the three directions. It should be noted that AERONET-based total AOD is composed of both anthropogenic fine aerosols and dust aerosols. We did not separate the dust AOD from total AOD but tended to accept that dust AOD was the dominant contributor to total AOD for dust events, as indicted by coarse-mode aerosols accounting for 74.4% of total AOD in this study. The EAE variations generally mirrored the AAE variations. Compared to the other two directions, smaller EAE (0.17) and greater AAE (3.51) values were observed in the dust from the northeast. The greatest SSA was 0.98 at 675 nm of dust from the northeast. Although we mostly excluded the fine mode aerosols from this analysis by applying a dust determination method, the dust from the northeast might be readily mixed with the anthropogenic fine aerosols associated with the heavy industrial emission in northeast China. This should be a possible reason of higher SSA from the northeast than that from the other two dominate directions (northwest and north). The dust SSA over North Africa and the Arabian Peninsula is generally 0.90–0.92 at 440 nm [9]. By analyzing the dust days during the springtime from 2001 to 2014 in Beijing (70 km southeast of XH), China, it was reported that SSA fluctuated from 0.82 to 0.96 with an average value of 0.88 at 440 nm [47]. SSA is wavelength dependent and generally increases with wavelength on dust days. The mean SSA of dust from northeast in our study was 0.89 at 440 nm, which was almost the same as that in Reference [47] and close to that in Reference [9]. Lower SSA at 440 nm (0.89) than that at 675 nm (0.98) associated with aerosols from the northeast in this study is in agreement with our understanding of strong dust absorption in the ultraviolet and blue spectrum. It should also be noted that our current study presents certain differences in dust properties within each dust source, showing a complex nature of dust properties in the NCP. However, given the fact that dust days for dust from the northeast (three days) during 2004–2017 were to some extent limited, caution should be taken regarding the statistical numbers presented here.
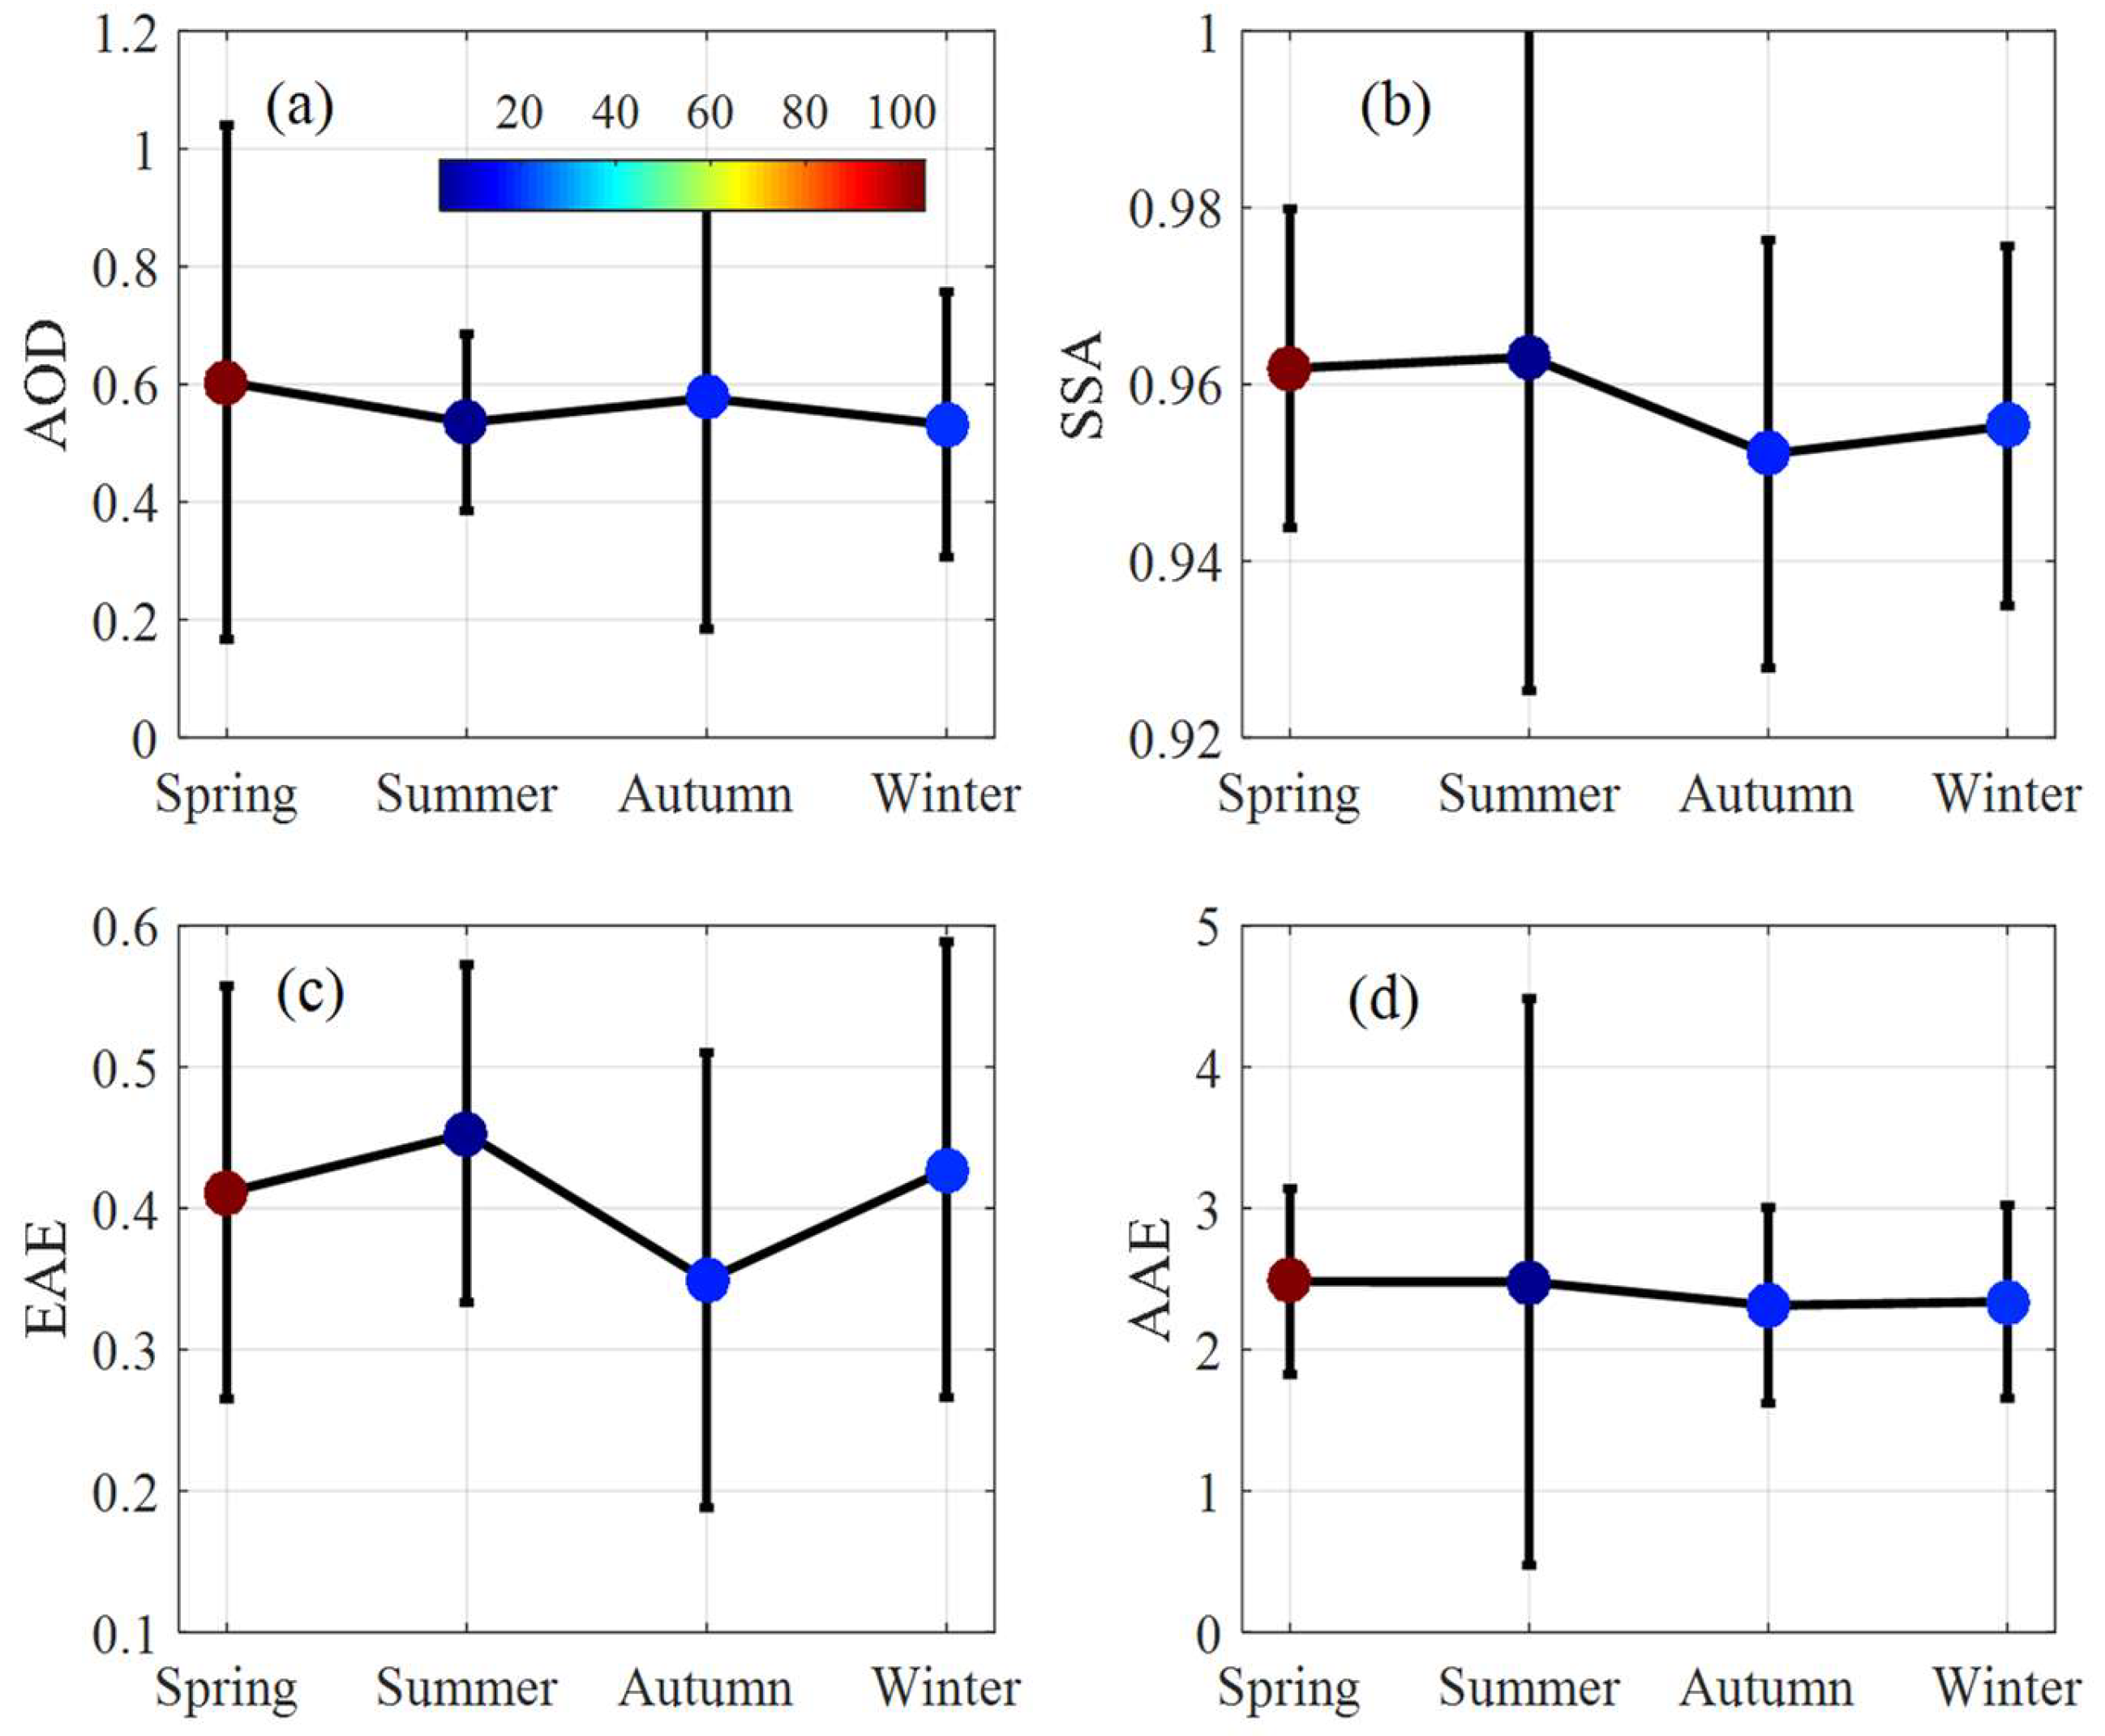
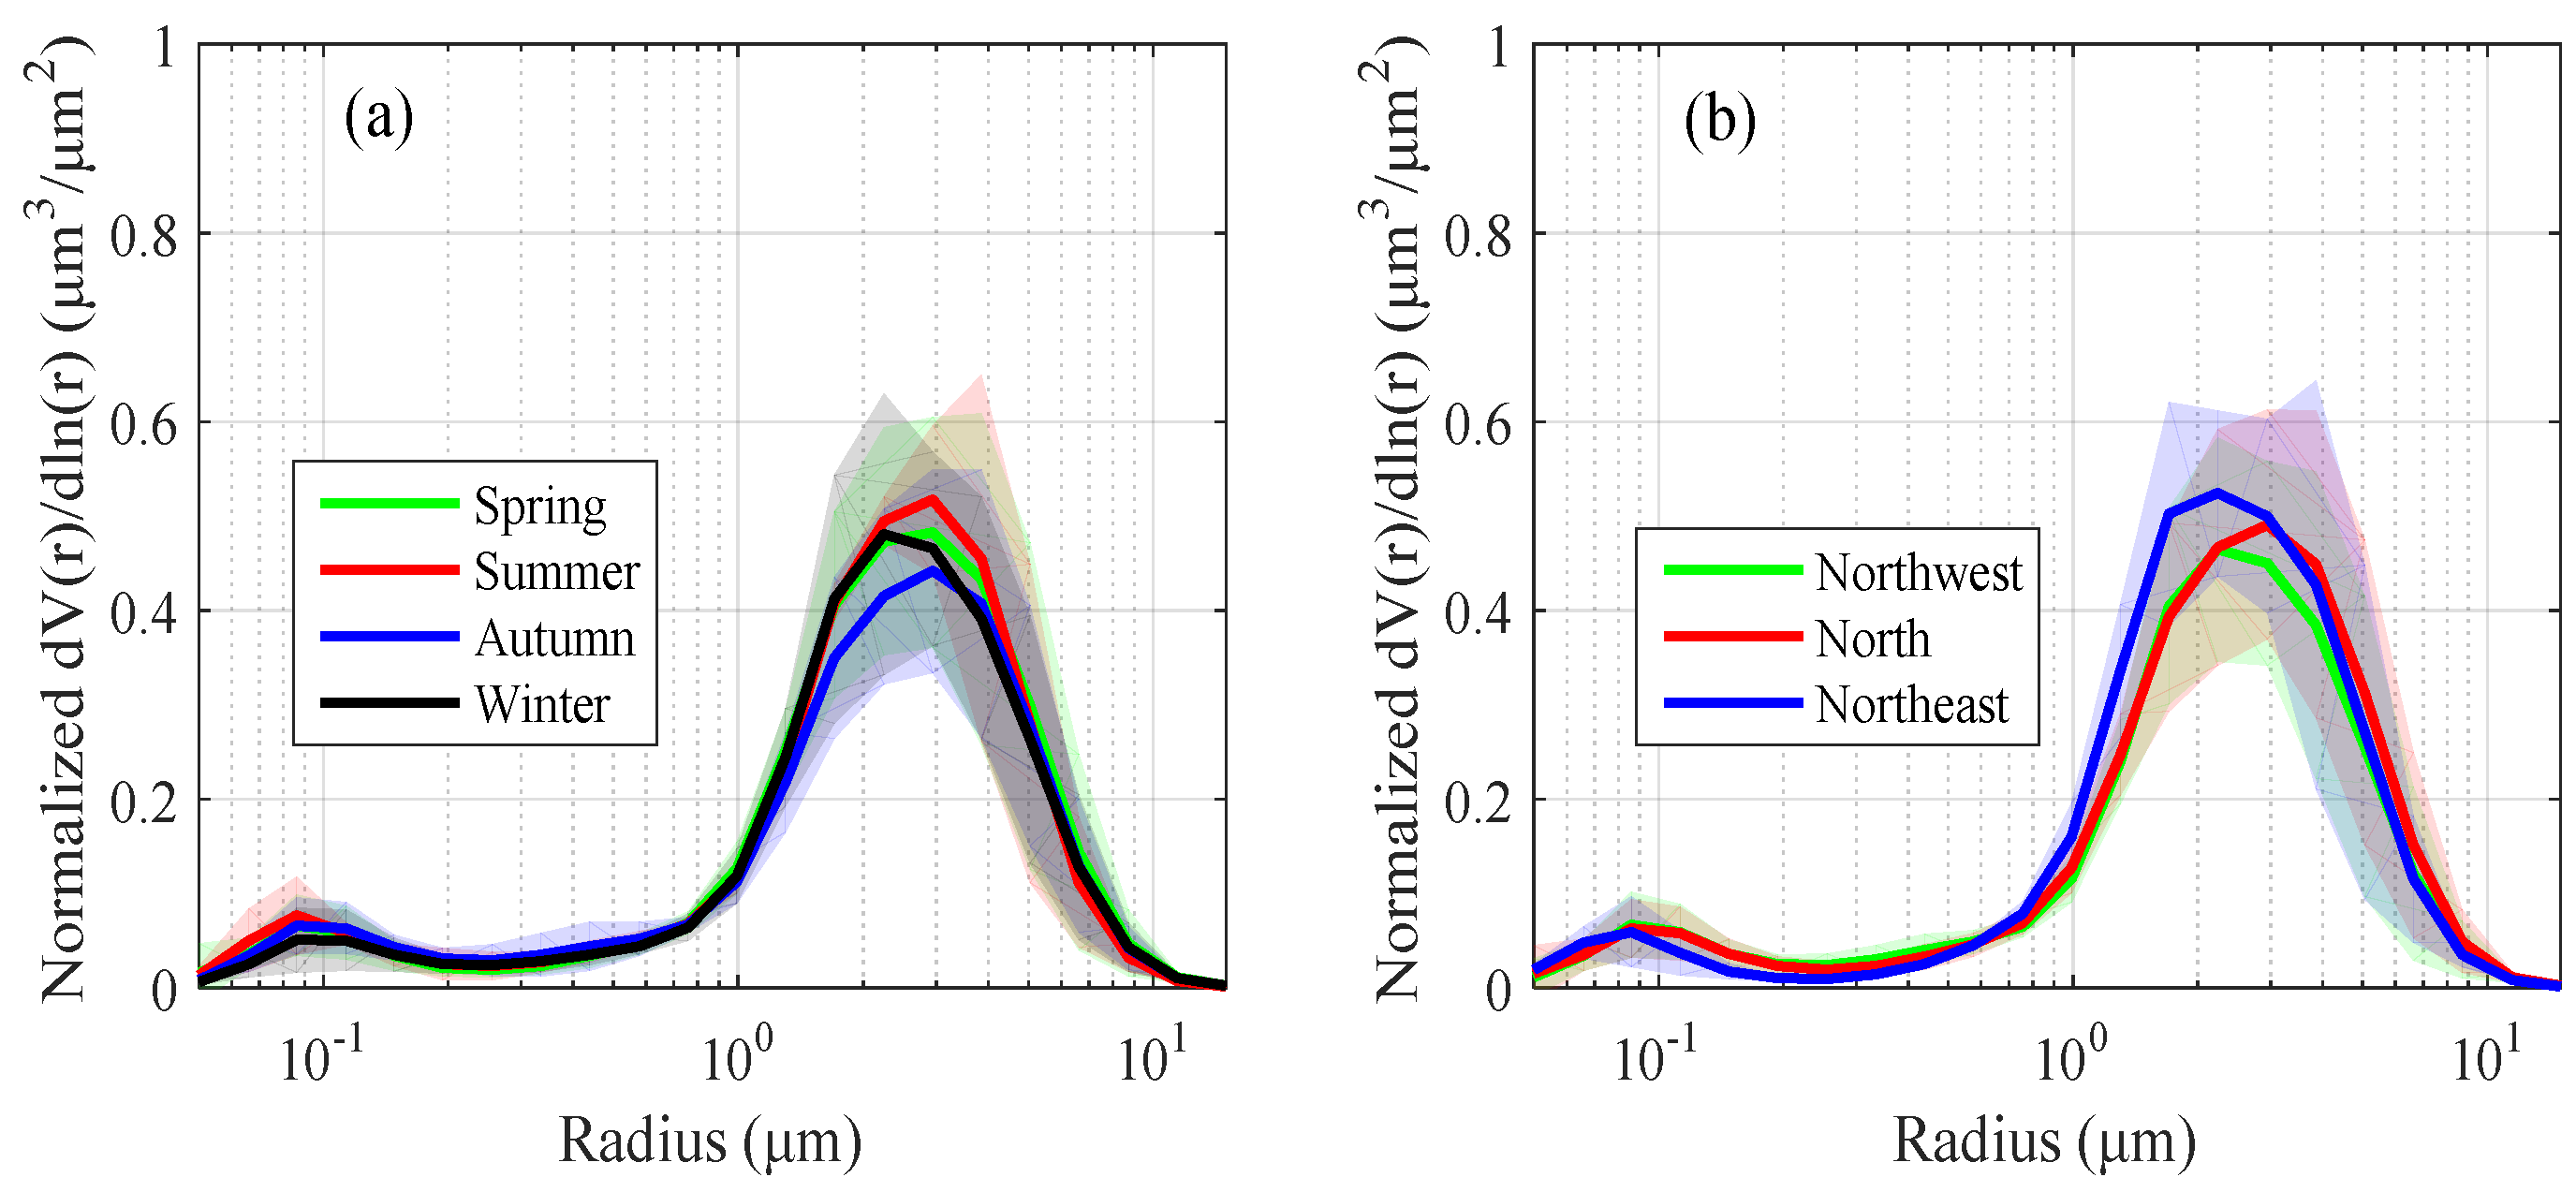
Seasonal variations in the above four parameters for all dust cases are presented in Figure 5. A total of 105, 3, 18, and 20 dust days were observed in spring, summer, autumn, and winter, respectively. Dust arriving at XH should be highly associated with the wind vector distributions. The dominant wind directions were from the dust source regions in spring, autumn, and winter; the prevailing wind was from south in summer [45] when the least dust events occurred at XH. Note that even the three dust days in summer were observed during the transitional periods of late spring and early summer; their air mass were respectively from northwest and north (not shown). The dust AOD was at a maximum in spring (0.60 ± 0.44), followed (in decreasing order) by those in autumn (0.58 ± 0.39), summer (0.54 ± 0.15), and winter (0.53 ± 0.23). The SSA hovered between 0.95 and 0.96 in the four seasons. The dust EAE was least in autumn (0.35 ± 0.16); closer values were observed in spring and winter. The average AAE ranged from 2.31 in autumn to 2.48 in spring. The EAE only provided the average size information, while the volume size distribution indicated the specific size distributed. The normalized size distributions of the dust cases are presented in Figure 6. A single peak structure of coarse-mode aerosols was distinctly demonstrated. The peak volume concentrations occurred at 2.94 μm in spring, summer, and autumn, with the exception of 2.24 μm in winter; they occurred at 2.24, 2.94, and 2.24 μm for dust aerosols from northwest, north, and northeast, respectively. Note that a small spike of fine mode particle also occurred at ~0.1 μm, which should be associated with the mixing between the dust plumes and the pollution originating from the surface.

3.2. Vertical Dust Distributions

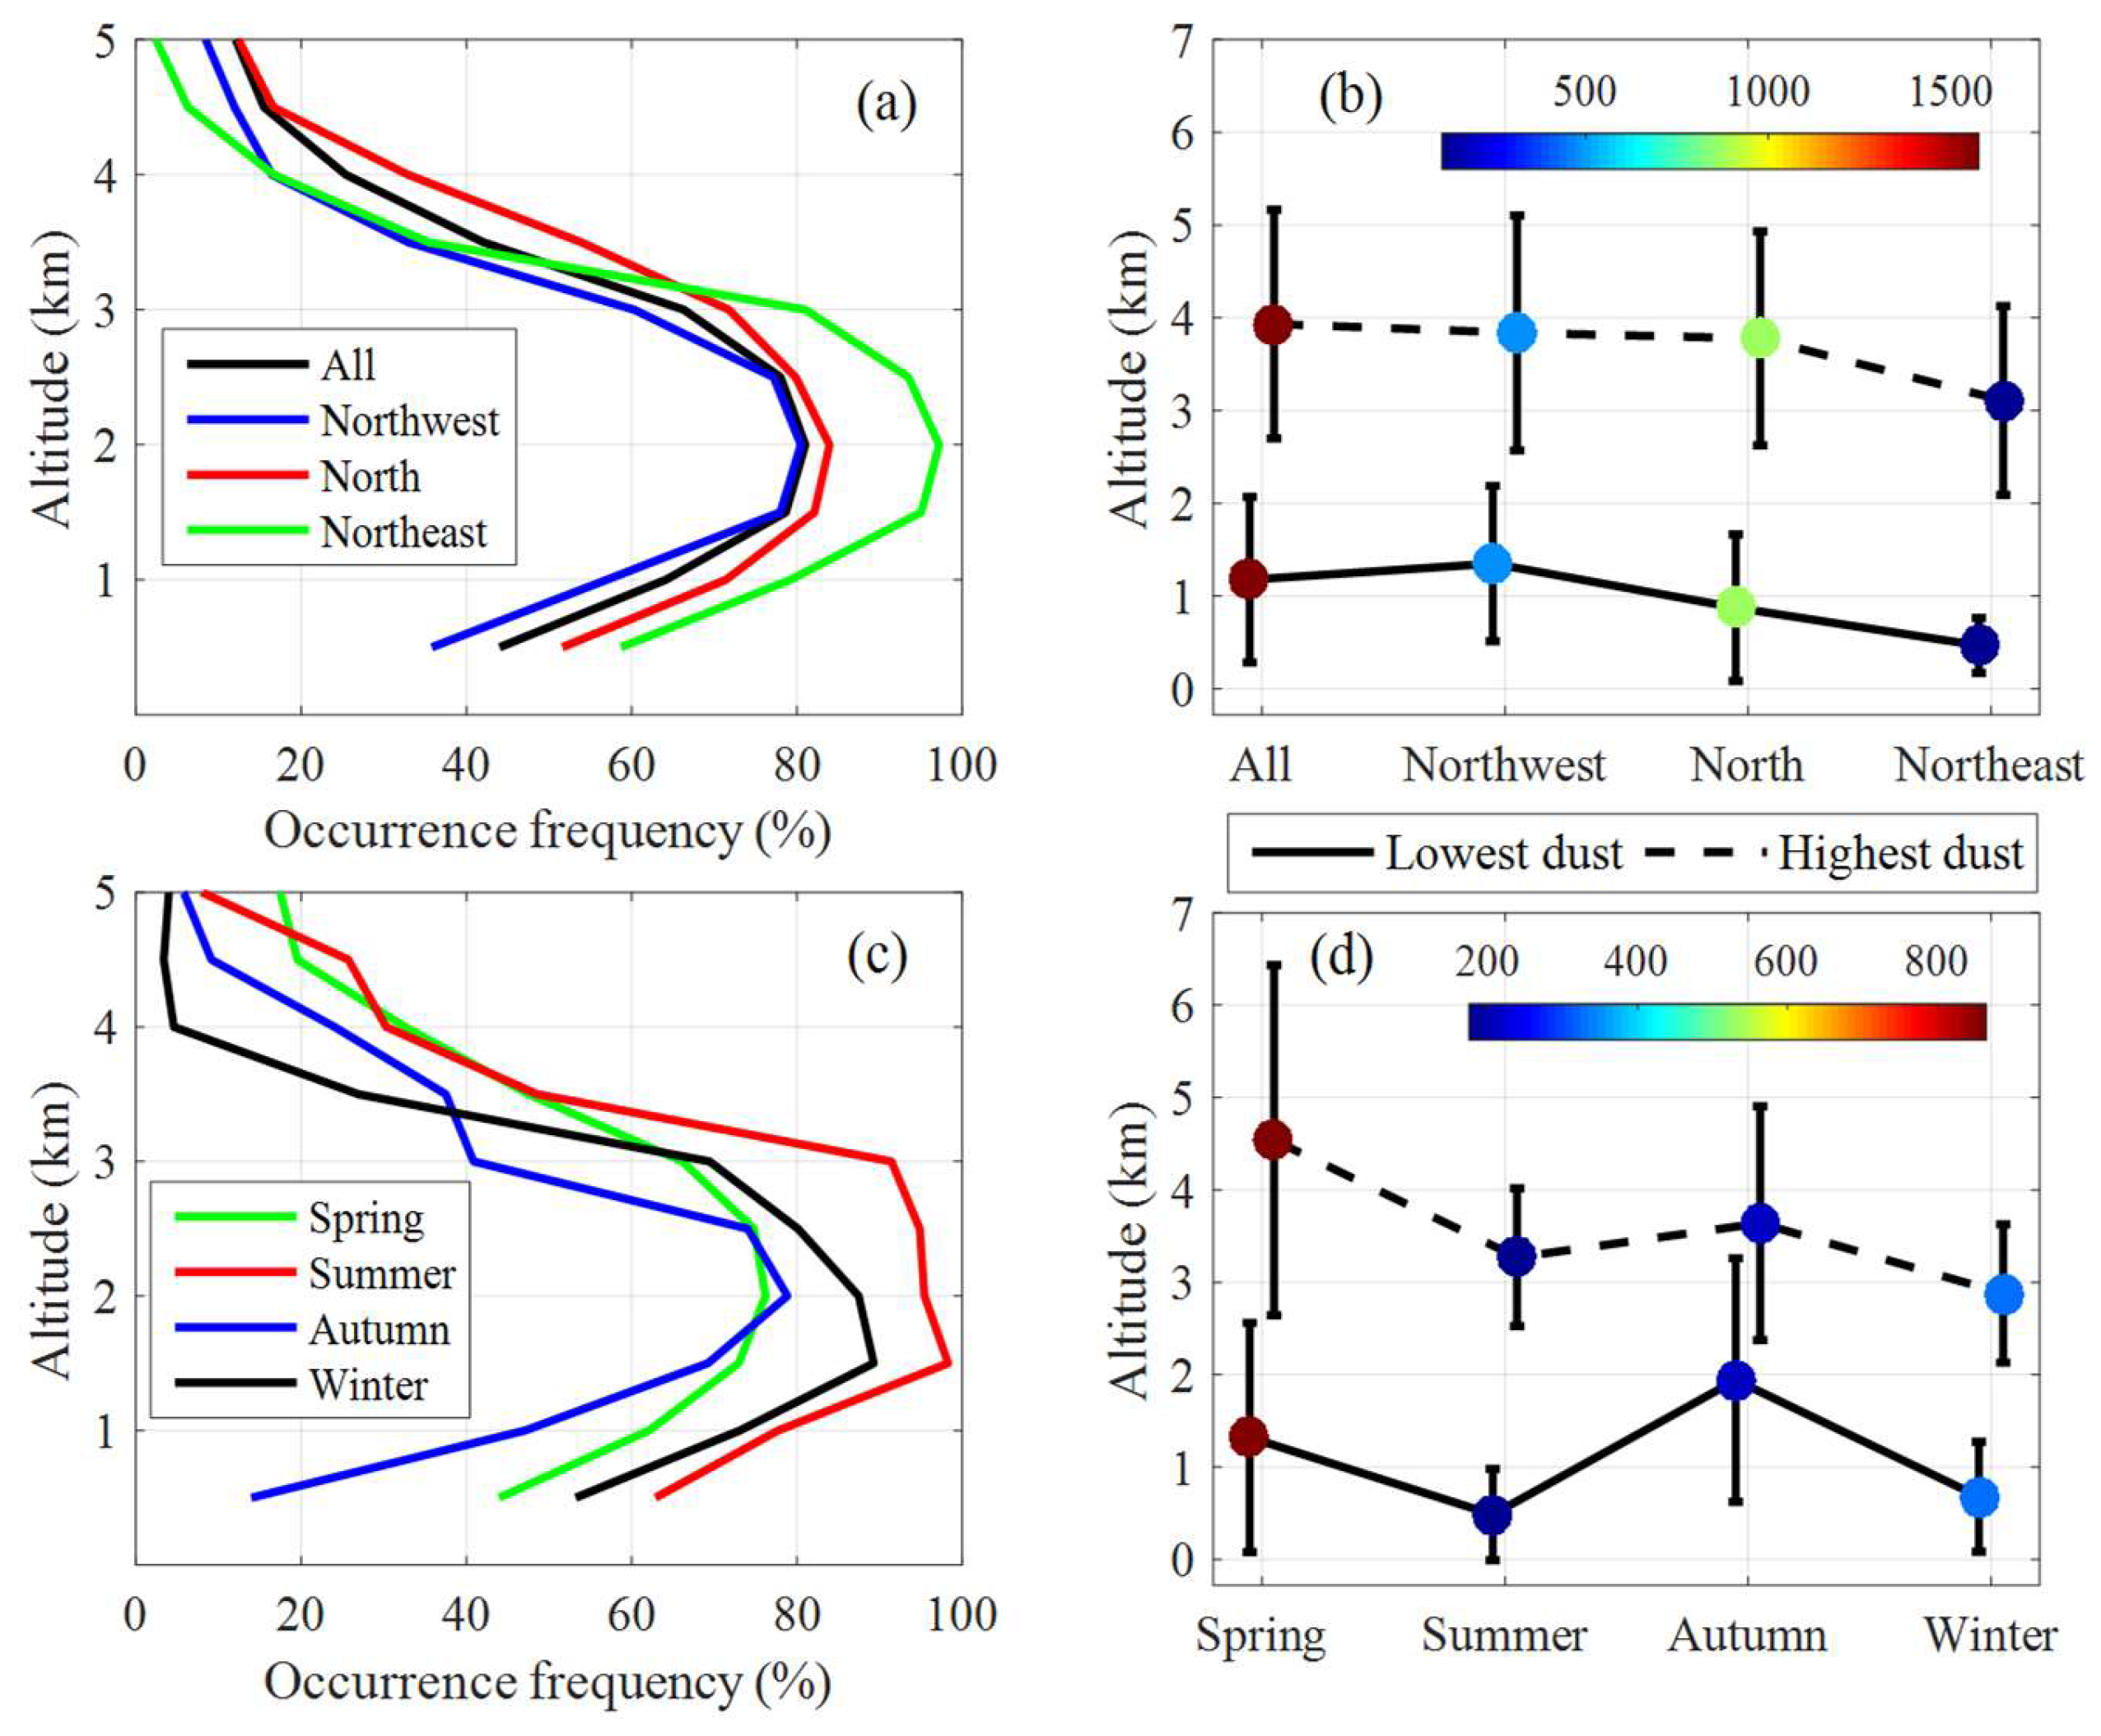
The above section primarily presents the dust aerosol optical properties based on the surface Cimel measurements. CALIOP data corresponding to the periods of dust events identified by the surface Cimel measurements were analyzed in this section. The ground-based and space-borne data products with different viewing geometries (from ground-up and from top-down) have their own merits and respective limitations. Ground-based Cimel can provide the properties of dust aerosols continuously during the day. CALIOP has the advantage of providing the vertical distribution of dust aerosols during the day and night, but it is unlikely to encounter all dust events occurred above XH site given its limited swath and repeat cycle of 16 days. This resulted in 37 dust days observed by CALIOP in this Section. To provide a good trade-off between the need for a certain number of samples to perform robust statistical analysis and the invariance of dust properties over the spatial and temporal intervals considered [48,49,50], CALIOP-based observations were considered within ±1° × 1° latitude-longitude around XH, resulting in ~1500 vertical profiles with dust present during the periods analyzed. It should also be noted this collocated method is reasonable since dust events are generally associated with synoptic-scale meteorology with a horizontal length scale on the order of 1000 km or more. The vertical resolution of CALIOP-based aerosol profile products is 60 m below 20.2 km in altitude. The vertical dust occurrence frequency in each 60-m bin was defined as the number of times with dust aerosol detected in that bin divided by the total number of dust vertical profiles in question, as shown in Figure 7a. Overall, a single-peaked structure, with a maximum occurred at~2 km, was illustrated by all dust events and those sorted by their sources in three directions. The location of the dust peak at XH generally agreed with that over East Asia from January 2007 to December 2011 [51]. A closer looking at Figure 7a suggested that dust occurrence tended to be larger below 3 km for dust from the northeast than that for dust from the other two directions.
CALIOP has the advantage of providing a global vertical distribution of dust aerosols during the day and night [52,53], but it should be noted this instrument also suffers from some limitations. For example, inaccurate or incomplete detection and misclassification of aerosol/cloud layers and retrieval errors, which are influenced by signal-to-noise ratios that are lower during daytime [54]. This space-borne measurement may also readily underreport the near-surface dust aerosol loading under heavy dust condition due to the attenuation effect of upper layers on the lidar signals [55], which might be associated with the deficiency of dust occurrence below boundary layer in Figure 7a. The averages of lowest dust altitude and highest dust altitudes, i.e., CALIOP-determined minimum and maximum altitude of the dust layers, are presented in Figure 7b. The aerosol layer height generally ranged from the boundary layer to the middle troposphere along the CALIPSO path for all dust cases and those from the northwest and north; a relative lower dust layer was retrieved by dust from the northeast (lowest dust altitude: 0.47 ± 0.30 km; highest dust altitude: 3.11 ± 1.02 km).
With regard to the seasonal variations, an interesting feature was that the dust frequency tended to be larger above 3 km in spring and summer and smaller below 3 km in autumn (Figure 7c). The lowest dust altitude was elevated in autumn (1.94 km) compared to those values in the other three seasons; the highest dust altitude was maximum in spring (4.54 km) (Figure 7d).

3.3. Dust Radiative Forcing

Dust radiative forcing from the AERONET inversion algorithm was analyzed in this Section. Before proceeding, in order to confirm the veracity of AERONET inversion algorithm, its calculated surface solar radiation was firstly assessed by the quality controlled BSRN data collected at XH. Figure 8 shows the density plots of global radiation from BSRN observations as a function of all AERONET calculations during 2004 and 2017. Overall, retrievals of the two distinct approaches agreed well between the ~7000 matched global radiations, as shown by an overwhelmingly large number of data points that fell along or overlap the 1:1 line. The vast majority of the absolute differences between the two methods were less than 10 Wm−2, accounting for ~60% of all cases analyzed. The correlation coefficient, mean bias (BSRN–AERONET) and standard deviation between the surface observation and AERONET calculations were 0.998, −2.07 Wm−2 and 10.14 Wm−2, respectively.
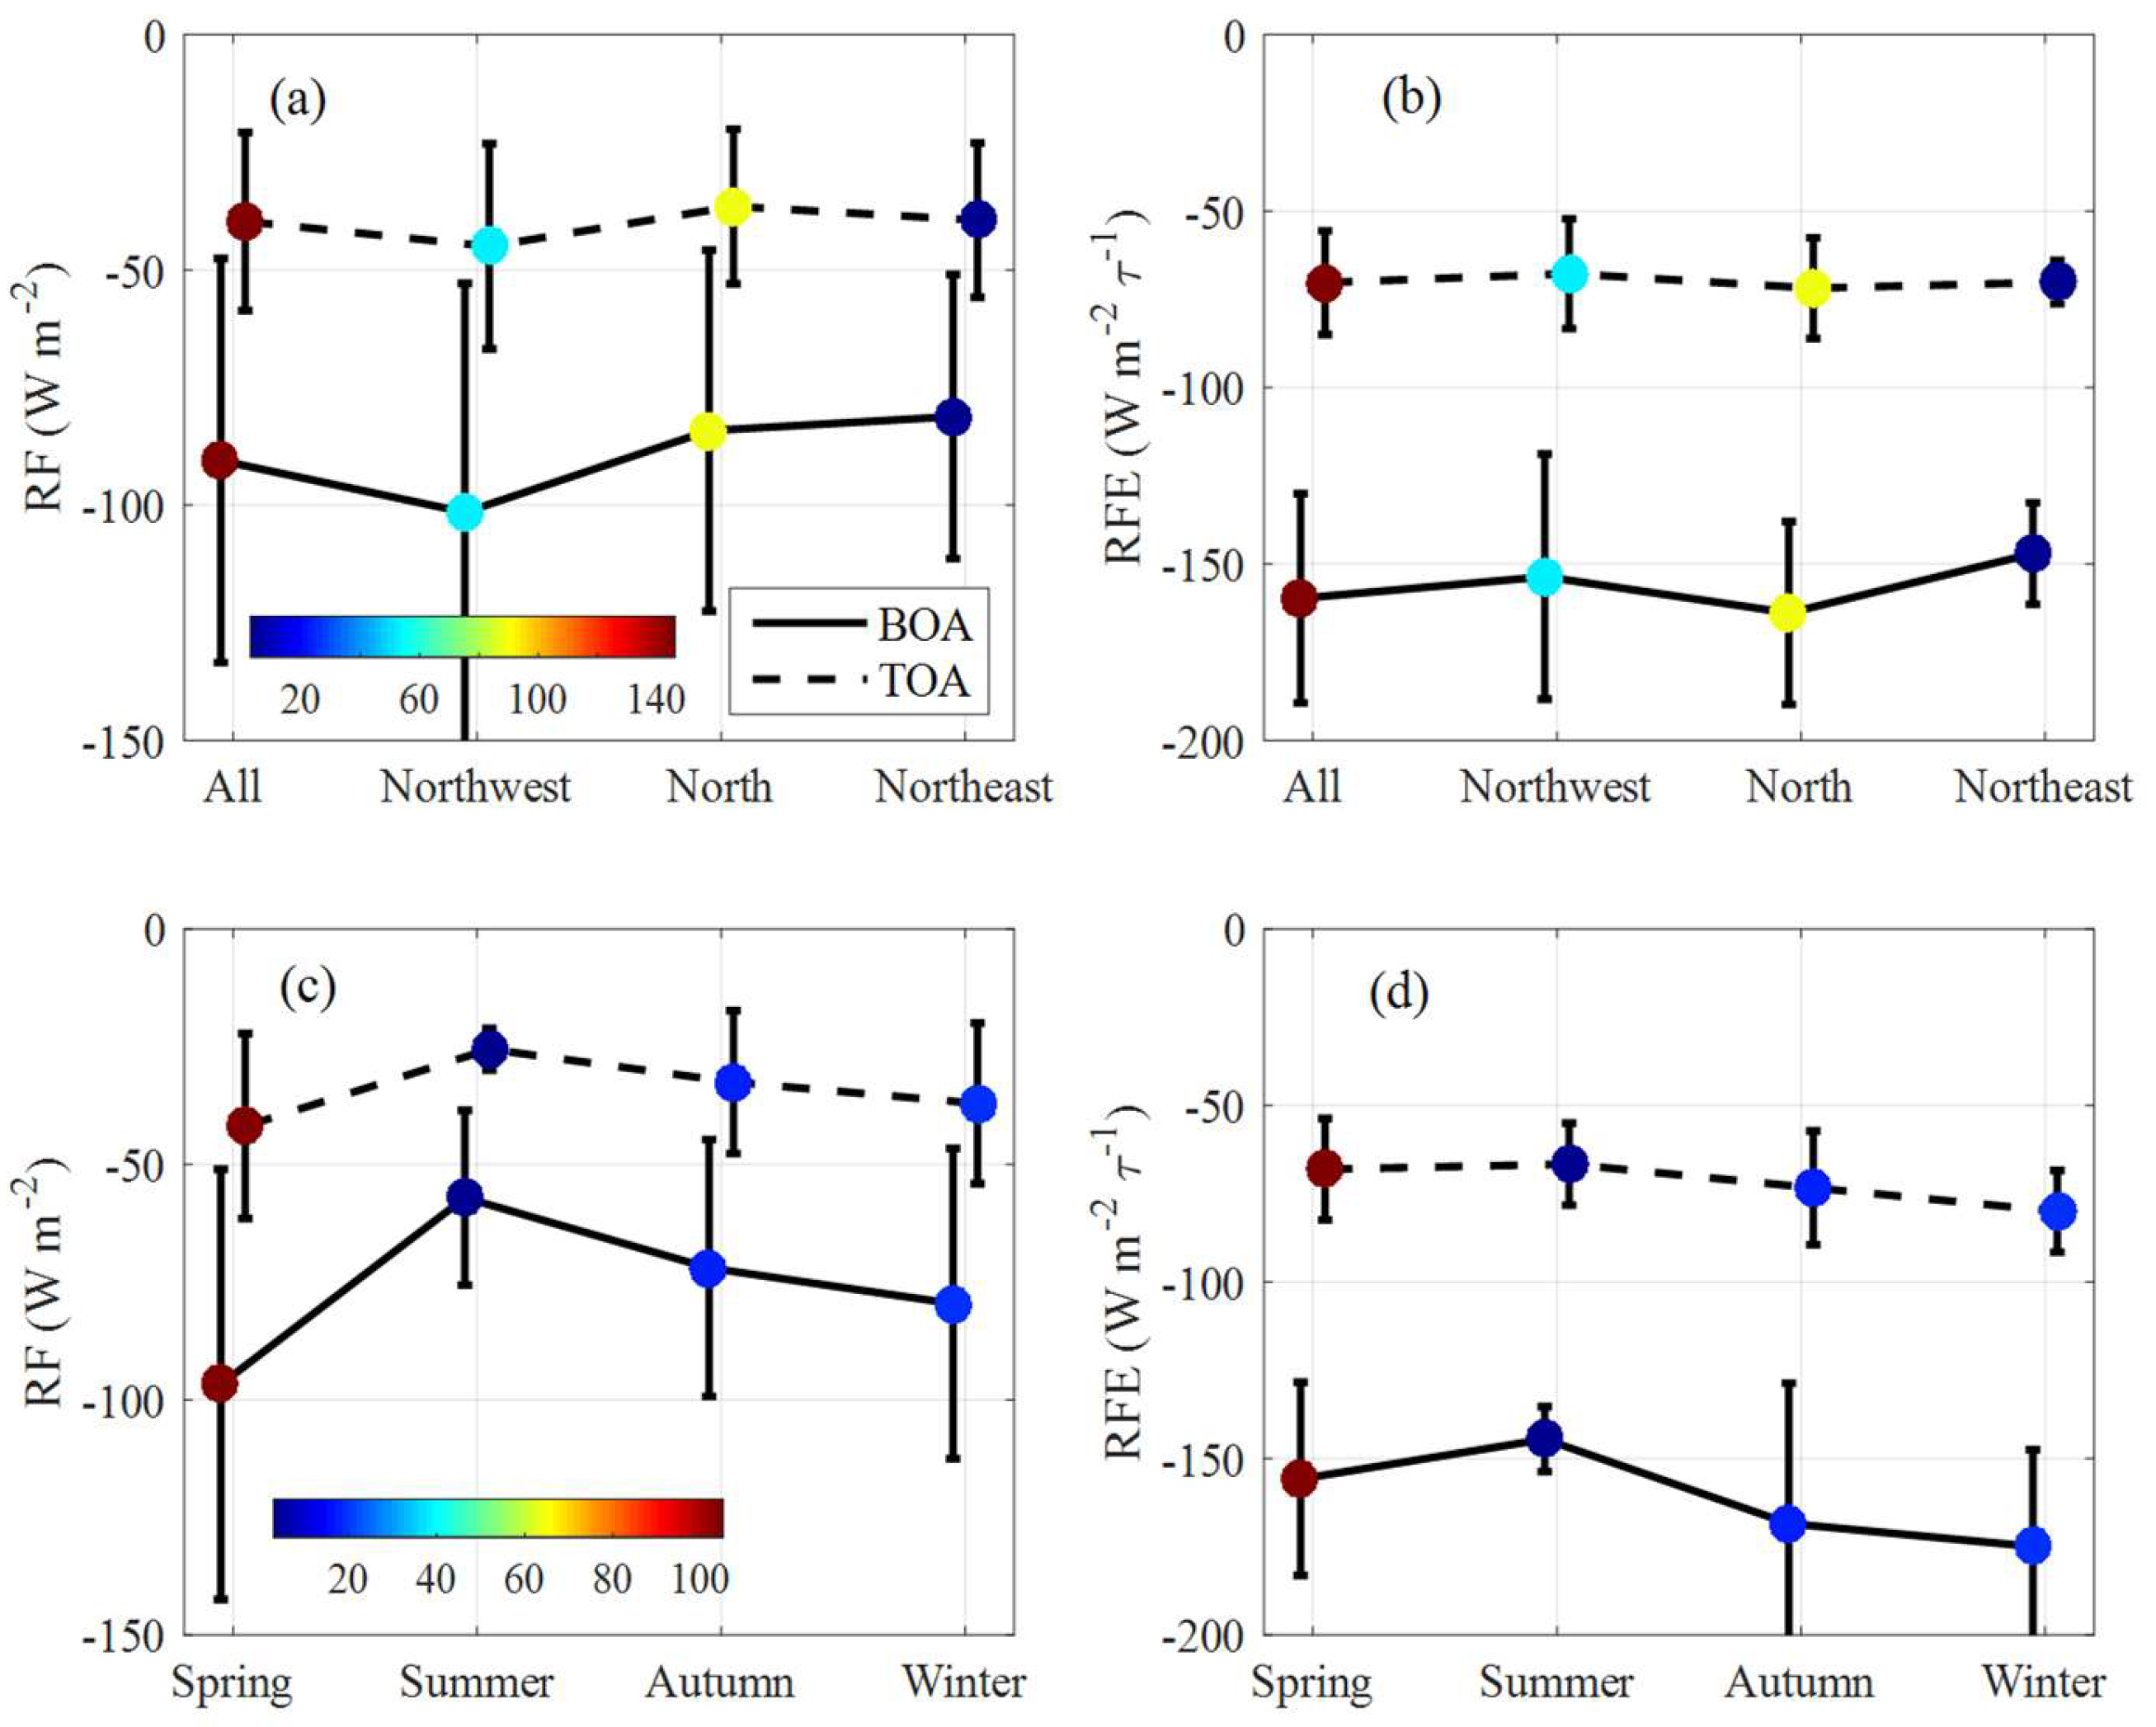
The excellent performance of the solar radiations calculated by AERONET inversion algorithm encouraged us to explore the dust aerosol radiative forcing as follows. A clear relationship, where both RFBOA and RFTOA increased with dust AOD, was demonstrated (not shown). Given RF values are available for solar zenith angles generally within 55°~65°, instantaneous RFs rather than 24-h average RFs are presented here. A negative or positive sign of the aerosol RF determines whether the dust aerosols produce a cooling or a heating effect. More negative values indicate stronger cooling effect. The mean RFBOA and RFTOA values were −90.51 ± 42.91 and −39.72 ± 18.91 Wm−2 for all dust cases (Figure 9a), respectively. The cooling effects of both RFBOA and RFTOA weakened as the dust source changed from the northwest to northeast, which was mostly due to larger AOD for dust from the northwest than that from the northeast. The dust RF efficiency at the BOA and TOA (RFEBOA and RFETOA) were also calculated and are shown in Figure 9b. These values were generally smooth, although weakest cooling effects of RFEBOA tended to be exhibited by dust from the northeast, which was partly because the largest dust SSA was associated with dust from this direction. In view of their seasonal statistics (Figure 9c), the cooling effects of both RFBOA and RFTOA tended to be strongest in spring (−96.72 ± 45.69 and −41.87 ± 19.66 Wm−2) compared to that in summer (−57.08 ± 18.54 and −25.54 ± 4.45 Wm−2), autumn (−72.01 ± 27.27 and −32.54 ± 15.18 Wm−2), and winter (−79.57 ± 32.96 and −37.05 ± 17.06 Wm−2). Various RF values have been reported by previous publications in different seasons over desert regions [11,56]. Relatively low cooling effect of RF in these publications is likely related to the fact that RF is calculated over desert where surface albedo is substantially larger than that in our study, i.e., ~0.15 at XH [57]. By analyzing a heavy dust case on April 17, 2006, in BJ (70 km southeast of XH), it showed that the RFBOA and RFTOA were −136 and −69 Wm−2 [20], respectively, being larger than the magnitudes at XH. The RFTOA was reported from −65.9 to −115.7 Wm−2 on dust days during the springtime from 2001 to 2014 in BJ [47]. For the RFE variations (Figure 9d), slight weaker cooling effects of RFEBOA were observed in summer compared to the other three seasons; a fine seasonal increasing pattern of the cooling effect was generally presented by RFETOA.

3.4. Case Study of Three Typical Dust Events

To better reveal how long-range transport impacts the dust properties over the NCP, three typical dust events are specifically discussed in this Section by using surface observations, satellite data and back-trajectory calculations. The first case, which occurred on May 4, 2017, was analyzed since it was a heavy dust storm according to the observation records and its source originated mostly from the northwest. The second and third cases originated from the northeast and north respectively. These three cases were respectively from the aforementioned three directions, leading to the expectations of exhibiting potentially different dust properties. Also note that the space-borne CALIPSO data were available around XH for the latter two cases, facilitating knowledge of the vertical dust distributions. More attention was paid to the second dust case from the northeast given the least dust cases came from this direction. The AERONET-based dust characteristics from the instantaneous retrieval for the above three dust cases are summarized in Table 1.
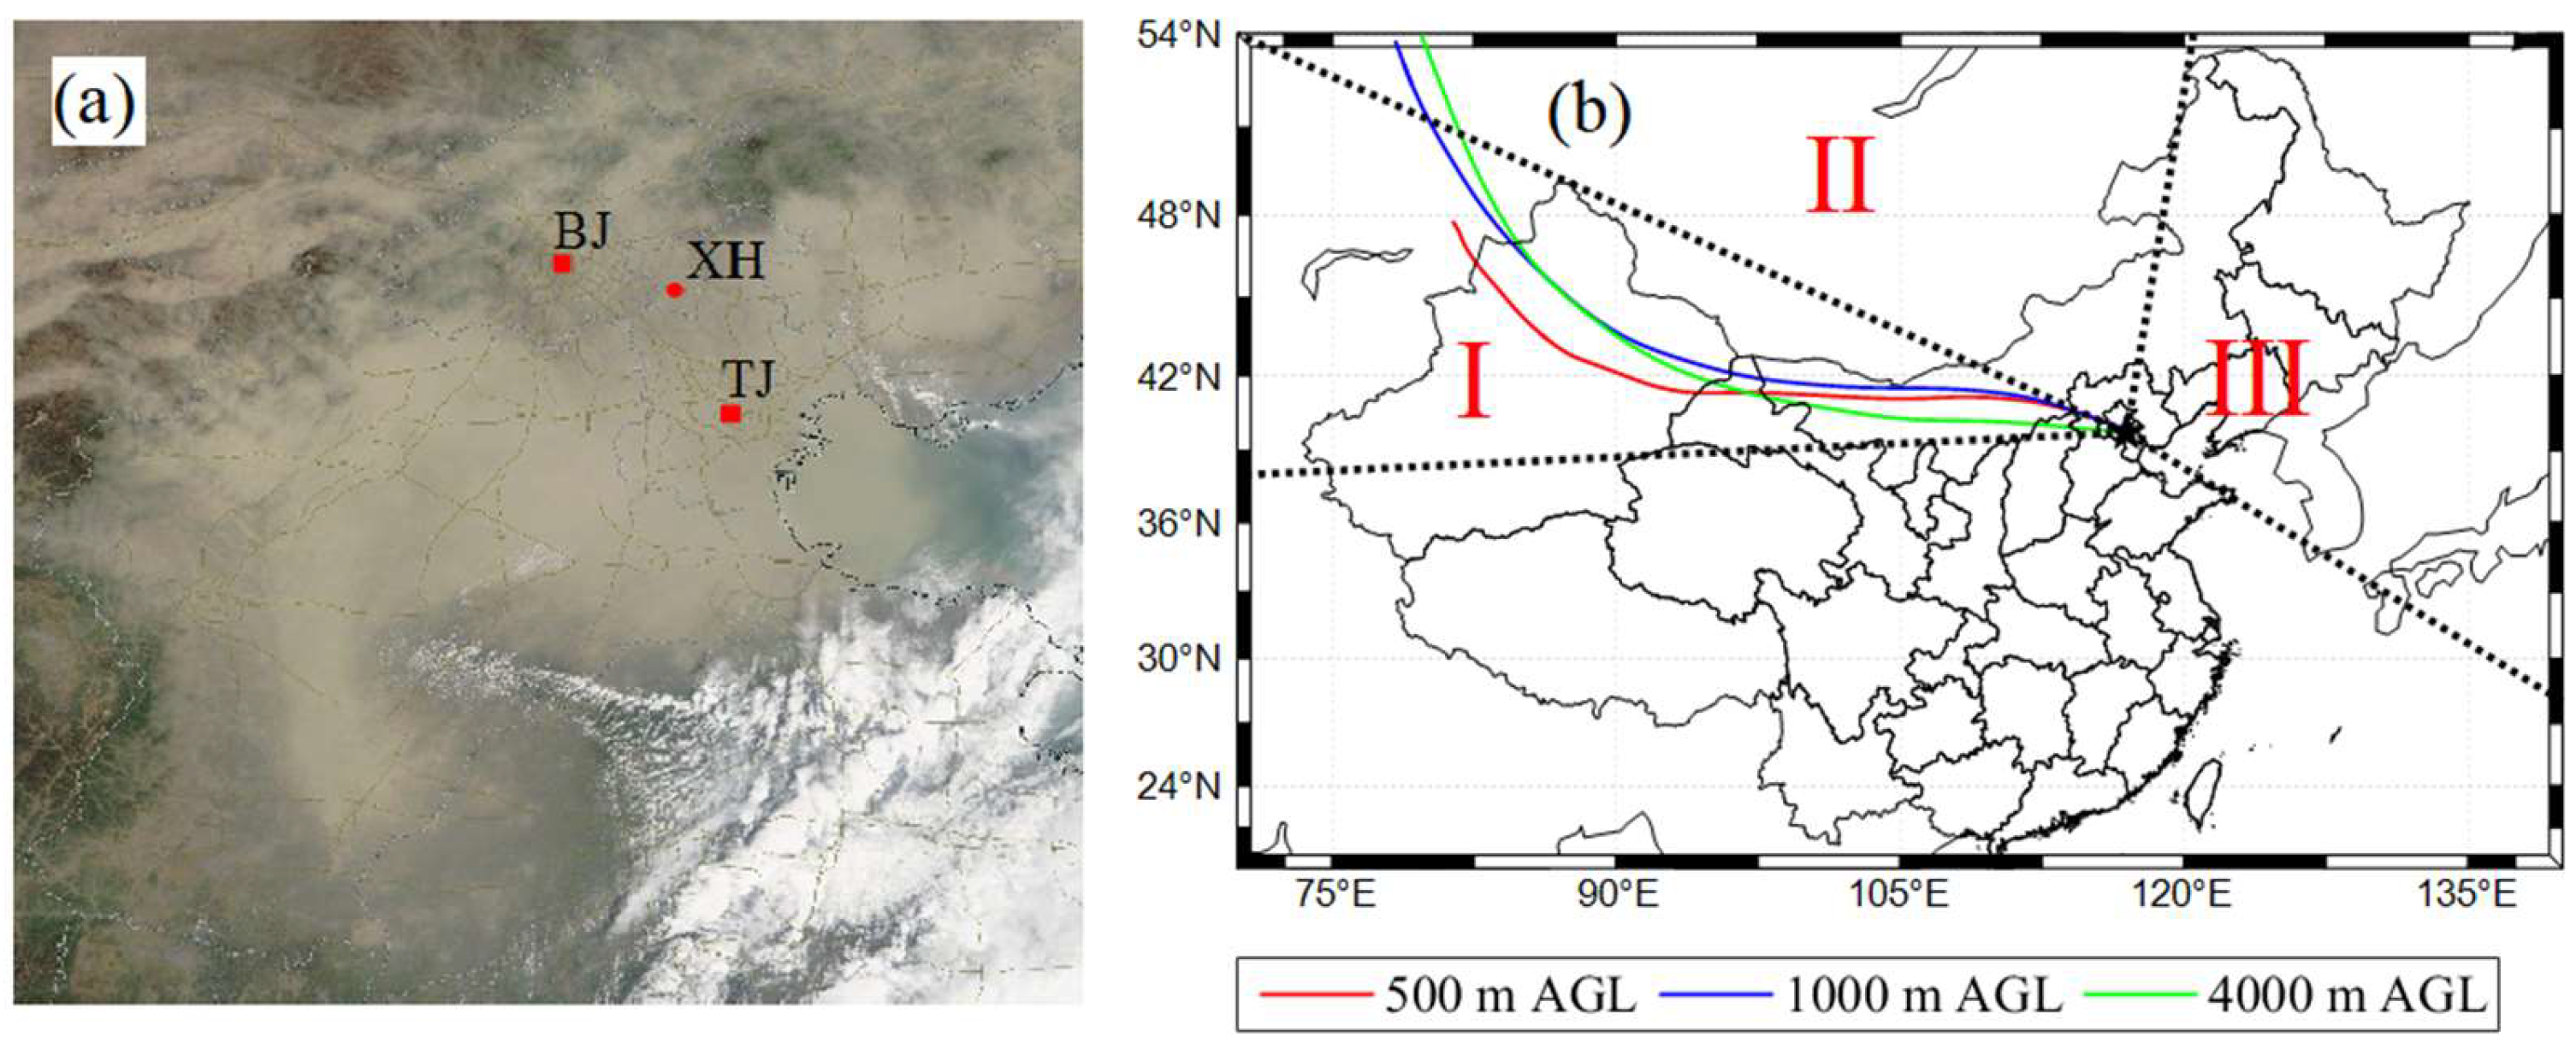
For the first dust storm that appeared in spring, as shown by the MODIS RGB image (Figure 10a), a heavy dust path was clearly observed over large areas of the NCP. Level 2 inversion data were not available for this case and Level 1.5 inversion data were thus analyzed as follows. This dust event was characterized by a large AOD (2.54), SSA (0.97), and AAE (3.56), along with a small EAE (0.07), resulting in severe RFBOA (−315.65 Wm−2) and RFTOA (−107.49 Wm−2) values. The RFEBOA and RFETOA were −124.1 and −42.3 Wm−2, respectively. The vertical dust distribution was not provided for this case because CALIPSO did not pass over the region around XH. The back-trajectory at 500, 1000, and 4000 m AGL indicated that this dust storm was mostly from the Gobi and other deserts of northwest China (Figure 10b).
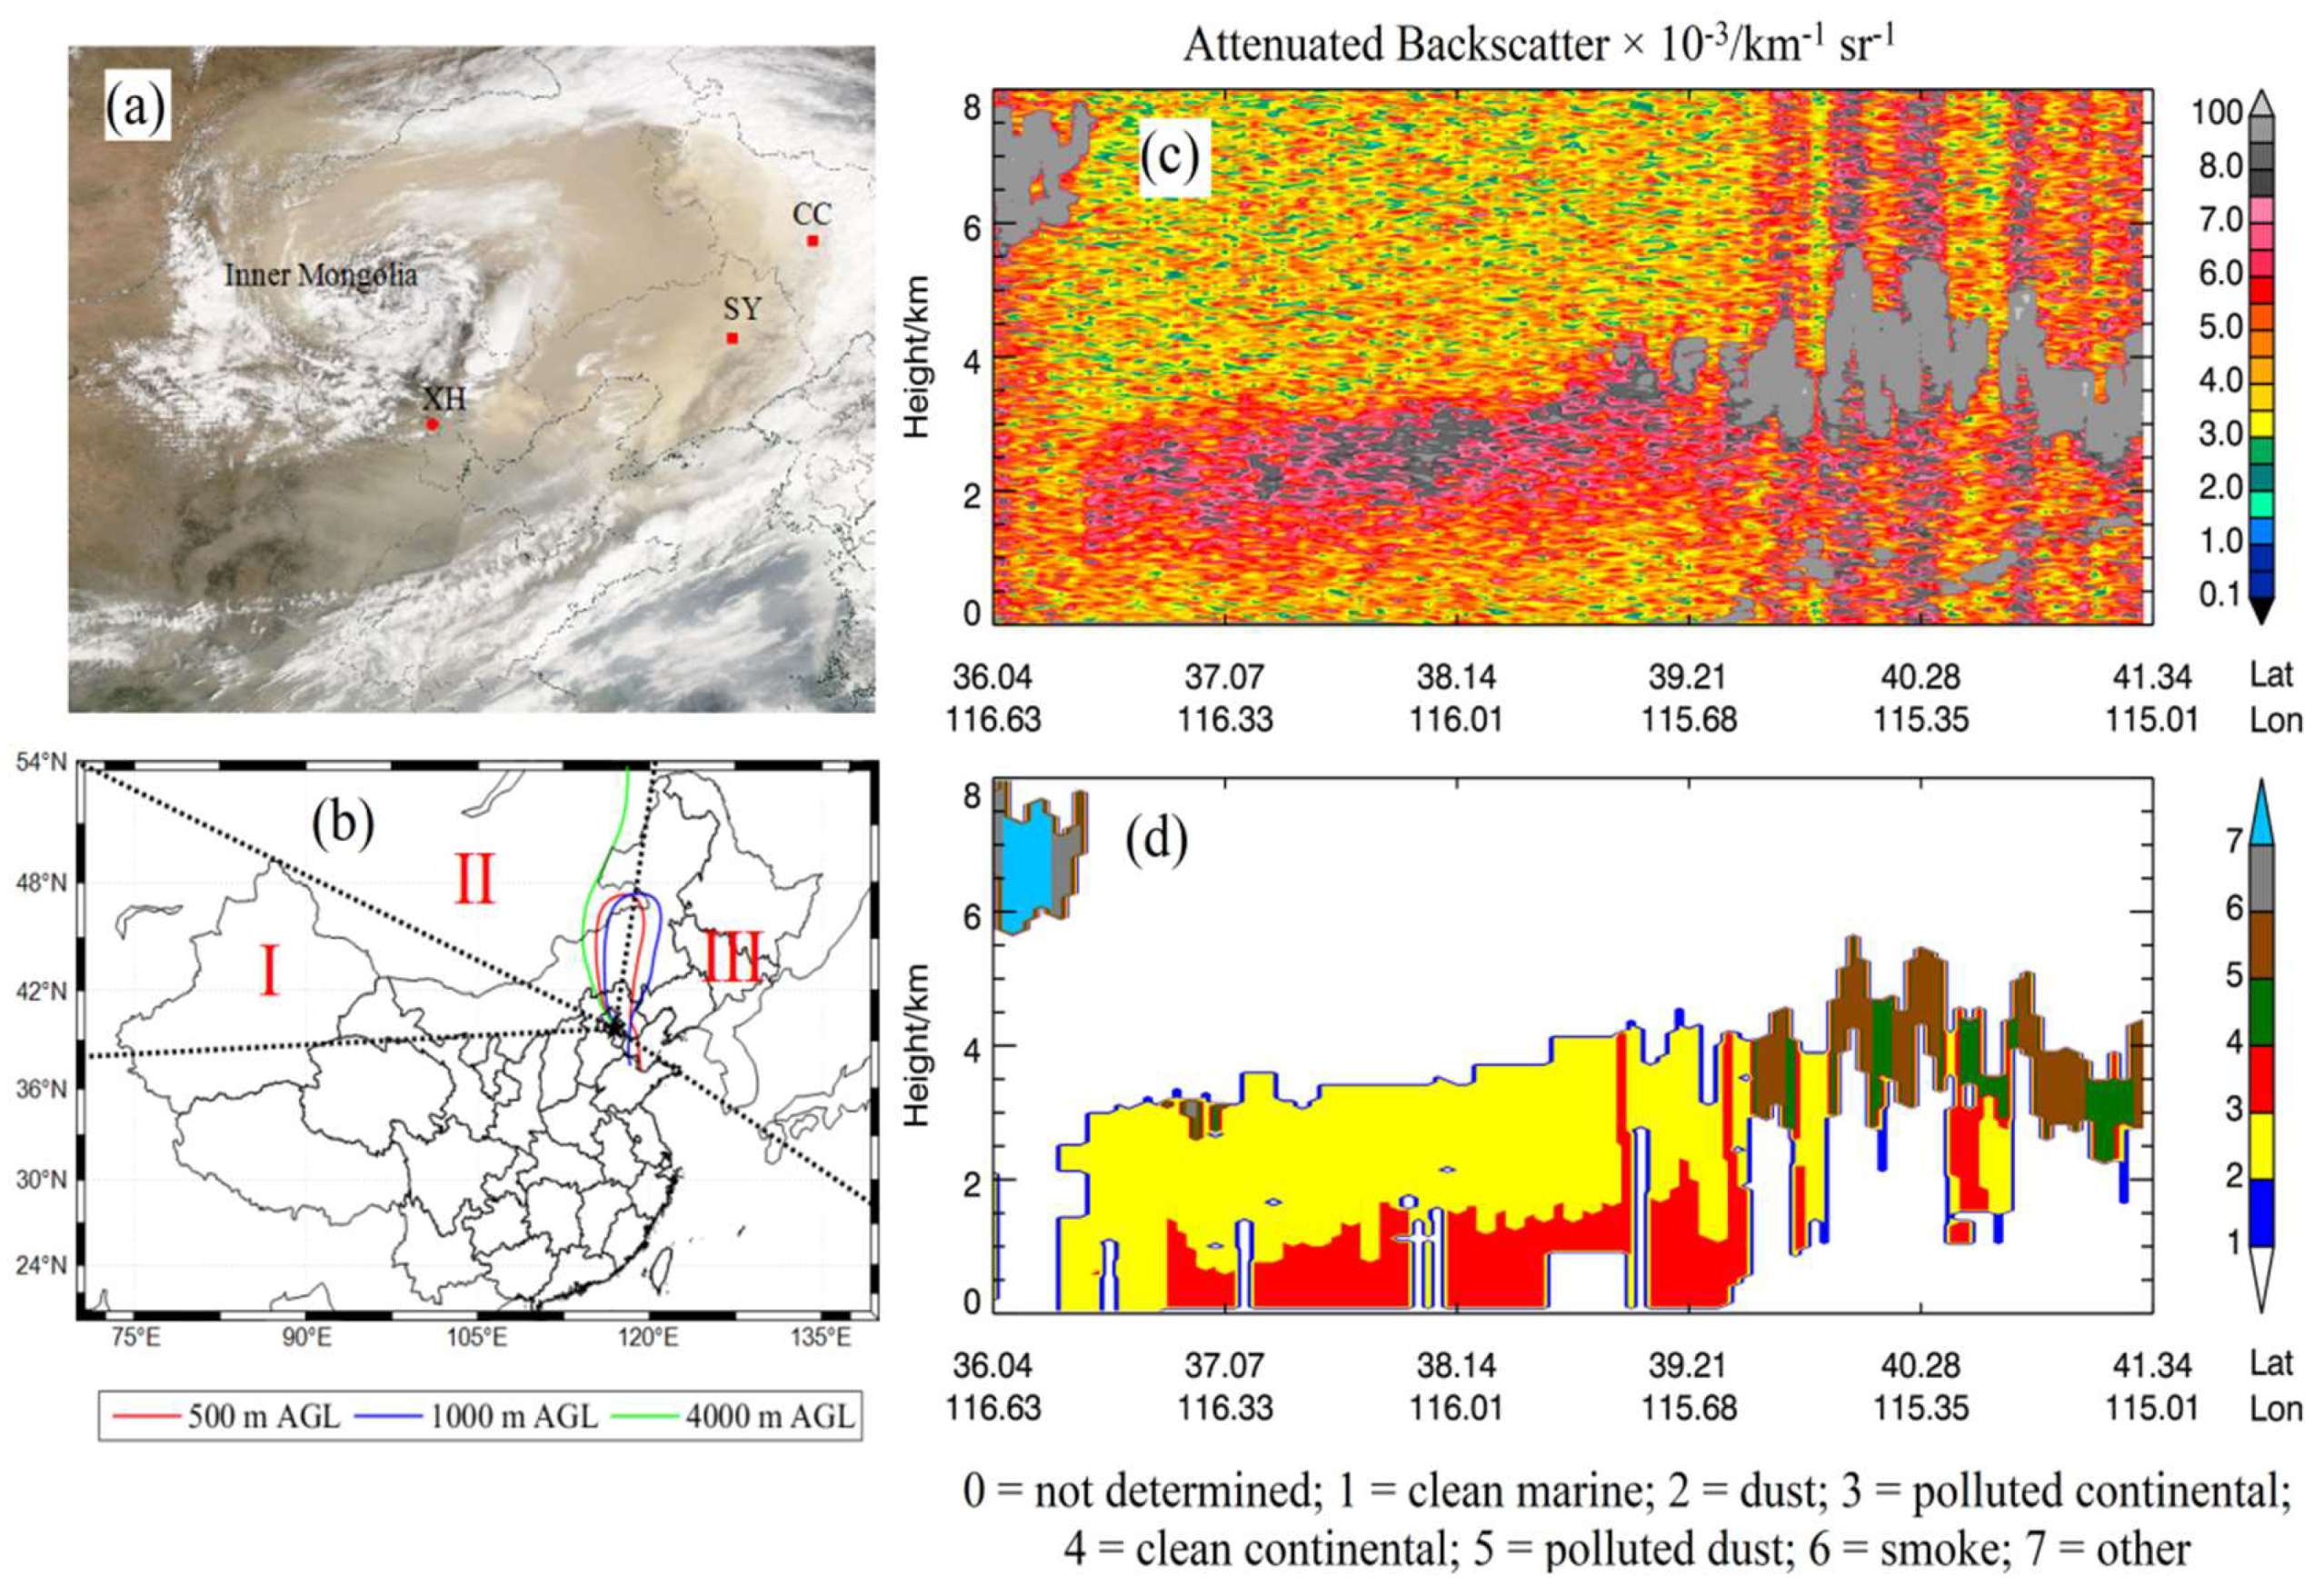
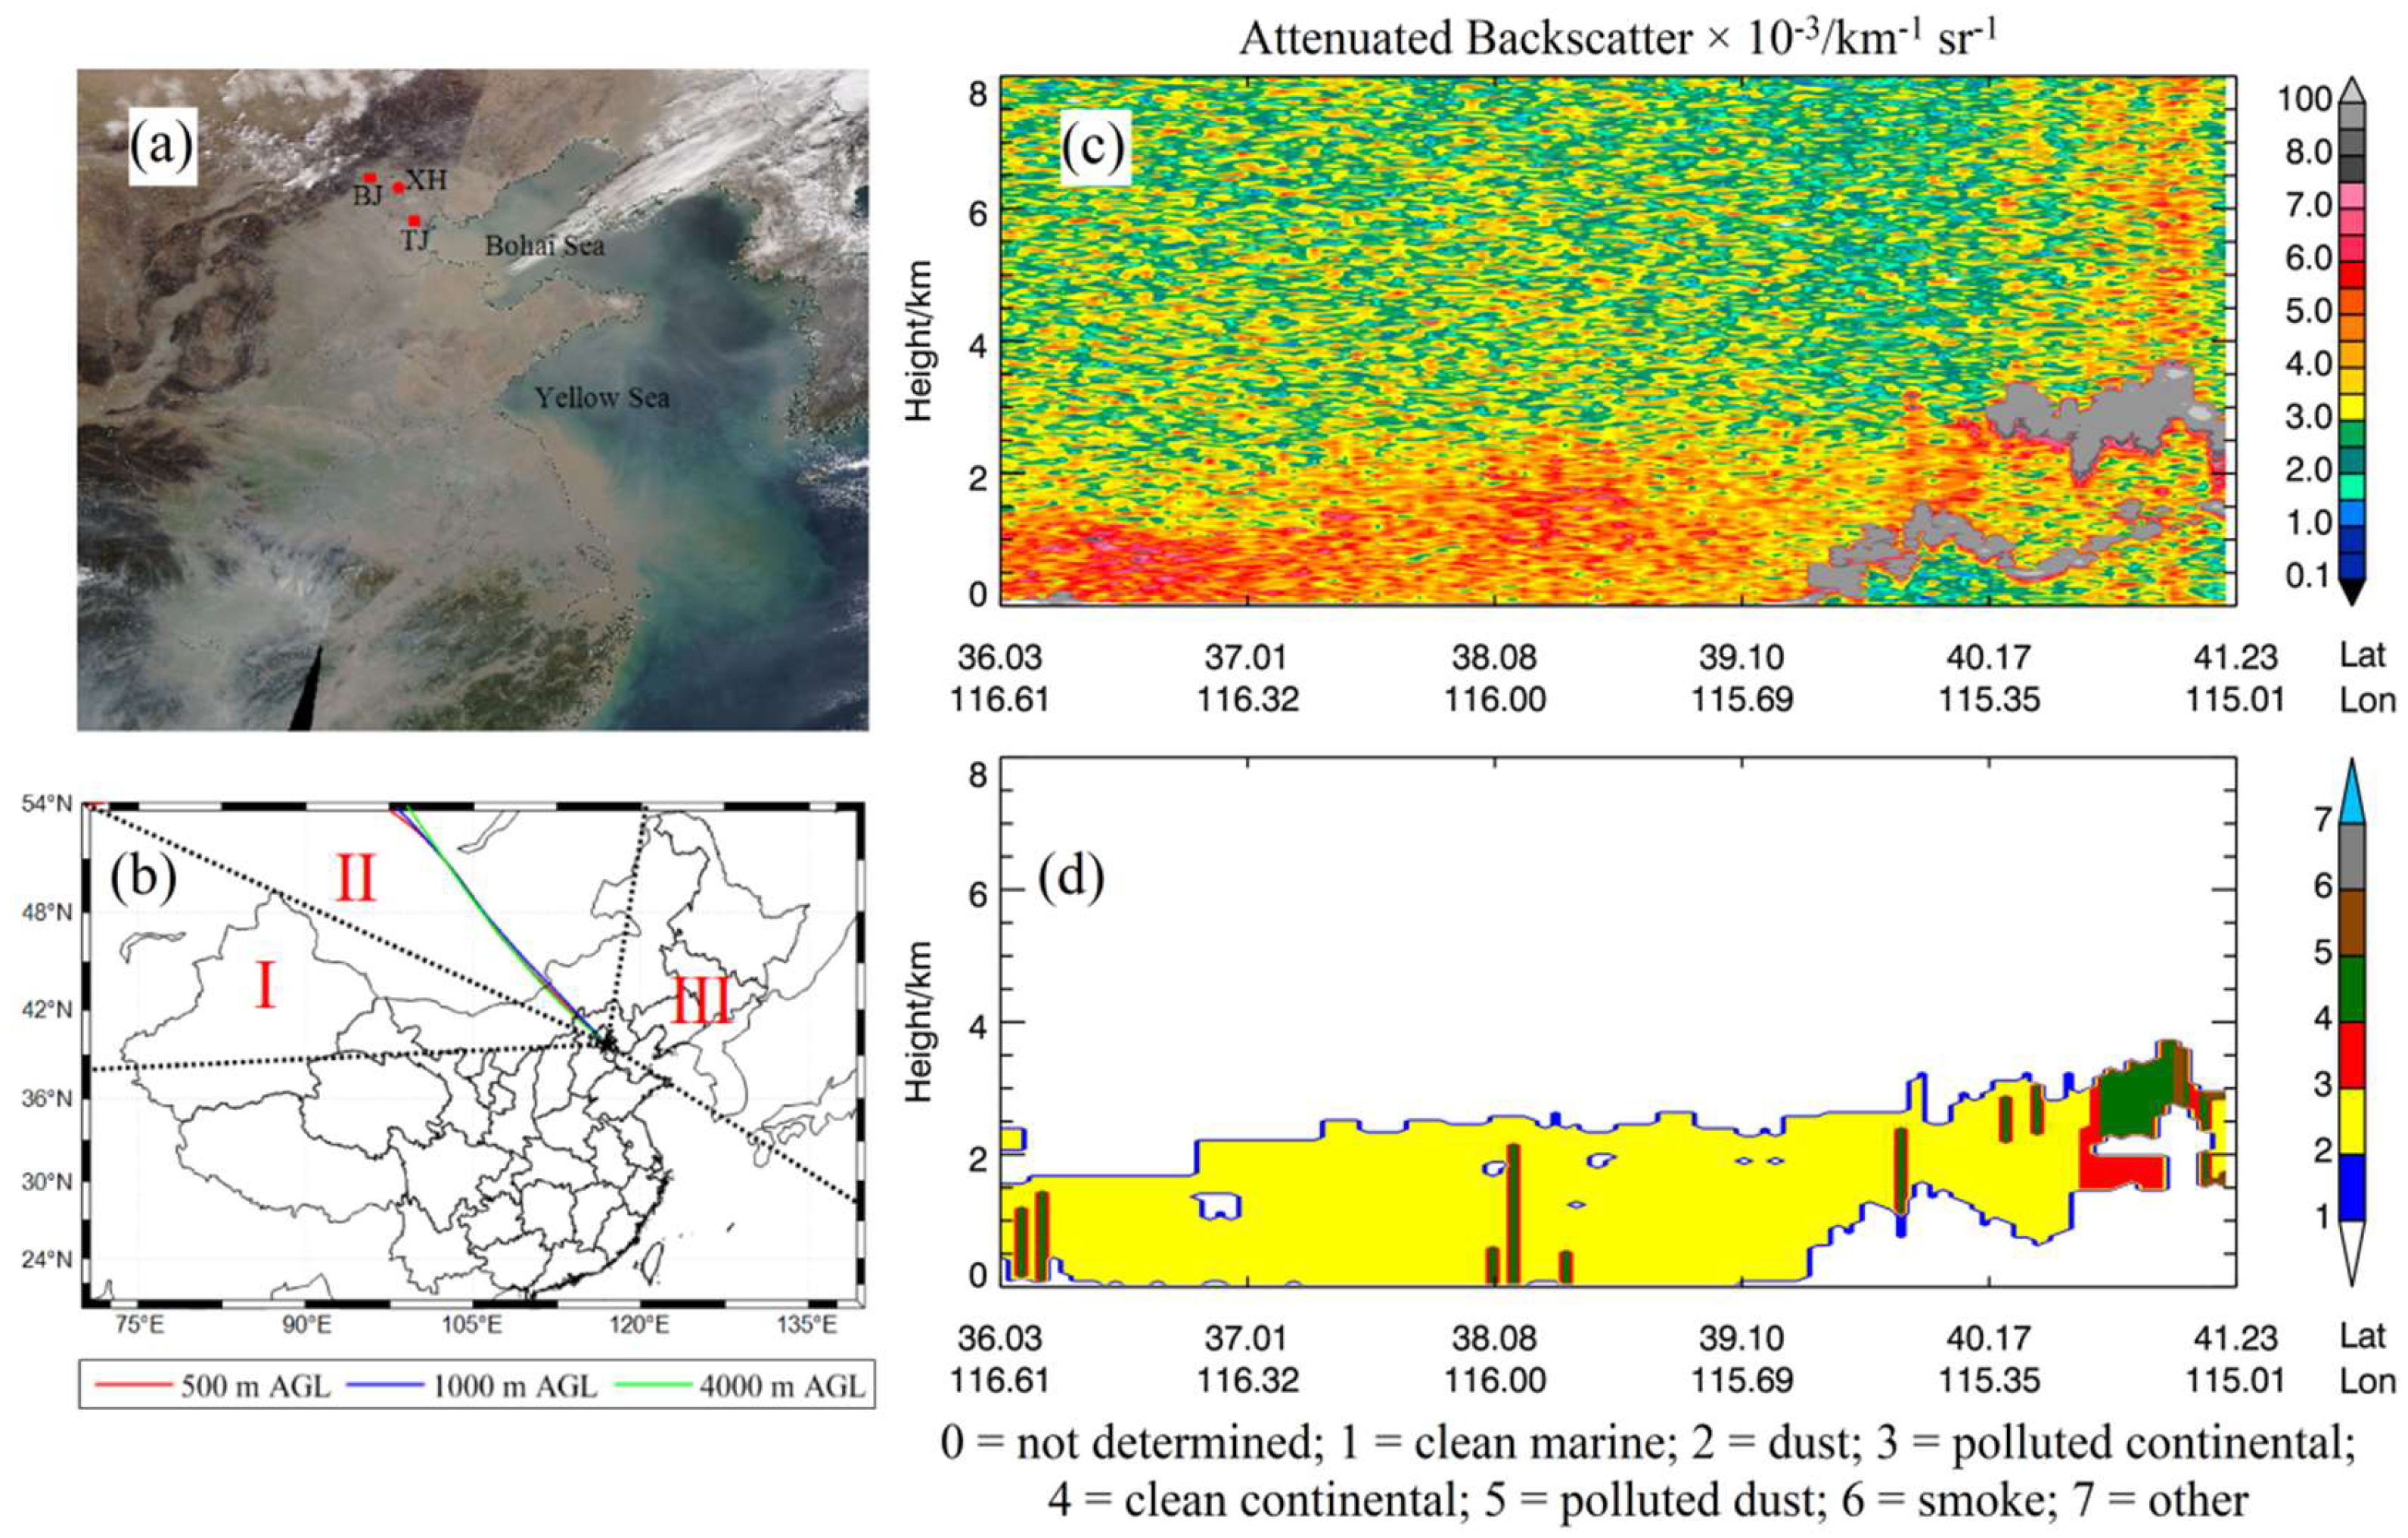
The second dust incident also occurred in spring. The AOD, RFBOA, and RFTOA values were 0.71, −89.33 Wm−2 and −45.63 Wm−2, respectively. A large SSA (0.98) and AAE (3.73) were observed for this case, which was close to that for the first dust case. The MODIS RGB image (Figure 11a) clearly displayed one arc-shaped dust layer, which dramatically suspended above the clouds and widely covered most provinces of the NCP (including BJ, TJ, HB, Shanxi, and Inner Mongolia) and northeast China (Liaoning and Jilin). Synoptic system analysis indicated that (not shown) a strong anticyclonic system controlled the NCP on April 30 after the passage of a cold front which caused strong winds and heavy dust over the NCP. An upper cold vortex with the center in Inner Mongolia covered most areas of the NCP, and XH was at the edge of this cold vortex cloud system. The back-trajectory at 500 and 1000 m showed that this air mass originated from areas surrounding XH and then returned after moving in a circle in northeast China (Figure 11b). A higher air mass at 4000 m AGL originated from the north. This dust event should be closely related to the deserts located in northeast China, such as Horqin, Nenjiang, and Otindag, based on the dust distributions in the MODIS RGB image and back-trajectory analysis. The CALIOP data indicated that this dust layer was generally located below 4 km around XH (Figure 11c,d), which was overlaid over a polluted continental aerosol layer in the boundary layer. This likely indicated the long-range transported dust layer to the NCP overlaid over the local anthropogenic emissions. However, it should be noted that CALIOP cannot easily distinguish dust from continental aerosol, especially when boundary aerosol layer produced lidar signal is attenuated by the dust layer aloft. Strong attenuation by the dust layer aloft even resulted in lack of lidar signal from the boundary layer (Figure 11d).
The third dust event occurred in the winter of 2013. As shown by the MODIS RGB image (Figure 12a), a thin dust scene existed above the NCP. XH was located at the edge of this dust event, with AOD, EAE, RFBOA, and RFTOA values of 0.32, 0.19, −68.57 Wm−2 and −21.32 Wm−2, respectively. SSA and AAE values are default in Level 2 data and their values are 0.89 and 1.12 in Level 1.5 data. Consistent with the land areas, dust aerosols were also suspended over the Bohai Sea and Yellow Sea, which are located ~100 and ~500 km southeast of XH, respectively. The back-trajectory showed that the air mass simultaneously originated from northern China at 500, 1000, and 4000 m (Figure 12b). The CALIPSO data showed that this dust layer generally appeared below 3 km (Figure 12c,d).

4. Conclusions

Atmospheric aerosols, as one of the fundamental components of the atmosphere, have a large impact on climate change. This study analyzed the properties of dust aerosols and their radiative effects based on high-quality and long-duration measurements with good continuity collected at XH in the NCP. The main conclusions are summarized as follows.
A total of 105, 3, 18, and 20 dust days were observed in spring, summer, autumn, and winter, respectively, between 2004 and 2017. The maximum dust AOD was 0.60 ± 0.44 in spring, followed (in decreasing order) by those in autumn (0.58 ± 0.39), summer (0.54 ± 0.15), and winter (0.53 ± 0.23). The dust EAE was least in autumn (0.35 ± 0.16); closer values were observed in spring and winter. A single-peak structure of coarse-mode aerosols were found at a peak value of 2.94 μm in spring, summer and autumn, with the exception of 2.24 μm in winter.
Dust air mass at 500 m mostly originated from the Gobi and other deserts of northern China and Mongolia (59.8%), followed by northwest China and Kazakhstan (37.2%), and the fewest dust events originated from northeast China (3.0%). A lower dust transport path tended to be demonstrated by dust from the northeast rather than those from the other directions. A decreasing trend of RF cooling effect was exhibited as the dust source changed from northwest to northeast, whereas their RFE variations were relatively stable. A stronger cooling effect of RF was presented in spring than in the other three seasons. Given the fact that RF derived from the AERONET retrieval products is mainly obtained at a very narrow range of solar zenith angle that shows little seasonal dependence, so in this study, we presented the RF result under nearly similar condition. Slight weaker cooling effect of RFEBOA were observed in summer compared to the other three seasons; a fine seasonal increasing pattern of the cooling effect was presented by RFETOA. By using surface observations, satellite data and back-trajectory calculations, the impacts of long-range transport on dust properties and their RF were specifically discussed for three typical dust events over the NCP.
This study aimed at presenting how dust events can be evaluated during the recent 14 years and how dust impacts radiative forcing in NCP. It should also be noted that the representativeness of the dust properties in summer and/or from the northeast region maybe still need further verification due to their relatively fewer dust event occurrences. Additionally, further relevant investigations of other dominant aerosol types are warranted, with the expectation of a better understanding of their distinct properties and radiative impacts over the NCP.

Author Contributions

Conceptualization, J.Z. and X.X.; methodology, J.Z. and X.X.; validation, H.C., X.F., and J.L.; data analysis, J.Z. and X.Z.; writing—review and editing, J.Z., X.X., and X.F.

Funding

This research was supported by the Strategic Priority Research Program of the Chinese Academy of Sciences (Grant No. XDA17010101), the National Key R&D Program of China (Grant No. 2017YFA0603504), and the National Natural Science Foundation of China (Grant No. 41875183).

Acknowledgments

The AERONET, MODIS, and CALIPSO data used in the paper are publicly available from http://aeronet.gsfc.nasa.gov/, https://worldview.earthdata.nasa.gov/, and https://www-calipso.larc.nasa.gov/, respectively.

Conflicts of Interest

The authors declare no conflict of interest.

References

  1. Haywood, J.; Francis, P.; Osborne, S.; Glew, M.; Loeb, N.; Highwood, E.; Tanré, D.; Myhre, G.; Formenti, P.; Hirst, E. Radiative properties and direct radiative effect of Saharan dust measured by the C-130 aircraft during SHADE: 1. Solar spectrum. J. Geophys. Res. 2003, 108, 8577. [Google Scholar] [CrossRef]
  2. Huang, J.; Lin, B.; Minnis, P.; Wang, T.; Wang, X.; Hu, Y.; Yi, Y.; Ayers, J.K. Satellite-based assessment of possible dust aerosols semi-direct effect on cloud water path over East Asia. Geophys. Res. Lett. 2006, 33, L19802. [Google Scholar] [CrossRef]
  3. Kaufman, Y.J.; Koren, I.; Remer, L.A.; Rosenfeld, D.; Rudich, Y. The effect of smoke, dust, and pollution aerosol on shallow cloud development over the Atlantic Ocean. Proc. Natl. Acad. Sci. USA 2005, 102, 11207–11212. [Google Scholar] [CrossRef] [PubMed] [Green Version]
  4. Kinne, S.; Schulz, M.; Textor, C.; Guibert, S.; Balkanski, Y.; Bauer, S.E.; Berntsen, T.; Berglen, T.F.; Boucher, O.; Chin, M.; et al. An AeroCom initial assessment—optical properties in aerosol component modules of global models. Atmos. Chem. Phys. 2006, 6, 1815–1834. [Google Scholar] [CrossRef]
  5. Huang, J.; Wang, T.; Wang, W.; Li, Z.; Yan, H. Climate effects of dust aerosols over East Asian arid and semiarid regions. J. Geophys. Res. 2014, 119, 11398–11416. [Google Scholar] [CrossRef]
  6. Husar, R.B.; Tratt, D.M.; Schichtel, B.A.; Falke, S.R.; Li, F.; Jaffe, D.; Gassó, S.; Gill, T.; Laulainen, N.S.; Lu, F.; et al. Asian dust events of April 1998. J. Geophys. Res. 2001, 106, 18317–18330. [Google Scholar] [CrossRef]
  7. Huang, K.; Zhuang, G.; Li, J.; Wang, Q.; Sun, Y.; Lin, Y.; Fu, J.S. Mixing of Asian dust with pollution aerosol and the transformation of aerosol components during the dust storm over China in spring 2007. J. Geophys. Res. 2010, 115, D00K13. [Google Scholar] [CrossRef]
  8. Che, H.; Zhang, X.Y.; Xia, X.; Goloub, P.; Holben, B.; Zhao, H.; Wang, Y.; Zhang, X.C.; Wang, H.; Blarel, L.; et al. Ground-based aerosol climatology of China: Aerosol optical depths from the China Aerosol Remote Sensing Network (CARSNET) 2002–2013. Atmos. Chem. Phys. 2015, 15, 7619–7652. [Google Scholar] [CrossRef]
  9. Kim, D.; Chin, M.; Yu, H.; Eck, T.F.; Sinyuk, A.; Smirnov, A.; Holben, B. Dust optical properties over North Africa and Arabian Peninsula derived from the AERONET dataset. Atmos. Chem. Phys. 2011, 11, 10733–10741. [Google Scholar] [CrossRef] [Green Version]
  10. Sokolik, I.N.; Toon, O.B. Incorporation of mineralogical composition into models of the radiative properties of mineral aerosol from UV to IR wavelengths. J. Geophys. Res. 1999, 104, 9423–9444. [Google Scholar] [CrossRef]
  11. Li, L.; Sokolik, I.N. The dust direct radiative impact and its sensitivity to the land surface state and key minerals in the WRF-Chem-DuMo Model: A case study of dust storms in Central Asia. J. Geophys. Res. 2018, 123, 4564–4582. [Google Scholar] [CrossRef]
  12. Russell, P.B.; Bergstrom, R.W.; Shinozuka, Y.; Clarke, A.D.; DeCarlo, P.F.; Jimenez, J.L.; Livingston, J.M.; Redemann, J.; Dubovik, O.; Strawa, A. Absorption Angstrom Exponent in AERONET and related data as an indicator of aerosol composition. Atmos. Chem. Phys. 2010, 10, 1155–1169. [Google Scholar] [CrossRef] [Green Version]
  13. Che, H.; Qi, B.; Zhao, H.; Xia, X.; Eck, T.F.; Goloub, P.; Dubovik, O.; Estelles, V.; Cuevas-Agulló, E.; Blarel, L.; et al. Aerosol optical properties and direct radiative forcing based on measurements from the China Aerosol Remote Sensing Network (CARSNET) in eastern China. Atmos. Chem. Phys. 2018, 18, 405–425. [Google Scholar] [CrossRef] [Green Version]
  14. Li, Z.; Li, C.; Chen, H.; Tsay, S.; Holben, B.; Huang, J.; Li, B.; Maring, H.; Qian, Y.; Shi, G.; et al. East Asian Studies of Tropospheric Aerosols and their Impact on Regional Climate (EAST-AIRC): An overview. J. Geophys. Res. 2011, 116, 1–15. [Google Scholar] [CrossRef]
  15. Li, Z.; Xia, X.; Cribb, M.; Mi, W.; Holben, B.; Wang, P.; Chen, H.; Tsay, S.; Eck, T.F.; Zhao, F.; et al. Aerosol optical properties and their radiative effects in northern China. J. Geophys. Res. 2007, 112, D22S01. [Google Scholar] [CrossRef]
  16. Xia, X.; Chen, H.; Wang, P.; Zong, X.; Gouloub, P. Aerosol properties and their spatial and temporal variations over north China in spring 2001. Tellus Ser. B 2005, 57, 28–39. [Google Scholar]
  17. Eck, T.; Holben, B.; Sinyuk, A.; Pinker, R.; Goloub, P.; Chen, H.; Chatenet, B.; Li, Z.; Singh, R.P.; Tripathi, S.N.; et al. Climatological aspects of the optical properties of fine/coarse mode aerosol mixtures. J. Geophys. Res. 2010, 115, D19205. [Google Scholar] [CrossRef]
  18. Xia, X.; Chen, H.; Goloub, P.; Zong, X.; Zhang, W.; Wang, P. Climatological aspects of aerosol optical properties in North China Plain based on ground and satellite remote-sensing data. J. Quant. Spectrosc. Radiat. Transf. 2013, 127, 12–23. [Google Scholar] [CrossRef]
  19. Xia, X.; Chen, H.; Li, Z.; Wang, P.; Wang, J. Significant reduction of surface solar irradiance induced by aerosols in a suburban region in northeastern China. J. Geophys. Res. 2007, 112, D22S02. [Google Scholar] [CrossRef]
  20. Wang, Y.; Che, H.; Ma, J.; Wang, Q.; Shi, G.; Chen, H.; Goloub, P.; Hao, X. Aerosol radiative forcing under clear, hazy, foggy, and dusty weather conditions over Beijing, China. Geophys. Res. Lett. 2009, 36, L06804. [Google Scholar] [CrossRef]
  21. Wang, W.; Cheng, T.; Zhang, R.; Jia, X.; Han, Z.; Zhang, X.; Xu, X.; Li, D. Insights into an Asian dust event sweeping Beijing during April 2006: Particle chemical composition, boundary layer structure, and radiative forcing. J. Geophys. Res. 2010, 115, D18208. [Google Scholar] [CrossRef]
  22. Li, Z.; Chen, H.; Cribb, M.; Dickerson, R.; Holben, B.; Li, C.; Lu, D.; Luo, Y.; Maring, H.; Shi, G.; et al. Preface to special section on East Asian Studies of Tropospheric Aerosols: An International Regional Experiment (EAST-AIRE). J. Geophys. Res. 2007, 112, D22S00. [Google Scholar] [CrossRef]
  23. Fan, X.; Xia, X.; Chen, H. Comparison of column-integrated aerosol optical and physical properties in an urban and suburban site on the North China Plain. Adv. Atmos. Sci. 2015, 32, 477–486. [Google Scholar] [CrossRef]
  24. Sun, J.; Zhang, M.; Liu, T. Spatial and temporal characteristics of dust storms in China and its surrounding regions, 1960-1999: Relations to source area and climate. J. Geophys. Res. 2001, 106, 10325–10334. [Google Scholar] [CrossRef]
  25. Wang, X.; Zhou, Z.; Dong, Z. Control of dust emissions by geomorphic conditions, wind environments and land use in northern China: An examination based on dust storm frequency from 1960 to 2003. Geomorphology 2006, 81, 292–308. [Google Scholar] [CrossRef]
  26. Wang, X.; Zhang, C.; Hasi, E.; Dong, Z. Has the Three Norths Forest Shelterbelt Program solved the desertification and dust storm problems in arid and semiarid China? J. Arid Environ. 2010, 74, 13–22. [Google Scholar] [CrossRef]
  27. Eck, T.F.; Holben, B.N.; Reid, J.S.; Dubovik, O.; Smirnov, A.; O’Neill, N.T.; Slutsker, I.; Kinne, S. Wavelength dependence of the optical depth of biomass burning, urban and desert dust aerosols. J. Geophys. Res. 1999, 104, 31333–31350. [Google Scholar] [CrossRef]
  28. Dubovik, O.; King, M.D. A flexible inversion algorithm for retrieval of aerosol optical properties from Sun and sky radiance measurements. J. Geophys. Res. 2000, 105, 20673–20696. [Google Scholar] [CrossRef] [Green Version]
  29. Dubovik, O.; Sinyuk, A.; Lapyonok, T.; Holben, B.; Mishchenko, M.; Yang, P.; Eck, T.; Volten, H.; Munoz, O.; Veihelmann, B.; et al. Application of spheroid models to account for aerosol particle nonsphericity in remote sensing of desert dust. J. Geophys. Res. 2006, 111, D11208. [Google Scholar] [CrossRef]
  30. García, O.E.; Díaz, A.M.; Expósito, F.J.; Díaz, J.P.; Dubovik, O.; Dubuisson, P.; Roger, J.C.; Eck, T.F.; Sinyuk, A.; Derimian, Y.; et al. Validation of AERONET estimates of atmospheric solar fluxes and aerosol radiative forcing by ground-based broadband measurements. J. Geophys. Res. 2008, 113, D21207. [Google Scholar] [CrossRef]
  31. Ohmura, A.; Dutton, E.G.; Forgan, B.; Fröhlich, C.; Gilgen, H.; Hegner, H.; Heimo, A.; König-Langlo, G.; McArthur, B.; Müller, G.; et al. Baseline Surface Radiation Network (BSRN/WCRP): New Precision Radiometry for Climate Research. Bull. Amer. Meteor. Soc. 1998, 79, 2115–2136. [Google Scholar] [CrossRef] [Green Version]
  32. Winker, D.M.; Hunt, W.H.; McGill, M.J. Initial performance assessment of CALIOP. Geophys. Res. Lett. 2007, 34, L19803. [Google Scholar] [CrossRef]
  33. Winker, D.M.; Vaughan, M.A.; Omar, A.; Hu, Y.; Powell, K.A.; Liu, Z.; Hunt, W.H.; Young, S.A. Overview of the CALIPSO Mission and CALIOP Data Processing Algorithms. J. Atmos. Ocean. Technol. 2009, 26, 2310–2323. [Google Scholar] [CrossRef]
  34. Omar, A.H.; Winker, D.M.; Vaughan, M.A.; Hu, Y.; Trepte, C.R.; Ferrare, R.A.; Lee, K.; Hostetler, C.A.; Kittaka, C.; Rogers, R.R.; et al. The CALIPSO Automated Aerosol Classification and Lidar Ratio Selection Algorithm. J. Atmos. Ocean. Technol. 2009, 26, 1994–2014. [Google Scholar] [CrossRef]
  35. Draxler, R.R.; Hess, G.D. An overview of the HYSPLIT_4 modeling system for trajectories, dispersion, and deposition. Aust. Meteorol. Mag. 1998, 47, 295–308. [Google Scholar]
  36. Stein, A.F.; Draxler, R.R.; Rolph, G.D.; Stunder, B.J.B.; Cohen, M.D.; Ngan, F. NOAA’s HYSPLIT atmospheric transport and dispersion modeling system. Bull. Am. Meteorol. Soc. 2015, 96, 2059–2077. [Google Scholar] [CrossRef]
  37. Rolph, G.; Stein, A.; Stunder, B. Real-time Environmental Applications and Display system: READY. Environ. Model. Softw. 2017, 95, 210–228. [Google Scholar] [CrossRef]
  38. Fleming, Z.L.; Monks, P.S.; Manning, A.J. Review: Untangling the influence of air-mass history in interpreting observed atmospheric composition. Atmos. Res. 2012, 104–105, 1–39. [Google Scholar] [CrossRef]
  39. Gaiero, D.M.; Simonella, L.; Gassó, S.; Gili, S.; Stein, A.F.; Sosa, P.; Becchio, R.; Arce, J.; Marelli, H. Ground/satellite observations and atmospheric modeling of dust storms originated in the high Puna-Altiplano deserts (South America): Implications for the interpretation of paleo-climatic archives. J. Geophys. Res. 2013, 118, 3817–3831. [Google Scholar]
  40. Ciren, P.; Shobha, K. Dust aerosol index (DAI) algorithm for MODIS. J. Geophys. Res. 2014, 119, 4770–4792. [Google Scholar] [CrossRef]
  41. Li, L.; Sokolik, I.N. Analysis of dust aerosol retrievals using satellite data in Central Asia. Atmosphere 2018, 9, 288. [Google Scholar] [CrossRef]
  42. Dubovik, O.; Holben, B.; Eck, T.F.; Smirnov, A.; Kaufman, Y.J.; King, M.D.; Tanre, D.; Slutsker, I. Variability of absorption and optical properties of key aerosol types observed in worldwide locations. J. Atmos. Sci. 2002, 59, 590–608. [Google Scholar] [CrossRef]
  43. Wang, J.; Xia, X.; Wang, P.; Christopher, S. Diurnal variability of dust aerosol optical thickness and Angstrom exponent over dust source regions in China. Geophys. Res. Lett. 2004, 31, L08107. [Google Scholar] [CrossRef]
  44. Xia, X.; Chen, H.; Wang, P. Aerosol properties in a Chinese semiarid region. Atmos. Environ. 2004, 38, 4571–4581. [Google Scholar]
  45. Zhang, J.; Chen, J.; Xia, X.; Che, H.; Fan, X.; Xie, Y.; Han, Z.; Chen, H.; Lu, D. Heavy aerosol loading over the Bohai Bay as revealed by ground and satellite remote sensing. Atmos. Environ. 2016, 124, 252–261. [Google Scholar] [CrossRef]
  46. Zhang, R.; Fu, C.; Han, Z.; Zhu, C. Characteristics of elemental composition of PM2.5 in the spring period at Tongyu in the semi-arid region of Northeast China. Adv. Atmos. Sci. 2008, 25, 922–931. [Google Scholar] [CrossRef] [Green Version]
  47. Yu, X.; Lu, R.; Kumar, K.R.; Ma, J.; Zhang, Q.; Jiang, Y.; Kang, N.; Yang, S.; Wang, J.; Li, M. Dust aerosol properties and radiative forcing observed in spring during 2001–2014 over urban Beijing, China. Environ. Sci. Pollut. Res. 2016, 23, 15432–15442. [Google Scholar] [CrossRef]
  48. Protat, A.; Bouniol, D.; Delanoë, J.; May, P.T.; Plana-Fattori, A.; Hasson, A.; O’Connor, E.; Görsdorf, U.; Heymsfield, A.J. Assessment of CloudSat reflectivity measurements and ice cloud properties using ground-based and airborne cloud radar observations. J. Atmos. Ocean. Technol. 2009, 26, 1717–1741. [Google Scholar] [CrossRef]
  49. Protat, A.; Young, S.A.; McFarlane, S.; L’Ecuyer, T.; Mace, G.G.; Comstock, J.; Long, J.C.; Berry, E.; Delanoë, J. Reconciling ground-based and space-based estimates of the frequency of occurrence and radiative effect of clouds around Darwin, Australia. J. Appl. Meteorol. Clim. 2014, 53, 456–478. [Google Scholar] [CrossRef]
  50. Xi, B.K.; Dong, X.Q.; Minnis, P.; Khaiyer, M.M. A 10 year climatology of cloud fraction and vertical distribution derived from both surface and GOES observations over the DOE ARM SPG site. J. Geophys. Res. 2010, 115, D12124. [Google Scholar] [CrossRef]
  51. Liu, D.; Zhou, T.; Boiyo, B.; Chen, S.; Lu, Z.; Wu, Y.; Zhao, Y. Vertical structures of dust aerosols over East Asia based on CALIPSO retrievals. Remote Sens. 2019, 11, 701. [Google Scholar] [CrossRef]
  52. Winker, D.M.; Pelon, J.R.; McCormick, M.P. The CALIPSO mission: Spaceborne lidar for observation of aerosols and clouds. Proc. SPIE 2003, 4893, 1–11. [Google Scholar]
  53. Liu, Z.; Hunt, W.; Vaughan, M.; Hostetler, C.; McGill, M.; Powell, K.; Winker, D.; Hu, Y. Estimating random errors due to shot noise in backscatter lidar observations. Appl. Opt. 2006, 45, 4437–4447. [Google Scholar] [CrossRef]
  54. Omar, A.H.; Winker, D.M.; Tackett, J.L.; Giles, D.M.; Kar, J.; Liu, Z.; Vaughan, M.A.K.; Powell, A.; Trepte, C.R. CALIOP and AERONET aerosol optical depth comparisons: One size fits none. J. Geophys. Res. 2013, 118, 4748–4766. [Google Scholar] [CrossRef]
  55. Liu, D.; Wang, Z.; Liu, Z.; Winker, D.; Trepte, C. A height resolved global view of dust aerosols from the first year CALIPSO lidar measurements. J. Geophys. Res. 2008, 113, D16214. [Google Scholar] [CrossRef]
  56. Barragan, R.; Romano, S.; Sicard, M.; Burlizzi, P.; Perrone, M.R.; Comeron, A. Estimation of mineral dust direct radiative forcing at the European Aerosol Research Lidar NETwork site of Lecce, Italy, during the ChArMEx/ADRIMED summer 2013 campaign: Impact of radiative transfer model spectral resolutions. J. Geophys. Res. 2016, 121, 10237–10261. [Google Scholar] [CrossRef]
  57. Zhao, F.; Li, Z. Estimation of aerosol single scattering albedo from solar direct spectral radiance and total broadband irradiances measured in China. J. Geophys. Res. 2007, 112, D22S03. [Google Scholar] [CrossRef]
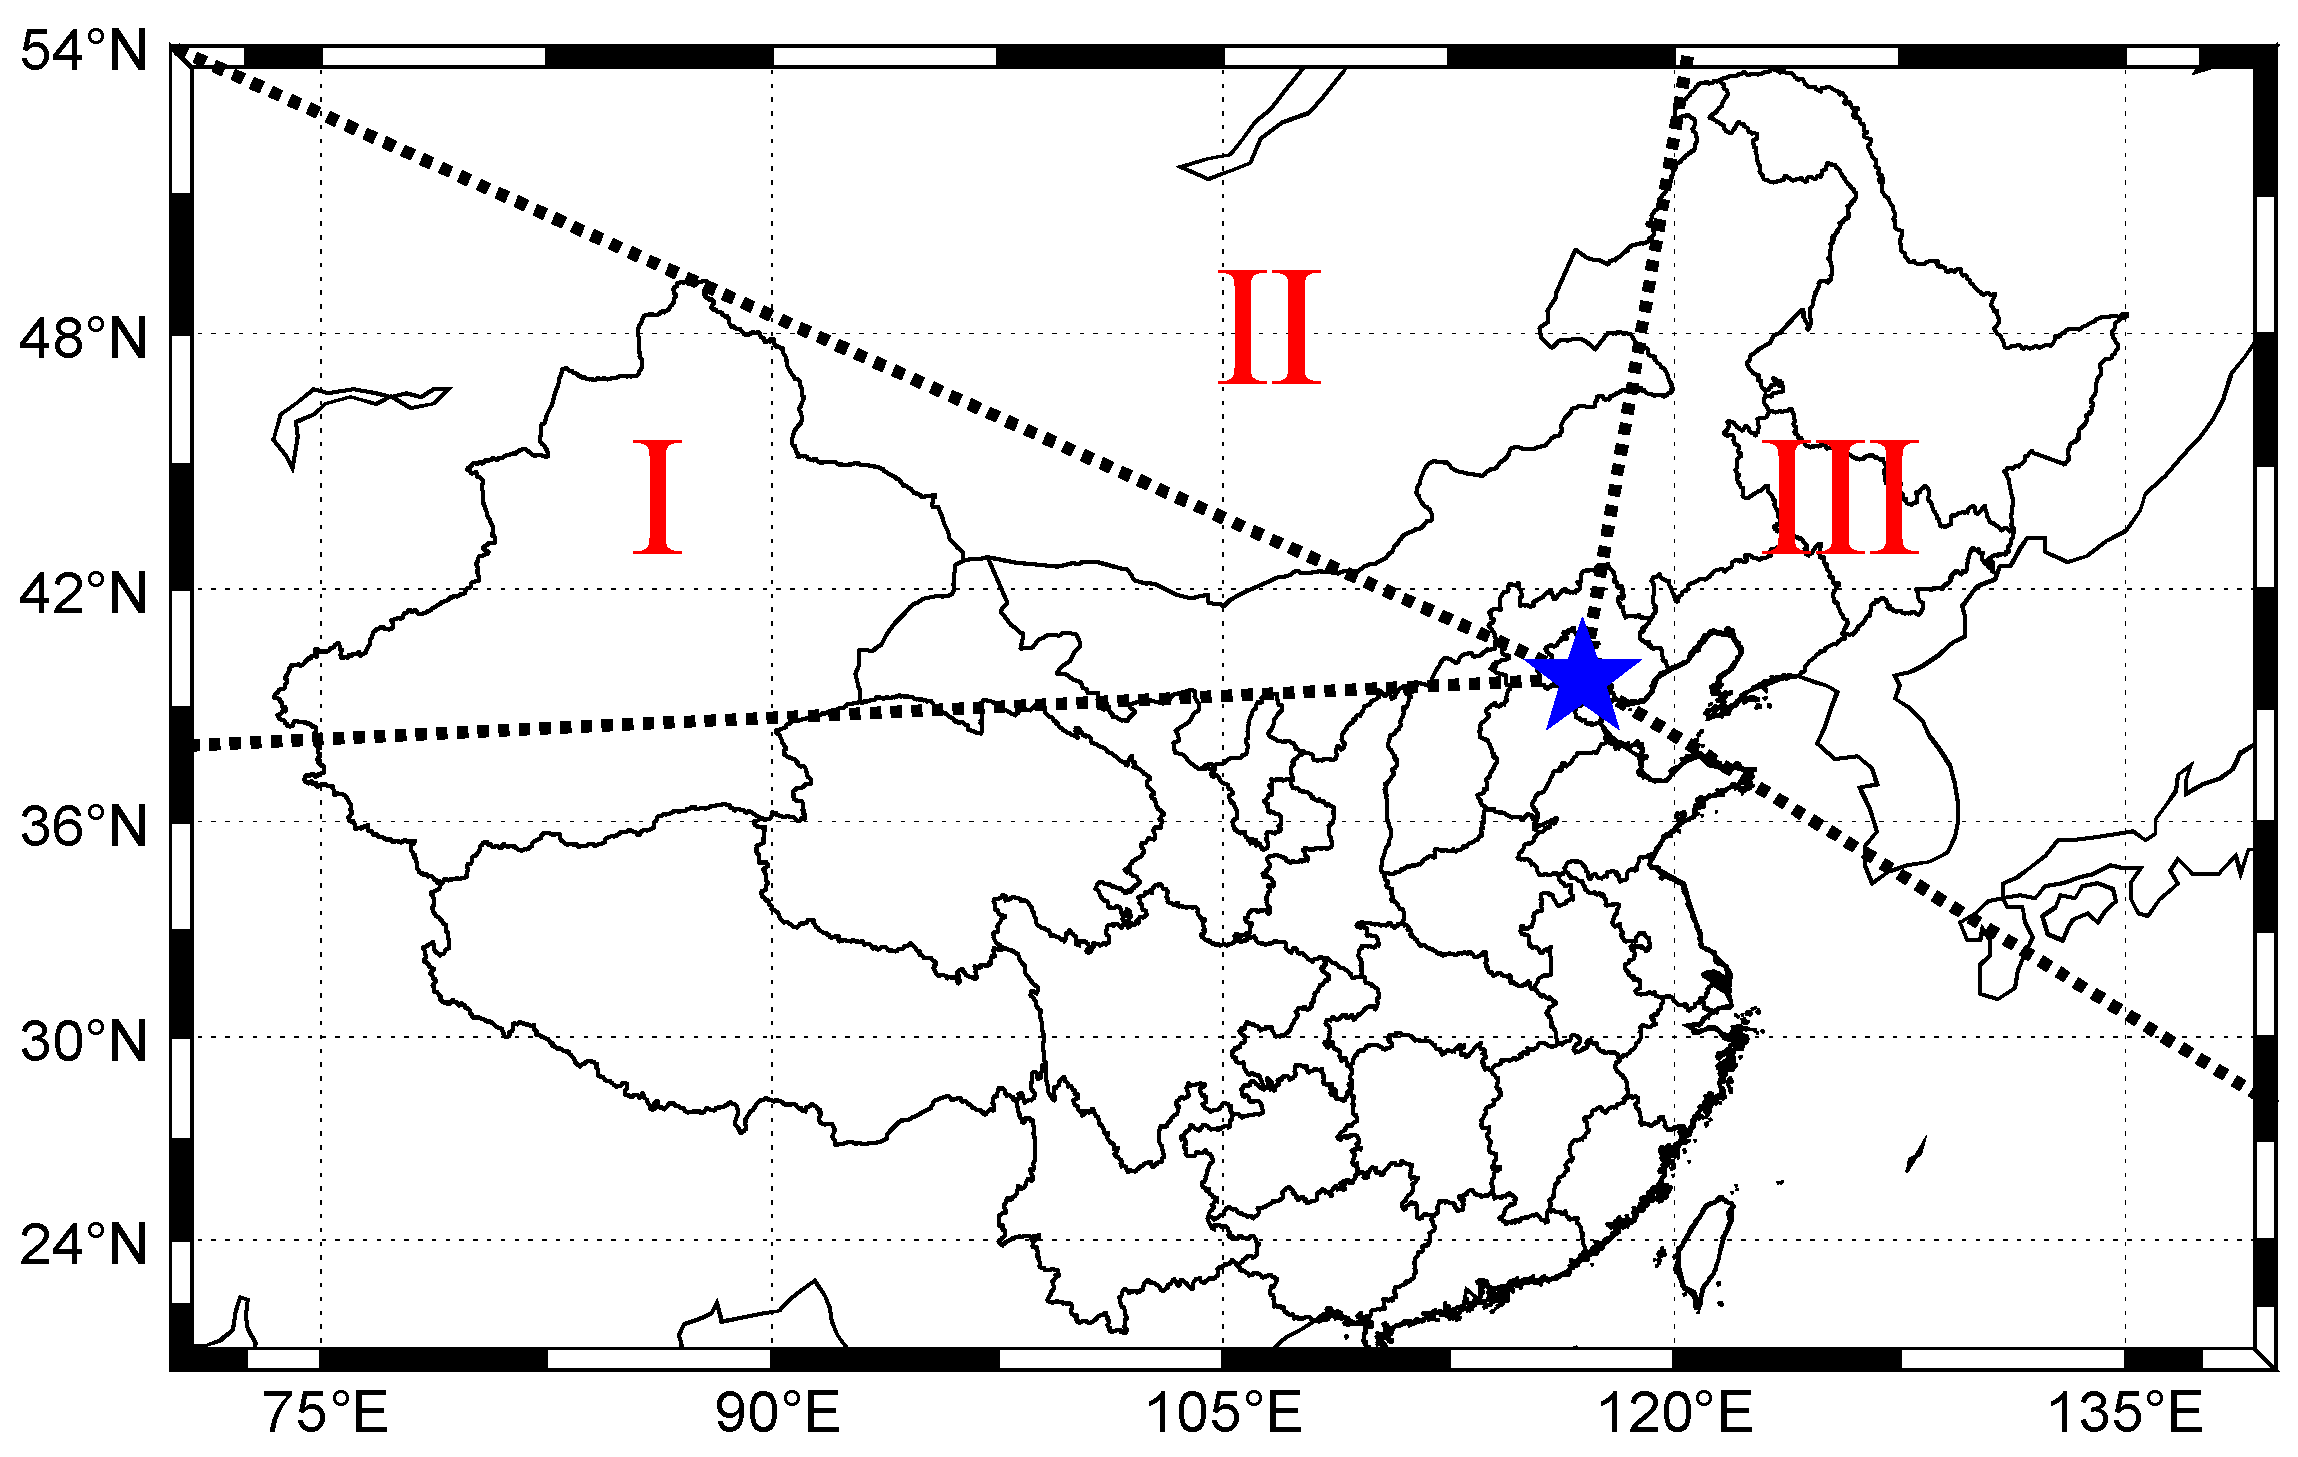
Figure 1. Sketch map of the dust that arrived at XH (blue star; 39.75°N, 116.96°E) from the three greatest possible sources/directions of China: (I) northwest, (II) north, and (III) northeast.
Remotesensing 11 01842 g001
Figure 2. (a) Annual and (b) monthly dust days at Xianghe (XH) between 2004 and 2017.
Remotesensing 11 01842 g002
Figure 3. Distributions of back-trajectory at (a) 500, (b) 1000, and (c) 4000 m above ground level (AGL) for all dust events that arrived at XH from 2004 to 2017. The black star indicates the XH location. The dashed blue line denotes the scope of the air mass from three directions (I: northwest; II: north; III: northeast). Panel (d) presents the occurrence frequency statistics of all dust events from the three directions at 500 (blue), 1000 (green), and 4000 m (yellow) AGL.
Remotesensing 11 01842 g003
Figure 4. Averages and their standard deviations in the (a) aerosol optical depth (AOD) at 675 nm, (b) single scattering albedo (SSA) at 675 nm, (c) extinction Ångström exponent (EAE) (440–870 nm), and (d) absorption Ångström exponent (AAE) (440–870 nm) dust properties for all dust days sorted by their air sources arriving at XH from three directions between 2004 and 2017. The color bar represents the number of dust days which are 54, 89, and 3 from the northwest, north, and northeast, respectively.
Remotesensing 11 01842 g004
Figure 5. Averages and their standard deviations in the (a) AOD at 675 nm, (b) SSA at 675 nm, (c) EAE (440–870 nm), and (d) AAE (440–870 nm) dust properties for all dust days sorted by their seasonal variations between 2004 and 2017. The number of dust days was 105, 3, 18, and 20 in spring, summer, autumn, and winter, respectively.
Remotesensing 11 01842 g005
Figure 6. (a) The normalized aerosol volume size distributions at XH in spring (green line), summer (red line), autumn (blue line), and winter (black line) between 2004 and 2017. The shaded areas represent their standard deviations. (b) Similar to (a) but for dust from three directions: northwest (green line), north (red line), and northeast (blue line).
Remotesensing 11 01842 g006
Figure 7. Cloud-Aerosol Lidar and Infrared Pathfinder Satellite Observations (CALIPSO)-based dust vertical occurrence frequency (left panels) and the averages and their standard deviations of the CALIPSO-retrieved lowest and highest dust altitudes (right panels) at XH from 2004 to 2017. The top panels (a) and (b) present all dust cases sorted by their sources from the three directions, and the bottom panels (c) and (d) show their seasonal variations. The color bar in the four panels represents the number of dust samples analyzed.
Remotesensing 11 01842 g007
Figure 8. Data density plots of global radiation from Baseline Surface Radiation Network (BSRN) observations as a function of Aerosol Robotic Network (AERONET) inversion algorithm calculations at XH from 2004 to 2017. The black line denotes the 1:1 line. The color bar shows the data density of the scatter points; the larger value represents the higher data density, i.e., the maximum value of 1 represents the maximum data density.
Remotesensing 11 01842 g008
Figure 9. Averages and their standard deviations of the dust radiative forcing (RF) (left panels) and RF efficiency (RFE) (right panels) at the dust at the bottom (BOA) (solid line) and dust at the top (TOA) (dashed line) at XH from 2004 to 2017. The top panels (a) and (b) present all dust days sorted by their sources from the three directions, and the bottom panels (c) and (d) show their seasonal variations. The color bar in the four panels represents the number of dust days analyzed.
Remotesensing 11 01842 g009
Figure 10. (a) Moderate Resolution Imaging Spectroradiometer (MODIS) RGB image and (b) back-trajectory at 500 (red line), 1000 (blue line), and 4000 m AGL (green line) for the dust storm that occurred on May 4, 2017. The locations of Beijing (BJ), Tianjin (TJ), and XH are noted in panel (a).
Remotesensing 11 01842 g010
Figure 11. (a) MODIS RGB image and (b) back-trajectory at 500 (red line), 1000 (blue line), and 4000 m AGL (green line) for the dust case that occurred on April 30, 2011. The locations of XH, SY (Shenyang—provincial capital of Liaoning Province), CC (Changchun—provincial capital of Jilin Province), and the Inner Mongolia Autonomous Region are noted in panel (a). Panels (c,d) present the CALIPSO-based vertical distributions of the 532 nm total attenuated backscatter and aerosol types, respectively.
Remotesensing 11 01842 g011
Figure 12. (a) MODIS RGB image and (b) back-trajectory at 500 (red line), 1000 (blue line), and 4000 m AGL (green line) for the dust case that occurred on December 31, 2013. The locations of XH, BJ, TJ, the Bohai Sea, and the Yellow Sea are noted in panel (a). Panels (c,d) present the CALIPSO-based vertical distributions of the 532 nm total attenuated backscatter and aerosol types, respectively.
Remotesensing 11 01842 g012
Table 1. Characteristics of AOD at 675 nm, SSA at 675 nm, EAE (440–870 nm), AAE (440–870 nm), RFBOA (units in Wm−2) and RFTOA (units in Wm−2) for three typical dust cases at XH.
Date (UTC)Dust Source AODSSAEAEAAERFBOARFTOA
20170504 Northwest2.540.970.073.56−315.65−107.49
20110430Northeast0.710.980.073.73−89.33−45.63
20131231 North0.320.890.191.12−68.57−21.32