Article

Satellite-Derived Correlation of SO2, NO2, and Aerosol Optical Depth with Meteorological Conditions over East Asia from 2005 to 2015

1
Research Center for Environmental Changes, Academia Sinica, Taipei 11529, Taiwan
2
Department of Atmospheric and Environmental Sciences, University at Albany, State University of New York, Albany, NY 12222, USA
3
Center for Space and Remote Sensing Research, National Central University, Chungli 32001, Taiwan
4
Department of Atmospheric Sciences, National Taiwan University, Taipei 10617, Taiwan
5
Division of Chemistry and Chemical Engineering, California Institute of Technology, Pasadena, CA 91125, USA
*
Author to whom correspondence should be addressed.
Remote Sens. 2019, 11(15), 1738; https://doi.org/10.3390/rs11151738
Submission received: 6 June 2019 / Revised: 18 July 2019 / Accepted: 20 July 2019 / Published: 24 July 2019
(This article belongs to the Section Atmospheric Remote Sensing)

Abstract

:
Intense economic and industrial development in China has been accompanied by severe local air pollution, as well as in other downwind countries in East Asia. This study analyzes satellite observational data of sulfur dioxide (SO2), nitrogen dioxide (NO2), and aerosol optical depth (AOD) to explore the spatial distribution, long-term temporal variation, and correlation to meteorological conditions over this region over the period 2005–2015. SO2 and NO2 data are retrieved from the ozone monitoring instrument (OMI) onboard the National Aeronautics and Space Administration (NASA) Aura satellite, while AOD data are from the moderate-resolution imaging spectroradiometer (MODIS) onboard the NASA Aqua satellite. Spatial distributions of SO2, NO2, and AOD show the highest levels in the North China Plain (NCP), with hotspots also in Southeastern China (SC) and the Sichuan Basin (SB). Biomass burning also contributes to a high level of AOD in Southeast Asia in spring and in Equatorial Asia in fall. Considering the correlation of pollutant levels to meteorological conditions, monitoring data show that higher temperature and higher relative humidity (RH) favor the conversion of SO2 and NO2 to sulfate and nitrate aerosol, respectively. The impact of stronger lower tropospheric stability facilitates the accumulation of SO2 and NO2 in NCP and SC. Transport of SO2 and NO2 from intense source regions to relatively clean regions is highly influential over East Asia; such transport from the NCP leads to a considerable increase of pollutants in SC, SB, Taiwan Island (TW), and Taiwan Strait (TWS), particularly in winter. Aerosols generated by biomass burning in Southeast Asia and anthropogenic aerosol in SC are transported to TW and TWS and lead to the increase of AOD, with the highest levels of AOD in SC, TW, and TWS occurring in spring. Precipitation results in the removal of pollutants, especially in highly polluted regions, the effect of which is most significant in winter and spring.

Graphical Abstract

1. Introduction

With the rapid economic developments in China in the past decades, the increased emissions of air pollutants from industries, power plants, vehicles, and fuel combustion in general have raised concerns about health and air quality over East Asia [1]. Two air pollutants of great importance in China are sulfur dioxide (SO2) and nitrogen dioxide (NO2) [2,3,4,5].
The source of SO2 is mainly from the combustion of coal and fuel by power plants and industries. Anthropogenic SO2 chiefly remains within the planetary boundary layer (PBL) and is highly related to public health. NO2 arises primarily from anthropogenic sources of NO, such as combustion of fuel by power plants, refineries, and motor vehicles. Furthermore, SO2 and NO2 can be oxidized in the atmosphere to form sulfate and nitrate, which contribute to fine particulate matter with aerodynamic diameter ≤2.5 micrometers (PM2.5). PM2.5 is associated with issues of public health, environmental acidification, and reduced visibility. Particulates can also have an impact on the weather or climate by directly scattering or absorbing insolation or by indirectly changing the reflectivity of cloud, cloud lifetime, and efficiency of precipitation [6,7]. Moreover, long-range transport of air pollution from China has been recognized to influence air quality in downwind regions, such as Taiwan [8,9], Korea [10], Japan [11], United States [12,13,14], and Canada [14,15]. In the presence of sunlight, NOx (NO + NO2) interacts with volatile organic compounds (VOCs) to generate ozone (O3), which is also a toxic air pollutant and greenhouse gas.
Ground-based measurements of these species tend to be limited to confined areas, such as cities. Satellite observations can cover an extensive region and have the advantage of monitoring temporal and spatial variations. The ozone monitoring instrument (OMI) aboard the Aura satellite provides levels of SO2 and NO2 with an extensive data record and higher spatial resolution as compared with other satellite instruments, such as global ozone monitoring experiment (GOME) and scanning imaging absorption spectrometer for atmospheric chartography (SCIAMACHY) [16]. OMI SO2 and NO2 data have been widely used to quantify emissions and evaluate regional trends of SO2 and NO2 [1,16,17,18,19,20,21]. Generally, the levels of SO2 in the United States and Europe have exhibited a continuously decreasing trend from 2005 to 2015 because of air quality regulations and economic recession [16]. The level of NO2 in the United States showed a downward trend from 2005 to 2009, while NO2 in Europe showed insignificant change from 2005 to 2015 [16,20,22]. However, the levels of SO2 and NO2 in China show several dramatic upward and downward trends owing to rapid economic development, technological changes, and environmental regulatory policy [16,21]. The enforcement of desulfurization produced a significant effect on the decrease of SO2 in 2008 [23], while the reduction of NO2 in China was one result of China’s 12th Five Year Plan (2011–2015) [24]. Moreover, the level of these species in the areas adjacent to China is potentially affected by long-range transport from China and, therefore, may also be sensitive to the economic and regulatory changes in China.
In addition to emission changes due to policy and economic development, meteorological factors play important roles in the formation of aerosol from precursor gaseous pollutants (SO2 and NO2) [7]. Several previous studies have been conducted to investigate the correlation between pollutant levels and meteorological conditions [25,26,27,28,29]. With higher temperature, relative humidity, and insolation, SO2 and NO2 can be transformed photochemically to sulfate and nitrate [25,26]. The correlations between meteorological factors and pollutants in the studies cited above were mostly derived from ground-level measurements. As noted above, satellite data can compensate for the limitations of ground-based measurements, especially in regions where in-situ measurements are not available. Moreover, the industrial structure, level of economic development, and environmental regulatory policies differ from region to region. To specifically explore the change of pollutant levels and correlations between pollutants and meteorological conditions in East Asia, we select the following six monitoring regions: North China Plain (NCP), Southeastern China (SC), Sichuan basin (SB), Taiwan Island (TW), Taiwan Strait (TWS), and South China Sea (SCS). Three of the most important industrial areas in China are located in Bohai Economic Rim, Yangtze River Delta, and Pearl River Delta. Bohai Economic Rim and Yangtze River Delta are in the North China Plain, while Pearl River Delta is in Southeastern China. Situated in Sichuan Basin, Chongqing is the most important inland industrial area in China and is mainly composed of heavy industry. As compared with industrial regions in China, the level of air pollution in Taiwan (Taiwan Island and Taiwan Strait) is less severe. The air pollution in Taiwan comes from both local emission sources and transport of pollutants from China [8,9]. The South China Sea is a relatively unimpacted area and can be considered a reference for evaluating the level of anthropogenic pollutants.
The objectives of this study include (1) evaluation of the spatiotemporal variation of SO2, NO2, and aerosol optical depth over East Asia; and (2) investigation of the correlation of these to meteorological conditions for each monitoring region over East Asia. Section 2 describes the data and methods used in this study. Analysis and results, including spatial and temporal evaluation of SO2, NO2, and aerosol optical path in China; the seasonal cycle of pollutants; and the impacts of meteorological conditions, are given in Section 3. Discussion and conclusions are given in Section 4.

2. Materials and Methods

2.1. Gaseous Pollutant Data

The gaseous pollutant data used in this study to examine the characteristics of air pollution over East Asia are from the ozone monitoring instrument (OMI). Launched in 2004, OMI is onboard National Aeronautics and Space Administration (NASA) Aura satellite and has a relatively high spatial resolution (13 km × 24 km) as compared with other satellite instruments for detecting trace gases. OMI derives the atmospheric composition of ozone (O3), sulfur dioxide (SO2), nitrogen dioxide (NO2), and other trace gases by measuring the backscattered sunlight from the earth in the range of ultraviolet and visible wavelengths. The objectives and detailed design of OMI have been previously reported [30].
We use the 0.25° level-3 (L3) daily OMI operational planetary boundary layer (PBL) SO2 product, which contains the vertical column density of SO2 in Dobson units (1DU = 2.69 ×10¹⁶ molecules cm−2). OMI PBL SO2 data are derived from the wavelengths in the range of 310.5 to 340 nm and are retrieved by the principal component analysis (PCA) algorithm [31]. To ensure the data quality, OMI PBL SO2 data exclude observations with (1) cloud radiance fraction > 0.2, (2) solar zenith angle > 70°; and (3) row anomaly [16,32]. Since SO2 from volcanic eruptions may contaminate the data, the threshold for filtering transient volcanic emission is defined when one grid point of SO2 data exceeds 10 DU over East Asia [16].
The 0.25° level-3 (L3) daily OMI operational tropospheric NO2 product is also used in this study, which is the column integral of NO2 between the earth’s surface and tropopause. The L3 OMI tropospheric NO2 data are retrieved from the wavelengths in the range from 405 to 465 nm with the NASA standard product algorithm [20] and Koninklijk Nederlands Meteorologisch Instituut (KNMI) Dutch-OMI-NO2 (DOMINO) algorithm [33]. The slant column density of NO2 is retrieved first and is converted to tropospheric vertical column density by applying vertical NO2 profile (shape profile) air mass factor interpolated from the look-up tables after subtracting the stratospheric contribution of NO2. OMI L3 tropospheric NO2 product further excludes the observations with cloud radiance fraction >0.3 and solar zenith angle >85° to ensure the data quality. The OMI L3 data of PBL SO2 and tropospheric NO2 are available in NASA GES DISC archive at http://disc.sci.gsfc.nasa.gov/Aura/data-holdings/OMI.

2.2. Aerosol Data

As a component of the earth observing system (EOS), the moderate-resolution imaging spectroradiometer (MODIS) aboard the NASA Terra and Aqua satellites provides level-2 aerosol products [34]. Because the local equator-crossing time of Aqua is close to that of Aura, we apply the aerosol optical depth (AOD) data from MODIS Aqua. Then, we further derive the level-3 0.25° daily AOD data from level-2 10 km AOD swath data with the quality flag of at least 2 (2: good; 3: very good) to ensure the data quality and match to gaseous pollutant data.
Previous studies have pointed out that aerosol optical depth observed by satellite is closely correlated to the concentration of aerosol in the atmosphere [35,36]. It is reported that the seasonal cycle observed by MODIS is consistent with ground-based observation, including micro-pulse lidar and the aerosol robotic network (AERONET) [35]. Therefore, AOD data may be deemed suitable as an evaluation tool to examine the spatiotemporal variation of aerosol over East Asia and can be used to cross-compare with measured gaseous pollutants. The uncertainty of the MODIS AOD is ± 0.03 ± 0.05 × AOD over the ocean and ± 0.05 ± 0.15 × AOD over the land [37].

2.3. Meteorological Data

The correlation between airborne species and meteorological conditions is also investigated. The 0.25° daily precipitation data from Tropical Rainfall Measuring Mission (TRMM 3B42 v7) [38,39] and 0.25° daily meteorological data from European Centre for Medium-Range Weather Forecasts (ECMWF) ERA-Interim reanalysis are used [40]. The meteorological variables include 850 hPa temperature, 850 hPa relative humidity, 850 hPa wind field, and the derived lower tropospheric stability (LTS) from 1 January 2005 to 31 December 2015. The definition of LTS is LTS = θ700 − θsurface, where θ700 and θsurface are potential temperature at 700 hPa and at the surface, respectively.

2.4. Region of Study

This study investigates the spatiotemporal variation of air pollutants over East Asia (95°E–150°E, –10°S–45°N) with a focus on both highly polluted regions (North China Plain (NCP), 110°E–120°E, 30°N–40°N; Sichuan Basin (SB), 102°E–110°E, 25°N–33°N; Southeastern China (SC; land only), 110°E–120°E, 20°N–30°N), downstream regions (Taiwan Island (TW; land only), 118°E–122°E, 22°N–27°N; Taiwan Strait (TWS; ocean only), 118°E–122°E, 22°N–27°N), and a clean region (South China Sea (SCS), 110°E–120°E, 12°N–18°N), as shown in Figure 1. Note that for Taiwan Island (TW) and Taiwan Strait (TWS), the data are selected only over land and ocean, respectively. The duration studied is from 1 January 2005 to 31 December 2015.

3. Results

3.1. Spatial Distribution of Airborne Species over East Asia

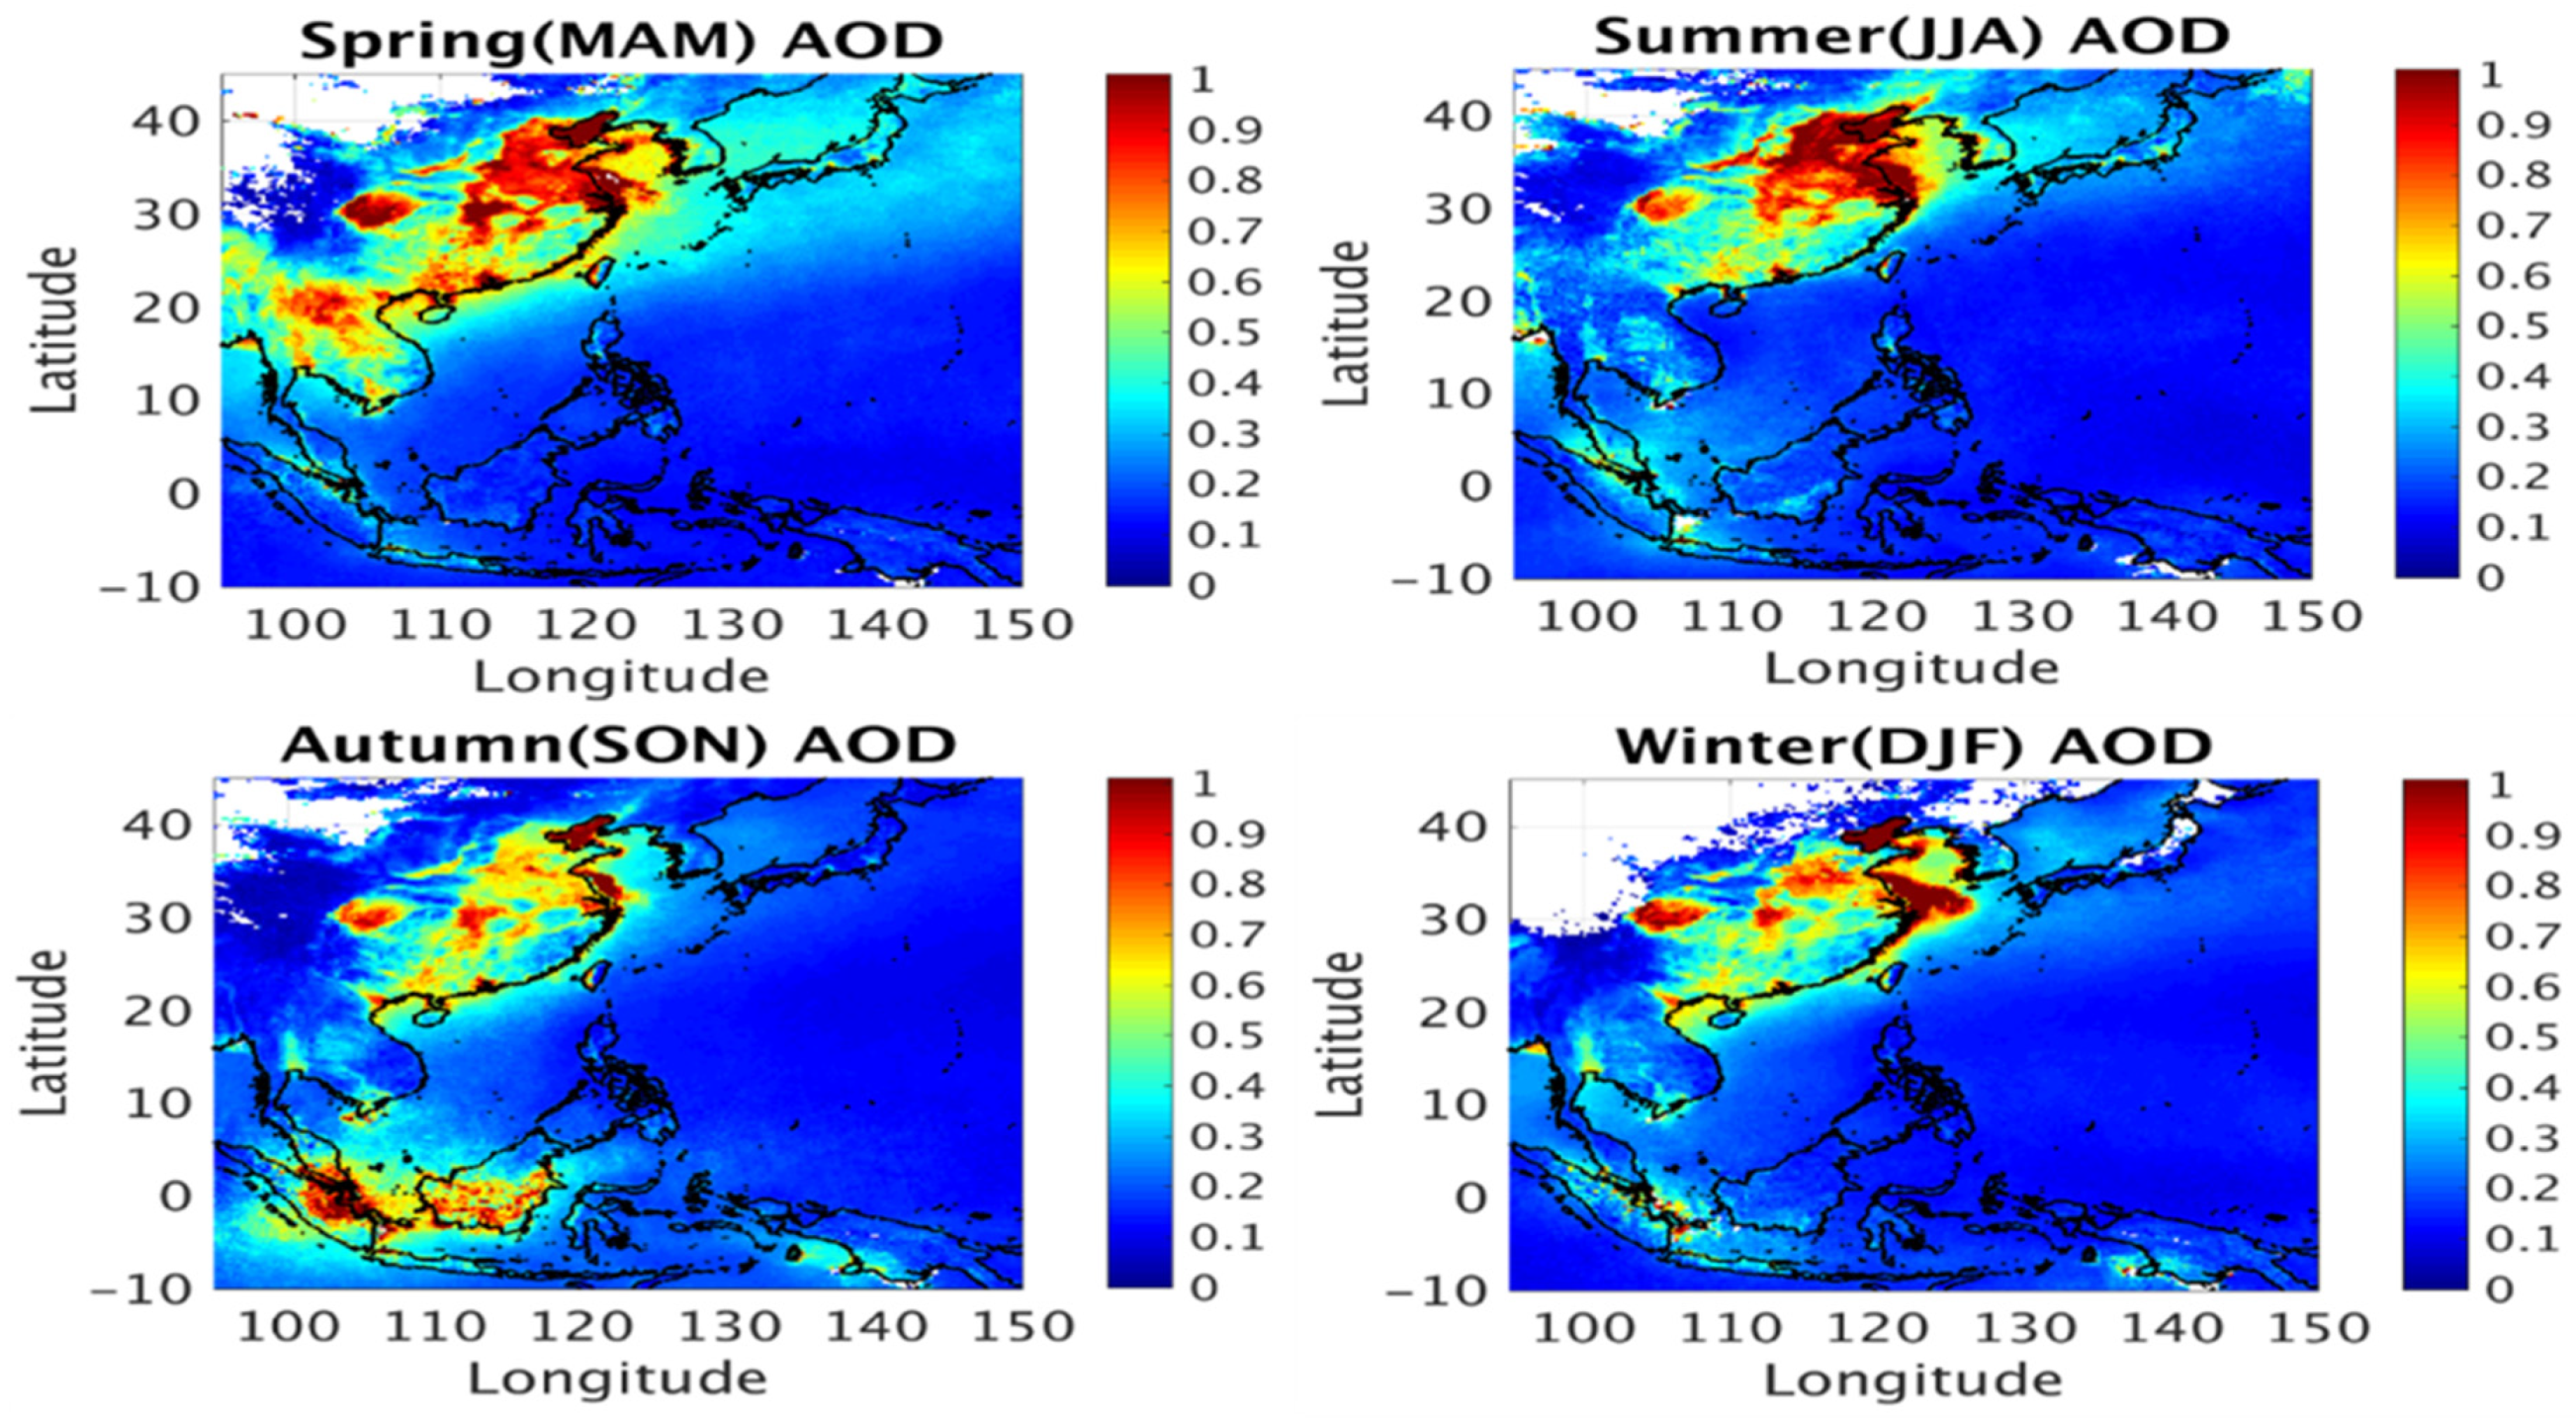
Figure 2 shows the 2005–2015 averaged spatial distribution of AOD from Aqua MODIS for each season. The source of aerosol is most likely attributed to the combustion of fossil fuel from power plants and industry, biomass burning, and long-range transport of dust. High values of AOD occur over the North China Plain, Sichuan basin, and Southeastern China from factories and power plants. In addition, the high signal of AOD over the Bohai Sea and the Yellow Sea may be a result of heavy ship emissions, long-range transport of aerosols from the NCP, and strong hygroscopic growth of fine mode aerosols over the humid environment [41,42,43]. The AOD over China is much higher than that of other countries in East Asia and exhibits the highest level in spring and summer. Meanwhile, hotspots of AOD are also observed in Southeast Asia in spring and in Equatorial Asia in autumn owing to biomass burning [44].
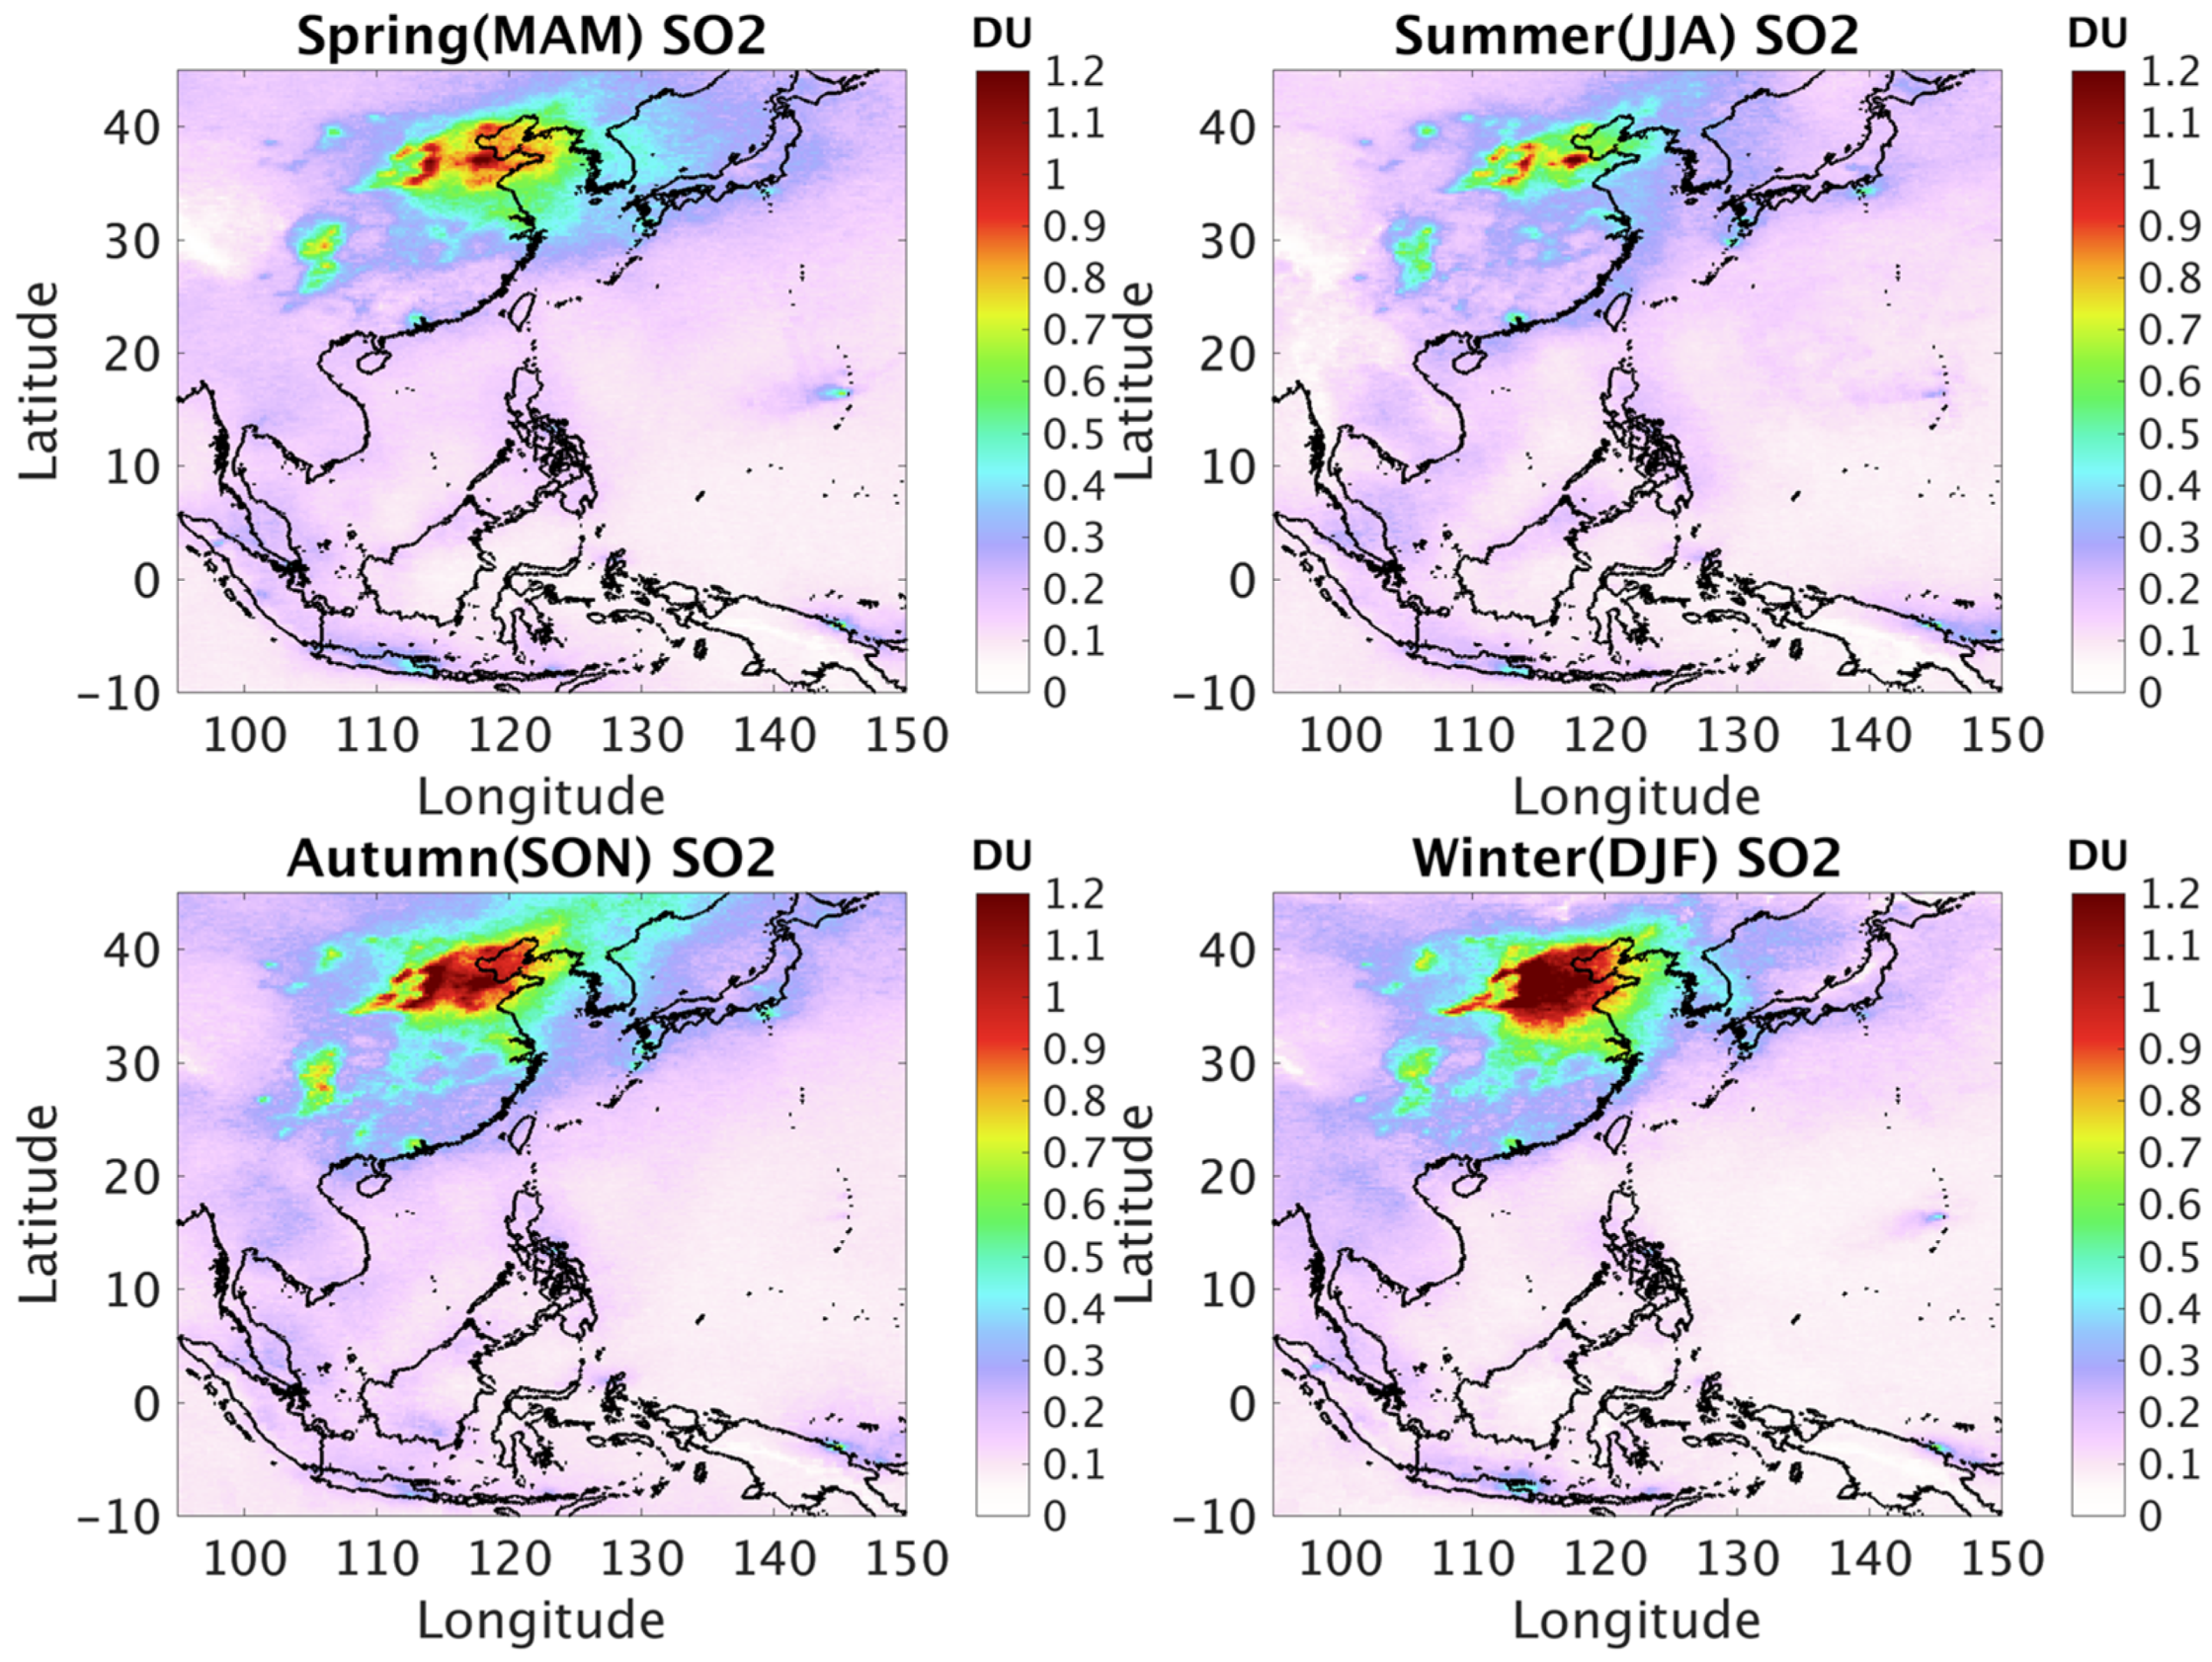
The spatially averaged SO2 from 2005–2015 over East Asia for each season is illustrated in Figure 3. Anthropogenic SO2 is mainly the result of the combustion of fossil fuel and coal by power plants, factories, and refineries [45]. Therefore, hotspots of SO2 occur over highly industrial regions, such as the North China Plain, Sichuan Basin, coastal industrial areas in Southeastern China, and Tokyo. In contrast to the seasonal cycle of AOD in China, SO2 exhibits the highest level in winter and the lowest level in summer. The level of SO2 in winter might be related to the added emissions from house heating and/or stronger stability, while the lower SO2 level in summer could be due to less emissions, as well as more efficient precipitation, and/or more efficient photochemical conversion of SO2 to sulfate.
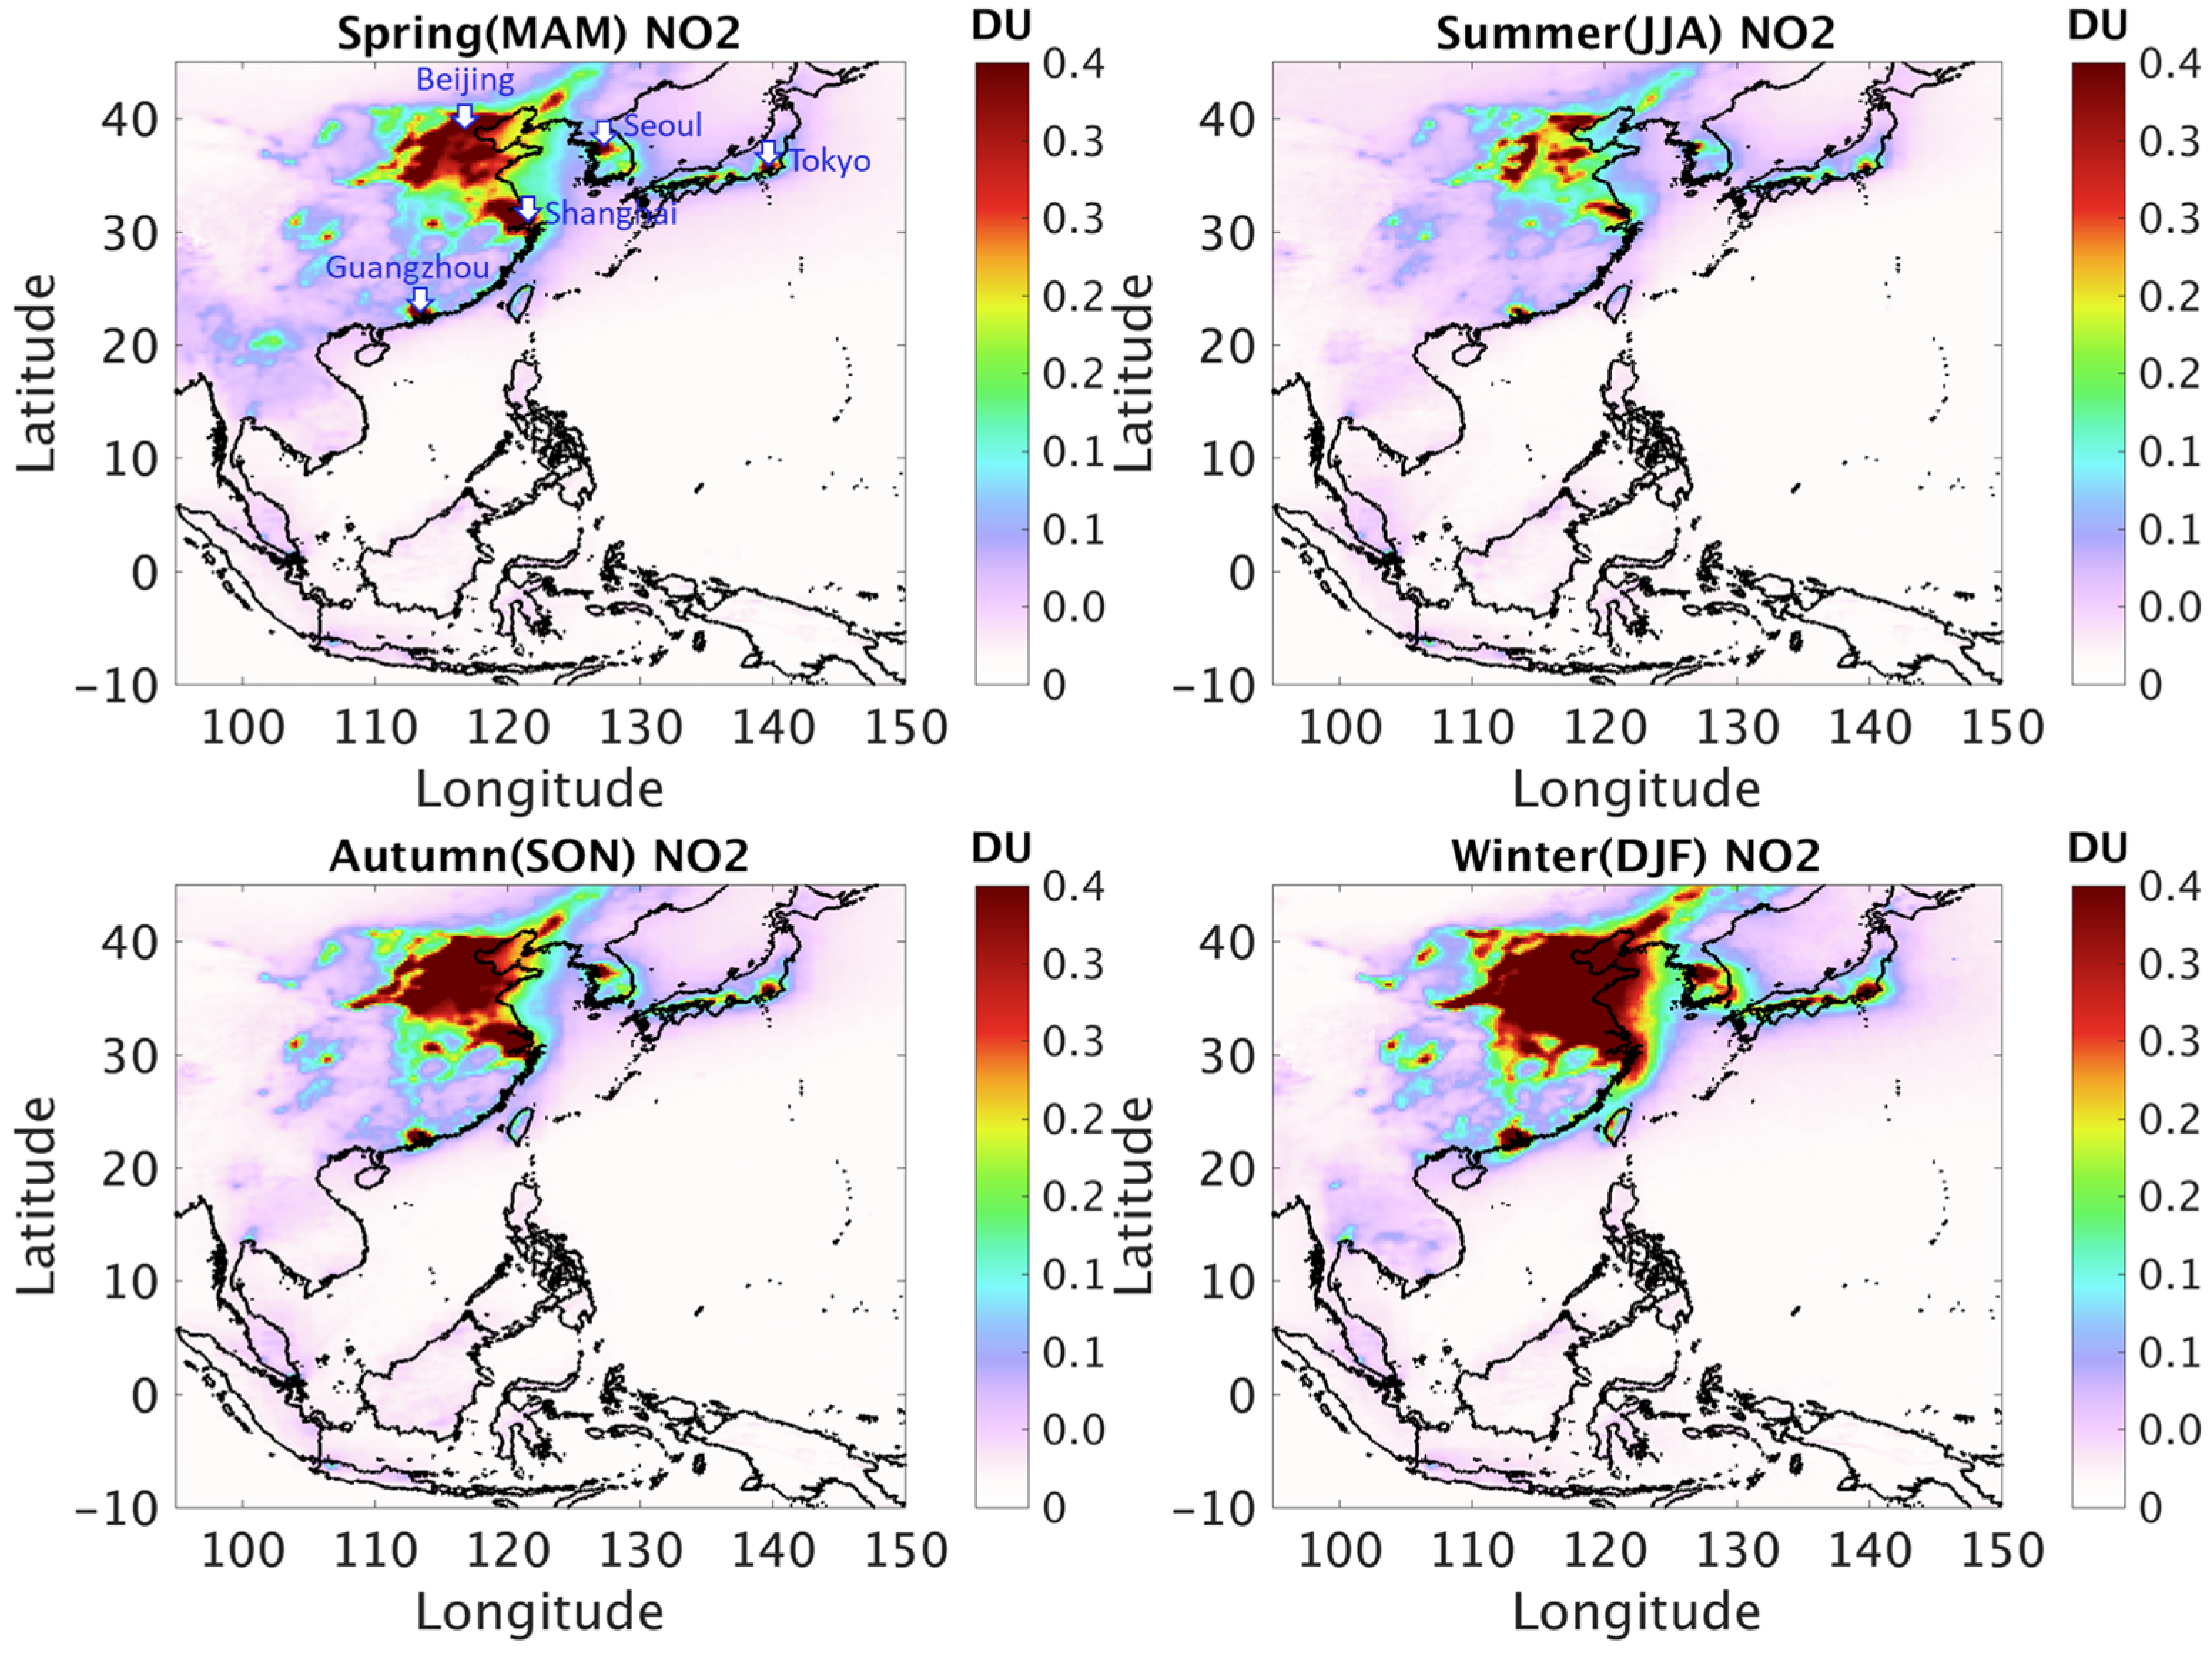
Because NO2 is mostly a result of vehicle emissions [7], hotspots of NO2 lie in highly urbanized areas such as Beijing, Shanghai, Guangzhou, Seoul, and Tokyo, as shown in Figure 4. NO2 is mainly anthropogenic in origin and NO2 levels over the ocean are low. The seasonal cycle of NO2 in China is the same as that of SO2, with the highest level in winter and the lowest level in summer, which is the result of the combination of emission source and the impact of meteorological fields.

3.2. Temporal Evolution of Pollutants

3.2.1. Method of Seasonal Adjustment

Typically, time series data can be decomposed into three components: a secular trend component (T(t)), a seasonal component (S(t)), and an irregular component (I(t)). Therefore, the time series of the monthly-averaged value of SO2, NO2, and AOD (Y(t)) in this study can be assumed as follows:
Y(t) = T(t) × S(t) × I(t).
It should be noted that we derived the monthly-mean SO2, NO2, and AOD data from daily data to analyze the temporal variation; therefore, t indicates time (month) here. Typically, the seasonal component can be represented by sine and cosine harmonic series [20]. However, with the considerable changes in inter-annual concentration of pollutants over East Asia, the amplitude of the seasonal component could also change dramatically. To account for the varying seasonal component, one can apply a locally-weighted smoothing technique [46] or a locally-weighted seasonal filter [47]. In this study, the locally-weighted seasonal filter is applied to derive the seasonally adjusted component (SA(t)), which is used to substitute for the seasonal component (S(t)) in Equation (1). We adopted the locally-weighted seasonal filter by considering an additional four monthly-averaged data from years adjacent to the target year to derive the seasonally adjusted component as shown below:
S A ( t ) = 1 9   S ( t 24 ) + 2 9   S ( t 12 ) + 3 9   S ( t ) + 2 9   S ( t + 12 ) + 1 9   S ( t + 24 ) .
As mentioned above, S(t) and t indicate seasonal component and calendar month, respectively. SA(t) in Equation (2) is referred to as locally-weighted seasonally adjusted component.
Then, by dividing the original time series by the locally-weighted seasonal component, the seasonally adjusted time series can be used to evaluate the temporal variation of species. The seasonally adjusted time series ( Y ( t ) ) can be represented as follows:
Y ( t )   =   Y ( t ) SA ( t )   =   T ( t ) × I ( t ) .
Moreover, the method of moving average is beneficial for evaluating the transition points caused by economic development and environmental policy. Therefore, we further calculate the five-month moving average data from the seasonally adjusted time series to assess the transition point and divide the trend into upward and downward patterns.

3.2.2. Temporal Evaluation of Pollutants for Each Monitoring Region

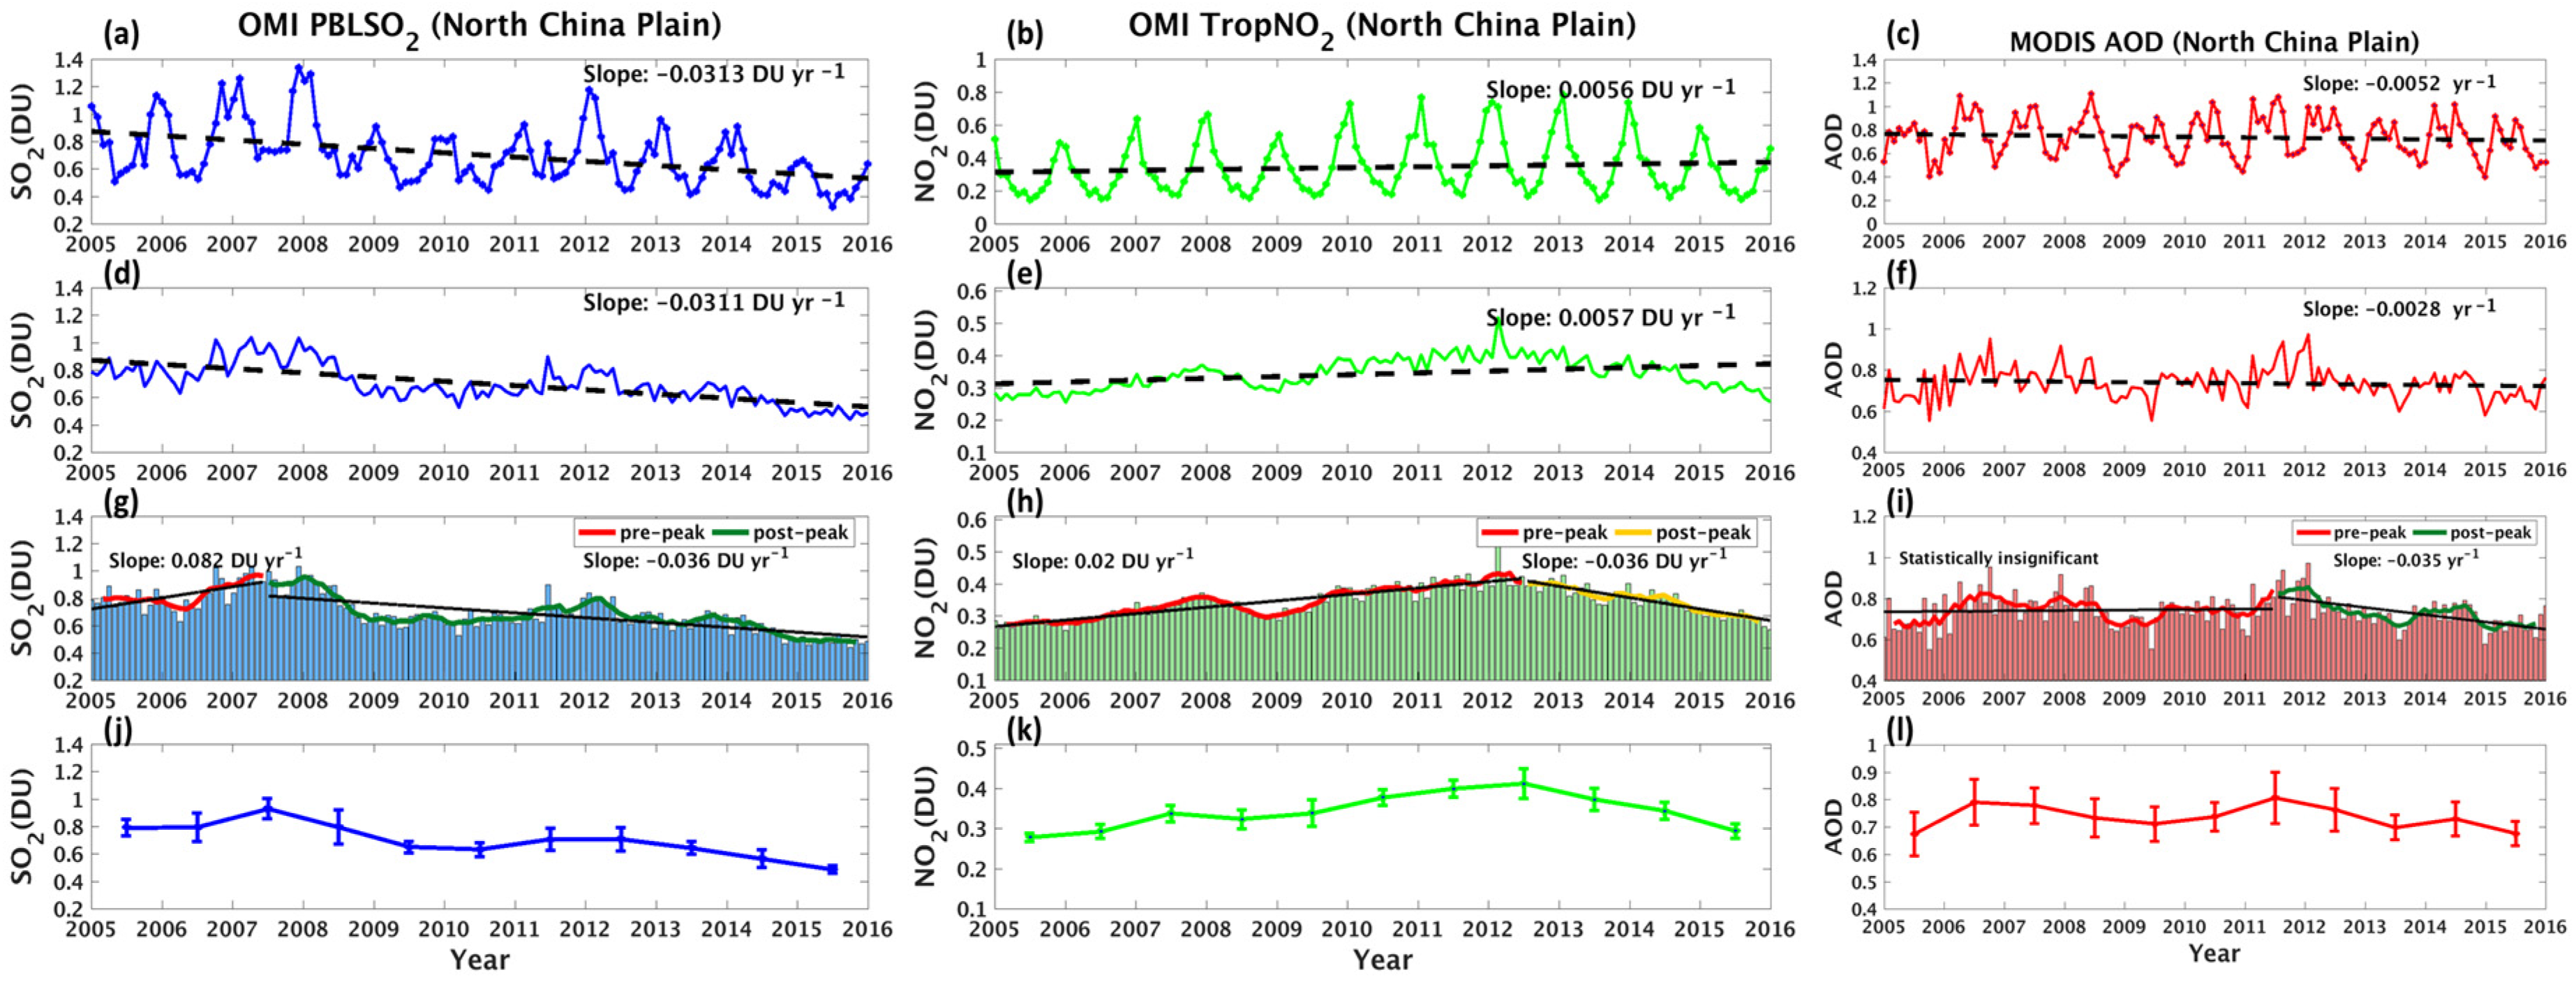
Figure 5a–c show the overall original time series of monthly-averaged SO2, NO2, and AOD in the North China Plain (NCP) from 2005 to 2015, respectively. The noticeable seasonal cycles of SO2 and NO2 show highest levels in winter and lowest levels in summer, especially for NO2, which is consistent with the results reported in the works of [21,22]. As shown in Figure 5d–f, with the seasonal filter, the seasonally adjusted data are more compatible with the regression line than the original data. The overall trends of SO2 and AOD show continuous decreasing trends, while that of NO2 shows an increasing trend. However, irregular upward and downward variations still exist, particularly for SO2 and AOD. To better understand the temporal variation of species as a result of energy and environmental policies, we divided the seasonally adjusted data into pre-peak and post-peak trends according to the peak of yearly-mean data (Figure 5g–i).
As illustrated in Figure 5g–i, the thick solid line indicates the five-month running mean of SO2, NO2, and AOD with pre-peak and post-peak trend lines, respectively. The seasonally adjusted data are illustrated by the histogram. SO2 in the NCP increases from 2005 to 2007, at the rate of 0.082 DU per year due to industrial development. Then, in 2007, the Chinese government introduced a new Five-Year Plan (FYP) to promote the installation of desulfurization devices on power plants and restrict emissions of SO2 [48]. Furthermore, the emissions of SO2 were further stringently controlled for the Beijing 2008 Olympic Games [48]. As a result, the level of SO2 starts to decrease after mid-2007 and decreases even more strongly in 2008. Although, there is a temporary rebound of SO2 in 2011 due to the economic recovery [21] or the end to the emission controls. The post-peak trend of SO2 approximately exhibits a decreasing pattern (−0.036 DU per year) from 2007 to 2015, which is in agreement with the decreasing rate of SO2 reported elsewhere [16,21]. SO2 in NCP decreased by about 70% from 2007 to 2015 [16], and SO2 in the Henan Province, located in the North China Plain, declined with the rate of 0.043 DU per year from 2007 to 2014 [21].
For NO2 over the NCP, there is an increasing trend of NO2 from 2005 to 2012 (0.02 DU per year) attributable to the rapid growth of population, and significant increase of motor vehicles, and economic recovery [21]. Because of the stricter emission control policy for the Beijing Olympic Games and the economic recession in 2008, there was also a temporary drop of NO2 as observed for SO2. After 2012, a new environmental policy of China 12th FYP (2011–2015) was established to further restrict emissions of NO and to reduce NO2 by 12% in 2015 from the 2010 level [24]. Consequently, the level of NO2 continuously declined from 2012 to 2015 at the rate of –0.036 DU per year (Figure 5h).
The overall trend of AOD shows a decreasing pattern with the rate of −0.0028 per year (Figure 5f). However, with several upward and downward variations in the span between 2005 and 2011, the overall trend line is statistically insignificant. The AOD in the NCP starts to decline by −0.035 per year only when both SO2 and NO2 show decreasing trends after 2012 (Figure 5g–i).
The patterns of change of SO2 and NO2 in the NCP and Southeastern China (SC) are very similar (Figure 5g−h and Figure 6a−b). The SO2 level in SC also increased from 2005 to 2007 (0.038 DU per year) and declined afterward (−0.008 DU per year) as a result of the implementation of flue gas desulfurization (FGD) measures. Besides, the NO2 level in SC increased slightly from 2005 to 2011 (0.005 DU per year) and then showed a decreasing trend (−0.009 DU per year) due to stricter emission controls after 2011.
As illustrated in Figure 6b, the magnitude of the increasing rate of NO2 is smaller than that of the decreasing rate of SO2 in the span between 2007 and 2011 in SC. Therefore, the temporal variation of AOD in SC is mainly controlled by SO2 and exhibits a similar pattern as the SO2 in SC, albeit with more noticeable inter-annual variations. Additionally, the drastic drop of AOD in SC in 2008 and 2013 is a result of the economic recession and stringent emission controls for the Beijing Olympic Games and 12-th FYP, respectively.
As shown in Figure 3 and Figure 4, a high SO2 level exists in the Sichuan Basin (SB), while the NO2 level in SB is lower. Unlike the pattern of SO2 in the NCP and SC, SO2 in SB shows a decreasing trend from 2006 to 2015, with a rate of −0.015 DU per year (Figure 6d). On the other hand, the temporal variation of NO2 level in SB is similar to that in the NCP and SC, albeit with a lower level of NO2. NO2 in SB shows an increasing trend from 2005 to 2013 (+0.004 DU per year) and a decreasing trend (−0.01DU per year) afterward. The AOD in SB exhibits an upward trend with an increasing rate of 0.047 per year from 2005 to 2007 and a downward trend with decreasing rate of −0.016 per year after 2007. The pattern of AOD in SB is similar to that of SO2, indicating that the AOD in SB is also mainly controlled by sulfate as that in SC.
As for Taiwan Island (TW; Figure 6g), the SO2 level remains nearly constant. The NO2 level in TW (Figure 6h) shows an upward trend (+0.002 DU per year) from 2005 to 2011 and a downward trend (−0.003 DU per year) after 2011 due to the slowdown of economic development. However, the trend of AOD in TW does not follow that of SO2 or NO2, which is possibly the result of other significant sources of aerosol (e.g., organic aerosols) or the influence of transport of aerosol from China. Aerosol in the NCP and SC is potentially brought to Taiwan Island by the northeasterly wind in winter and southwestern wind in summer, respectively. Therefore, the temporal variation of aerosol in China, especially Southeastern China, could influence the trend of AOD in TW to a certain extent. In Figure 6i, the pattern of AOD in TW is very similar to that in SC and also with the dramatic drop of AOD in 2008 and 2013, just as the pattern of AOD in SC.
Adjacent to Taiwan Island and Southeastern China, the SO2 level in Taiwan Strait remained nearly steady (Figure 6j). Most of the NO2 in TWS (Figure 6k) is transported from TW and SC, therefore, the pattern of NO2 in TWS is the same as that in TW and SC. The AOD in TWS exhibits a continuously decreasing trend with the rate of –0.002 DU per year from 2005 to 2015 (Figure 6l).
As the background reference, the levels of SO2 and NO2 over the South China Sea (SCS) are much lower than those in other regions. As illustrated in Figure 6m–o, the trend lines of SO2 and NO2 remain almost constant, indicating no considerable change of sources of SO2 and NO2. However, the AOD in SCS shows a slightly decreasing trend (−0.002 per year).
It should be noted that in each monitored region, a certain fraction of the measured AOD is probably from the organic component of aerosols (see Figure S1 in Supplementary Materials). Thus, the trends in AOD cannot be attributed entirely to sulfate and nitrate aerosols.

3.3. Impact of Meteorological Conditions on Pollutants

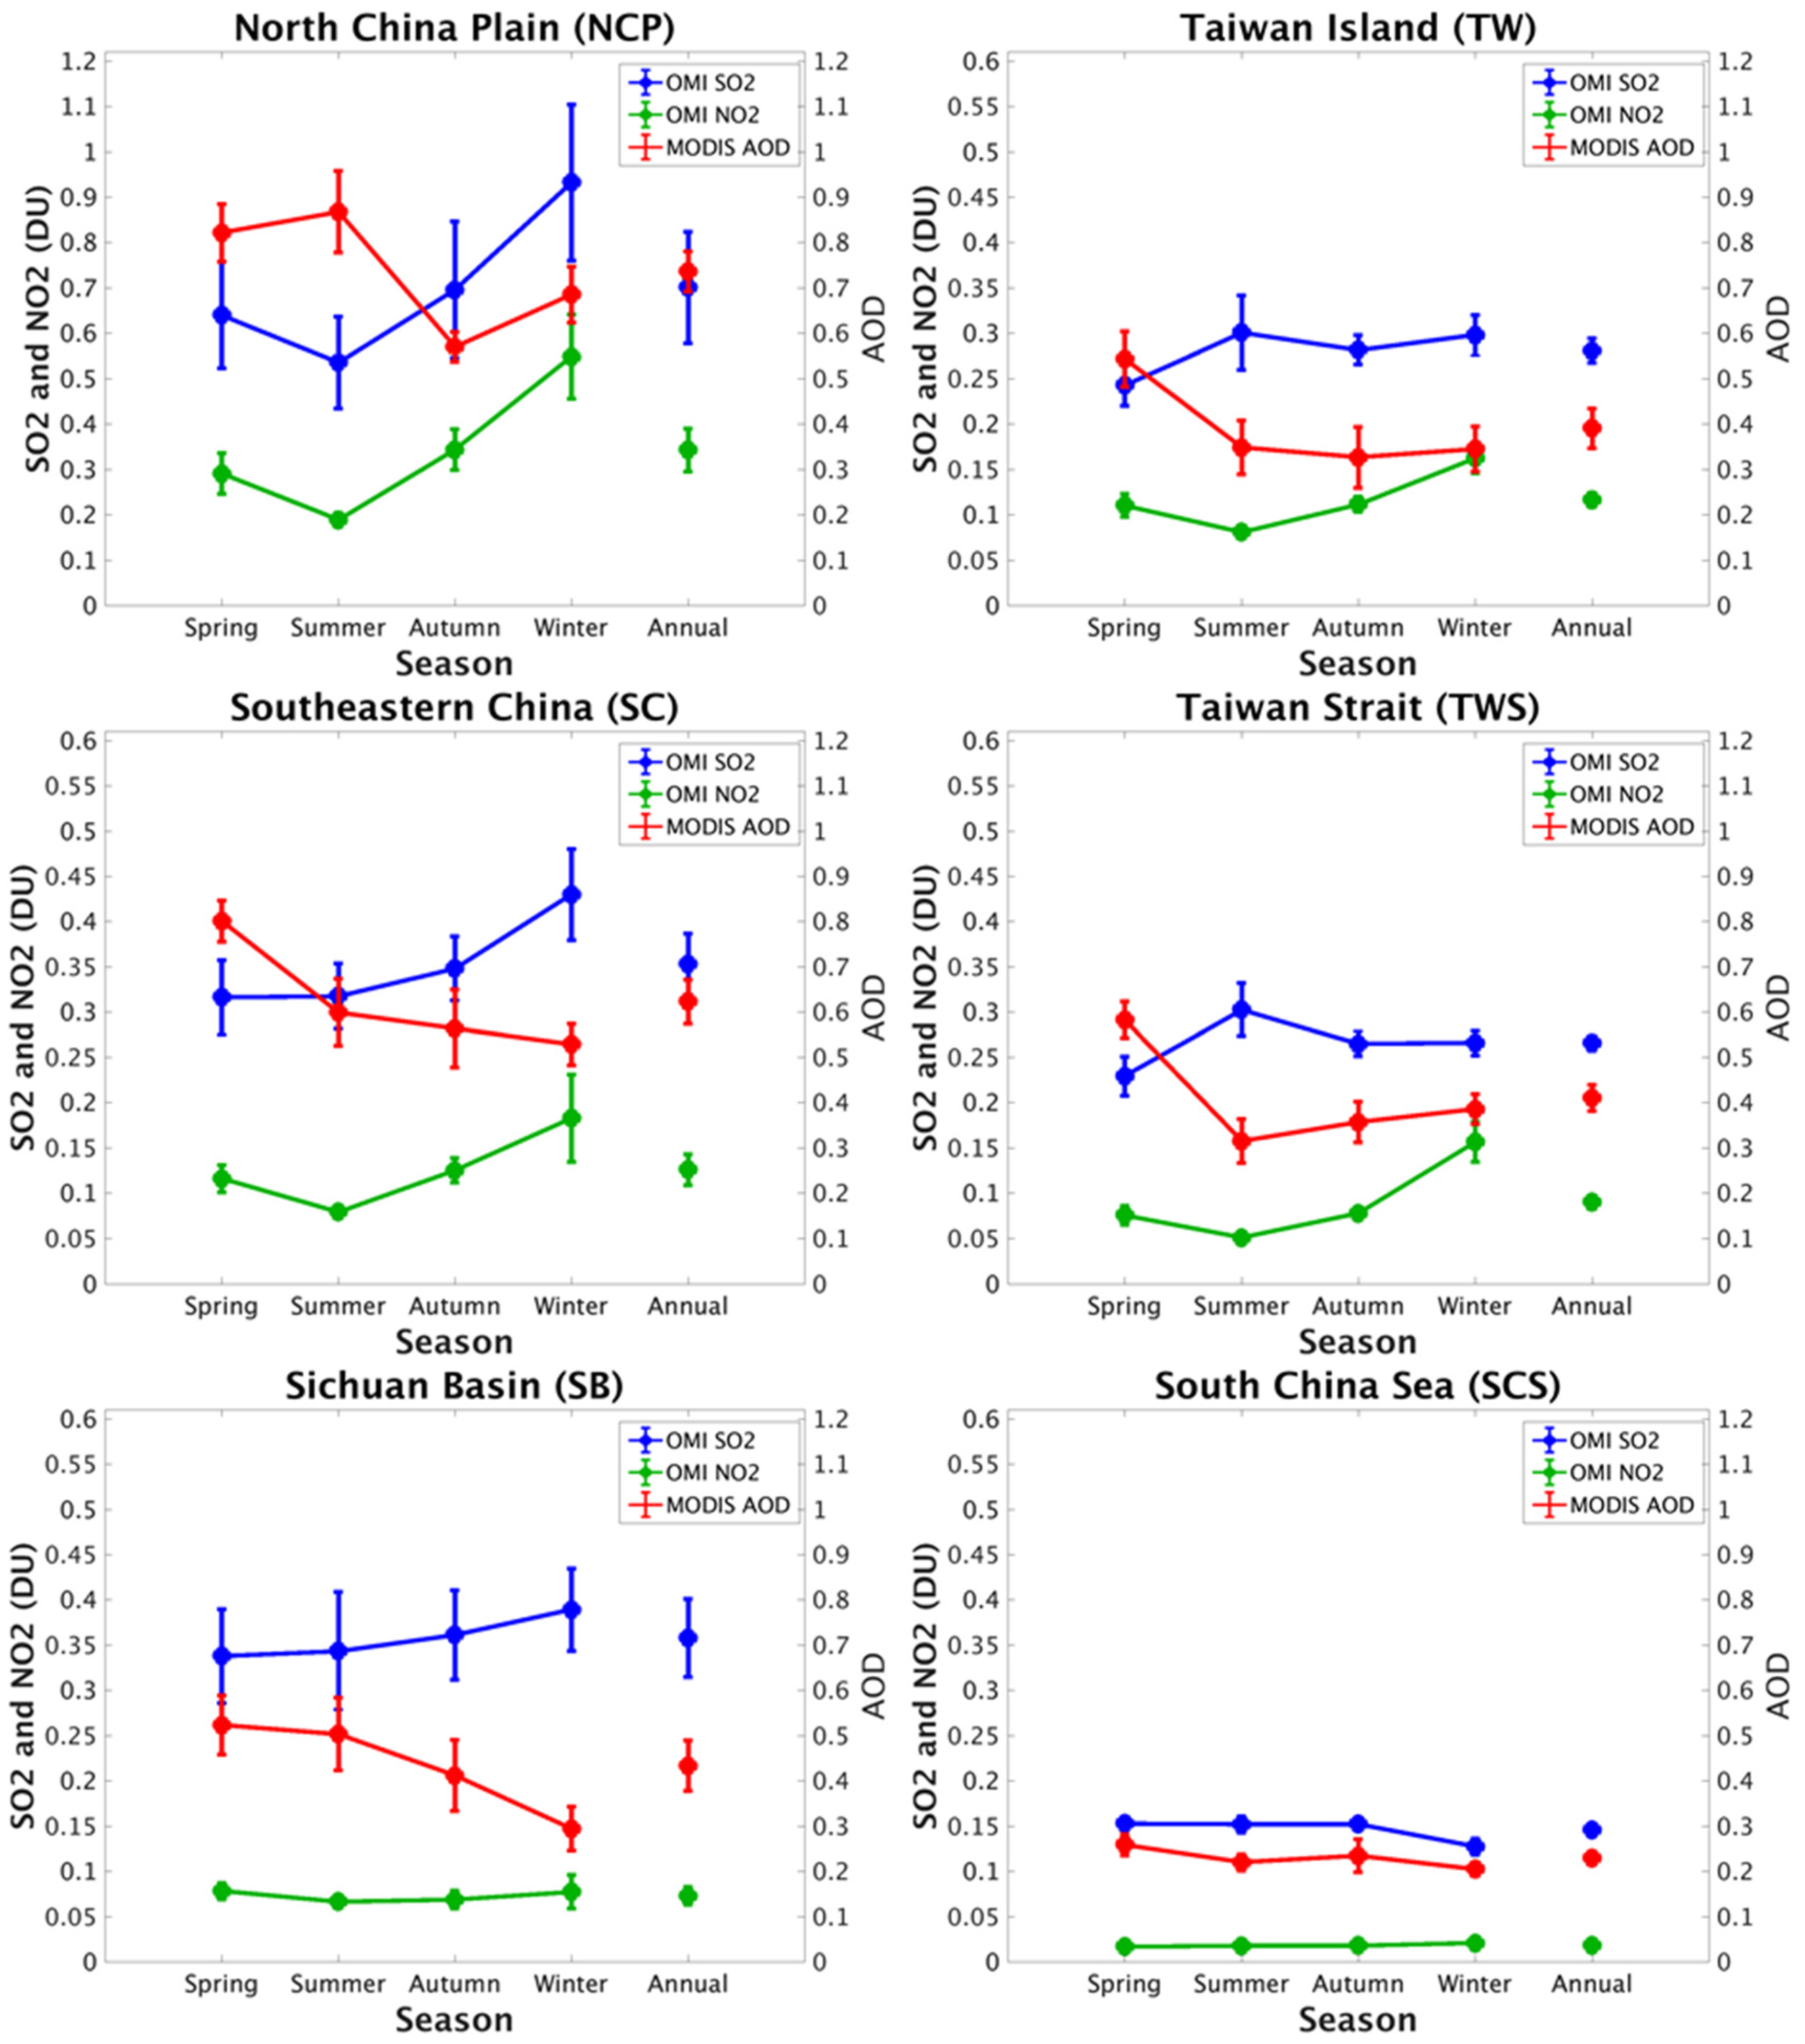
Figure 7 shows the summary of seasonal cycles of SO2, NO2, and AOD for monitoring regions. The level and the variation of SO2 is very dissimilar among the monitoring regions, whereas the NO2 seasonal cycle is quite consistent among all regions with the highest and lowest levels of NO2 occurring in winter and summer, respectively. On the other hand, the AOD in the NCP shows the highest level in summer, while AOD in all the other regions exhibits the highest level in spring. Other than emission sources, the meteorological condition play key factors in determining the seasonal cycle of pollutants and is discussed in the following.

3.3.1. Correlation Coefficient between Meteorological Factors and Pollutants

In this section, we calculate the correlation coefficients between pollutant levels (SO2, NO2, and AOD) and meteorological conditions from the regionally-averaged monthly-mean pollutant data and meteorological data. To explicitly investigate the impact of meteorological factors on each of pollutants (SO2, NO2, and AOD), the meteorological data are further screened by SO2, NO2, and AOD, respectively. The summary of the correlation coefficients is shown in Table 1.
First, we investigate the correlation between pollutant levels and 850 hPa temperature. The correlations between SO2 and temperature are statistically significant among the NCP, SC, and SB, with negative correlation coefficients (Table 1). This indicates that a higher temperature promotes the photochemical reaction of SO2 to sulfate. However, the correlation coefficients in TWS and SCS are statistically positive, which is possibly the result of the impact of transportation of SO2 or natural sources of SO2 over the sea, such as dimethyl sulfide from phytoplankton. The correlation coefficients between NO2 and temperature are negative and statistically significant among all monitored regions, indicating that higher temperature promotes the transformation of NO2 into nitrate, and/or more efficient decomposition of NO2 into NO. As a result of photochemical reactions, aerosol (sulfate and nitrate) is generated from SO2 and NO2 and will consequently lead to the decrease of SO2 and NO2 and increase of AOD. Nonetheless, only the correlations between AOD and temperature in the NCP and SB are statistically significant and positive. This is possible because the impact of transport of aerosol or other significant sources of aerosol, such as organics, may be more influential than the effect of photochemical reactions in other regions.
Both higher temperature and higher humidity are beneficial to the conversion process from SO2 and NO2 to sulfate and nitrate, respectively [25,26]. Therefore, the relationship between SO2 and relative humidity (RH) is expected to be similar to that between SO2 and temperature. As a result, the correlation coefficients between SO2 and RH are all negative and statistically significant in the NCP and SC, as they are between SO2 and temperature (Table 1). Furthermore, the correlation of NO2 to relative humidity is also similar to that of NO2 to temperature among all monitored regions, except SCS. This is perhaps because the RHs in the SCS are relatively high and invariable, and the seasonal variation of RH in the SCS is different from that in other regions. However, the magnitude of the correlation coefficient between NO2 and RH is smaller than that between NO2 and temperature, inferring that the effect of temperature may be more important than the effect of RH in the conversion process. With respect to the correlation of AOD to RH, the effect of RH on AOD is ambiguous and AOD does not clearly increase with increasing RH or decreasing RH. That is, under the condition of higher RH, there may be more clouds or higher probability of precipitation to wash out the suspended aerosol. The influence from the hygroscopic growth and the wet scavenging of aerosol needs to be considered more carefully under different conditions and with specific precipitation amount.
As to the effect of lower tropospheric stability (LTS), the correlations of SO2 and NO2 to LTS are statistically significant and positive in the NCP, SC, and TW. More SO2 and NO2 accumulate when the atmosphere is more stable [28]. However, the correlations of SO2 and NO2 to LTS are negative in TWS and SCS, where most SO2 and NO2 are transported from the adjacent megacities or industrial regions over land. Therefore, under the condition of strong stability, the wind speed could be weak and the pollutants are not transported effectively into TWS or SCS. Additionally, the correlation of AOD to LTS is negative in the NCP, SC, and TW. The higher LTS and more stable atmosphere may be associated with limited aerosol and particulate material mixing up to a high PBL, resulting in lower AOD.
The long-term trends of these meteorological fields (850 hPa temperature, 850 hPa RH, and lower LTS) for each monitored region are also investigated (see Figures S2–S7). The seasonal cycle of 2005–2015 mean SO2, NO2, AOD, and meteorological fields in each monitored region are displayed in Figures S8–S13 for the reader’s reference.

3.3.2. Transport of Pollutants

In this section, we further explore the effect of transport of aerosol from one region to another region. Here, we categorize the daily regionally-averaged SO2, NO2, and AOD data according to the daily regionally-averaged wind speed and wind direction from ECMWF, and then derive the figure of dependency of each pollutant on the wind to analyze the impact of transport of aerosols.
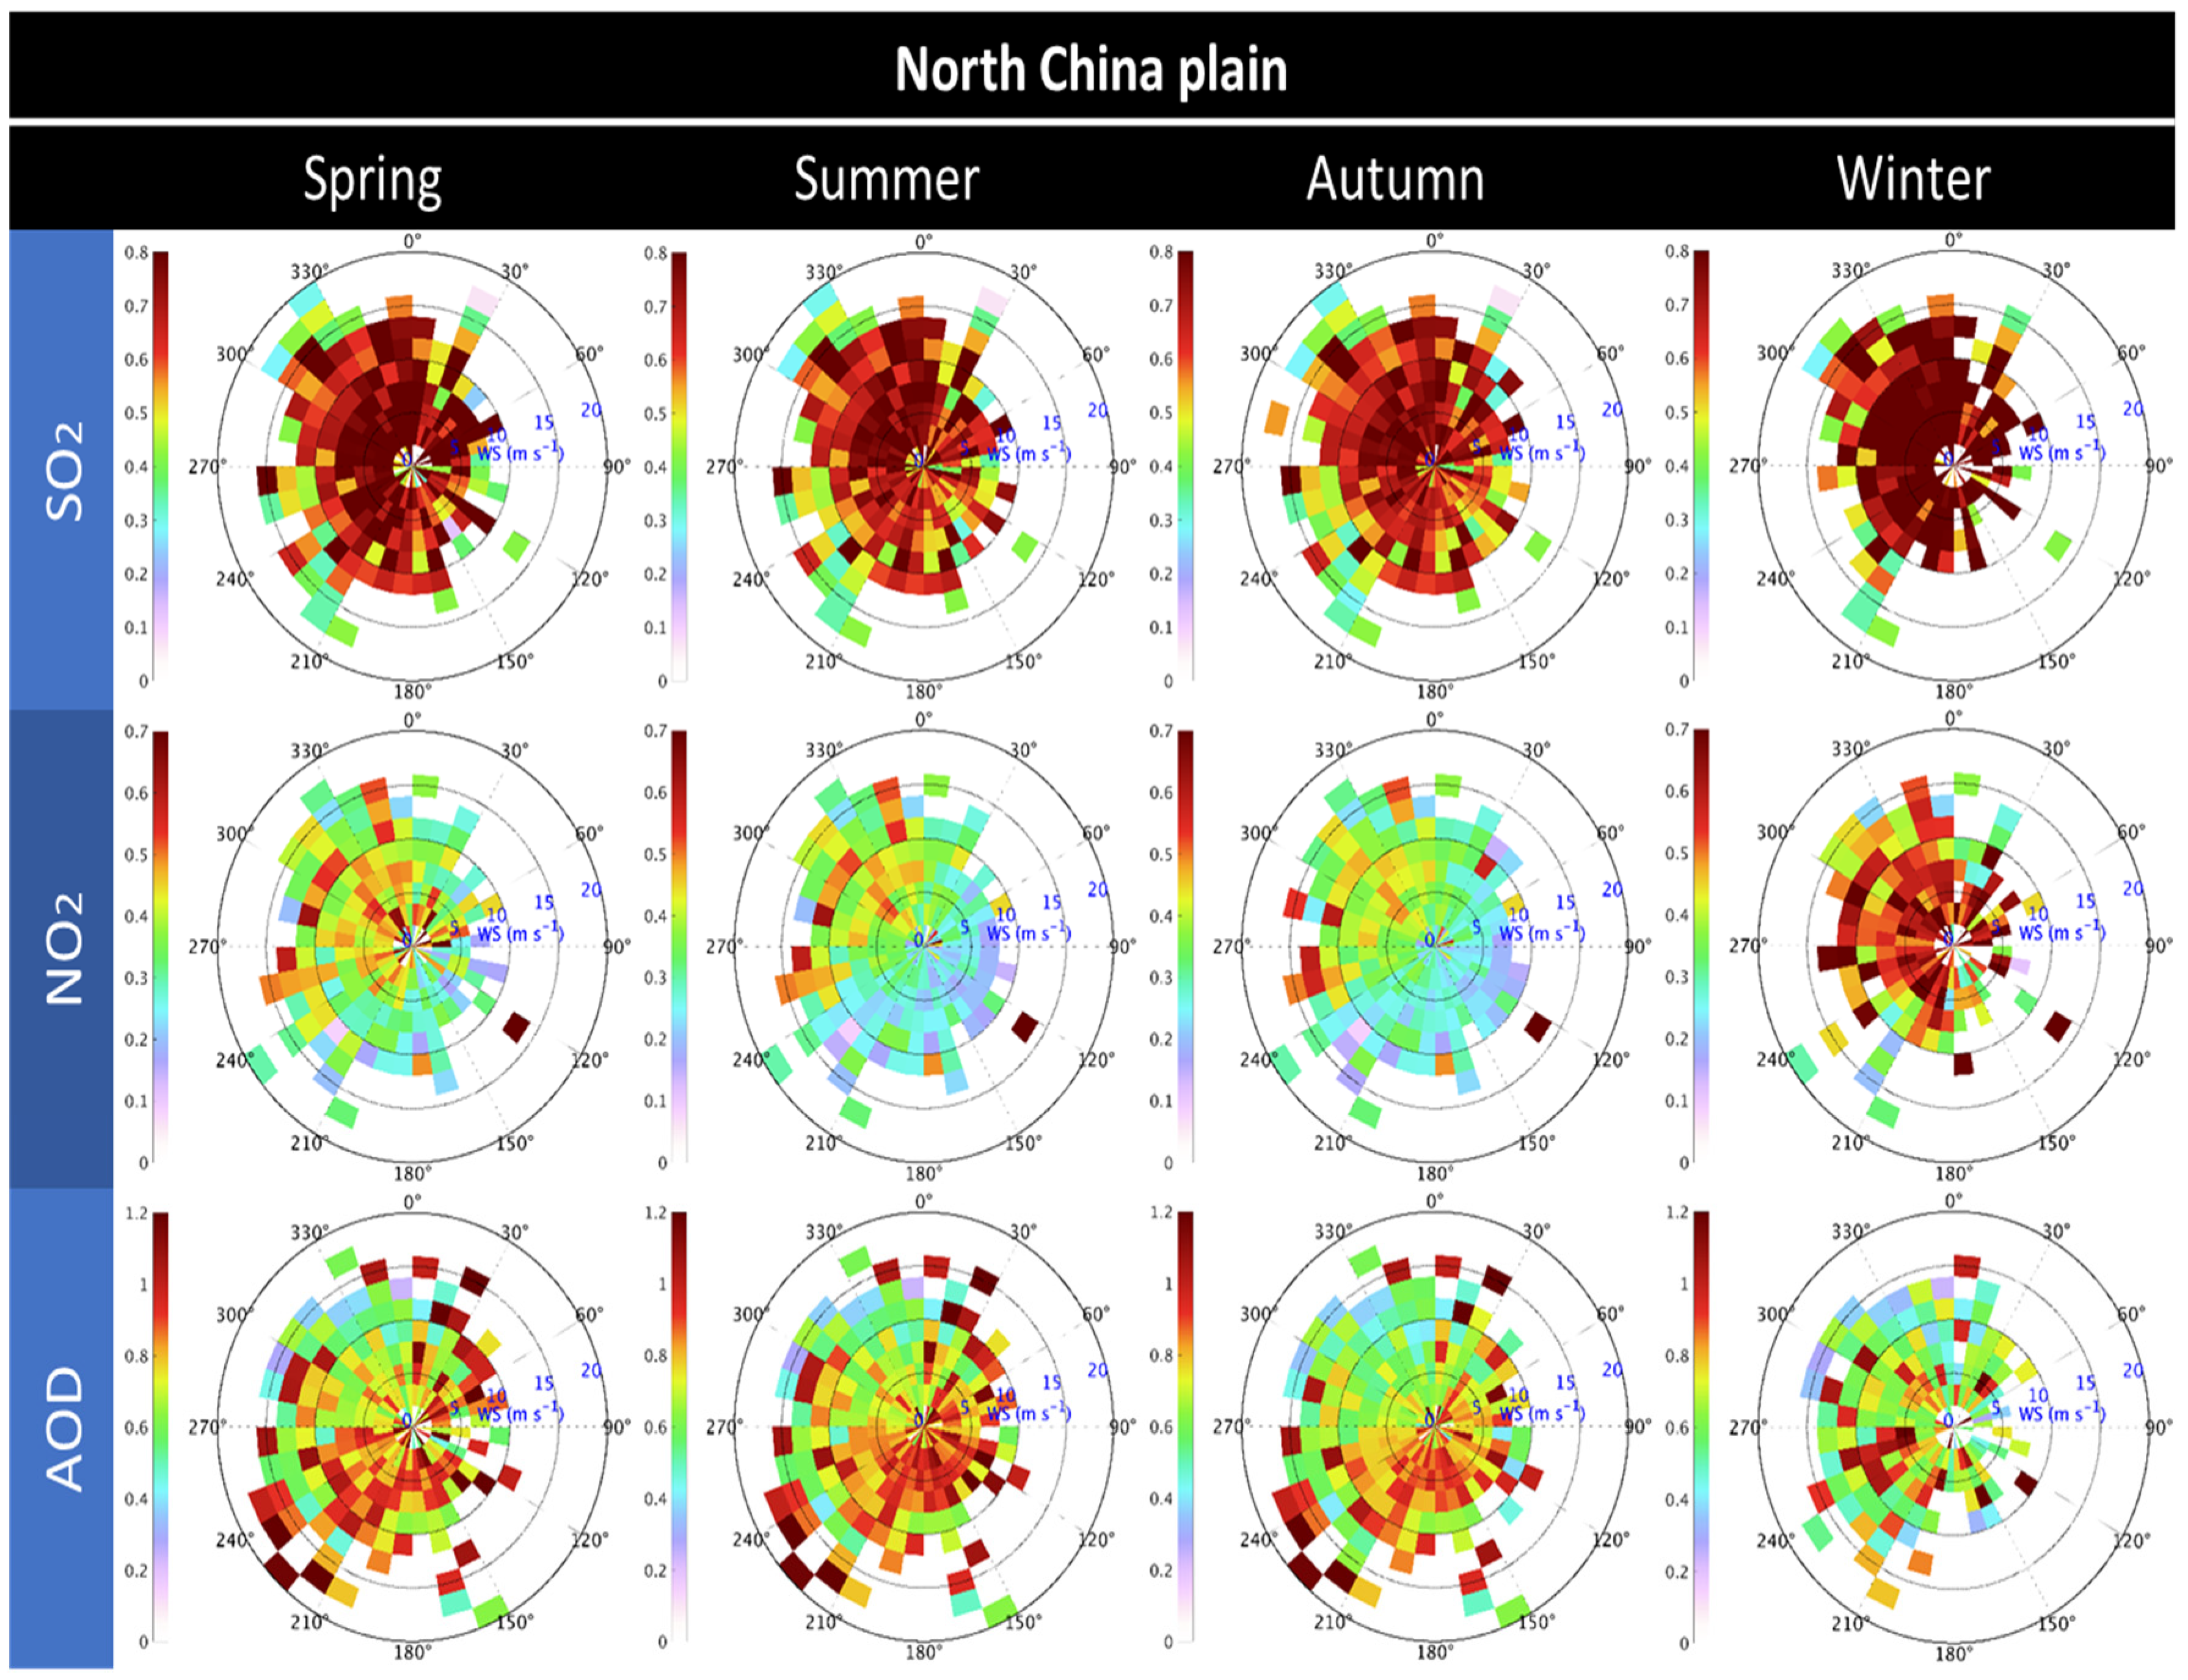
Figure 8 shows the summary of wind dependency of SO2, NO2, and AOD in the North China Plain for each season. The NCP is the most polluted region over East Asia, with most of the pollutants generated locally rather than transported from outside of the NCP. Therefore, the dependency of SO2 on wind is insignificant, and the level of SO2 is very high in all directions among all seasons. Higher levels of NO2 occur in the condition of west or northwest wind, while NO2 shows the lowest level in the east sector, probably owing to the injection of fresh air from the sea. The dependency of AOD on wind direction indicates southwest and south wind bring more moisture to the North China Plain in spring, summer, and autumn, which favors hygroscopic growth of the aerosol, and consequently an increase of AOD.
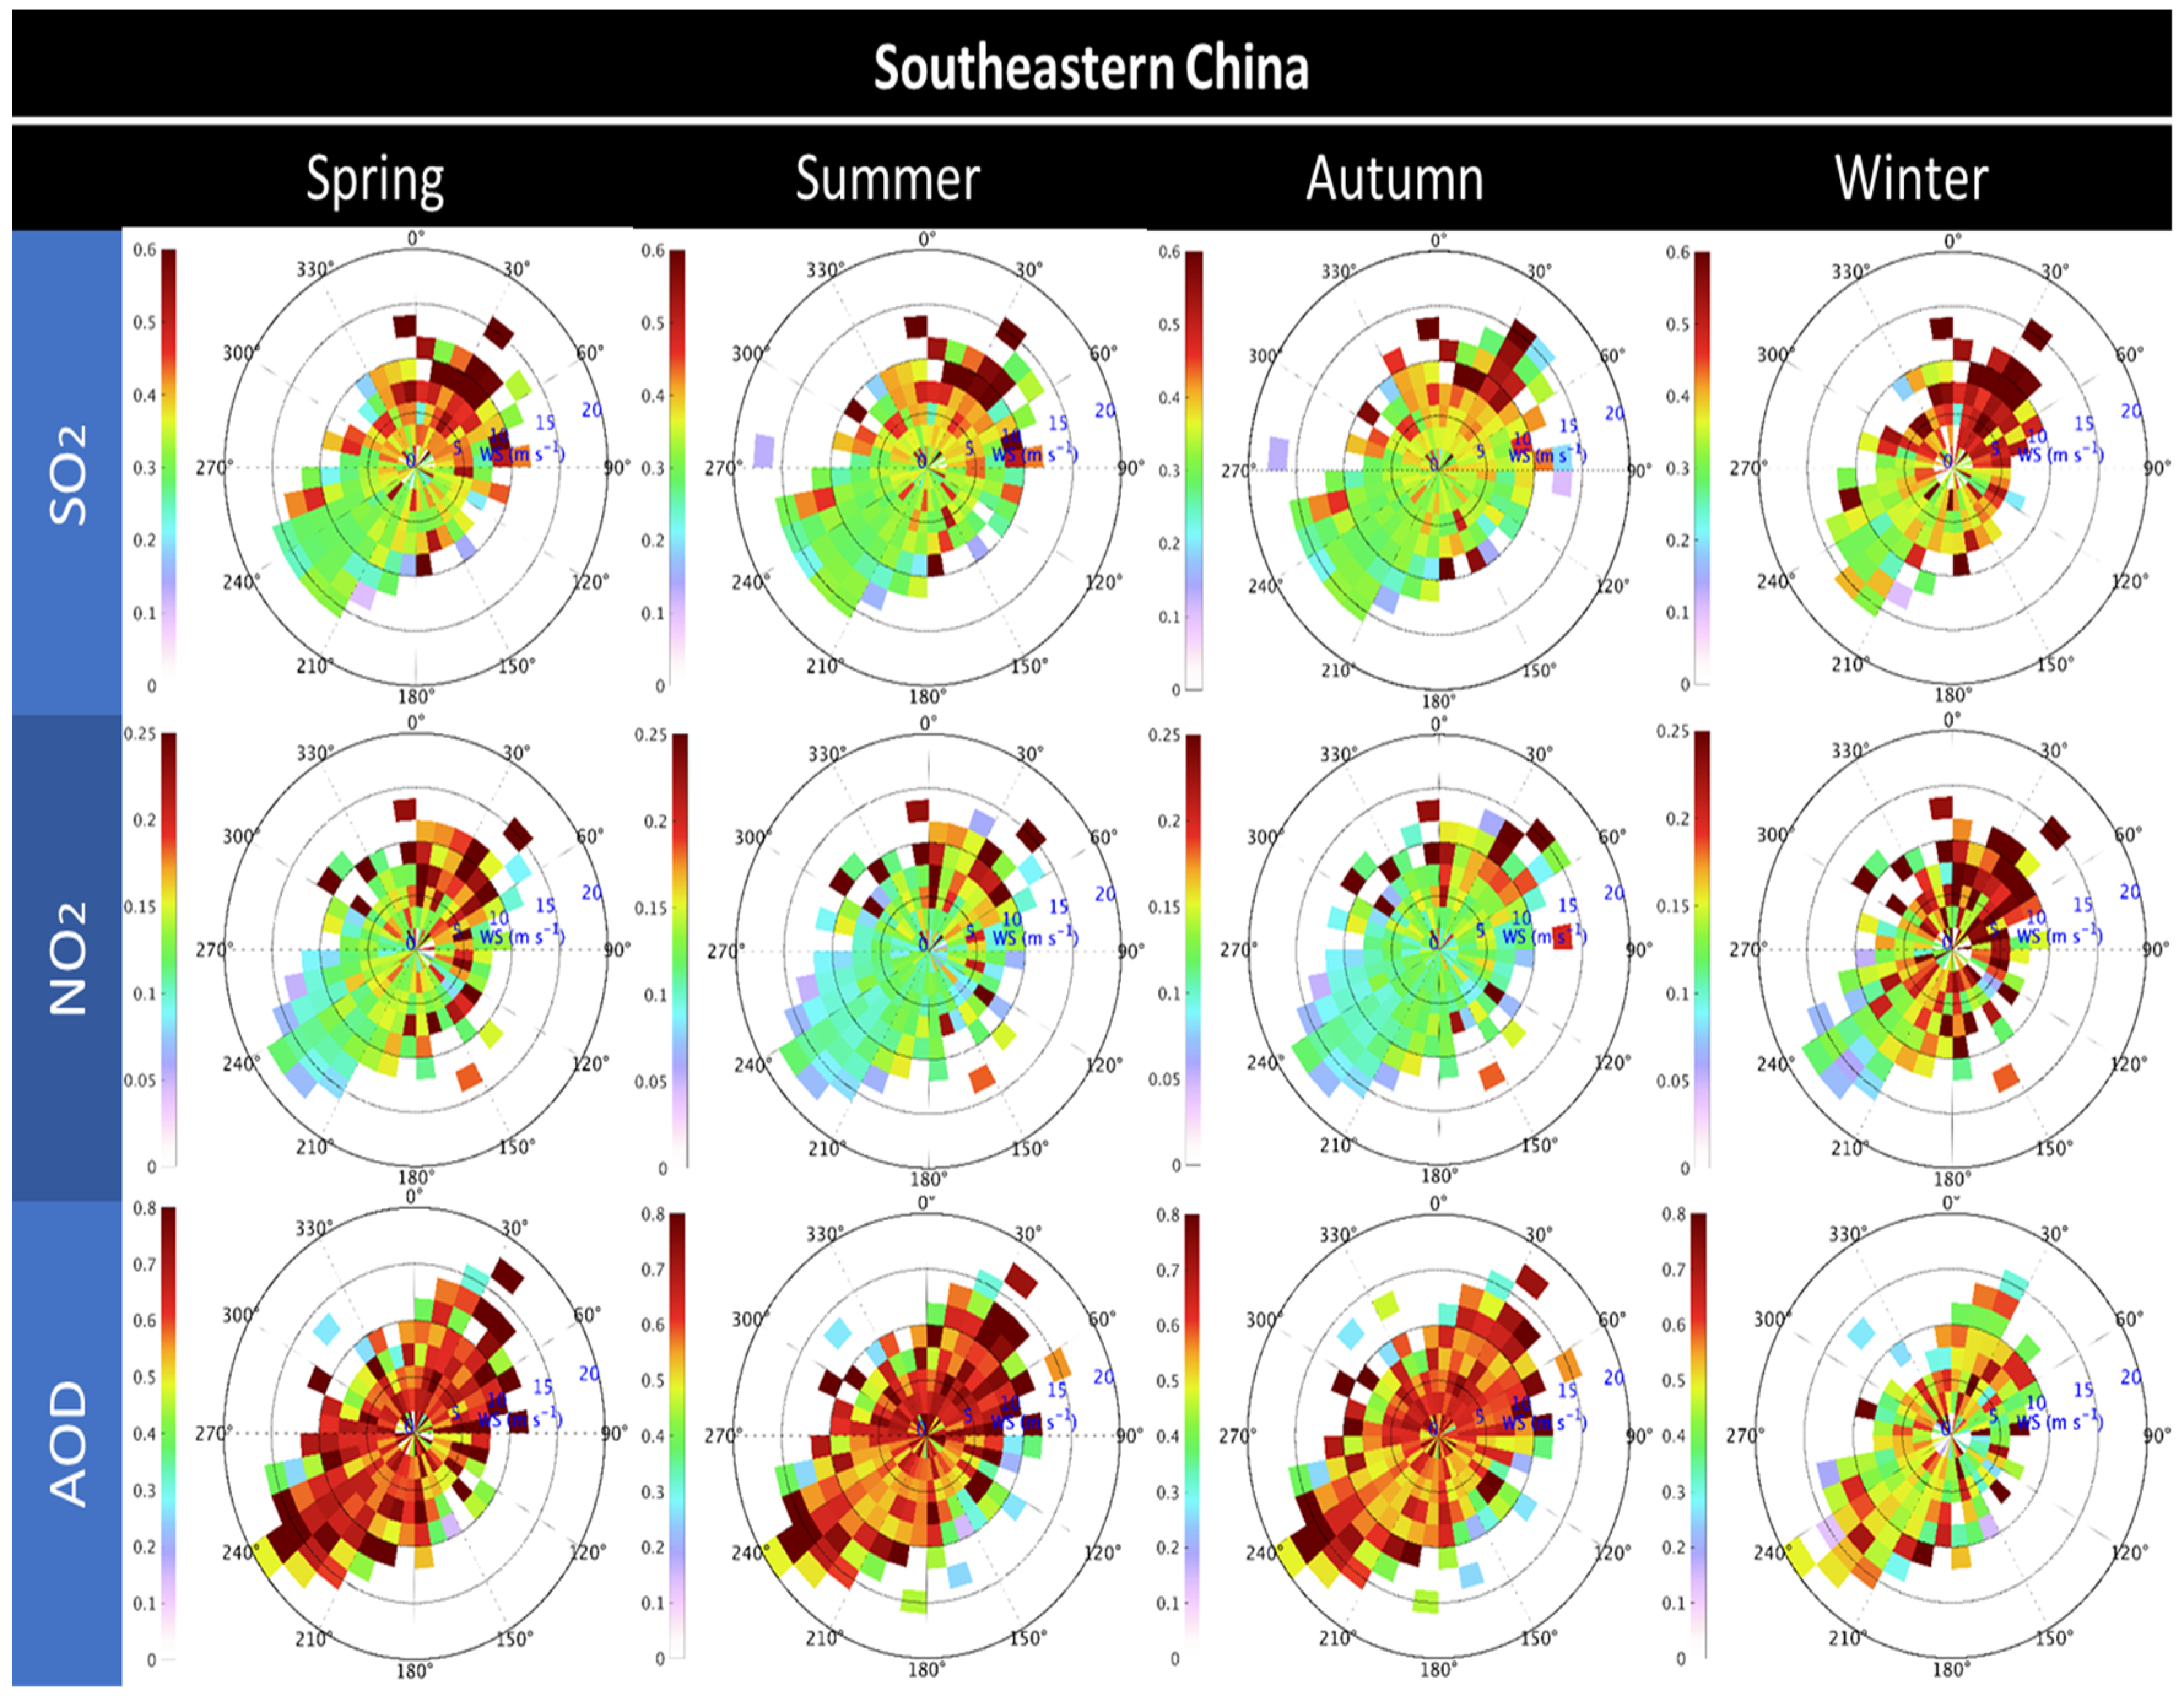
As shown in Figure 9, additional SO2 and NO2 are brought by northeast wind from the NCP to SC, causing a considerable increase of SO2 and NO2. The concentrations of SO2 and NO2 increase with increasing wind speed, indicating the effectiveness of transport. As for the AOD, the transport of aerosol is not only from the NCP by the northeast wind, but also from Southeast Asia by the southwest wind. As noted, biomass burning aerosols in Southeast Asia can potentially contribute to a high value of AOD in SC. Under a southwest wind, the transport of aerosols from Southeast Asia leads to the increase of AOD in the southwestern part of SC from spring to fall. Consistent with the biomass burning season in Southeast Asia in spring, the highest level of AOD in SC also occurs in spring, as illustrated in Figure 7. The impact of transport of aerosols on the increase of AOD in SC is substantial and may be the cause of the insignificant correlation between AOD and other meteorological factors that relate to photochemical reactions, such as temperature and RH (Table 1).
Because of the geographic and topographic conditions, the impact of transport of pollutants is insignificant in SB. NO2 and AOD exhibit higher concentrations in the northeast sector and south sector only when in the condition of strong (wind speed ≈10 m s−1) northeastern and southern wind, respectively (not shown).
Over Taiwan island, SO2 shows higher concentration in the north sector, and the concentration of SO2 increases with increasing wind speed (Figure 10). However, NO2 in TW shows no clear dependency on wind direction among all seasons. Therefore, the highest level of NO2 in TW in winter is probably caused by a combination of meteorological conditions and local sources of NO2, such as emissions from vehicles and power plants.
Compared with wind dependency of AOD in SC, the wind dependency of AOD in TW also illustrates a higher level of AOD in the southwest sector. Therefore, the increase of AOD in TW from spring to autumn may be mainly the result of the transport of aerosol from Southeast Asia or Southeastern China by southwest wind. Particularly in the spring, the level of AOD in TW is the highest and is much higher than that in other seasons (Figure 7). The transport of aerosols from Southeastern China and Southeast Asia possibly also leads to the insignificant correlation of AOD to temperature and relative humidity as SC.
With few locally-generated anthropogenic pollutants in the Taiwan Strait, the concentrations in TWS are highly dependent on transport. The pattern of dependency of pollutants on the winds in TWS is similar to that in TW, albeit with other sources of pollutants transported from TW by eastern winds (not shown). Besides, AOD in TWS also exhibits the highest level in spring, which is in agreement with the AOD in SC and in TW (Figure 7).
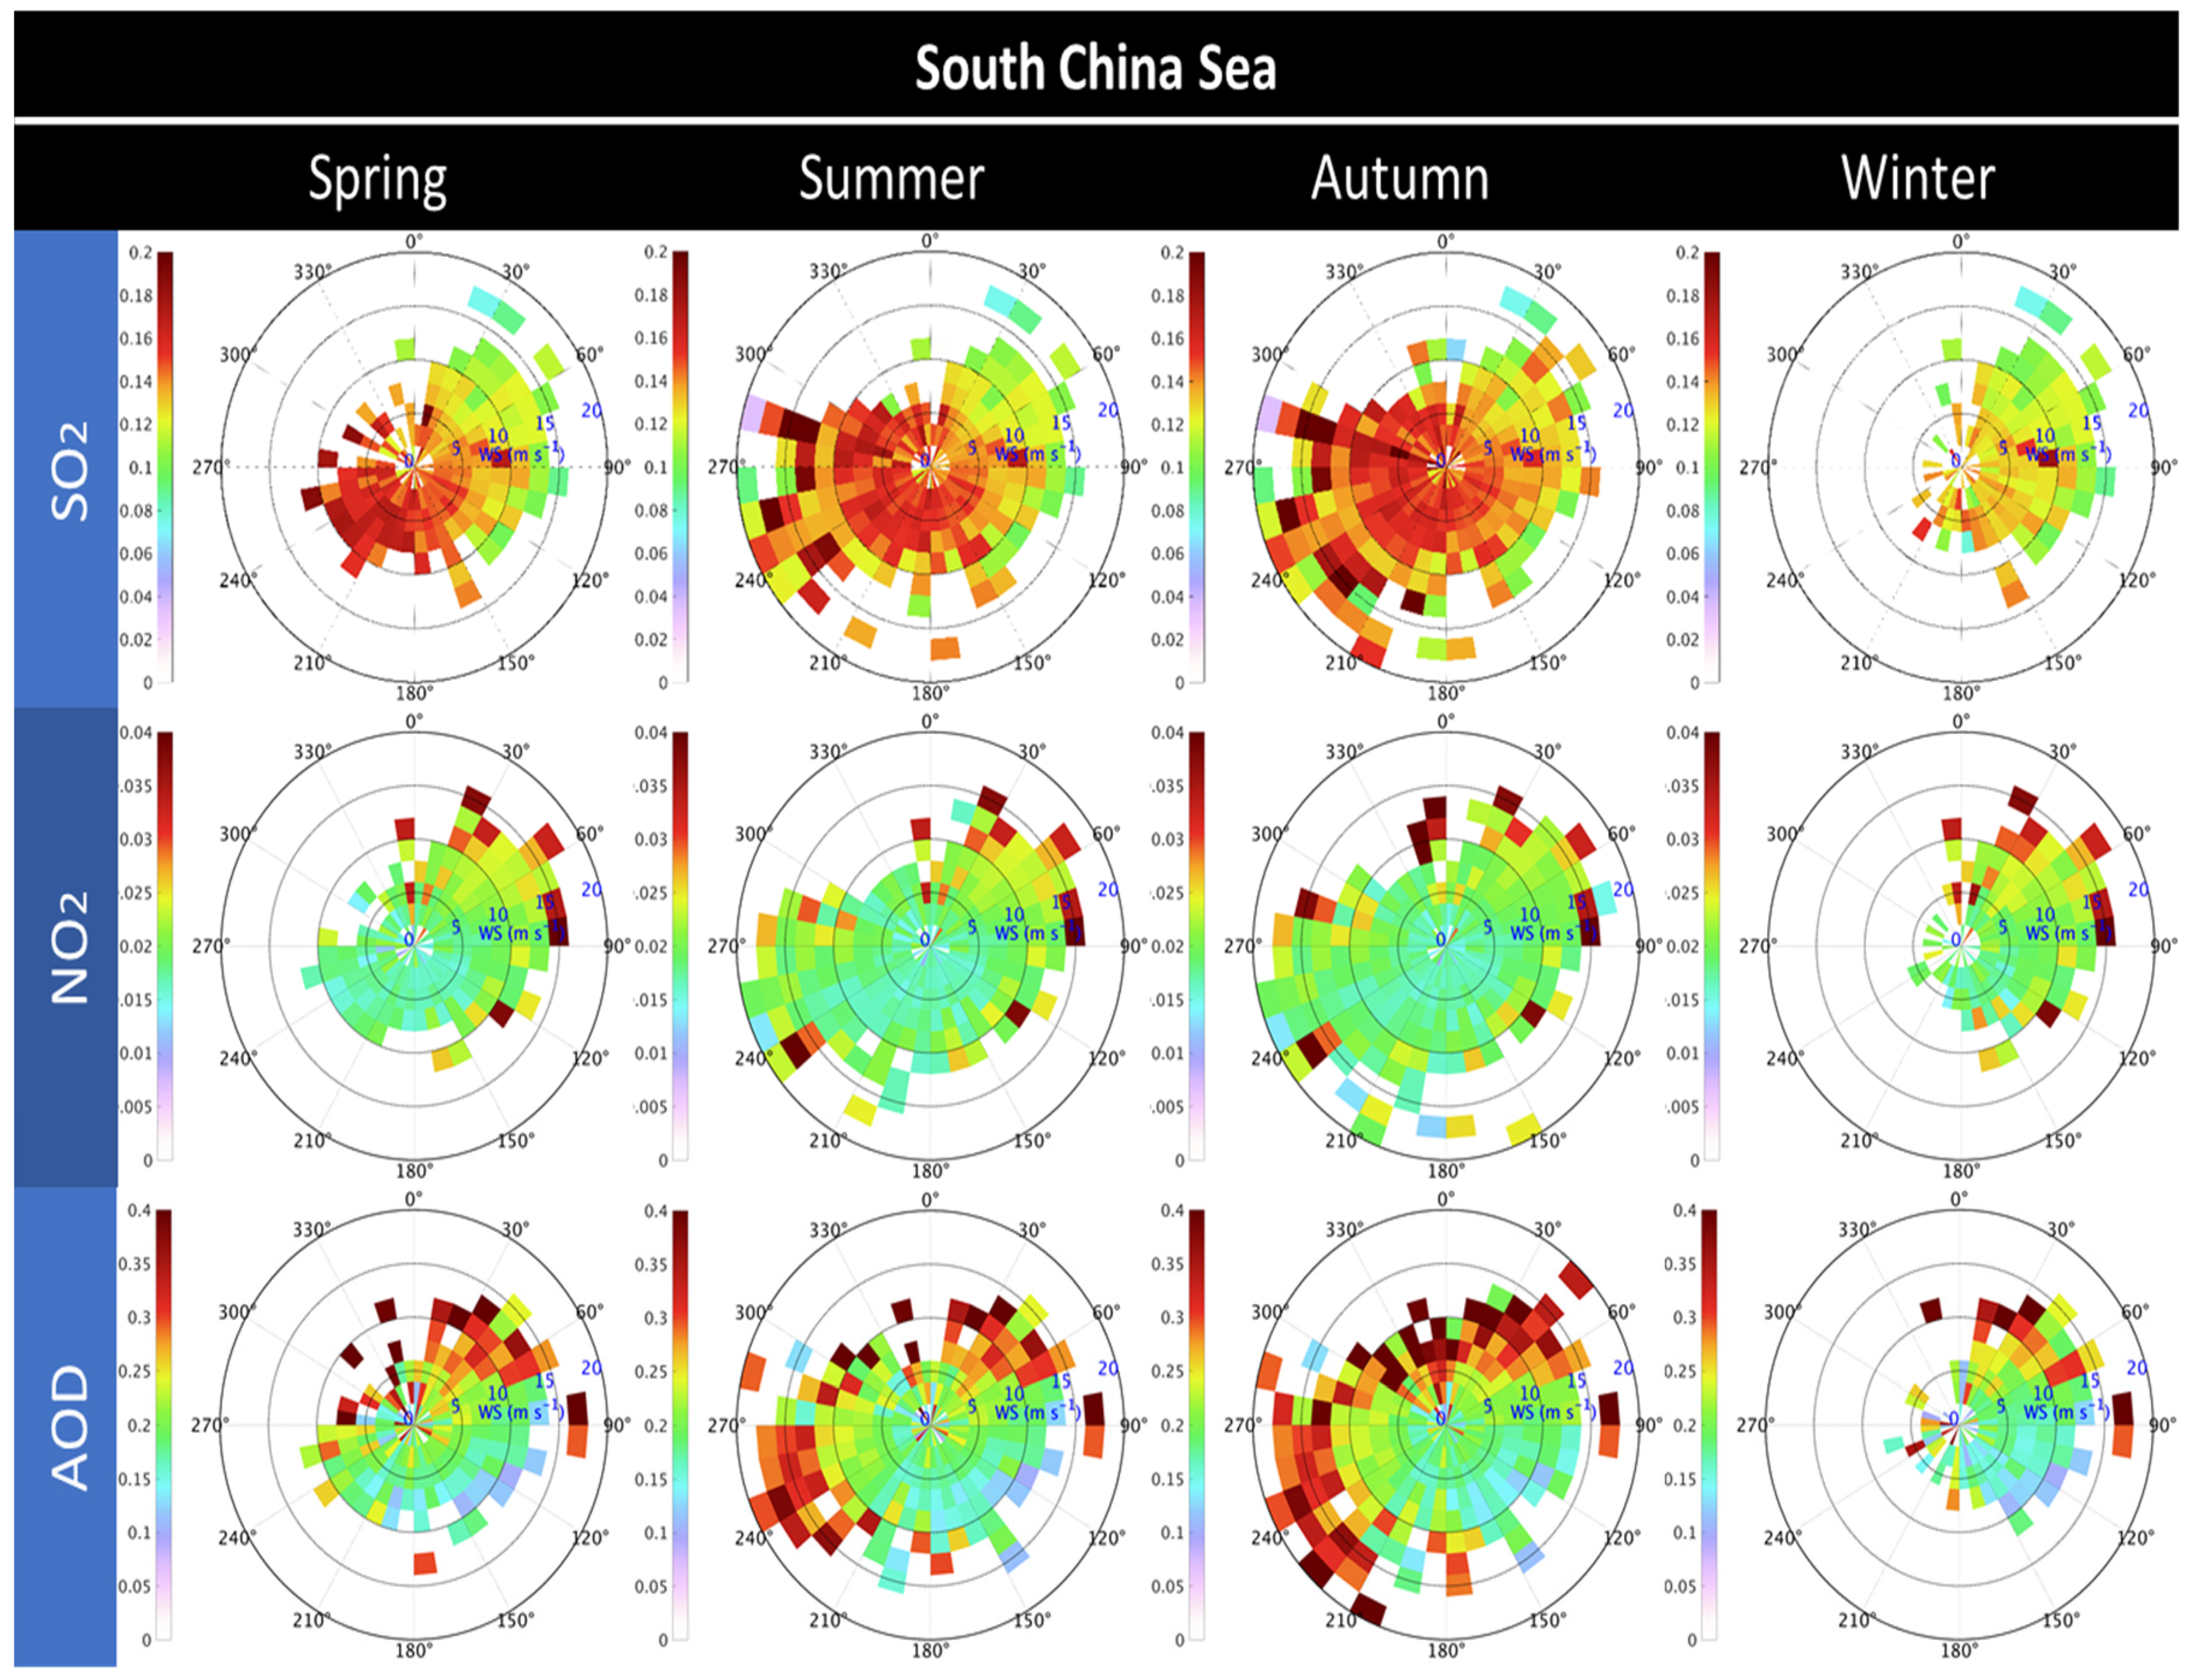
The South China Sea is surrounded by Southeastern China, the Philippines, Southeast Asia, and Borneo. As shown in Figure 11, most of the SO2 in SCS is brought in by the southwest wind from Southeast Asia from spring to autumn. However, NO2 in SCS is not only transported from Southeast Asia, but also from SC and the Philippines under strong northeasterly winds.
Figure 11 shows that the AOD in SCS is also highly dependent on wind and closely related to the location of the intertropical convergence zone (ITCZ). In spring and winter, the northeast wind brings aerosol from the Philippines and SC to SCS and leads to a higher level of AOD in the northeast sector. On the other hand, in summer and autumn, AOD in SCS is not only transported from the north or northeast, but also from Southeast Asia and Borneo by the southwest wind. The impact of transportation of biomass burning aerosols from Southeast Asia on the increase of AOD is even more important than the locally generated aerosol in SC, TW, and TWS, potentially explaining the insignificant correlation of AOD to temperature and RH.

3.3.3. Effect of Precipitation

To explore the effect of precipitation, we separate the 0.25° daily pollutant (SO2, NO2, and AOD) data based on the existence of precipitation. In this study, the data with and without precipitation are selected when the precipitation from TRMM is >5 mm day−1 and <0.1 mm day−1, respectively. Furthermore, the pollutant data are selected one day after the precipitation data in order to compare the level of pollution affected by precipitation and that not affected by precipitation.
Figure 12 shows the seasonal cycles of SO2, NO2, and AOD with and without precipitation for each monitoring region. The seasonal cycle of precipitation rate in each region is illustrated by the histogram in Figure 12. Overall, as expected, the level of SO2 after precipitation is lower than without precipitation. Also, the level of NO2 with precipitation is slightly less than that without precipitation. The effect of precipitation on AOD is not as clear, varying from region to region and month to month. While the precipitation is associated with more efficient wet scavenging, the lower air temperature and weak insolation in a precipitation day are also associated with limited photochemical decomposition of SO2/NO2. The two opposite effects might offset each other and result in a minor difference of AOD/SO2/NO2 between the precipitation days and the non-precipitation days.

4. Discussion and Conclusions

This study evaluates the spatiotemporal variation of pollutants (SO2, NO2, and AOD) over East Asia, and derives the correlation of their levels to meteorological factors for various monitoring regions (North China Plain, Southeastern China, Sichuan Basin, Taiwan Island, Taiwan Strait, and South China Sea). The OMI derived SO2 and NO2 show high values in China, especially in the North China Plain. SO2 and NO2, the precursors of sulfate and nitrate aerosols, are the two dominant pollutants in China. Therefore, the spatial distribution of AOD in China is consistent with that of SO2 and NO2 and with the highest level in the NCP. Additionally, there are hotspots of AOD in Southeast Asia in spring and in Indonesia in fall as a result of biomass burning.
The temporal variation of pollutants of each monitored region is diverse owing to different environmental policies, economic development, and industrial structure. SO2 levels in the NCP, SC, and SB exhibit a decreasing trend after around 2007 due to the installation of desulfurization devices, while the temporal variations of SO2 level in TW, TWS, and SCS are statistically insignificant during the period from 2005 to 2015. NO2 levels in all monitoring regions, except SCS, show a decreasing trend after around 2012 because of the economic recession and China’s 12th Five Year Policy to further restrict the emission of NO in the NCP, SC, and SB.
Because of the difference in the composition of aerosols, the temporal variation of AOD among the monitoring regions is much more complicated. In the NCP, the level of AOD is controlled by both SO2 and NO2, and started to decline after 2012 when both SO2 and NO2 decrease. On the other hand, the level of AOD shows a decreasing trend after 2007 in SC, SB, and TW, which is mainly the result of the installation of desulfurization devices and the resultant reduction of sulfate aerosol.
Additionally, the seasonal cycle of SO2 is disparate among all monitored regions, while the seasonal cycles of NO2 in all regions are identical, with the highest level occurring in the winter and the lowest level in the summer. The highest level of AOD in the NCP occurs in the summer, but in other regions, it occurs in the spring. The difference in seasonal cycles of pollutants among the monitoring regions could be a result of the impact of meteorological factors. Therefore, the correlations of pollutants to 850 hPa temperature, 850 hPa relative humidity, and lower tropospheric stability were derived and the effect of transport of aerosol and precipitation were also investigated.
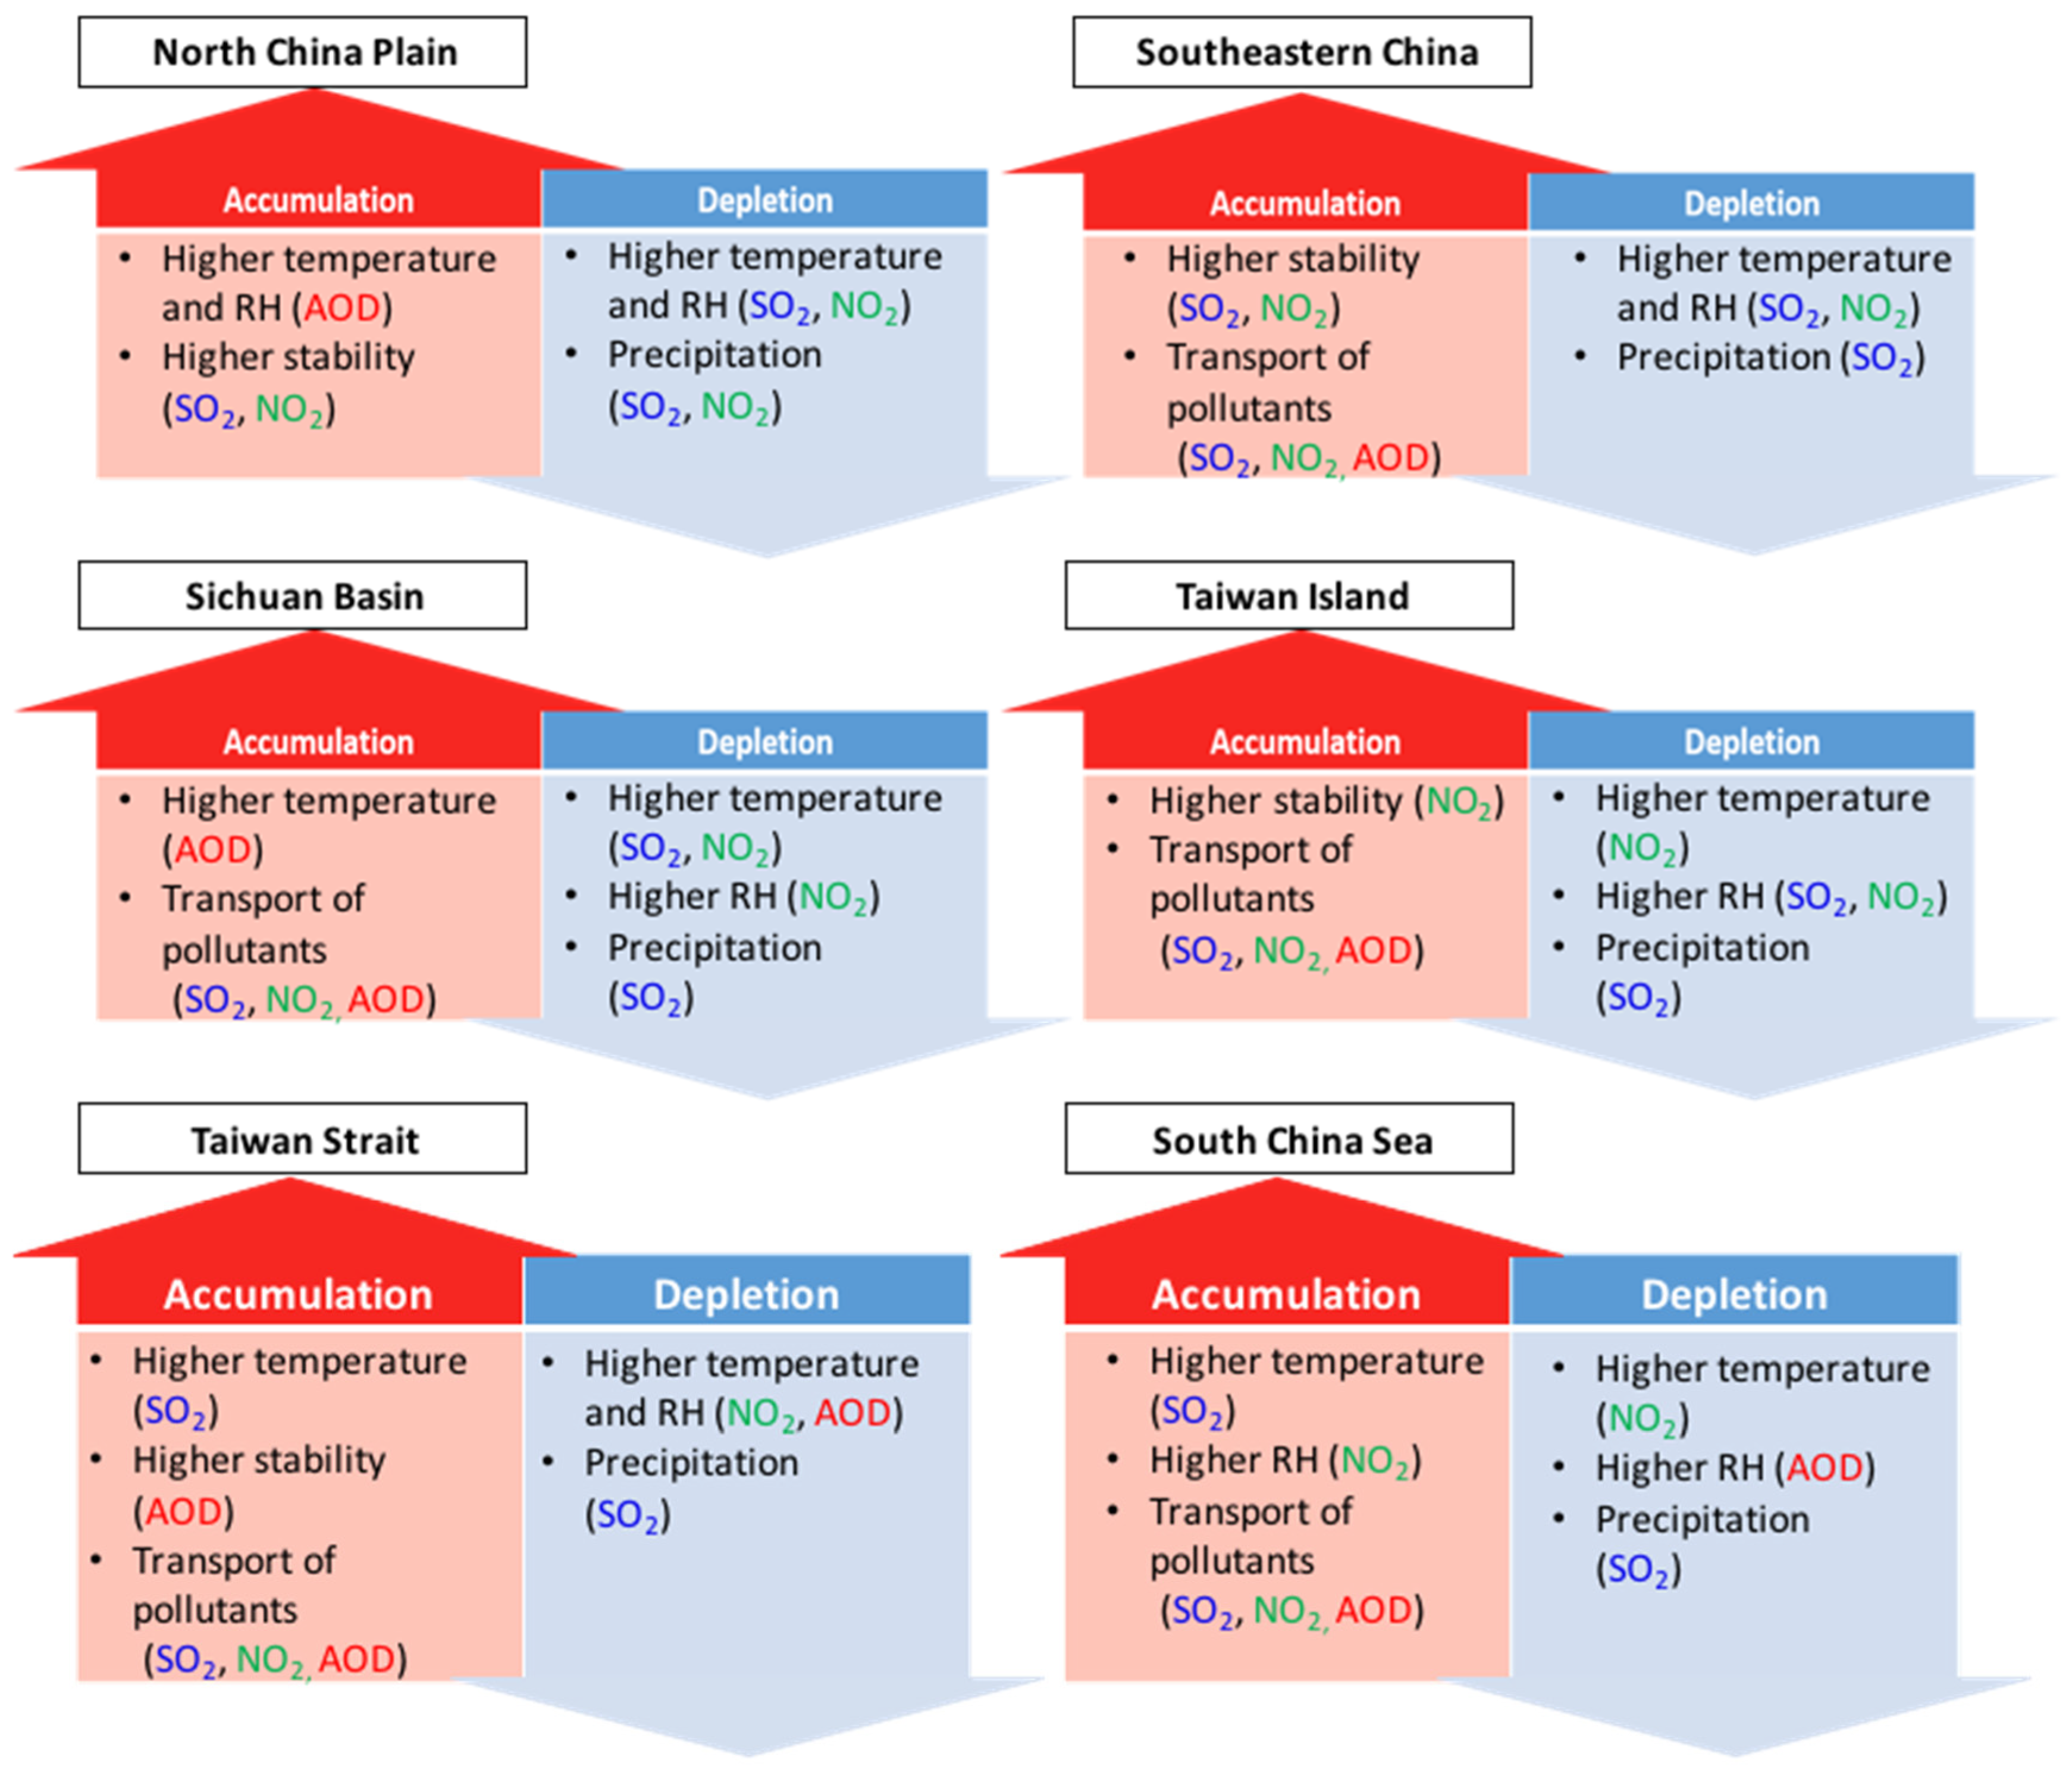
A summary of the correlations of pollutant levels to meteorological conditions for all monitoring regions is given in Figure 13. Because photochemical reactions transform SO2 and NO2 to sulfate and nitrate aerosol, respectively, more efficiently under the condition of higher temperature and higher relative humidity, the correlations of SO2 and NO2 to temperature and RH are negative (statistically significant) in most regions. However, the correlation between SO2 and temperature is positive in TWS, and SCS, which is possibly attributable to a natural source of SO2 over the sea. Furthermore, the correlation of AOD to temperature and RH is positive (statistically significant) only in the NCP and SB, but not in the other monitored regions. This may be because of aerosol transport or other significant aerosol sources in other monitoring regions. With respect to lower tropospheric stability, higher stability causes accumulation of SO2 and NO2 in the NCP and SC. However, the correlation of AOD to LTS is negative in the NCP, SC, and TW. A more stable atmosphere may be associated with limited aerosol and particulate material mixing up to a relatively high PBL, resulting in lower AOD.
The level of aerosol in less polluted regions is potentially influenced by the transport of aerosol from highly polluted regions. Transport of SO2 and NO2 from the NCP causes the increase of SO2 and NO2 level in SC, SB, TW, and TWS, especially under the prevailing northeastern wind in winter. The level of SO2 and NO2 in the northeastern sector increases with increasing wind speed, indicating the effect of transport of SO2 and NO2. In addition to the transport of aerosol from the NCP, biomass burning aerosol in Southeast Asia and anthropogenic aerosol in SC, respectively, contribute to the noticeable increase of AOD in SC and TW under southwestern wind from spring to fall. The effect of precipitation leads to the decline of SO2, NO2, and AOD, especially in highly polluted regions. While the precipitation is associated with more efficient wet scavenging, the lower air temperature and weak insolation in a precipitation day are also associated with limited photochemical decomposition of SO2/NO2, leading to an insignificant difference of pollutants between precipitation days and non-precipitating days.
Overall, this study investigates the characteristics of pollutants (SO2, NO2, and AOD) and the correlation of pollutants to meteorological conditions over East Asia. This can be further applied to understand the variations of East Asian pollutants under future climate change.

Supplementary Materials

The following are available online at https://www.mdpi.com/2072-4292/11/15/1738/s1, Figure S1: Spatial distribution of 2005–2015 averaged ratio of the extinction AOD of (a) organic carbon (OC), (b) black carbon (BC), (c) SO4 (sulfate aerosol), and (d) dust over total extinction AOD. AOD data are from Modern-Era Retrospective analysis for Research and Applications, Version 2 (MERRA-2) reanalysis data. Figure S2–7: Time series of yearly-mean SO2, NO2, AOD, and meteorological fields (850 hPa temperature, 850 hPa RH, and lower tropospheric stability (LTS)) over NCP, SB, SC, SCS, TWS, and TW, respectively. Figure S8–13: Seasonal cycle of 2005–2015 mean SO2, NO2, AOD, and meteorological fields (850 hPa temperature, 850 hPa RH, and lower tropospheric stability (LTS)) over NCP, SB, SC, SCS, TWS, and TW, respectively.

Author Contributions

Data Curation, C.-A.L., C.-Y.L. and W.-T.C.; Formal Analysis, C.-A.L.; Funding Acquisition, Y.-C.C. and C.C.-K.C.; Project Administration, Y.-C.C.; Supervision, Y.-C.C., C.-Y.L., W.-T.C. and C.C.-K.C.; Writing—Original Draft Preparation, C.-A.L.; Writing—Review & Editing, Y.-C.C., W.-T.C. and J.H.S.

Funding

This research was funded by the Ministry of Science and Technology (MOST) of Taiwan (MOST 107-2111-M-00l-001-MY2) and Academia Sinica, Taiwan, through grant AS-KPQ-106-DDPP.

Acknowledgments

Authors acknowledge the support from the Ministry of Science and Technology (MOST 107-2111-M-00l-001-MY2) of Taiwan and Academia Sinica, Taiwan (grant AS-KPQ-106-DDPP). Authors acknowledge the reviewers for the comments and suggestions. Authors acknowledge NASA’s Goddard Earth Science Data and Information Center (GES DISC), Atmosphere Archive & Distribution System (LAADS) Distributed Active Archive Center (DAAC), and Giovanni website for making the MODIS and OMI satellite data available and easily accessible. TRMM 3B42 data are downloaded from NASA Precipitation Measurement Missions https://pmm.nasa.gov/data-access/downloads/trmm.

Conflicts of Interest

The authors declare no conflict of interest. The funders had no role in the design of the study; in the collection, analyses, or interpretation of data; in the writing of the manuscript, or in the decision to publish the results.

References

  1. Lu, Z.; Zhang, Q.; Streets, D.G. Sulfur dioxide and primary carbonaceous aerosol emissions in China and India, 1996–2010. Atmos. Chem. Phys. Discuss. 2011, 11, 9839–9864. [Google Scholar] [CrossRef]
  2. Streets, D.; Waldhoff, S.; Streets, D. Present and future emissions of air pollutants in China. Atmos. Environ. 2000, 34, 363–374. [Google Scholar] [CrossRef]
  3. Liu, F.; Zhang, Q.; Tong, D.; Zheng, B.; Li, M.; Huo, H.; He, K.B. High-resolution inventory of technologies, activities, and emissions of coal-fired power plants in China from 1990 to 2010. Atmos. Chem. Phys. Discuss. 2015, 15, 13299–13317. [Google Scholar] [CrossRef] [Green Version]
  4. Hua, S.; Tian, H.; Wang, K.; Zhu, C.; Gao, J.; Ma, Y.; Xue, Y.; Wang, Y.; Duan, S.; Zhou, J. Atmospheric emission inventory of hazardous air pollutants from China’s cement plants: Temporal trends, spatial variation characteristics and scenario projections. Atmos. Environ. 2016, 128, 1–9. [Google Scholar] [CrossRef]
  5. Azimi, M.; Feng, F.; Yang, Y. Air Pollution Inequality and Its Sources in SO2 and NOX Emissions among Chinese Provinces from 2006 to 2015. Sustainability 2018, 10, 367. [Google Scholar] [CrossRef]
  6. Seinfeld, J.H.; Pandis, S.N. Atmospheric Chemistry and Physics: From Air Pollution to Climate Change, 3rd ed.; John Wiley Sons: Hoboken, NJ, USA, 2016. [Google Scholar]
  7. USEPA. Our Nation’s Air Status and Trends Through 2010; Technical Report EPA-454/R-12-001; USEPA: Washington, DC, USA, 2012.
  8. Chou, C.C.-K.; Lee, C.; Yuan, C.; Hsu, W.; Lin, C.-Y.; Hsu, S.-C.; Liu, S. Implications of the chemical transformation of Asian outflow aerosols for the long-range transport of inorganic nitrogen species. Atmos. Environ. 2008, 42, 7508–7519. [Google Scholar] [CrossRef]
  9. Lin, C.-Y.; Chou, C.C.; Wang, Z.; Lung, S.-C.; Lee, C.-T.; Yuan, C.-S.; Chen, W.-N.; Chang, S.-Y.; Hsu, S.-C.; Chen, W.-C.; et al. Impact of different transport mechanisms of Asian dust and anthropogenic pollutants to Taiwan. Atmos. Environ. 2012, 60, 403–418. [Google Scholar] [CrossRef]
  10. Oh, H.-R.; Ho, C.-H.; Kim, J.; Chen, D.; Lee, S.; Choi, Y.-S.; Chang, L.-S.; Song, C.-K. Long-range transport of air pollutants originating in China: A possible major cause of multi-day high-PM10 episodes during cold season in Seoul, Korea. Atmos. Environ. 2015, 109, 23–30. [Google Scholar] [CrossRef]
  11. Naja, M.; Akimoto, H. Contribution of regional pollution and long-range transport to the Asia-Pacific region: Analysis of long-term ozonesonde data over Japan. J. Geophys. Res. Space Phys. 2004, 109. [Google Scholar] [CrossRef]
  12. Lin, M.; Fiore, A.M.; Horowitz, L.W.; Cooper, O.R.; Naik, V.; Holloway, J.; Johnson, B.J.; Middlebrook, A.M.; Oltmans, S.J.; Pollack, I.B.; et al. Transport of Asian ozone pollution into surface air over the western United States in spring, J. Geophys. Res. 2012, 117, D00V07. [Google Scholar] [CrossRef]
  13. Lin, J.; Pan, D.; Davis, S.J.; Zhang, Q.; He, K.; Wang, C.; Streets, D.G.; Wuebbles, D.J.; Guan, D. China’s international trade and air pollution in the United States. Proc. Natl. Acad. Sci. USA 2014, 111, 1736–1741. [Google Scholar] [CrossRef] [PubMed]
  14. Yu, H.; Remer, L.A.; Chin, M.; Bian, H.; Kleidman, R.G.; Diehl, T. A satellite-based assessment of transpacific transport of pollution aerosol. J. Geophys. Res. 2008, 113, 1–15. [Google Scholar] [CrossRef]
  15. Van Donkelaar, A.; Martin, R.V.; Leaitch, W.R.; Macdonald, A.M.; Walker, T.W.; Streets, D.G.; Zhang, Q.; Dunlea, E.J.; Jimenez, J.L.; Dibb, J.E.; et al. Analysis of aircraft and satellite measurements from the Intercontinental Chemical Transport Experiment (INTEX-B) to quantify long-range transport of East Asian sulfur to Canada. Atmos. Chem. Phys. Discuss. 2008, 8, 2999–3014. [Google Scholar] [CrossRef] [Green Version]
  16. Krotkov, N.A.; McLinden, C.A.; Li, C.; Lamsal, L.N.; Celarier, E.A.; Marchenko, S.V.; Swartz, W.H.; Bucsela, E.J.; Joiner, J.; Duncan, B.N.; et al. Aura OMI observations of regional SO2 and NO2 pollution changes from 2005 to 2015. Atmos. Chem. Phys. Discuss. 2016, 16, 4605–4629. [Google Scholar] [CrossRef]
  17. Lu, Z.; Streets, D.G.; de Foy, B.; Krotkov, N.A. Ozone Monitoring Instrument Observations of Interannual Increases in SO2 Emissions from Indian Coal-Fired Power Plants during 2005–2012. Environ. Sci. Technol. 2013, 47, 13993–14000. [Google Scholar] [CrossRef] [PubMed]
  18. Hilboll, A.; Richter, A.; Burrows, J.P. Long-term changes of tropospheric NO2 over megacities derived from multiple satellite instruments. Atmos. Chem. Phys. Discuss. 2013, 13, 4145–4169. [Google Scholar] [CrossRef]
  19. Krotkov, N.A.; McLinden, C.A.; Li, C.; Lamsal, L.N.; Celarier, E.A.; Marchenko, S.V.; Swartz, W.H.; Bucsela, E.J.; Joiner, J.; Duncan, B.N.; et al. Aura OMI observations of regional SO2 and NO2 pollution changes from 2005 to 2014. Atmos. Chem. Phys. Discuss. 2015, 15, 26555–26607. [Google Scholar] [CrossRef]
  20. Lamsal, L.N.; Duncan, B.N.; Yoshida, Y.; Krotkov, N.A.; Pickering, K.E.; Streets, D.G.; Lu, Z. US NO2 trends (2005–2013): EPA Air Quality System (AQS) data versus improved observations from the Ozone Monitoring Instrument (OMI). Atmos. Environ. 2015, 110, 130–143. [Google Scholar] [CrossRef]
  21. Zhang, L.; Lee, C.S.; Zhang, R.; Chen, L. Spatial and temporal evaluation of long term trend (2005–2014) of OMI retrieved NO2 and SO2 concentrations in Henan Province, China. Atmos. Environ. 2017, 154, 151–166. [Google Scholar] [CrossRef]
  22. Russell, A.R.; Valin, L.C.; Cohen, R.C. Trends in OMI NO2 observations over the United States: Effects of emission control technology and the economic recession. Atmos. Chem. Phys. Discuss. 2012, 12, 12197–12209. [Google Scholar] [CrossRef]
  23. Van Der A, R.J.; Mijling, B.; Ding, J.; Koukouli, M.E.; Liu, F.; Li, Q.; Mao, H.; Theys, N. Cleaning up the air: Effectiveness of air quality policy for SO2 and NOx emissions in China. Atmos. Chem. Phys. Discuss. 2017, 17, 1775–1789. [Google Scholar] [CrossRef]
  24. Zhao, B.; Wang, S.; Wang, J.; Fu, J.S.; Liu, T.; Xu, J.; Fu, X.; Hao, J. Impact of national NOx and SO2 control policies on particulate matter pollution in China. Atmos. Environ. 2013, 77, 453–463. [Google Scholar] [CrossRef]
  25. Eatough, D.; Caka, F.; Farber, R. The Conversion of SO2 to Sulfate in the Atmosphere. Isr. J. Chem. 1994, 34, 301–314. [Google Scholar] [CrossRef]
  26. Khoder, M.; Khoder, M. Atmospheric conversion of sulfur dioxide to particulate sulfate and nitrogen dioxide to particulate nitrate and gaseous nitric acid in an urban area. Chemosphere 2002, 49, 675–684. [Google Scholar] [CrossRef]
  27. Turalıoğlu, F.S.; Nuhoglu, A.; Bayraktar, H.; Turalioglu, F.S. Impacts of some meteorological parameters on SO2 and TSP concentrations in Erzurum, Turkey. Chemosphere 2005, 59, 1633–1642. [Google Scholar] [CrossRef] [PubMed]
  28. Wallace, J.; Kanaroglou, P. The sensitivity of OMI-derived nitrogen dioxide to boundary layer temperature inversions. Atmos. Environ. 2009, 43, 3596–3604. [Google Scholar] [CrossRef]
  29. Bralić, M.; Buljac, M.; Periš, N.; Buzuk, M.; Dabić, P.; Brinić, S. Monthly and Seasonal Variations of NO2, SO2 and Black-smoke Located Within the Sport District in Urban Area, City of Split, Croatia. Croat. Chem. Acta 2012, 85, 139–145. [Google Scholar] [CrossRef]
  30. Malkki, A.; Saari, H.; Levelt, P.; Oord, G.V.D.; Dobber, M.; Visser, H.; De Vries, J.; Stammes, P.; Lundell, J. The ozone monitoring instrument. IEEE Trans. Geosci. Remote Sens. 2006, 44, 1093–1101. [Google Scholar] [CrossRef]
  31. Li, C.; Joiner, J.; Krotkov, N.A.; Bhartia, P.K. A fast and sensitive new satellite SO2 retrieval algorithm based on principal component analysis: Application to the ozone monitoring instrument. Geophys. Res. Lett. 2013, 40, 6314–6318. [Google Scholar] [CrossRef]
  32. KNMI. Background Information about the Row Anomaly in OMI. 2012. Available online: https://projects.knmi.nl/omi/research/product/rowanomaly-background.php (accessed on 5 August 2015).
  33. Boersma, K.F.; Eskes, H.J.; Dirksen, R.J.; Van Der A, R.J.; Veefkind, J.P.; Stammes, P.; Huijnen, V.; Kleipool, Q.L.; Sneep, M.; Claas, J.; et al. An improved tropospheric NO2 column retrieval algorithm for the Ozone Monitoring Instrument. Atmos. Meas. Tech. 2011, 4, 1905–1928. [Google Scholar] [CrossRef]
  34. Mattoo, S.; Munchak, L.A.; Remer, L.A.; Sayer, A.; Patadia, F.; Hsu, N.C.; Levy, R. The Collection 6 MODIS aerosol products over land and ocean. Atmos. Meas. Tech. 2013, 6, 2989–3034. [Google Scholar] [CrossRef] [Green Version]
  35. Kim, S.-W.; Yoon, S.-C.; Kim, J.; Kim, S.-Y. Seasonal and monthly variations of columnar aerosol optical properties over east Asia determined from multi-year MODIS, LIDAR, and AERONET Sun/sky radiometer measurements. Atmos. Environ. 2007, 41, 1634–1651. [Google Scholar] [CrossRef]
  36. Tao, M.; Chen, L.; Su, L.; Tao, J. Satellite observation of regional haze pollution over the North China Plain. J. Geophys. Res. Space Phys. 2012, 117, 1–16. [Google Scholar] [CrossRef]
  37. Remer, L.A.; Kaufman, Y.J.; Tanre, D.; Mattoo, S.; Chu, D.A.; Martins, J.V.; Li, R.-R.; Ichoku, C.; Levy, R.C.; Kleidman, R.G.; et al. The MODIS Aerosol Algorithm, Products, and Validation. J. Atmos. Sci. 2005, 62, 947–973. [Google Scholar] [CrossRef] [Green Version]
  38. Huffman, G.J.; Adler, R.F.; Bolvin, D.T.; Nelkin, E.J. The TRMM Multi-Satellite Precipitation Analysis (TMPA). In Satellite Rainfall Applications for Surface Hydrology; Gebremichael, G., Hossain, F., Eds.; Springer: Dordrecht, The Netherlands, 2010; pp. 3–22. [Google Scholar]
  39. Kummerow, C.; Simpson, J.; Thiele, O.; Barnes, W.; Chang, A.T.C.; Stocker, E.; Adler, R.F.; Hou, A.; Kakar, R.; Wentz, F.; et al. The Status of the Tropical Rainfall Measuring Mission (TRMM) after Two Years in Orbit. J. Appl. Meteorol. 2000, 39, 1965–1982. [Google Scholar] [CrossRef]
  40. Dee, D.P.; Uppala, S.M.; Simmons, A.J.; Berrisford, P.; Poli, P.; Kobayashi, S.; Andrae, U.; Balmaseda, M.A.; Balsamo, G.; Bauer, P.; et al. The ERA-Interim reanalysis: Configuration and performance of the data assimilation system. Q. J. R. Meteorol. Soc. 2011, 137, 553–597. [Google Scholar] [CrossRef]
  41. Zhang, J.; Chen, J.; Xia, X.; Che, H.; Fan, X.; Xie, Y.; Han, Z.; Chen, H.; Lu, D. Heavy aerosol loading over the Bohai Bay as revealed by ground and satellite remote sensing. Atmos. Environ. 2016, 124, 252–261. [Google Scholar] [CrossRef]
  42. Tang, I.N. Chemical and size effects of hygroscopic aerosols on light scattering coefficients. J. Geophys. Res. Space Phys. 1996, 101, 19245–19250. [Google Scholar] [CrossRef]
  43. Alam, K.; Iqbal, M.J.; Blaschke, T.; Qureshi, S.; Khan, G. Monitoring spatio-temporal variations in aerosols and aerosol-cloud interactions over Pakistan using MODIS data. Adv. Space Res. 2010, 46, 1162–1176. [Google Scholar] [CrossRef]
  44. Chen, J.; Li, C.; Ristovski, Z.; Milic, A.; Gu, Y.; Islam, M.S.; Wang, S.; Hao, J.; Zhang, H.; He, C.; et al. A review of biomass burning: Emissions and impacts on air quality, health and climate in China. Sci. Total Environ. 2017, 579, 1000–1034. [Google Scholar] [CrossRef]
  45. Roy, P.; Sardar, A. SO2 Emission Control and Finding a Way Out to Produce Sulphuric Acid from Industrial SO2 Emission. J. Chem. Eng. Process Technol. 2015, 6, 230. [Google Scholar] [CrossRef]
  46. Cleveland, R.B.; Cleveland, W.S.; McRae, J.E.; Terpenning, I. STL: A seasonal-trend decomposition procedure based on loess. J. Off. Stat. 1990, 6, 3–73. [Google Scholar]
  47. Findley, D.F.; Monsell, B.C.; Bell, W.R.; Otto, M.C.; Chen, B.-C. [New Capabilities and Methods of the X-12-ARIMA Seasonal-Adjustment Program]: Reply. J. Bus. Econ. Stat. 1998, 16, 169–177. [Google Scholar] [CrossRef]
  48. Li, C.; Zhang, Q.; Krotkov, N.A.; Streets, D.G.; He, K.; Tsay, S.-C.; Gleason, J.F. Recent large reduction in sulfur dioxide emissions from Chinese power plants observed by the Ozone Monitoring Instrument. Geophys. Res. Lett. 2010, 37, 1–6. [Google Scholar] [CrossRef]
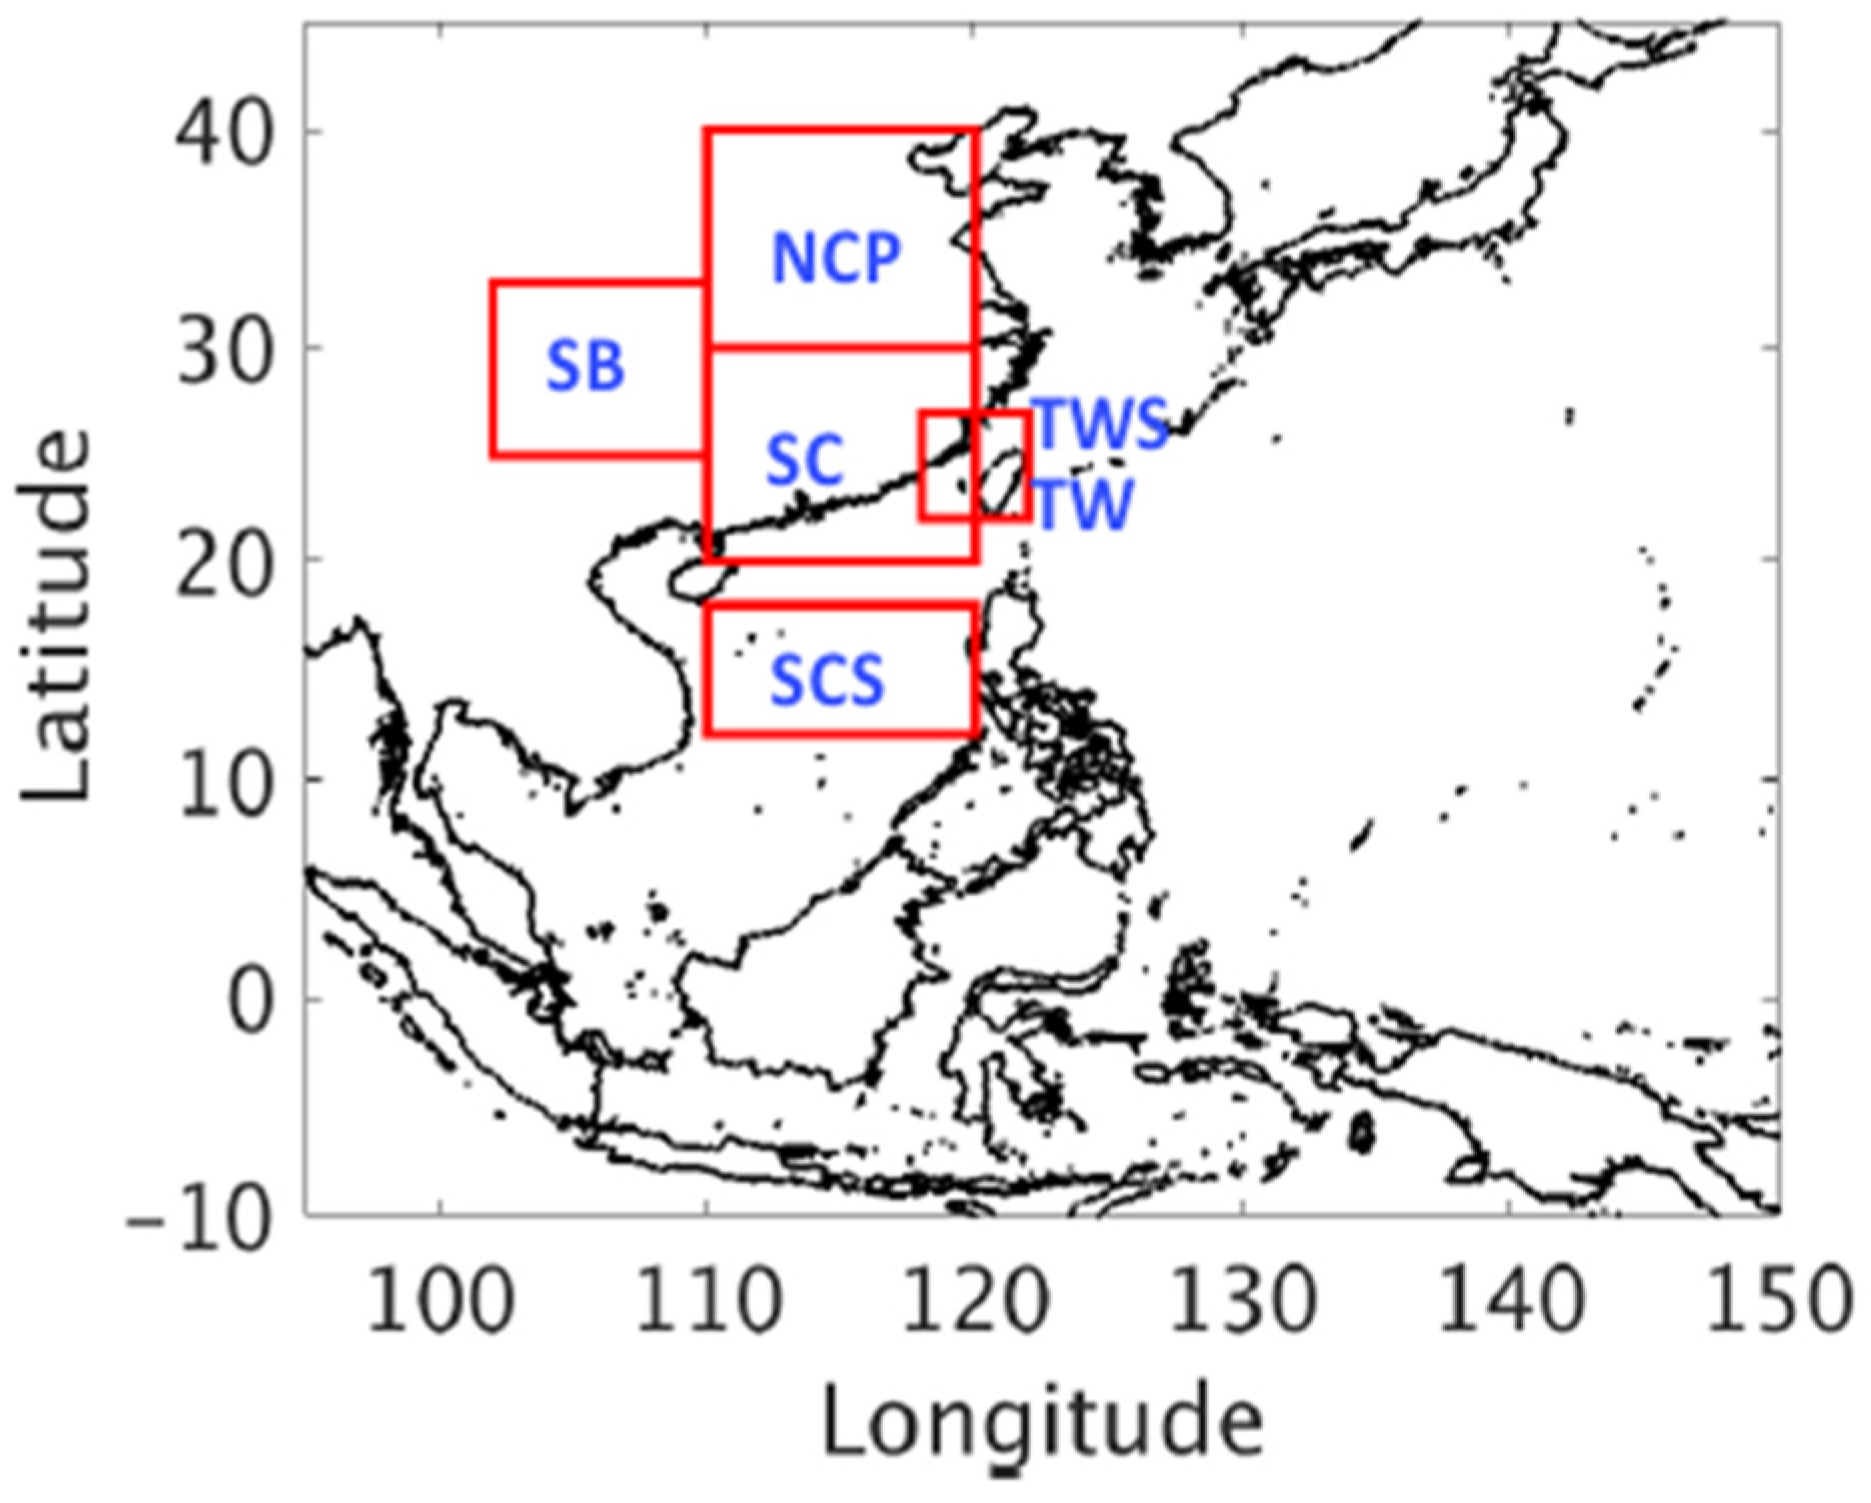
Figure 1. Summary of monitored regions, including North China Plain (NCP), Southeastern China (SC; land only), Sichuan Basin (SB), Taiwan Island (TW; land only), Taiwan Strait (TWS; sea only), and South China Sea (SCS).
Remotesensing 11 01738 g001
Figure 2. Spatial distribution of aerosol optical depth (AOD) from Aqua moderate-resolution imaging spectroradiometer (MODIS) for each season in East Asia 2005–2015.
Remotesensing 11 01738 g002
Figure 3. Spatial distribution of planetary boundary layer (PBL) sulfur dioxide (SO2) from Aura ozone monitoring instrument (OMI) for each season, 2005–2015. (Unit: Dobson units; 1DU= 2.69 ×10¹⁶ molecules cm−2)
Remotesensing 11 01738 g003
Figure 4. Spatial distribution of tropospheric nitrogen dioxide (NO2) from Aura OMI for each season.
Remotesensing 11 01738 g004
Figure 5. Long term trends of SO2, NO2, and AOD over the North China Plain. (ac) original with overall trend line, (df) seasonally adjusted time series with overall trend line, (gi) five-month moving average with pre-peak and post-peak trend lines and histogram for seasonally adjusted data, and (jl) yearly mean time series.
Remotesensing 11 01738 g005
Figure 6. Five-month moving averaged seasonally adjusted time series of SO2, NO2, and AOD over (ac) Southeastern China, (df) Sichuan Basin, (gi) Taiwan Island, (jl) Taiwan Strait, and (mo) South China Sea. The pre-peak and post-peak trend lines are indicated by red and green lines, respectively, for SO2 and AOD, and are indicated by red and yellow lines, respectively, for NO2. Besides, the seasonally adjusted data are also shown by histogram.
Remotesensing 11 01738 g006
Figure 7. Seasonal cycle of SO2, NO2, and AOD for each monitoring region. The error bar indicates the standard deviation of each seasonal or annual mean. Note that the scale of SO2 and NO2 for the NCP is different from that for the other regions.
Remotesensing 11 01738 g007
Figure 8. Summary of wind dependency of SO2, NO2, and AOD in North China Plain for each season. The shading color indicates the value of SO2, NO2, and AOD. The radial direction and radial distance represent the wind direction and wind speed at 850 mb, respectively.
Remotesensing 11 01738 g008
Figure 9. Summary of wind dependency of SO2, NO2, and AOD in Southeastern China for each season. The shading color indicates the value of SO2, NO2, and AOD. The radial direction and radial distance represent the wind direction and wind speed at 850 mb, respectively.
Remotesensing 11 01738 g009
Figure 10. Summary of wind dependency of SO2, NO2, and AOD in Taiwan Island for each season. The shading color indicates the value of SO2, NO2, and AOD. The radial direction and radial distance represent the wind direction and wind speed at 850 mb, respectively.
Remotesensing 11 01738 g010
Figure 11. Summary of wind dependency of SO2, NO2, and AOD in South China Sea for each season. The shading color indicates the value of SO2, NO2, and AOD. The radial direction and radial distance represent the wind direction and wind speed at 850 mb, respectively.
Remotesensing 11 01738 g011
Figure 12. Seasonal cycles of SO2, NO2, and AOD with precipitation and without precipitation in (a) North China Plain, (b) Southeastern China, (c) Sichuan Basin, (d) Taiwan Island, (e) Taiwan Strait, and (f) South China Sea, respectively. Precipitation is indicated by P and the pollutant data (SO2, NO2, and AOD) with and without precipitation are presented by the dashed and solid line, respectively. The SO2, NO2, and AOD data are shown by the blue, green, and red line, respectively. The seasonal cycle of precipitation is illustrated by the histogram for each monitoring regions.
Remotesensing 11 01738 g012
Figure 13. Summary of correlations between pollutants and meteorological conditions for six monitoring regions. When the effect of meteorological factor leads to the accumulation/depletion of pollutants, it is indicated by the red/blue arrow. Additionally, the effect of meteorological factor could be only significant on certain species of pollutant, which is shown within the brackets and is further highlighted by blue, red, and green color for SO2, NO2, AOD, respectively.
Remotesensing 11 01738 g013
Table 1. Summary of correlation coefficient of pollutants (sulfur dioxide (SO2), nitrogen dioxide (NO2), and aerosol optical depth (AOD)) to meteorological factors (850 hPa temperature, 850 hPa relative humidity (RH), and lower tropospheric stability (LTS)) for monitoring regions. Statistically significant (p-value < 0.05) correlation coefficient is marked with bold letters.
North China Plain (NCP)Taiwan Island (TW)
850 hPa Temp850 hPa RHLTS 850 hPa Temp850 hPa RHLTS
SO2−0.696−0.4570.527SO20.007−0.1750.086
NO2−0.885−0.6180.685NO2−0.871−0.3910.632
AOD0.3510.356−0.435AOD−0.082−0.086−0.358
Southeastern China (SC)Taiwan Strait (TWS)
850 hPa Temp850 hPa RHLTS 850 hPa Temp850 hPa RHLTS
SO2−0.542−0.5740.408SO20.2840.021−0.194
NO2−0.811−0.6560.743NO2−0.862−0.324−0.271
AOD0.050.153−0.442AOD−0.274−0.2670.244
Sichuan Basin (SB)South China Sea (SCS)
850 hPa Temp850 hPa RHLTS 850 hPa Temp850 hPa RHLTS
SO2−0.310−0.1270.128SO20.5440.117−0.473
NO2−0.328−0.420−0.167NO2−0.4890.3460.145
AOD0.5050.109−0.108AOD0.048−0.1920.083