Article

Evaluation of Different Methods for Estimating the Fraction of Sunlit Leaves and Its Contribution for Photochemical Reflectance Index Utilization in a Coniferous Forest

1
Key Laboratory of Agricultural Remote Sensing, Mnistry of Agriculture and Rural Affairs, Beijing 100081, China
2
Jiangsu Provincial Key Laboratory of Geographic Information Science and Technology, International Institute for Earth System Science, Nanjing University, Nanjing 210023, China
3
School of Environmental and Resources Science, Zhejiang A & F University, Lin’an 311300, China
4
Collaborative Innovation Center on Forecast and Evaluation of Meteorological Disasters, Jiangsu Key Laboratory of Agricultural Meteorology, School of Applied Meteorology, Nanjing University of Information Science & Technology, Nanjing 210044, China
*
Author to whom correspondence should be addressed.
Remote Sens. 2019, 11(14), 1643; https://doi.org/10.3390/rs11141643
Submission received: 12 June 2019 / Revised: 7 July 2019 / Accepted: 8 July 2019 / Published: 10 July 2019
(This article belongs to the Section Forest Remote Sensing)

Abstract

:
Proper determinations of light use efficiency (LUE) and absorbed photosynthetically active radiation (APAR) are essential for LUE models to simulate gross primary productivity (GPP). This study intended to apply the photochemical reflectance index (PRI) to track LUE or APAR variations in a subtropical coniferous forest using tower-based PRI and GPP measurements. To improve the ability of using PRI to track LUE or APAR, a two-leaf approach differentiating sunlit and shaded leaves was used to process the remote sensing and flux data. However, penumbra region, the ‘grey region’ between sunlit and shaded leaves, increases the difficulty for quantifying the fractions of sunlit and shaded leaves. Firstly, three methods with different ways on treating the penumbra region were investigated for estimating the fraction of sunlit leaves (PT). After evaluating the correlations between observed PRI (PRIobs) and inversely retrieved PRI (PRIinv) from estimated PT using the three methods, we found that treating a substantial portion of penumbra region as sunlit leaves was reasonable and using the ratio of canopy reflectance to leaf reflectance as PT was accurate and efficient. Based on this, we used the two-leaf approach to estimate the canopy-level PRI, aiming to evaluate the ability of using PRI as a proxy for LUE or APAR. Results showed that PRI was able to capture half-hourly and daily changes in LUE and APAR, and the two-leaf approach could enhance the correlations between PRI and both LUE and APAR at both half-hourly and daily time steps. Strong diurnal correlations (averaged R = 0.82 from 173 days) between two-leaf PRI and APAR were found on more than 80% days and the relationship between them over the whole study period was also very significant (R2 > 0.5, p <0.0001) regardless of different climate conditions, suggesting that the two-leaf PRI was probably a better proxy for APAR than for LUE at short-term scale as PRI mainly represented the absorbed energy allocated to photoprotection at short time scale and was a direct outcome driven by APAR. However, the scattered relationships of PRI with LUE and APAR indicated there were still many limitations in usage of PRI to accurately estimate physiological parameters affected by changing weather conditions, pigment pool size, etc., which needed further exploration.

1. Introduction

Remote sensing data have been widely used to calculate gross primary productivity (GPP) in combination with light use efficiency (LUE) models, which commonly express GPP as the product of the amount of absorbed photosynthetically active radiation (APAR) and a LUE term (GPP = LUE × APAR) [1,2]. LUE models are applied to estimation of GPP at the regional or global scale. However, the estimations of the two key input parameters of LUE models, i.e., LUE and APAR, remain challenging [3,4,5]. Proper determination of LUE and APAR are critical for calculating GPP using remote sensing data and LUE models.
In LUE models, stress-based approaches considering a maximum LUE downregulated by environmental factors, such as soil water, vapor pressure deficit (VPD), minimum and maximum air temperature [3,6,7,8,9,10,11,12]. However, such an assumption probably induces considerable uncertainties in determining GPP [13,14,15,16,17]. As canopy LUE is hard to be directly measured, flux-tower-based canopy LUE is treated as almost the ‘real’ LUE and is often used for evaluating or validating LUE models at stand and landscape scales [8,18,19,20,21,22]. It is estimated as GPP derived from net ecosystem CO2 exchange (NEE) measurements from eddy covariance technique divided by empirically estimated or observed APAR. Previous studies indicated that the fractions of diffuse and direct radiation absorbed by leaves were different [23,24,25], and that LUE was affected by both the quantity and composition of the incoming solar radiation [14,16,26]. With a given value of total incoming radiation, the canopy-level LUE generally increases with increasing fraction of diffuse radiation due to an increase in the canopy fraction that is receiving illumination without photo-saturation [15,17,26,27,28]. The calculation of APAR is suitable for clear sky conditions due to its theoretic basis on direct radiative transfer regime, but may overestimate APAR of sunlit leaves and underestimate that of shaded leaves when the fraction of diffuse radiation is high.
A promising method used for accurately estimating LUE is the photochemical reflectance index (PRI = (R531 − R570)/(R531 + R570), where R531 and R570 are canopy reflectance at wavelengths 531 and 570 nm, respectively) [29]. The xanthophyll cycle, which is part of the leaf photoprotective mechanisms and functionally related to photosynthetic rates, is closely correlated with the rate of dissipation of excess absorbed energy as heat [30]. During this cycle, the xanthophyll pigment diepoxide violaxanthin is converted rapidly via the intermediate monoepoxide antheraxanthin into the epoxide-free form zeaxanthin by the enzyme violaxanthin de-epoxidase, known as a de-epoxidation sequence [30,31,32,33,34]. As the reflectance change at 531 nm is caused by the appearance of zeaxanthin, PRI is currently considered as the most representative index of the xanthophyll cycle [29,35,36]. As we know, energy absorbed by plants (i.e., APAR) is distributed to three parts (i.e., photochemistry, fluorescence and photoprotection dissipating as heat), and these three portions are competitive. PRI being the proxy for the portion of photoprotection shows the potential to indicate LUE which is an outcome of the competition, as well as APAR which is an input of the competition [22].
Strong correlations were observed between PRI and LUE for individual species, and significant but much weaker correlations were observed for several species as a group [37,38,39,40,41,42,43,44]. However, the relationship between PRI and LUE remains elusive because of the complex influence of canopy architecture [38,42,45,46,47,48]. Even worse, PRI may be decoupled with LUE when different inherent mechanisms driving PRI and LUE variations under some circumstances [49,50,51]. Under severe stress conditions, some other photoprotection mechanism like photorespiration is also involved in as a sink of excess energy as heat dissipation is not enough for stress protection [52,53]. Decoupling between PRI and photoprotection might occur in response to different sources of stress, mostly reported as severe drought stress and high light intense [49,51], that further make the relationship between PRI and LUE break down [50], limiting the ability of PRI to indicate LUE.
Estimation of APAR of a vegetation canopy is also challenging. Considerable research has been conducted using vegetation indices to calculate the fraction of photosynthetically active radiation absorbed by a canopy (FPAR) and then APAR with photosynthetically active radiation (PAR) mostly from reanalysis remote sensing data [7,54,55]. With products from a moderate resolution imaging spectroradiometer (MODIS), Zhang et al. [56,57,58] presented a method to retrieve the fraction of PAR absorbed by chlorophyll contained throughout the canopy (fPARchl) with the advanced radiative transfer model PROSAIL2 and a type of Markov Chain Monte Carlo (MCMC) estimation procedure, which opens a new perspective for accurate estimation of APAR used for photosynthesis. However, estimation of FPAR was sensitive to two structural parameter (i.e., leaf area index (LAI) and the average leaf inclination angle (ALA)) and illumination conditions [59], and estimation of PAR was also of uncertainty [60,61], both of which introduced errors in estimation of APAR. To our limited knowledge, no works have been conducted to estimate APAR directly using remote sensing data. As variation of PRI is directly driven by absorbed energy while LUE changes from more processes [62,63], to some extent PRI is assumed to be a better proxy for APAR than for LUE if the effects of non-physiological factors on PRI are reduced.
To reduce the effects of non-physiological factors on PRI, such as sun-target-view geometry, background reflectance, diffuse sky radiation, and canopy structure, many works have been done in last several years. Hall et al. [64,65] demonstrated that directional changes in observed canopy PRI at a given time interval can be attributed almost entirely to shadow fraction (αs) variations. The partial derivative of PRI with respect to αs (∂PRI/∂αs) was used to indicate the relative light use efficiency Δε (relative to unstressed, where the unstressed value Δε = 1.0, so that Δε ranges from 0 to 1) [64,65]. However, this assessment of αs could only be used under clear sky conditions, since the model does not account for diffuse radiation. [66]. The ratio of direct to total irradiance should certainly be considered [26], and simpler and more universal methods by separating the canopy into sunlit and shaded parts under various weather conditions should be developed for LUE models.
Separating sunlit and shaded leaves is vital to accurately predict canopy photosynthesis due to their different light responses [67,68]. Sunlit leaves are illuminated by both the direct and diffuse radiation while shaded leaves are illuminated by only diffuse radiation [69], however, quantifying the fractions of these two parts is hard to achieve. Previous studies could only estimate sunlit and shaded leaf areas of the whole canopy using Chen’s method based on solar zenith angle and measurements of leaf area index [23]. Geometric-optical models can be used to simulate the fractions of sunlit and shaded leaves [70,71,72] but need many accurate input parameters and some assumptions. Zhang et al. [73] developed a simple two-leaf approach to separate a canopy-level PRI observation into sunlit and shaded PRI values using a ratio of observed canopy reflectance to leaf reflectance. The two-leaf canopy PRI (PRIt) was calculated as the sum of sunlit and shaded PRI weighted by their respective sunlit and shaded LAI, based on the principle of linear decomposition of canopy reflectance [70]. Tower-based flux and multi-angle PRI measurements were made over a subtropical forest to develop and validate the algorithm. At both half-hourly and daily time steps, PRIt can effectively improve (>60%) its correlations with LUE derived from the tower flux measurements over the big-leaf PRI taken as the arithmetic average of the multi-angle measurements in a given time interval.
Even though the definitions of sunlit and shaded leaves are clear, except for these two parts, the penumbra region (part sun visible) is also an important element of the canopy since the sun is a solar disc with a finite size instead of a beam with parallel rays [74]. The penumbra region is the ‘grey region’ between sunlit and shaded leaves, and can be treated as partially sunlit and partially shaded blurring the boundary between sunlit and shaded leaf. Penumbra effect would influence the canopy photosynthesis and stomatal conductance to some extent. The method for estimating the fraction of sunlit leaves presented by Zhang et al. [73] fitted the definition of sunlit leaves; however, this method included a substantial portion of the penumbra region into sunlit leaves, which needed to be verified if the fraction of sunlit leaves is overestimated. This study aimed at testing three methods for estimating the fraction of sunlit leaves that were seen by a remote sensing sensor, which were further used to calculate two-leaf canopy PRI. Comparisons were made among the three methods including two models for estimating the fraction of sunlit leaves based on Zhang’s method [73] with different hypotheses on the way to treat penumbra region (hypothesis I: a substantial portion of penumbra region is treated as sunlit leaves; and hypothesis II: a substantial portion of penumbra region suffers a much lower level of light stress than sunlit leaves and similar as shaded leaves), and an geometrical-optical model, which was a novel tool to simulate the fractions of four components of the canopy (i.e., sunlit and shaded leaves and sunlit and shaded backgrounds) [72]. These models were tested against the tower-based flux and PRI datasets in order to find a simple and reliable two-leaf model for improving the ability of PRI measurements for tracking LUE as well as APAR of plant canopies.

2. Materials and Methods

2.1. Field Measurements

We observed the CO2 flux and multi-angle canopy spectral reflectance of a sub-tropic mature evergreen coniferous forest stand on a tower at Qianyanzhou Experimental Station (QYZ) in the southeast of China. The CO2 flux was measured using eddy covariance (EC) method at 39.6 m height flux tower [75]. Half-hourly flux data was provided and processed to derive GPP from measured NEE with daytime ecosystem respiration (Re) estimated with an empirical equation fitted using nighttime NEE and temperature measurements [76,77], as follows:
G P P = N E E + R e
Multi-angle spectral data were acquired from iAMSPEC system mounted at 31 m on the same tower for EC measurements [73,78], which could concurrently measure incoming solar irradiance and reflected canopy radiance every 2~3 s all day using a dual-channel spectrometer Unispec-DC (PP Systems, Amesbury, MA, USA). A rotator device PTU-D46 (FLIR Systems, Goleta, CA, USA) was used to change view angles to obtain multi-angle canopy reflectance. The view azimuth angle changed at 10° angular step width with in a range from 45° to 325° (defined from geodetic north), and an observation cycle was completed in 15 minu with four view zenith angles (firstly fixed at the instantaneous solar zenith angle to finish a horizontal cycle and then at (37°, 47°, 57°) or (42°, 52°, 62°) for each view azimuth angle (backward- and forward-looking, changing alternatively) alternatively between two 15-min cycles). After dark current (DC) and calibration of sensors, canopy reflectance (Rcan) was calculated as observed canopy reflected radiance divided by solar radiance:
R c a n = ( R r R r D C ) × ( R i R i D C ) ( R i R i D C ) × ( R r R r D C )
where Ri and Rr are the irradiance and the radiance of the canopy sensor, respectively; the single quote mark means data measured from the reference target. Then PRI was calculated as [73,78]:
P R I = R 531 R 570 R 531 + R 570
The canopy-level big-leaf PRI (PRIb) was simply the arithmetic average of all 2–3 s intervals of observed multi-angle PRI values when the view zenith angle is less than 63° within half an hour to match the temporal scale of half-hourly LUE.
Available bioclimatic measurements were also made around the same flux tower, mainly including photosynthetically active radiation (PAR, MJ/m2/hh), air temperature (Ta, °C), vapor pressure deficit (VPD, kPa), relative humidity (Rh), wind direction, wind speed (m/s) and precipitation (mm). The green leaf area index (LAI) of the canopy was 5.8 for the entire study period, and the clumping index (Ω) was 0.57 estimated from hemispherical photos for this forest. Data from day of year (DOY) 101 to 275 in 2013 were used in this study.

2.2. Calculations of APAR and LUE

APAR was calculated using the algorithm in a two-leaf LUE model (TL-LUE) developed by He et al. [15]. This algorithm differentiates transfers of diffuse and direct radiation within a canopy. Sunlit leaves absorb both direct and diffuse radiation, while shaded leaves are only exposed to diffuse radiation. The total LAI of the canopy can be separated into sunlit LAI (Lsun) and shaded LAI (Lsh) according to half-hourly solar zenith angle (θ) based on the methods presented by Chen et al. [23,24]. APAR on per unit leaf area was calculated separately for sunlit (APARsun) and shaded leaves (APARsh) (detailed derivation can be found in Appendix A), hence the two-leaf APAR and LUE were calculated as [15,73,78]:
L s u n = 2 c o s θ × ( 1 e 0.5 Ω × L A I / c o s θ )
L s h = LAI L s u n
A P A R = A P A R s u n × L s u n + A P A R s h × L s h
L U E = G P P A P A R

2.3. Two-Leaf PRI Model

Treating the canopy as two big leaves, i.e., sunlit and shaded leaves, and considering their distinct difference of absorbed radiation and PRI, a two-leaf approach was developed to derive PRIt using multi-angle observations.
To derive fractions of observed sunlit and shaded leaves, observed canopy reflectance (Rcan) for each view angle was separated to four components on the basis of a four-scale bidirectional reflectance model [70], as following:
R c a n = R T × P T + R G × P G + R S × P S + R Z × P Z
where PT and PS are the fractions of sunlit and shaded leaves, respectively; PG and PZ are the fractions of sunlit and shaded background, respectively; RT and RS are the reflectance of sunlit and shaded leaves, respectively; RG and RZ are the reflectance of sunlit and shaded background, respectively. The fractions of four components are irrelevant with respect to wavelength, whereas reflectance of these four elements is wavelength dependent.

2.3.1. Estimations of Observed Fraction of Background

The observed fraction of background (PVG) at a given view angle (θv) is composed of PG and PZ, which are hard to be estimated separately from observations. Assuming the background had no vegetation and its reflectance was constant, PVG, which was also the gap fraction from the viewer direction, could be totally calculated based on the methods presented by Chen et al. [70] as:
P V G = e 0.5 Ω × L A I / c o s θ V

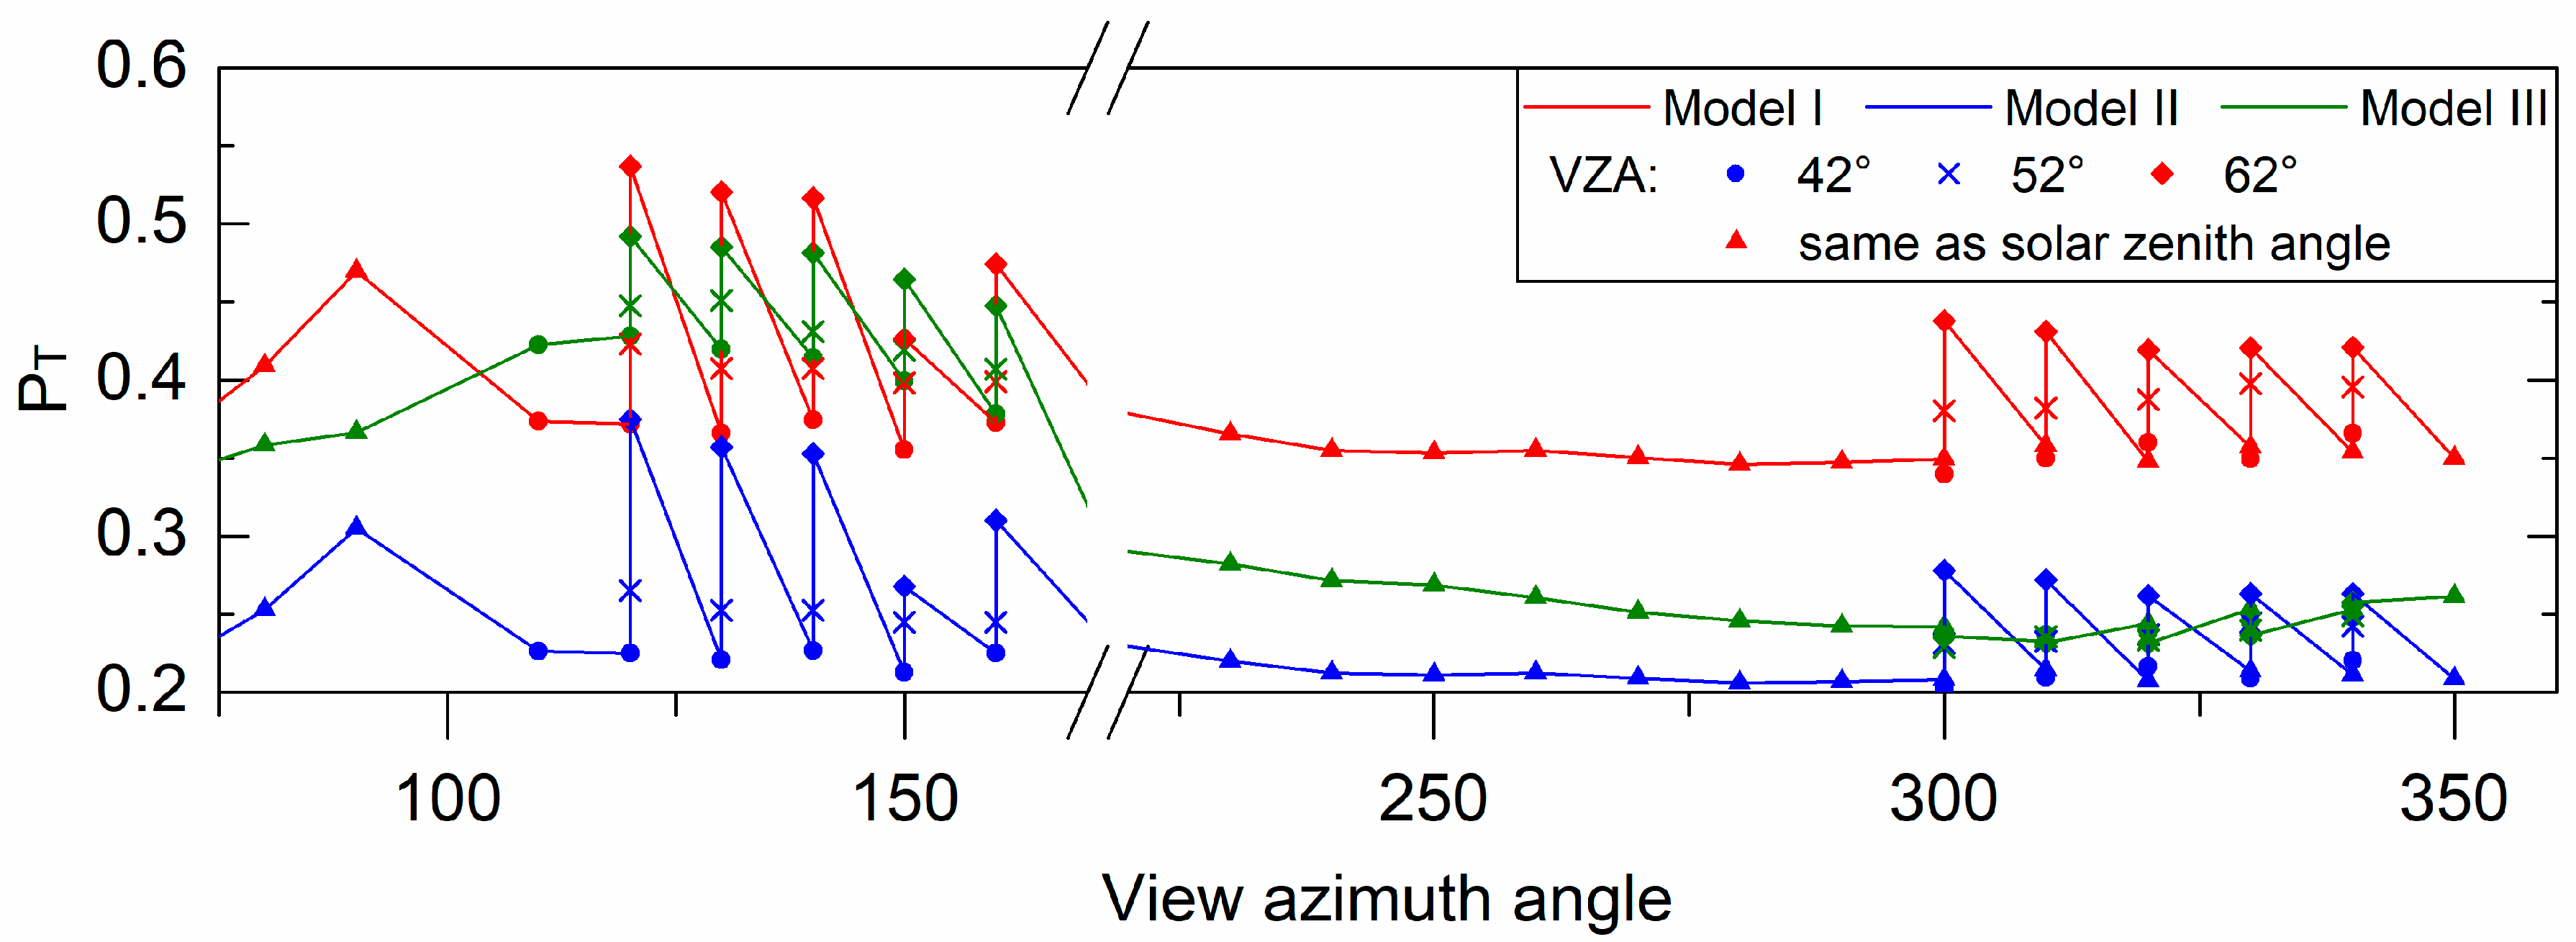
2.3.2. Estimations of PT and PS

According to Equation (8), the sum of the fractions of sunlit and shaded leaves and sunlit and shaded backgrounds is unit, thus the fraction of shaded leaves (PS) was:
P S = 1 P T P V G
Estimation of canopy PT was based on both canopy and leaf reflectances presented by Zhang et al. [73]. The ratio of the observed canopy reflectance (Rcan) to leaf reflectance (Rleaf) at 670 nm (the multi-scattering and the contribution from background in this band is the lowest), defined as RSL, was taken to be approximately equal to the degree to which the canopy was exposed to radiation. Determination of the observed PT at each view angle was tested on two different strategies of whether or not considering the contribution to canopy reflectance from shaded leaves, which were only exposed to diffuse radiation. A hybrid geometric-optical model (GOST) with ray tracing method was also tested to estimate PT, which was also treated as a reference to exam PT calculated from the other two methods, as GOST was a novel model to simulate the fractions of the four components of a canopy presented in equation (8).
Model I: Treating PT as the fraction of the canopy exposed to total radiation.
According to the definition of sunlit leaf, a substantial portion of penumbra region was treated as sunlit leaves. Hypothesizing this part of penumbra region suffered the same level of light stress on photosynthesis as sunlit leaves, without separating direct and diffuse radiation, PT in this model (PT,I) was equal to RSL:
P T , I = R S L
This model could represent the total degree of leaves exposed to radiation. It satisfied the assumption that photosynthesis often saturates under high radiation while it was supposed to be non-saturate under diffuse radiation. However, as the canopy reflectance was composed with reflectances of both sunlit and shaded leaves, RSL might include the contribution from shaded leaves of a part of penumbra region. Therefore, this model was hypothesized overestimating the real PT.
Model II: Treating PT as the fraction of the canopy exposed to total radiation subtracted by the fraction of shaded leaves exposed to diffuse radiation.
Hypothesizing a substantial portion of penumbra region suffered a much lower level of light stress than sunlit leaves and similar to shaded leaves, we further hypothesized that the direct radiation contributes to the light stress while the diffuse radiation cause none light stress considering the penumbra effect. Therefore, PT in this model (PT,II) was the degree of the canopy exposed to direct radiation, and could be treated as the ratio of canopy reflectance from direct incident radiation (instead of total incident radiation) to leaf reflectance. With the ratio of diffuse radiation to total radiation (Rdif), the fraction of shaded leaves was subtracted from RSL to calculate PT,II. The canopy reflectance come from direct and diffuse radiation, can be expressed as:
R d i f = P A R d i f P A R
R c a n = R c a n , d i r + R c a n , d i f
where PARdif is diffuse PAR, of which calculation can be found in Appendix A; Rcan,dir and Rcan,dif are canopy reflectances from direct and diffuse incident radiation, respectively. Therefore,
P T , I I = R c a n P S × R c a n , d i f R l e a f
As Rcan can be divided into Rcan,dir and Rcan,dif by the direct and diffuse ratios to total radiation, Rcan,dif was:
R c a n , d i f = R d i f × R c a n
thus, with equation (10),
P T , I I = R S L ( 1 R d i f × P S ) = R S L ( 1 R d i f × ( 1 P T , I I P V G ) )
Finally, PT,II can be finally expressed as
P T , I I = R S L ( 1 R d i f + R d i f × P V G ) 1 R d i f × R S L
This model also satisfied the definition that sunlit leaves absorbed both direct and diffuse radiation while shaded leaves only absorbed diffuse radiation. However, as the real sunlit and shaded leaves were not always easy to distinguish, this model treated a substantial portion of penumbra region as shaded leaves, hence we hypothesized that it may over-calculate the fraction of shaded leaves and hence underestimate the real PT.
Model III: Modeling PT using a hybrid geometric-optical model with ray tracing method for sloping terrains (GOST) [71,72,79].
In the geometric-optical model for sloping terrains (GOST), the shape of trees was simplified as adiactinic cylinder and cone, and there was no penumbra region within the canopy. It assumed a Neyman distribution, also called double-Poisson distribution, of the trees. A simplified ray tracing method was designed for simulating the ratio of the viewed sunlit leaves to all viewed leaves (SPT). The basic idea of this method was first to describe the foliage spatial and angular distributions, and then to penetrate a view line into the canopy. If the view line does not touch any leaves in the forest scene, it was not considered. Otherwise, the first intersection point (FIP) of the view line and leaves could be found. If there was no other leaves shaded the FIP in the sunlight direction, it was a sunlit point in the view direction. If there were other leaves between the sun’s position and the FIP, the FIP was the shaded point. Through repeating these steps many times, the probability of viewing sunlit leaves could be separated from the viewed leaves.
After all the ray tracing procedures, the percentage of sunlit points SPT reached by the view lines in the view direction could be simulated. The fraction of sunlit leaves in the canopy was
P T , I I I = S P T ( 1 P V G )
To drive GOST, several canopy structure parameters were measured and presented in Table 1.

2.3.3. Estimation of Two-Leaf PRI

As PRI of the background with no vegetation was presumed to be constant [80] and the light condition was supposed to be steady, radiation and PRI of sunlit (PRIsun) and shaded (PRIsh) leaves were assumed to be constant within 15 min. Thus, PRIobs at different view angles varies only because of the variable sunlit and shaded portions of the canopy, and then could be separated into two components:
P R I o b s = P T × P R I s u n + P S × P R I s h
PRIsun and PRIsh were estimated with multi-angle observations acquired within 15 min using least squares regression.
Finally, PRIt was calculated with the weights of Lsun and Lsh:
P R I t = P R I s u n × L s u n L A I + P R I s h × L s h L A I

2.4. Statistical Data Analysis

All data measured with the solar zenith angle less than 75° and the view zenith angle less than 63° were selected to reduce the influence of low quality of measurements when solar and view zenith angle were too large. In total, there were nearly one hundred thousand of 2–3 s intervals observed samples of multi-angle reflectance and PRI obtained under different weather conditions. To test the three methods for estimating the fraction of sunlit leaves, samples within each 15-min observation were separately analyzed. Once we derived PRIsun, PRIsh, PT and PS from the three models, PRI values at each view angle were inversely calculated (PRIinv) using reversed Equation (19), and then compared with each observed PRI (PRIobs) within 15 min. The linear correlations coefficients between PRIinv and PRIobs within 15-min intervals were calculated. The frequencies of correlations coefficients at different significant levels were used to indicate the accuracy of the three models.
Correlations between PRI and LUE or APAR at both half-hourly and daily temporal scales were presented to evaluate the ability of PRIt to indicate LUE and APAR against that of PRIb. For diurnal relationship analysis, half-hourly PRI, LUE and APAR obtained from 7:00 to 17:30 local time were selected to process linear regression. Half-hourly PRI was averaged from two 15-min PRI. For the whole study period, the linear and non-linear (exponential) relationships of PRI with LUE and APAR were assessed for discussing the utilization of PRI to indicate LUE and APAR at both half-hourly and daily scales. Statistical analyses were performed using MATLAB and Microsoft Excel software.

3. Results and Discussion

3.1. Test of Three Methods for Estimating the Fraction of Sunlit Leaves

With the three models, three sets of PT were derived from multi-angle datasets. Figure 1 showed the variations of three sets of PT with different view angles within an observation cycle from 10:45 to 11:00 on April 11. PT from model I and model II showed quite similar trends but totally different values. Considering the penumbra effect, a substantial portion of penumbra was considered as shaded leaves in model II, leading to the much lower values of PT,II than that of PT,I. PT from model III exhibited a larger variation range than the other two models, with a slightly different variation trend. High values of PT,III matched those of PT,I well, while low values were close to those of PT,II. High values of PT were observed from backward looking (sensor pointing north) and low values were observed from forward looking (sensor pointing south). At the same view azimuth angle, larger view zenith angle had bigger values of PT. PT,III from forward looking had low values with changing view zenith angle. Model III assumed a uniform canopy and used statistical methods to simulate PT [70,79], which meant that it needed a large sample for satisfying this assumption. This indicated that model III cannot capture small structural changes from the real canopy, which was heterogeneous, so that the variation of PT,III was different from the other two.
The correlations between observed PRI (PRIobs) and inversely retrieved PRI (PRIinv) from estimated PT were used to evaluate the accuracy of three models. The frequency of the correlations at different significance levels was a proxy for accuracy. Figure 2 showed variations of the frequencies of the models I and II over the study period (number of measurements = 5700). PRIinv from both models matched observed PRI well (>70% samples) with a significance level of 95% over the entire period. Model I performed marginally better than model II either in each month or over the entire period.
The solid lines in Figure 2 showed variations of the mean residuals (multiplied by 100) throughout the six months, which include estimation errors and PRI of sunlit background (shaded background was approximately 0), as PRI of background was presumed to be constant and not taken into account. Residuals in model I were considerably smaller than those in model II, indicating model I was better than model II. Moreover, the difference of PRI between sunlit and shaded background in the dry season (from July to September) [78] was theoretically higher than that of wet background in the rainy season (from April to June), indicating that residuals should be large in the dry season [73]. In model I, mean residuals in July and August were larger than other months. The mean residual in September was small probably due to large solar zenith angle and more litter cover on the ground. However, in model II, a big part of the penumbra region was treated as shaded leaves, so that the fraction of leaves exposed to diffuse radiation contributed to PS. Residuals in model II varied in a large range and were much larger in the rainy season than in the dry season, proving that model II was of lower accuracy due to underestimated PT especially in the rainy season when the fraction of diffuse radiation was high. As in model II, fThis further indicated that the penumbra region was better represented by sunlit leaf conditions under light stress, and model I had a higher accuracy.
As the ray tracing treatment of GOST was computationally demanding, model III was more computationally intensive than the other two models by several orders of magnitude to simulate PT and PS. Therefore, only data acquired in April were processed using model III to compare its accuracy with those of the other two models. Figure 3 showed differences between the frequencies of the three models in April. The accuracy of model III was higher than the other two models under most significant levels. However, its leading position faded away with increases of significance level from 0.05 to 0.001. Its accuracy was lower than that of model I at significance level of 0.0001. The mean residuals (multiplied by 1000) of PRIinv of model III were larger than residuals of model I but smaller than those of model II.
The enumbra region occupied a substantial portion of the conifer forest canopy. To accurately estimate the fraction of sunlit leaves in the canopy, the way to treat penumbra region was vital for the estimation accuracy [74]. Models I and II treated penumbra region differently, resulting in quite different PT values (Figure 1). Model III made some assumptions so that penumbra region does not exist in the model. Since there was no useful method to quantify the penumbra region for now, we made two different hypotheses for two models to justify how we should make the boundary between sunlit and shaded leaves clear. By testing the accuracy of inversely retrieved PRI from estimated using three models, we found that model II did not perform as well as the other two models. Model III was generally the best one of higher accuracy compared to model I, which indicated that GOST was a novel tool to simulate the fractions of the four components of the canopy. However, model III treated the canopy as a uniform surface which caused some differences from the real trees distribution in simulating PT and PS at different view angles. Furthermore, model III was very computationally demanding and required six months to process six months of data using a high grade workstation while model I was computationally efficient only needing tens of minutes with comparable high accuracy. On the other hand, even though model I may introduce some errors from hypotheses [73], the similar accuracy of model I with model III proved the effectiveness of the method to retrieve two-leaf canopy PRI [73]. Results presented by Middleton et al. [81] indicated the PRI values of penumbra region (sunlit-shaded mixed group) were more closer to sunlit leaves than shaded leaves. Likewise, our results also demonstrated that the penumbra region mostly should be treated as sunlit leaves. Therefore, we found model I is the optimal two-leaf approach to calculate canopy-level PRI.

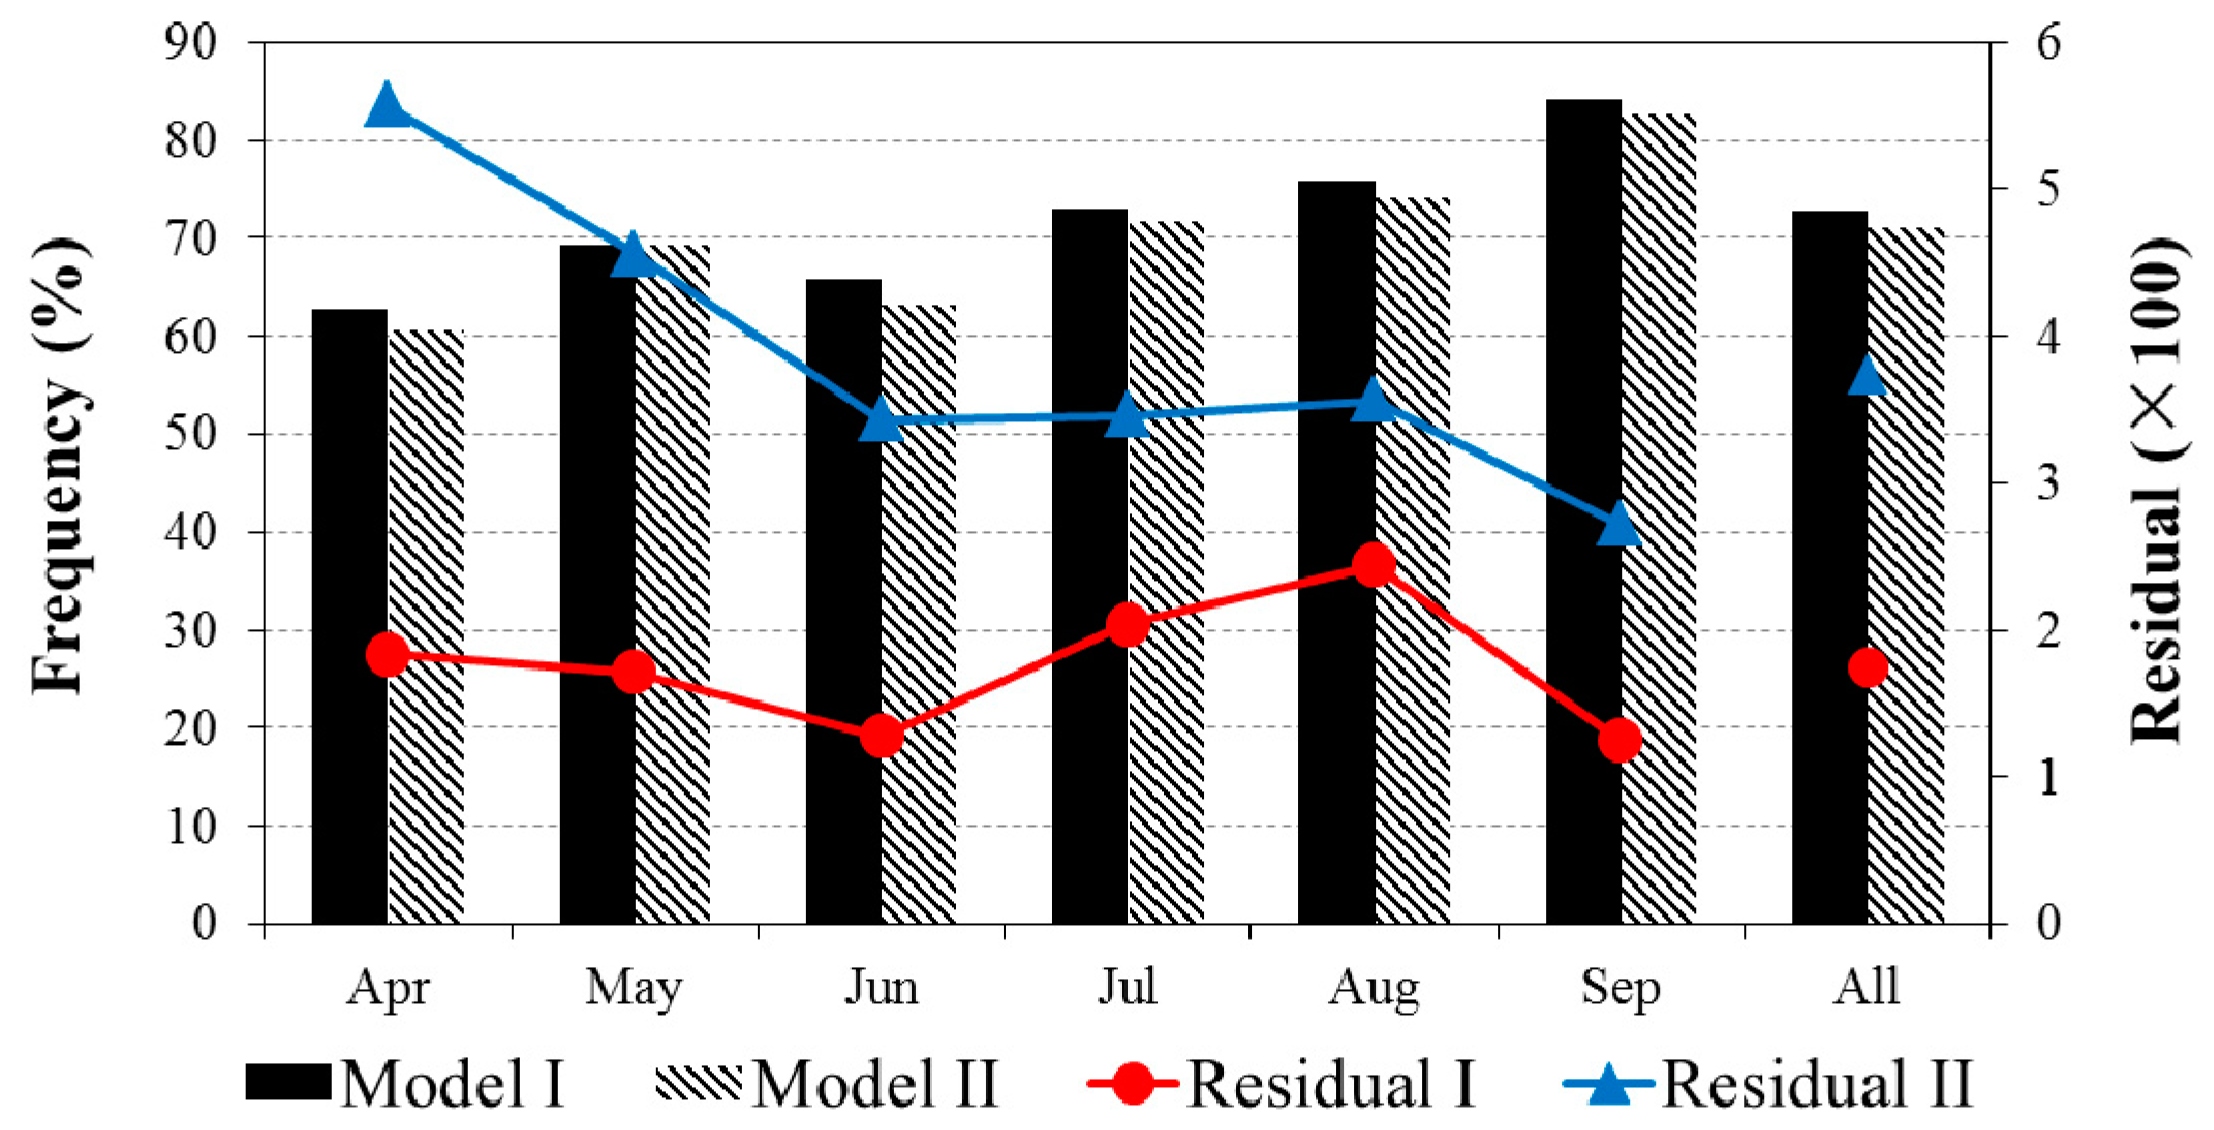
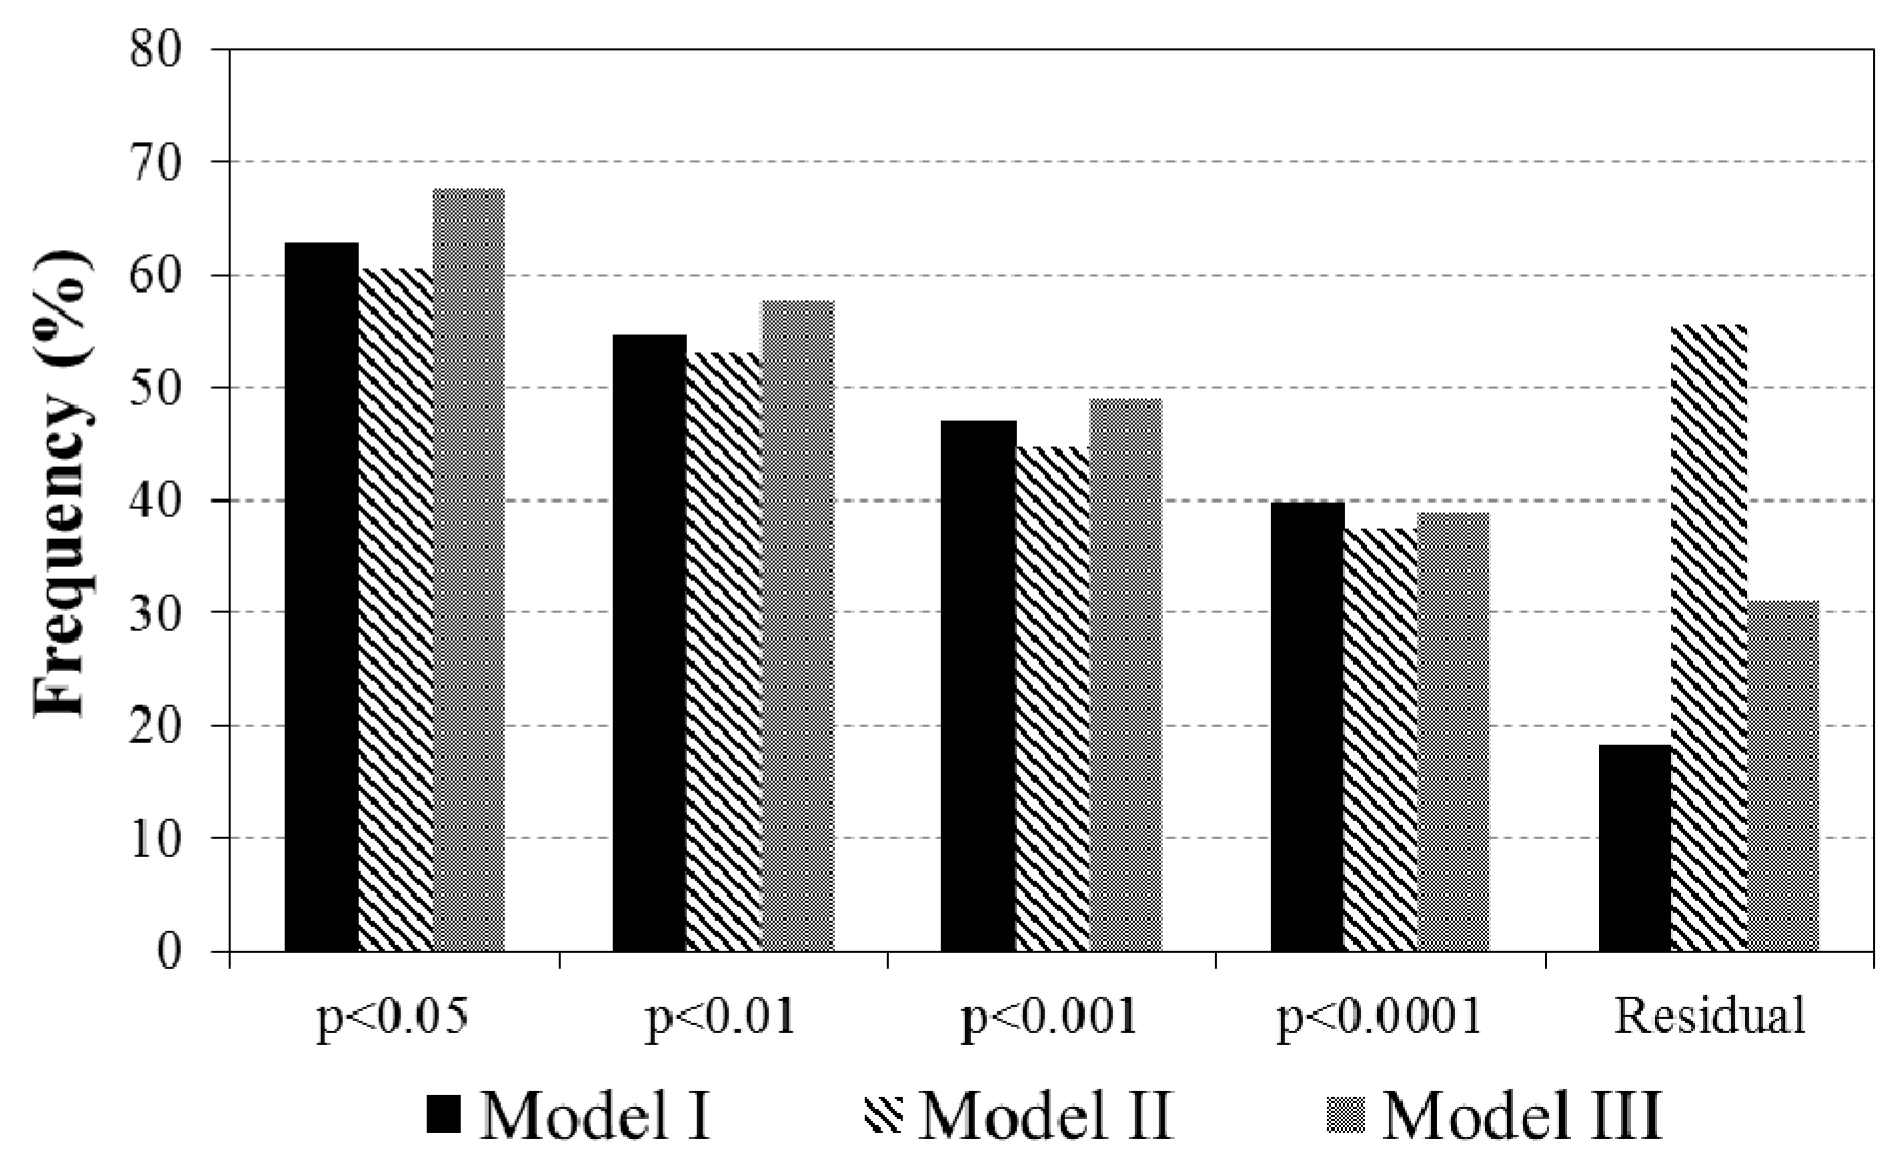
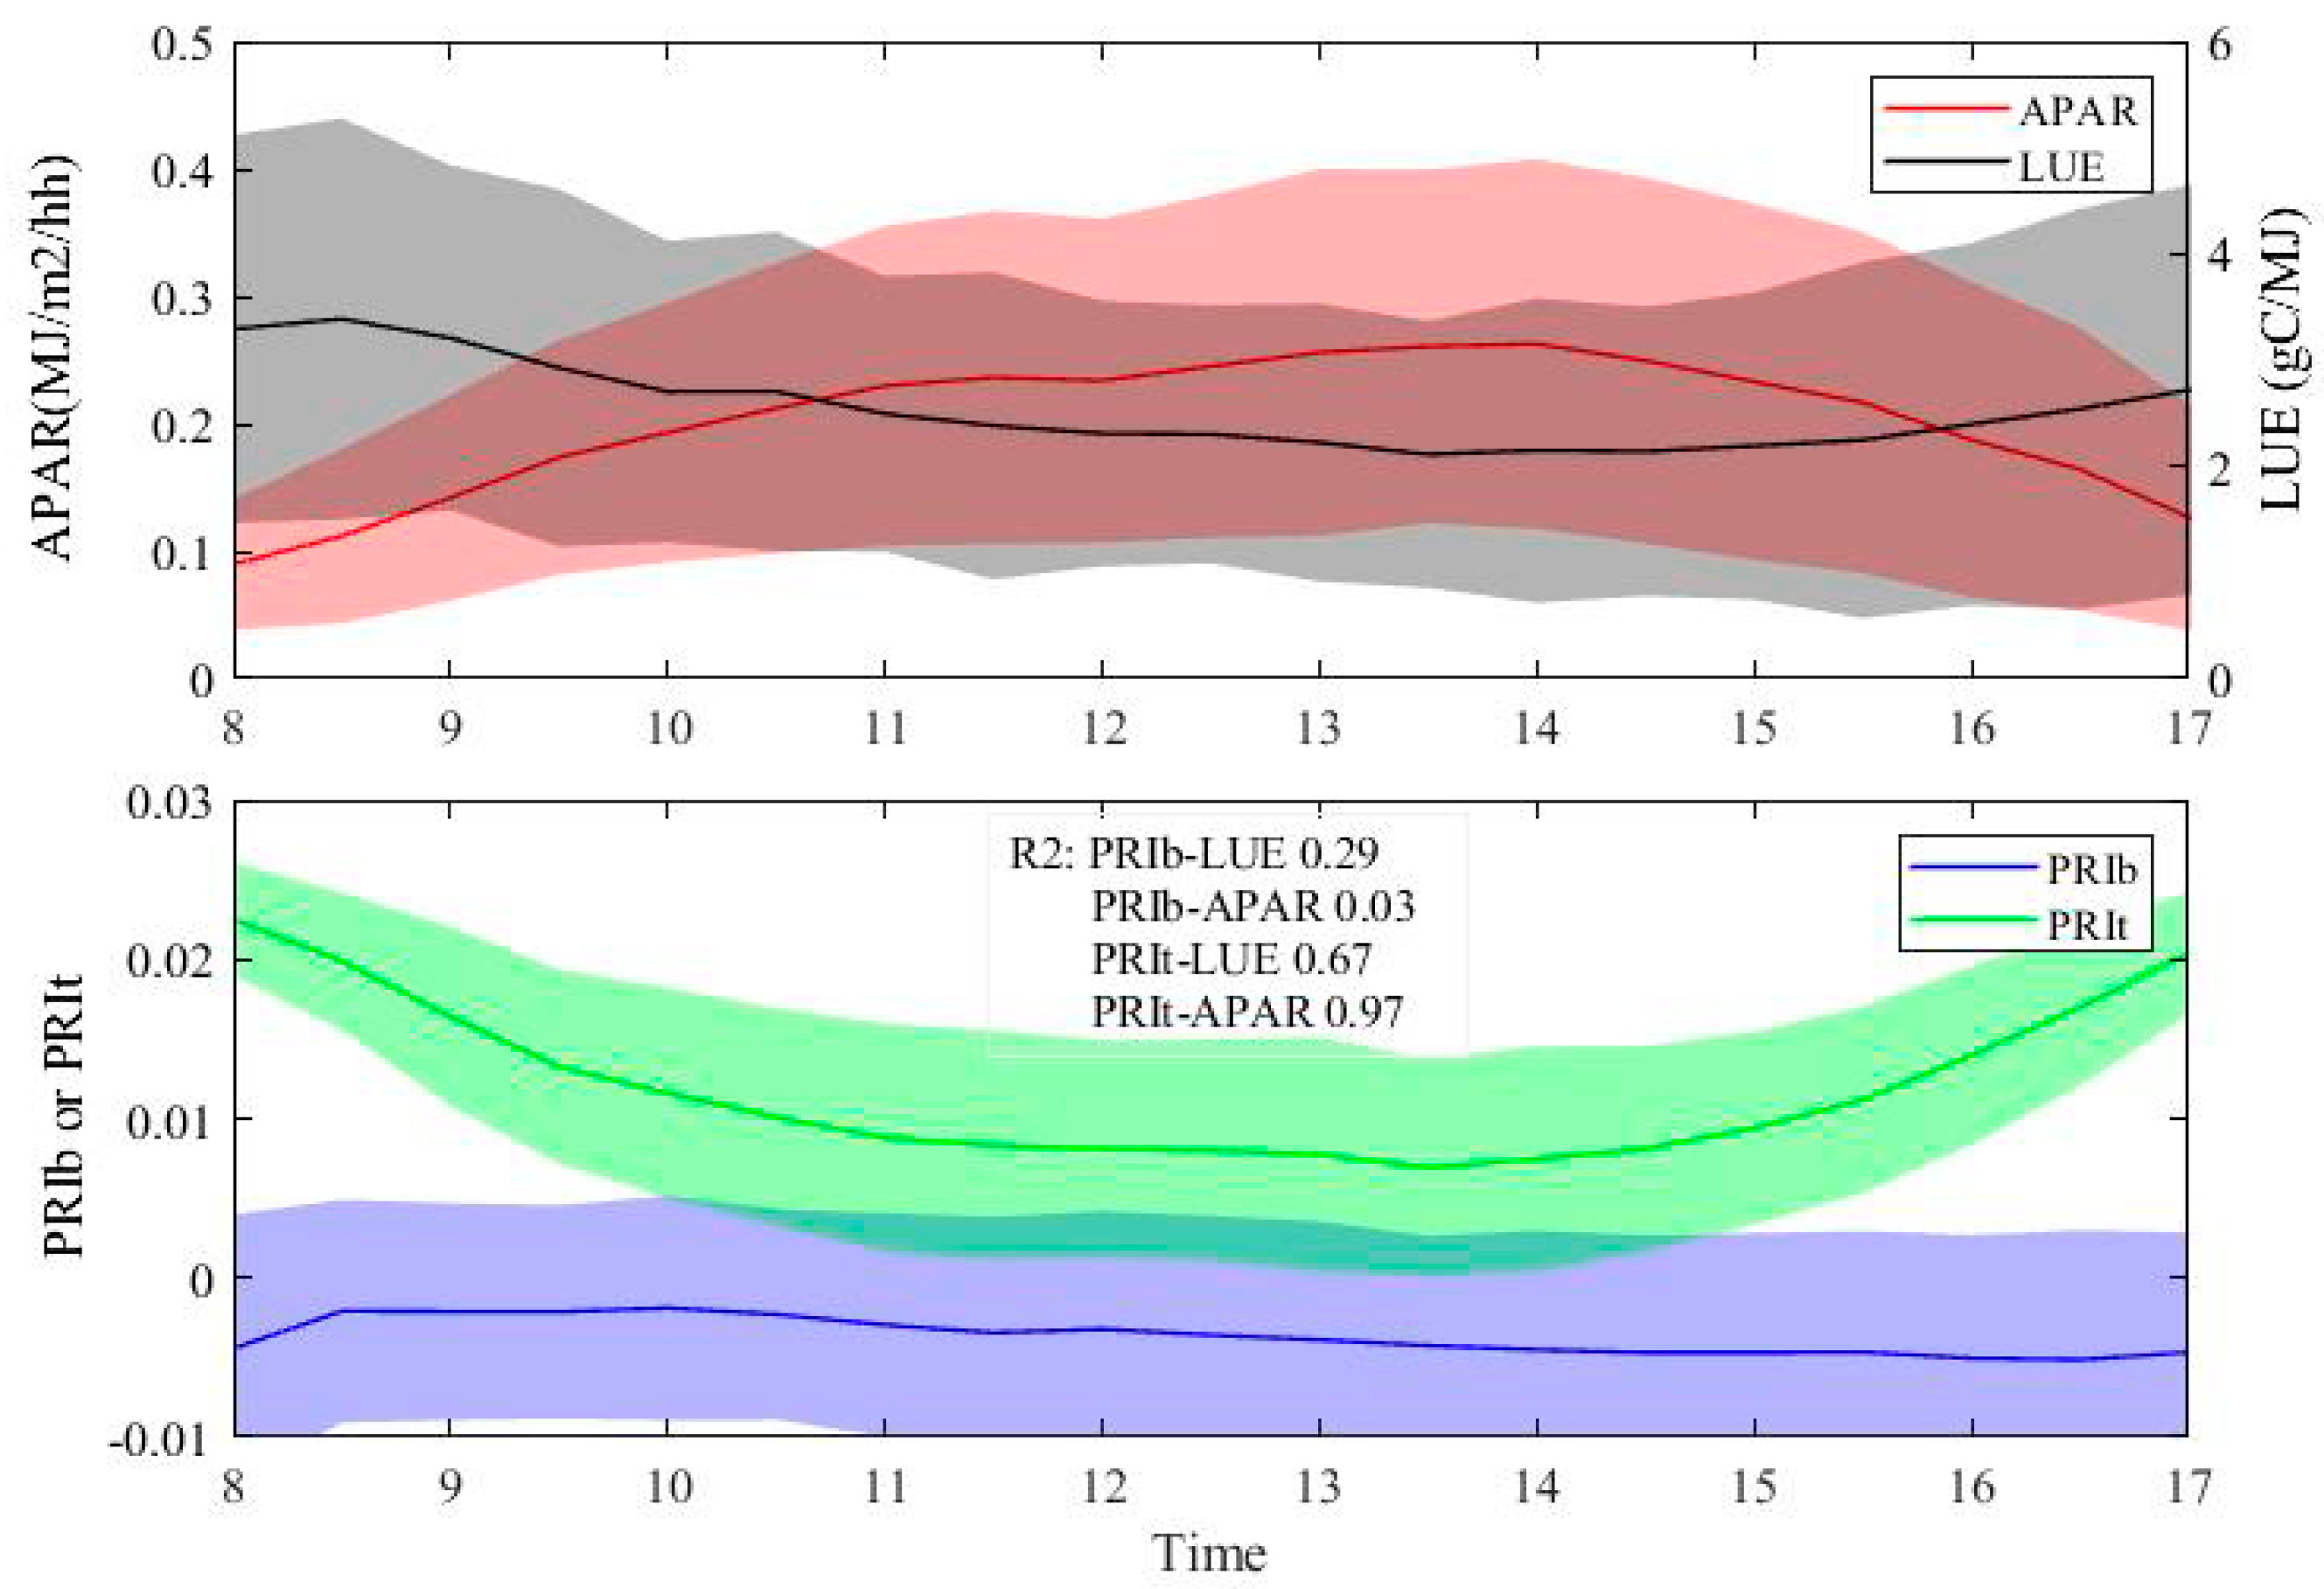
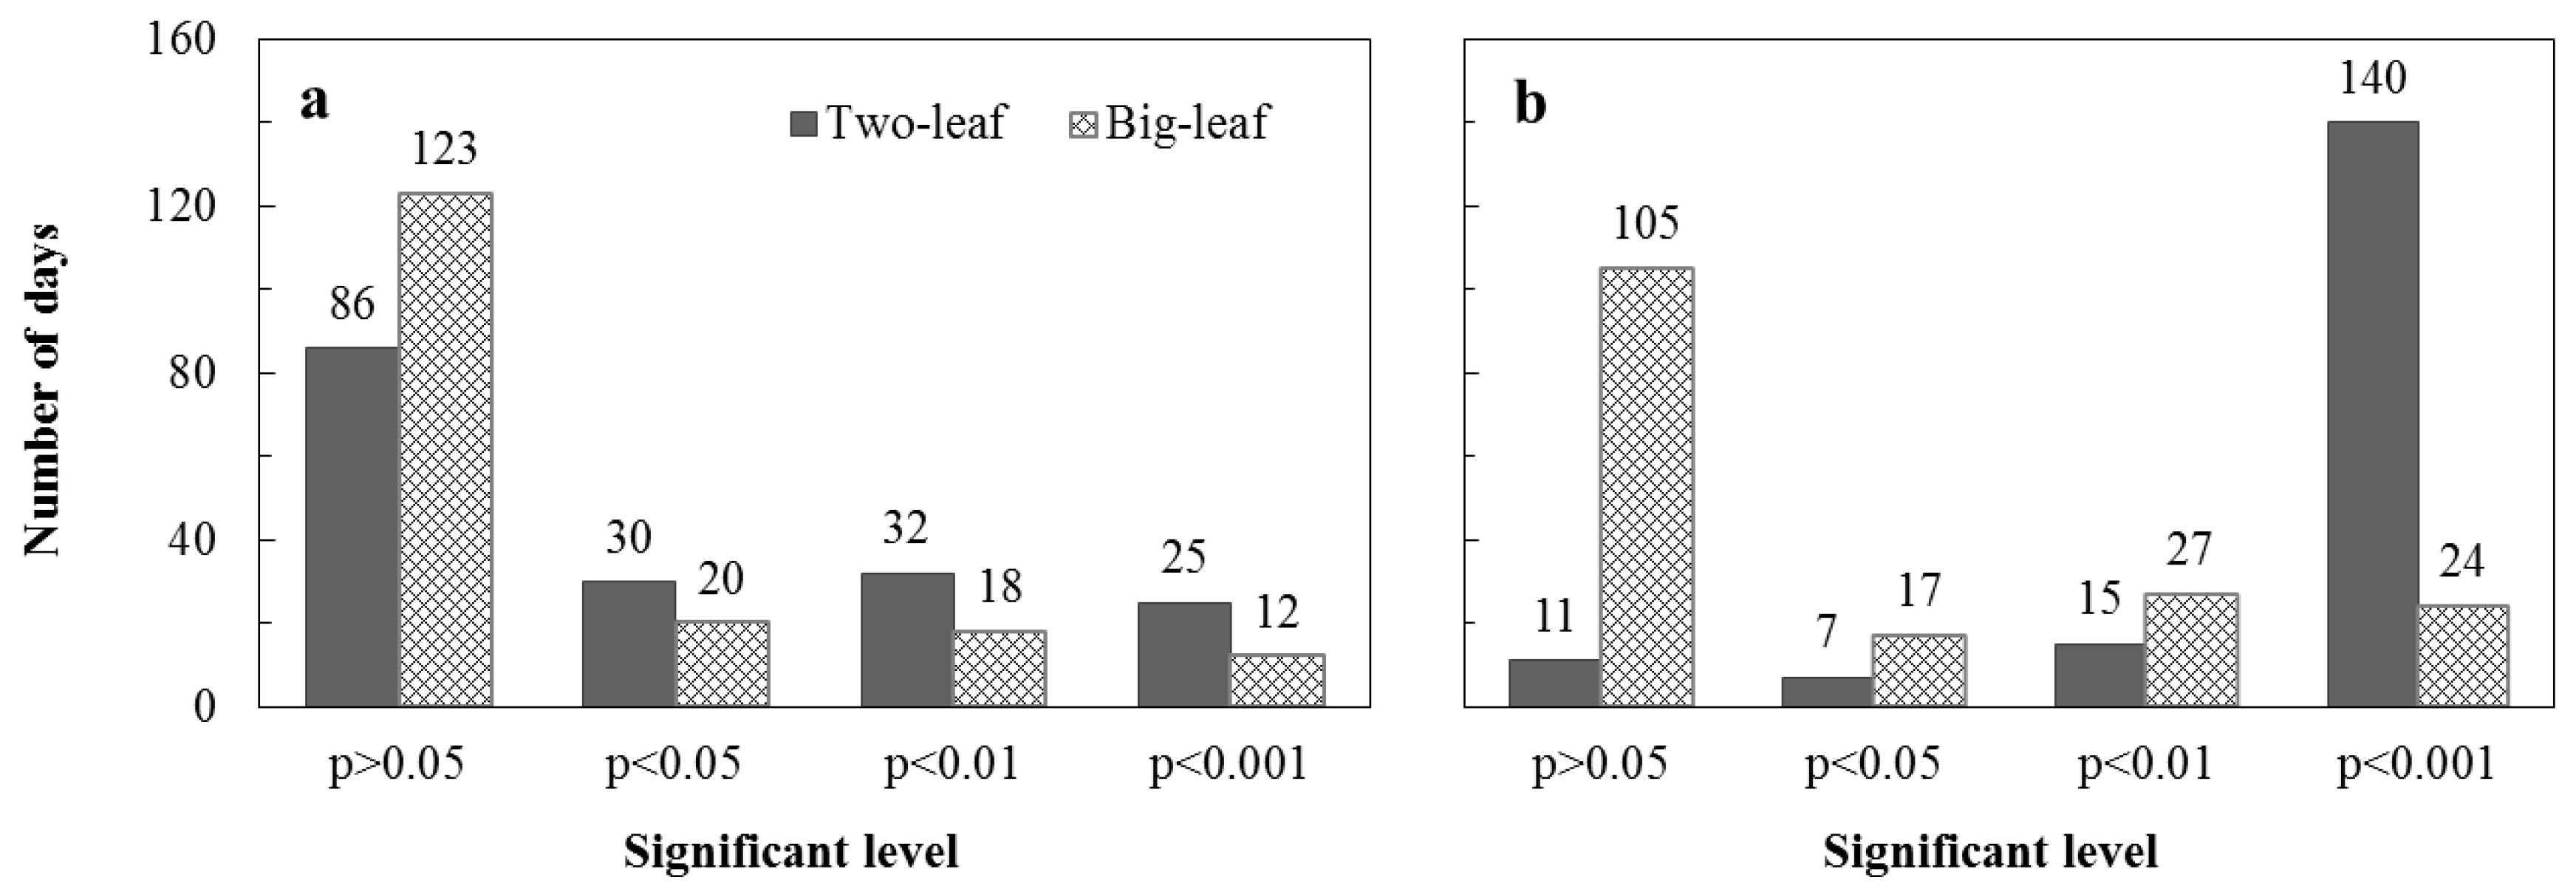
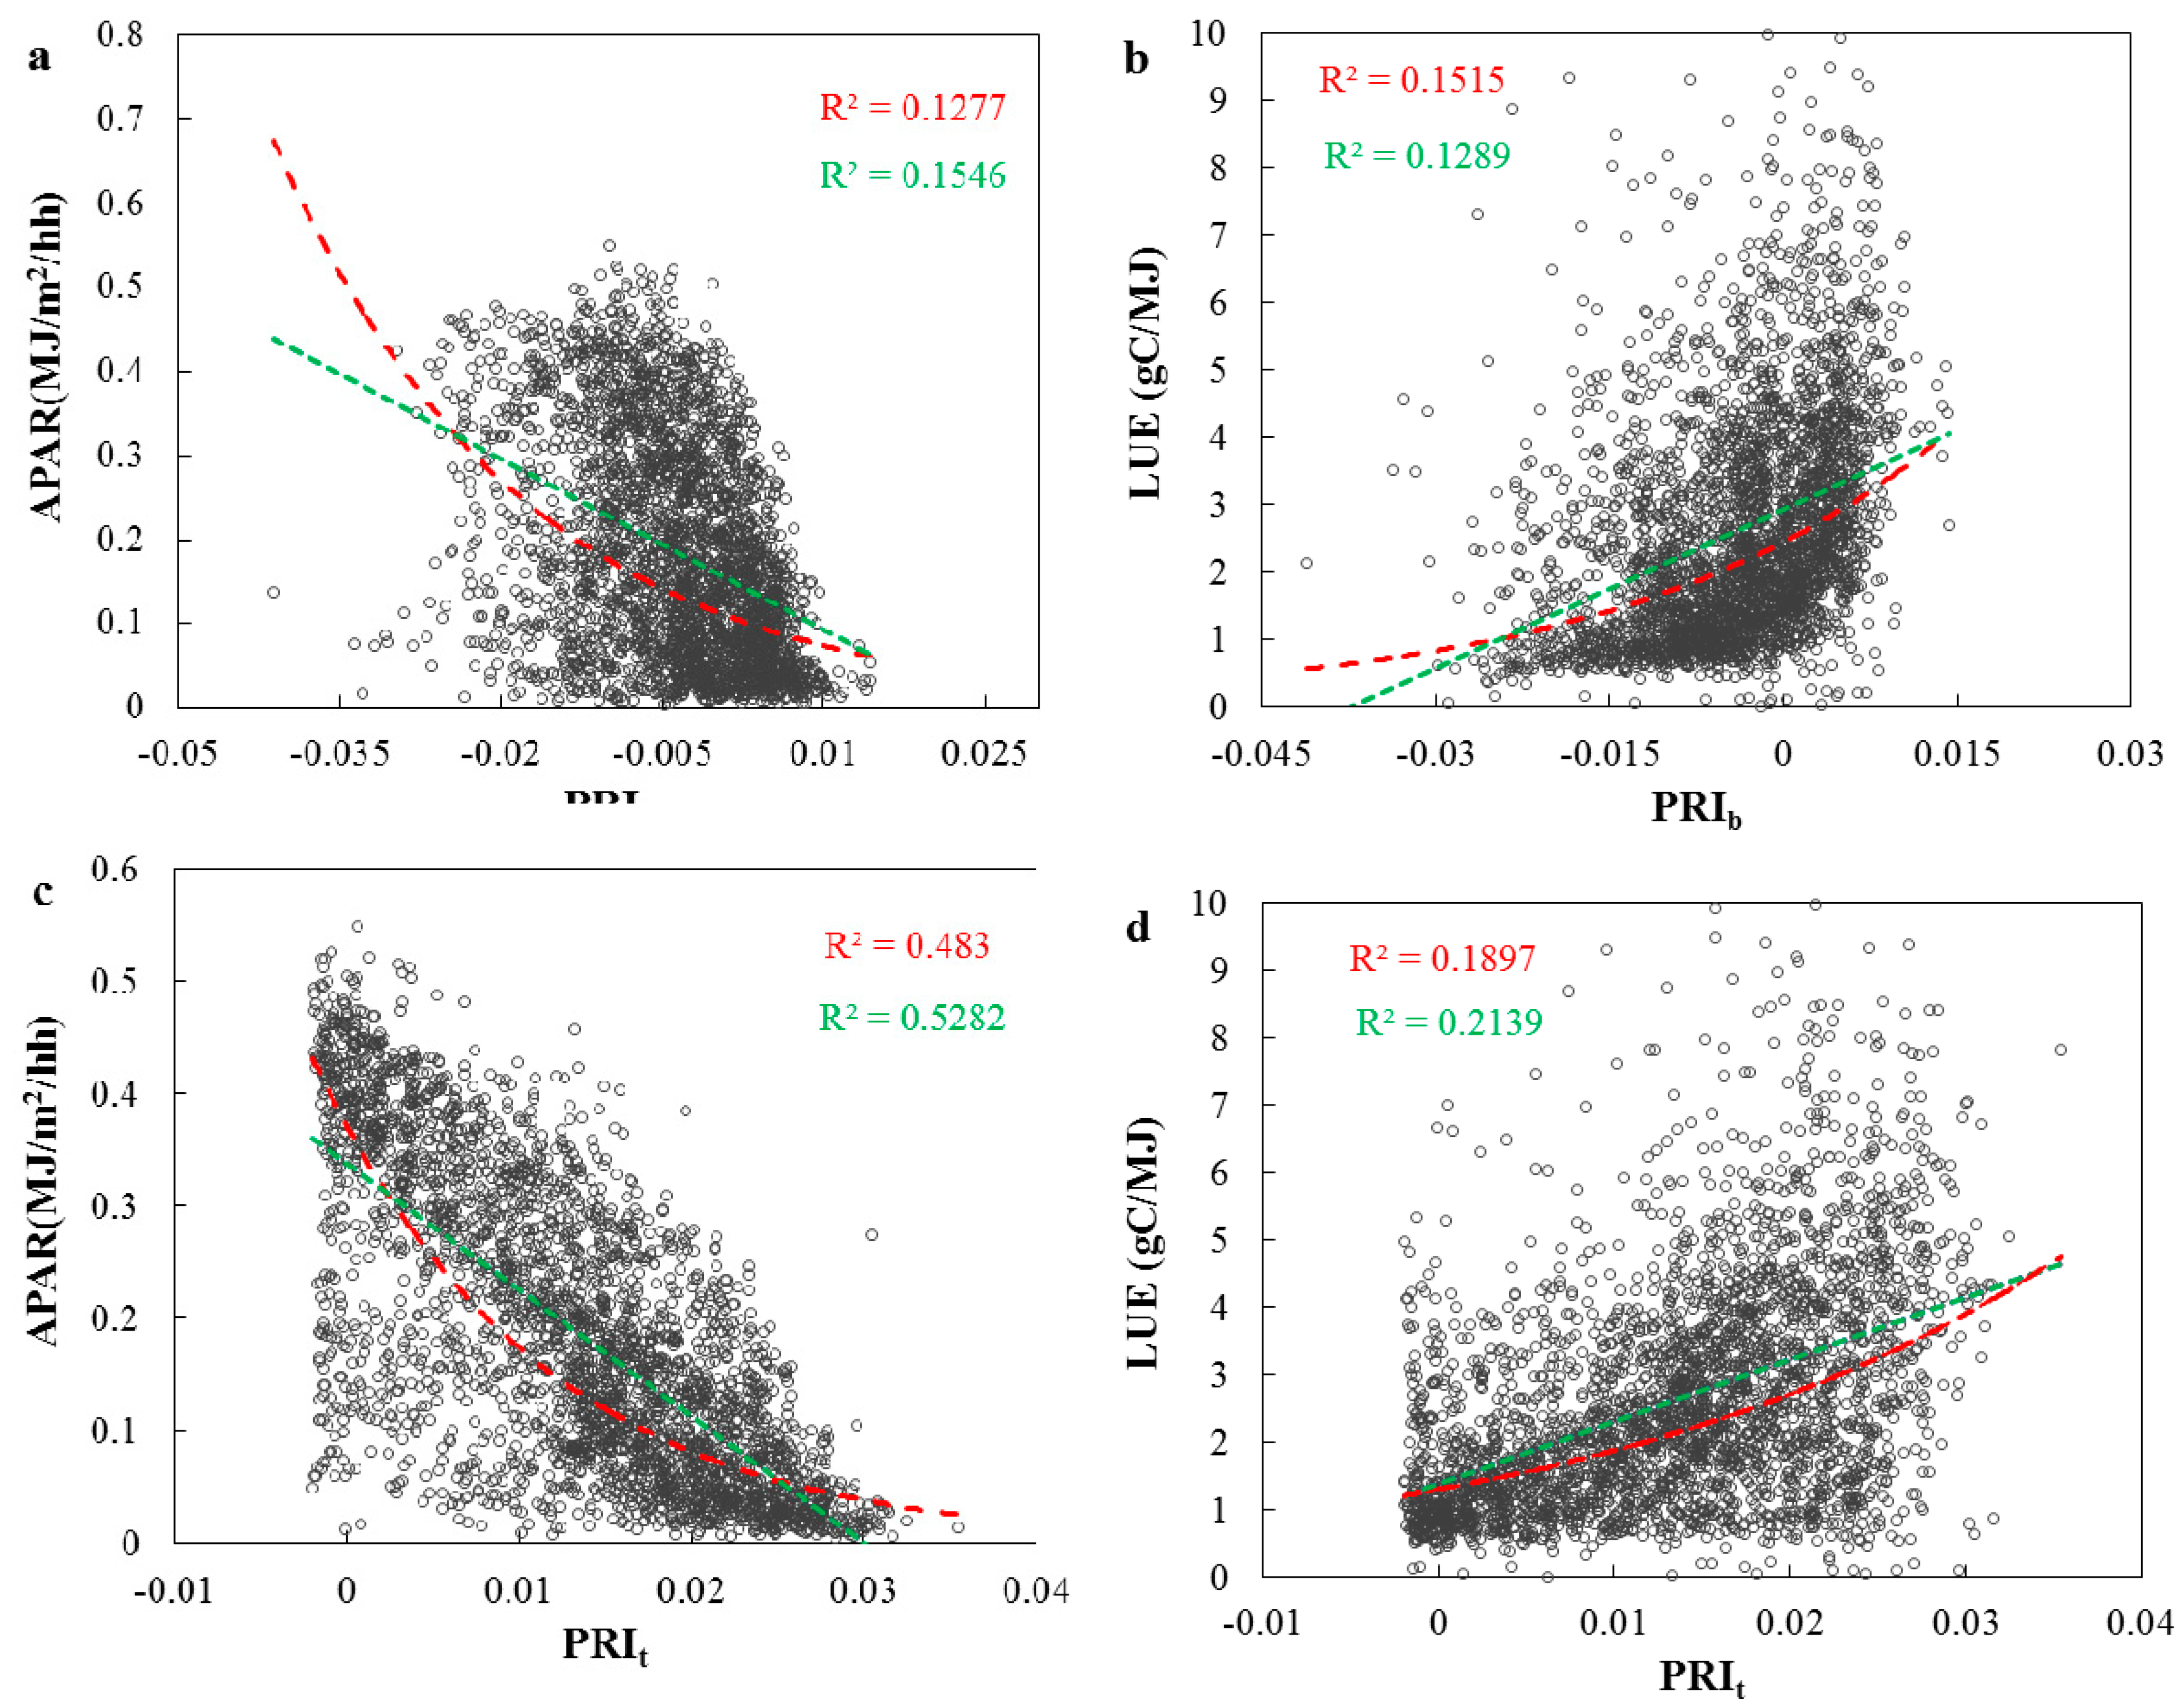
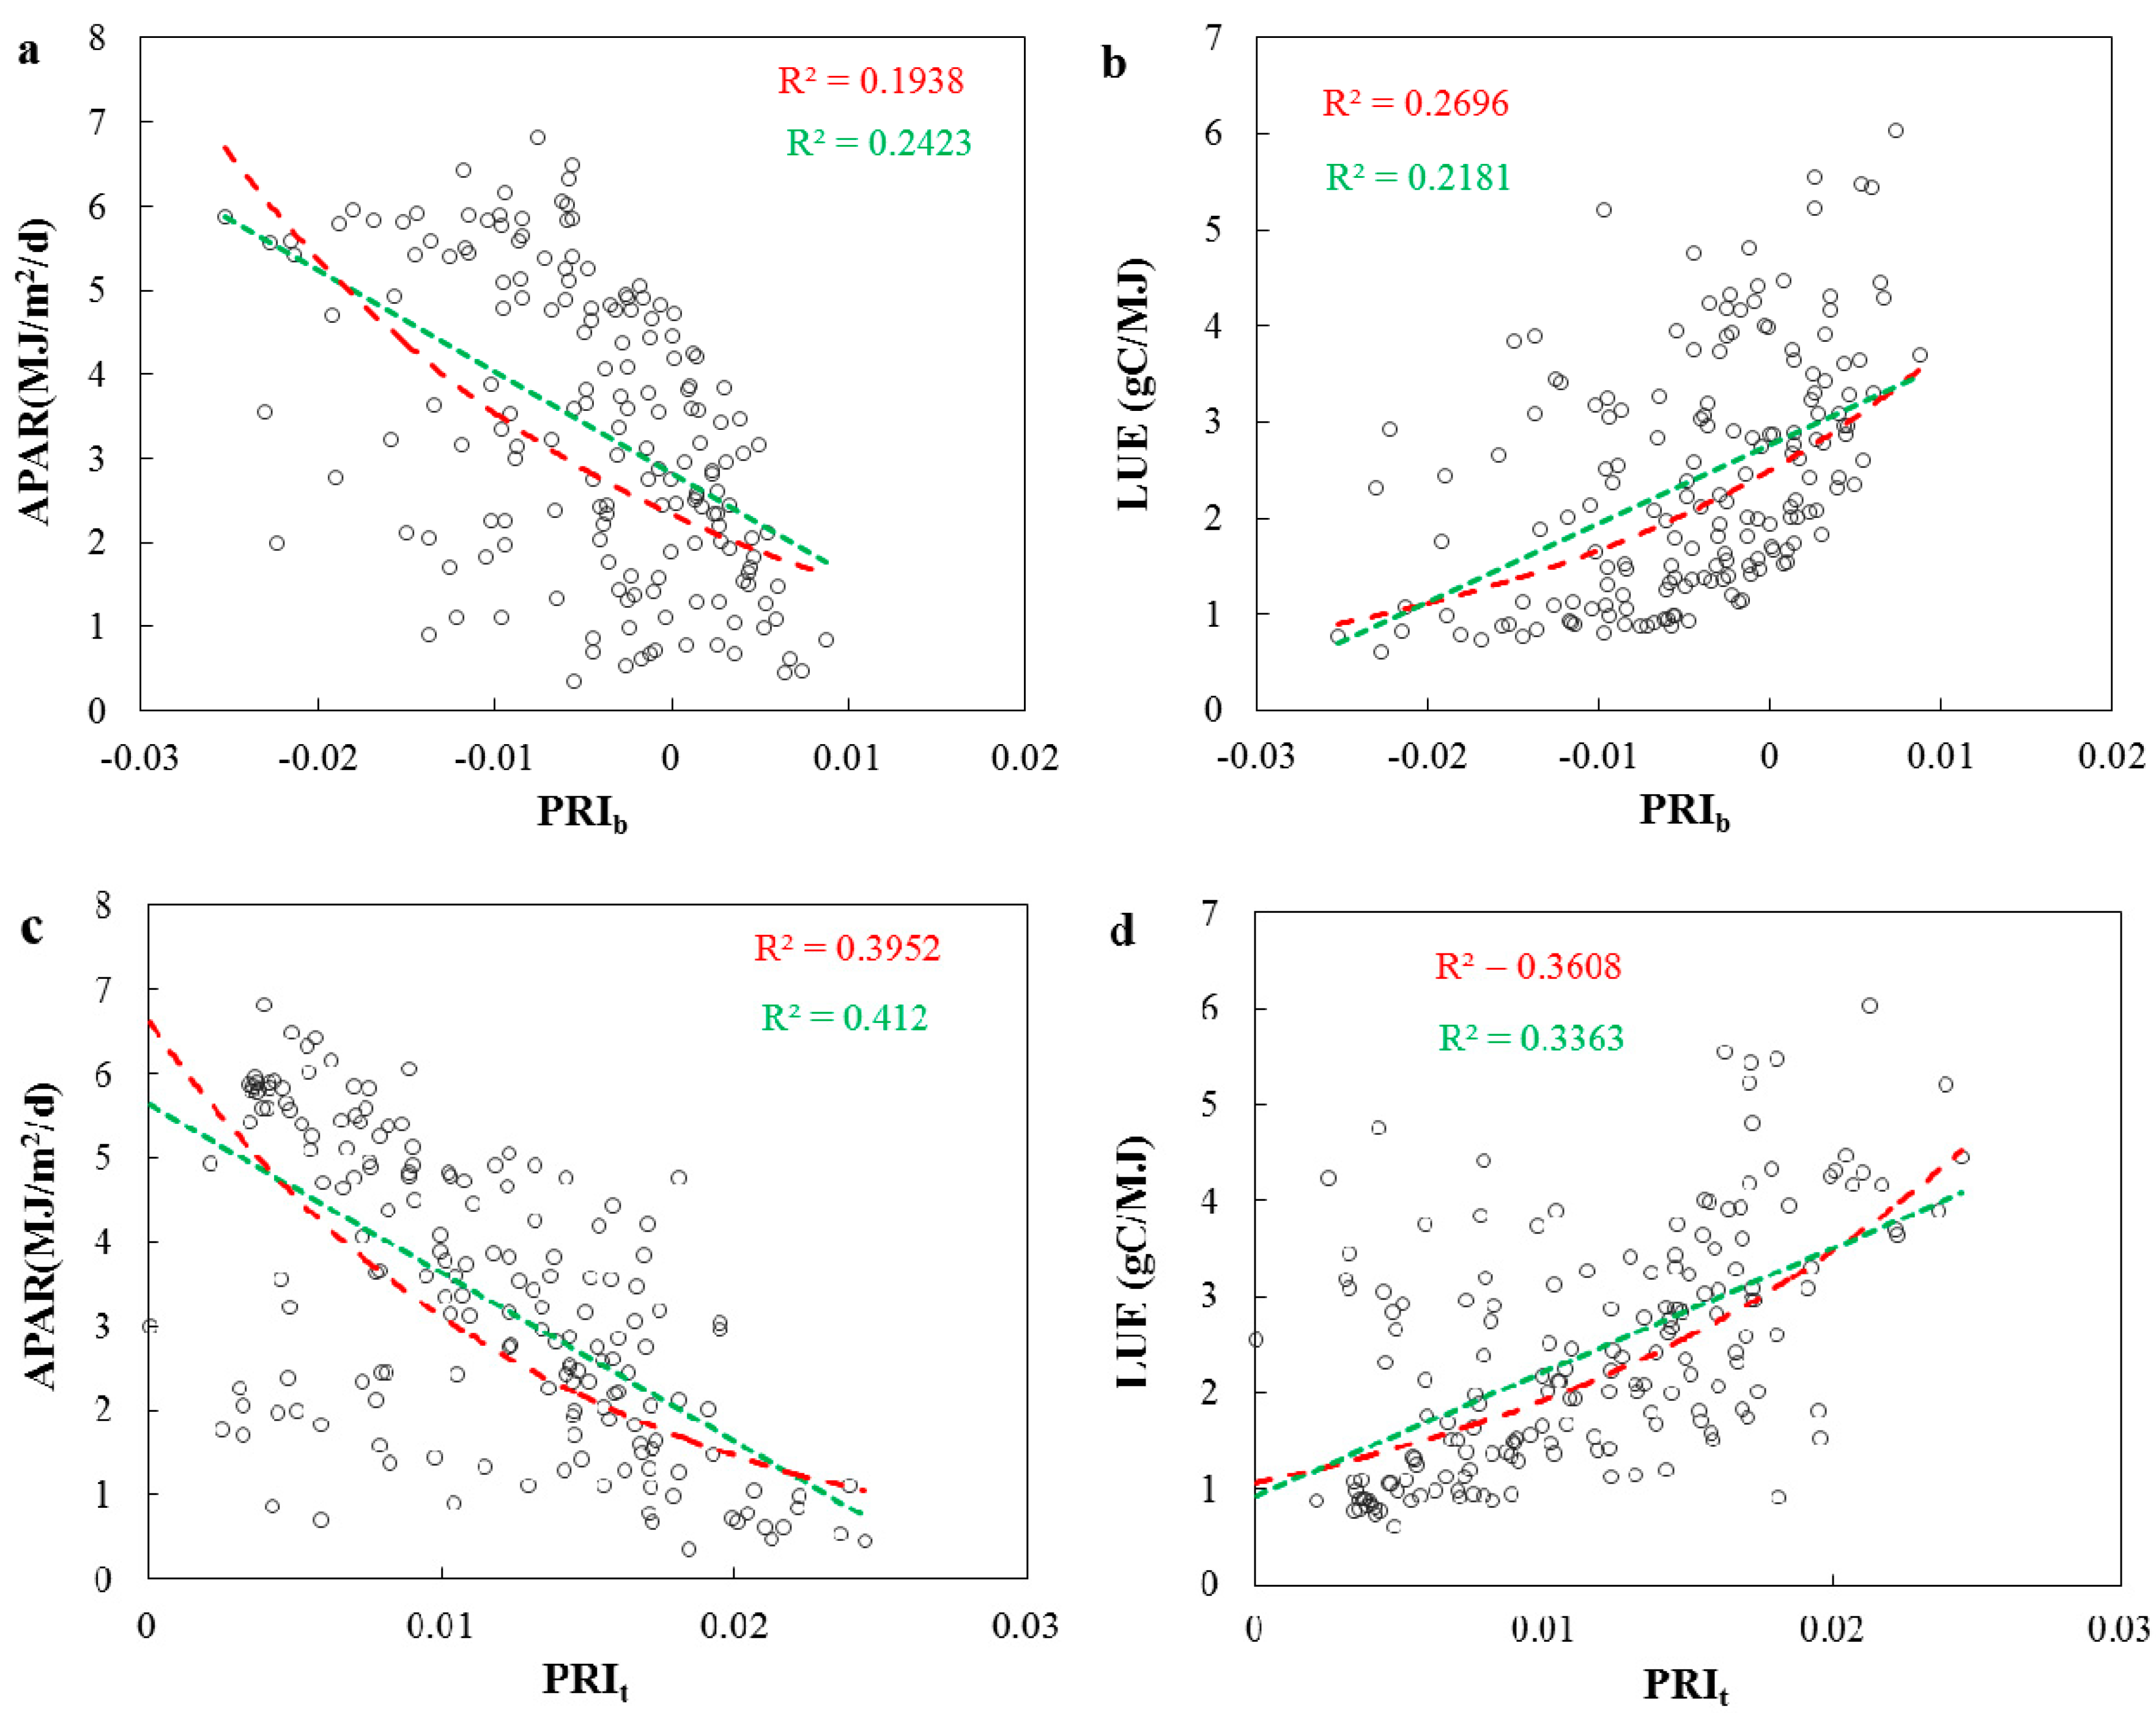
3.2. Evaluations of the Two-Leaf PRI (PRIt) to Indicate LUE and APAR

Firstly, PRIt retrieved using model I was analyzed with LUE and APAR, and compared with PRIb. Figure 4 displayed the diurnal variations of half-houly LUE, APAR, PRIb and PRIt averaged from the whole study period and the coefficients of determination (R2) of LUE and APAR with PRIb and PRIt. The grey areas denote the standard deviation of each of the four terms. Generally, LUE and PRIt showed similar variation trends, while APAR had an opposite changing trend. PRIb showed a quite different diurnal variation that increased in early morning and changed marginally during the rest of day. PRIt could well track changes of both LUE and APAR, especially APAR. PRIb could also track change of LUE, but hardly be able to track change of APAR. As observed PRIb at early morning and late afternoon mostly represented leaves of upper canopy (mostly sunlit leaves), of which values were relatively lower than those of lower canopy [73], PRIb was even lower than that at midday owing to sun-viewer geometry. The standard deviation of PRIb was larger than that of PRIt, indicating that PRIb was affected by non-physiological factors, especially the sun-viewer geometry, and PRIt could reduce these effects [73]. In early morning and late afternoon, a large part of sunlit leaves on top of the canopy, which was of low PRI values, was observed due to the sun-viewer geometry, so that the value of PRIb was as low as that around noon and had marginal diurnal variation. PRIt reduced effect of sun-viewer geometry and had similar diurnal variation with LUE.
Seasonal variations of daily PRIb, PRIt, LUE and APAR averaged from half-hourly data from 10:00 to 15:30 per day were shown in Figure 5. LUE and APAR exhibited quite inversely similar seasonal trends. During the period from day 218 to 225, when a long-term heat wave with high values of APAR occurred [78], both PRIb, PRIt and LUE decreased, whereas PRIb seriously declined but the relationship between PRIt and LUE also broken down under severe heat wave [73]. As the study period was the growing season of this conifer forest while the chlorophyll content and LAI changed marginally [73], there was no obvious seasonal variations of these four terms were observed.
Figure 6 showed the number of days on which the correlation coefficients (R) were significant at different levels (p). The R between half-hourly PRIb or PRIt and LUE (Figure 4a) or APAR (Figure 6b) on individual days were calculated with more than five good-quality observations from 7:00 to 17:30, when the solar zenith angle was less than 75°. As PRI was known to be positively correlated with LUE during the growing season, the numbers of days that PRIt was positively correlated to LUE at the significance levels of 0.01 and 0.001 are almost double those of PRIb (Figure 6a). The two-leaf treatment obviously improved the ability of PRI to track diurnal variations of LUE in comparison to the big-leaf PRI. The correlation between PRIt and APAR (Figure 6b) was highly enhanced as among 173 days, with more than 80% days that PRIt was highly significantly correlated to APAR (p < 0.001) while more than 60% days that PRIb was weakly related to APAR (p > 0.05). These results suggested that two-leaf PRI was a better proxy for APAR at a short temporal scale than LUE.
Figure 7 illustrated the relationships of PRIb and PRIt to APAR and LUE, respectively, at half-hourly temporal scales with observations from 7:00 to 17:30 throughout the study period in all weather conditions. PRIb was less correlated with either APAR or LUE than PRIt. The relationship between PRIt and APAR was much stronger than that between PRIb and APAR with significantly increased R2 value (increased ~71%; Figure 7a,c). Generally, these results again proved the feasibility of the two-leaf approach tested in this study and presented by Zhang et al. [73]. In addition, both PRIb and PRIt showed higher correlation with APAR than LUE, which indicated that PRI was probably a better proxy for APAR than for LUE. Even though previous studies were focused on using PRI to indicate LUE, stronger correlation between PRI and APAR than that between PRI and LUE at short-term across a growing season have been reported for different forests by Soudani et al. [44]. Decrease of PRI with increased APAR is linked with an increase in light absorption associated with the conversion of violaxanthin into antheraxanthin and zeaxanthin pigments, which can be detected by the decrease in reflectance at 531 nm [35]. PRI is more sensitive to absorbed energy, exhibiting closely increasing with APAR even when net photosynthesis rate and LUE are still low (often occur with low stomatal conductance in the afternoon) [49].
The relationships of daily mean PRIb and PRIt to APAR and LUE averaged from observations between 10:00 and 15:30 throughout the study period were shown in Figure 8. Significant linear correlations were also found for all relationships, while the relationships of PRIb and PRIt with LUE were more non-linear (exponential). The correlation between PRIt and LUE was about 35% stronger than that between PRIb and LUE, although some low PRIt values corresponding to high LUE (Figure 8b,d). The relationship between daily PRIt and APAR was also stronger than that between daily PRIb and APAR (Figure 8a,c), but was weaker than the relationship at half-hourly scale (Figure 7c).
Even though the ability of PRI to indicate LUE had been discussed in previous works [4,22,42,44,47,64,78,82], PRI was still difficult to be use to estimate LUE over different tempo-spatial scales as their relationship was influenced by many factors, such as pigment concentration, sun-target-view geometry, background reflectance, diffuse sky radiation, canopy structure. This limited the effectiveness of PRI to be involved in LUE models for GPP estimations [2,41,43,46,65,78,83,84]. Generally, either PRIb or PRIt was more linked to APAR than LUE at different temporal scales (Figure 7 and Figure 8). Porcar-Castell et al. [62] demonstrated that APAR was directly linked with dissipation of a part of energy as heat, which was related to PRI [29,33,36,85], while LUE was dominated by further processes linked with energy distribution. This indicated the stronger mechanistic linkage between PRI and APAR than LUE. PRIt could better capture variations of half-hourly APAR (Figure 7) than those of daily APAR, indicating that the two-leaf PRI was efficient to track short-term (sub-day or even instantaneous) variations of APAR. The penumbra region probably contributed a large amount of absorbed radiation almost like or even more than that absorbed by sunlit leaves in this conifer forest, demonstrating that treating penumbra region as sunlit leaves was suitable for understanding the link between fast-change APAR and canopy PRI (PRIt). Mechanistically, PRI mainly represented the absorbed energy allocated to photoprotection at short time scale [62,73,81,84,86,87,88], and was consequently effective to indicate APAR under generally steady conditions (when the distribution of absorbed energy does not change dramatically) as PRI was a direct outcome driven by APAR. But more importantly, this result demonstrated that, at short term, PRI was only able to track changes in LUE driven by APAR, which also had been mentioned by Zhang et al. [73]. This finding further revealed the limitation of using PRI to track diurnal variation of LUE at some circumstances that LUE was not mainly driven by radiation.
Above all, the two-leaf approach, which used the canopy reflectance ratio to leaf reflectance to represent the fraction of sunlit leaves, was simple and very effective, verifying the work presented by Zhang et al. [73]. During the process of two-leaf PRI calculation, it was proved that the penumbra region should be mostly treated as sunlit leaves only on concept. If intending to quantify the penumbra effect, light detection and ranging (LiDAR) could be a useful technology to simulate the radiation distribution within the canopy, and then identify the sunlit, penumbra and shaded elements, even could map the 3D distribution of LUE within the canopy [89]. PRI could be used to indicate both of the two key parameters (i.e., LUE and APAR) of LUE model, while two-leaf PRI was a better proxy for APAR at a shorter time scale. It was promising to estimate APAR from hyperspectral data through PRIt with high spatial and temporal resolution, while to estimate LUE was limited under the circumstance that LUE was mainly driven by radiation. However, to generalize the utilization of PRI, further works are needed for clarifying the benefits and limitations of PRI in indicating photosynthetic parameters. To promote using PRI as a proxy for LUE, their relationships at different temporal scales and under different weather conditions should be investigated in different ecosystems.

4. Conclusions

Shaded leaves, as well as sunlit leaves, contribute quite differently to reflectance and GPP at canopy level. Therefore, separating the canopy into sunlit and shaded parts for estimation of GPP using remote sensing technology is very necessary. Penumbra effect increases the difficulty for quantifying the fractions of sunlit and shaded leaves. In this paper, we investigated three methods with different hypotheses on treatments of the penumbra region for estimating the fraction of sunlit leaves. Inversely retrieved PRI (PRIinv) from estimated PT were compared to multi-angle observed PRI (PRIobs) to evaluate the accuracy of the three methods. The high accuracy of model I demonstrated that the penumbra region should be mostly treated as sunlit leaves, of which the fraction could be simply estimated using the ratio of canopy reflectance to leaf reflectance.
The simple two-leaf approach presented by Zhang et al. [73] was used to process the remote sensing and flux data, aiming to evaluate the ability of using PRI as a proxy for LUE or APAR. Generally, PRI was able to capture half-hourly and daily changes in LUE as well as APAR. At either half-hourly or daily time steps, the two-leaf approach significantly enhanced the correlations between PRI and LUE and APAR. The correlation between two-leaf PRI and APAR was very significant under all weather conditions, especially at half-hourly temporal scale. These results suggested that two-leaf PRI was probably a better proxy for APAR than LUE. However, in order to make PRI effective for understanding plant photosynthetic status under different weather conditions, a lot of works need to be done before a general method for reducing the effects of non-physiological factors on PRI can be wildly used.

5. Patents

Chinese patent: An approach for retrieving canopy photochemical reflectance index of separated sunlit and shaded leaves by using multi-angle observation data. Authorized: ZL201310283751.4

Author Contributions

Conceptualization, Q.H., F.Q. and Q.Z.; Methodology, F.Q., W.F. and Q.Z.; Software, Q.H.; Validation, F.Q., W.F. and Q.Z.; Formal Analysis, Q.H. and Q.Z.; Writing-Original Draft Preparation, Q.H.; Writing-Review & Editing, Y.L. and Q.Z.; Visualization, Q.H. and F.Q.; Supervision, Y.L. and Q.Z.; Project Administration, Q.Z.; Funding Acquisition, W.F. and Q.Z.

Funding

This research was funded by National Natural Science Foundation of China, grant number: 41701393; by China Postdoctoral Science Foundation, grant number: 2017M621698; by Zhejiang Provincial Natural Science Foundation of China, grant number: LY18D010003; by Foundation of Key Laboratory of Agricultural Remote Sensing, Ministry of Agriculture, grant number: 201709; and by Foundation of Jiangsu Key Laboratory of Agricultural Meteorology, Nanjing University of Information Science and Technology, grant number: JKLAM1702.

Acknowledgments

We gratefully acknowledge the support from the Qianyanzhou station of the Chinese Academy of Sciences for providing flux and meteorology datasets. We further acknowledge Jing M. Chen (University of Toronto, Canada) for his valuable discussion on different methods for estimation of the fraction of sunlit leaves. Many thanks to three anonymous reviewers who provided helpful comments to the improvement of the manuscript.

Conflicts of Interest

The authors declare no conflicts of interest

Abbreviations

The following abbreviations are used in this manuscript:
α The half apex angle
αs Shadow fractions (equal to PS)
ρCanopy reflectance from Unispec-DC
ρrRadiance of the canopy sensor
ρiIrradiance of the canopy sensor
ρiDCDaytime DC for irradiance
ρrDC Daytime DC for radiance
ξAngle between the sun and the viewer
θSolar zenith angle
θvView zenith angle
ΩThe value of clumping index
γEThe needle-to-shoot area ratio
APARAbsorbed photosynthetically active radiation
APARsunPhotosynthetically active radiation absorbed by sunlit leaves
APARshPhotosynthetically active radiation absorbed by shaded leaves
BRDFBidirectional reflectance distribution function
CERNChinese Ecosystem Research Network
CHMCanopy height model
CiThe intercellular CO2 concentration
CIClearness index
CVCoefficient of variation
DCDark current
DOYDay of year
ECEddy covariance
FIPThe first intersection point
FPARThe fraction of PAR
fAPARchlThe fraction of PAR absorbed by chlorophyll
G(θ)The projection of unit leaf areas
GPPGross primary production
GOSTGeometric-optical model
HaThe height of the lower part of the tree (trunk space)
HbThe height of crown
LAILeaf area index
LsunSunlit leaf area index
LshShaded leaf area index
LUE, εLight use efficiency
MODISModerate Resolution Imaging Spectroradiometer
NADPHReduced pyridine nucleotide
NDVINormalized difference vegetation index
NEENet ecosystem productivity
NPQNonphotochemical quenching
PARPhotosynthetically active radiation
PQPhotochemical quenching
PRIPhotochemical reflectance index
PRIbBig-leaf PRI
PRIinvInversely calculated PRI at each view angle
PRIobsObserved PRI at each view angle
PRIshPRI of shaded leaves
PRIsunPRI of sunlit leaves
PRItTwo-leaf PRI
PS I, IIPhotosystem I and II
PTUPan-tilt unit
PTThe observed fraction of sunlit leaves
PSThe observed fraction of shaded leaves
PVGThe observed fraction of background
PGThe observed fraction of sunlit background
PZThe observed fraction of shade background
QYZQianyanzhou Experimental Station
rThe diameter of the crown
R0The extraterrestrial radiation at the top of the atmosphere
RcanCanopy reflectance
RTReflectance of sunlit leaves
RGReflectance of sunlit background
RSReflectance of shaded leaves
RZReflectance of shaded background
RdifThe ratio of diffuse radiation to total radiation
ReDaytime ecosystem respiration
RgThe global solar radiation on the surface of the earth
RleafLeaf reflectance
RSLThe ratio of canopy reflectance to leaf reflectance
RhRelative humidity
SPTThe ratio of the sunlit point in a tree
TaAir temperature
VPDVapor pressure deficit
WSThe mean width of elements shadows cast inside tree crowns

Appendix A

Estimation of PARdif, PARdir, APARsun and APARsh:APAR on per unit leaf area is calculated separately for sunlit (APARsun) and shaded leaves (APARsh):
A P A R s u n = ( 1 α ) × ( P A R d i r × cos β cos θ + A P A R s h )
A P A R s u n = ( 1 α ) × ( 1 δ ) × ( ( P A R d i r P A R d i f , u ) / L A I + C )
C = 0.07 Ω × P A R d i r × ( 1.1 0.1 L A I ) e cos θ
P A R d i f , u = P A R d i r × e 0.5 Ω × L A I 0.537 + 0.025 × L A I
δ = 0.2 × ( 1 e 0.5 Ω × L A I 0.537 + 0.025 × L A I )
where α is the albedo related to vegetation types setting as 0.15 for coniferous forest; PARdif and PARdir are the diffuse and direct components of incoming PAR, respectively, and they are calculated using equation (A6); PARdif,u is the diffuse PAR under the canopy; (PARdif − PARdif,u)/LAI represents the diffuse PAR on per unit leaf area within the canopy; C quantifies the contribution of multiple scattering of the total PAR to the diffuse irradiance per unit leaf area within the canopy; β is mean leaf-sun angle and set as 60º for a canopy with a spherical leaf angle distribution; δ is a correction for nonlinear response of leaf photosynthesis to the vertical variation of diffuse radiation within the canopy that makes APARsh represents absorbed radiation times light response of photosynthesis; and θ is the solar zenith angle.
Diffuse and direct PAR are partitioned [15,23,24] with parameters calibrated using daily clearness index (CI) and total incoming radiation as:
P A R d i f = P A R × ( 0.7702 + 3.6895 C I 15.4527 C I 2 + 16.9828 C I 3 5.7773 C I 4 )
CI is a ratio of the global solar radiation on the surface of the earth (Rg) and the extraterrestrial radiation at the top of the atmosphere (R0). R0 for any day and any moment can be calculated using solar zenith (θ) at a given place as:
R 0 = S 0 × ( 1 + 0.033 cos ( 360 D O Y / 365 ) ) × cos θ
where S0 is the solar constant (1367 W/m2); DOY denotes day of the year. With observed half-hourly total incident radiation (Rg), CI is calculated as Rg/R0.

References

  1. Monteith, J.L. Solar radiation and productivity in tropical ecosystems. J. Appl. Ecol. 1972, 9, 747–766. [Google Scholar] [CrossRef]
  2. Hilker, T.; Coops, N.C.; Hall, F.G.; Black, T.A.; Wulder, M.A.; Nesic, Z.; Krishnan, P. Separating physiologically and directionally induced changes in pri using brdf models. Remote Sens. Environ. 2008, 112, 2777–2788. [Google Scholar] [CrossRef]
  3. Tan, K.P.; Kanniah, K.D.; Cracknell, A.P. A review of remote sensing based productivity models and their suitability for studying oil palm productivity in tropical regions. Prog. Phys. Geogr. 2012, 36, 655–679. [Google Scholar] [CrossRef]
  4. Hilker, T.; Coops, N.C.; Wulder, M.A.; Black, T.A.; Guy, R.D. The use of remote sensing in light use efficiency based models of gross primary production: A review of current status and future requirements. Sci. Total Environ. 2008, 404, 411–423. [Google Scholar] [CrossRef] [PubMed] [Green Version]
  5. Ahl, D.E.; Gower, S.T.; Mackay, D.S.; Burrows, S.N.; Norman, J.M.; Diak, G.R. Heterogeneity of light use efficiency in a northern wisconsin forest: Implications for modeling net primary production with remote sensing. Remote Sens. Environ. 2004, 93, 168–178. [Google Scholar] [CrossRef]
  6. Potter, C.S.; Randerson, J.T.; Field, C.B.; Matson, P.A.; Vitousek, P.M.; Mooney, H.A.; Klooster, S.A. Terrestrial ecosystem production: A process model based on global satellite and surface data. Glob. Biogeochem. Cycles 1993, 7, 811–841. [Google Scholar] [CrossRef]
  7. Running, S.W.; Thornton, P.E.; Nemani, R.; Glassy, J.M. Global terrestrial gross and net primary productivity from the earth observing system. In Methods in Ecosystem Science; Springer: New York, NY, USA, 2000; pp. 44–57. [Google Scholar]
  8. Running, S.W.; Nemani, R.R.; Heinsch, F.A.; Zhao, M.; Reeves, M.; Hashimoto, H. A continuous satellite-derived measure of global terrestrial primary production. BioScience 2004, 54, 547–560. [Google Scholar] [CrossRef]
  9. Xiao, X.; Zhang, Q.; Braswell, B.; Urbanski, S.; Boles, S.; Wofsy, S.; Moore, B.; Ojima, D. Modeling gross primary production of temperate deciduous broadleaf forest using satellite images and climate data. Remote Sens. Environ. 2004, 91, 256–270. [Google Scholar] [CrossRef]
  10. Xiao, X.; Hollinger, D.; Aber, J.; Goltz, M.; Davidson, E.A.; Zhang, Q.; Moore, B. Satellite-based modeling of gross primary production in an evergreen needleleaf forest. Remote Sens. Environ. 2004, 89, 519–534. [Google Scholar] [CrossRef]
  11. Myneni, R.B.; Hall, F.G.; Sellers, P.J.; Marshak, A.L. The interpretation of spectral vegetation indexes. IEEE Trans. Geosci. Remote Sens. 1995, 33, 481–486. [Google Scholar] [CrossRef]
  12. Ruimy, A.; Saugier, B.; Dedieu, G. Methodology for the estimation of terrestrial net primary production from remotely sensed data. J. Geophys. Res. Atmos. 1994, 99, 5263–5283. [Google Scholar] [CrossRef]
  13. Goetz, S.J.; Prince, S.D. Modelling terrestrial carbon exchange and storage: Evidence and implications of functional convergence in light-use efficiency. Adv. Ecol. Res. 1999, 28, 57–92. [Google Scholar]
  14. Lagergren, F.; Eklundh, L.; Grelle, A.; Lundblad, M.; Mölder, M.; Lankreijer, H.; Lindroth, A. Net primary production and light use efficiency in a mixed coniferous forest in sweden. Plant Cell Environ. 2005, 28, 412–423. [Google Scholar] [CrossRef]
  15. He, M.; Ju, W.; Zhou, Y.; Chen, J.; He, H.; Wang, S.; Wang, H.; Guan, D.; Yan, J.; Li, Y. Development of a two-leaf light use efficiency model for improving the calculation of terrestrial gross primary productivity. Agric. For. Meteorol. 2013, 173, 28–39. [Google Scholar] [CrossRef]
  16. Oliphant, A.J.; Goni, D.; Deng, B.; Grimmond, C.S.B.; Schmid, H.P.; Scott, S.L. The role of sky conditions on gross primary production in a mixed deciduous forest. Agric. For. Meteorol. 2011, 151, 781–791. [Google Scholar] [CrossRef]
  17. Zhang, M.; Yu, G.R.; Zhuang, J.; Gentry, R.; Fu, Y.L.; Sun, X.M.; Zhang, L.M.; Wen, X.F.; Wang, Q.F.; Han, S.J. Effects of cloudiness change on net ecosystem exchange, light use efficiency, and water use efficiency in typical ecosystems of china. Agric. For. Meteorol. 2011, 151, 803–816. [Google Scholar] [CrossRef]
  18. Fleisher, D.H.; Timlin, D.J.; Reddy, V.R. Temperature influence on potato leaf and branch distribution and on canopy photosynthetic rate. Agron. J. 2006, 98, 1442–1452. [Google Scholar] [CrossRef]
  19. Nichol, C.J.; Huemmrich, K.F.; Black, T.A.; Jarvis, P.G.; Walthall, C.L.; Grace, J.; Hall, F.G. Remote sensing of photosynthetic-light-use efficiency of boreal forest. Agric. For. Meteorol. 2000, 101, 131–142. [Google Scholar] [CrossRef] [Green Version]
  20. Nichol, C.J.; Lloyd, J.; Shibistova, O.; Arneth, A.; Röser, C.; Knohl, A.; Matsubara, S.; Grace, J. Remote sensing of photosynthetic light use efficiency of a siberian boreal forest. Tellus B 2002, 54, 677–687. [Google Scholar] [CrossRef]
  21. Yuan, W.; Liu, S.; Yu, G.; Bonnefond, J.-M.; Chen, J.; Davis, K.; Desai, A.R.; Goldstein, A.H.; Gianelle, D.; Rossi, F. Global estimates of evapotranspiration and gross primary production based on modis and global meteorology data. Remote Sens. Environ. 2010, 114, 1416–1431. [Google Scholar] [CrossRef]
  22. Coops, N.C.; Hilker, T.; Hall, F.G.; Nichol, C.J.; Drolet, G.G. Estimation of light-use efficiency of terrestrial ecosystems from space: A status report. BioScience 2010, 60, 788–797. [Google Scholar] [CrossRef]
  23. Chen, J.M.; Liu, J.; Cihlar, J.; Goulden, M.L. Daily canopy photosynthesis model through temporal and spatial scaling for remote sensing applications. Ecol. Model. 1999, 124, 99–119. [Google Scholar] [CrossRef] [Green Version]
  24. Chen, J.M.; Mo, G.; Pisek, J.; Liu, J.; Deng, F.; Ishizawa, M.; Chan, D. Effects of foliage clumping on the estimation of global terrestrial gross primary productivity. Glob. Biogeochem. Cycles 2012, 26, 626–640. [Google Scholar] [CrossRef]
  25. Li, D.; Ju, W.; Lu, D.; Zhou, Y.; Wang, H. Impact of estimated solar radiation on gross primary productivity simulation in subtropical plantation in southeast china. Sol. Energy 2015, 120, 175–186. [Google Scholar] [CrossRef]
  26. Mercado, L.M.; Bellouin, N.; Sitch, S.; Boucher, O.; Huntingford, C.; Wild, M.; Cox, P.M. Impact of changes in diffuse radiation on the global land carbon sink. Nature 2009, 458, 1014–1017. [Google Scholar] [CrossRef] [PubMed] [Green Version]
  27. Roderick, M.L.; Farquhar, G.D.; Berry, S.L.; Noble, I.R. On the direct effect of clouds and atmospheric particles on the productivity and structure of vegetation. Oecologia 2001, 129, 21–30. [Google Scholar] [CrossRef] [PubMed]
  28. Wu, X.; Ju, W.; Zhou, Y.; He, M.; Law, B.E.; Black, T.A.; Margolis, H.A.; Cescatti, A.; Gu, L.; Montagnani, L. Performance of linear and nonlinear two-leaf light use efficiency models at different temporal scales. Remote Sens. 2015, 7, 2238–2278. [Google Scholar] [CrossRef]
  29. Gamon, J.A.; Penuelas, J.; Field, C. A narrow-waveband spectral index that tracks diurnal changes in photosynthetic efficiency. Remote Sens. Environ. 1992, 41, 35–44. [Google Scholar] [CrossRef]
  30. Demmig-Adams, B.; Adams, W.W., III; Winter, K.; Meyer, A.; Schreiber, U.; Pereira, J.S.; Krüger, A.; Czygan, F.-C.; Lange, O.L. Photochemical efficiency of photosystem ii, photon yield of o2 evolution, photosynthetic capacity, and carotenoid composition during the midday depression of net co2 uptake in arbutus unedo growing in portugal. Planta 1989, 177, 377–387. [Google Scholar] [CrossRef]
  31. Demmig-Adams, B. Survey of thermal energy dissipation and pigment composition in sun and shade leaves. Plant Cell Physiol. 1998, 39, 474–482. [Google Scholar] [CrossRef]
  32. Demmig-Adams, B.; Adams, W.W. Photoprotection and other responses of plants to high light stress. Annu. Rev. Plant Biol. 1992, 43, 599–626. [Google Scholar] [CrossRef]
  33. Demmig-Adams, B.; Adams, W.W. The role of xanthophyll cycle carotenoids in the protection of photosynthesis. Trends Plant Sci. 1996, 1, 21–26. [Google Scholar] [CrossRef]
  34. Demmig-Adams, B.; Adams, W.W. Photoprotection in an ecological context: The remarkable complexity of thermal energy dissipation. New Phytol. 2006, 172, 11–21. [Google Scholar] [CrossRef] [PubMed]
  35. Gamon, J.; Serrano, L.; Surfus, J. The photochemical reflectance index: An optical indicator of photosynthetic radiation use efficiency across species, functional types, and nutrient levels. Oecologia 1997, 112, 492–501. [Google Scholar] [CrossRef] [PubMed]
  36. Peñuelas, J.; Filella, I.; Gamon, J.A. Assessment of photosynthetic radiation-use efficiency with spectral reflectance. New Phytol. 1995, 131, 291–296. [Google Scholar] [CrossRef]
  37. Barton, C.V.M.; North, P.R.J. Remote sensing of canopy light use efficiency using the photochemical reflectance index model and sensitivity analysis. Remote Sens. Environ. 2001, 78, 264–273. [Google Scholar] [CrossRef]
  38. Damm, A.; Guanter, L.; Verhoef, W.; Schläpfer, D.; Garbari, S.; Schaepman, M. Impact of varying irradiance on vegetation indices and chlorophyll fluorescence derived from spectroscopy data. Remote Sens. Environ. 2015, 156, 202–215. [Google Scholar] [CrossRef]
  39. Drolet, G.G.; Huemmrich, K.F.; Hall, F.G.; Middleton, E.M.; Black, T.A.; Barr, A.G.; Margolis, H.A. A modis-derived photochemical reflectance index to detect inter-annual variations in the photosynthetic light-use efficiency of a boreal deciduous forest. Remote Sens. Environ. 2005, 98, 212–224. [Google Scholar] [CrossRef]
  40. Drolet, G.G.; Middleton, E.M.; Huemmrich, K.F.; Hall, F.G.; Amiro, B.D.; Barr, A.G.; Black, T.A.; McCaughey, J.H.; Margolis, H.A. Regional mapping of gross light-use efficiency using modis spectral indices. Remote Sens. Environ. 2008, 112, 3064–3078. [Google Scholar] [CrossRef]
  41. Gamon, J.A.; Bond, B. Effects of irradiance and photosynthetic downregulation on the photochemical reflectance index in douglas-fir and ponderosa pine. Remote Sens. Environ. 2013, 135, 141–149. [Google Scholar] [CrossRef]
  42. Garbulsky, M.F.; Peñuelas, J.; Gamon, J.; Inoue, Y.; Filella, I. The photochemical reflectance index (pri) and the remote sensing of leaf, canopy and ecosystem radiation use efficienciesa review and meta-analysis. Remote Sens. Environ. 2011, 115, 281–297. [Google Scholar] [CrossRef]
  43. Hernández-Clemente, R.; Navarro-Cerrillo, R.M.; Suárez, L.; Morales, F.; Zarco-Tejada, P.J. Assessing structural effects on pri for stress detection in conifer forests. Remote Sens. Environ. 2011, 115, 2360–2375. [Google Scholar] [CrossRef]
  44. Soudani, K.; Hmimina, G.; Dufrêne, E.; Berveiller, D.; Delpierre, N.; Ourcival, J.-M.; Rambal, S.; Joffre, R. Relationships between photochemical reflectance index and light-use efficiency in deciduous and evergreen broadleaf forests. Remote Sens. Environ. 2014, 144, 73–84. [Google Scholar] [CrossRef]
  45. Cheng, Y.-B.; Middleton, E.M.; Zhang, Q.; Corp, L.A.; Dandois, J.; Kustas, W.P. The photochemical reflectance index from directional cornfield reflectances: Observations and simulations. Remote Sens. Environ. 2012, 124, 444–453. [Google Scholar] [CrossRef] [Green Version]
  46. Mõttus, M.; Takala, T.L.; Stenberg, P.; Knyazikhin, Y.; Yang, B.; Nilson, T. Diffuse sky radiation influences the relationship between canopy pri and shadow fraction. ISPRS J. Photogramm. Remote Sens. 2015, 105, 54–60. [Google Scholar] [CrossRef]
  47. Stagakis, S.; Markos, N.; Sykioti, O.; Kyparissis, A. Tracking seasonal changes of leaf and canopy light use efficiency in a phlomis fruticosa mediterranean ecosystem using field measurements and multi-angular satellite hyperspectral imagery. ISPRS J. Photogramm. Remote Sens. 2014, 97, 138–151. [Google Scholar] [CrossRef]
  48. Zhou, Y.; Hilker, T.; Ju, W.; Coops, N.C.; Black, T.A.; Chen, J.M.; Wu, X. Modeling gross primary production for sunlit and shaded canopies across an evergreen and a deciduous site in canada. IEEE Trans. Geosci. Remote Sens. 2017, 55, 1859–1873. [Google Scholar] [CrossRef]
  49. Peguero-Pina, J.J.; Morales, F.; Flexas, J.; Gil-Pelegrín, E.; Moya, I. Photochemistry, remotely sensed physiological reflectance index and de-epoxidation state of the xanthophyll cycle in quercus coccifera under intense drought. Oecologia 2008, 156, 1–11. [Google Scholar] [CrossRef]
  50. Porcar-Castell, A.; Garcia-Plazaola, J.I.; Nichol, C.J.; Kolari, P.; Olascoaga, B.; Kuusinen, N.; Fernández-Marín, B.; Pulkkinen, M.; Juurola, E.; Nikinmaa, E. Physiology of the seasonal relationship between the photochemical reflectance index and photosynthetic light use efficiency. Oecologia 2012, 170, 313–323. [Google Scholar] [CrossRef]
  51. Sims, D.A.; Luo, H.; Hastings, S.; Oechel, W.; Rahman, A.; Gamon, J. Parallel adjustments in vegetation greenness and ecosystem CO2 exchange in response to drought in a southern california chaparral ecosystem. Remote Sens. Environ. 2006, 103, 289–303. [Google Scholar] [CrossRef]
  52. Ogren, W.L. Photorespiration: Pathways, regulation, and modification. Annu. Rev. Plant Physiol. 1984, 35, 415–442. [Google Scholar] [CrossRef]
  53. Wingler, A.; Lea, P.J.; Quick, W.P.; Leegood, R.C. Photorespiration: Metabolic pathways and their role in stress protection. Philos. Trans. R. Soc. B Biol. Sci. 2000, 355, 1517–1529. [Google Scholar] [CrossRef]
  54. Asrar, G.; Myneni, R.B.; Choudhury, B.J. Spatial heterogeneity in vegetation canopies and remote sensing of absorbed photosynthetically active radiation: A modeling study. Remote Sens. Environ. 1992, 41, 85–103. [Google Scholar] [CrossRef]
  55. Myneni, R.B.; Ramakrishna, R.; Nemani, R.; Running, S.W. Estimation of global leaf area index and absorbed par using radiative transfer models. IEEE Trans. Geosci. Remote Sens. 2002, 35, 1380–1393. [Google Scholar] [CrossRef]
  56. Zhang, Q.; Cheng, Y.B.; Lyapustin, A.I.; Wang, Y.; Gao, F.; Suyker, A.; Verma, S.; Middleton, E.M. Estimation of crop gross primary production (gpp): Fapar chl versus mod15a2 fpar. Remote Sens. Environ. 2014, 153, 1–6. [Google Scholar] [CrossRef]
  57. Zhang, Q.; Cheng, Y.B.; Lyapustin, A.I.; Wang, Y.; Xiao, X.; Suyker, A.; Verma, S.; Tan, B.; Middleton, E.M. Estimation of crop gross primary production (gpp): I. Impact of modis observation footprint and impact of vegetation brdf characteristics. Agric. For. Meteorol. 2014, 191, 51–63. [Google Scholar] [CrossRef]
  58. Zhang, Q.; Cheng, Y.B.; Lyapustin, A.I.; Wang, Y.; Zhang, X.; Suyker, A.; Verma, S.; Shuai, Y.; Middleton, E.M. Estimation of crop gross primary production (gpp): Ii. Do scaled modis vegetation indices improve performance? Agric. For. Meteorol. 2015, 200, 1–8. [Google Scholar] [CrossRef]
  59. Dong, T.; Wu, B.; Meng, J.; Xin, D.; Shang, J. Sensitivity analysis of retrieving fraction of absorbed photosynthetically active radiation (fpar) using remote sensing data. Acta Ecol. Sin. 2016, 36, 1–7. [Google Scholar] [CrossRef]
  60. Liang, S.; Zheng, T.; Liu, R.; Fang, H.; Tsay, S.C.; Running, S. Estimation of incident photosynthetically active radiation from moderate resolution imaging spectrometer data. J. Geophys. Res. Atmos. 2006, 111. [Google Scholar] [CrossRef]
  61. Liu, R.; Liang, S.; He, H.; Liu, J.; Zheng, T. Mapping incident photosynthetically active radiation from modis data over china. Remote Sens. Environ. 2008, 112, 998–1009. [Google Scholar]
  62. Porcar-Castell, A.; Tyystjärvi, E.; Atherton, J.; van der Tol, C.; Flexas, J.; Pfündel, E.E.; Moreno, J.; Frankenberg, C.; Berry, J.A. Linking chlorophyll a fluorescence to photosynthesis for remote sensing applications: Mechanisms and challenges. J. Exp. Bot. 2014, 65, 4065–4095. [Google Scholar] [CrossRef]
  63. Evain, S.; Flexas, J.; Moya, I. A new instrument for passive remote sensing: 2. Measurement of leaf and canopy reflectance changes at 531 nm and their relationship with photosynthesis and chlorophyll fluorescence. Remote Sens. Environ. 2004, 91, 175–185. [Google Scholar] [CrossRef]
  64. Hall, F.G.; Hilker, T.; Coops, N.C. Photosynsat, photosynthesis from space: Theoretical foundations of a satellite concept and validation from tower and spaceborne data. Remote Sens. Environ. 2011, 115, 1918–1925. [Google Scholar] [CrossRef]
  65. Hall, F.G.; Hilker, T.; Coops, N.C.; Lyapustin, A.; Huemmrich, K.F.; Middleton, E.; Margolis, H.; Drolet, G.; Black, T.A. Multi-angle remote sensing of forest light use efficiency by observing pri variation with canopy shadow fraction. Remote Sens. Environ. 2008, 112, 3201–3211. [Google Scholar] [CrossRef]
  66. Hilker, T.; Leeuwen, M.; Coops, N.C.; Wulder, M.A.; Newnham, G.J.; Jupp, D.L.B.; Culvenor, D.S. Comparing canopy metrics derived from terrestrial and airborne laser scanning in a douglas-fir dominated forest stand. Trees 2010, 24, 819–832. [Google Scholar] [CrossRef]
  67. Gu, L.; Baldocchi, D.; Verma, S.B.; Black, T.A.; Vesala, T.; Falge, E.M.; Dowty, P.R. Advantages of diffuse radiation for terrestrial ecosystem productivity. J. Geophys. Res. Atmos. 2002, 107, ACL 2-1–ACL 2-23. [Google Scholar] [CrossRef]
  68. Ellsworth, D.S.; Reich, P.B. Canopy structure and vertical patterns of photosynthesis and related leaf traits in a deciduous forest. Oecologia 1993, 96, 169–178. [Google Scholar] [CrossRef]
  69. Wilson, J.W. Stand structure and light penetration. Iii. Sunlit foliage area. J. Appl. Ecol. 1967, 4, 159. [Google Scholar] [CrossRef]
  70. Chen, J.M.; Leblanc, S.G. A four-scale bidirectional reflectance model based on canopy architecture. IEEE Trans. Geosci. Remote Sens. 1997, 35, 1316–1337. [Google Scholar] [CrossRef]
  71. Fan, W.; Chen, J.M.; Ju, W.; Zhu, G. Gost: A geometric-optical model for sloping terrains. IEEE Trans. Geosci. Remote Sens. 2014, 52, 5469–5482. [Google Scholar]
  72. Fan, W.; Li, J.; Liu, Q. Gost2: The improvement of the canopy reflectance model gost in separating the sunlit and shaded leaves. IEEE J. Sel. Top. Appl. Earth Obs. Remote Sens. 2015, 8, 1423–1431. [Google Scholar] [CrossRef]
  73. Zhang, Q.; Chen, J.M.; Ju, W.; Wang, H.; Qiu, F.; Yang, F.; Fan, W.; Huang, Q.; Wang, Y.P.; Feng, Y. Improving the ability of the photochemical reflectance index to track canopy light use efficiency through differentiating sunlit and shaded leaves. Remote Sens. Environ. 2017, 194, 1–15. [Google Scholar] [CrossRef]
  74. Stenberg, P. Penumbra in within-shoot and between-shoot shading in conifers and its significance for photosynthesis. Ecol. Model. 1995, 77, 215–231. [Google Scholar] [CrossRef]
  75. Wen, X.; Yu, G.-R.; Sun, X.-M.; Li, Q.-K.; Liu, Y.-F.; Zhang, L.-M.; Ren, C.-Y.; Fu, Y.-L.; Li, Z.-Q. Soil moisture effect on the temperature dependence of ecosystem respiration in a subtropical pinus plantation of southeastern china. Agric. For. Meteorol. 2006, 137, 166–175. [Google Scholar] [CrossRef]
  76. Falge, E.; Baldocchi, D.; Olson, R.; Anthoni, P.; Aubinet, M.; Bernhofer, C.; Burba, G.; Ceulemans, R.; Clement, R.; Han, D. Gap filling strategies for defensible annual sums of net ecosystem exchange ☆. Agric. For. Meteorol. 2001, 107, 43–69. [Google Scholar] [CrossRef]
  77. Lloyd, J.; Taylor, J. On the temperature dependence of soil respiration. Funct. Ecol. 1994, 315–323. [Google Scholar] [CrossRef]
  78. Zhang, Q.; Ju, W.; Chen, J.; Wang, H.; Yang, F.; Fan, W.; Huang, Q.; Zheng, T.; Feng, Y.; Zhou, Y.; et al. Ability of the photochemical reflectance index to track light use efficiency for a sub-tropical planted coniferous forest. Remote Sens. 2015, 7, 16938–16962. [Google Scholar] [CrossRef]
  79. Fan, W.; Chen, J.M.; Ju, W.; Nesbitt, N. Hybrid geometric optical–radiative transfer model suitable for forests on slopes. IEEE Trans. Geosci. Remote Sens. 2014, 52, 5579–5586. [Google Scholar]
  80. Hilker, T.; Hall, F.G.; Coops, N.C.; Lyapustin, A.; Wang, Y.; Nesic, Z.; Grant, N.; Black, T.A.; Wulder, M.A.; Kljun, N. Remote sensing of photosynthetic light-use efficiency across two forested biomes: Spatial scaling. Remote Sens. Environ. 2010, 114, 2863–2874. [Google Scholar] [CrossRef]
  81. Middleton, E.M.; Cheng, Y.B.; Hilker, T.; Black, T.A.; Krishnan, P.; Coops, N.C.; Huemmrich, K.F. Linking foliage spectral responses to canopy-level ecosystem photosynthetic light-use efficiency at a douglas-fir forest in canada. Can. J. Remote Sens. 2009, 35, 166–188. [Google Scholar] [CrossRef]
  82. Hilker, T.; Gitelson, A.; Coops, N.C.; Hall, F.G.; Black, T.A. Tracking plant physiological properties from multi-angular tower-based remote sensing. Oecologia 2011, 165, 865–876. [Google Scholar] [CrossRef] [PubMed] [Green Version]
  83. Hilker, T.; Coops, N.C.; Schwalm, C.R. Effects of mutual shading of tree crowns on prediction of photosynthetic light-use efficiency in a coastal douglas fir forest. Tree Physiol. 2008, 28, 825–834. [Google Scholar] [CrossRef] [PubMed]
  84. Wong, C.Y.; Gamon, J.A. Three causes of variation in the photochemical reflectance index (pri) in evergreen conifers. New Phytol. 2015, 206, 187–195. [Google Scholar] [CrossRef] [PubMed]
  85. Gamon, J.A.; Field, C.; Bilger, W.; Björkman, O.; Fredeen, A.; Peñuelas, J. Remote sensing of the xanthophyll cycle and chlorophyll fluorescence in sunflower leaves and canopies. Oecologia 1990, 85, 1–7. [Google Scholar] [CrossRef]
  86. Butler, W.L. Energy distribution in the photochemical apparatus of photosynthesis. Annu. Rev. Plant Physiol. 1978, 29, 345–378. [Google Scholar] [CrossRef]
  87. Magney, T.S.; Eusden, S.A.; Eitel, J.U.H.; Logan, B.A.; Jiang, J.; Vierling, L.A. Assessing leaf photoprotective mechanisms using terrestrial lidar: Towards mapping canopy photosynthetic performance in three dimensions. New Phytol. 2014, 201, 344–356. [Google Scholar] [CrossRef]
  88. Magney, T.S.; Vierling, L.A.; Eitel, J.U.; Huggins, D.R.; Garrity, S.R. Response of high frequency photochemical reflectance index (pri) measurements to environmental conditions in wheat. Remote Sens. Environ. 2016, 173, 84–97. [Google Scholar] [CrossRef]
  89. Coops, N.C.; Hermosilla, T.; Hilker, T.; Andrew Black, T. Linking stand architecture with canopy reflectance to estimate vertical patterns of light-use efficiency. Remote Sens. Environ. 2017, 194, 322–330. [Google Scholar] [CrossRef]
Figure 1. PT estimated from three models. Data observed from 10:45 to 11:00 on April 11, 2013 were displayed here. The view zenith angle was the same as solar zenith angle (triangles) to finish a horizontal cycle at the beginning of the observation cycle, and then changed to (42°, 52°, 62°) for each view azimuth angle (backward and forward looking changing alternatively, defined from geodetic north). Different symbols represent different view zenith angles.
Remotesensing 11 01643 g001
Figure 2. The data fraction, expressed as percent frequency, that reaches a level of significance (p < 0.05) in the correlation between observed and retrieved photochemical reflectance index (PRI) values using model I and model II within every 15-min interval during the study period from April to September. The solid lines represent the mean residuals (multiplied by 100) of retrieved PRI in each month.
Remotesensing 11 01643 g002
Figure 3. The frequency that reaches different levels of significance in the correlation between the observed PRI and retrieved PRI values using the three models within every 15-min interval in April. The last volume represents the mean residuals (multiplied by 1000) of retrieved PRI from the three models.
Remotesensing 11 01643 g003
Figure 4. Diurnal variations of half-hourly PRIb, PRIt, light use efficiency (LUE) and absorbed photosynthetically active radiation (APAR) from 8:00 to 17:00. The coefficients of determination (R2) of LUE and APAR with PRIb and PRIt were also calculated. The grey areas denote the standard deviations of each of the four terms.
Remotesensing 11 01643 g004
Figure 5. Seasonal variations of daily PRIb, PRIt, LUE and APAR averaged from half-hourly data from 10:00 to 15:30 per day. The solid line indicates the moving averages of the five samples.
Remotesensing 11 01643 g005
Figure 6. Number of days on which the correlation coefficients (R) of PRIb and PRIt with (a) LUE and (b) APAR are significant at different levels (p). The value of R between half-hourly PRIb/PRIt and LUE and APAR was calculated per day with more than five good-quality observations from 7:00 to 17:30.
Remotesensing 11 01643 g006
Figure 7. Relationships of PRIb and PRIt with APAR and LUE at half-hourly temporal scales with observations from 7:00 to 17:30 throughout the study period. The two R2 represent the coefficients of determination of linear (red) and exponential (green) regressions, respectively.
Remotesensing 11 01643 g007
Figure 8. Relationships of PRIb and PRIt with APAR and LUE at daily temporal scales averaged from half-hourly data from 10:00 to 15:30 throughout the study period. The two R2 represent the coefficients of determination of linear (red) and exponential (green) regressions, respectively.
Remotesensing 11 01643 g008
Table 1. The canopy structure parameters for the geometric-optical model for sloping terrains (GOST). Ha is the height of the lower part of the tree (trunk space), Hb is the height of crown, r is the diameter of the crown, α is the half apex angle, Ws is the mean width of elements shadows cast inside tree crowns, γE is the needle-to-shoot area ratio and G(θ) is the projection of unit leaf areas.
LAIHaHbrαWsΩγEG(θ)
5.89 m4.5 m2.5 m25°0.17 m0.5710.5

