Automated Visual Recognizability Evaluation of Traffic Sign Based on 3D LiDAR Point Clouds


 ,
, 
Abstract
1. Introduction
2. Related Work
2.1. Visibility and Recognizability Evaluation
2.2. Traffic Sign Detection and Classification
2.3. Road Marking Detection and Classification
3. Definition of Models
3.1. Vem Model
- Geometric factor evaluationWe use the principle of retinal imaging to consider the impact of the geometric factor. The evaluation of the geometric factor, , is given as follows:where is the imaging area of retinal of a sign from viewpoint ; is the retinal imaging area of a standard traffic sign viewed from the “unit viewpoint”.The reason for introducing is to make the value of fall in intervals . The “unit viewpoint” is a viewpoint that has a unit distance to the panel and in the normal line passing through the center of the panel. The are illustrated in Figure 2a. To ensure , we set the unit distance, , at less than 3 m. It is unnecessary to compute the visibility of a traffic sign when the observation distance is less than three meters. Due to the vehicle almost passing through the traffic sign, it is highly impractical (almost impossible) for the driver to turn around 90° to observe the traffic sign.is inversely proportional to the following: (1) the angle between the line connecting the viewpoint to the center of the traffic sign panel and the normal passing through the center (orientation factor); (2) observation distance; and (3) the damage degree of the traffic sign panel.
- Occlusion factor evaluationAs K. Doman [12] did, we consider the ratio of occlusion into the model. The occlusion factor is given as follows:where is the occluded imaging area of retinal of a sign from viewpoint ; is the penalization weight.when the ratio of occlusion, , is constant, decreases as increases; when is constant, decreases as the ratio of occlusion increases. To ensure is nearly zero when ratio of occlusion is nearly one and the traffic sign cannot be recognized under the situation of half occlusion, must satisfy the condition: .
- Sight line deviation factor evaluationGiven and , the sight line deviation factor reflects the different imaging positions on the retina that may lead to different visibilities. An object viewed from the line-of-sight in front of a driver’s eye is seen more clearly than an object viewed from the periphery. When a traffic sign is fall in GFOV, it can be recognized; otherwise, it is unrecognizable. The evaluation of the driver’s sight line deviation factor, , is established as follows:where is the angle between sight line and line from viewpoint to the center of traffic sign; G is the GFOV angle; V is the maximum angle between sight line and the line from viewpoint to the “A” pillar of the vehicle far from the driver; is the punishment weight. The are illustrated in Figure 2b.The GFOV decreases progressively with increasing vehicle speed [4,6]. G depends on the actual 85th percentile driving speed [50,51]. The actual 85th percentile driving speed on a road can be obtained by traffic big data.The line-of-sight, the middle line of GFOV, is along the driving direction. If , a driver must turn his head to see traffic signs, thereby reducing the visibility of the traffic signs. If , then , because V is the maximum viewing angle for a driver.
3.2. Tsvrem Model
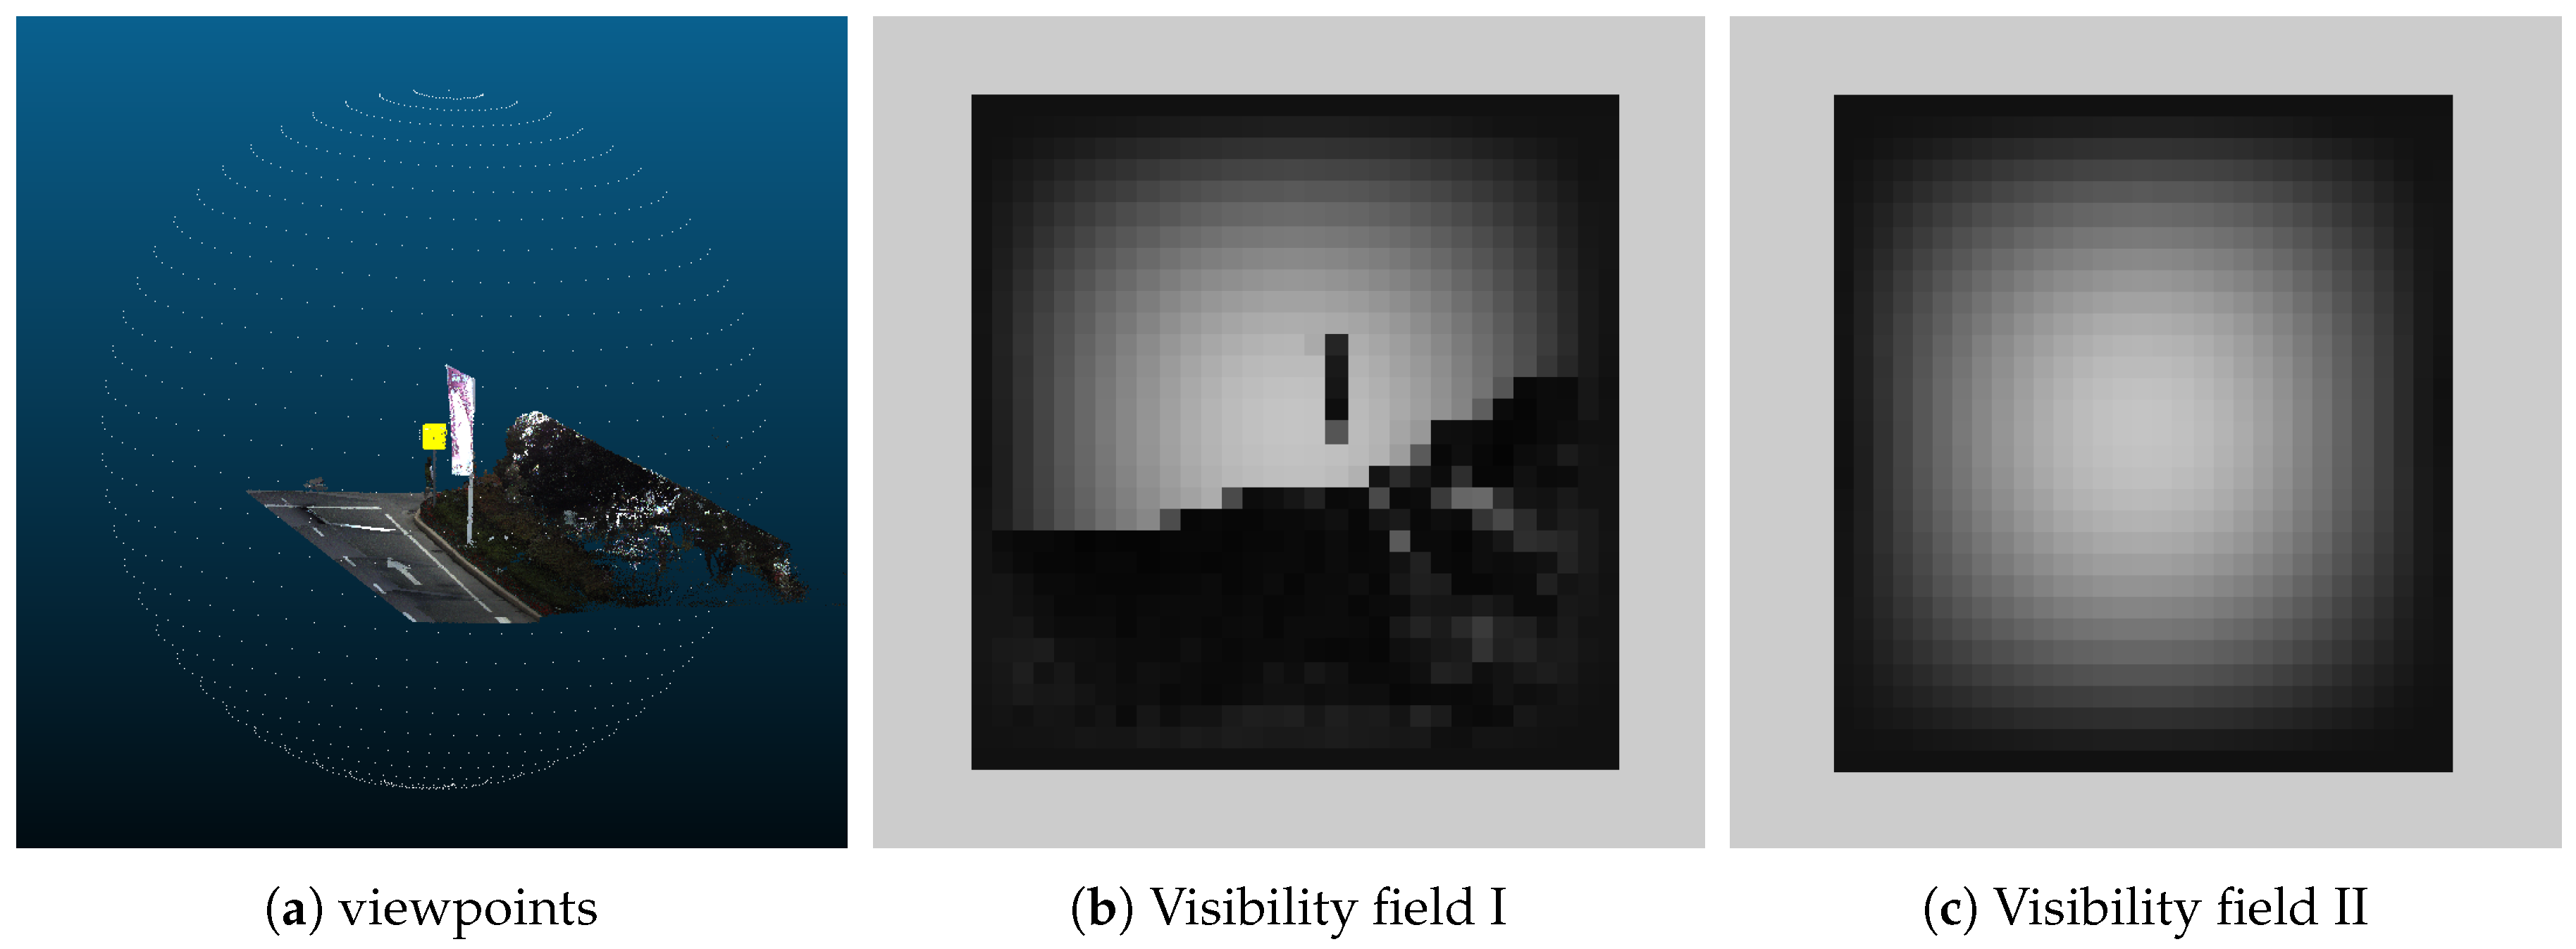
3.2.1. Viewpoint Recognizability and Definition of Visual Recognizability Field
3.2.2. Traffic Sign Visual Recognizability
4. Tsvrem Model Implementation
| Algorithm 1 TSVREM Model Implementation | |
| Input: MLS point clouds, trajectory | |
| Output: visibility field, visual recognizability field, | |
| traffic sign visual recognizability, occluding points | |
| 1: | Detect traffic signs [31], road markings [48] |
| 2: | Select viewpoints from road markings Section 4.1.1 |
| 3: | Segment traffic sign surrounding point clouds Section 4.1.2 |
| 4: | for each viewpoint |
| 5: | Translate and rotate [55] a group input data to human view |
| 6: | Compute traffic sign retina imaging area Section 4.2.1 |
| 7: | Compute occlusion point clouds retina imaging area Section 4.2.2 |
| 8: | Compute sight line deviation degree Section 4.2.3 |
| 9: | Compute visibility in actual traffic surrounding Equation (5) |
| 10: | Compute visibility in standard traffic surrounding Section 4.2.4 Equation (6) |
| 11: | Compute recognizability Equation (7) |
| 12: | end for |
| 13: | Compute traffic sign visual recognizability according to Equation (8) |
4.1. Viewpoints Selection and Segment Traffic Sign Surrounding Point Clouds
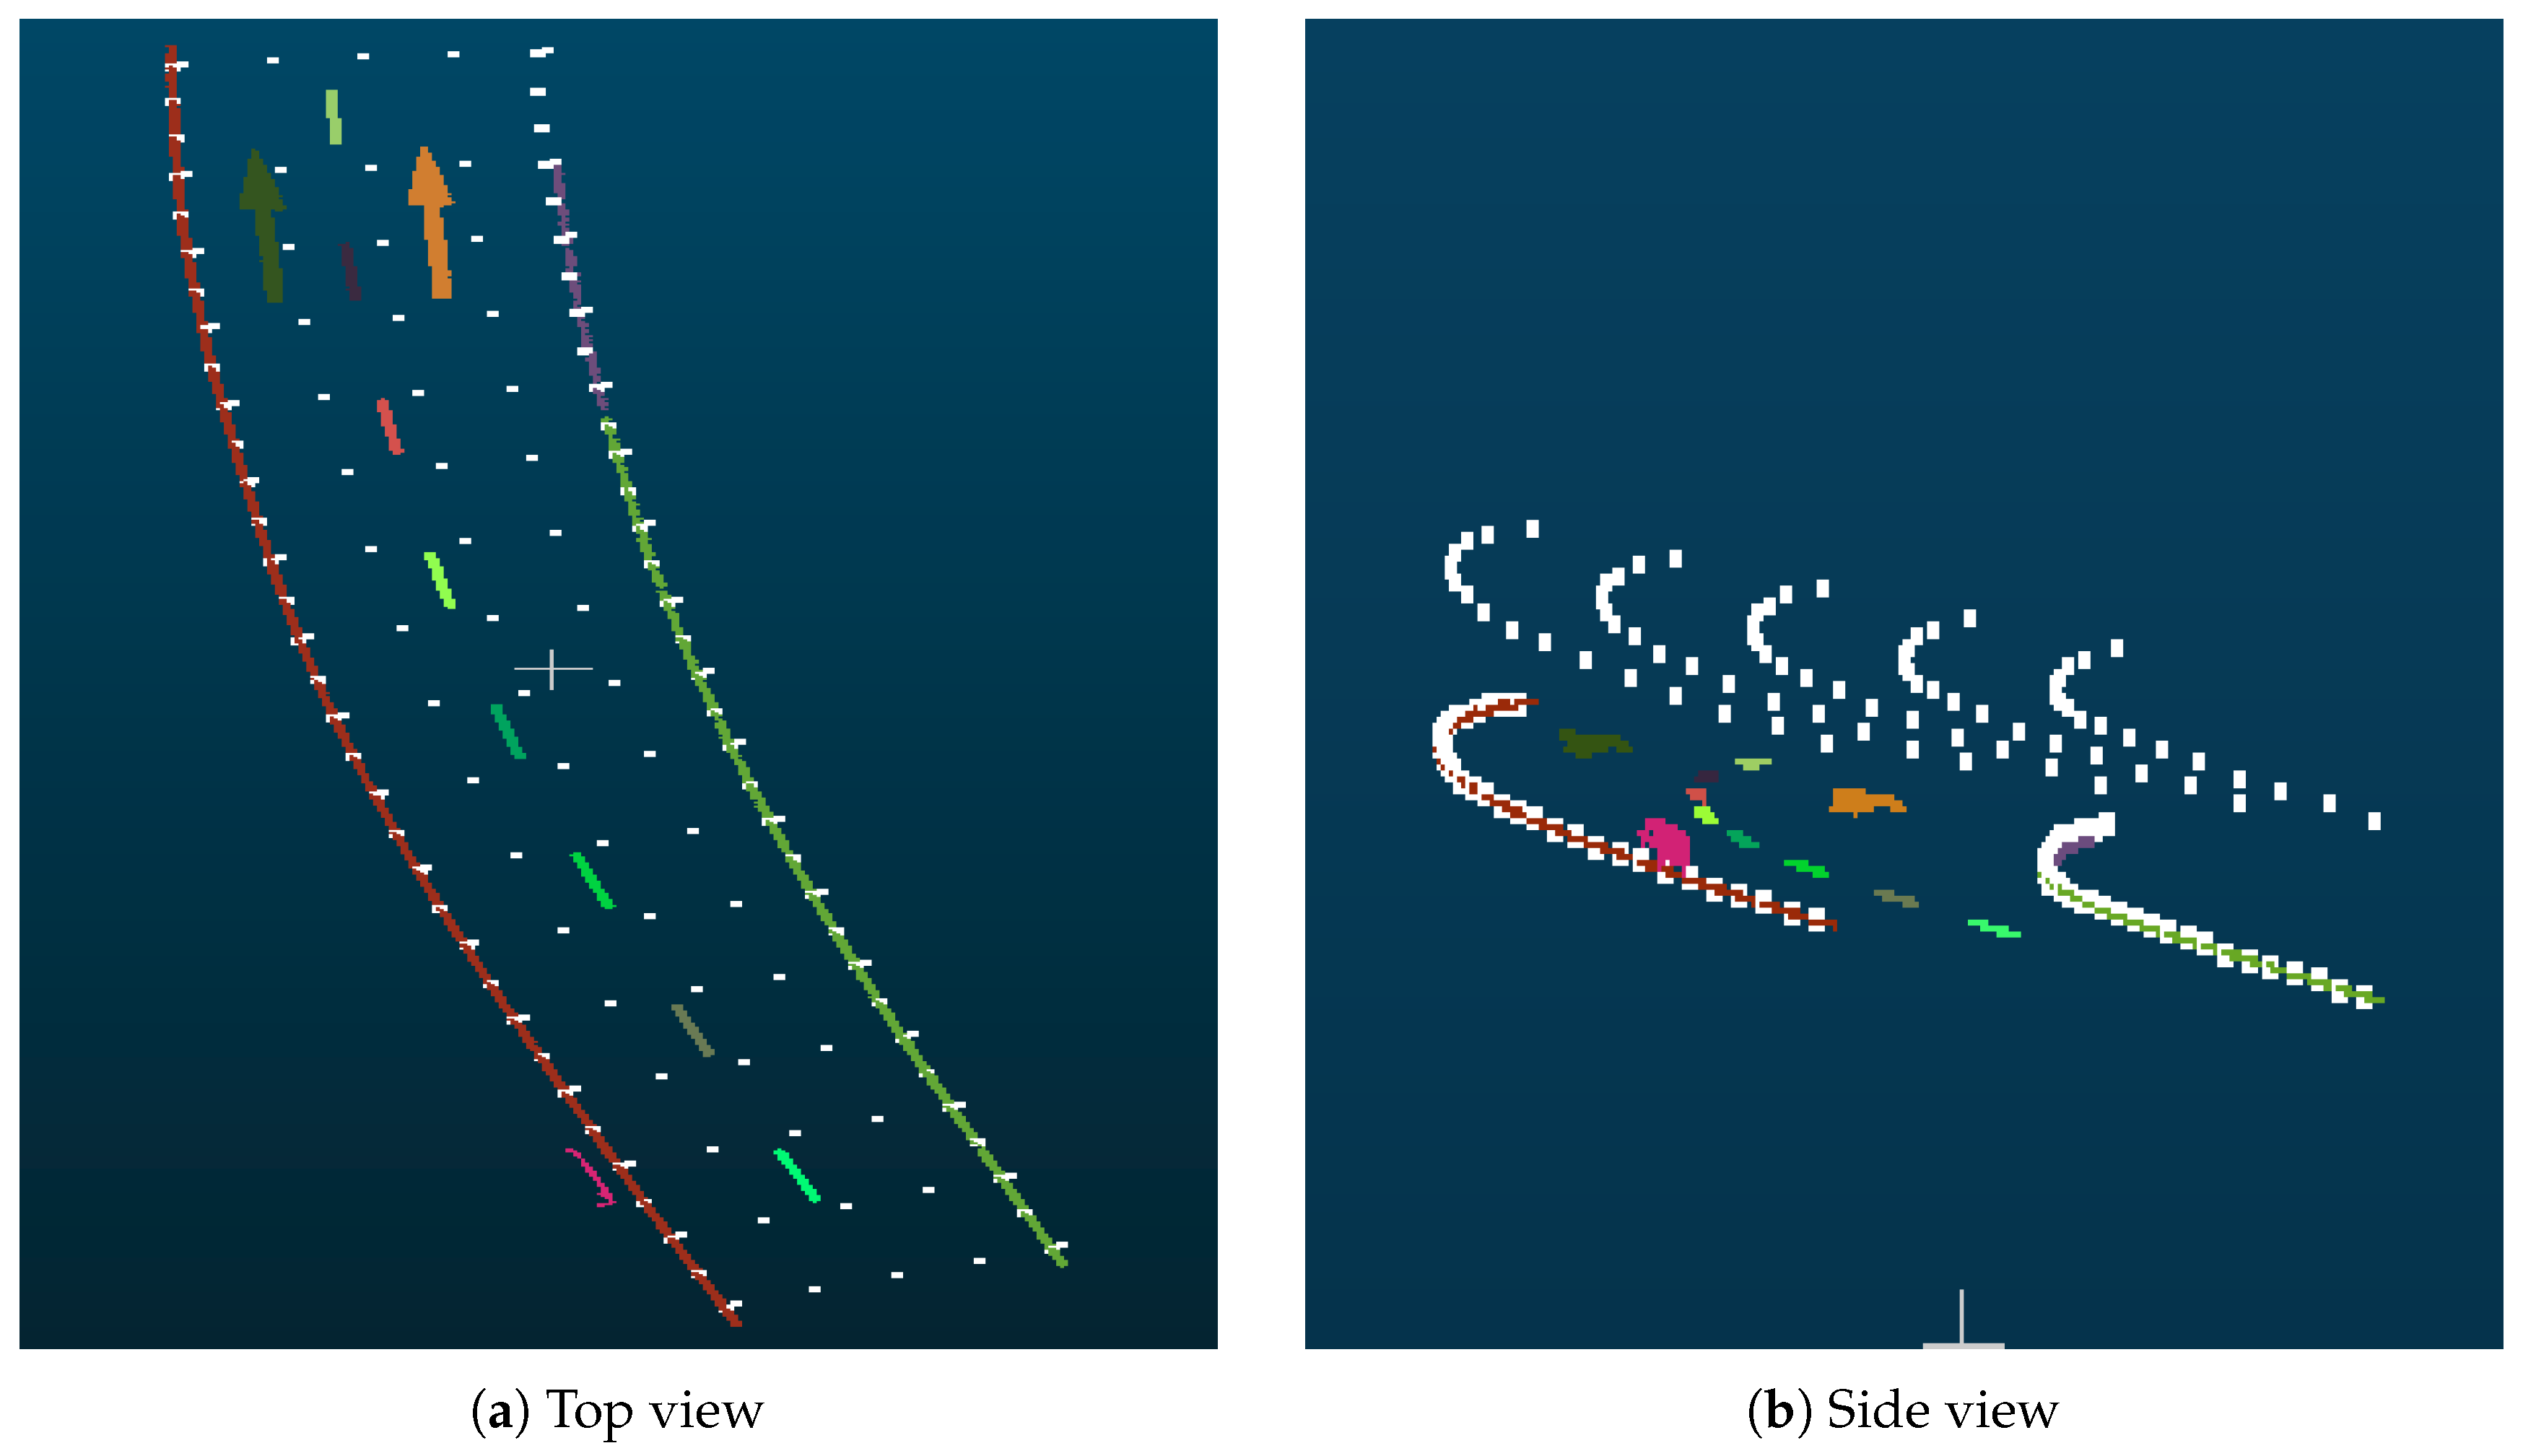
4.1.1. Viewpoints Selection
4.1.2. Segment Traffic Sign Surrounding Point Clouds
4.2. Traffic Sign Visual Recognizability Computing
4.2.1. Traffic Sign Retina Imaging Area Computing
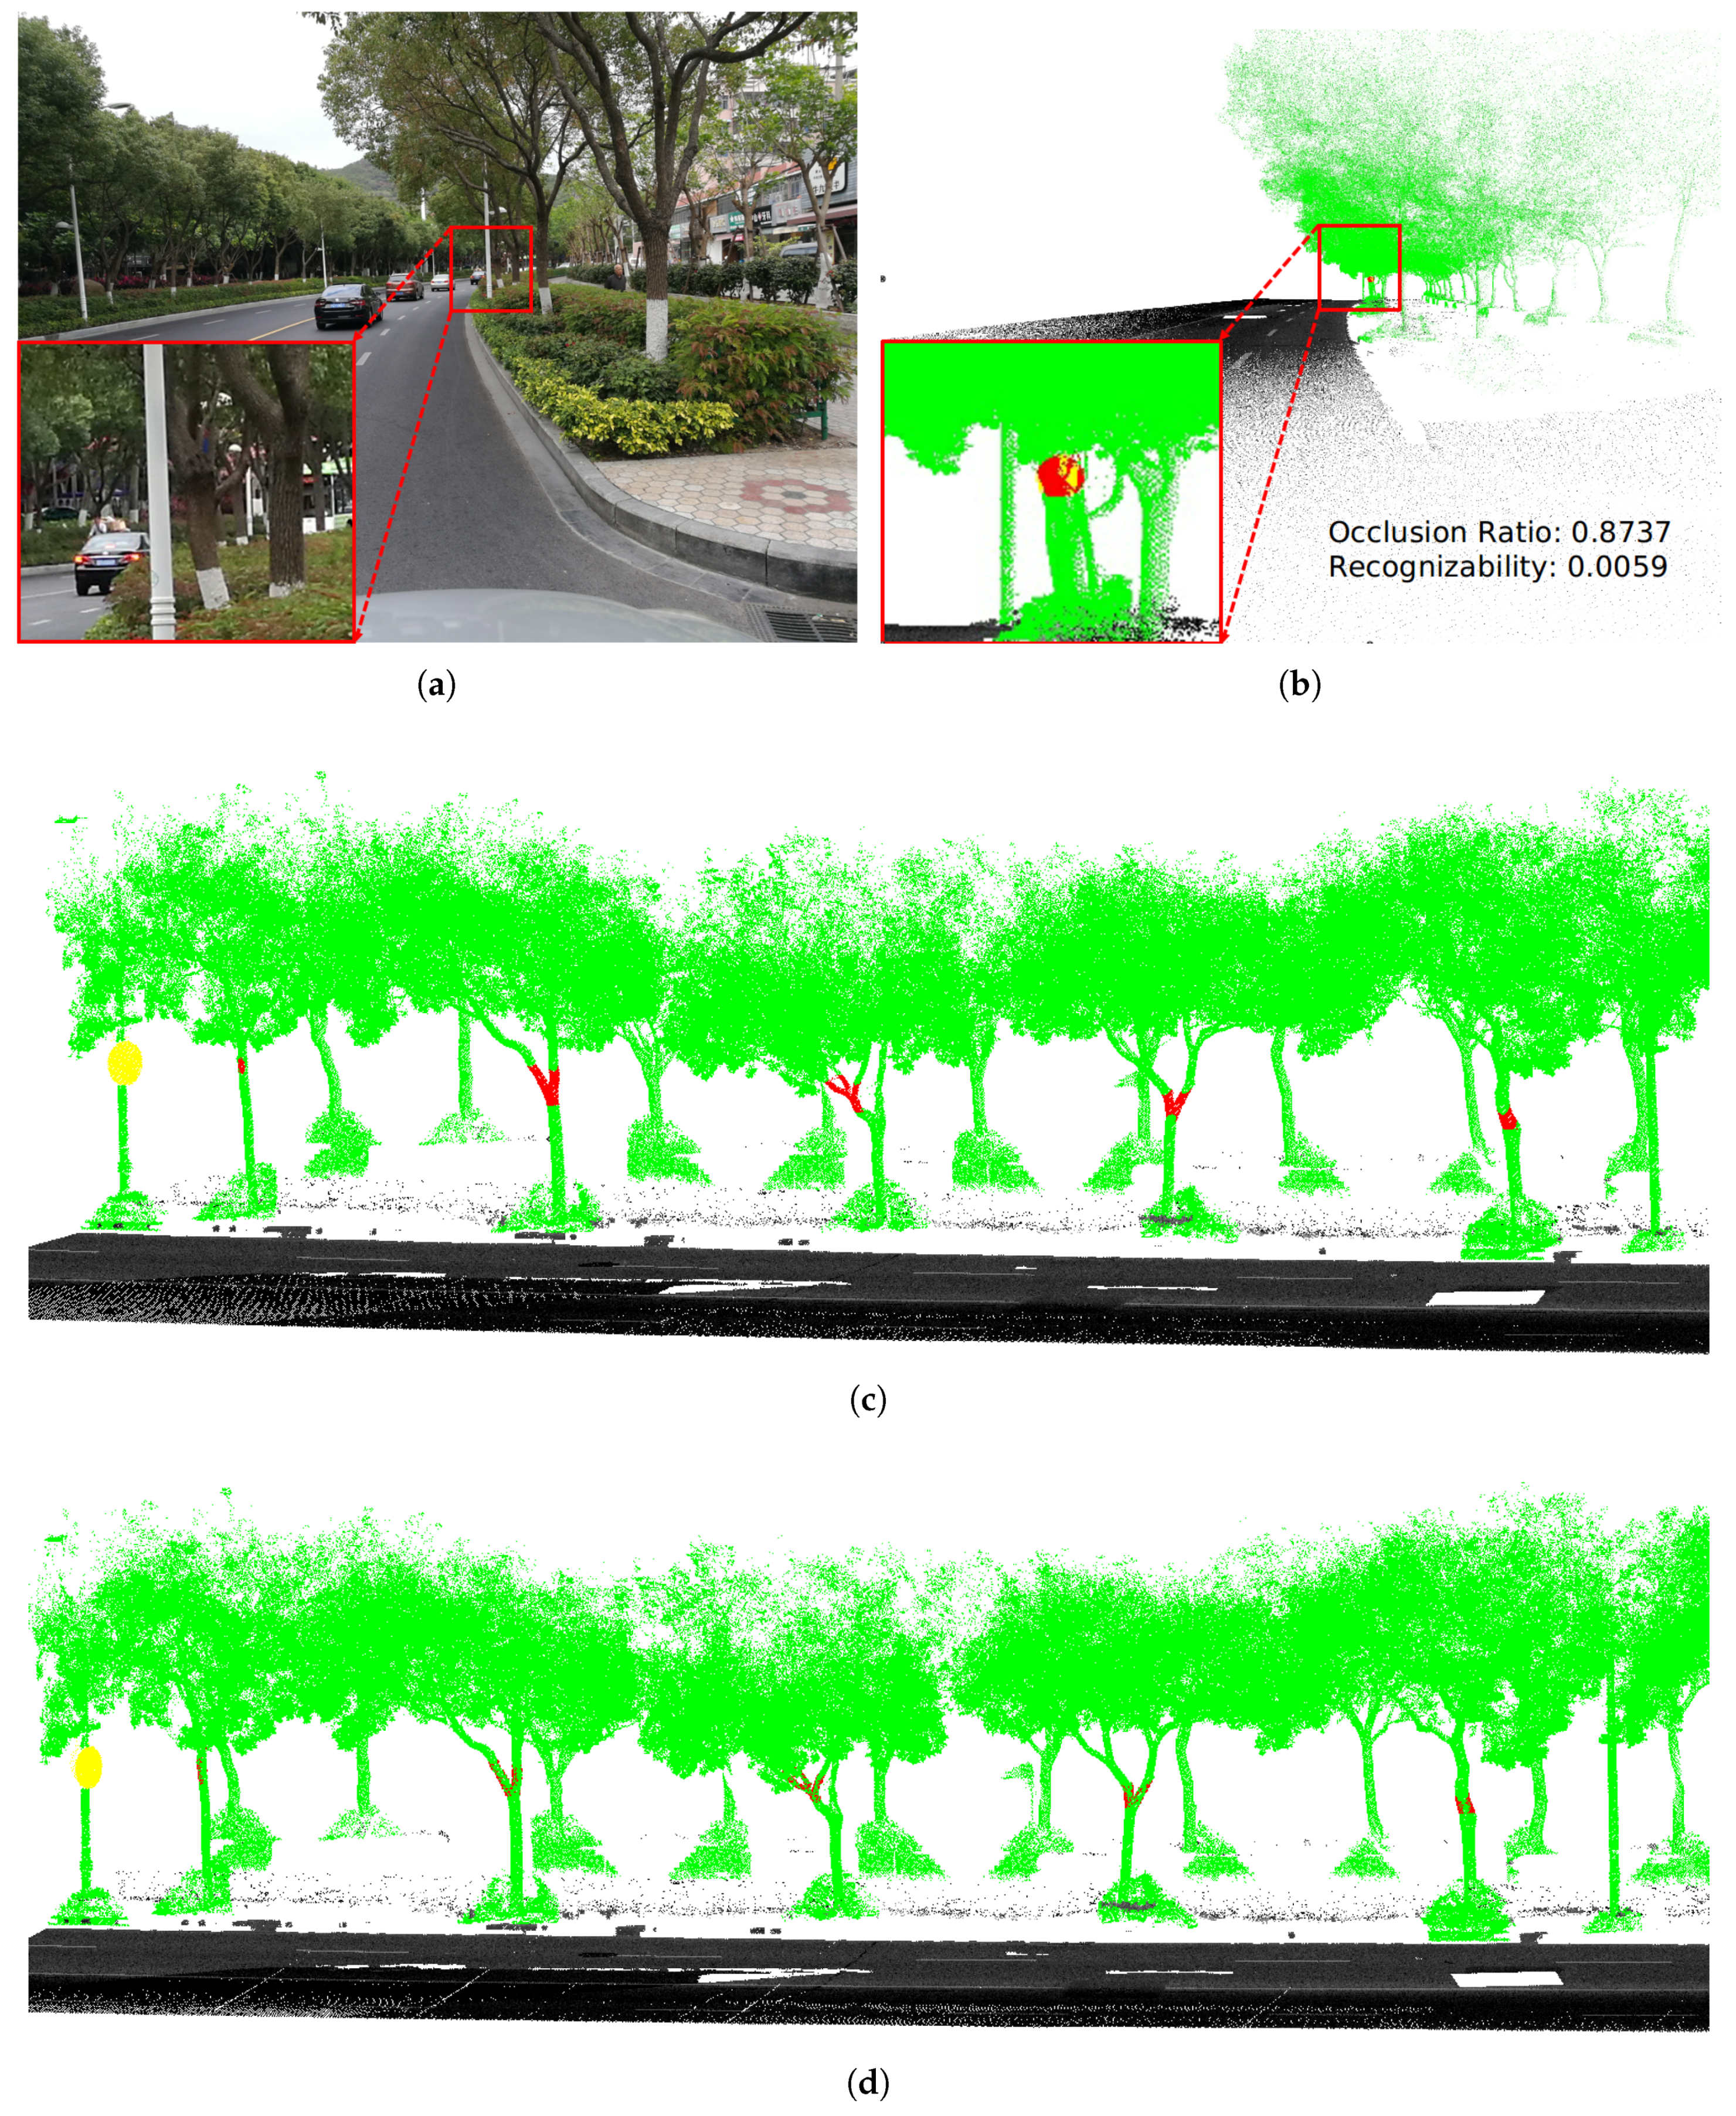
4.2.2. Occlusion Point Clouds Retina Imaging Area Computing
4.2.3. Sight Line Deviation Computing
4.2.4. Standard Traffic Surrounding Setting
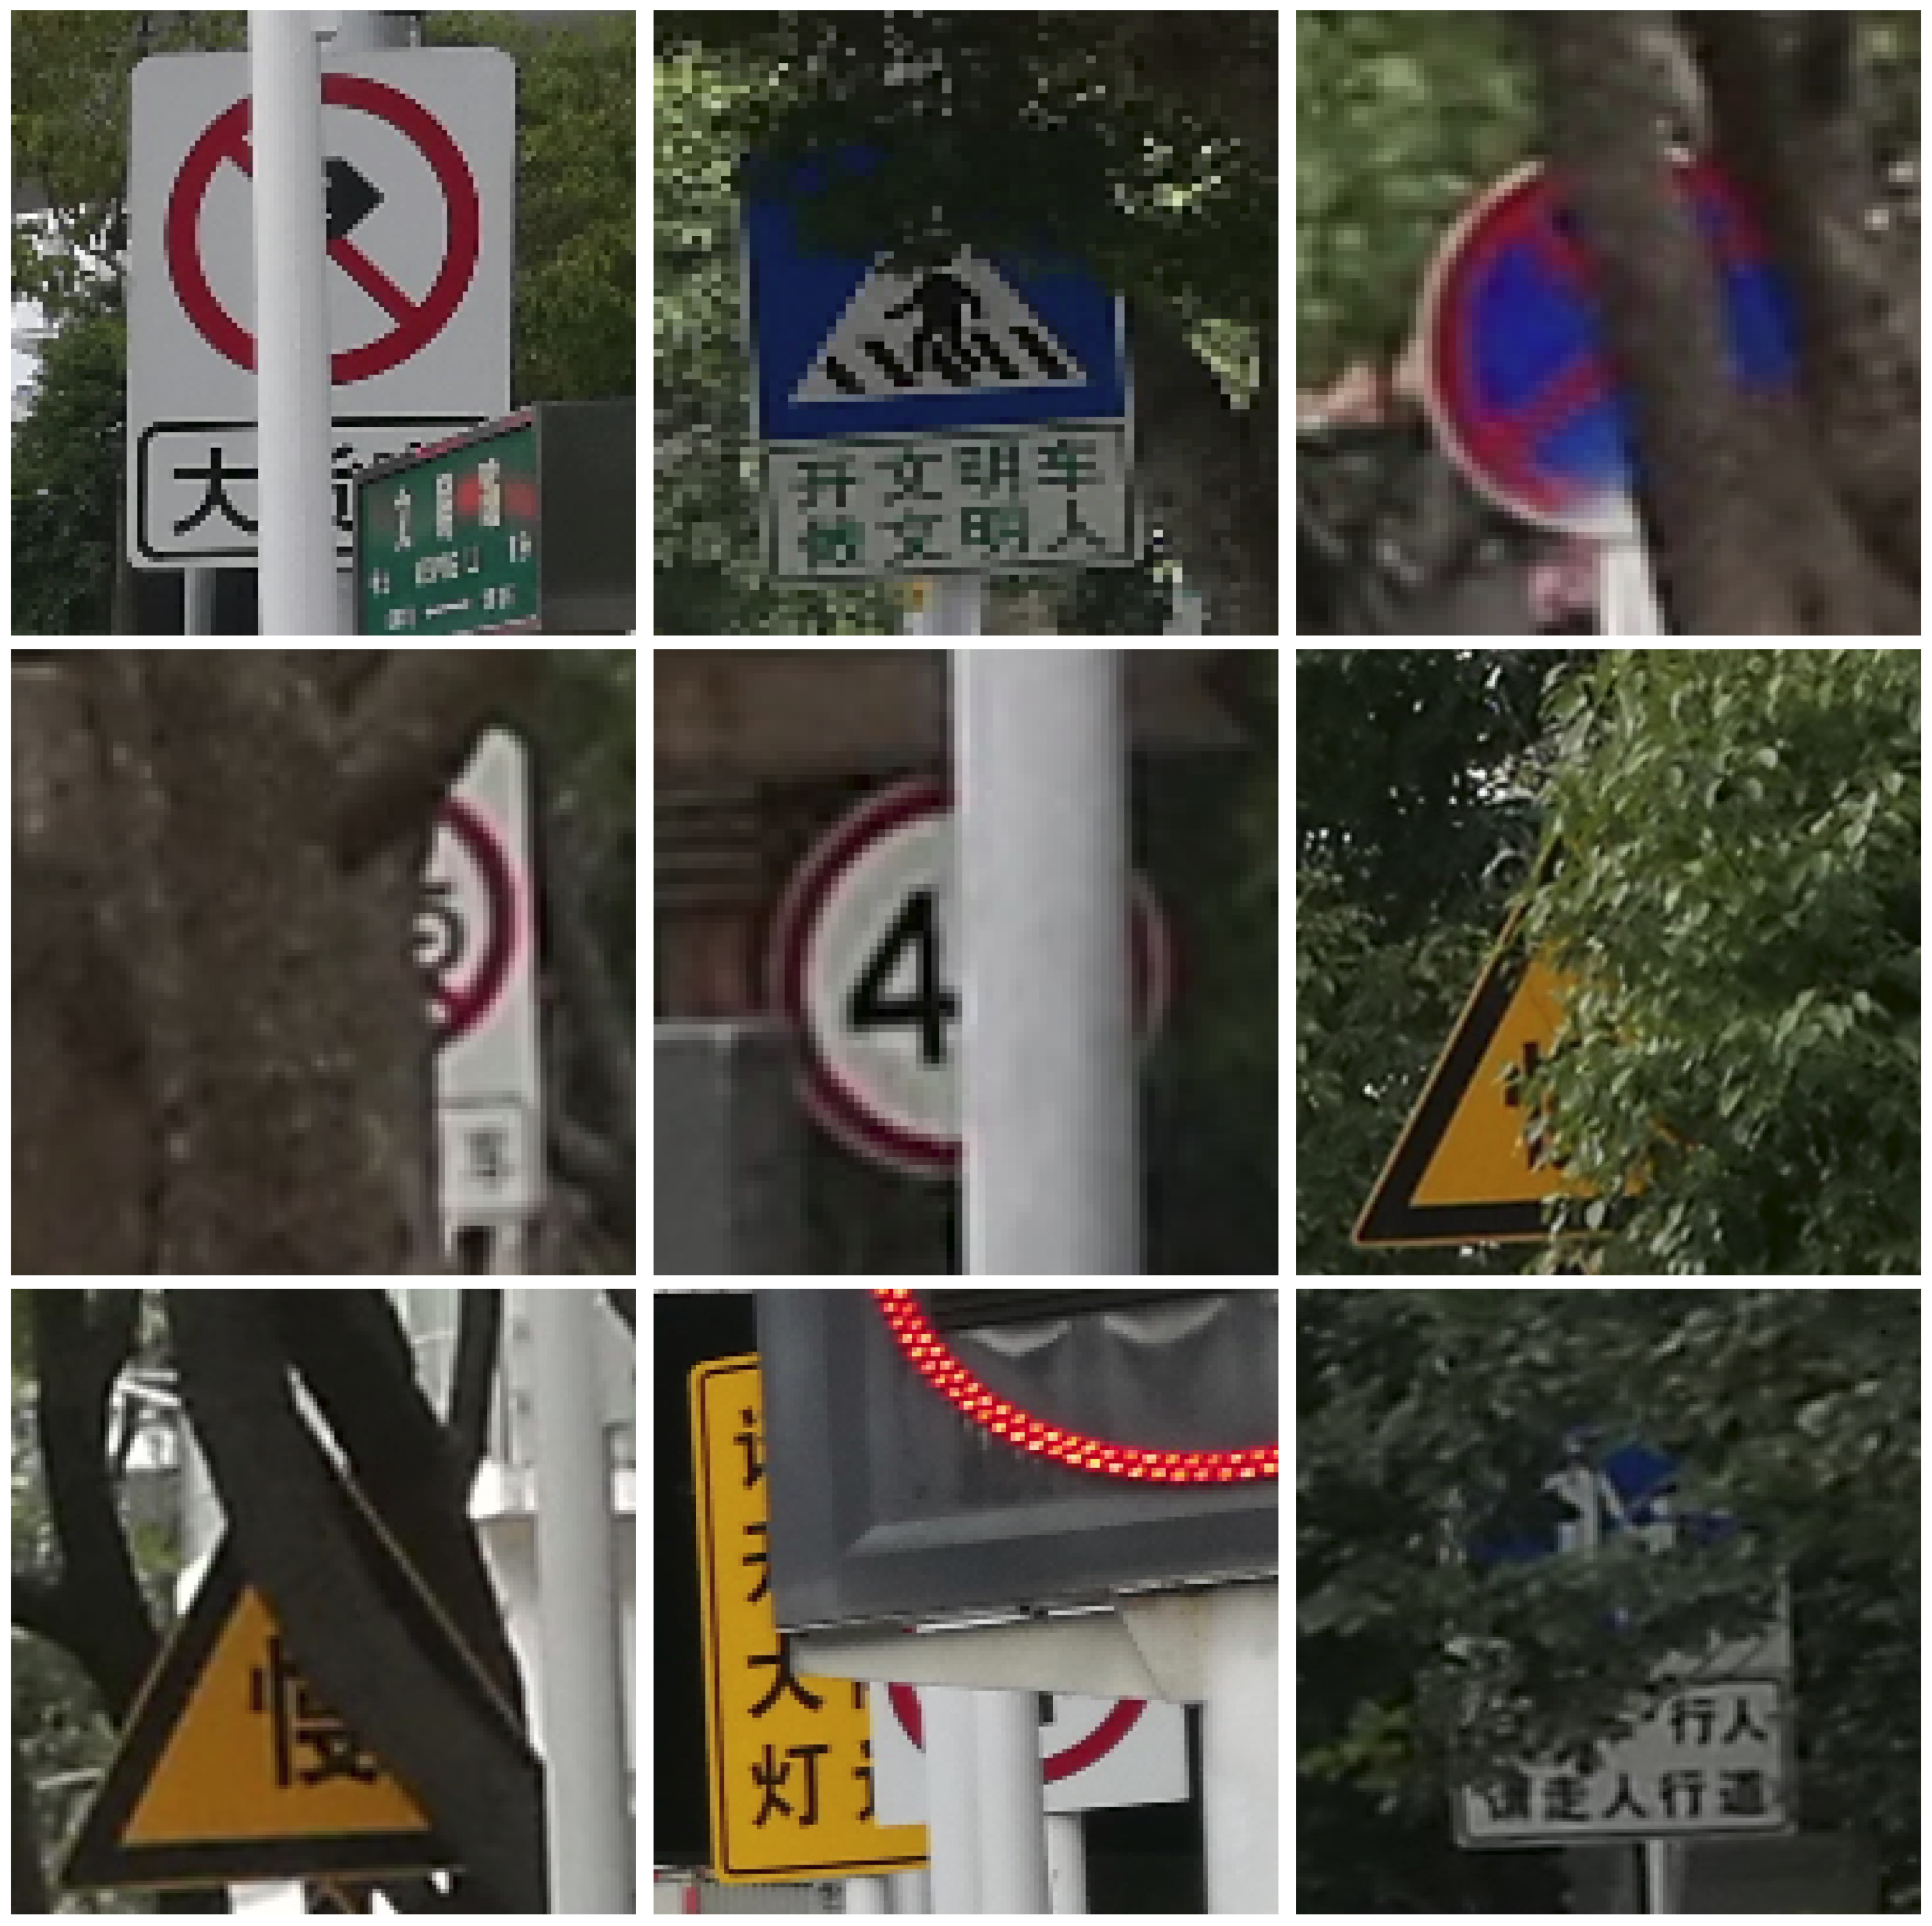
5. Experiments And Discussion
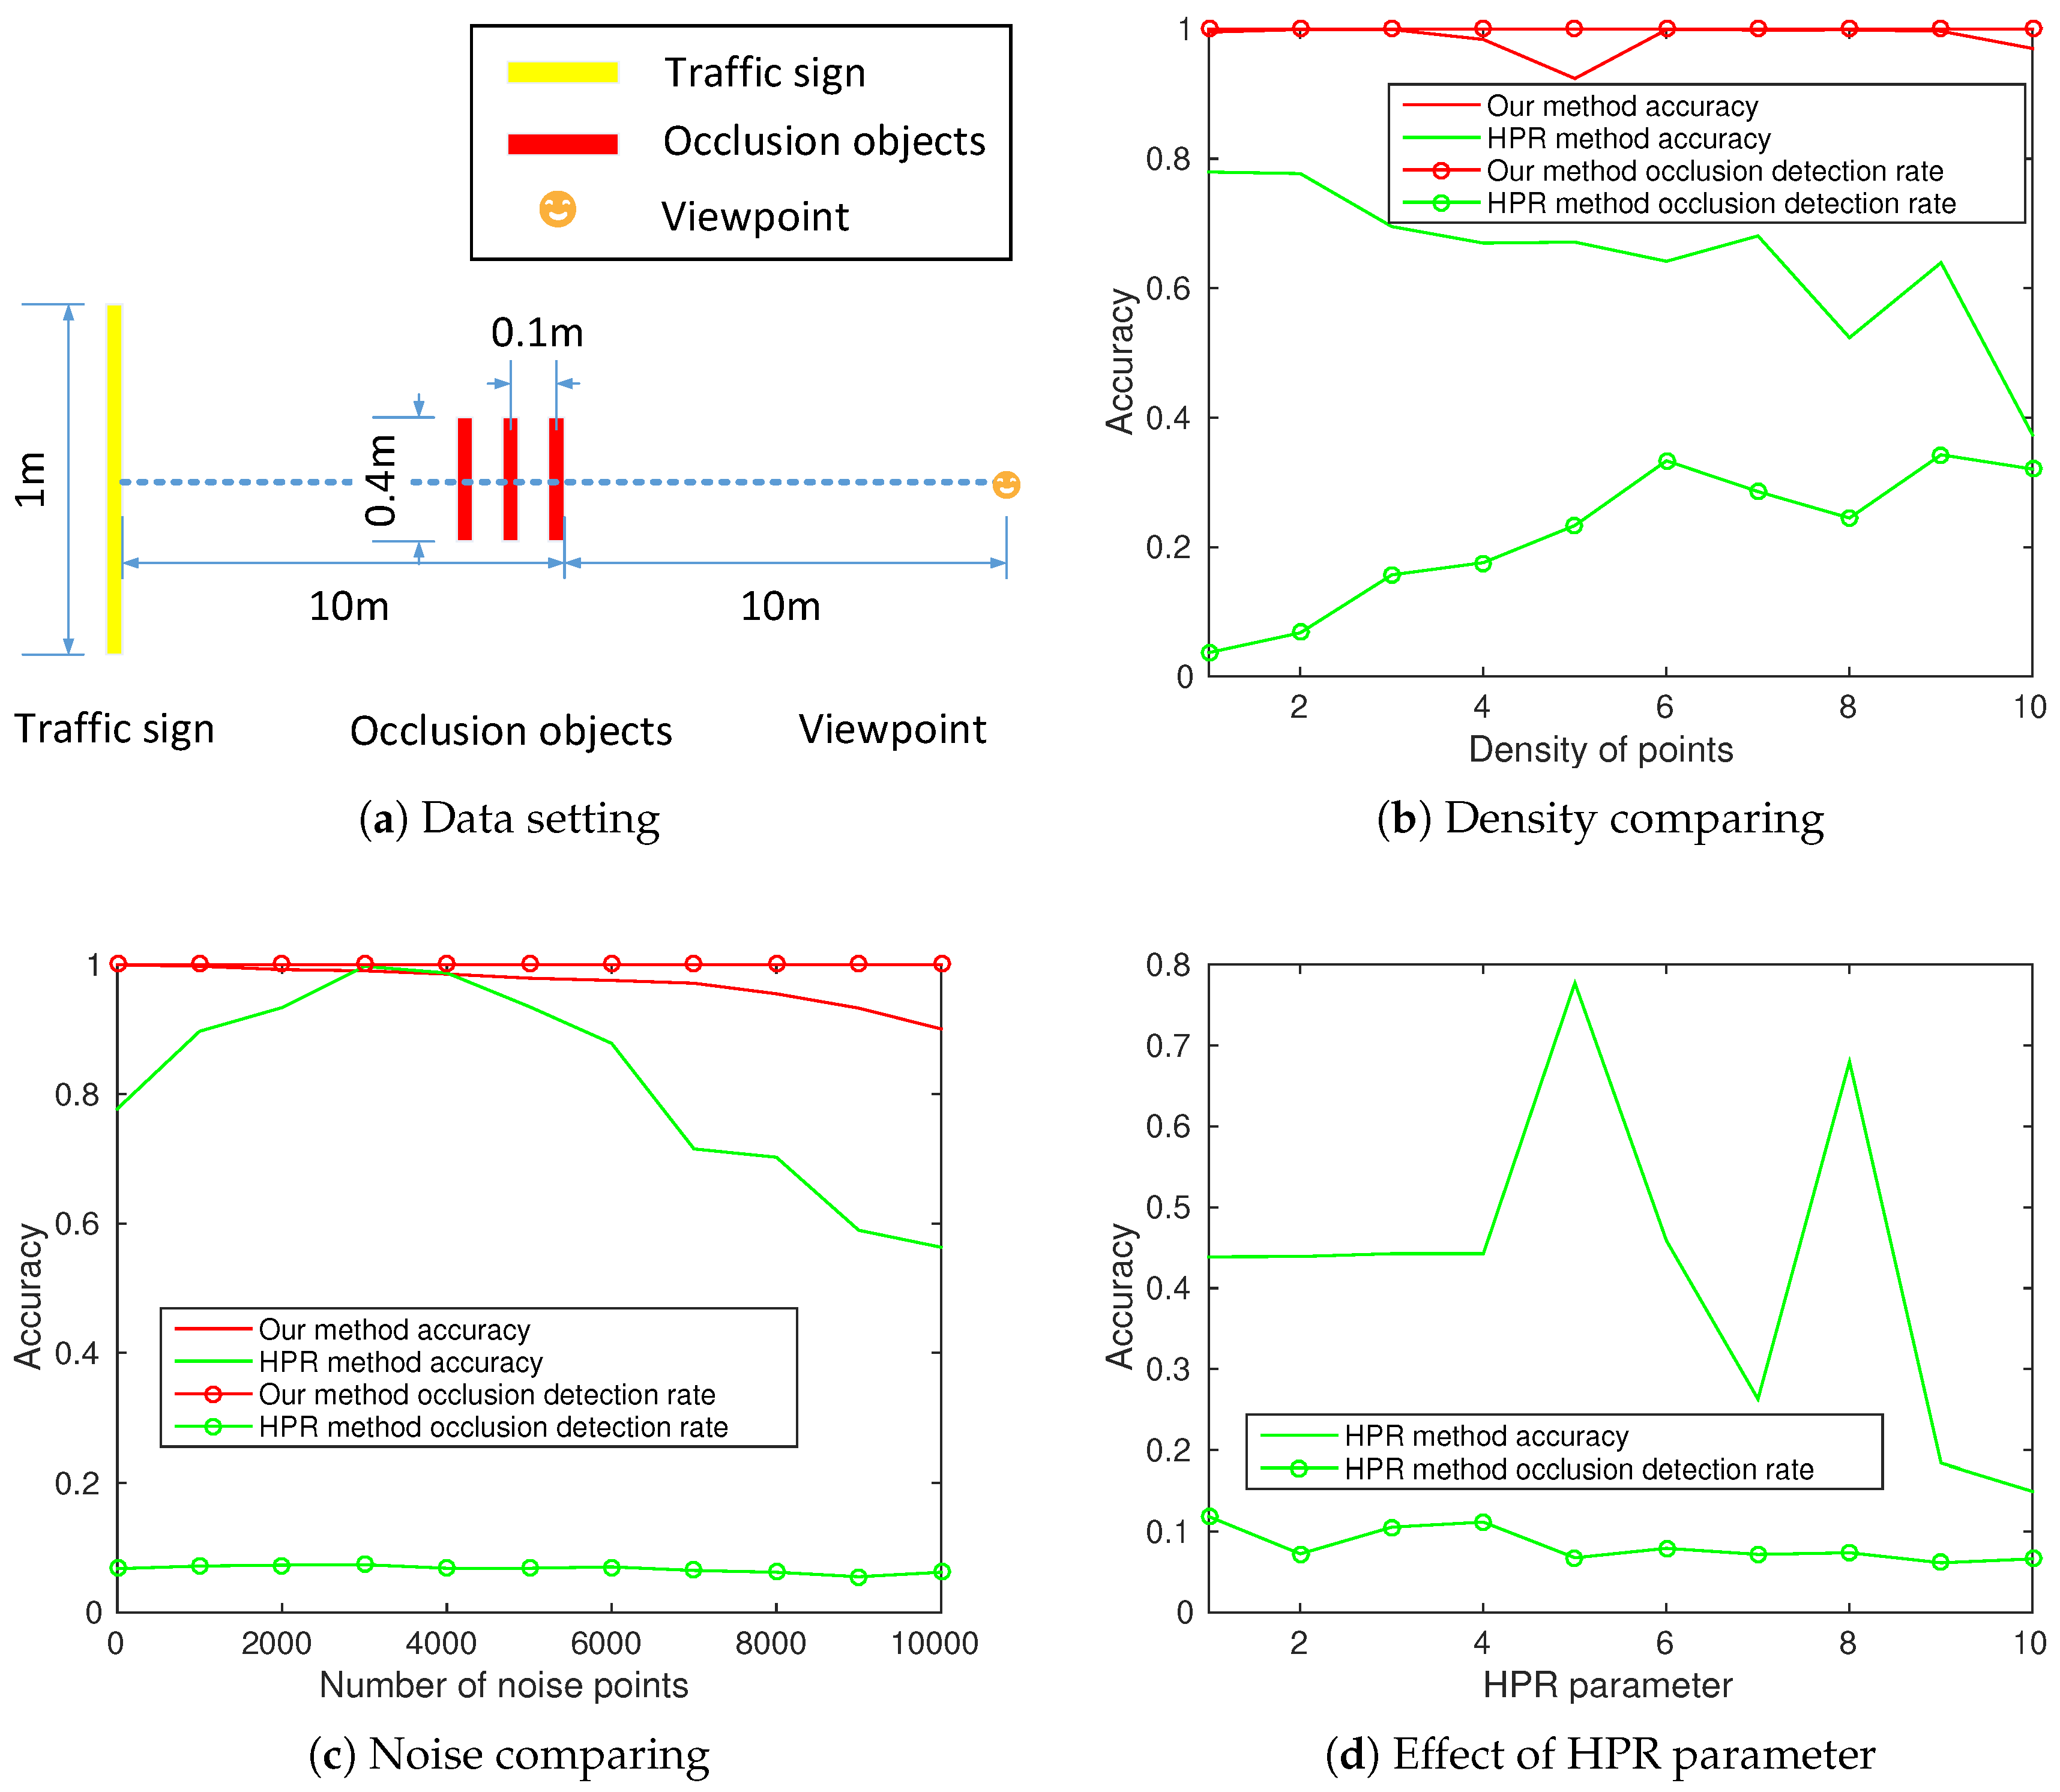
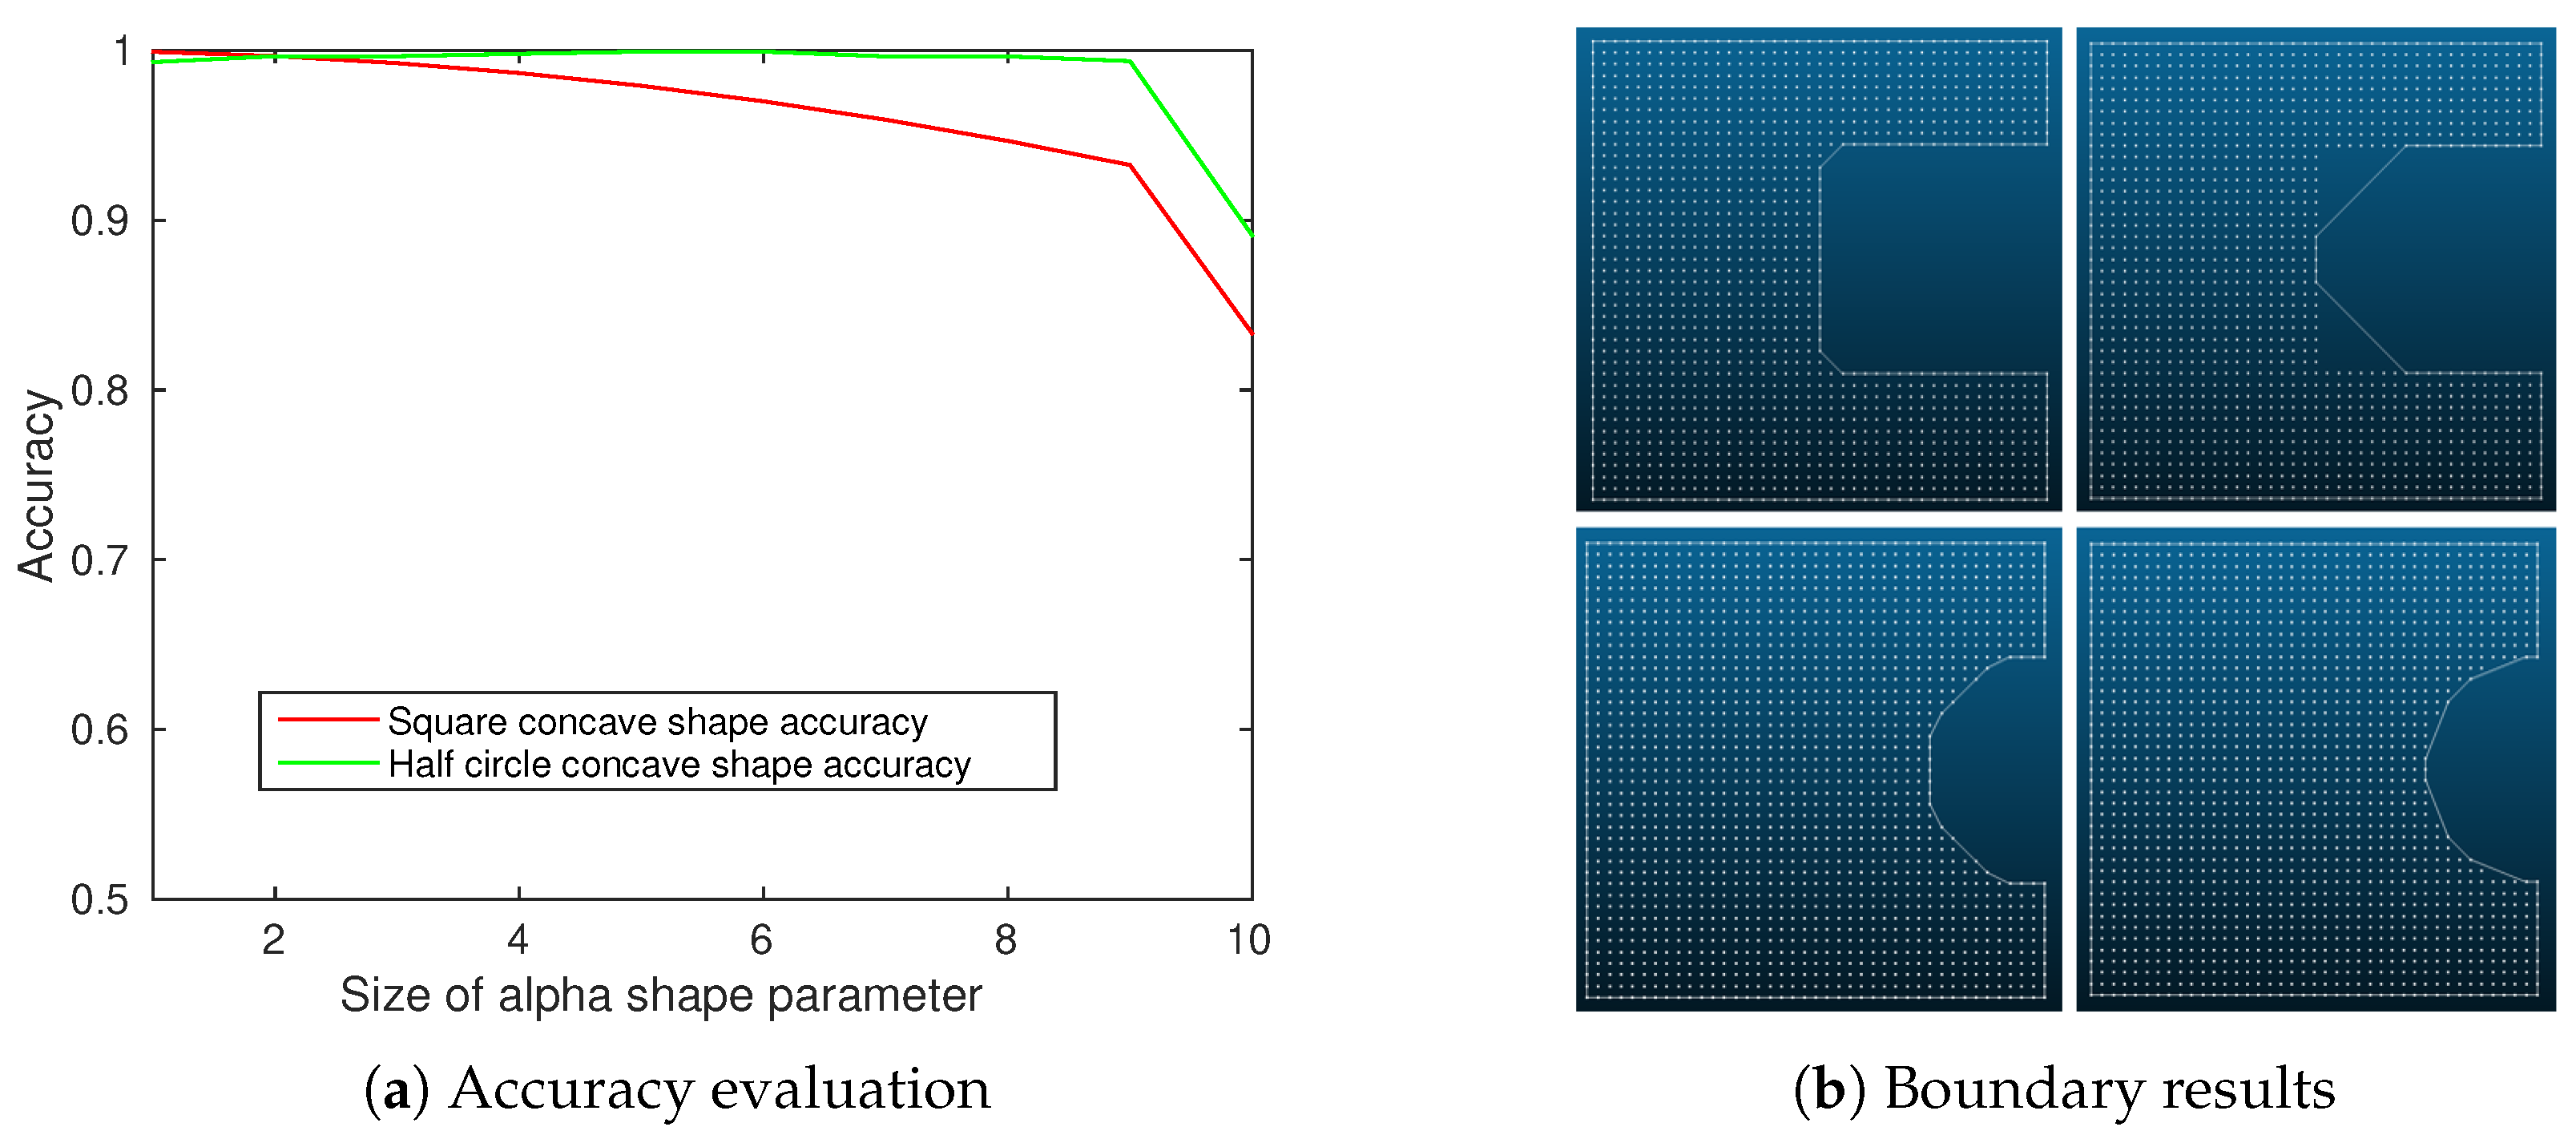
5.1. Parameter Sensitivity Analysis
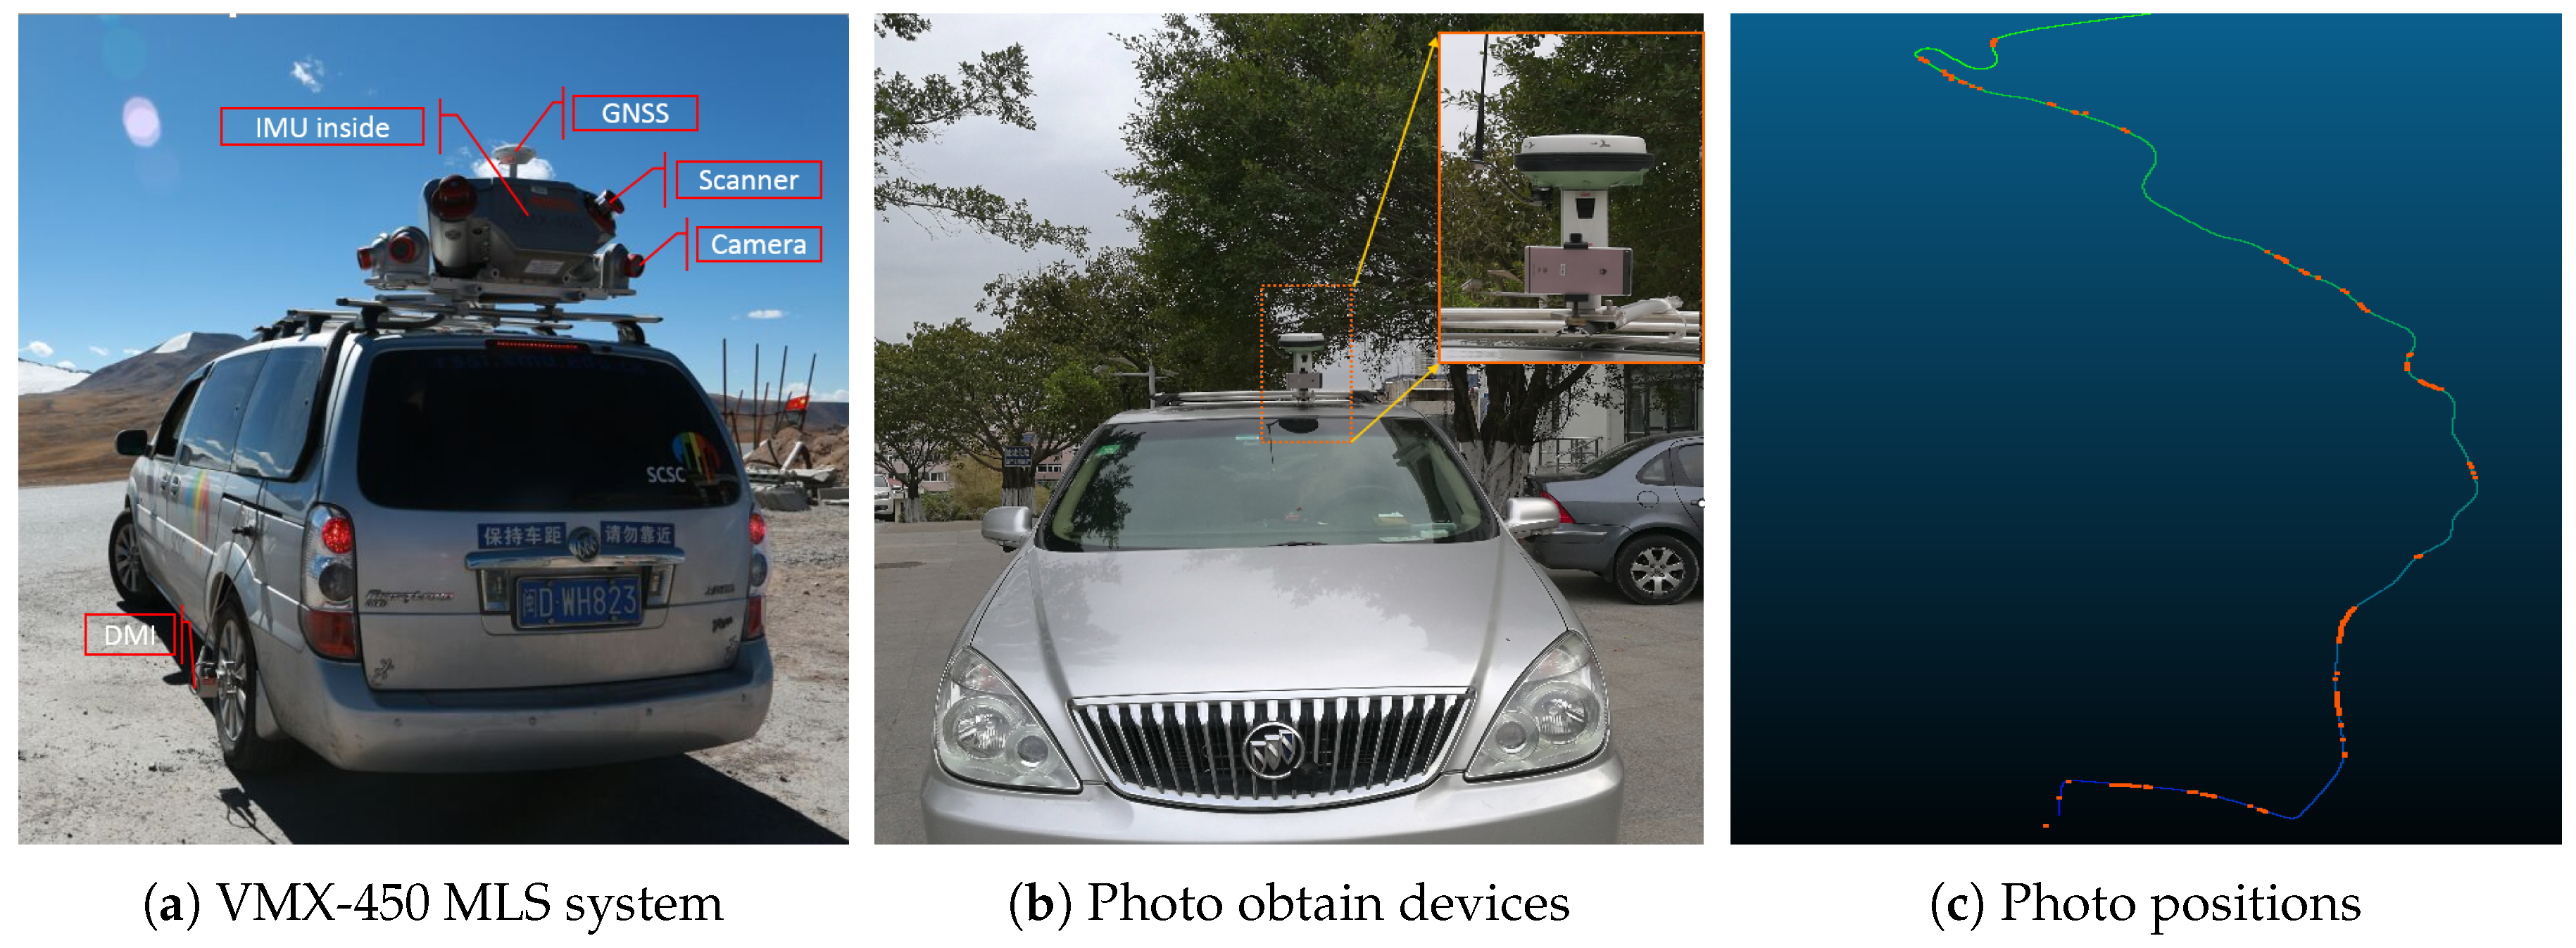
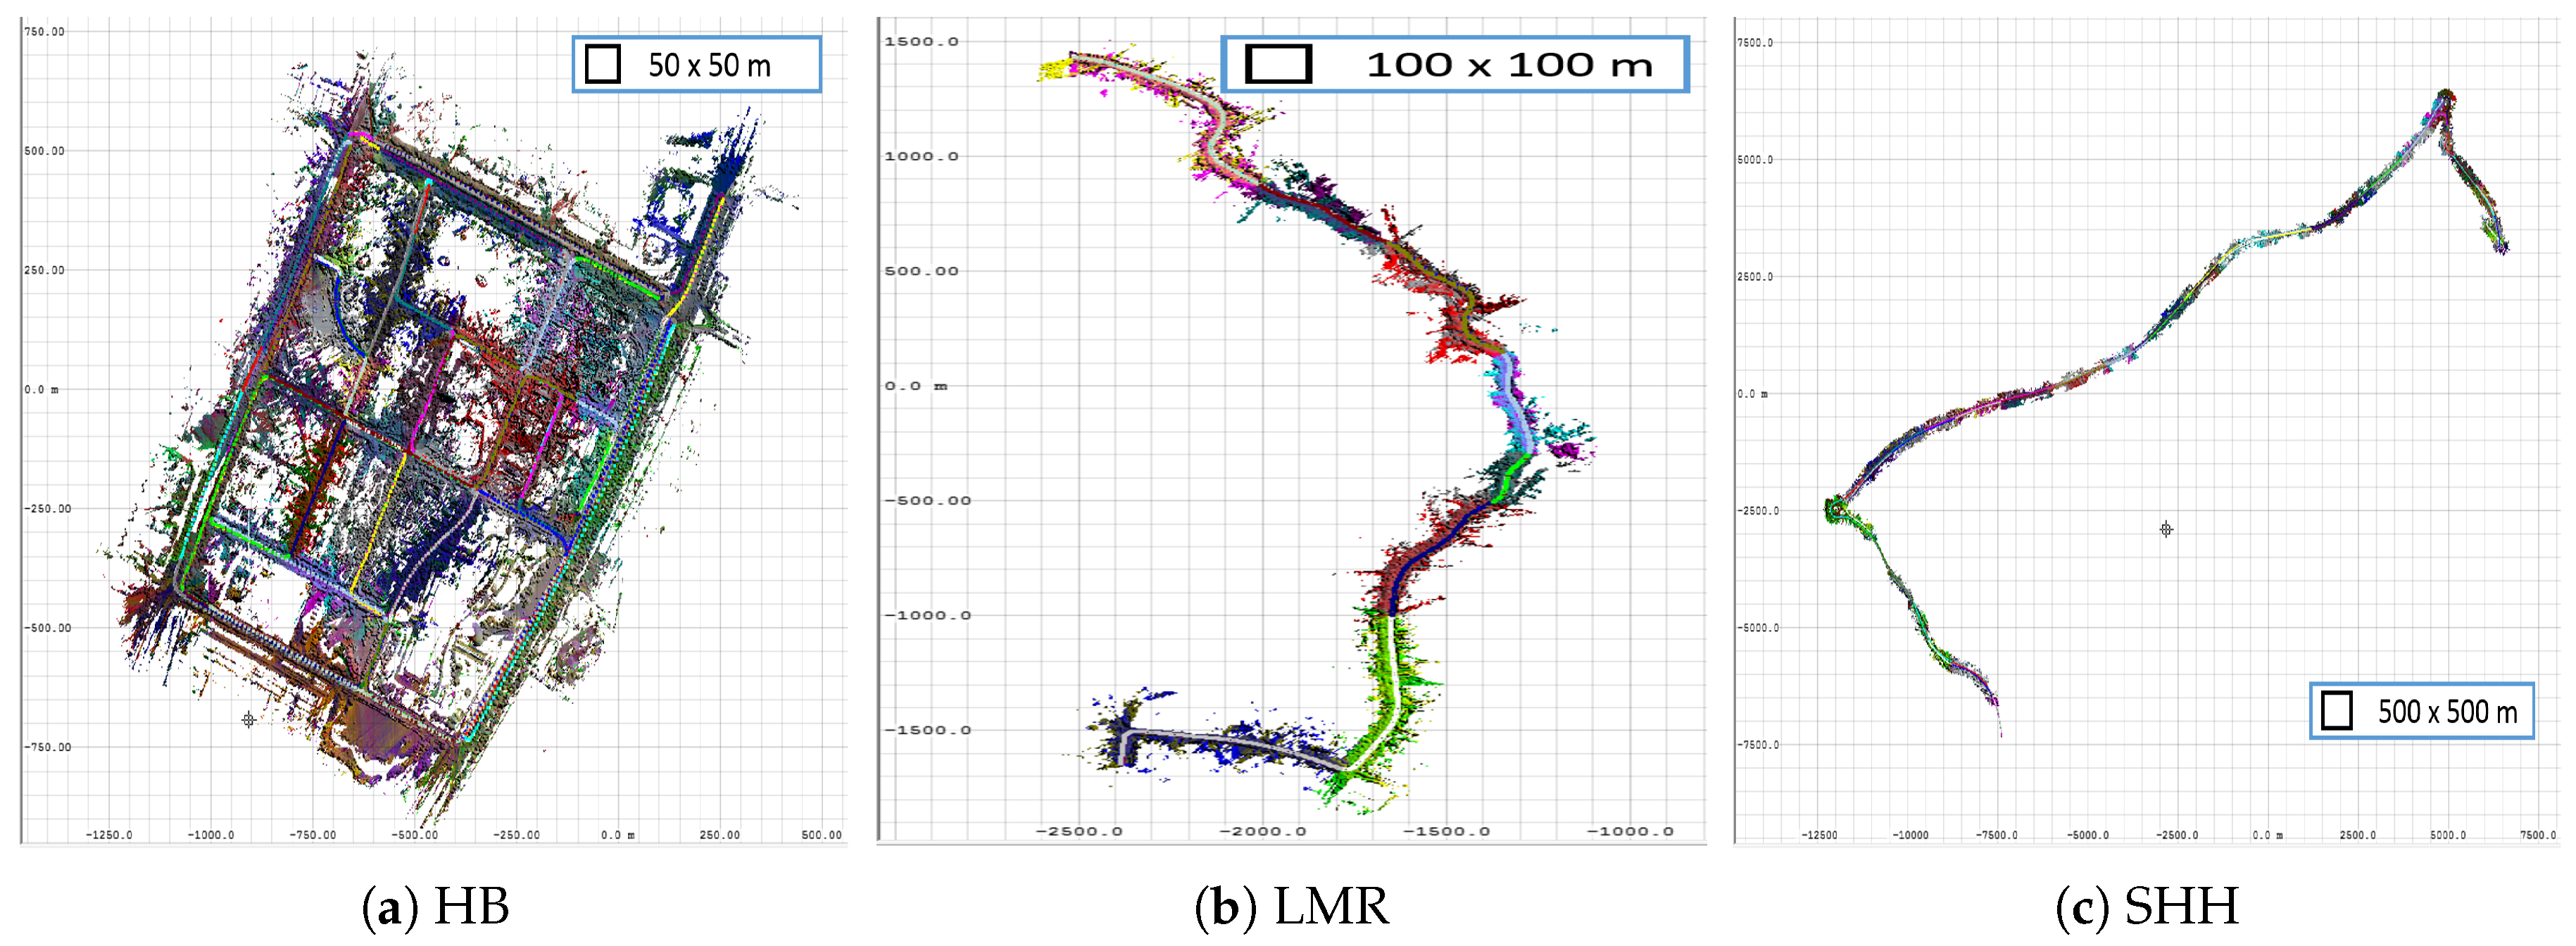
5.2. Datasets Acquisition
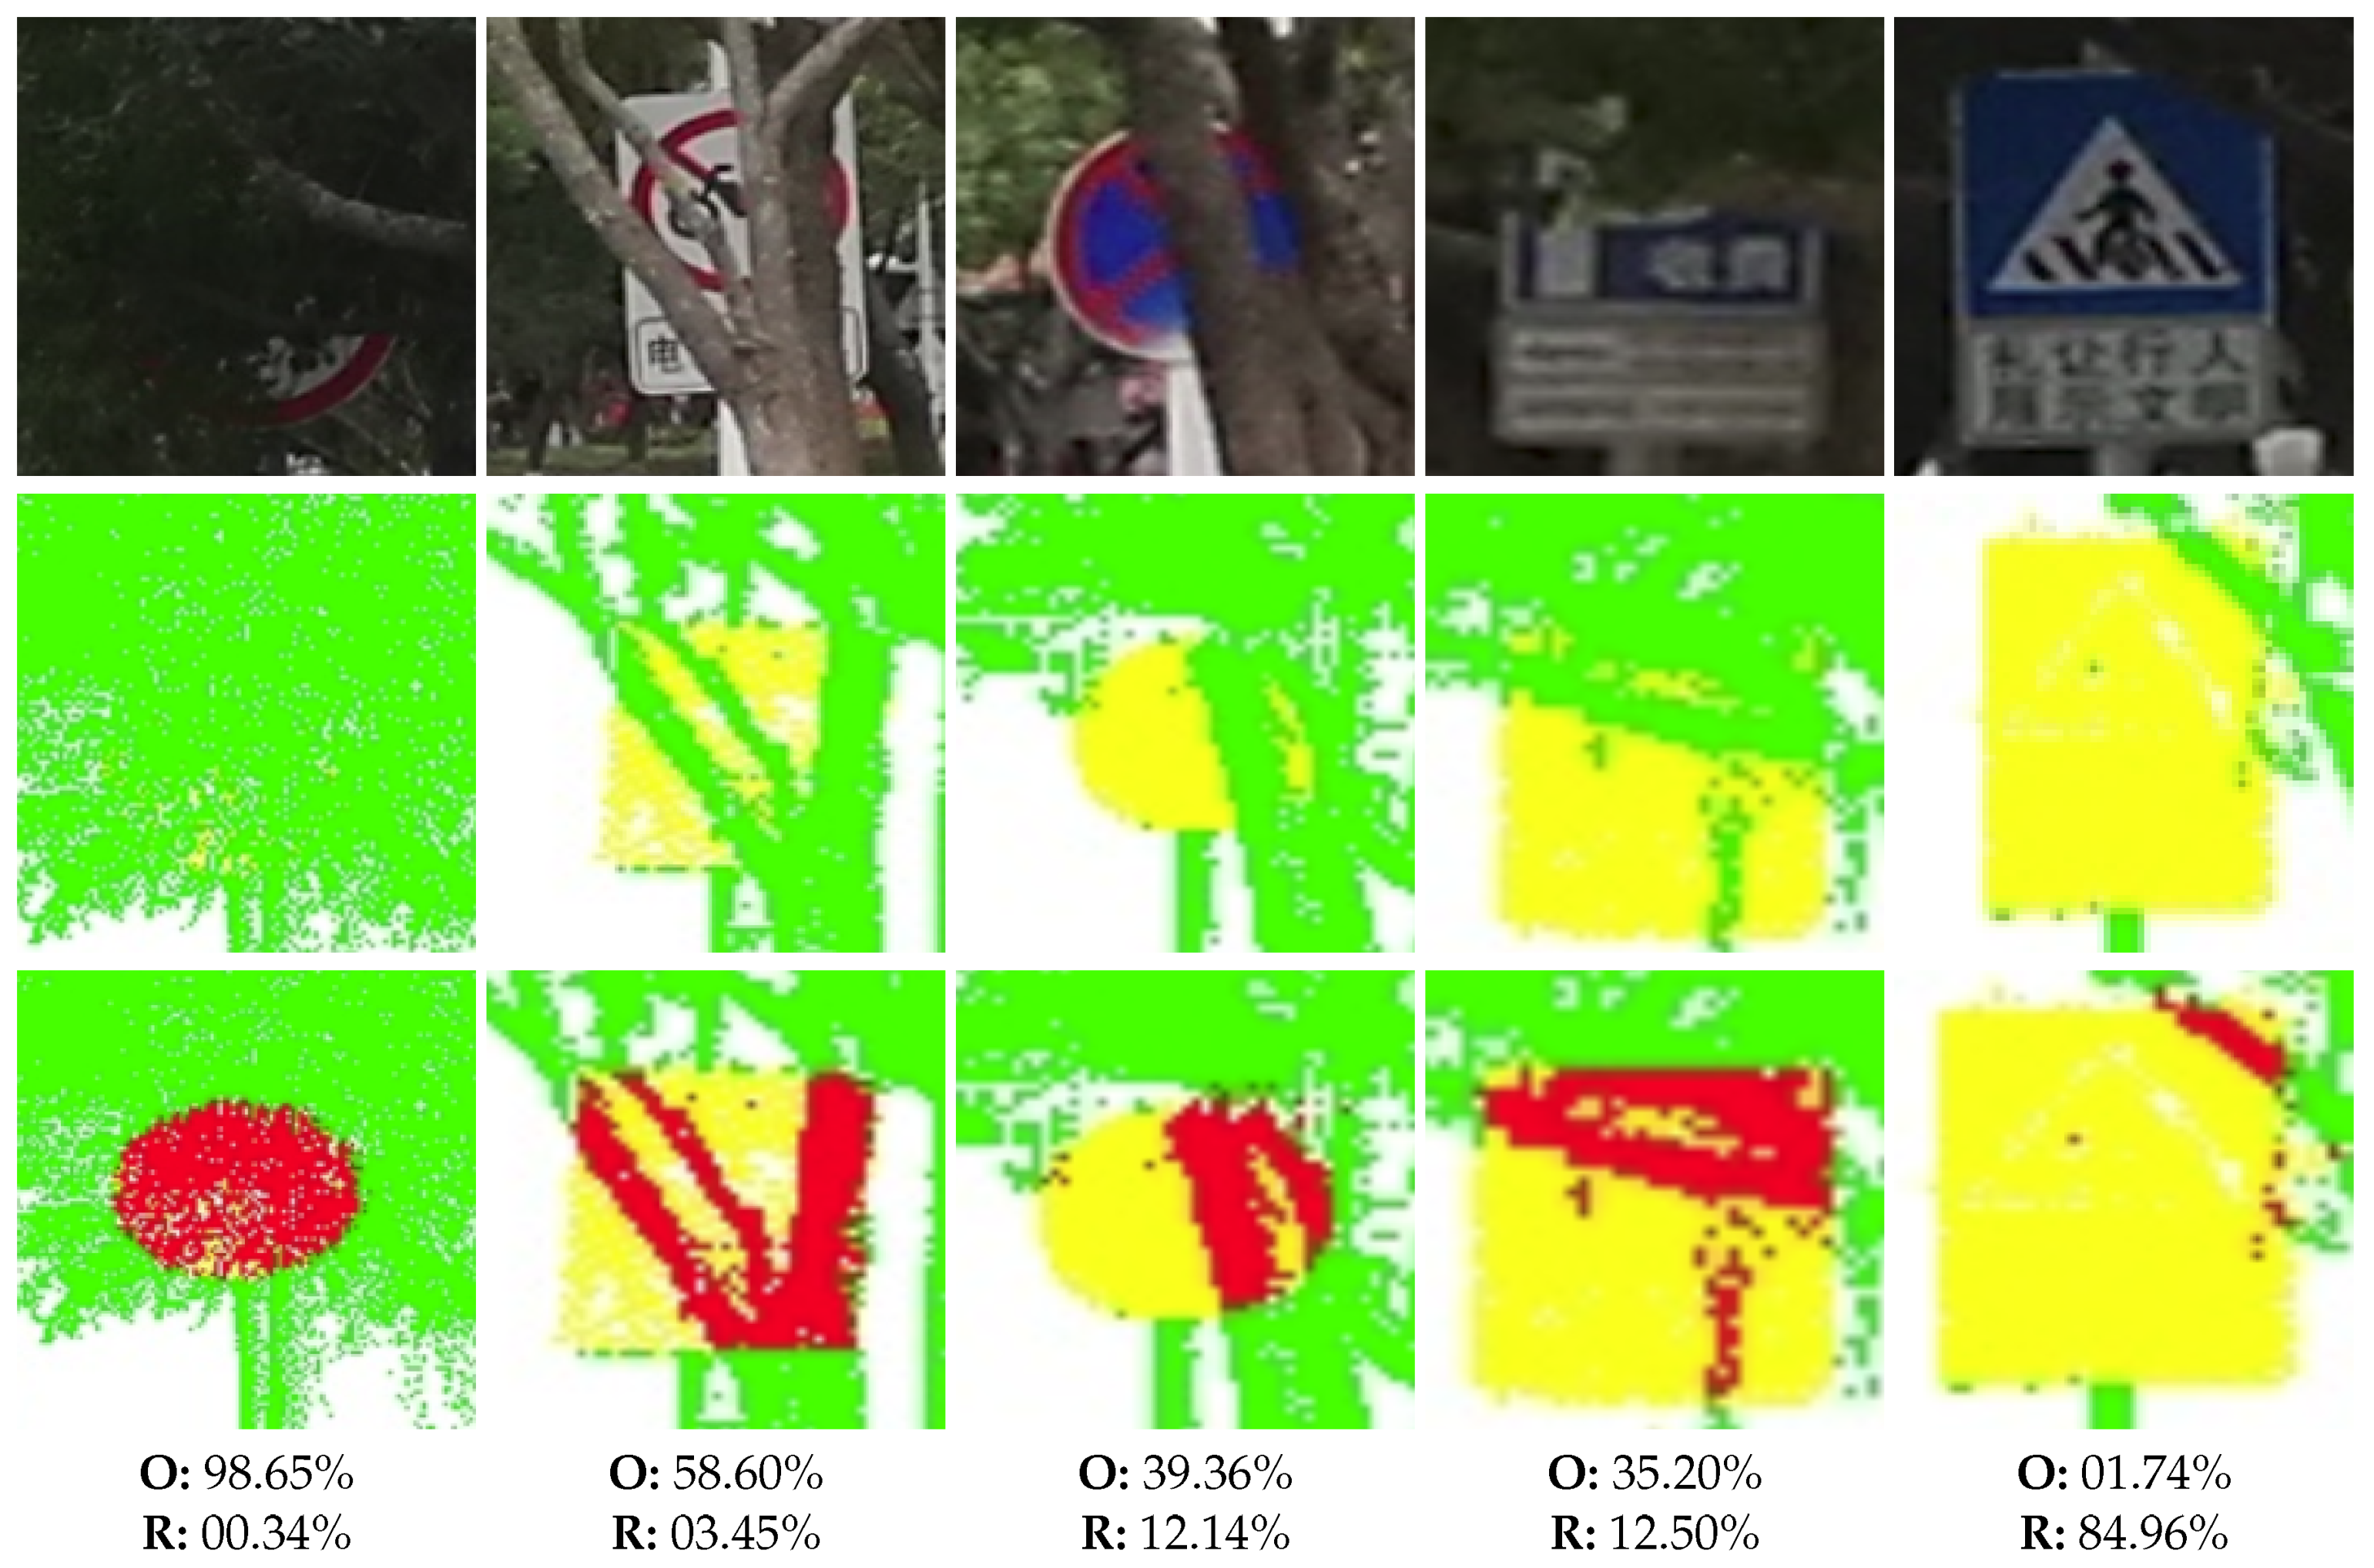
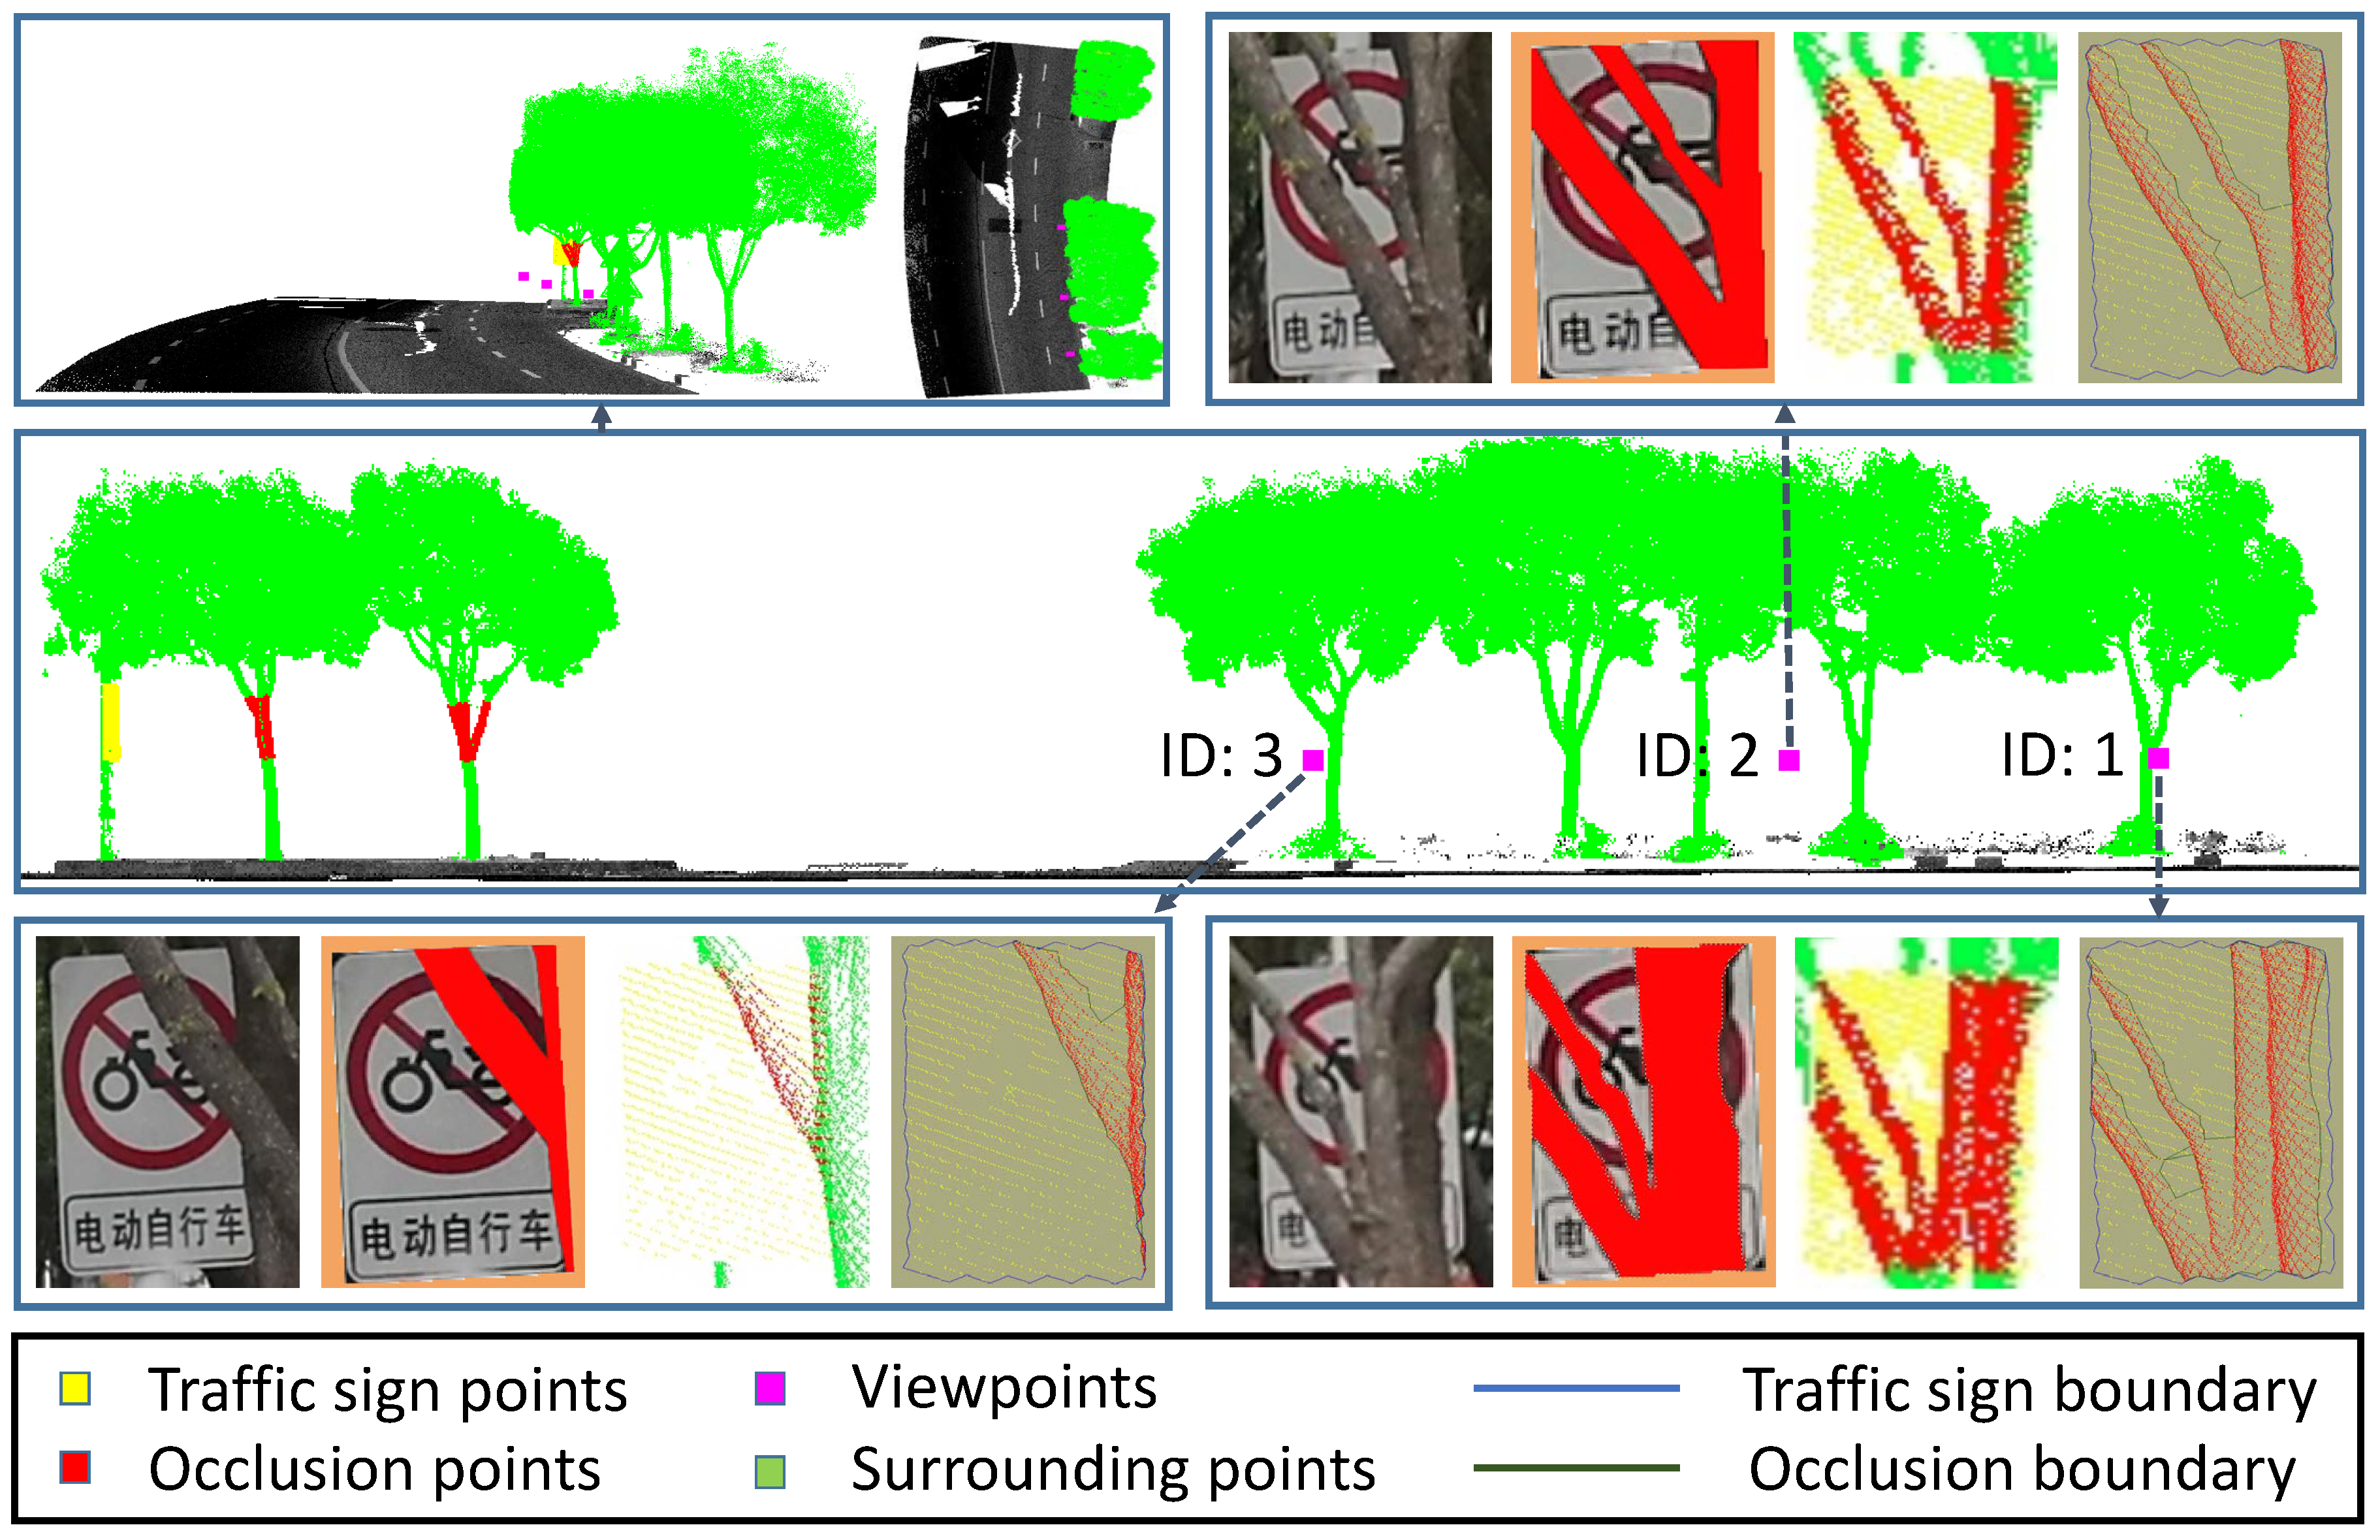
5.3. Verification Experiment and Discussion
5.4. Accuracy Analysis and Reliability Analysis
5.4.1. Accuracy Analysis
5.4.2. Reliability Analysis
5.5. Large-Scale Application Experiment and Discussion
6. Conclusions
Author Contributions
Funding
Acknowledgments
Conflicts of Interest
Abbreviations
| The punishment weight of sight line deviation | |
| The weight of other factors | |
| The penalization weight of occlusion | |
| The area of driving area within sight distance of a traffic sign | |
| The retinal imaging area of a standard traffic sign viewed from the “unit viewpoint” | |
| The occluded imaging area of retinal of a sign from viewpoint | |
| The imaging area of retinal of a sign from viewpoint | |
| D | The driving area within sight distance of a traffic sign |
| The visual recognizability of a traffic sign | |
| The estimated value of standard geometric factors | |
| The estimated value of geometric factors | |
| The estimated value of occlusion factors | |
| The estimated value of standard sight line deviation factors | |
| The estimated value of sight line deviation factor | |
| The estimated value of viewpoint visibility | |
| The estimated value of standard viewpoint visibility | |
| G | The value of GFOV |
| l | The length from viewpoint to traffic sign along road direction |
| A viewpoint | |
| V | The maximum angle between sight line and the line from viewpoint to the “A” pillar of the vehicle |
| The angle between sight line and line from viewpoint to the center of traffic sign | |
| w | The width from viewpoint to roadside in vertical road direction |
| The driving area width of the road | |
| GFOV | Geometric Field Of View |
| HPR | Hidden Point Removal |
| MLS | Mobile Laser Scanning] |
| SD | Sight Distance |
| TSVREM | Traffic Sign Visual Recognizability Evaluation Model |
| VEM | Visibility Evaluation Model |
References
- Liu, B.; Wang, Z.; Song, G.; Wu, G. Cognitive processing of traffic signs in immersive virtual reality environment: An ERP study. Neurosci. Lett. 2010, 485, 43–48. [Google Scholar] [CrossRef] [PubMed]
- Kirmizioglu, E.; Tuydes-Yaman, H. Comprehensibility of traffic signs among urban drivers in Turkey. Accid. Anal. Prev. 2012, 45, 131–141. [Google Scholar] [CrossRef] [PubMed]
- Ben-Bassat, T.; Shinar, D. The effect of context and drivers’ age on highway traffic signs comprehension. Transp. Res. Part Traffic Psychol. Behav. 2015, 33, 117–127. [Google Scholar] [CrossRef]
- Mourant, R.R.; Ahmad, N.; Jaeger, B.K.; Lin, Y. Optic flow and geometric field of view in a driving simulator display. Displays 2007, 28, 145–149. [Google Scholar] [CrossRef]
- Belaroussi, R.; Gruyer, D. Impact of reduced visibility from fog on traffic sign detection. In Proceedings of the 2014 IEEE Intelligent Vehicles Symposium Proceedings, Dearborn, MI, USA, 8–11 June 2014; pp. 1302–1306. [Google Scholar]
- Rogé, J.; Pébayle, T.; Lambilliotte, E.; Spitzenstetter, F.; Giselbrecht, D.; Muzet, A. Influence of age, speed and duration of monotonous driving task in traffic on the driver’s useful visual field. Vis. Res. 2004, 44, 2737–2744. [Google Scholar] [CrossRef] [PubMed]
- Costa, M.; Simone, A.; Vignali, V.; Lantieri, C.; Bucchi, A.; Dondi, G. Looking behavior for vertical road signs. Transp. Res. Part Traffic Psychol. Behav. 2014, 23, 147–155. [Google Scholar] [CrossRef]
- Lyu, N.; Xie, L.; Wu, C.; Fu, Q.; Deng, C. Driver’s cognitive workload and driving performance under traffic sign information exposure in complex environments: A case study of the highways in China. Int. J. Environ. Res. Public Health 2017, 14, 203. [Google Scholar] [CrossRef]
- Motamedi, A.; Wang, Z.; Yabuki, N.; Fukuda, T.; Michikawa, T. Signage visibility analysis and optimization system using BIM-enabled virtual reality (VR) environments. Adv. Eng. Inform. 2017, 32, 248–262. [Google Scholar] [CrossRef]
- Li, L.; Zhang, Q. Research on Visual Cognition About Sharp Turn Sign Based on Driver’s Eye Movement Characteristic. Int. J. Pattern Recognit. Artif. Intell. 2017, 31, 1759012. [Google Scholar] [CrossRef]
- González, Á.; Garrido, M.Á.; Llorca, D.F.; Gavilán, M.; Fernández, J.P.; Alcantarilla, P.F.; Parra, I.; Herranz, F.; Bergasa, L.M.; Sotelo, M.Á.; et al. Automatic traffic signs and panels inspection system using computer vision. IEEE Trans. Intell. Transp. Syst. 2011, 12, 485–499. [Google Scholar] [CrossRef]
- Doman, K.; Deguchi, D.; Takahashi, T.; Mekada, Y.; Ide, I.; Murase, H.; Sakai, U. Estimation of traffic sign visibility considering local and global features in a driving environment. In Proceedings of the 2014 IEEE Intelligent Vehicles Symposium Proceedings, Dearborn, MI, USA, 8–11 June 2014; pp. 202–207. [Google Scholar]
- Khalilikhah, M.; Heaslip, K. Analysis of factors temporarily impacting traffic sign readability. Int. J. Transp. Sci. Technol. 2016, 5, 60–67. [Google Scholar] [CrossRef]
- Balsa-Barreiro, J.; Valero-Mora, P.M.; Berné-Valero, J.L.; Varela-García, F.A. GIS Mapping of Driving Behavior Based on Naturalistic Driving Data. Isprs Int. J. Geo-Inf. 2019, 8, 226. [Google Scholar] [CrossRef]
- Balsa-Barreiro, J.; Valero-Mora, P.M.; Montoro, I.P.; García, M.S. Geo-referencing naturalistic driving data using a novel method based on vehicle speed. IET Intell. Transp. Syst. 2013, 7, 190–197. [Google Scholar] [CrossRef]
- Sun, L.; Yao, L.; Rong, J.; Lu, J.; Liu, B.; Wang, S. Simulation analysis on driving behavior during traffic sign recognition. Int. J. Comput. Intell. Syst. 2011, 4, 353–360. [Google Scholar] [CrossRef]
- Li, N.; Busso, C. Predicting perceived visual and cognitive distractions of drivers with multimodal features. IEEE Trans. Intell. Transp. Syst. 2015, 16, 51–65. [Google Scholar] [CrossRef]
- Bohua, L.; Lishan, S.; Jian, R. Driver’s visual cognition behaviors of traffic signs based on eye movement parameters. J. Transp. Syst. Eng. Inf. Technol. 2011, 11, 22–27. [Google Scholar]
- Doman, K.; Deguchi, D.; Takahashi, T.; Mekada, Y.; Ide, I.; Murase, H.; Tamatsu, Y. Estimation of traffic sign visibility toward smart driver assistance. In Proceedings of the 2010 IEEE Intelligent Vehicles Symposium (IV), San Diego, CA, USA, 21–24 June 2010; pp. 45–50. [Google Scholar]
- Doman, K.; Deguchi, D.; Takahashi, T.; Mekada, Y.; Ide, I.; Murase, H.; Tamatsu, Y. Estimation of traffic sign visibility considering temporal environmental changes for smart driver assistance. In Proceedings of the 2010 IEEE Intelligent Vehicles Symposium (IV), Baden-Baden, Germany, 5–9 June 2011; pp. 667–672. [Google Scholar]
- Katz, S.; Tal, A.; Basri, R. Direct visibility of point sets. Acm Trans. Graph. (TOG) ACM 2007, 26, 24. [Google Scholar] [CrossRef]
- Katz, S.; Tal, A. Improving the visual comprehension of point sets. In Proceedings of the IEEE Conference on Computer Vision and Pattern Recognition, Portland, OR, USA, 23–28 June 2013; pp. 121–128. [Google Scholar]
- Katz, S.; Tal, A. On the Visibility of Point Clouds. In Proceedings of the IEEE International Conference on Computer Vision, Santiago, Chile, 7–13 December 2015; pp. 1350–1358. [Google Scholar]
- Huang, P.; Cheng, M.; Chen, Y.; Luo, H.; Wang, C.; Li, J. Traffic sign occlusion detection using mobile laser scanning point clouds. IEEE Trans. Intell. Transp. Syst. 2017, 18, 2364–2376. [Google Scholar] [CrossRef]
- Lillo-Castellano, J.; Mora-Jiménez, I.; Figuera-Pozuelo, C.; Rojo-Álvarez, J.L. Traffic sign segmentation and classification using statistical learning methods. Neurocomputing 2015, 153, 286–299. [Google Scholar] [CrossRef]
- Li, H.; Sun, F.; Liu, L.; Wang, L. A novel traffic sign detection method via color segmentation and robust shape matching. Neurocomputing 2015, 169, 77–88. [Google Scholar] [CrossRef]
- Qin, K.h.; Wang, H.Y.; Zheng, J.T. A unified approach based on hough transform for quick detection of circles and rectangles. J. Image Graph. 2010, 1, 109–115. [Google Scholar]
- Greenhalgh, J.; Mirmehdi, M. Real-time detection and recognition of road traffic signs. IEEE Trans. Intell. Transp. Syst. 2012, 13, 1498–1506. [Google Scholar] [CrossRef]
- Yuan, Y.; Xiong, Z.; Wang, Q. An incremental framework for video-based traffic sign detection, tracking, and recognition. IEEE Trans. Intell. Transp. Syst. 2017, 18, 1918–1929. [Google Scholar] [CrossRef]
- Zeng, Y.; Xu, X.; Shen, D.; Fang, Y.; Xiao, Z. Traffic sign recognition using kernel extreme learning machines with deep perceptual features. IEEE Trans. Intell. Transp. Syst. 2017, 18, 1647–1653. [Google Scholar] [CrossRef]
- Wen, C.; Li, J.; Luo, H.; Yu, Y.; Cai, Z.; Wang, H.; Wang, C. Spatial-related traffic sign inspection for inventory purposes using mobile laser scanning data. IEEE Trans. Intell. Transp. Syst. 2016, 17, 27–37. [Google Scholar] [CrossRef]
- Yang, B.; Dong, Z.; Zhao, G.; Dai, W. Hierarchical extraction of urban objects from mobile laser scanning data. Isprs J. Photogramm. Remote. Sens. 2015, 99, 45–57. [Google Scholar] [CrossRef]
- Lehtomäki, M.; Jaakkola, A.; Hyyppä, J.; Lampinen, J.; Kaartinen, H.; Kukko, A.; Puttonen, E.; Hyyppä, H. Object classification and recognition from mobile laser scanning point clouds in a road environment. IEEE Trans. Geosci. Remote. Sens. 2016, 54, 1226–1239. [Google Scholar] [CrossRef]
- Wang, J.; Lindenbergh, R.; Menenti, M. SigVox–A 3D feature matching algorithm for automatic street object recognition in mobile laser scanning point clouds. Isprs J. Photogramm. Remote. Sens. 2017, 128, 111–129. [Google Scholar] [CrossRef]
- Huang, J.; You, S. Pole-like object detection and classification from urban point clouds. In Proceedings of the 2015 IEEE International Conference on Robotics and Automation (ICRA), Seattle, WA, USA, 26–30 May 2015; pp. 3032–3038. [Google Scholar]
- Golovinskiy, A.; Kim, V.G.; Funkhouser, T. Shape-based recognition of 3D point clouds in urban environments. In Proceedings of the 2009 IEEE 12th International Conference on Computer Vision, Kyoto, Japan, 29 September–2 October 2009; pp. 2154–2161. [Google Scholar]
- Li, F.; Elberink, S.O.; Vosselman, G. Semantic labelling of road furniture in mobile laser scanning data. In Proceedings of the International Archives of the Photogrammetry, Remote Sensing and Spatial Information Sciences, Wuhan, China, 18–22 September 2017. [Google Scholar]
- Balsa-Barreiro, J.; Fritsch, D. Generation of visually aesthetic and detailed 3D models of historical cities by using laser scanning and digital photogrammetry. Digit. Appl. Archaeol. Cult. Herit. 2018, 8, 57–64. [Google Scholar] [CrossRef]
- Yu, Y.; Li, J.; Wen, C.; Guan, H.; Luo, H.; Wang, C. Bag-of-visual-phrases and hierarchical deep models for traffic sign detection and recognition in mobile laser scanning data. ISPRS J. Photogramm. Remote. Sens. 2016, 113, 106–123. [Google Scholar] [CrossRef]
- Soilán, M.; Riveiro, B.; Martínez-Sánchez, J.; Arias, P. Traffic sign detection in MLS acquired point clouds for geometric and image-based semantic inventory. ISPRS J. Photogramm. Remote. Sens. 2016, 114, 92–101. [Google Scholar] [CrossRef]
- Tan, M.; Wang, B.; Wu, Z.; Wang, J.; Pan, G. Weakly supervised metric learning for traffic sign recognition in a LIDAR-equipped vehicle. IEEE Trans. Intell. Transp. Syst. 2016, 17, 1415–1427. [Google Scholar] [CrossRef]
- Ai, C.; Tsai, Y.J. An automated sign retroreflectivity condition evaluation methodology using mobile LIDAR and computer vision. Transp. Res. Part Emerg. Technol. 2016, 63, 96–113. [Google Scholar] [CrossRef]
- Lee, S.; Kweon, I.S.; Kim, J.; Yoon, J.S.; Shin, S.; Bailo, O.; Kim, N.; Lee, T.H.; Hong, H.S.; Han, S.H. VPGNet: Vanishing Point Guided Network for Lane and Road Marking Detection and Recognition. In Proceedings of the IEEE International Conference on Computer Vision (ICCV), Venice, Italy, 22 October–29 October 2017; pp. 1965–1973. [Google Scholar]
- Ahmad, T.; Ilstrup, D.; Emami, E.; Bebis, G. Symbolic road marking recognition using convolutional neural networks. In Proceedings of the 2017 IEEE Intelligent Vehicles Symposium (IV), Los Angeles, CA, USA, 11–14 June 2017; pp. 1428–1433. [Google Scholar]
- Guan, H.; Li, J.; Yu, Y.; Wang, C.; Chapman, M.; Yang, B. Using mobile laser scanning data for automated extraction of road markings. ISPRS J. Photogramm. Remote. Sens. 2014, 87, 93–107. [Google Scholar] [CrossRef]
- Guan, H.; Li, J.; Yu, Y.; Ji, Z.; Wang, C. Using mobile LiDAR data for rapidly updating road markings. IEEE Trans. Intell. Transp. Syst. 2015, 16, 2457–2466. [Google Scholar] [CrossRef]
- Soilán, M.; Riveiro, B.; Martínez-Sánchez, J.; Arias, P. Segmentation and classification of road markings using MLS data. ISPRS J. Photogramm. Remote. Sens. 2017, 123, 94–103. [Google Scholar] [CrossRef]
- Yu, Y.; Li, J.; Guan, H.; Jia, F.; Wang, C. Learning hierarchical features for automated extraction of road markings from 3-D mobile LiDAR point clouds. IEEE J. Sel. Top. Appl. Earth Obs. Remote. Sens. 2015, 8, 709–726. [Google Scholar] [CrossRef]
- Garber, N.J.; Hoel, L.A. Traffic and Highway Engineering; Cengage Learning: Boston, MA, USA, 2014. [Google Scholar]
- Adminstration, F.H. Manual on Uniform Traffic Control Devices. 2009. Available online: https://mutcd.fhwa.dot.gov/pdfs/2009/pdf_index.htm (accessed on 1 May 2019).
- Diels, C.; Parkes, A.M. Geometric field of view manipulations affect perceived speed in driving simulators. Adv. Transp. Stud. 2010, 22, 53–64. [Google Scholar]
- Department for Transport, The Traffic Signs Regulations and General Directions 2016. 2016. Available online: https://assets.publishing.service.gov.uk/government/uploads/system/uploads/attachment_data/file/523916/DfT-circular-01-2016.pdf (accessed on 1 May 2019).
- Yang, J.; Liu, H. GB 5768-1999, Road Traffic Signs and Markings. 1999. Available online: http://www.gb688.cn/bzgk/gb/newGbInfo?hcno=A009EE301906F810B586264BDA029FD3 (accessed on 1 May 2019).
- Byers, S.; Raftery, A.E. Nearest-neighbor clutter removal for estimating features in spatial point processes. J. Am. Stat. Assoc. 1998, 93, 577–584. [Google Scholar] [CrossRef]
- Kuipers, J.B. Quaternions and Rotation Sequences; Princeton University Press: Princeton, NJ, USA, 1999; Volume 66. [Google Scholar]
- Banks, J.H. Introduction to Transportation Engineering; McGraw-Hill: New York, NY, USA, 2002; Volume 21. [Google Scholar]
- Edelsbrunner, H.; Kirkpatrick, D.; Seidel, R. On the shape of a set of points in the plane. IEEE Trans. Inf. Theory 1983, 29, 551–559. [Google Scholar] [CrossRef]
- Kaiser, P.K. The Joy of Visual Perception; York University: York, UK, 2009. [Google Scholar]
- Binghong Pan, Y.Z.; Liang, X. Application of dynamic vision theory in highway alignment design. J. Chang. Univ. Nat. Sci. Ed. 2004, 24, 20–24. [Google Scholar]
- Ullrich, A.; Pfennigbauer, M. Noisy lidar point clouds: Impact on information extraction in high-precision lidar surveying. Laser Radar Technology and Applications XXIII. Int. Soc. Opt. Photonics 2018, 10636, 106360M. [Google Scholar]
- Gargoum, S.; El-Basyouny, K. Effects of LiDAR Point Density on Extraction of Traffic Signs: A Sensitivity Study. Transp. Res. Rec. 2019. [Google Scholar] [CrossRef]
- Järemo Lawin, F.; Danelljan, M.; Shahbaz Khan, F.; Forssén, P.E.; Felsberg, M. Density Adaptive Point Set Registration. In Proceedings of the IEEE Conference on Computer Vision and Pattern Recognition, Salt Lake City, UT, USA, 18 June 2018; pp. 3829–3837. [Google Scholar]
- Kukko, A.; Kaartinen, H.; Hyyppä, J.; Chen, Y. Multiplatform mobile laser scanning: Usability and performance. Sensors 2012, 12, 11712–11733. [Google Scholar] [CrossRef]


| Viewpoint ID | Image | Point Clouds | Accuracy (%) | ||||
|---|---|---|---|---|---|---|---|
| Sign Pixels | Occlusion Pixels | Ratio (%) | Sign Area | Occlusion Area | Ratio (%) | ||
| 1 | 6917 | 3971 | 57.41 | 2.76 | 1.50 | 54.48 | 94.89 |
| 2 | 9738 | 4285 | 44.00 | 3.44 | 1.42 | 41.39 | 94.06 |
| 3 | 18,477 | 3170 | 17.16 | 7.70 | 1.27 | 16.48 | 96.04 |
| Dataset | Length (km) | Speed Limit (km/h) | Steps (min) | Average Cost (m/min) | ||
|---|---|---|---|---|---|---|
| Sign Detection | Viewpoints Selection | Recognizability Evaluation | ||||
| HB | 24.12 | 30 | 188.67 | 477.62 | 8.63 | 35.74 |
| LMR | 9.49 | 40 | 96.25 | 133.63 | 5.73 | 40.29 |
| SHH | 62.48 | 120 | 177.18 | 215.00 | 19.75 | 151.68 |
| Dataset | Traffic Signs’ Number | Occlusion | Average (%) | ||
|---|---|---|---|---|---|
| Number | Ratio (%) | Occlusion Area Ratio | Recognizability | ||
| HB | 135 | 101 | 74.81 | 10.97 | 78.43 |
| LMR | 73 | 61 | 83.56 | 20.73 | 62.61 |
| SHH | 127 | 90 | 70.87 | 12.71 | 80.51 |
| Total | 335 | 252 | 75.22 | 14.80 | 73.85 |
© 2019 by the authors. Licensee MDPI, Basel, Switzerland. This article is an open access article distributed under the terms and conditions of the Creative Commons Attribution (CC BY) license (http://creativecommons.org/licenses/by/4.0/).
Share and Cite
Zhang, S.; Wang, C.; Lin, L.; Wen, C.; Yang, C.; Zhang, Z.; Li, J. Automated Visual Recognizability Evaluation of Traffic Sign Based on 3D LiDAR Point Clouds. Remote Sens. 2019, 11, 1453. https://doi.org/10.3390/rs11121453
Zhang S, Wang C, Lin L, Wen C, Yang C, Zhang Z, Li J. Automated Visual Recognizability Evaluation of Traffic Sign Based on 3D LiDAR Point Clouds. Remote Sensing. 2019; 11(12):1453. https://doi.org/10.3390/rs11121453
Chicago/Turabian StyleZhang, Shanxin, Cheng Wang, Lili Lin, Chenglu Wen, Chenhui Yang, Zhemin Zhang, and Jonathan Li. 2019. "Automated Visual Recognizability Evaluation of Traffic Sign Based on 3D LiDAR Point Clouds" Remote Sensing 11, no. 12: 1453. https://doi.org/10.3390/rs11121453
APA StyleZhang, S., Wang, C., Lin, L., Wen, C., Yang, C., Zhang, Z., & Li, J. (2019). Automated Visual Recognizability Evaluation of Traffic Sign Based on 3D LiDAR Point Clouds. Remote Sensing, 11(12), 1453. https://doi.org/10.3390/rs11121453