Using Multi-Temporal Landsat Images and Support Vector Machine to Assess the Changes in Agricultural Irrigated Areas in the Mogtedo Region, Burkina Faso

 ,
,  , ,
, ,
Abstract
:1. Introduction
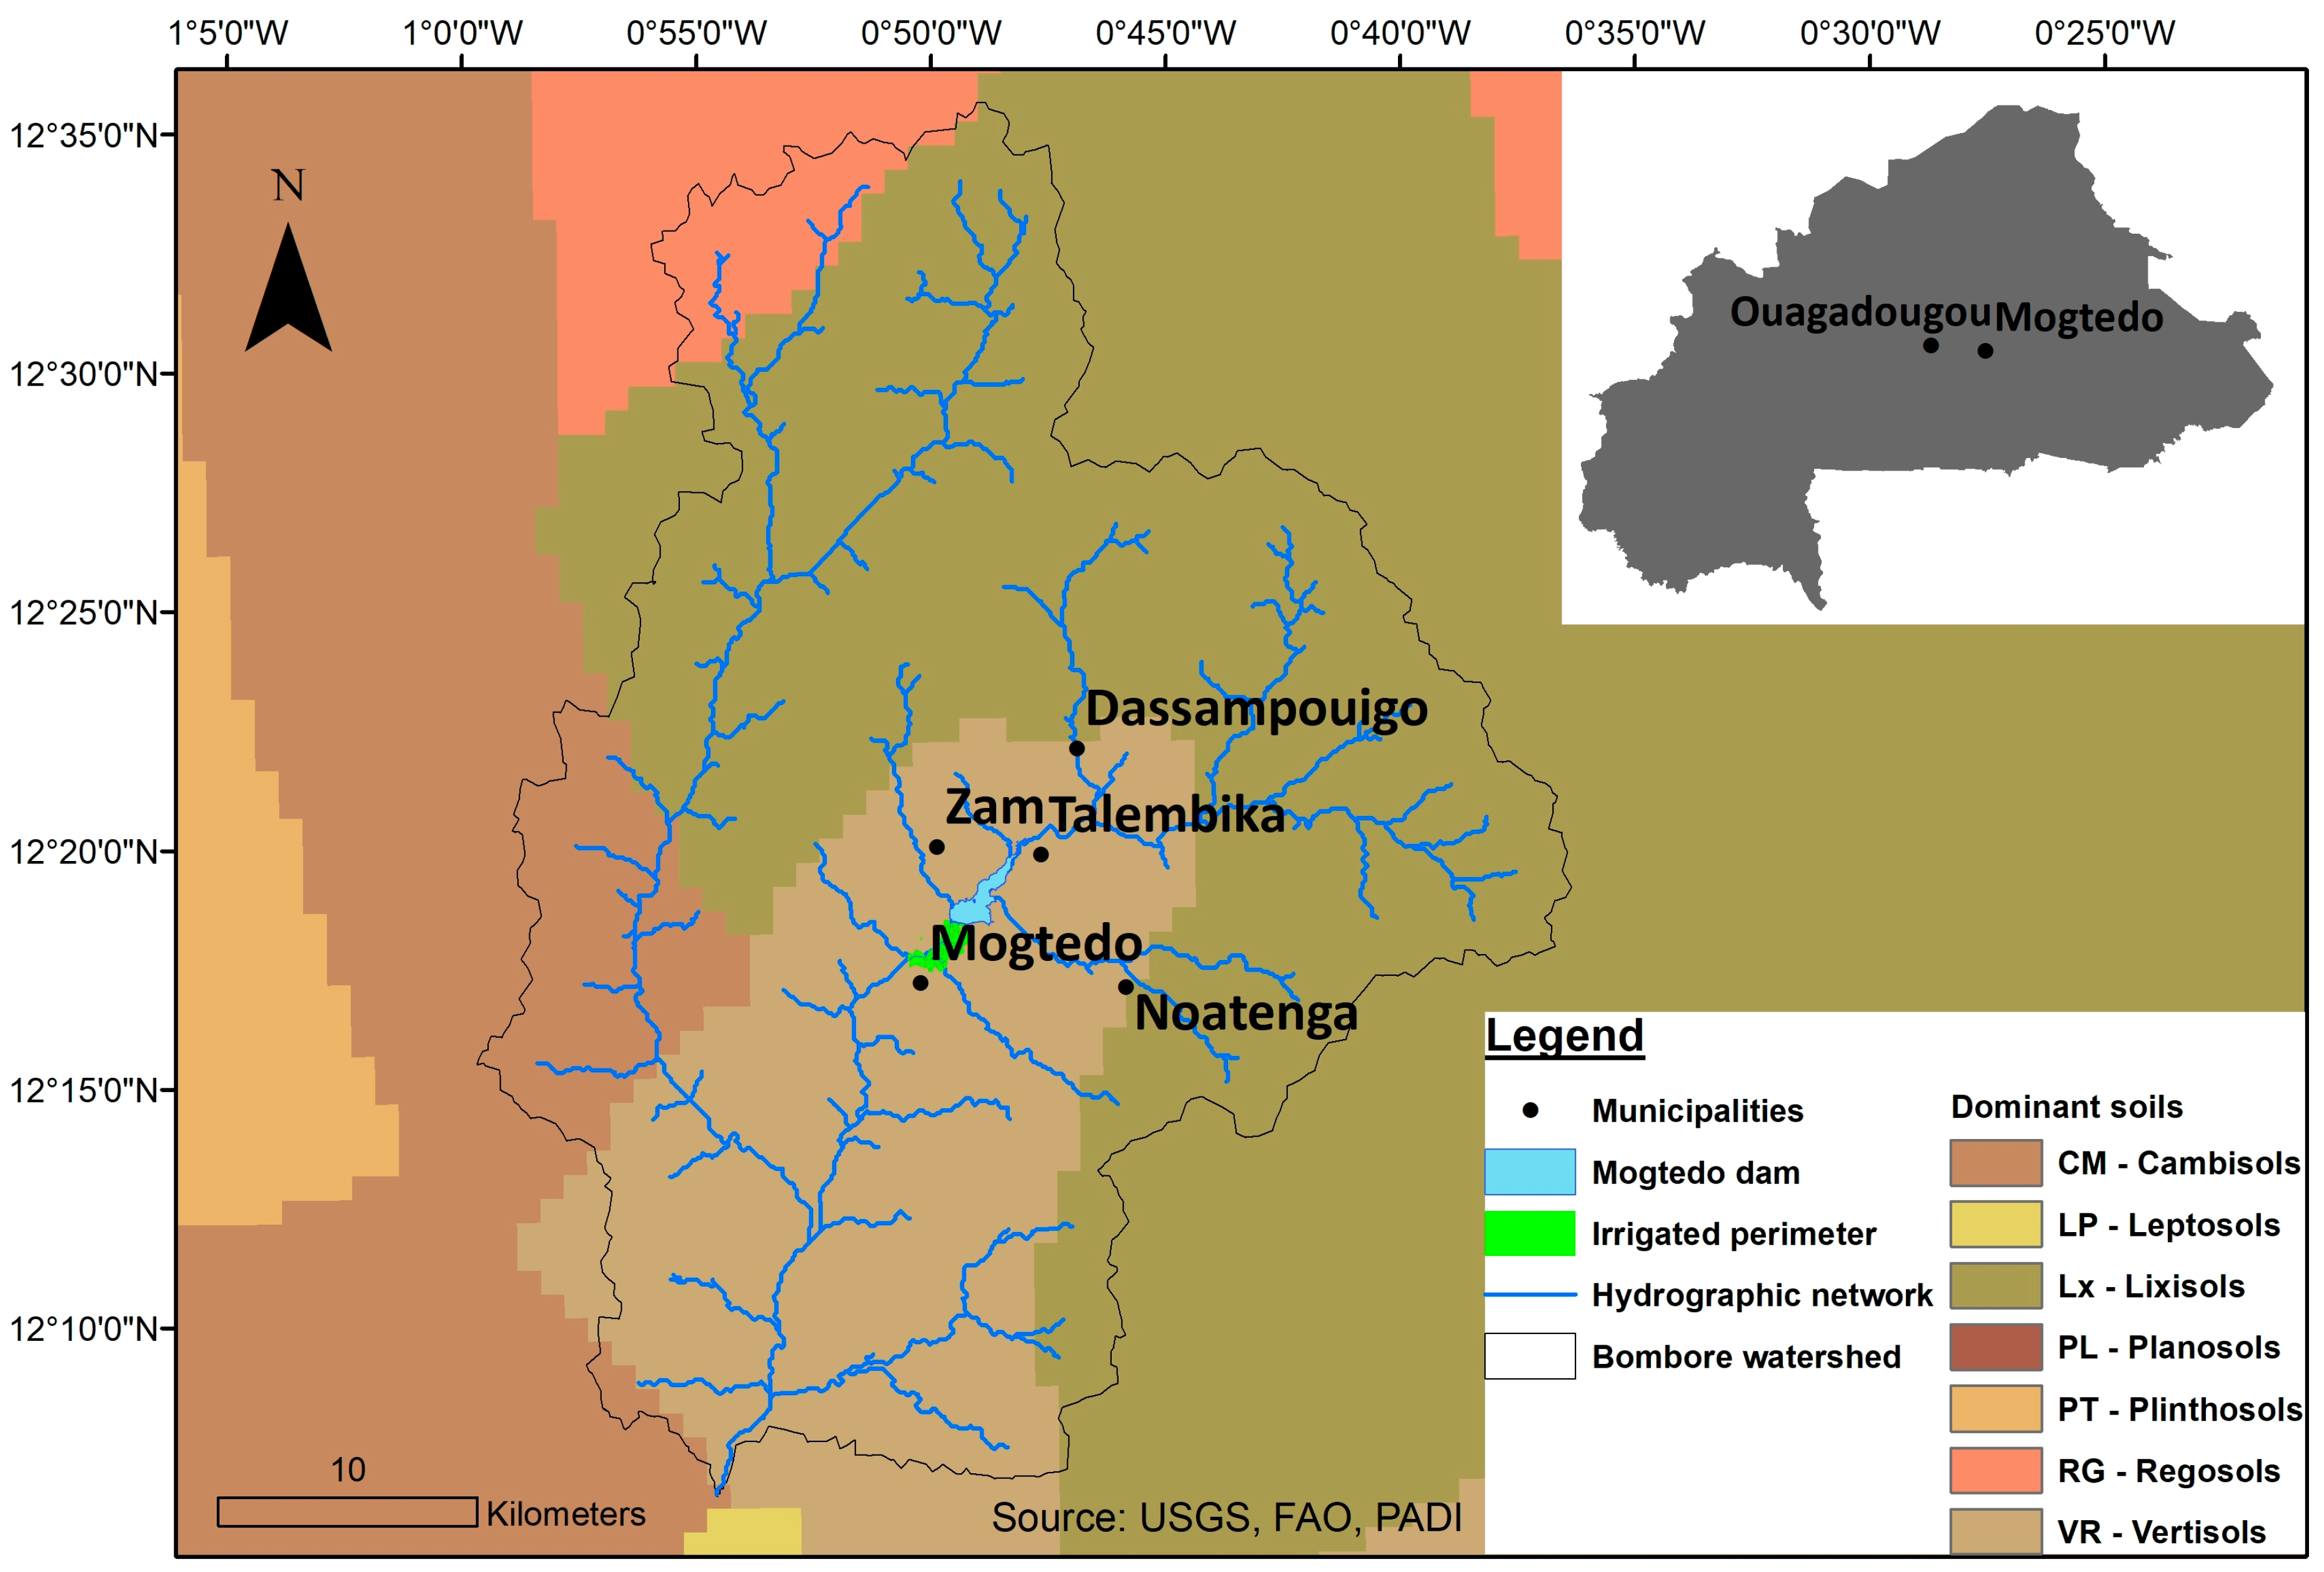
2. Study Area
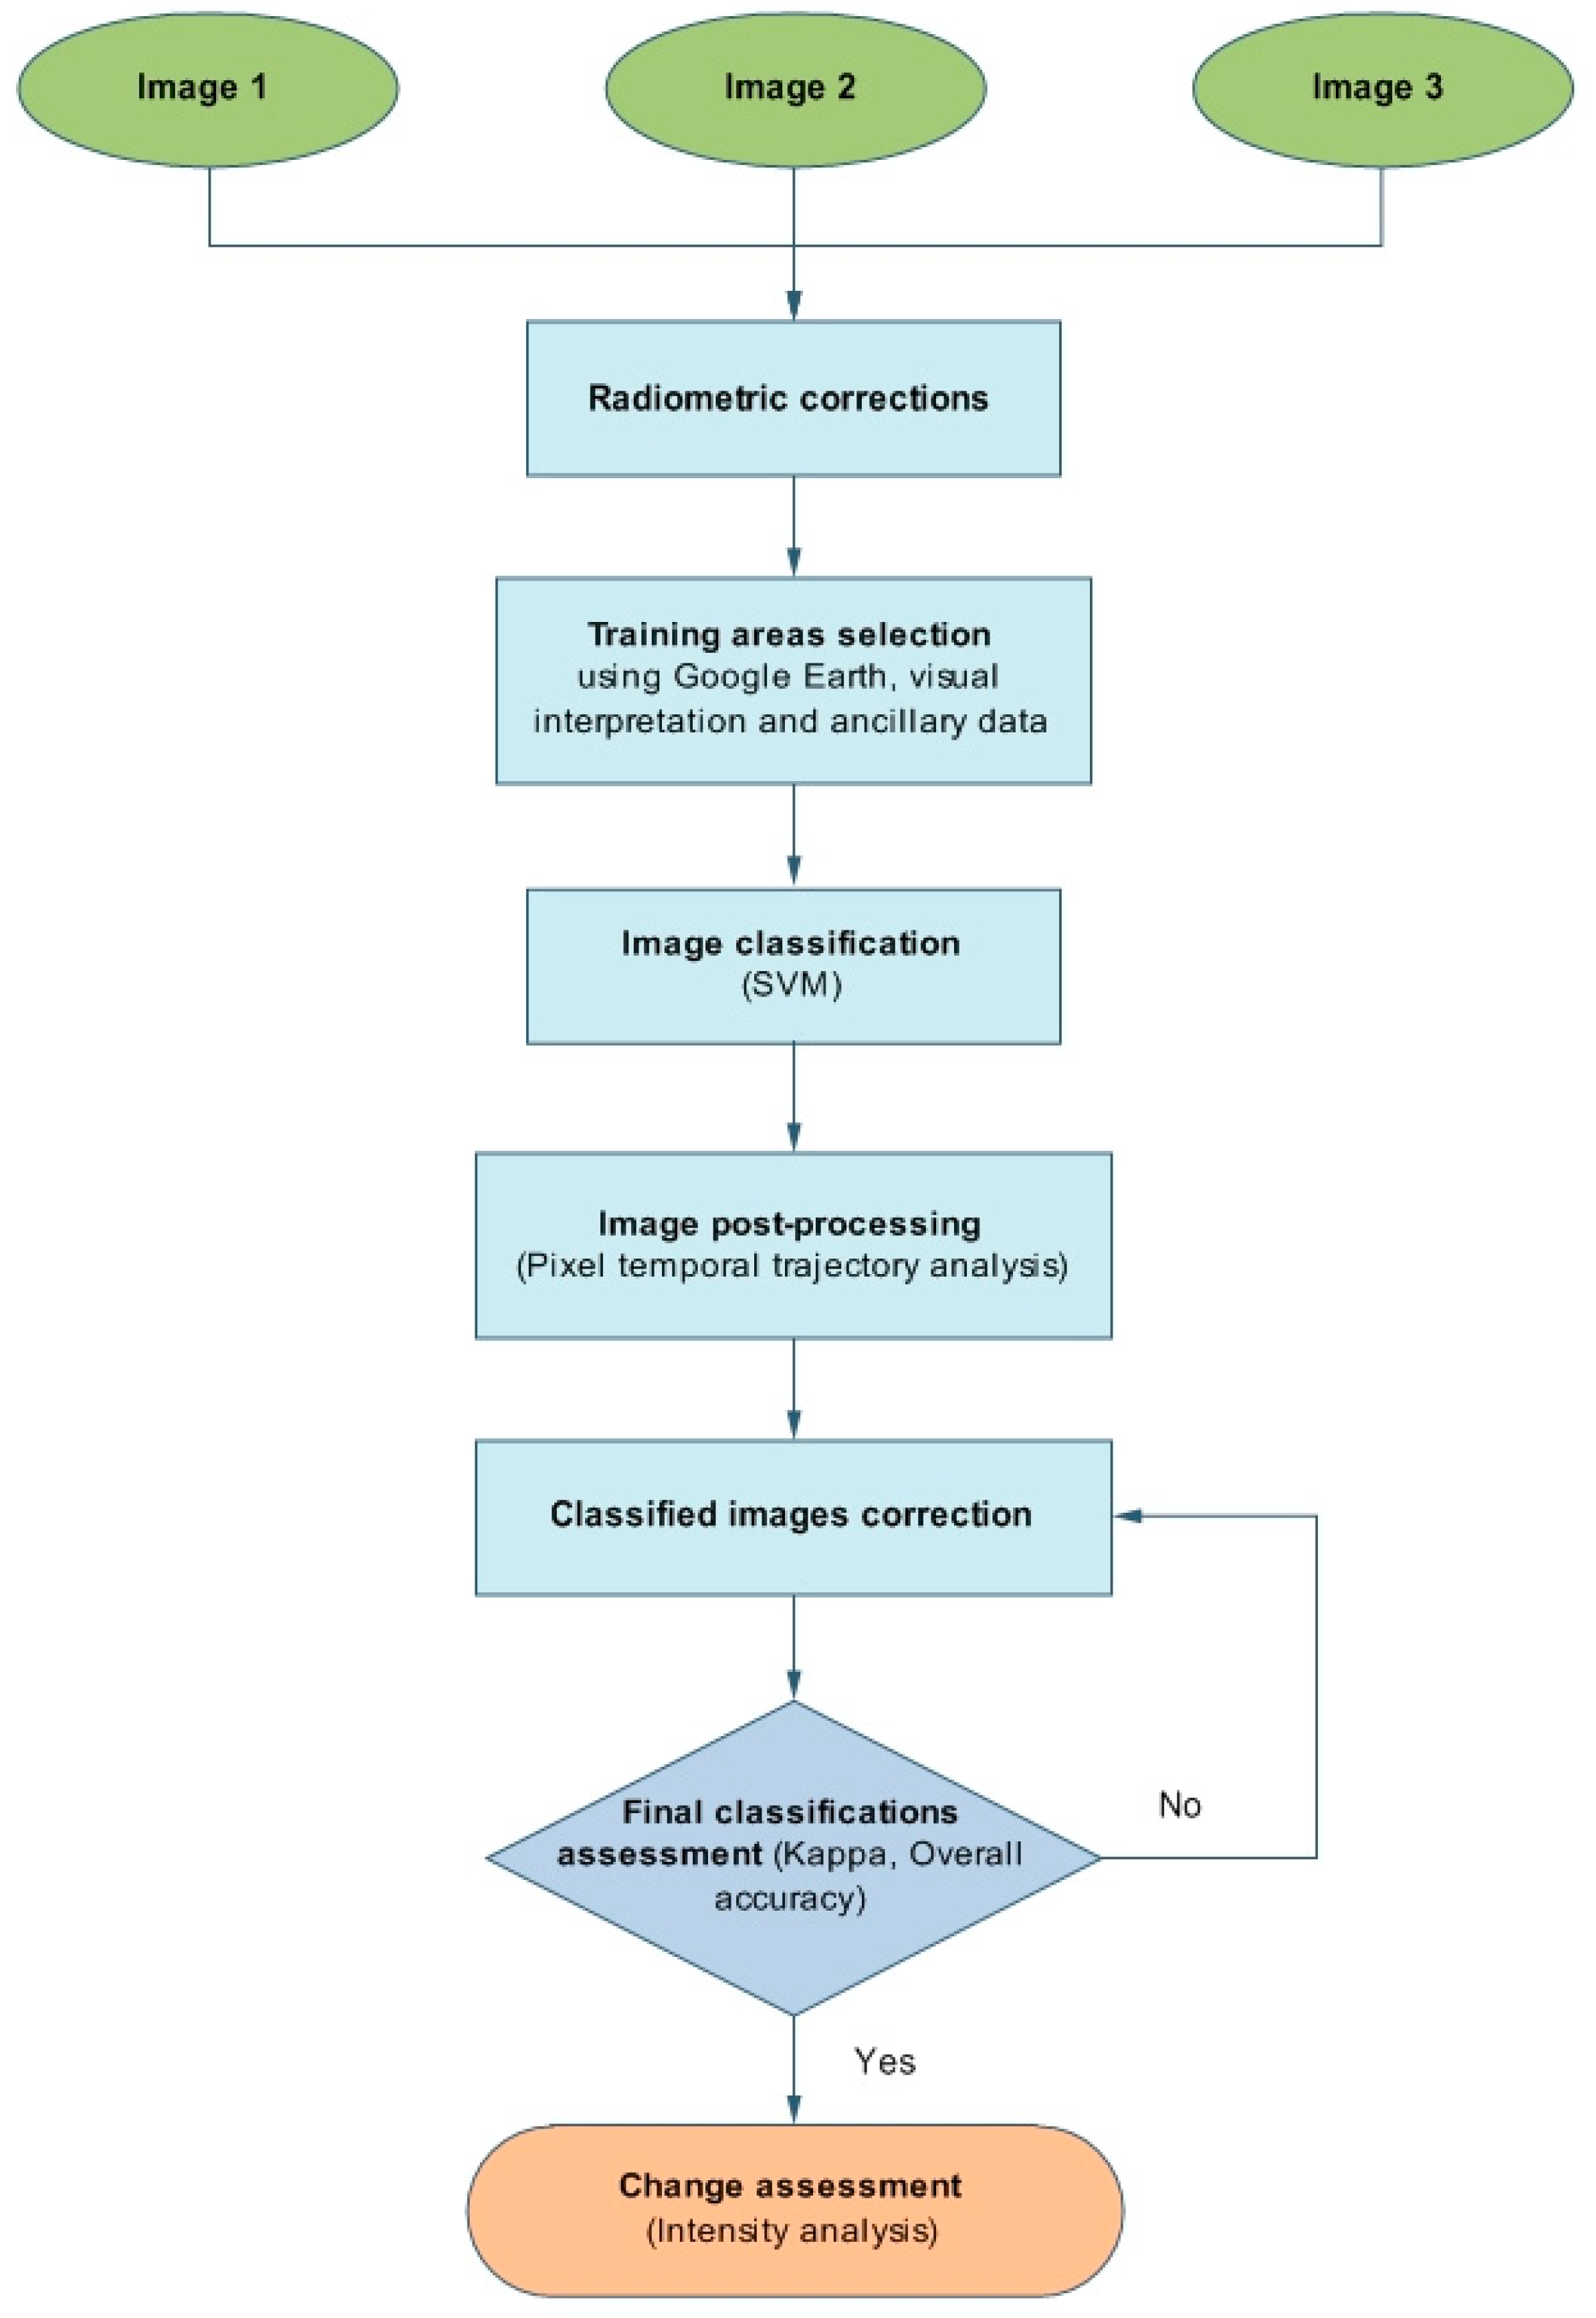
3. Materials and Methods
3.1. Radiometric Corrections
3.2. Selection of Training and Validation Areas
3.3. Support Vector Machine Classification
3.4. Images Post-Processing and Final Classification Assessment
3.5. Change Assessment
4. Results and Discussion
4.1. Accuracy Assessment before Pixel Trajectory Corrections
4.2. Pixel Temporal Trajectory Analysis and Trajectory Corrections
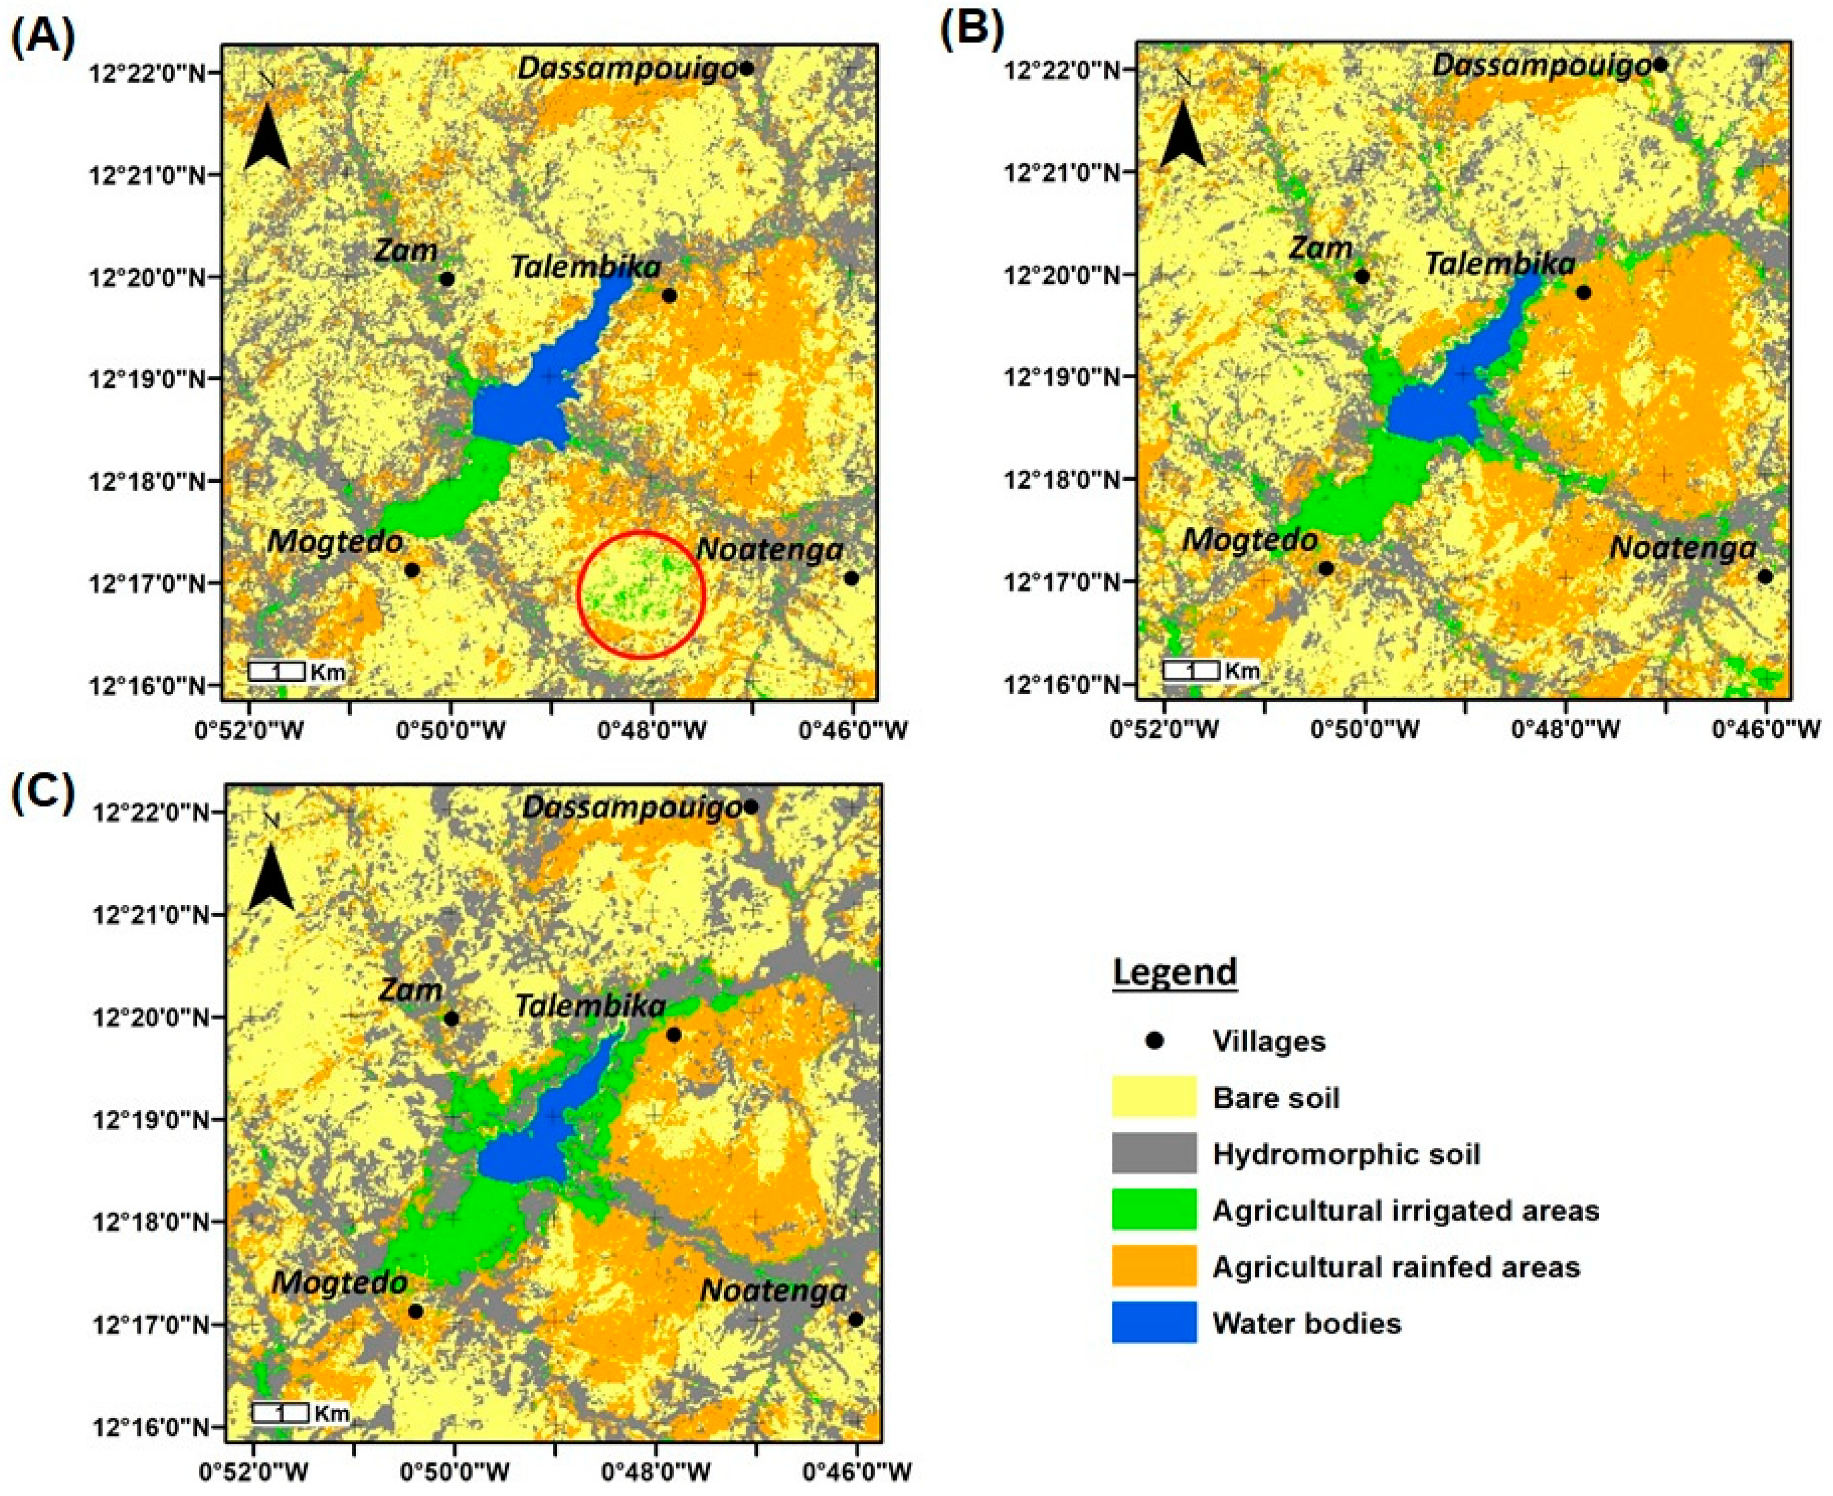
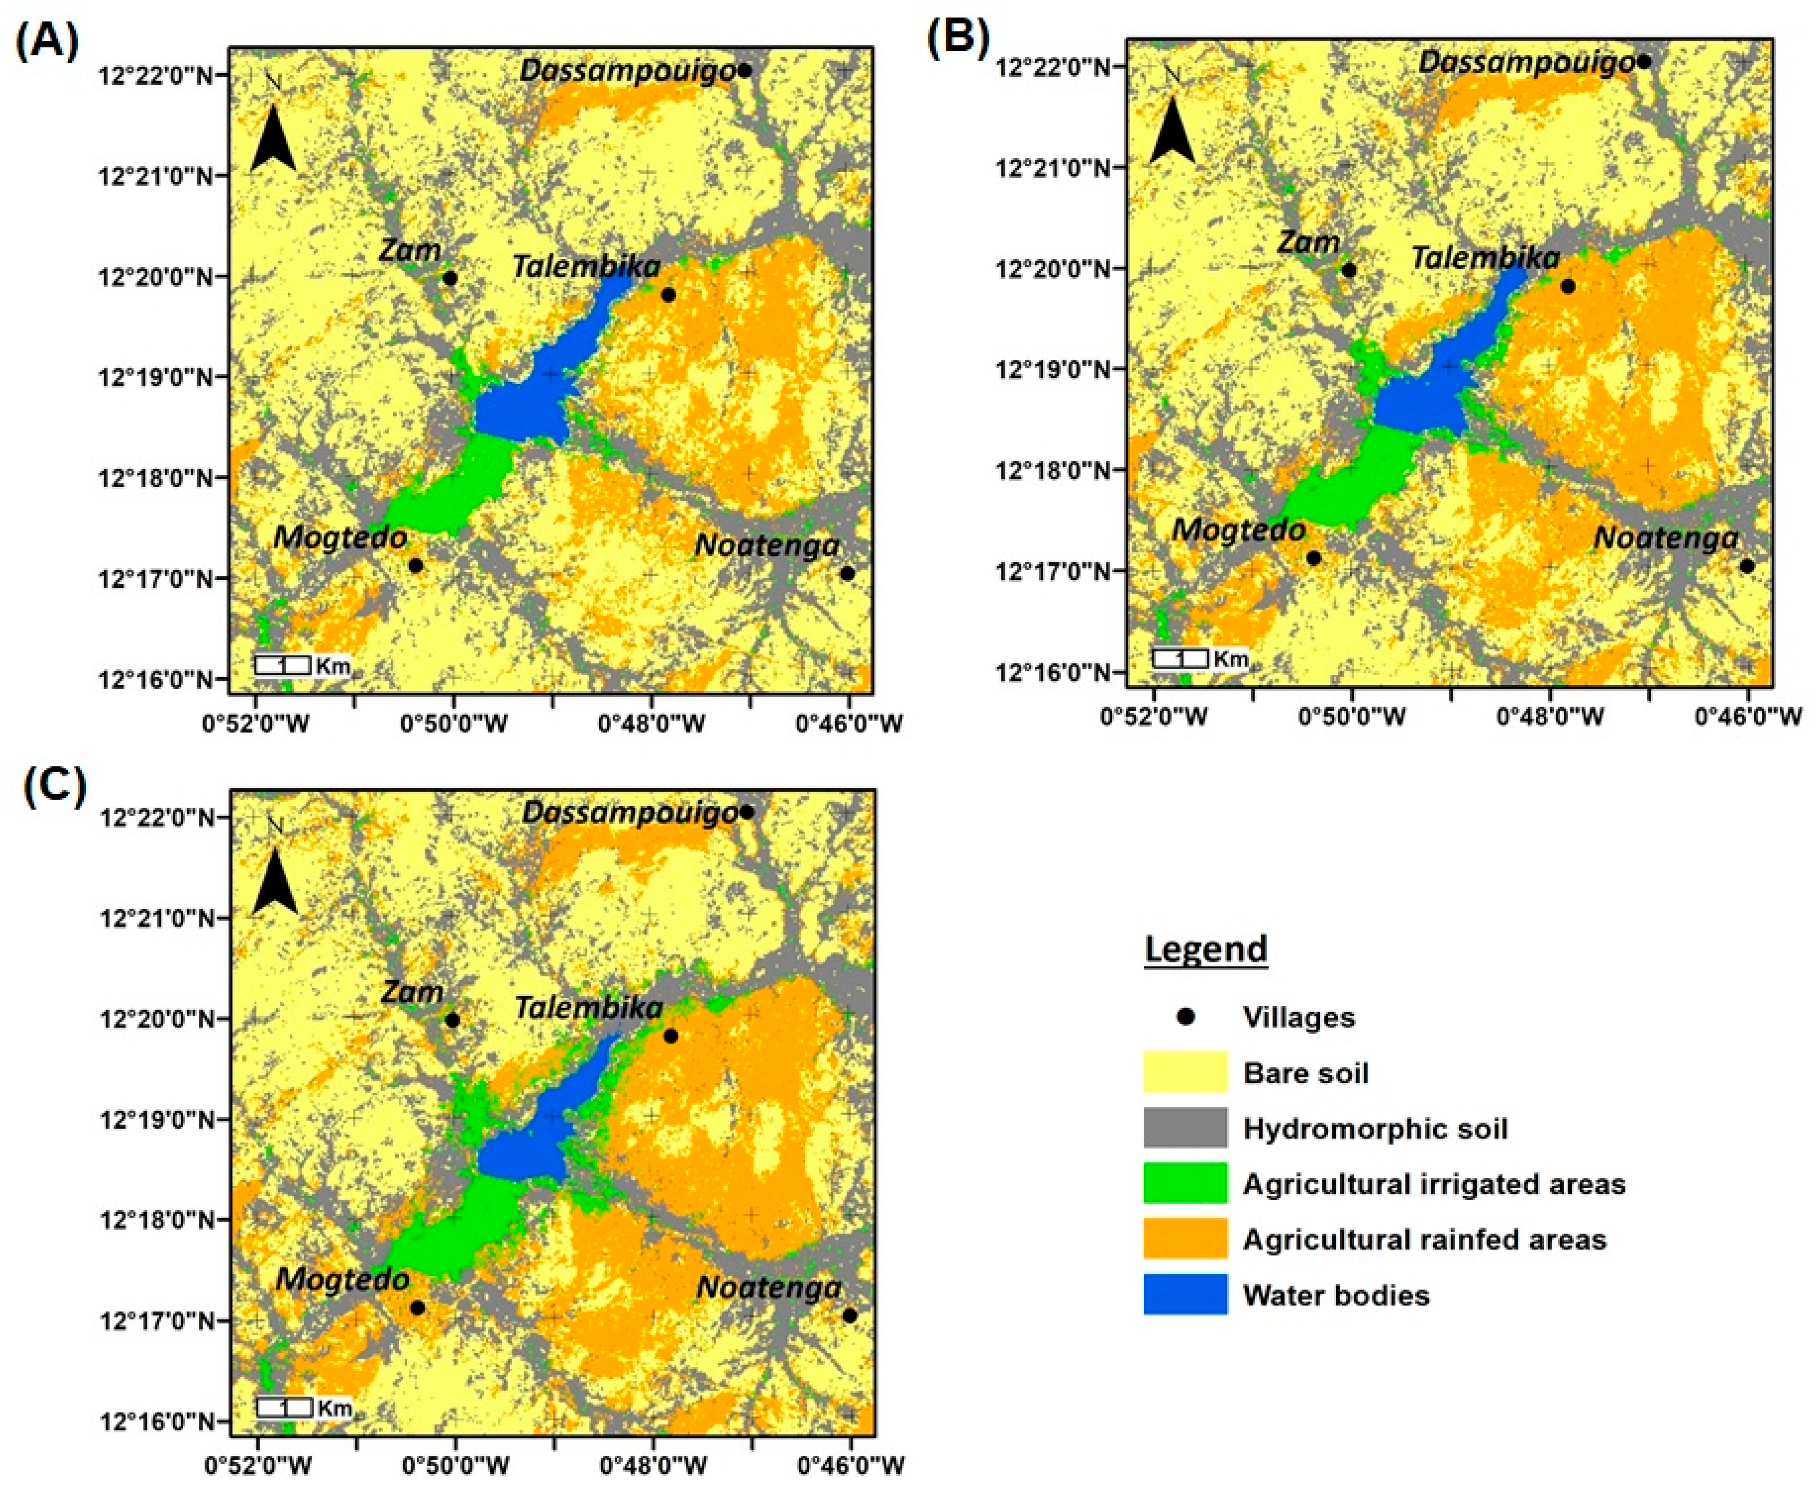
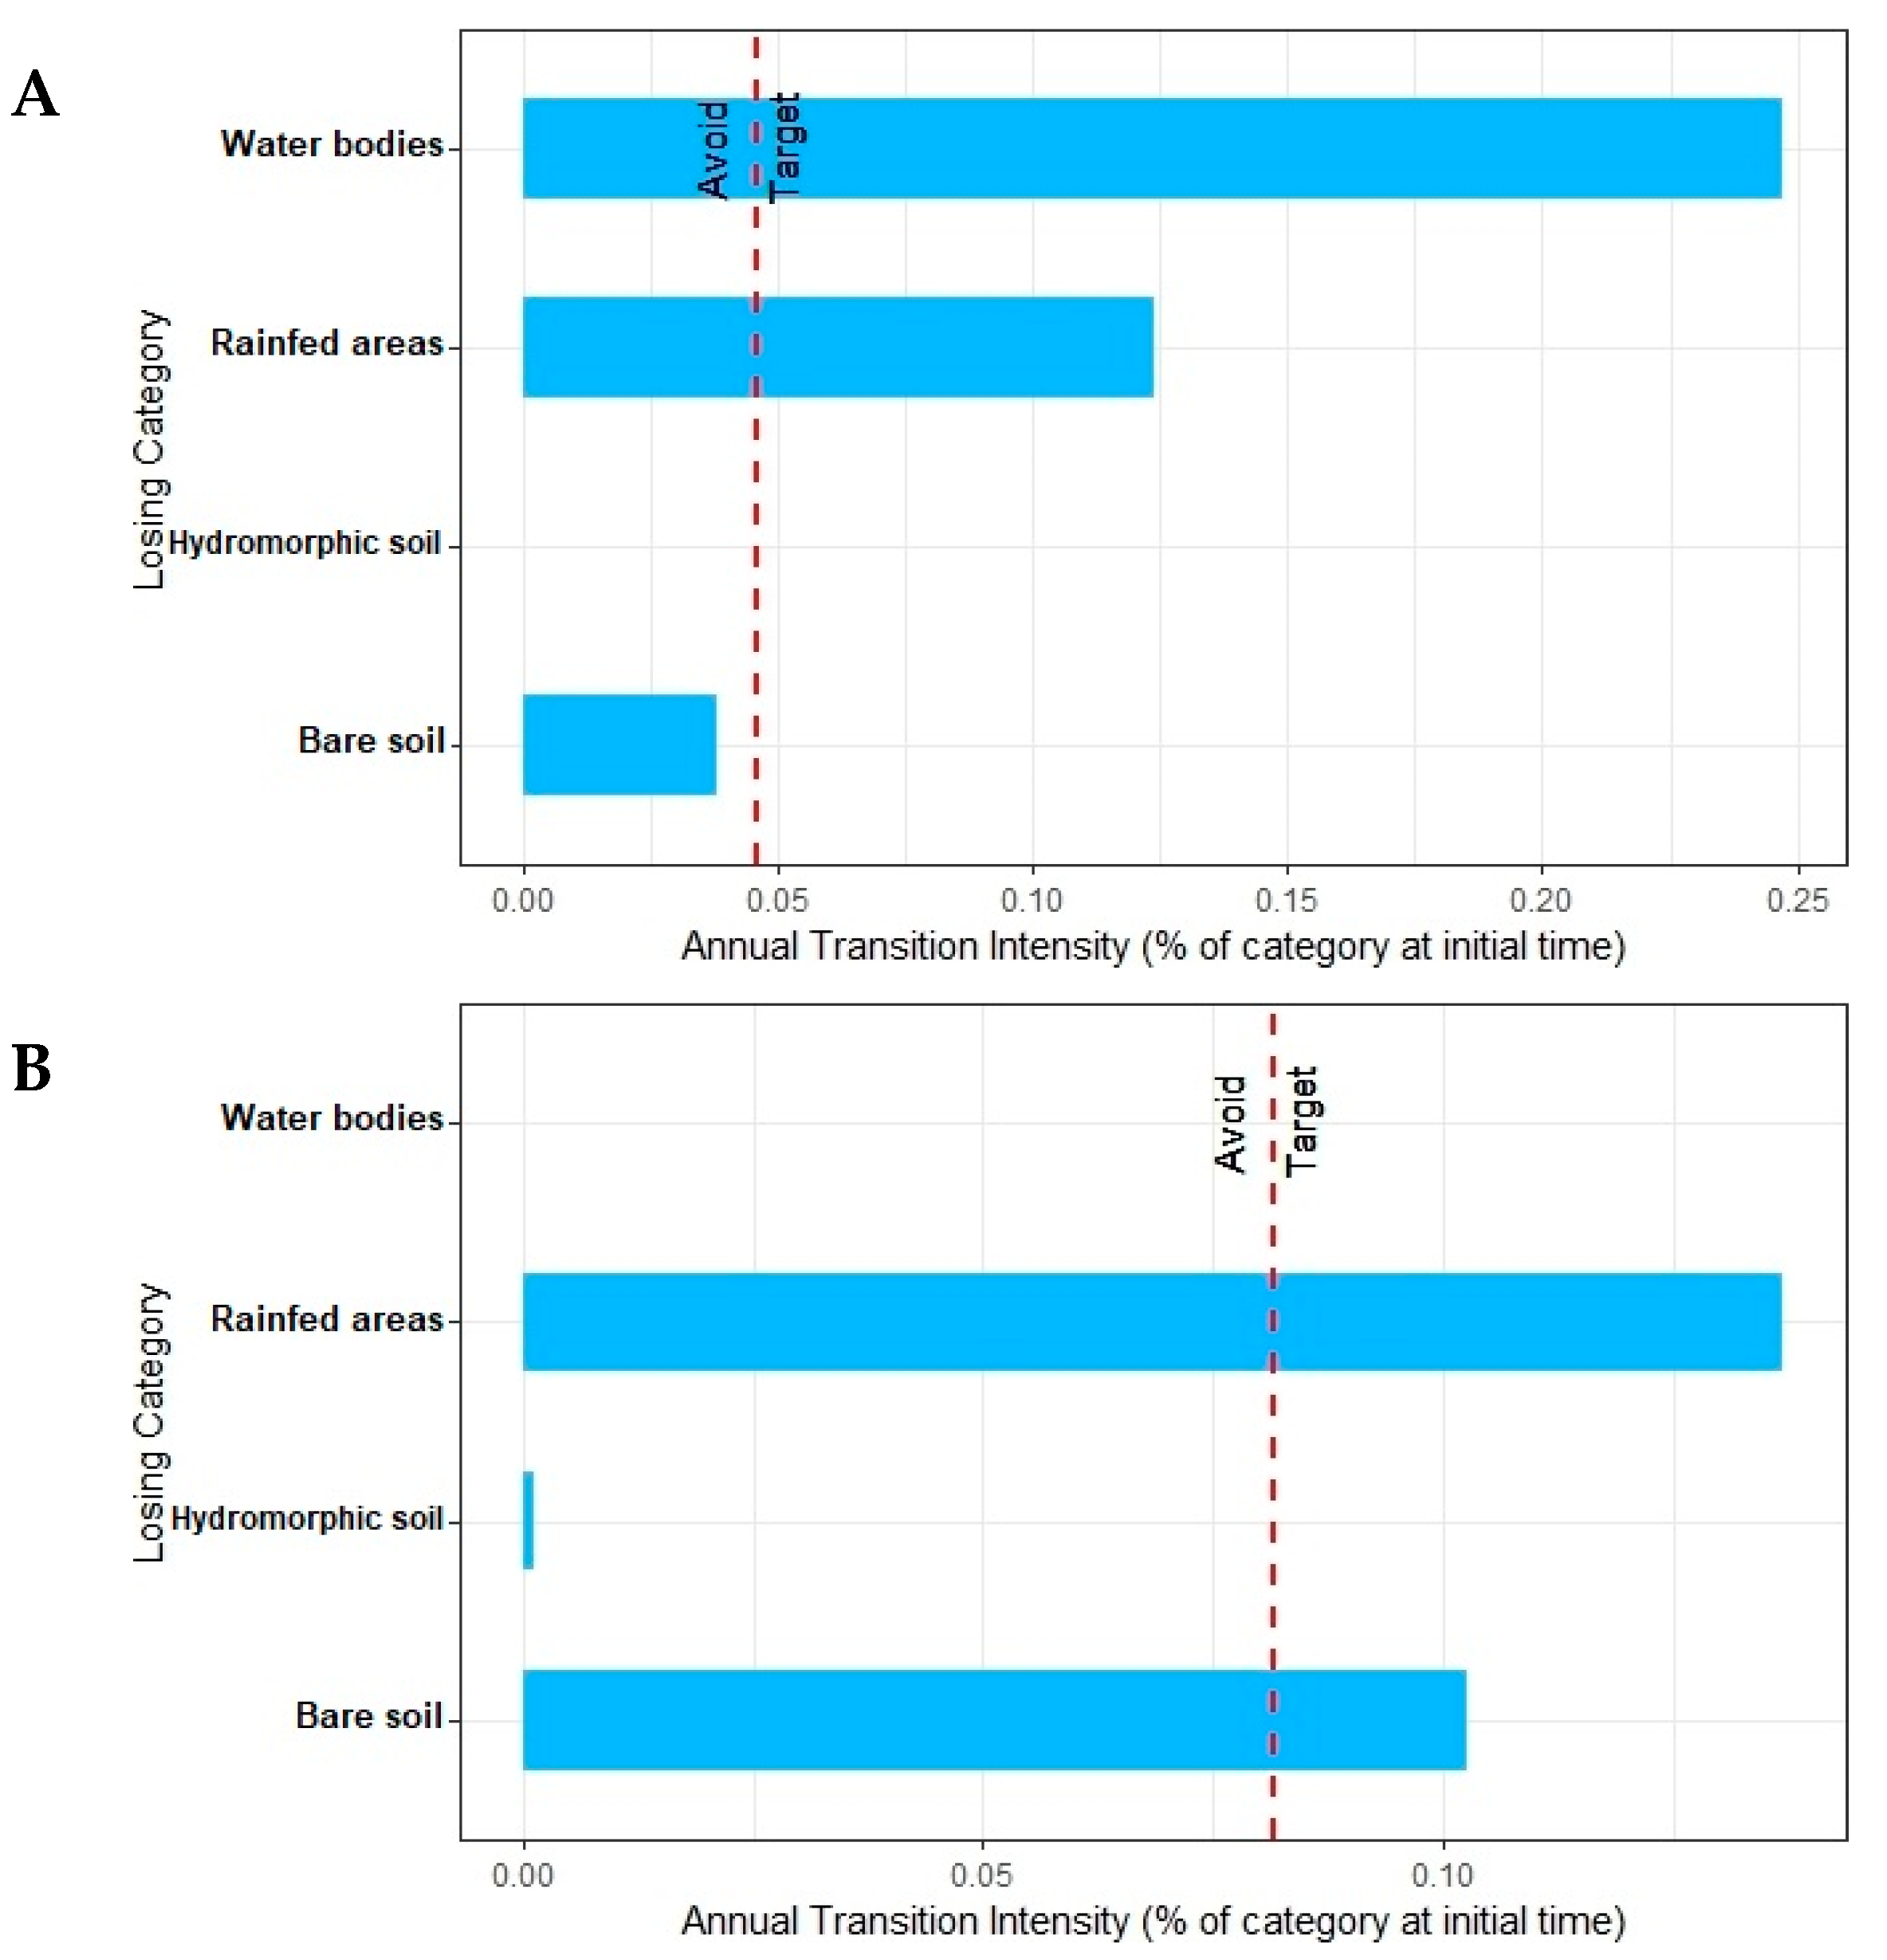
- Transition from irrigated areas to rainfed areas: rainfed agriculture was practiced on the hillsides, while irrigated areas were found close to the water reservoir where flooding could occur during the rainy season.
- Transition from irrigated areas to bare soil: fallow was not an option in crop rotation in irrigated areas.
- Transition from irrigated areas to water bodies.
4.3. Accuracy Assessment after Pixel Trajectory Corrections
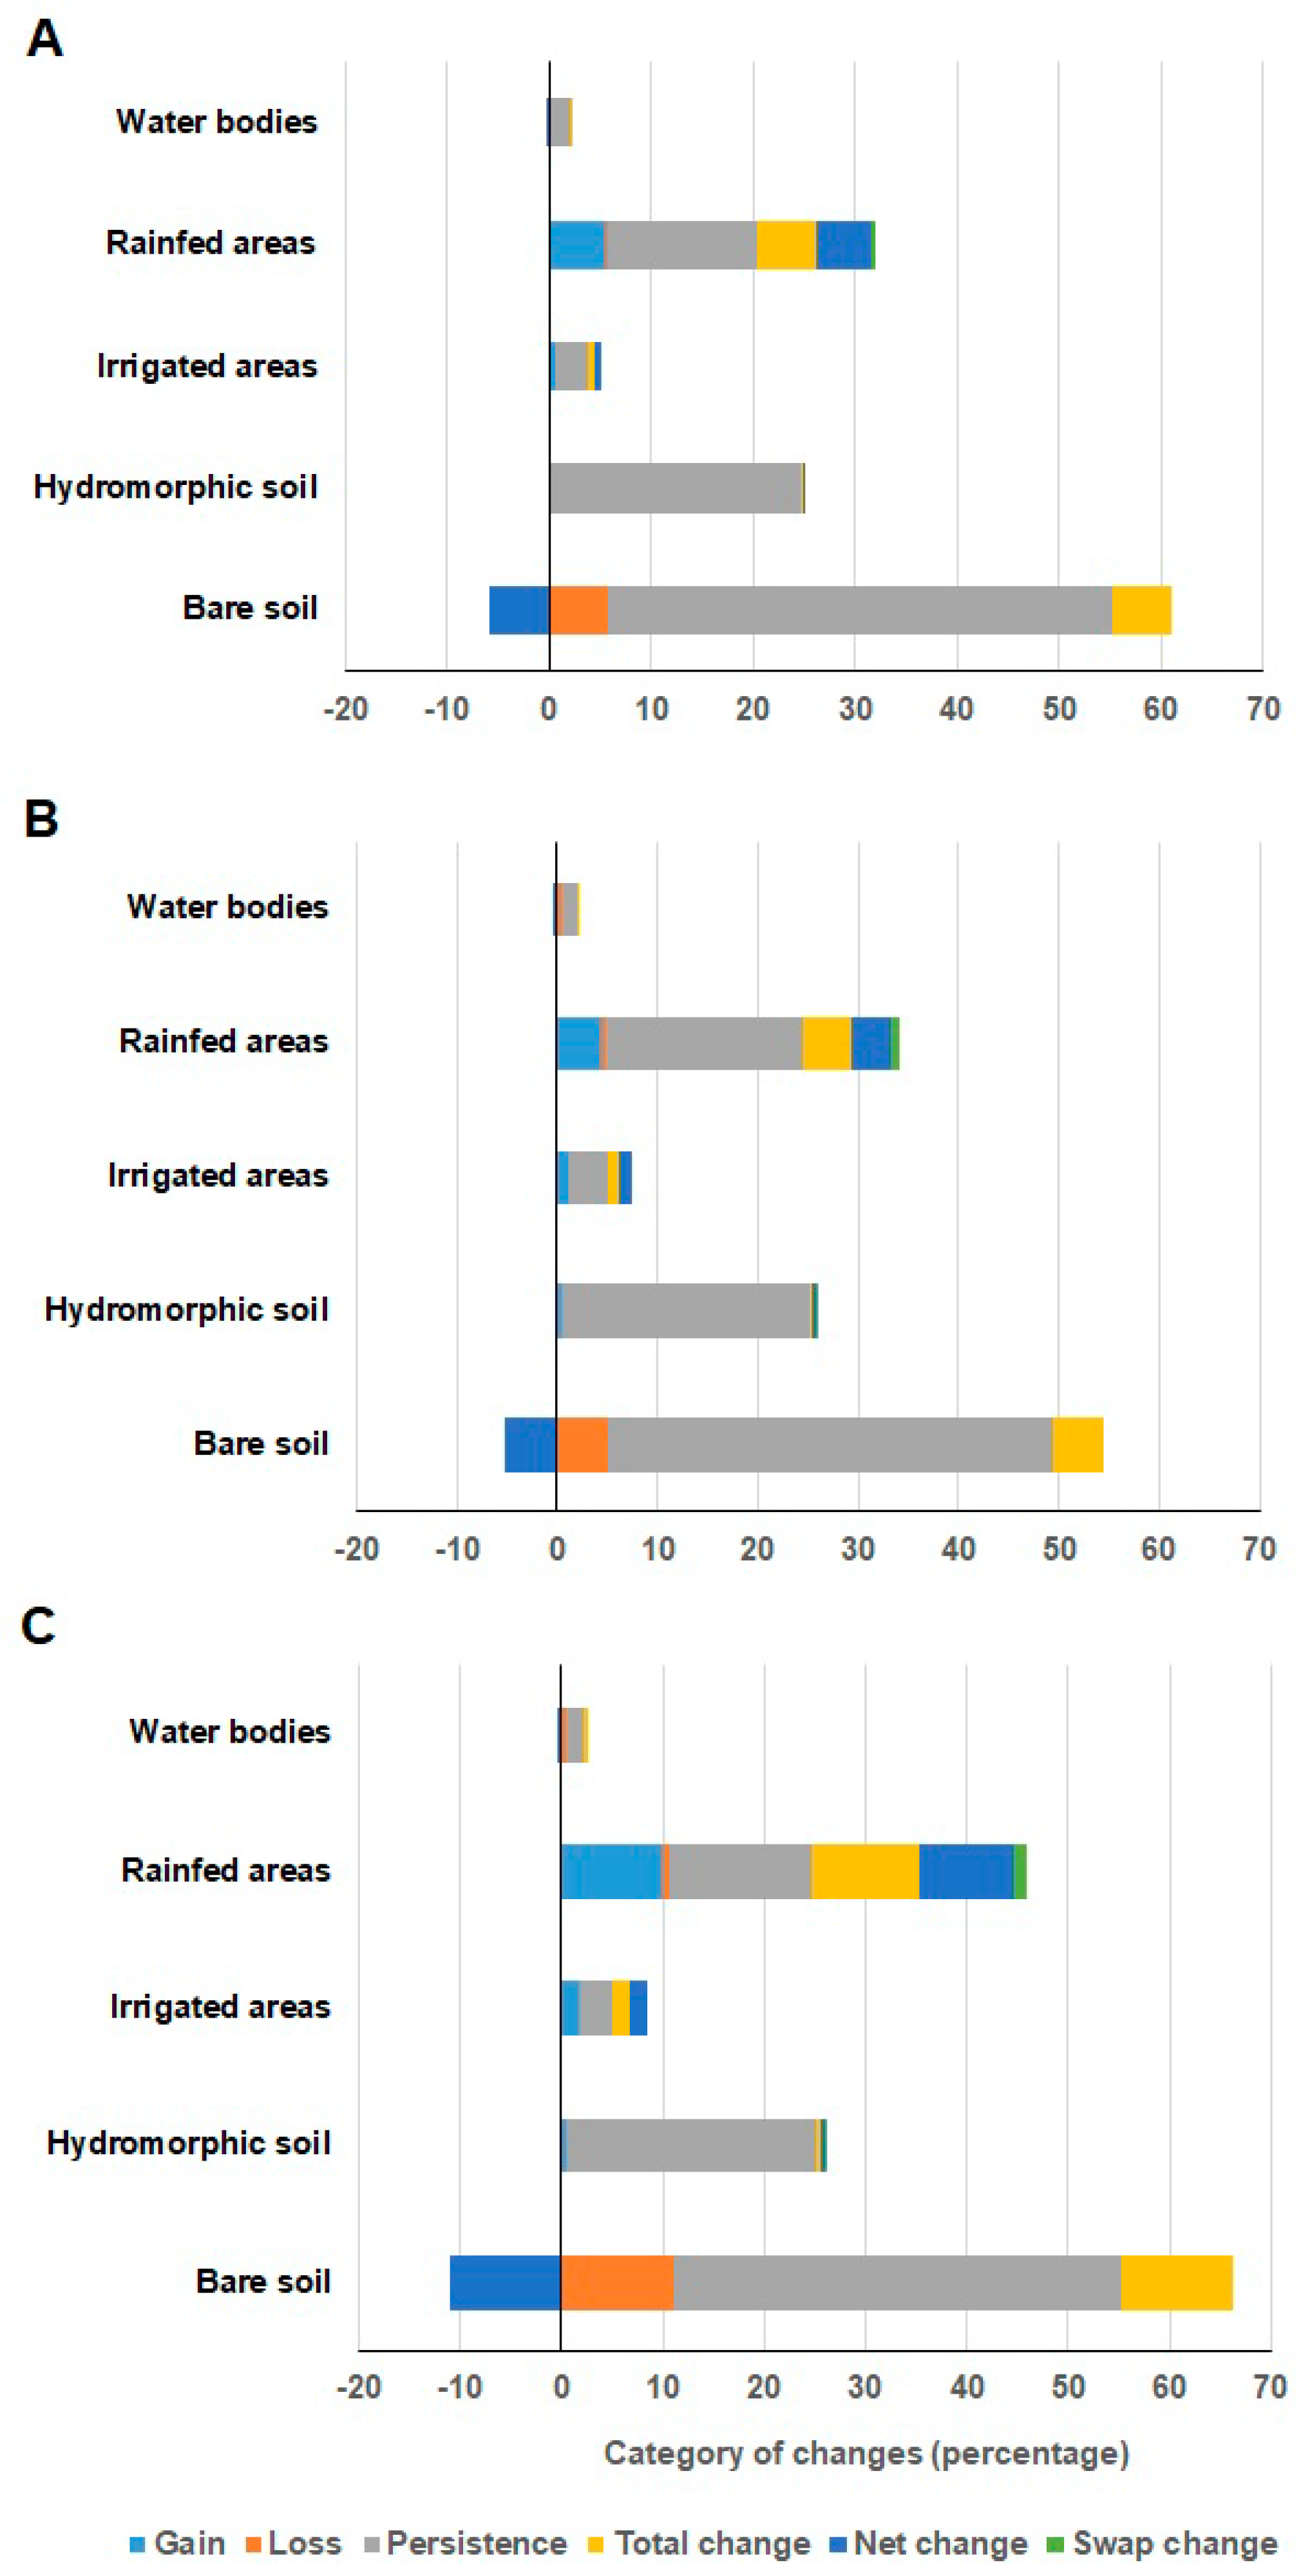
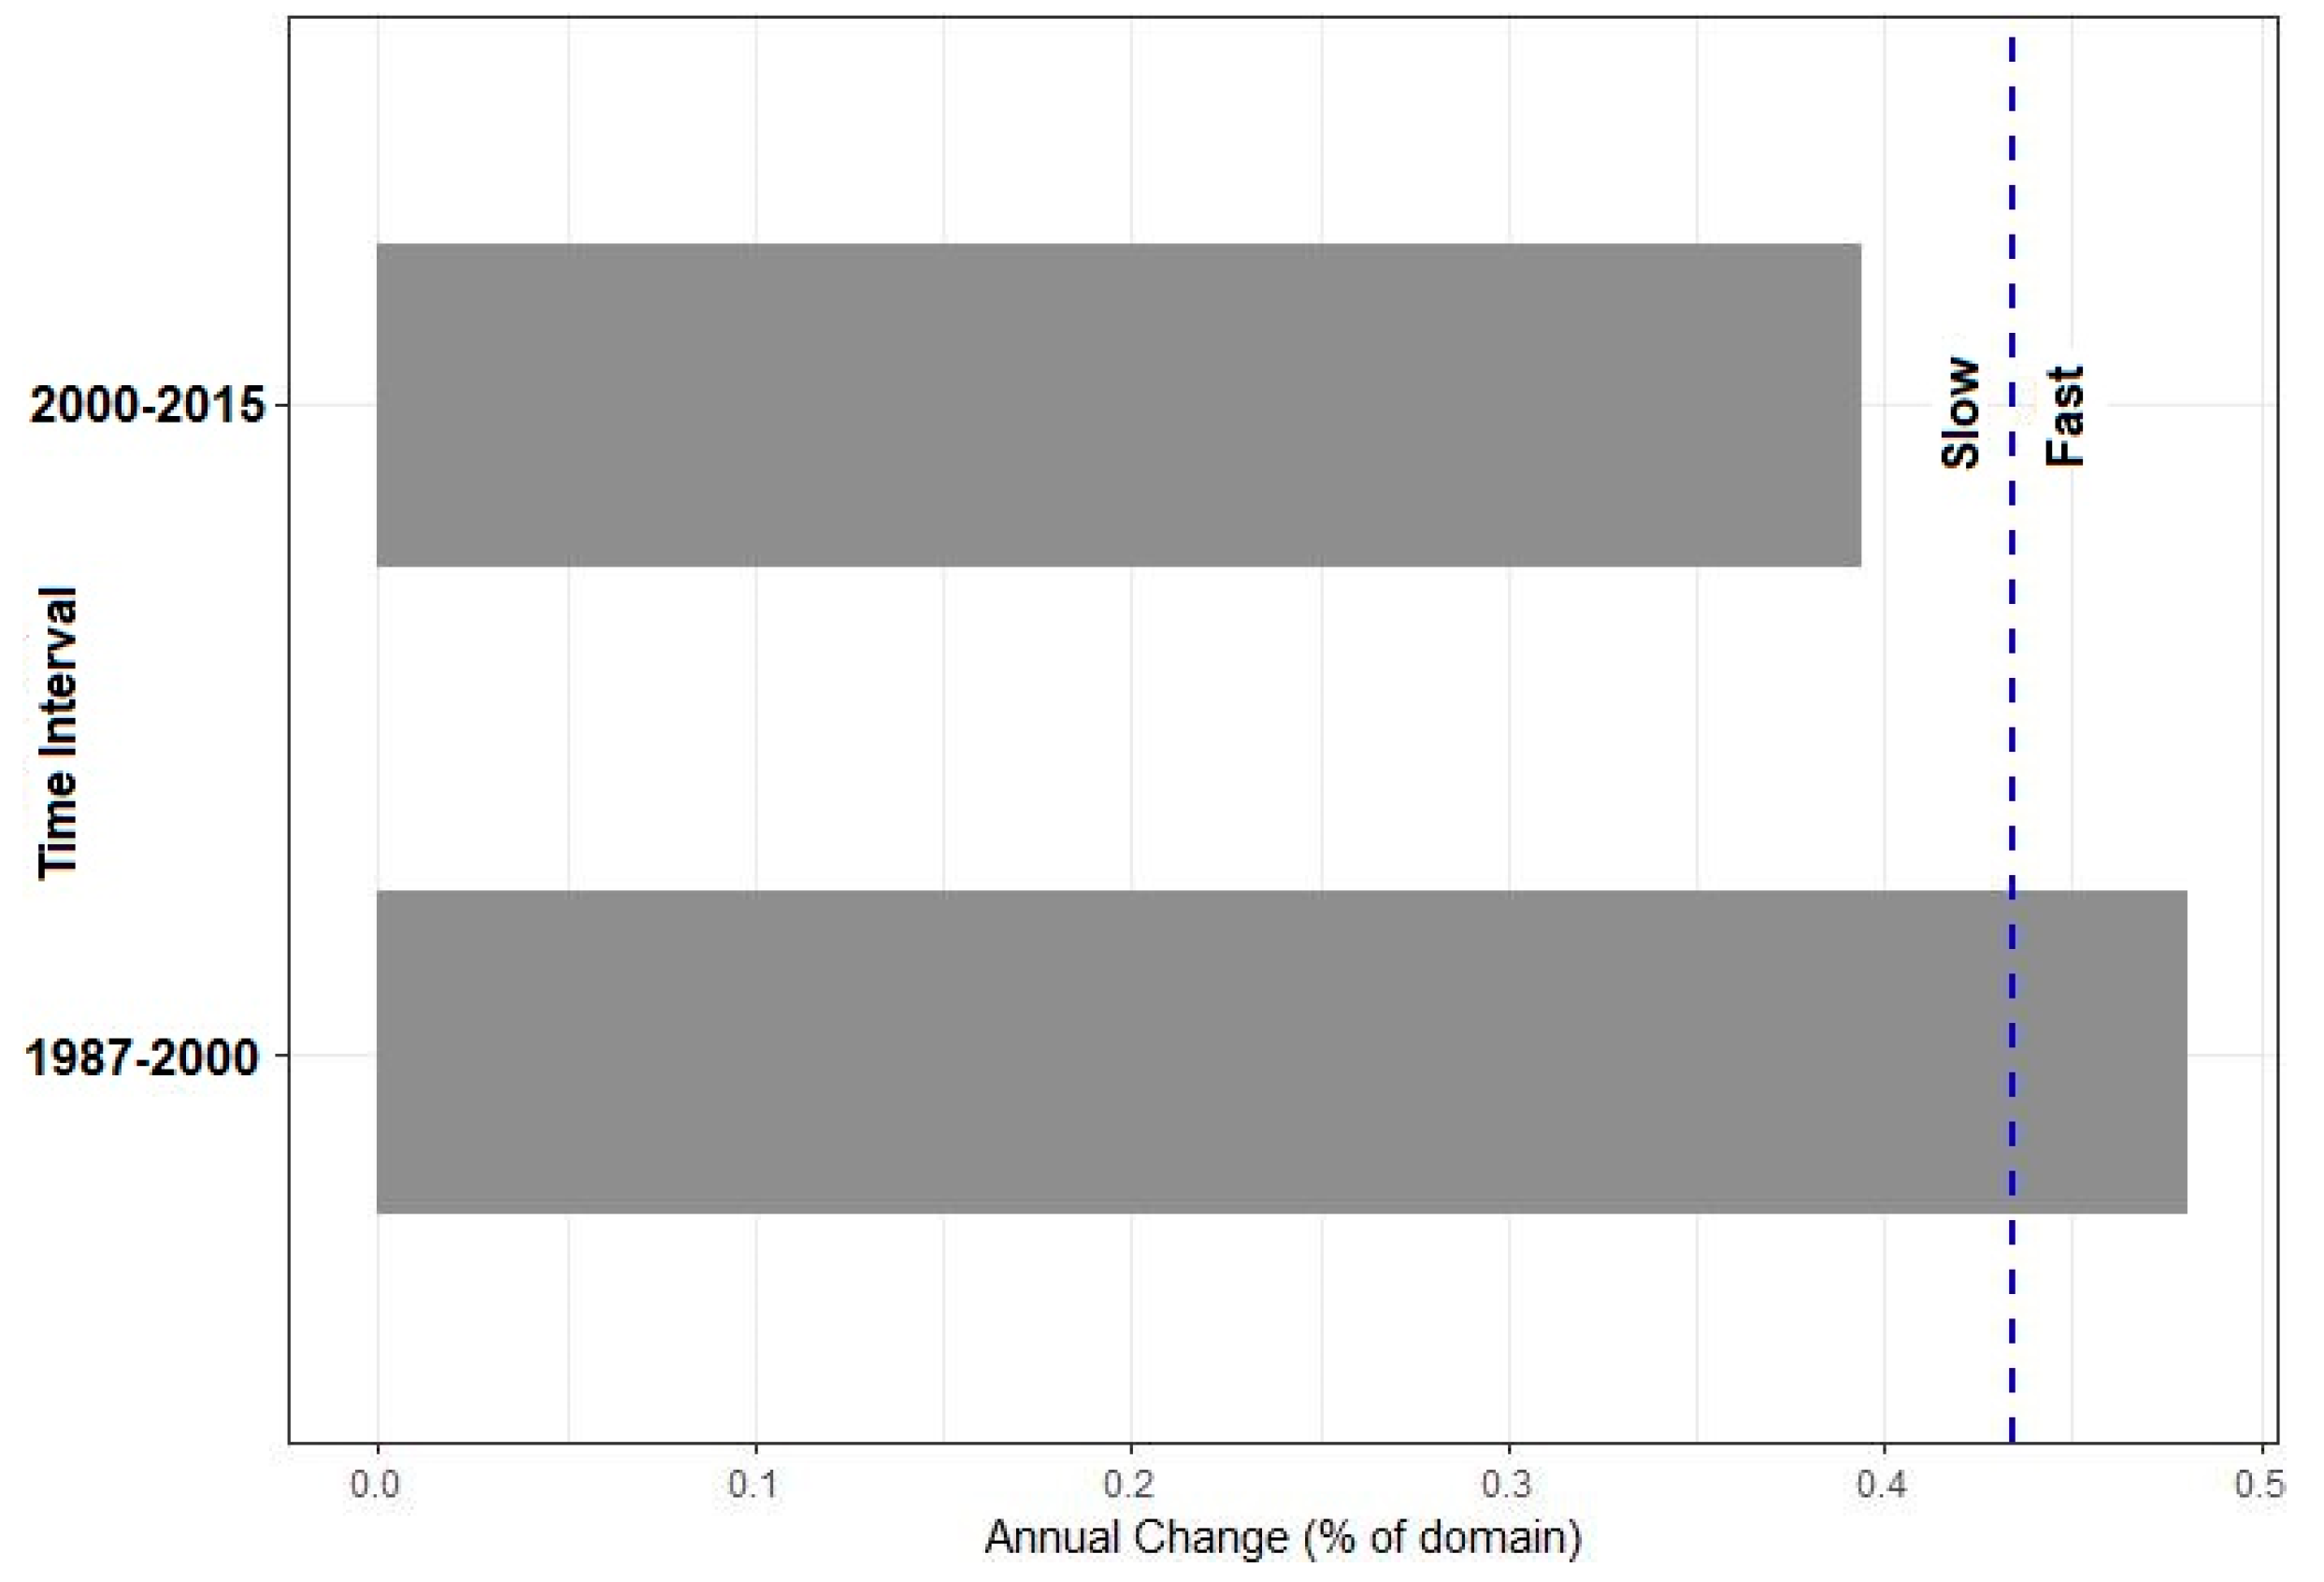
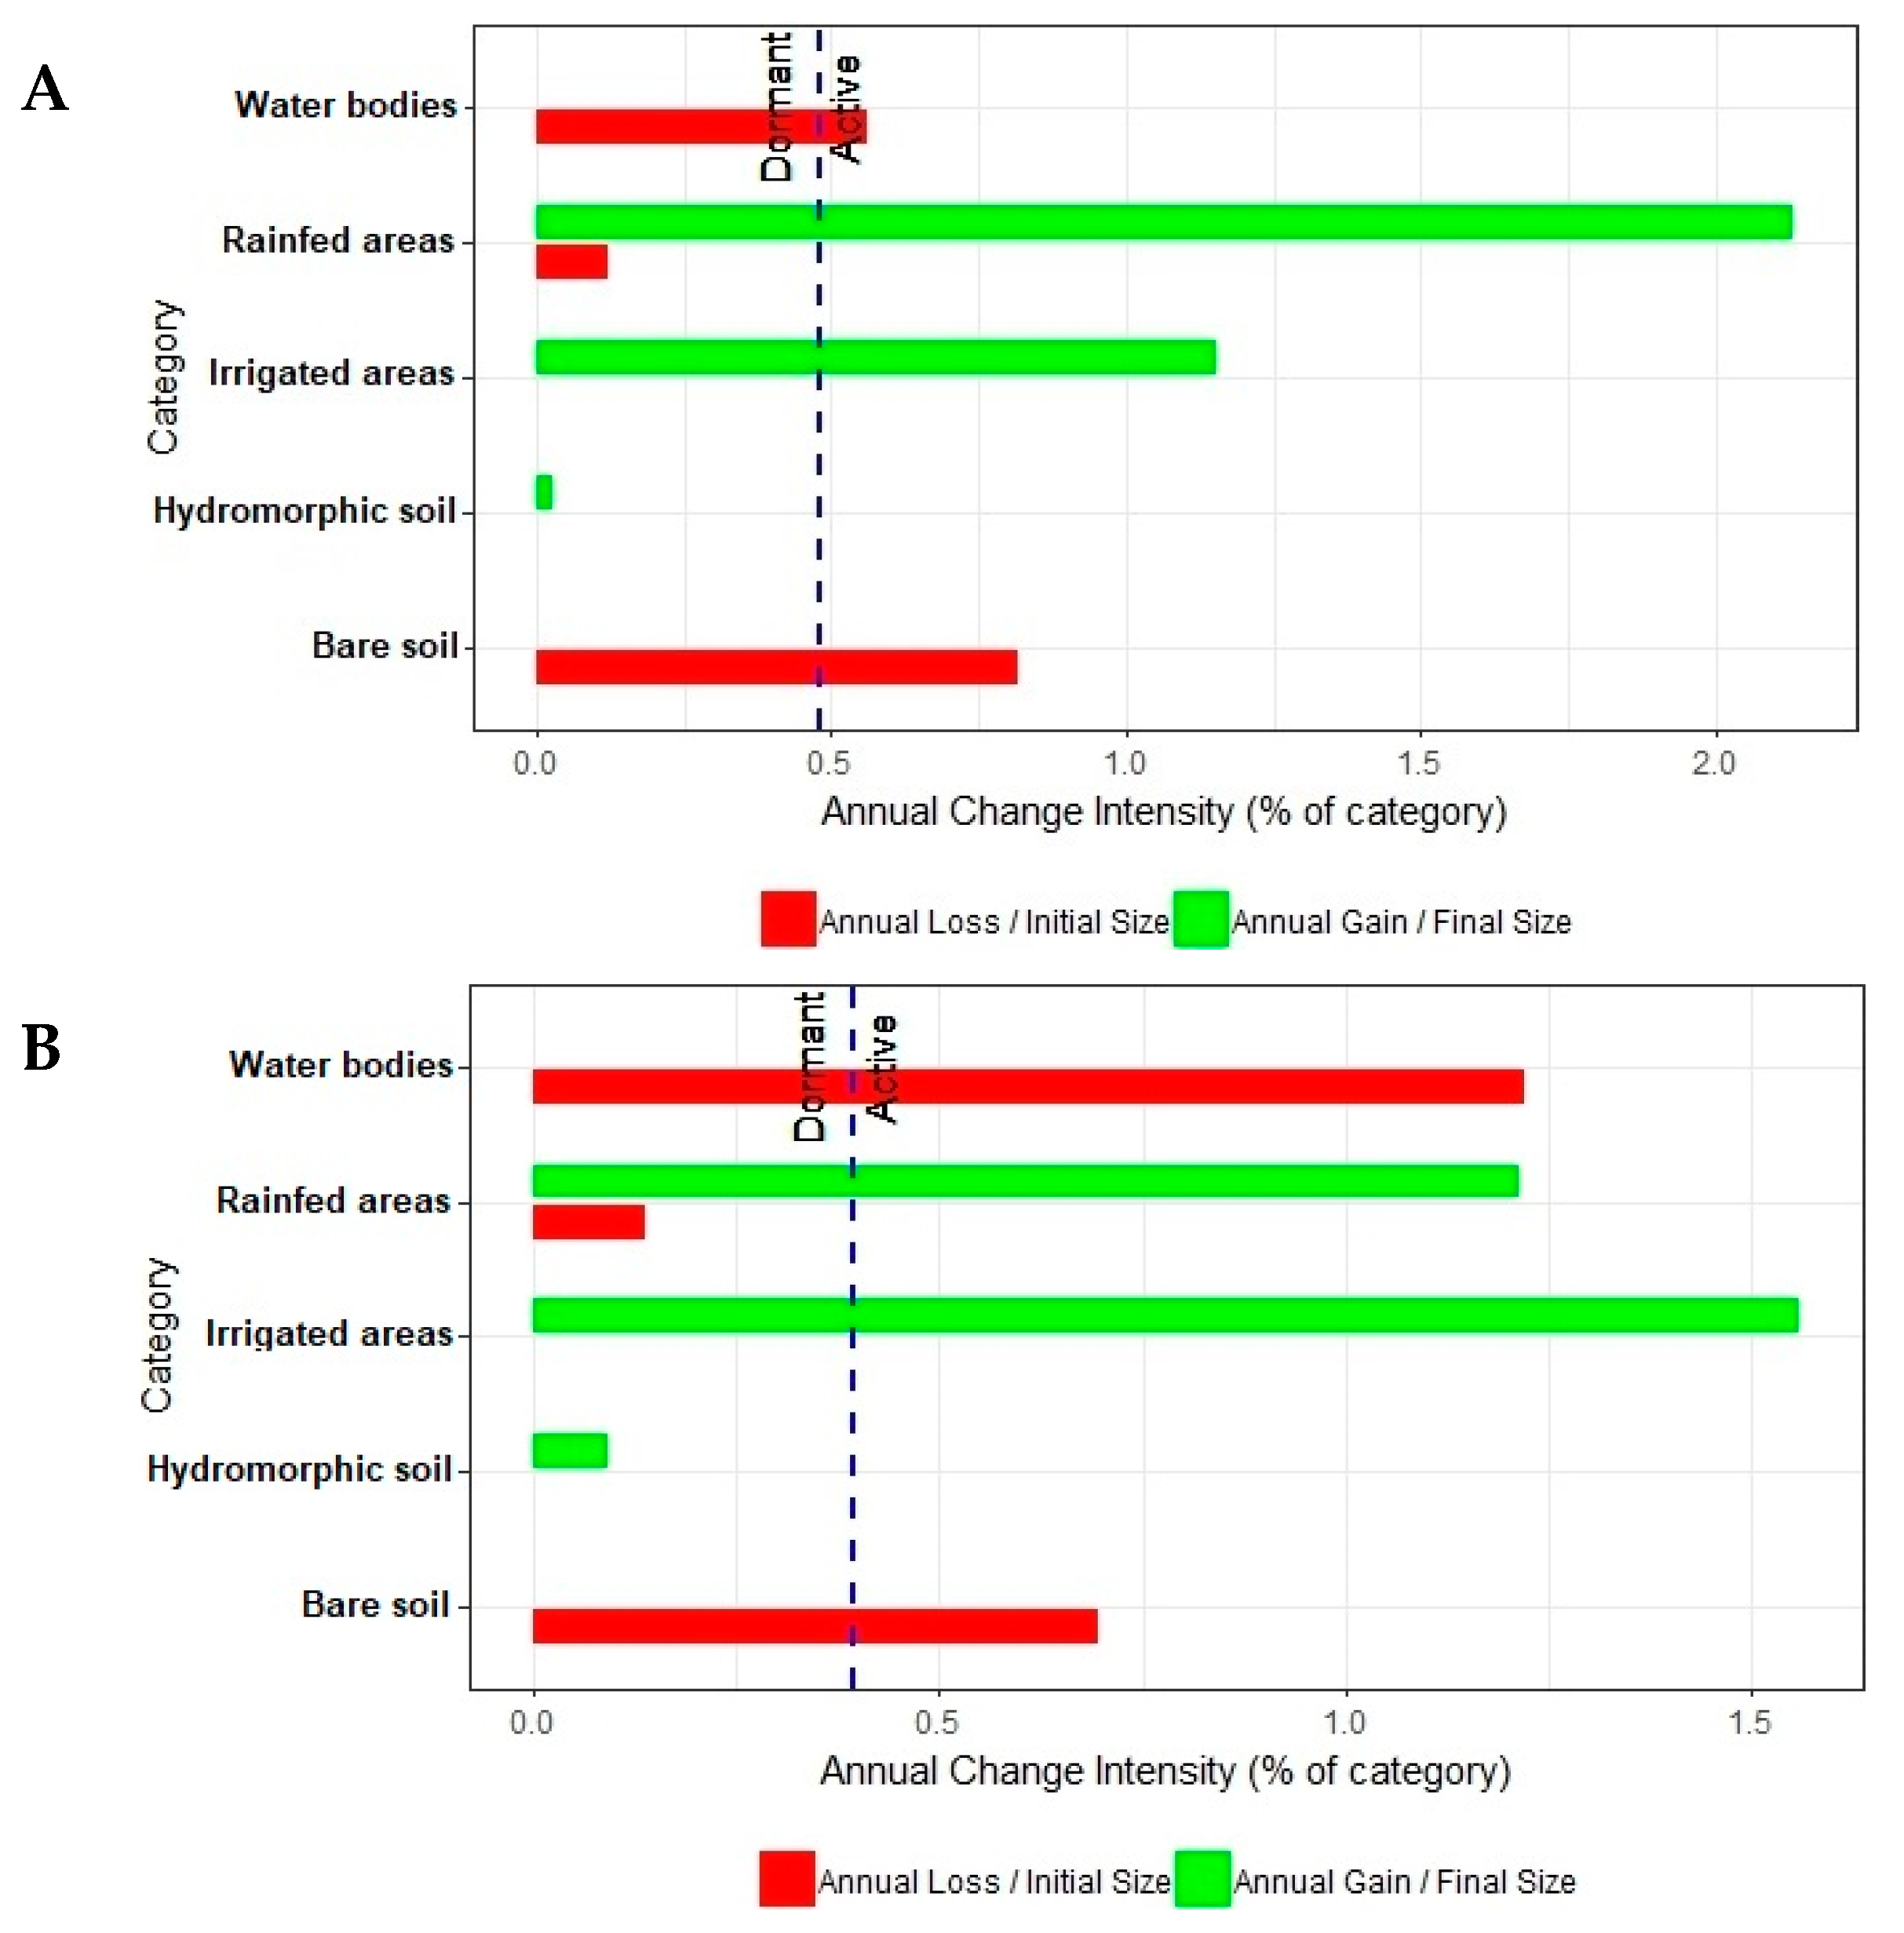
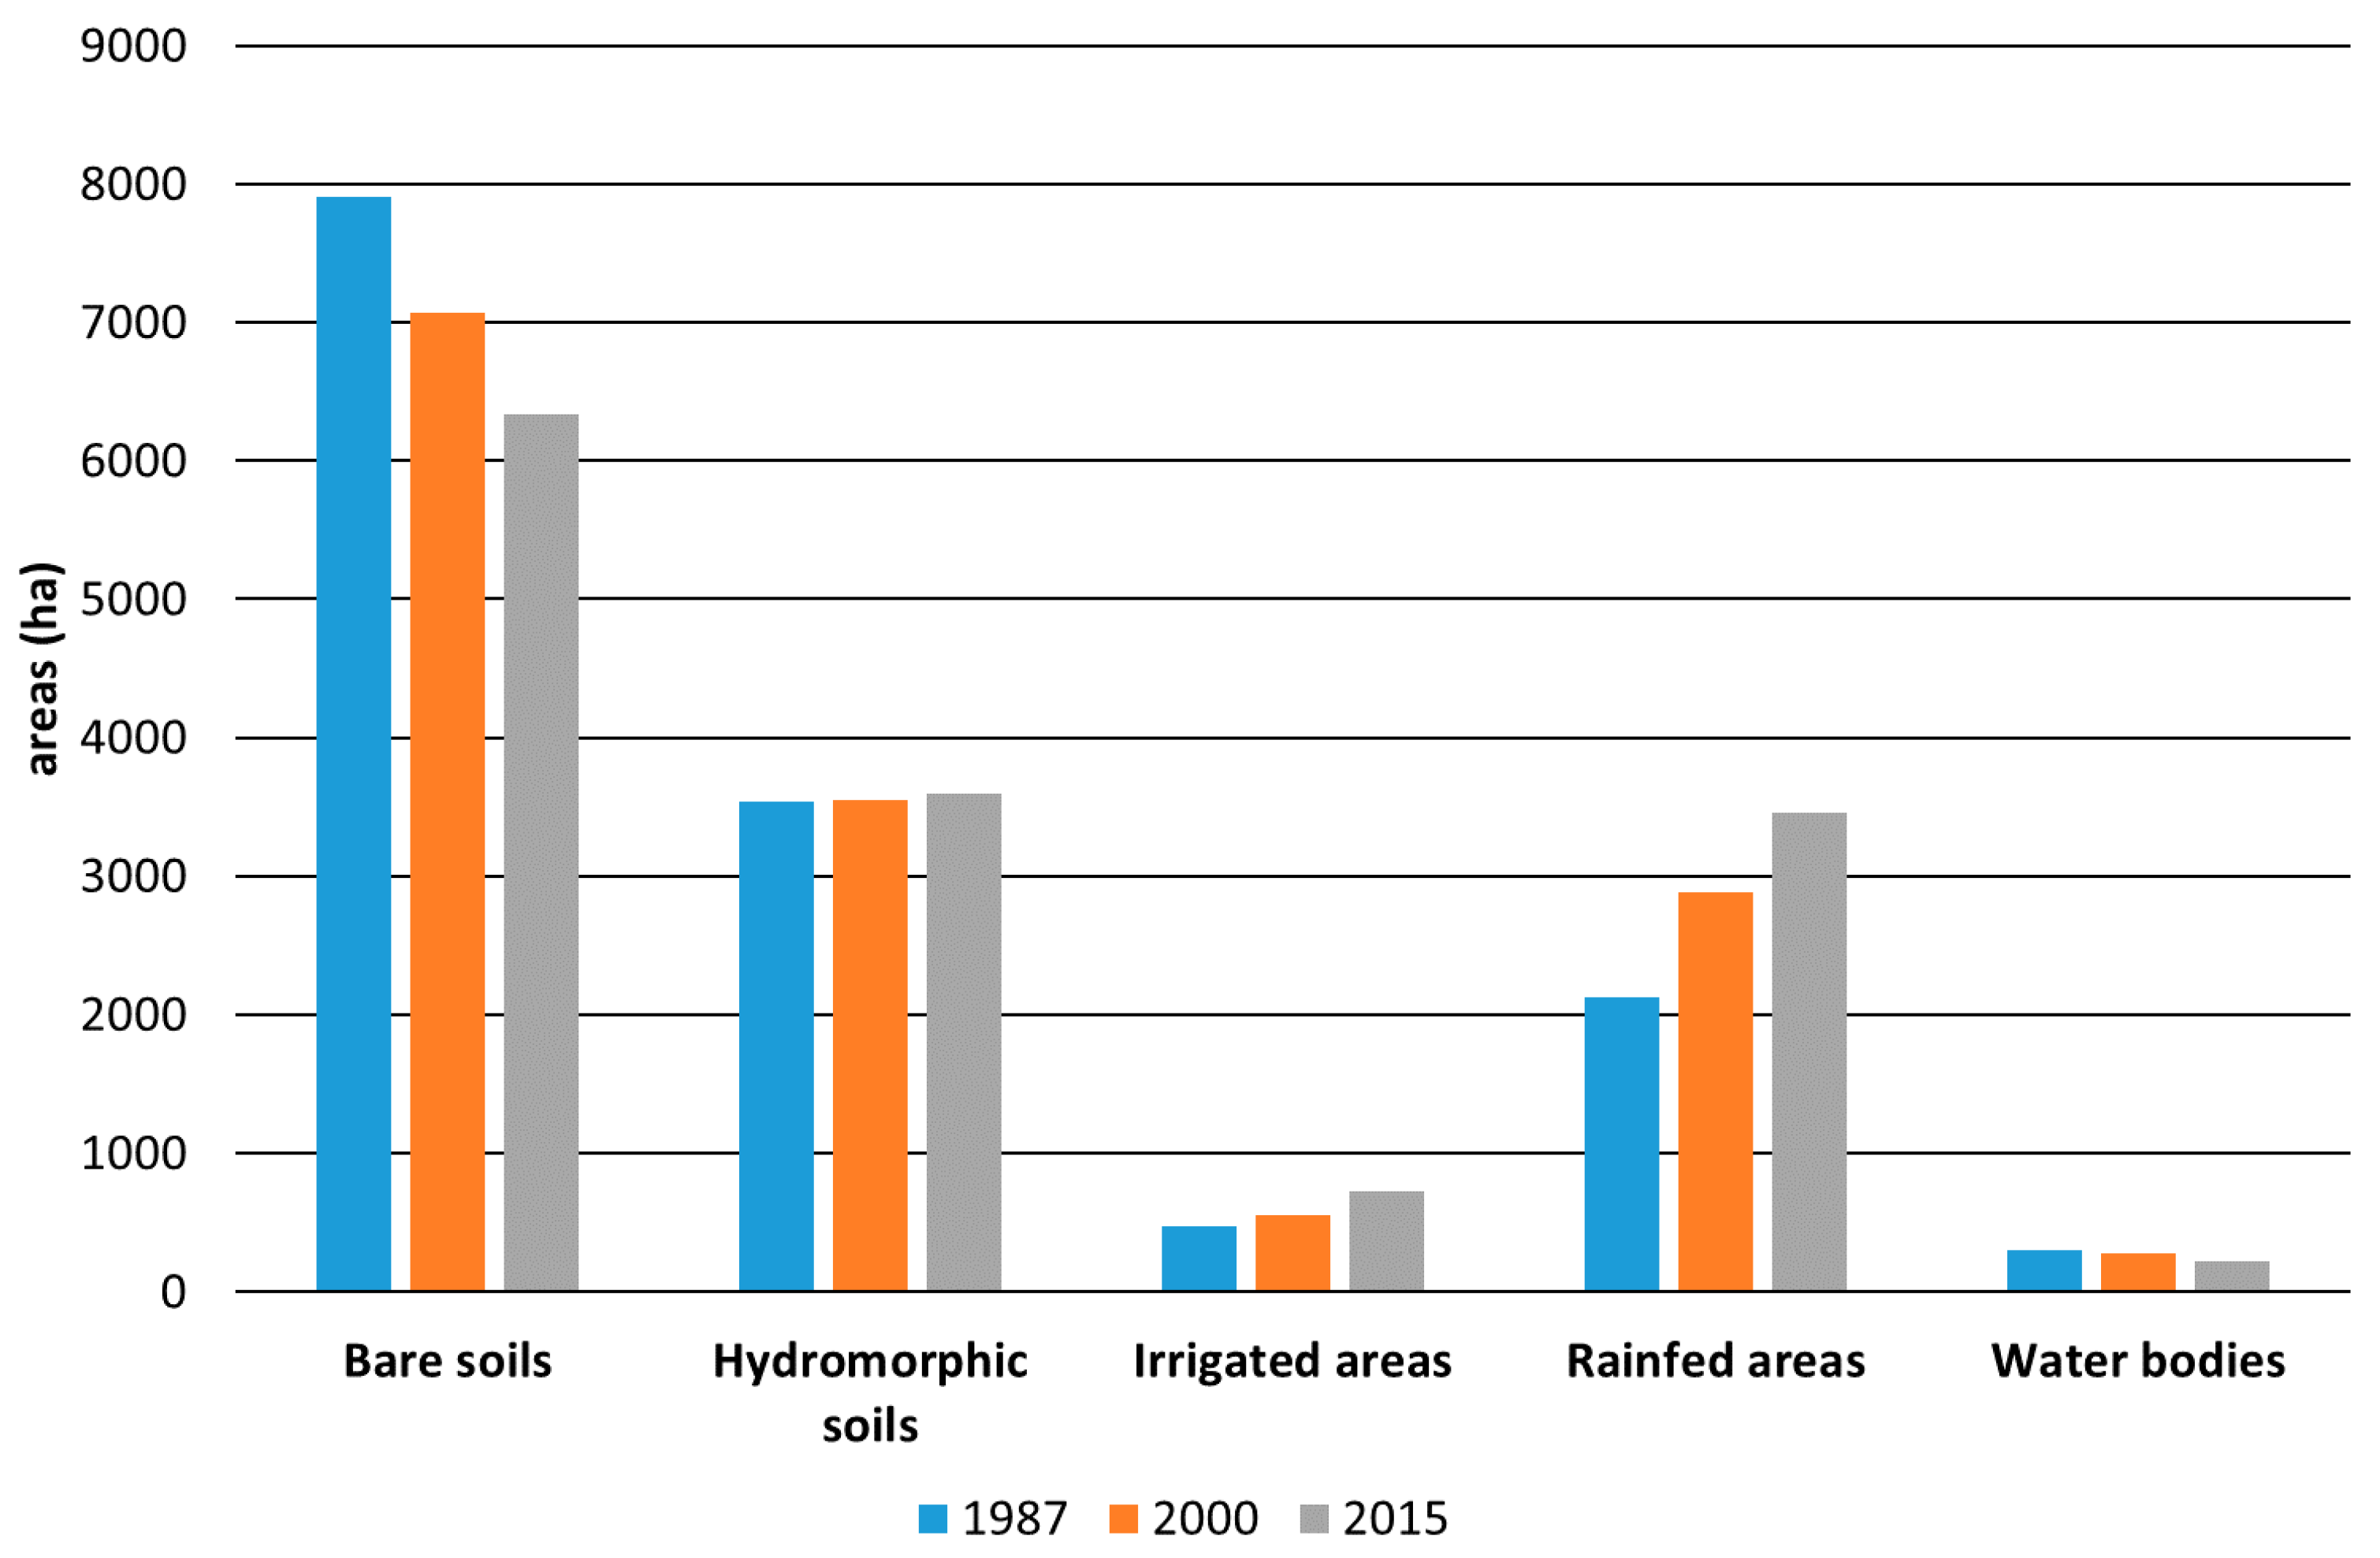
4.4. Changes of LULC Classes Between 1987 and 2015
5. Conclusions
Supplementary Materials
Author Contributions
Acknowledgments
Conflicts of Interest
References
- FAO. Country Fact Sheet on Food and Agriculture Policy Trends—Burkina Faso, April 2014. Available online: http://www.fao.org/docrep/field/009/i3760e/i3760e.pdf (accessed on 19 March 2019).
- Paturel, J.E.; Boubacar, I.; L’Aour, A.; Mahé, G. Analyses de grilles pluviométriques et principaux traits des changements survenus au 20ème siècle en Afrique de l’Ouest et Centrale. Hydrolog. Sci. J. 2010, 55, 1281–1289. [Google Scholar] [CrossRef]
- Paturel, J.E.; Servat, E.; Delattre, M.O.; Lubes-Niel, H. Analyse de séries pluviométriques de longue durée en Afrique de l’Ouest et Centrale non sahélienne dans un contexte de variabilité climatique/Analysis of rainfall long series in non-Sahelian West and Central Africa within a context of climate variability. Hydrolog. Sci. J. 1998, 43, 937–946. [Google Scholar] [CrossRef]
- Ali, A.; Lebel, T. The Sahelian standardized rainfall index revisited. Int. J. Climatol. 2008, 29, 1705–1714. [Google Scholar] [CrossRef]
- Benoît, E. Les changements climatiques: Vulnérabilité, impacts et adaptation dans le monde de la médecine traditionnelle au Burkina Faso. VertigO—La revue Électronique en Sciences de L’environnement 2008, 8, 1–13. [Google Scholar] [CrossRef]
- Lebel, T.; Ali, A. Recent trends in the Central and Western Sahel rainfall regime (1990–2007). J. Hydrol. 2009, 375, 52–64. [Google Scholar] [CrossRef]
- Ibrahim, B.; Karambiri, H.; Polcher, J.; Yacouba, H.; Ribstein, P. Changes in rainfall regime over Burkina Faso under the climate change conditions simulated by 5 regional climate models. Clim. Dynam. 2014, 42, 1363–1381. [Google Scholar] [CrossRef]
- Yameogo, S.; Kienou, A. Analysis of Public Expenditures in Support of Food and Agriculture Development in Burkina Faso, 2006–2010; Technical Notes Series; MAFAP, FAO: Rome, Italy, 2013; Available online: http://www.fao.org/3/a-at461e.pdf (accessed on 19 March 2019).
- Ministère de l’agriculture de l’hydraulique et des ressources halieutiques. Politique Nationale de Développement Durable de L’agriculture Irriguée: Stratégie, Plan D’action, Plan D’investissement à L’horizon 2015; Rapport Principal; MAHRH: Ouagadougou, Burkina Faso, 2006.
- FAO. Analyse des Dépenses Publiques en Soutien à L’agriculture et au Développement Rural au Burkina Faso, 2006–2013; Programme de Suivi et Analyses des Politiques Agricoles et Alimentaires (SAPAA), Série de Notes Techniques; MAFAP, FAO: Rome, Italy, 2014; Available online: http://www.fao.org/3/a-i4513f.pdf (accessed on 19 March 2019).
- Thenkabail, P.S.; Biradar, C.M.; Noojipady, P.; Dheeravath, V.; Li, Y.; Velpuri, M.; Gumma, M.; Gangalakunta, O.R.P.; Turral, H.; Cai, X.; et al. Global irrigated area map (GIAM), derived from remote sensing, for the end of the last millennium. Int. J. Remote Sens. 2009, 30, 3679–3733. [Google Scholar] [CrossRef]
- Ozdogan, M.; Yang, Y.; Allez, G.; Cervantes, C. Remote sensing of irrigated agriculture: Opportunities and challenges. Remote Sens. 2010, 2, 2274–2304. [Google Scholar] [CrossRef]
- Gumma, M.K.; Thenkabail, P.S.; Hideto, F.; Nelson, A.; Dheeravath, V.; Busia, D.; Rala, A. Mapping irrigated areas of Ghana using fusion of 30 m and 250 m resolution remote-sensing data. Remote Sens. 2011, 3, 816–835. [Google Scholar] [CrossRef]
- Velpuri, N.M.; Thenkabail, P.S.; Gumma, M.K.; Biradar, C.B.; Noojipady, P.; Dheeravath, V.; Yuanjie, L. Influence of resolution in irrigated area mapping and area estimations. Photogramm. Eng. Remote Sens. 2009, 75, 1383–1395. [Google Scholar] [CrossRef]
- Zoungrana, B.J.-B.; Conrad, C.; Amekudzi, L.K.; Thiel, M.; Da, E.D.; Forkuor, G.; Löw, F. Multi-Temporal Landsat Images and Ancillary Data for Land Use/Cover Change (LULCC) Detection in the Southwest of Burkina Faso, West Africa. Remote Sens. 2015, 7, 12076–12102. [Google Scholar] [CrossRef] [Green Version]
- Knauer, K.; Gessner, U.; Fensholt, R.; Forkuor, G.; Kuenzer, C. Monitoring Agricultural Expansion in Burkina Faso over 14 Years with 30 m Resolution Time Series: The Role of Population Growth and Implications for the Environment. Remote Sens. 2017, 9, 132. [Google Scholar] [CrossRef]
- Traoré, F.; Cornet, Y.; Denis, A.; Wellens, J.; Tychon, B. Monitoring the evolution of irrigated areas with Landsat images using backward and forward change detection analysis in the Kou watershed, Burkina Faso. Geocarto Int. 2013, 28, 733–752. [Google Scholar] [CrossRef]
- Jin, N.; Tao, B.; Ren, W.; Feng, M.; Sun, R.; He, L.; Zhuang, W.; Yu, Q. Mapping irrigated and rainfed wheat areas using multi-temporal satellite data. Remote Sens. 2016, 8, 207. [Google Scholar] [CrossRef]
- Basukala, A.K.; Oldenburg, C.; Schellberg, J.; Sultanov, M.; Dubovyk, O. Towards improved land use mapping of irrigated croplands: Performance assessment of different image classification algorithms and approaches. Eur. J. Remote Sens. 2017, 50, 187–201. [Google Scholar] [CrossRef]
- Xiong, J.; Thenkabail, P.S.; Gumma, M.K.; Teluguntla, P.; Poehnelt, J.; Congalton, R.G.; Yadav, K.; Thau, D. Automated cropland mapping of continental Africa using Google Earth Engine cloud computing. ISPRS J. Photogramm. Remote Sens. 2017, 126, 225–244. [Google Scholar] [CrossRef] [Green Version]
- Forkuor, G.; Hounkpatin, O.K.L.; Welp, G.; Thiel, M. High resolution mapping of soil properties using remote sensing variables in south-western Burkina Faso: A comparison of machine learning and multiple linear regression models. PLoS ONE 2017, 12, e0170478. [Google Scholar] [CrossRef]
- Schug, F.; Okujeni, A.; Hauer, J.; Hostert, P.; Nielsen, J.Ø.; van der Linden, S. Mapping patterns of urban development in Ouagadougou, Burkina Faso, using machine learning regression modeling with bi-seasonal Landsat time series. Remote Sens. Environ. 2018, 210, 217–228. [Google Scholar] [CrossRef]
- Société Africaine d’études et Conseils. Plan Communal de Développement de Zam; MATD: Ouagadougou, Burkina Faso, 2008; p. 104. [Google Scholar]
- Sahelian Agency for Water Environment and Sanitation. Plan Communal de Développement Sectoriel Approvisionnement en Eau Potable et Assainissement de la Commune de Mogtedo (Horizon 2010–2015); Gouvernorat du Plateau Central: Ziniaré, Burkina Faso, 2009; p. 57.
- Ouédraogo, S. Diagnostic Organisationnel Pour L’exploitation et la Gestion du Périmètre Irrigué de Mogtedo: Contrainte et Suggestions; Rapport de fin de Cycle du Brevet de Technicien Supérieur; Centre Agricole Polyvalent de Matourkou: Matourkou, Burkina Faso, 2009. [Google Scholar]
- Ibrahim, B. Evaluation de la Prise en Compte de la Variabilité Climatique Dans la Gestion de la Retenue D’eau de Mogtedo au Burkina Faso; WASCAL: Ouagadougou, Burkina Faso, 2016; p. 23. [Google Scholar]
- Sally, H.; Lévite, H.; Cour, J. Local water management of small reservoirs: Lessons from two case studies in Burkina Faso. Water Altern. 2011, 4, 365–382. [Google Scholar]
- Ndanga Kouali, G. Compétition Entre Périmètres Irrigués Partageant la Même Ressource en Eau: Cas de Mogtedo et Talembika; Mémoire de Master; 2iE: Ouagadougou, Burkina Faso, 2010. [Google Scholar]
- Guyon, F.; Hallot, E.; De Thysebaert, D.; Diarra, B.G.; Roamba, J.; Zangré, B.V.C.A. Estimation de la sédimentation des retenues de Kierma, Wedbila et Mogtedo—Méthodologie et résultats obtenus. In Proceedings of the Atelier de capitalisation des résultats et Acquis du PADI, Ouagadougou, Burkina Faso, 14–15 November 2016. [Google Scholar]
- Sally, H.; Keïta, A.; Ouattara, S. Analyse Diagnostic et Performances de 5 Périmètres Irrigués Autour de Barrages au Burkina Faso; Projet Management de l’Irrigation—Burkina Faso: Ouagadougou, Burkina Faso, 1997; p. 273. [Google Scholar]
- Mas, J.F. Monitoring land-cover changes: A comparison of change detection techniques. Int. J. Remote Sens. 1999, 20, 139–152. [Google Scholar] [CrossRef]
- Chander, G.; Markham, B.L. Revised Landsat-5 TM radiometric calibration procedures and postcalibration dynamic ranges. IEEE Trans. Geosci. Remote Sens. 2003, 41, 2674–2677. [Google Scholar] [CrossRef]
- Chander, G.; Markham, B.L.; Helder, D.L. Summary of current radiometric calibration coefficients for Landsat MSS, TM, ETM+, and EO-1 ALI sensors. Remote Sens. Environ. 2009, 113, 893–903. [Google Scholar] [CrossRef]
- Wellens, J. Note Technique: Recensement Hydro-Agricole: Mogtedo—Mars 2012; PADI-BF102: Ouagadougou, Burkina Faso, 2012; p. 7. [Google Scholar]
- Richards, J.A.; Jia, X. Remote Sensing Digital Image Analysis, 4th ed.; Springer: Berlin/Heidelberg, Germany, 2006; p. 439. [Google Scholar] [CrossRef]
- Ustuner, M.; Sanli, F.B.; Dixon, B. Application of support vector machines for landuse classification using high-resolution rapideye images: A sensitivity analysis. Eur. J. Remote Sens. 2015, 48, 403–422. [Google Scholar] [CrossRef]
- Mountrakis, G.; Im, J.; Ogole, C. Support vector machines in remote sensing: A review. ISPRS J. Photogramm. Remote Sens. 2011, 66, 247–259. [Google Scholar] [CrossRef]
- Vapnik, V.N. The Nature of Statistical Learning Theory; Springer: New York, NY, USA, 1995; p. 314. [Google Scholar] [CrossRef]
- Gidudu, A.; Greg, H.; Marwala, T. Classification of Images Using Support Vector Machines. arXiv 2007, arXiv:0709.3967. [Google Scholar]
- Huang, C.; Davis, L.S.; Townshend, J.R.G. An assessment of support vector machines for land cover classification. Int. J. Remote Sens. 2002, 23, 725–749. [Google Scholar] [CrossRef]
- Manandhar, R.; Odeh, I.O.A.; Ancev, T. Improving the accuracy of land use and land cover classification of Landsat data using post-classification enhancement. Remote Sens. 2009, 1, 330–344. [Google Scholar] [CrossRef]
- Congalton, R.G.; Green, K. Assessing the Accuracy of Remotely Sensed Data: Principles and Practices, 2nd ed.; CRC/Taylor & Francis: Boca Raton, FL, USA, 2009; p. 200. [Google Scholar]
- Banko, G. A Review of Assessing the Accuracy of Classifications of Remotely Sensed Data and of Methods Including Remote Sensing Data in Forest Inventory; International Institute for Applied Systems Analysis: Laxenburg, Austria, 1998; p. 42. [Google Scholar]
- Foody, G.M. Status of land cover classification accuracy assessment. Remote Sens. Environ. 2002, 185–201. [Google Scholar] [CrossRef]
- Landis, J.R.; Koch, G.G. The measurement of observer agreement for categorical data. Biometrics 1977, 33, 159–174. [Google Scholar] [CrossRef]
- Pontius, R.G.; Shusas, E.; McEachern, M. Detecting important categorical land changes while accounting for persistence. Agr. Ecosyst. Environ. 2004, 101, 251–268. [Google Scholar] [CrossRef]
- Alo, C.A.; Pontius, R.G. Identifying systematic land-cover transitions using remote sensing and GIS: The fate of forests inside and outside protected areas of southwestern Ghana. Environ. Plan. B 2008, 35, 280–295. [Google Scholar] [CrossRef]
- Zhou, P.; Huang, J.; Pontius, R.G., Jr.; Hong, H. Land classification and change intensity analysis in a coastal watershed of Southeast China. Sensors 2014, 14, 11640–11658. [Google Scholar] [CrossRef] [PubMed]
- Diwediga, B.; Agodzo, S.; Wala, K.; Le, Q.B. Assessment of multifunctional landscapes dynamics in the mountainous basin of the Mo River (Togo, West Africa). J. Geogr. Sci. 2017, 27, 579–605. [Google Scholar] [CrossRef]
- Koglo, Y.S.; Gaiser, T.; Agyare, W.A.; Sogbedji, J.M.; Kouami, K. Implications of some major human-induced activities on forest cover using extended change matrix quantity and intensity analysis based on historical Landsat data from the Kloto District, Togo. Ecol. Indic. 2019, 96, 628–634. [Google Scholar] [CrossRef]
- Pontius, R.G.; Gao, Y.; Giner, N.M.; Kohyama, T.; Osaki, M.; Hirose, K. Design and Interpretation of Intensity Analysis Illustrated by Land Change in Central Kalimantan, Indonesia. Land 2013, 2, 351–369. [Google Scholar] [CrossRef]
- Gao, Y.; Pontius, R.G.; Giner, N.M.; Kohyama, T.S.; Osaki, M.; Hirose, K. Land Change Analysis from 2000 to 2004 in Peatland of Central Kalimantan, Indonesia Using GIS and an Extended Transition Matrix. In Tropical Peatland Ecosystems; Osaki, M., Tsuji, N., Eds.; Springer: Tokyo, Japan, 2016; pp. 433–443. [Google Scholar] [CrossRef]
- Aldwaik, S.Z.; Pontius, R.G. Intensity analysis to unify measurements of size and stationarity of land changes by interval, category, and transition. Landsc. Urban Plan. 2012, 106, 103–114. [Google Scholar] [CrossRef]
- R Core Team. R: A Language and Environment for Statistical Computing; R Foundation for Statistical Computing: Vienna, Austria, 2016; Available online: https://www.R-project.org/. (accessed on 25 May 2019).
- Streiner, D.L.; Norman, G.R. Health Measurement Scales: A Practical Guide to Their Development and Use, 3rd ed.; Oxford University Press: New York, NY, USA, 2003; p. 296. [Google Scholar]
- Institut National de la Statistique et de la Démographie (INSD). Projections Démographiques des Communes du Burkina Faso de 2007 à 2020; Institut National de la Statistique et de la Démographie (INSD): Ouagadougou, Burkina Faso, 2017; pp. 1488–1492, 1498–1502. Available online: http://www.insd.bf/n/contenu/autres_publications/Projection_com_Burkina_2007_2020.pdf (accessed on 19 March 2019).
- Sanfo, S. Politiques Publiques Agricoles et Lutte Contre la Pauvreté au Burkina Faso: Le cas de la Région du Plateau Central. Ph.D. Thesis, Université Paris 1 Panthéon-Sorbonne, Paris, France, 2010. [Google Scholar]
- INSD. Analyse des Résultats de L’enquête Burkinabé sur les Conditions de vie Des Ménages—Rapport Final; Institut National de la Statistique et de la Démographie: Ouagadougou, Burkina Faso, 2003; p. 270. [Google Scholar]
- Padonou, M.N.; Sarr, P. Contribution de la Télédétection et du Système d’Information Géographique à l’amélioration de la gestion des eaux de surface dans un bassin versant: Cas du barrage de Mogtedo au Burkina Faso. In Proceedings of the Journées d’Animation Scientique (JAS’09) de l’AUF, Alger, Algérie, 8–11 Novembre 2009; p. 7. [Google Scholar]
- Tao, A. Mogtedo: Le barrage se meurt, la ville aussi. FENOP Info 2016, 24, 2–3. [Google Scholar]
- Parzen, E. Stochastic Processes; Holden-Day: San Francisco, CA, USA, 1964; p. 324. [Google Scholar]
- Bell, E.J.; Hinojosa, R.C. Markov analysis of land use change: Continuous time and stationary processes. Soc. Econ. Plan. Sci. 1977, 11, 13–17. [Google Scholar] [CrossRef]
- Petit, C.; Scudder, T.; Lambin, E. Quantifying processes of land-cover change by remote sensing: Resettlement and rapid land-cover changes in south-eastern Zambia. Int. J. Remote Sens. 2001, 22, 3435–3456. [Google Scholar] [CrossRef]
- Traoré, F.; Paré, K.; Walbeogo, R.; Wellens, J.; Tychon, B. Estimation de L’évolution des Superficies Agricoles Irriguées du Bassin de la Haute-Comoé—Application D’une Méthode de Détection de Changements Amont et Aval; Rapport PADI (Programme d’Appui au Développement de l’Irrigation); PADI: Ouagadougou, Burkina Faso, 2016. [Google Scholar]


| Images | Acquisition Date | Path | Row | Spatial Resolution (m) | Bands Used |
|---|---|---|---|---|---|
| Landsat-5 TM | 15 February 1987 | 194 | 52 | 30 | 1, 2, 3, 4, 5, 7 |
| Landsat-7 ETM+ | 11 February 2000 | 194 | 52 | 30 | 1, 2, 3, 4, 5, 7 |
| Landsat-8 OLI | 27 January 2015 | 194 | 52 | 30 | 2, 3, 4, 5, 6, 7 |
| Images | Overall Accuracy (%) | Kappa Coefficient | Agreement * |
|---|---|---|---|
| Landsat-5 TM | 88.48 | 0.84 | Excellent |
| Landsat-7 ETM+ | 90.98 | 0.87 | Excellent |
| Landsat-8 OLI | 95.26 | 0.94 | Excellent |
| Bare Soil | Hydromorphic Soil | Irrigated Areas | Rainfed Areas | Water Bodies | User Accuracy | |
|---|---|---|---|---|---|---|
| Landsat 5 TM | ||||||
| Bare soil | 90.73 | 16.33 | 0.52 | 13.11 | 0 | 88.88 |
| Hydromorphic soil | 3.71 | 73.87 | 1.57 | 3.66 | 0 | 78.61 |
| Irrigated areas | 0.07 | 2.01 | 97.38 | 0 | 0 | 97.64 |
| Rainfed areas | 5.49 | 7.54 | 0.52 | 83.23 | 0 | 83.74 |
| Water bodies | 0 | 0.25 | 0 | 0 | 100 | 99.6 |
| Landsat 7 ETM+ | ||||||
| Bare soil | 91.25 | 9.64 | 0.53 | 13.26 | 0 | 90.64 |
| Hydromorphic soil | 2.3 | 84.64 | 2.11 | 0.61 | 0 | 87.37 |
| Irrigated areas | 0 | 1.82 | 96.49 | 0.15 | 0 | 98.57 |
| Rainfed areas | 6.45 | 3.39 | 0.88 | 85.98 | 0 | 84.3 |
| Water bodies | 0 | 0.52 | 0 | 0 | 100 | 99.19 |
| Landsat-8 OLI | ||||||
| Bare soil | 95.4 | 2.6 | 0 | 3.2 | 0 | 97.65 |
| Hydromorphic soil | 1.34 | 90.36 | 2.81 | 2.13 | 0 | 87.85 |
| Irrigated areas | 0.07 | 3.65 | 97.19 | 0.3 | 0 | 97.02 |
| Rainfed areas | 3.19 | 3.39 | 0 | 94.36 | 0 | 91.7 |
| Water bodies | 0 | 0 | 0 | 0 | 100 | 100 |
| N° | Initial Trajectory | Corrected Trajectory | N° | Initial Trajectory | Corrected Trajectory | No. | Initial Trajectory | Corrected Trajectory | No. | Initial Trajectory | Corrected Trajectory |
|---|---|---|---|---|---|---|---|---|---|---|---|
| 1 | 1->1->1 | 1->1->1 | 41 | 2->4->1 | 1->1->1 | 81 | 4->2->1 | 1->1->1 | 121 | 5->5->1 | 5->5->2 |
| 2 | 1->1->2 | 1->1->1 | 42 | 2->4->2 | 2->2->2 | 82 | 4->2->2 | 2->2->2 | 122 | 5->5->2 | 5->5->2 |
| 3 | 1->1->3 | 1->1->3 | 43 | 2->4->3 | 4->4->4 | 83 | 4->2->3 | 4->4->4 | 123 | 5->5->3 | 5->5->2 |
| 4 | 1->1->4 | 1->1->4 | 44 | 2->4->4 | 4->4->4 | 84 | 4->2->4 | 4->4->4 | 124 | 5->5->4 | 5->5->2 |
| 5 | 1->1->5 | 1->1->1 | 45 | 2->4->5 | 5->5->5 | 85 | 4->2->5 | 5->5->5 | 125 | 5->5->5 | 5->5->5 |
| 6 | 1->2->1 | 1->1->1 | 46 | 2->5->1 | 1->1->1 | 86 | 4->3->1 | 1->1->1 | |||
| 7 | 1->2->2 | 2->2->2 | 47 | 2->5->2 | 2->2->2 | 87 | 4->3->2 | 2->2->2 | |||
| 8 | 1->2->3 | 1->1->3 | 48 | 2->5->3 | 2->2->3 | 88 | 4->3->3 | 4->3->3 | |||
| 9 | 1->2->4 | 1->1->4 | 49 | 2->5->4 | 2->2->2 | 89 | 4->3->4 | 4->4->4 | |||
| 10 | 1->2->5 | 2->2->2 | 50 | 2->5->5 | 5->5->5 | 90 | 4->3->5 | 5->5->5 | |||
| 11 | 1->3->1 | 1->1->1 | 51 | 3->1->1 | 1->1->1 | 91 | 4->4->1 | 4->4->4 | |||
| 12 | 1->3->2 | 2->2->2 | 52 | 3->1->2 | 2->2->2 | 92 | 4->4->2 | 4->4->4 | |||
| 13 | 1->3->3 | 1->3->3 | 53 | 3->1->3 | 3->3->3 | 93 | 4->4->3 | 4->4->3 | |||
| 14 | 1->3->4 | 1->1->4 | 54 | 3->1->4 | 1->1->4 | 94 | 4->4->4 | 4->4->4 | |||
| 15 | 1->3->5 | 5->5->5 | 55 | 3->1->5 | 5->5->5 | 95 | 4->4->5 | 5->5->5 | |||
| 16 | 1->4->1 | 1->1->1 | 56 | 3->2->1 | 1->1->1 | 96 | 4->5->1 | 1->1->1 | |||
| 17 | 1->4->2 | 1->4->4 | 57 | 3->2->2 | 2->2->2 | 97 | 4->5->2 | 2->2->2 | |||
| 18 | 1->4->3 | 1->4->4 | 58 | 3->2->3 | 3->3->3 | 98 | 4->5->3 | 4->4->4 | |||
| 19 | 1->4->4 | 1->1->4 | 59 | 3->2->4 | 4->4->4 | 99 | 4->5->4 | 4->4->4 | |||
| 20 | 1->4->5 | 5->5->5 | 60 | 3->2->4 | 5->5->5 | 100 | 4->5->5 | 5->5->5 | |||
| 21 | 1->5->1 | 1->1->1 | 61 | 3->3->1 | 3->3->3 | 101 | 5->1->1 | 1->1->1 | |||
| 22 | 1->5->2 | 2->2->2 | 62 | 3->3->2 | 3->3->3 | 102 | 5->1->2 | 5->2->2 | |||
| 23 | 1->5->3 | 2->2->2 | 63 | 3->3->3 | 3->3->3 | 103 | 5->1->3 | 5->2->3 | |||
| 24 | 1->5->4 | 1->4->4 | 64 | 3->3->4 | 3->3->3 | 104 | 5->1->4 | 1->1->4 | |||
| 25 | 1->5->5 | 5->5->5 | 65 | 3->3->5 | 5->5->5 | 105 | 5->1->5 | 5->5->5 | |||
| 26 | 2->1->1 | 1->1->1 | 66 | 3->4->1 | 1->1->1 | 106 | 5->2->1 | 5->2->2 | |||
| 27 | 2->1->2 | 2->2->2 | 67 | 3->4->2 | 2->2->2 | 107 | 5->2->2 | 5->2->2 | |||
| 28 | 2->1->3 | 1->1->3 | 68 | 3->4->3 | 3->3->3 | 108 | 5->2->3 | 5->2->3 | |||
| 29 | 2->1->4 | 1->1->4 | 69 | 3->4->4 | 4->4->4 | 109 | 5->2->4 | 5->2->2 | |||
| 30 | 2->1->5 | 5->5->5 | 70 | 3->4->5 | 5->5->5 | 110 | 5->2->5 | 5->5->5 | |||
| 31 | 2->2->1 | 2->2->2 | 71 | 3->5->1 | 1->1->1 | 111 | 5->3->1 | 1->1->1 | |||
| 32 | 2->2->2 | 2->2->2 | 72 | 3->5->2 | 2->2->2 | 112 | 5->3->2 | 5->2->2 | |||
| 33 | 2->2->3 | 2->2->2 | 73 | 3->5->3 | 3->3->3 | 113 | 5->3->3 | 5->3->3 | |||
| 34 | 2->2->4 | 2->2->2 | 74 | 3->5->4 | 4->4->4 | 114 | 5->3->4 | 4->4->4 | |||
| 35 | 2->2->5 | 5->5->5 | 75 | 3->5->5 | 5->5->5 | 115 | 5->3->5 | 5->5->5 | |||
| 36 | 2->3->1 | 1->1->1 | 76 | 4->1->1 | 1->1->1 | 116 | 5->4->1 | 1->1->1 | |||
| 37 | 2->3->2 | 2->2->2 | 77 | 4->1->2 | 2->2->2 | 117 | 5->4->2 | 5->2->2 | |||
| 38 | 2->3->3 | 3->3->3 | 78 | 4->1->3 | 1->1->3 | 118 | 5->4->3 | 5->3->3 | |||
| 39 | 2->3->4 | 4->4->4 | 79 | 4->1->4 | 4->4->4 | 119 | 5->4->4 | 4->4->4 | |||
| 40 | 2->3->5 | 5->5->5 | 80 | 4->1->5 | 5->5->5 | 120 | 5->4->5 | 5->5->5 |
| Images | Overall Accuracy (%) | Kappa Coefficient | Agreement* |
|---|---|---|---|
| Landsat-5 TM | 94.22 | 0.92 | Excellent |
| Landsat-7 ETM+ | 95.38 | 0.94 | Excellent |
| Landsat-8 OLI | 95.60 | 0.94 | Excellent |
| Bare Soil | Hydromorphic Soil | Irrigated Areas | Rainfed Areas | Water Bodies | User Accuracy | |
|---|---|---|---|---|---|---|
| Landsat 5 TM | ||||||
| Bare soil | 96.96 | 5.78 | 0.52 | 14.02 | 0 | 91.78 |
| Hydromorphic soil | 0.89 | 91.21 | 0 | 0.46 | 0 | 96.03 |
| Irrigated areas | 0 | 1.26 | 98.95 | 0 | 0 | 98.69 |
| Rainfed areas | 2.15 | 1.51 | 0.52 | 85.52 | 0 | 93.81 |
| Water bodies | 0 | 0.25 | 0 | 0 | 100 | 99.6 |
| Landsat 7 ETM+ | ||||||
| Bare soil | 96.51 | 4.43 | 1.4 | 4.73 | 0 | 95.87 |
| Hydromorphic soil | 0.89 | 91.15 | 3.33 | 0.46 | 0 | 91.15 |
| Irrigated areas | 0 | 1.3 | 94.21 | 0 | 0 | 99.08 |
| Rainfed areas | 2.6 | 2.6 | 1.05 | 94.82 | 0 | 92.42 |
| Water bodies | 0 | 0.52 | 0 | 0 | 100 | 99.19 |
| Landsat-8 OLI | ||||||
| Bare soil | 94.44 | 3.65 | 0 | 1.07 | 0 | 98.38 |
| Hydromorphic soil | 0.89 | 91.67 | 3.33 | 0.46 | 0 | 91.19 |
| Irrigated areas | 0 | 1.56 | 95.96 | 0.15 | 0 | 98.74 |
| Rainfed areas | 4.67 | 3.13 | 0.7 | 98.32 | 0 | 89.09 |
| Water bodies | 0 | 0 | 0 | 0 | 100 | 100 |
| Year | Classifier | Overall Accuracy (%) | Kappa Coefficient |
|---|---|---|---|
| 1987 | MLC | 86.76 | 0.82 |
| SVM | 88.48 | 0.84 | |
| 2000 | MLC | 89.64 | 0.86 |
| SVM | 90.98 | 0.88 |
© 2019 by the authors. Licensee MDPI, Basel, Switzerland. This article is an open access article distributed under the terms and conditions of the Creative Commons Attribution (CC BY) license (http://creativecommons.org/licenses/by/4.0/).
Share and Cite
Traoré, F.; Bonkoungou, J.; Compaoré, J.; Kouadio, L.; Wellens, J.; Hallot, E.; Tychon, B. Using Multi-Temporal Landsat Images and Support Vector Machine to Assess the Changes in Agricultural Irrigated Areas in the Mogtedo Region, Burkina Faso. Remote Sens. 2019, 11, 1442. https://doi.org/10.3390/rs11121442
Traoré F, Bonkoungou J, Compaoré J, Kouadio L, Wellens J, Hallot E, Tychon B. Using Multi-Temporal Landsat Images and Support Vector Machine to Assess the Changes in Agricultural Irrigated Areas in the Mogtedo Region, Burkina Faso. Remote Sensing. 2019; 11(12):1442. https://doi.org/10.3390/rs11121442
Chicago/Turabian StyleTraoré, Farid, Joachim Bonkoungou, Jérôme Compaoré, Louis Kouadio, Joost Wellens, Eric Hallot, and Bernard Tychon. 2019. "Using Multi-Temporal Landsat Images and Support Vector Machine to Assess the Changes in Agricultural Irrigated Areas in the Mogtedo Region, Burkina Faso" Remote Sensing 11, no. 12: 1442. https://doi.org/10.3390/rs11121442