1. Introduction
Slope movement is one of the most common geological and geomorphic natural hazards in China [
1]. Rockfall is an essential type of slope movement phenomenon that frequently occurs on steep rock cliffs and represents a relevant hazard in mountainous areas, significantly influencing the safety of residents and infrastructure. Defining, zoning, and locating the most probable future rockfall source areas are of primary importance for rock slope hazard investigation, assessment and management. According to the spatial scale of geomorphological observations and investigations, rockfall analysis mainly covers three different scales: the regional scale (areas of square kilometers), block specific scale (areas of square meters), and cliff scale (hundreds to thousands of square meters) [
2], and of which this paper focused on the cliff scale rockfall. In practice, the field investigations of cliffs are usually carried out in stages. The primary survey stage should start with rockfall source detection to define the points of initiation for future rockfalls [
2]. Compared with traditional approaches that might consider all steep slopes as equivalent source areas; the problem with on-site detecting, zoning, and locating of the most likely rockfall source areas and unstable rock masses on the slope badly needs to be addressed [
3]. On-site rockfall source detection can ensure a more effective and reliable hazard assessment, guide further detailed fieldwork and subsequent slope treatment, and help establish a smart rock slope environment. Therefore, this research problem is particularly worthy of academic attention.
Rockfall mechanisms at the cliff scale are strongly linked to the slope morphology and rock discontinuities [
2], which are primarily the joints involved in our study areas. The use of remote sensing techniques over recent decades has dramatically increased the 3D data acquisition quality of both the slope and discontinuity geometry for rockfall analysis [
4]. Based on the remote sensed high-resolution 3D point clouds and mesh models, more reliable landslide mappings, either in 2D or 3D, in scalar or vectors forms, can be generated [
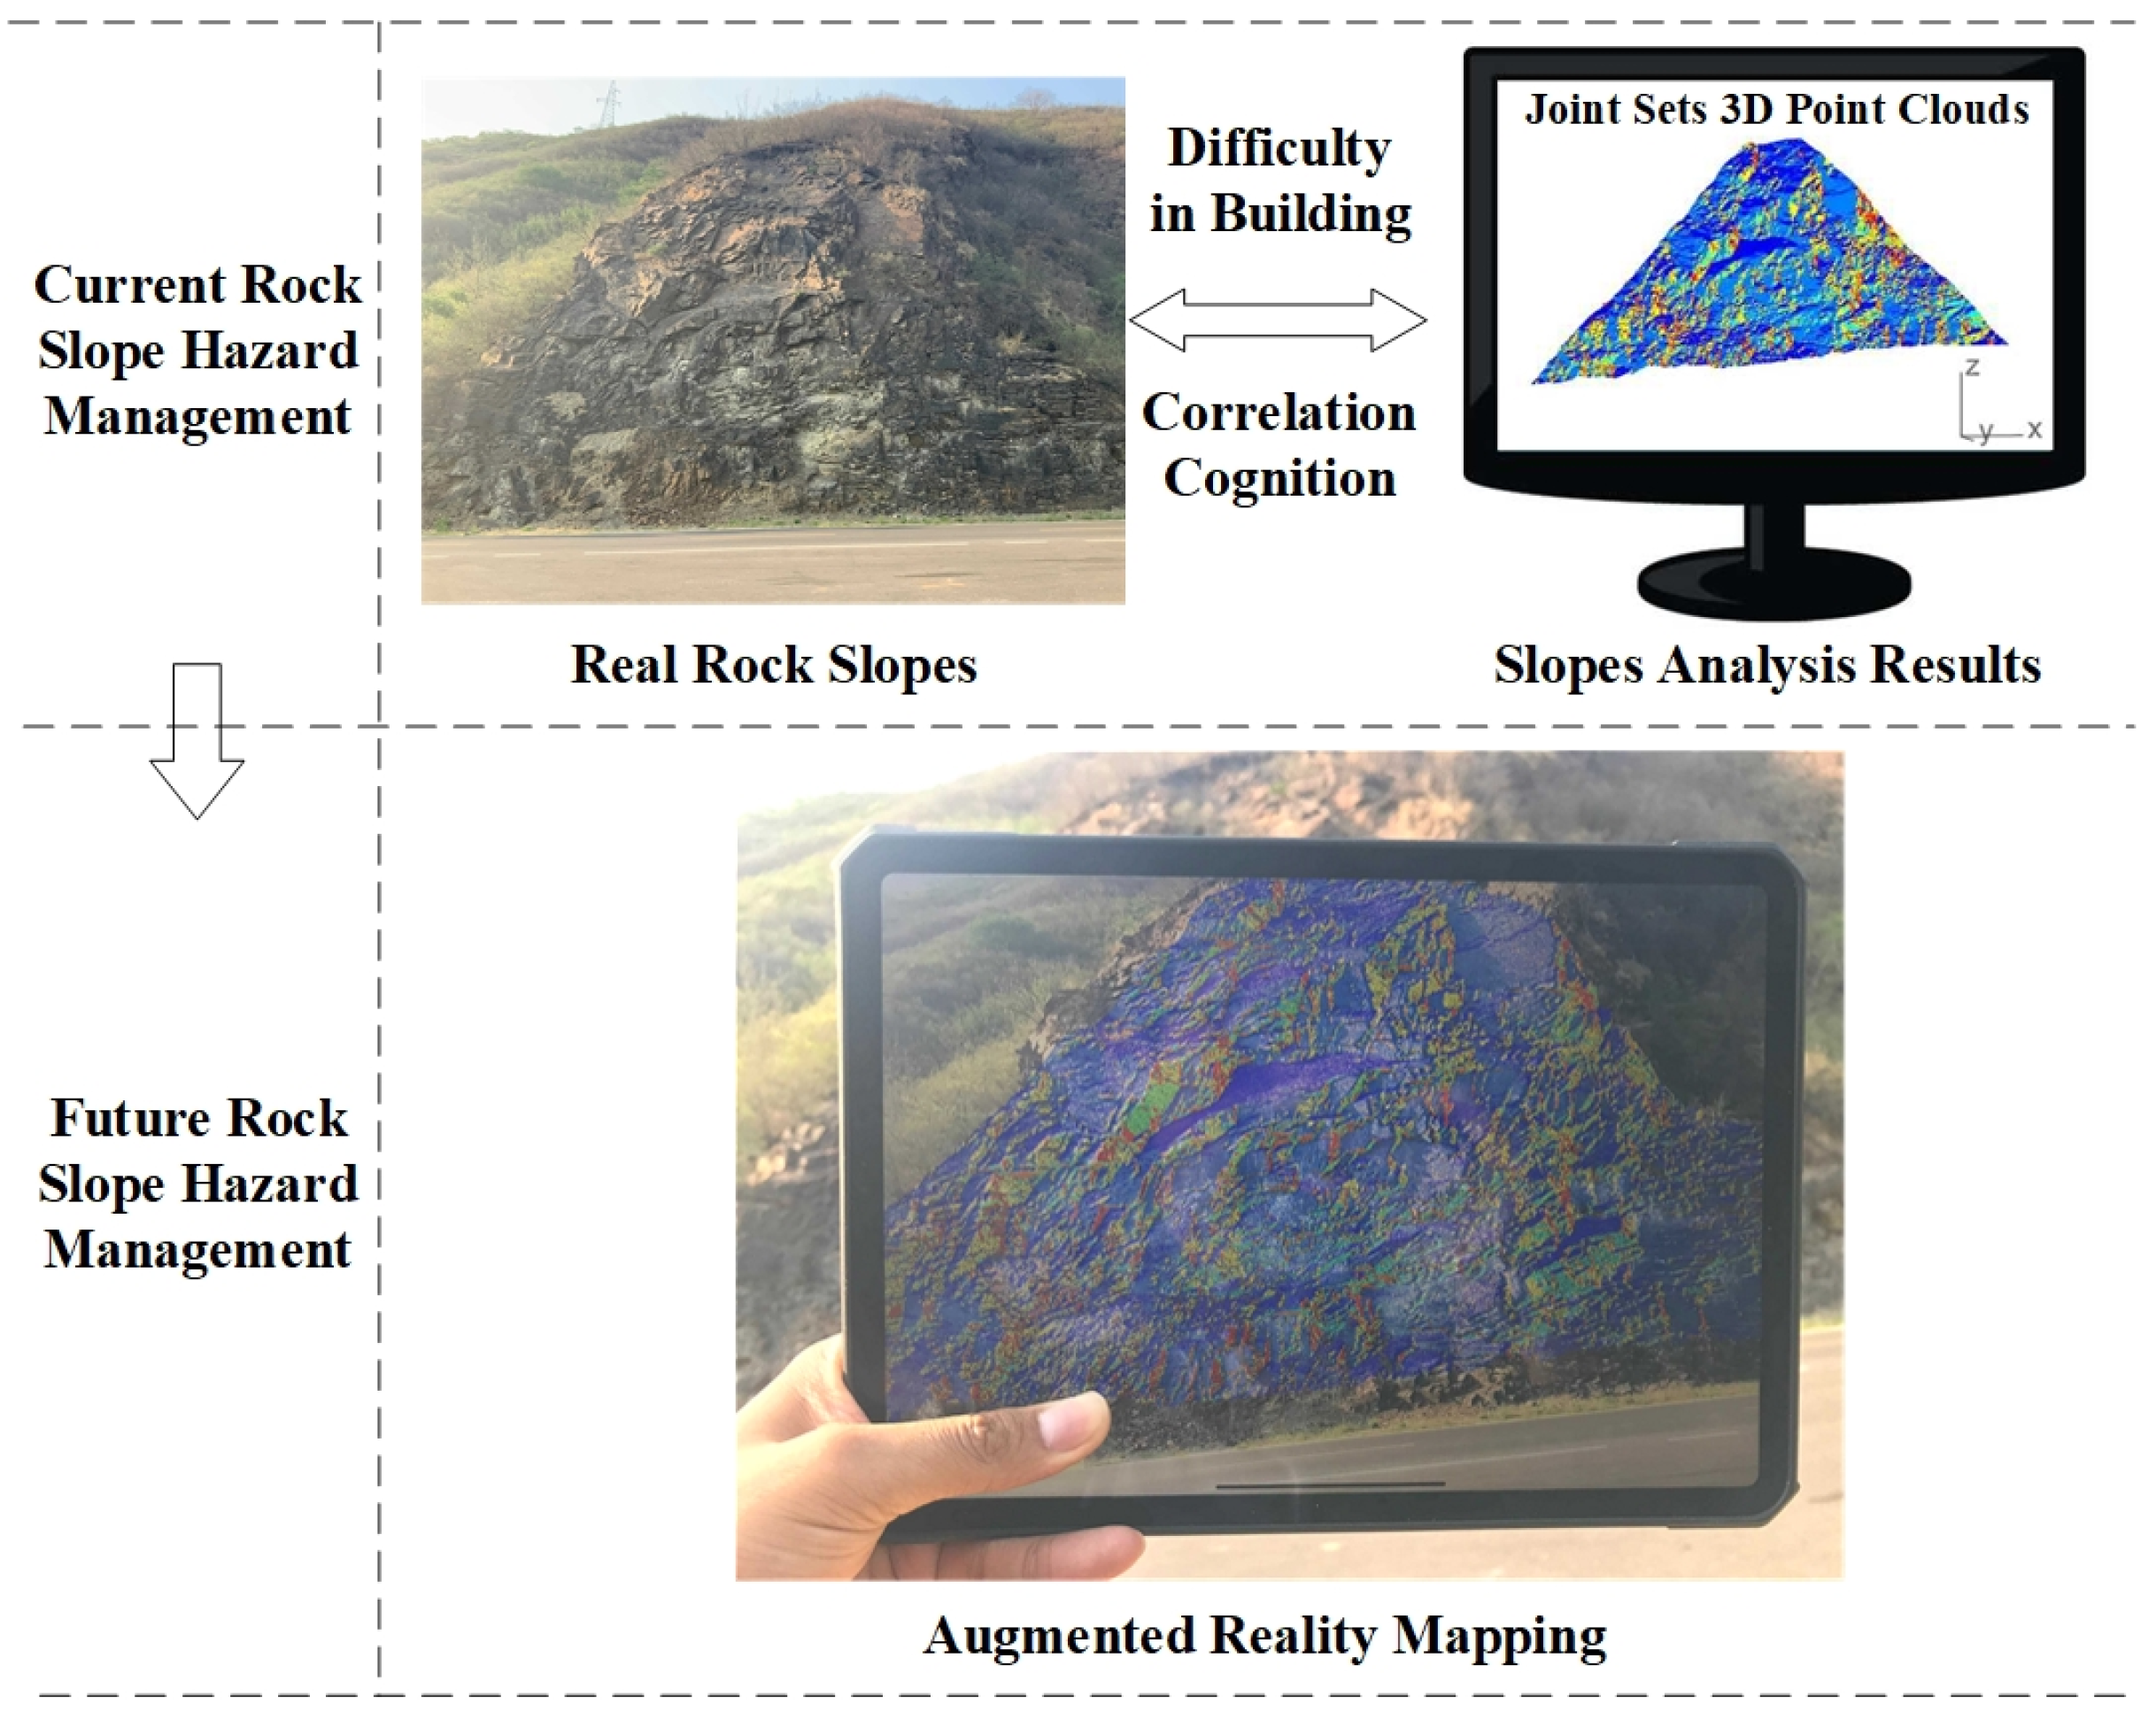
5]. With the goal of on-site locating potential rockfalls, the analysis results need to be further visualized in the fieldwork. The strategies for data visualization could be divided into two categories: displaying the data within the 2D screen of laptops and desktops, and the recently developed augmented reality (AR) visualization, which can put the 2D images and 3D models into the real world using the camera of mobile devices; including smartphones and tablets. However, due to the innate irregularity of rocky slope surface morphology, it is a nonintuitive and puzzling task to establish the corresponding correlation between the real slopes and the hazard maps displayed as virtual content within a 2D screen, as schematically illustrated in
Figure 1 where the virtual information is 3D scalar point clouds that could convey the information of join sets and rockfall susceptibility with the colors of the points. Different from the conventional 2D visualization provided with the 2D screens, the AR methods can present a 3D holographic visualization, which can effectively feedback rockfall analysis results to the fieldwork and avoid subjective cognitive bias. This paper presents some pioneering research in introducing mobile augmented reality technology to the realm of rockfall hazard management and developed a methodology to visualize the slope information beyond the screen to the real slope environment and directly superimpose slope information onto the real slopes, as shown in
Figure 1.
In order to understand which areas of a steep cliff are more likely to be affected by a future rockfall, the spatial distribution of rockfall probability is mainly quantified by the index ”susceptibility”, as previously reported [
2,
3]. Detailed 3D outcrop models are the fundamental data basis that significantly controls the resolution, accuracy, and reliability of the susceptibility analysis. Far beyond the conventional survey methods of fracture windows sketching and the assumption that simplifies the whole slope with a uniform dip and dip direction, close-range remote sensing technologies, including Light Detection and Ranging (LiDAR) and photogrammetry [
5,
6,
7], are revolutionary in acquiring 3D virtual outcrops of rock slopes with high resolution and high accuracy for susceptibility analysis. Specifically, for steep slopes at the cliff scale, the overhanging areas are at high risk to rockfalls but are poorly resolved with the nadir imaging view of airborne remote sensing techniques, where the Terrestrial Laser Scanning (TLS), ground-based photogrammetry, and the recently developed unmanned aerial vehicle (UAV) photogrammetry are especially applicable [
2,
7].
In the last two decades, LiDAR has been widely applied to the generation of digital elevation models (DEMs) and rock discontinuity characterization for slope stability analysis [
8,
9]. The authors in [
5] developed an algorithm for automated geometric analysis and classification of landslides based on LiDAR-derived DEMs. The exact parameters of outcropped structural planes, including positions, orientations, persistence, and spacing can be measured from laser-scanned 3D point clouds or 3D meshes of the cliff. Reference [
10] researched the method for rock surface extraction from 3D rock-mass point clouds based on major orientation estimation. The research in [
11] developed a semi-automatic method for rock mass joint recognition from 3D point clouds while the study in [
12] further explored the automatic extraction of discontinuity orientation. Reference [
13] performed geomechanical analysis on high-resolution 3D point clouds collected by TLS for slope stability condition assessment.
In recent years, more and more attention has been given to UAV photogrammetry, especially the SfM-MVS [
14], which can also generate high-resolution 3D point clouds and 3D meshes of the cliff, with the advantage of low cost, flexible oblique view sensing and photo-realistic vision information when compared with LiDAR [
15]. The authors in [
16] first introduced SfM photogrammetry to rock outcrop modeling and presented an initial appraisal of the SfM-derived DEM compared with laser scanned models, which revealed the revolutionary potential of the SfM technique for geoscience applications. The study by [
17] demonstrated that the photogrammetry method using low-cost image sensors and aerial platforms could create reliable and accurate rock surface models and [
18] overviewed the UAV SfM workflows and applications in geomorphometry reconstruction. Reference [
19] introduced the SfM generated models into 3D rockfall simulations. [
20] applied UAV SfM photogrammetry to recognize the predominant discontinuities of rock slopes and quantified the block size for rockfall simulation. During rock discontinuity characterization for rockfall analysis, discontinuity orientation is the most critical input parameter for quantifying the main joint sets that serve to destabilize rock masses [
2]. In fact, in case of discontinuity orientation measuring, since TLS and ground-based photogrammetry technologies suffer from the effects of occlusion when dealing with high slopes, UAV SfM virtual outcrops can yield better along-strike predictions, which is attributed to a broader coverage, the avoiding of hidden zones by UAV and the reliable reconstruction of a higher number of structural planes [
21].
As overviewed by [
22], modern UAV SfM technology can provide point clouds and textured models for structural geology with multidimensional information (x, y, z, point orientation, color, texture). However, to the best of our knowledge, current studies have mainly focused on the geometry information of the UAV SfM model, and have not made the most of the advantage in the captured photo-realistic model materials and textures of rock slopes. Our research explored the computer vision information derived from photo-realistic virtual outcrops, which show another dimension of the UAV SfM potentiality.
To detect potential rockfall source areas, current research has seen a surge of interest in combining kinematic analysis with 3D point clouds or 3D meshes from remote sensing to generate susceptibility maps according to the interaction between the discontinuities and the local cliff orientation. The authors in [
3] studied the impacts of fracturing patterns on the rockfall susceptibility and erosion rate of slopes based on Airborne Laser Scanning (ALS), while [
2] researched the cliff scale failure mechanisms of steep and overhanging rock slopes and developed some indexes to assess rockfall susceptibility using kinematic analysis based on TLS models. Intensive studies have focused on the calculation step of susceptibility maps; however, the realization of the straightforward on-site visualization of hazard maps to feedback the risk zones to fieldwork still remains a research gap. To address this problem, we first introduce advanced mobile augmented reality technology, and then used its advantages to directly superimpose the rockfall susceptibility maps onto corresponding real rock slopes.
Mobile augmented reality has only been applied to the geological and environmental context in the last few years. The authors in [
23] developed a new AR software for fieldwork, such as the interpretation of folded structures in a mobile augmented reality environment. Reference [
24] developed a novel AR system for abandoned mine hazard site investigation by visualizing mine drifts, boreholes and underground water in a mobile augmented reality environment. These applications are generally aimed at larger scenarios that allow for a higher degree of AR overlapping discrepancies as compared with the task of superimposing information onto fractured rock mass in this research, which has not been addressed in previous studies.
The concept of augmented reality is established based on the seamless alignment between virtual objects and the real world in an accurate and visually acceptable way, which belong to the scope of a motion tracking issue. The solution to this underlying problem is referred to as “camera pose estimation” with a simple definition: “given a set of correspondences between 3D features and their projections in the images plane, pose estimation consists in computing the position and orientation of the camera” [
25].
In mobile augmented reality realizations, there exist various strategies for camera pose estimation [
25] including sensor-based [
23,
24], marker-based [
26], SLAM-based [
27], and model-based methods [
28,
29], from which the most suitable approach should be selected for the scenario of rockfall AR mapping. The sensor-based method utilizes GPS, IMU, depth cameras, and other sensors embedded in mobile devices, and this type of approach cannot meet the accuracy demands for aligning 3D models with the intricate fractured rock mass surface. The marker-based method using fiducial markers as locating references [
26] and requires a heavy workload of marker arrangement, which is unpractical in fieldwork scenarios. Simultaneous localization and mapping (SLAM) including visual-inertial odometry (VIO) simultaneously locates the camera and maps the environment in a random local coordinate system [
27], which causes difficulties in transforming the camera location to another desired coordinate system, so this type of method alone cannot meet the requirements of rockfall AR mapping, but is suitable when combined with other approaches to extend and enhance the tracking performance. While the model-based method utilizes a predefined 3D template model of the real-world object to directly recognize and track the object itself, which allows more accurate alignment when compared with the sensor-based method [
29], avoids fiducial markers correlated with the marker-based method and simplifies the coordinate system conversion problem when compared with the SLAM-based method [
25]. Consequently, the model-based strategy is the most suitable for the AR mapping of rockfall susceptibility maps, which was adopted in this study.
The matching and alignment between predefined 3D models and real-world objects based on computer vision features is a critical problem to be addressed in model-based AR, and different types of features such as key point features, edge features, and color features, etc., need to be chosen in consideration of different types of target objects, which may be static rigid or articulated, textured or untextured, with or without sharp edges [
30], etc. Concerning the specific target of the fractured rock mass, the visual characteristics can be preliminarily described as follows: first, the fractured rock mass is a rigid object and is generally static during the inspection process; second, it usually has many intricately and heterogeneously distributed sharp edges at the intersections of structural planes with no semantic straight lines and no outer contours; and third, it can present various textures and colors, and may sometimes be texture-less, depending on the type of rock mass material. Therefore, the key point features and color features can sometimes be unreliable for this type of tracking target, while the sharp edges of structural planes can be a superb candidate feature for model-based AR tracking.
However, current edge-based camera pose estimation studies have been mainly aimed at tracking the manufactured artifacts for Industry 4.0, which can be distinguished by regular humanmade geometries with sharp edges according to precise 3D CAD models. The research by [
31] and [
32] studied the binocular approach and the contour-color feature fusion approach for tracking texture-less benchmark toy objects, respectively. The authors in [
33] researched the line-based AR initialization method for aircraft assembly and [
34] studied fast pose estimation for texture-less industrial products based on B-Rep models. Reference [
35] proposed the average shading gradients method for the AR registration of untextured geometries including statues and buildings, while [
36] researched model-constrained SLAM localization methodology to track both polyhedral and curved objects including toys, furniture, vehicles, and machines. Unfortunately, to the best of our knowledge, in current studies of edge-based tracking for augmented reality, the rock mass has seldom been considered as the tracking target.
In the problem of the edge-based tracking of a rock mass target, there are mainly two aspects of research questions: where to track and how to get the 3D model for matching (detailed in
Section 2.3). Regarding the first aspect, compared with the industrial applications aiming at well trackable geometries, the irregularly fractured morphology can appear heterogeneous in the spatial distribution of edge features, where the scales of extending, winding, and crisscrossing of the edges detected in camera images can vary tremendously in different parts of the rock mass [
37,
38]. Consequently, the slope region with the most favorable visual features for edge alignment needs to be delineated first. Regarding the second aspect, a priori 3D model corresponding to the rock mass to be used as a matching template does not exist. Furthermore, even the remote sensed and 3D reconstructed rock surface models would not directly work as a useful 3D template model, on account of the naturally formed irregular geometries of the rock mass [
39]. Therefore, the fundamental problem to be solved is how to obtain an applicable 3D template model of the rock mass. In this paper, we first studied the model-based tracking of the fractured rock mass by focusing on the edge features formed by the structural plane intersections, and developed a tracking region selection and 3D template modeling solution which extracts the visually prominent structural planes from UAV SfM models by the proposed method VGSI and Pro-SP.
This paper is organized as follows.
Section 1 overviews the previous studies on the rockfall analysis based on remote sensing and different augmented reality strategies sorted by the camera pose estimation technologies. Subsequently, the framework of the proposed methodology is elucidated in
Section 2, and
Section 2.1 to
Section 2.6 explain the six parts of this framework, respectively.
Section 2.1 presents the UAV-SfM remote sensing and modeling of a slope at risk to rockfall in the case study location;
Section 2.2 clarifies the rock discontinuity characterization process;
Section 2.3 elaborates the realization strategy of the proposed markerless mobile AR inspection methodology;
Section 2.4 articulates the proposed rock mass 3D template modeling method, which lays the foundation for recognizing and tracking rock mass in model-based AR;
Section 2.5 illustrates the kinematic schemes for stability analysis using the 3D point clouds; and
Section 2.6 explains the rock slope information AR superimposing and AR mapping. Then,
Section 3 presents the results, including the validation of the edge tracking performance using the proposed 3D templated modeling method, the realization of susceptibility AR mapping and on-site rockfall zoning and locating in augmented reality. Then, the results, potential, and limitations of the proposed methodology are discussed in
Section 4. Finally,
Section 5 concludes and presents future research prospects.
2. Materials and Methods
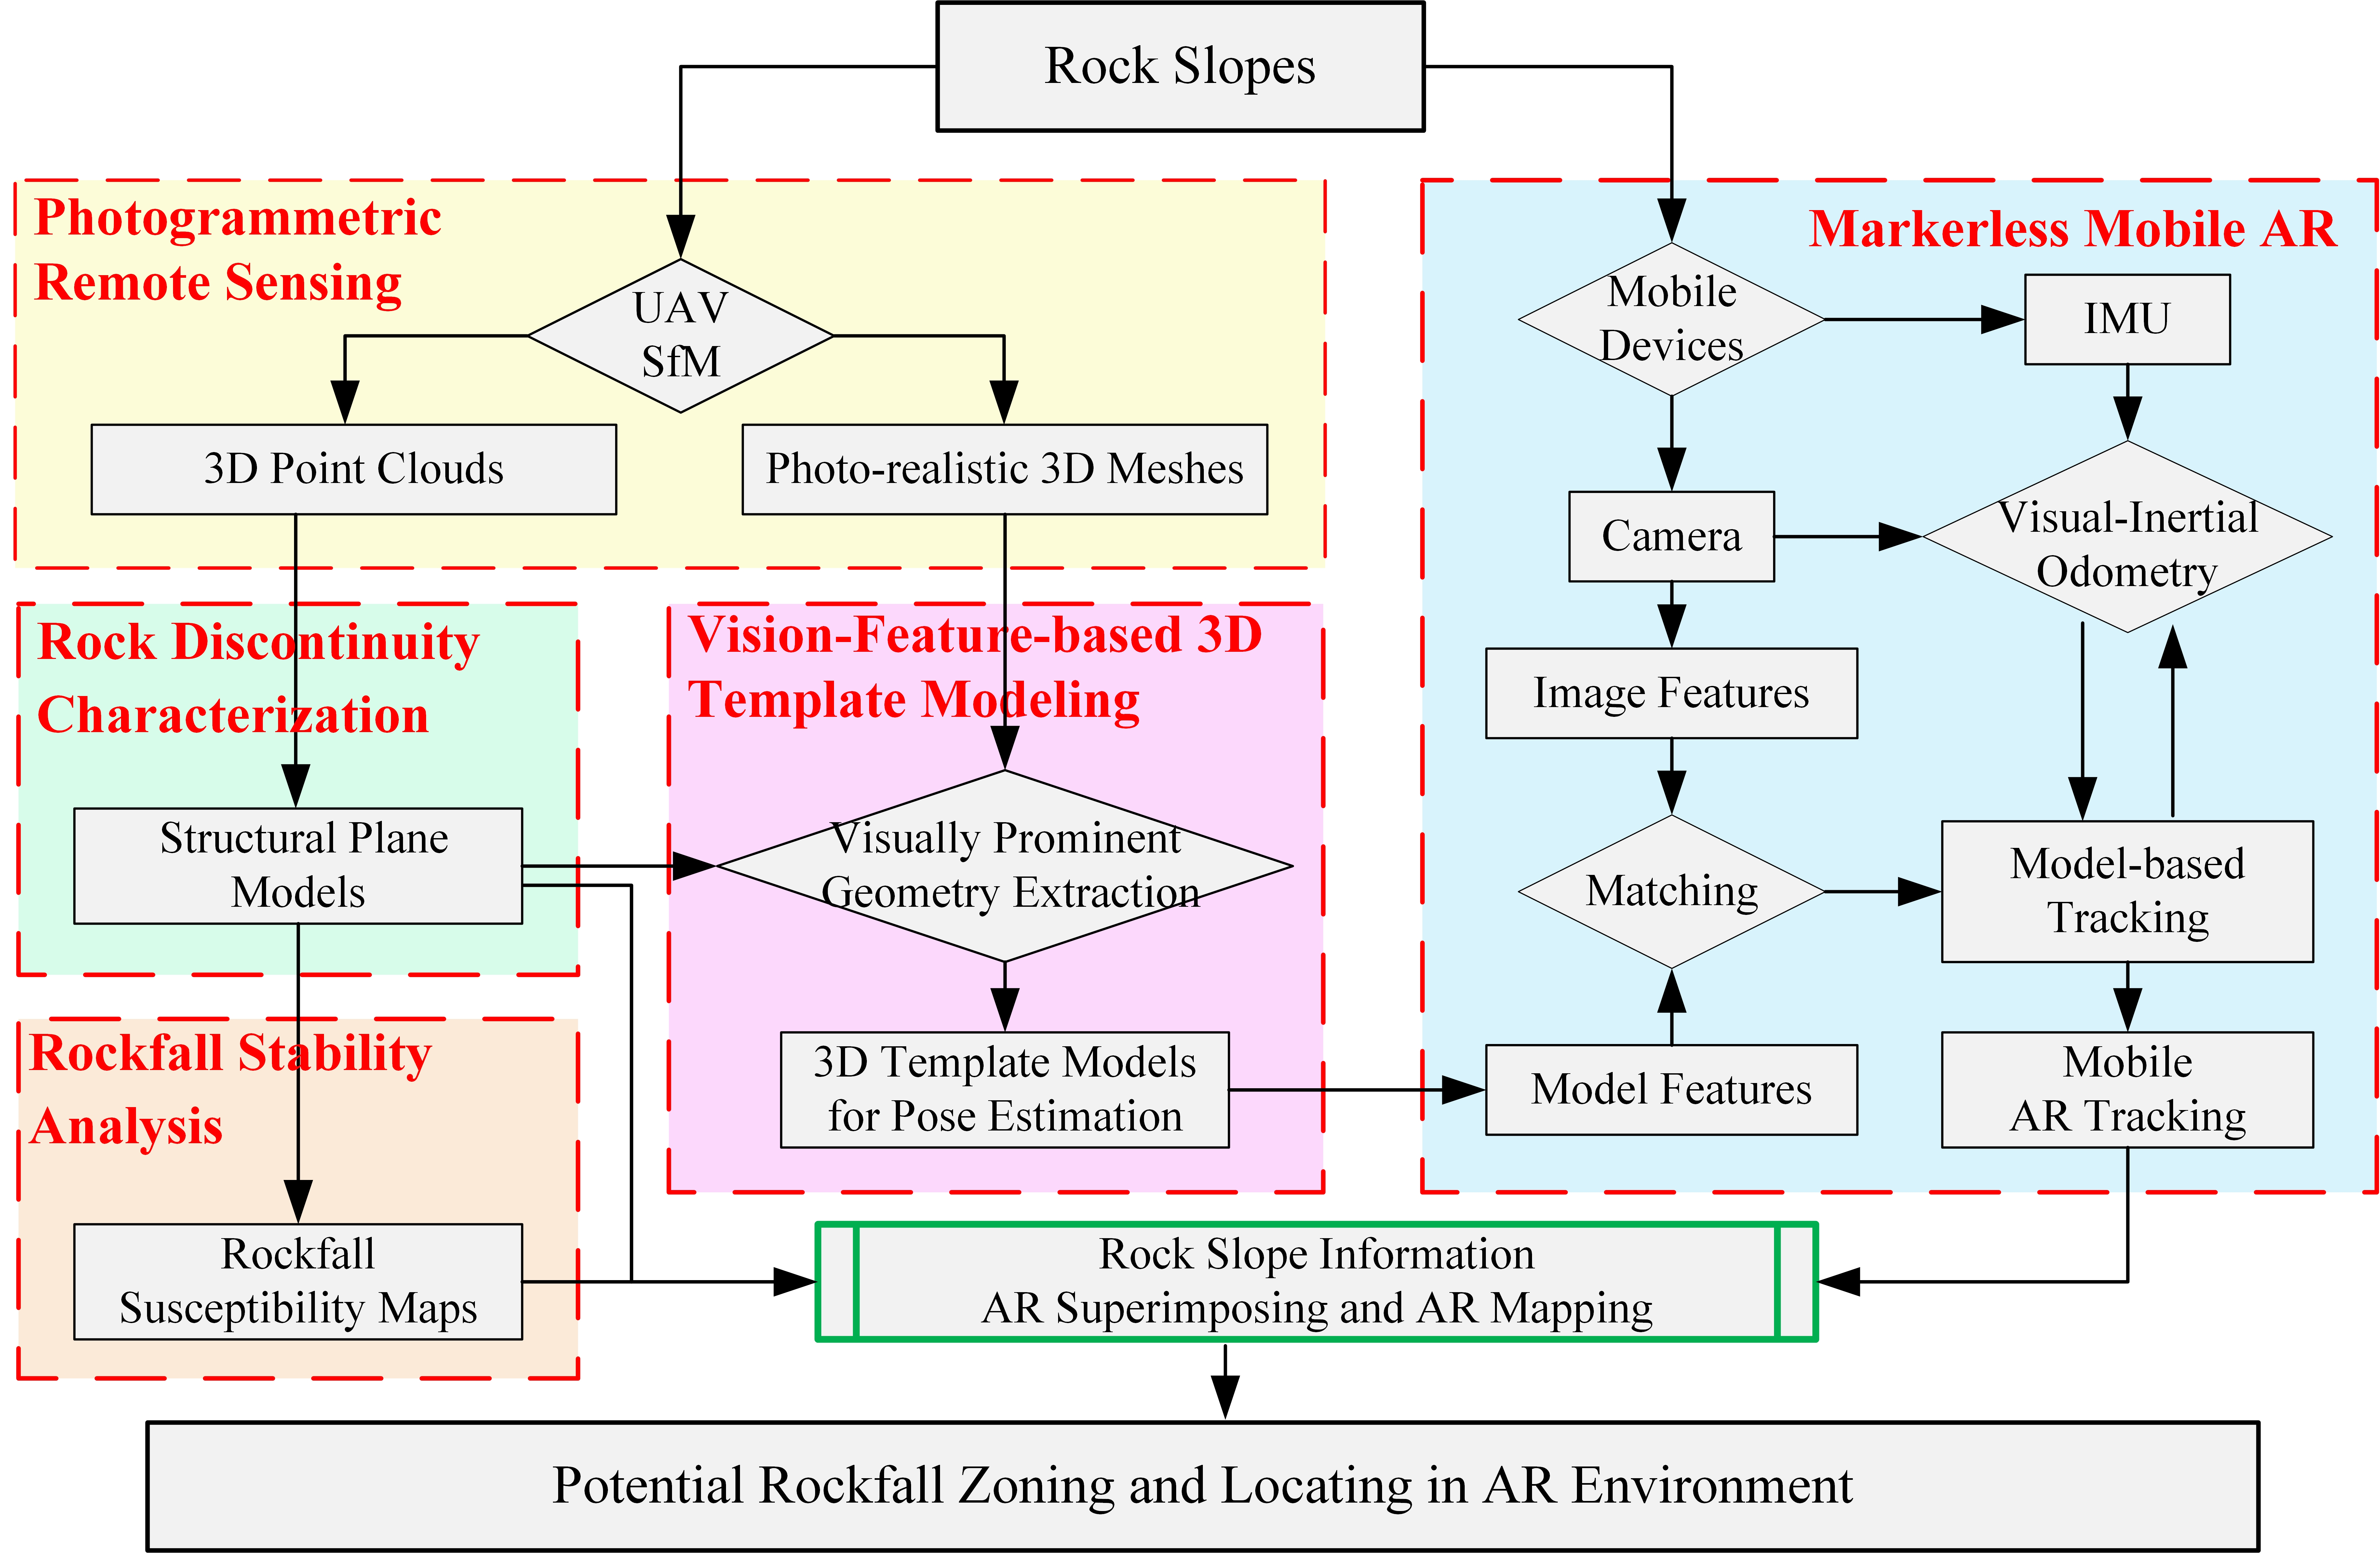
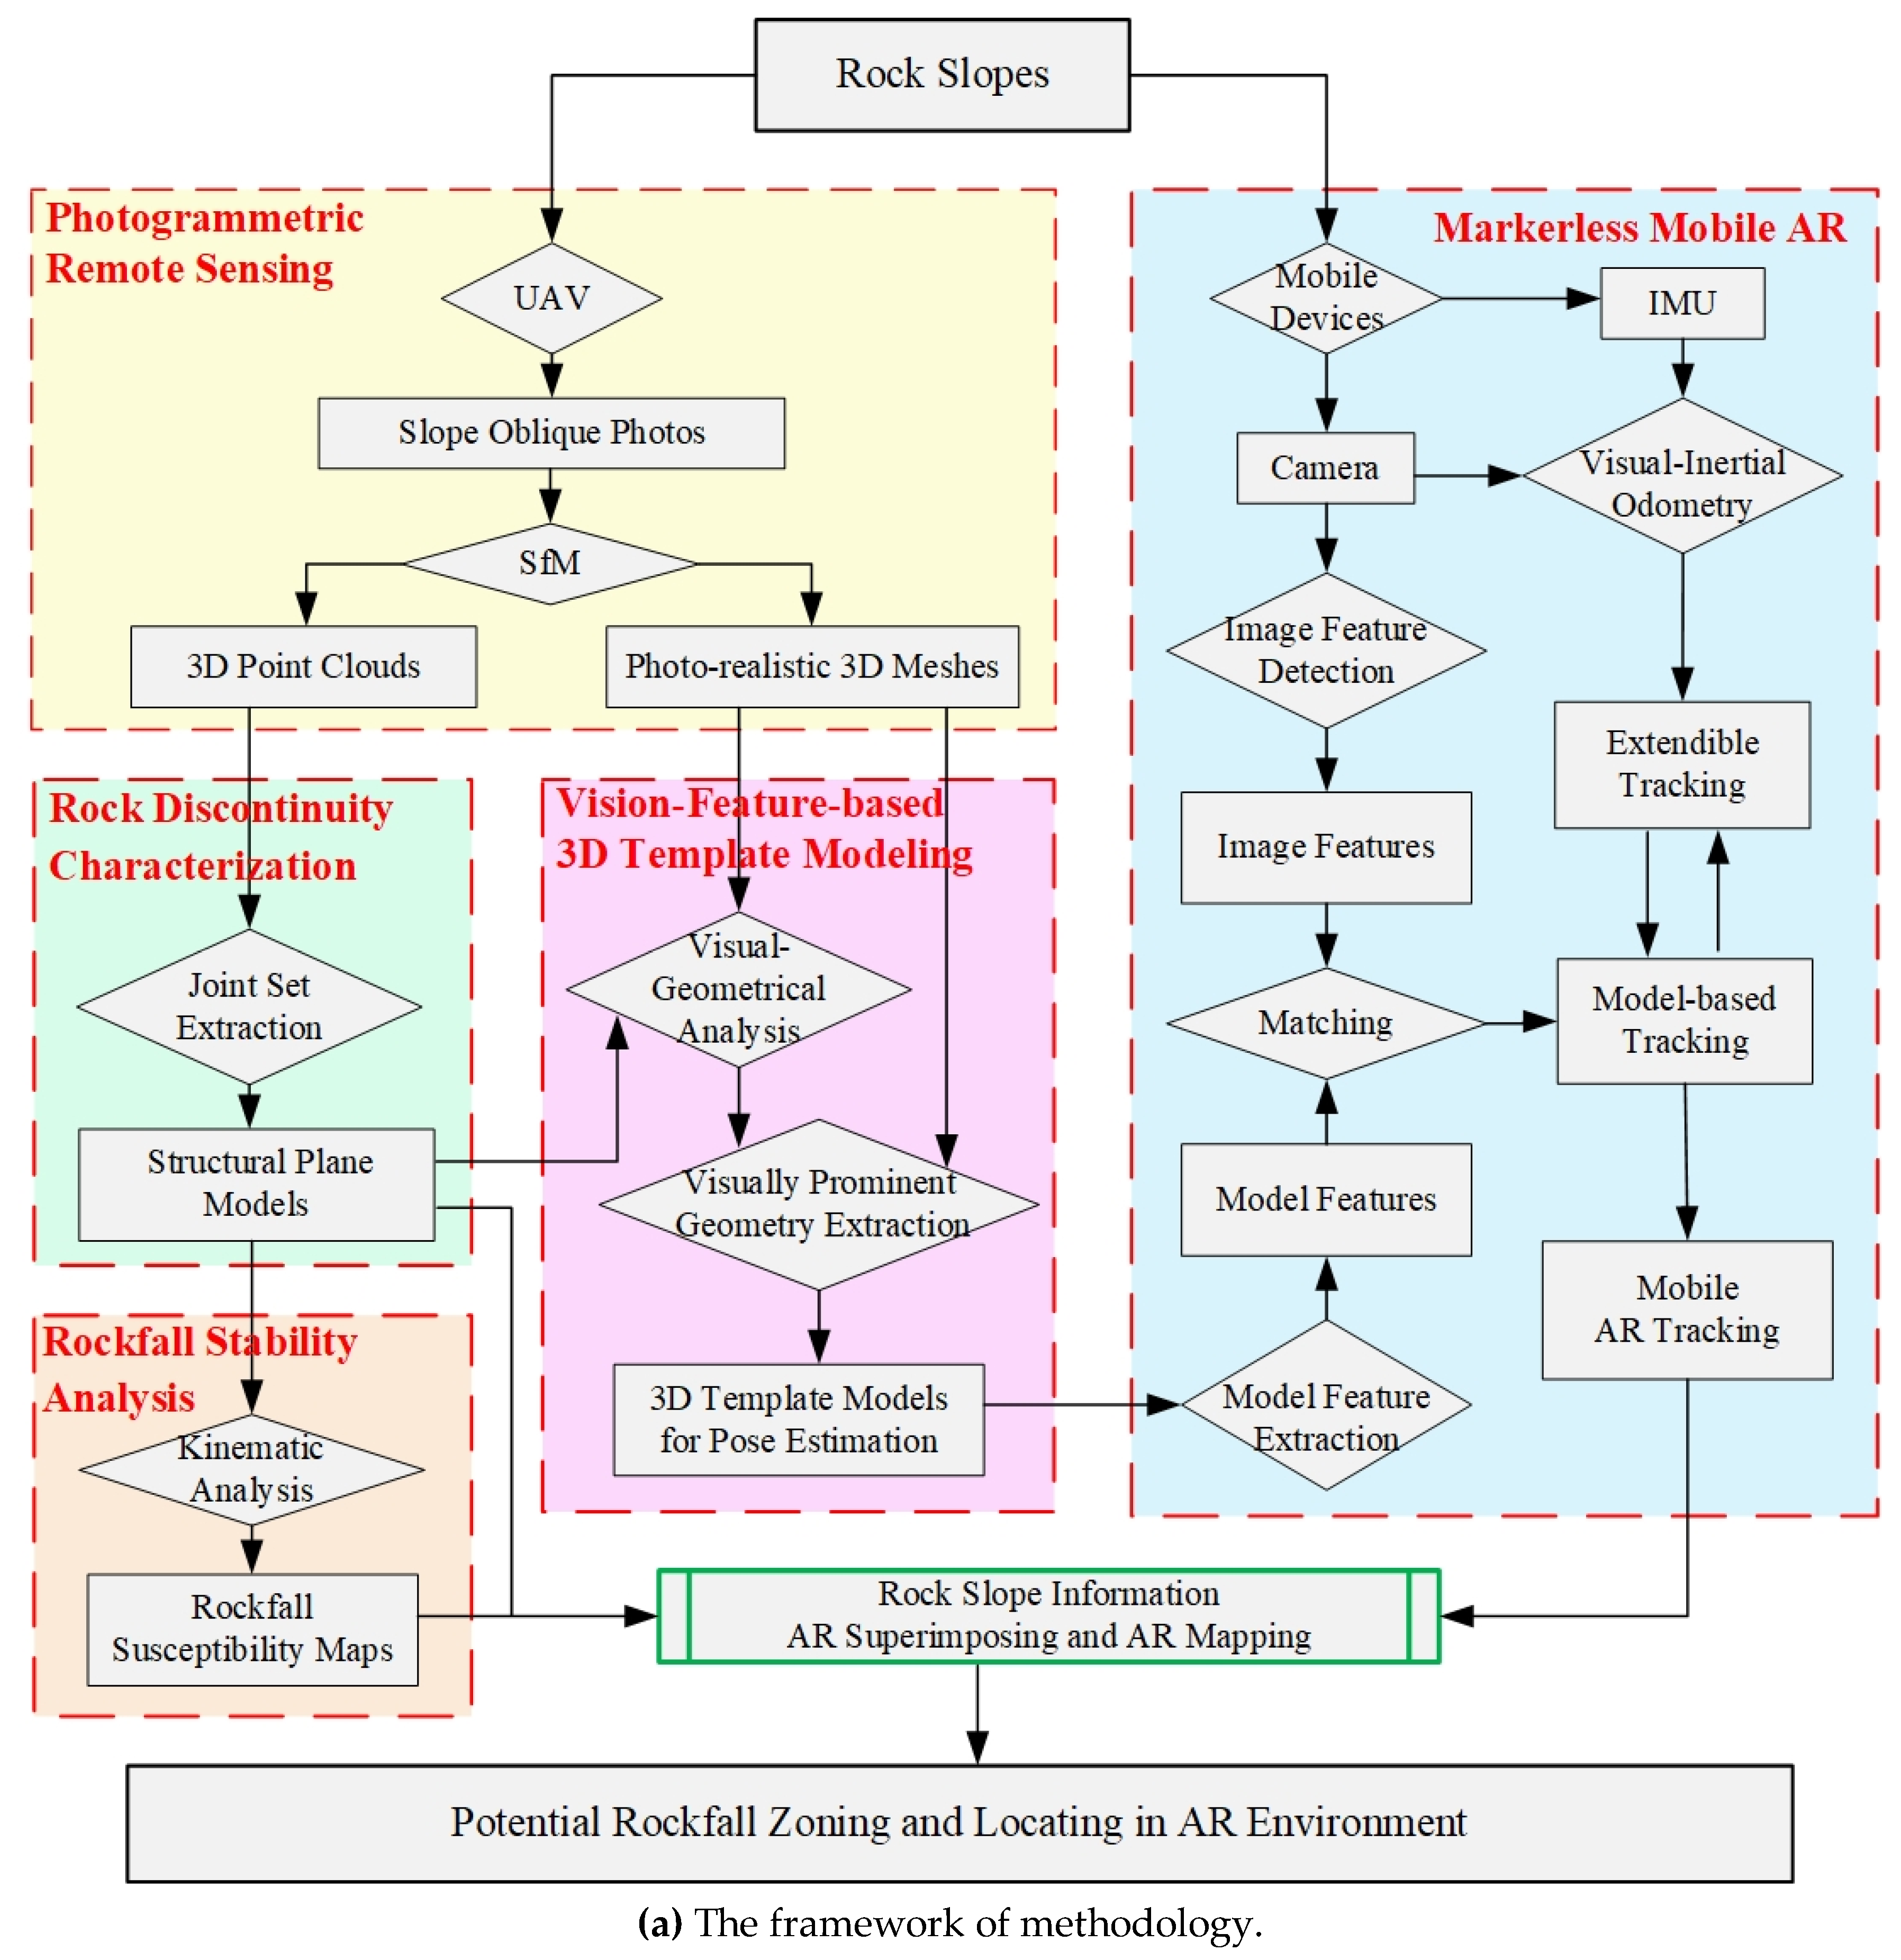
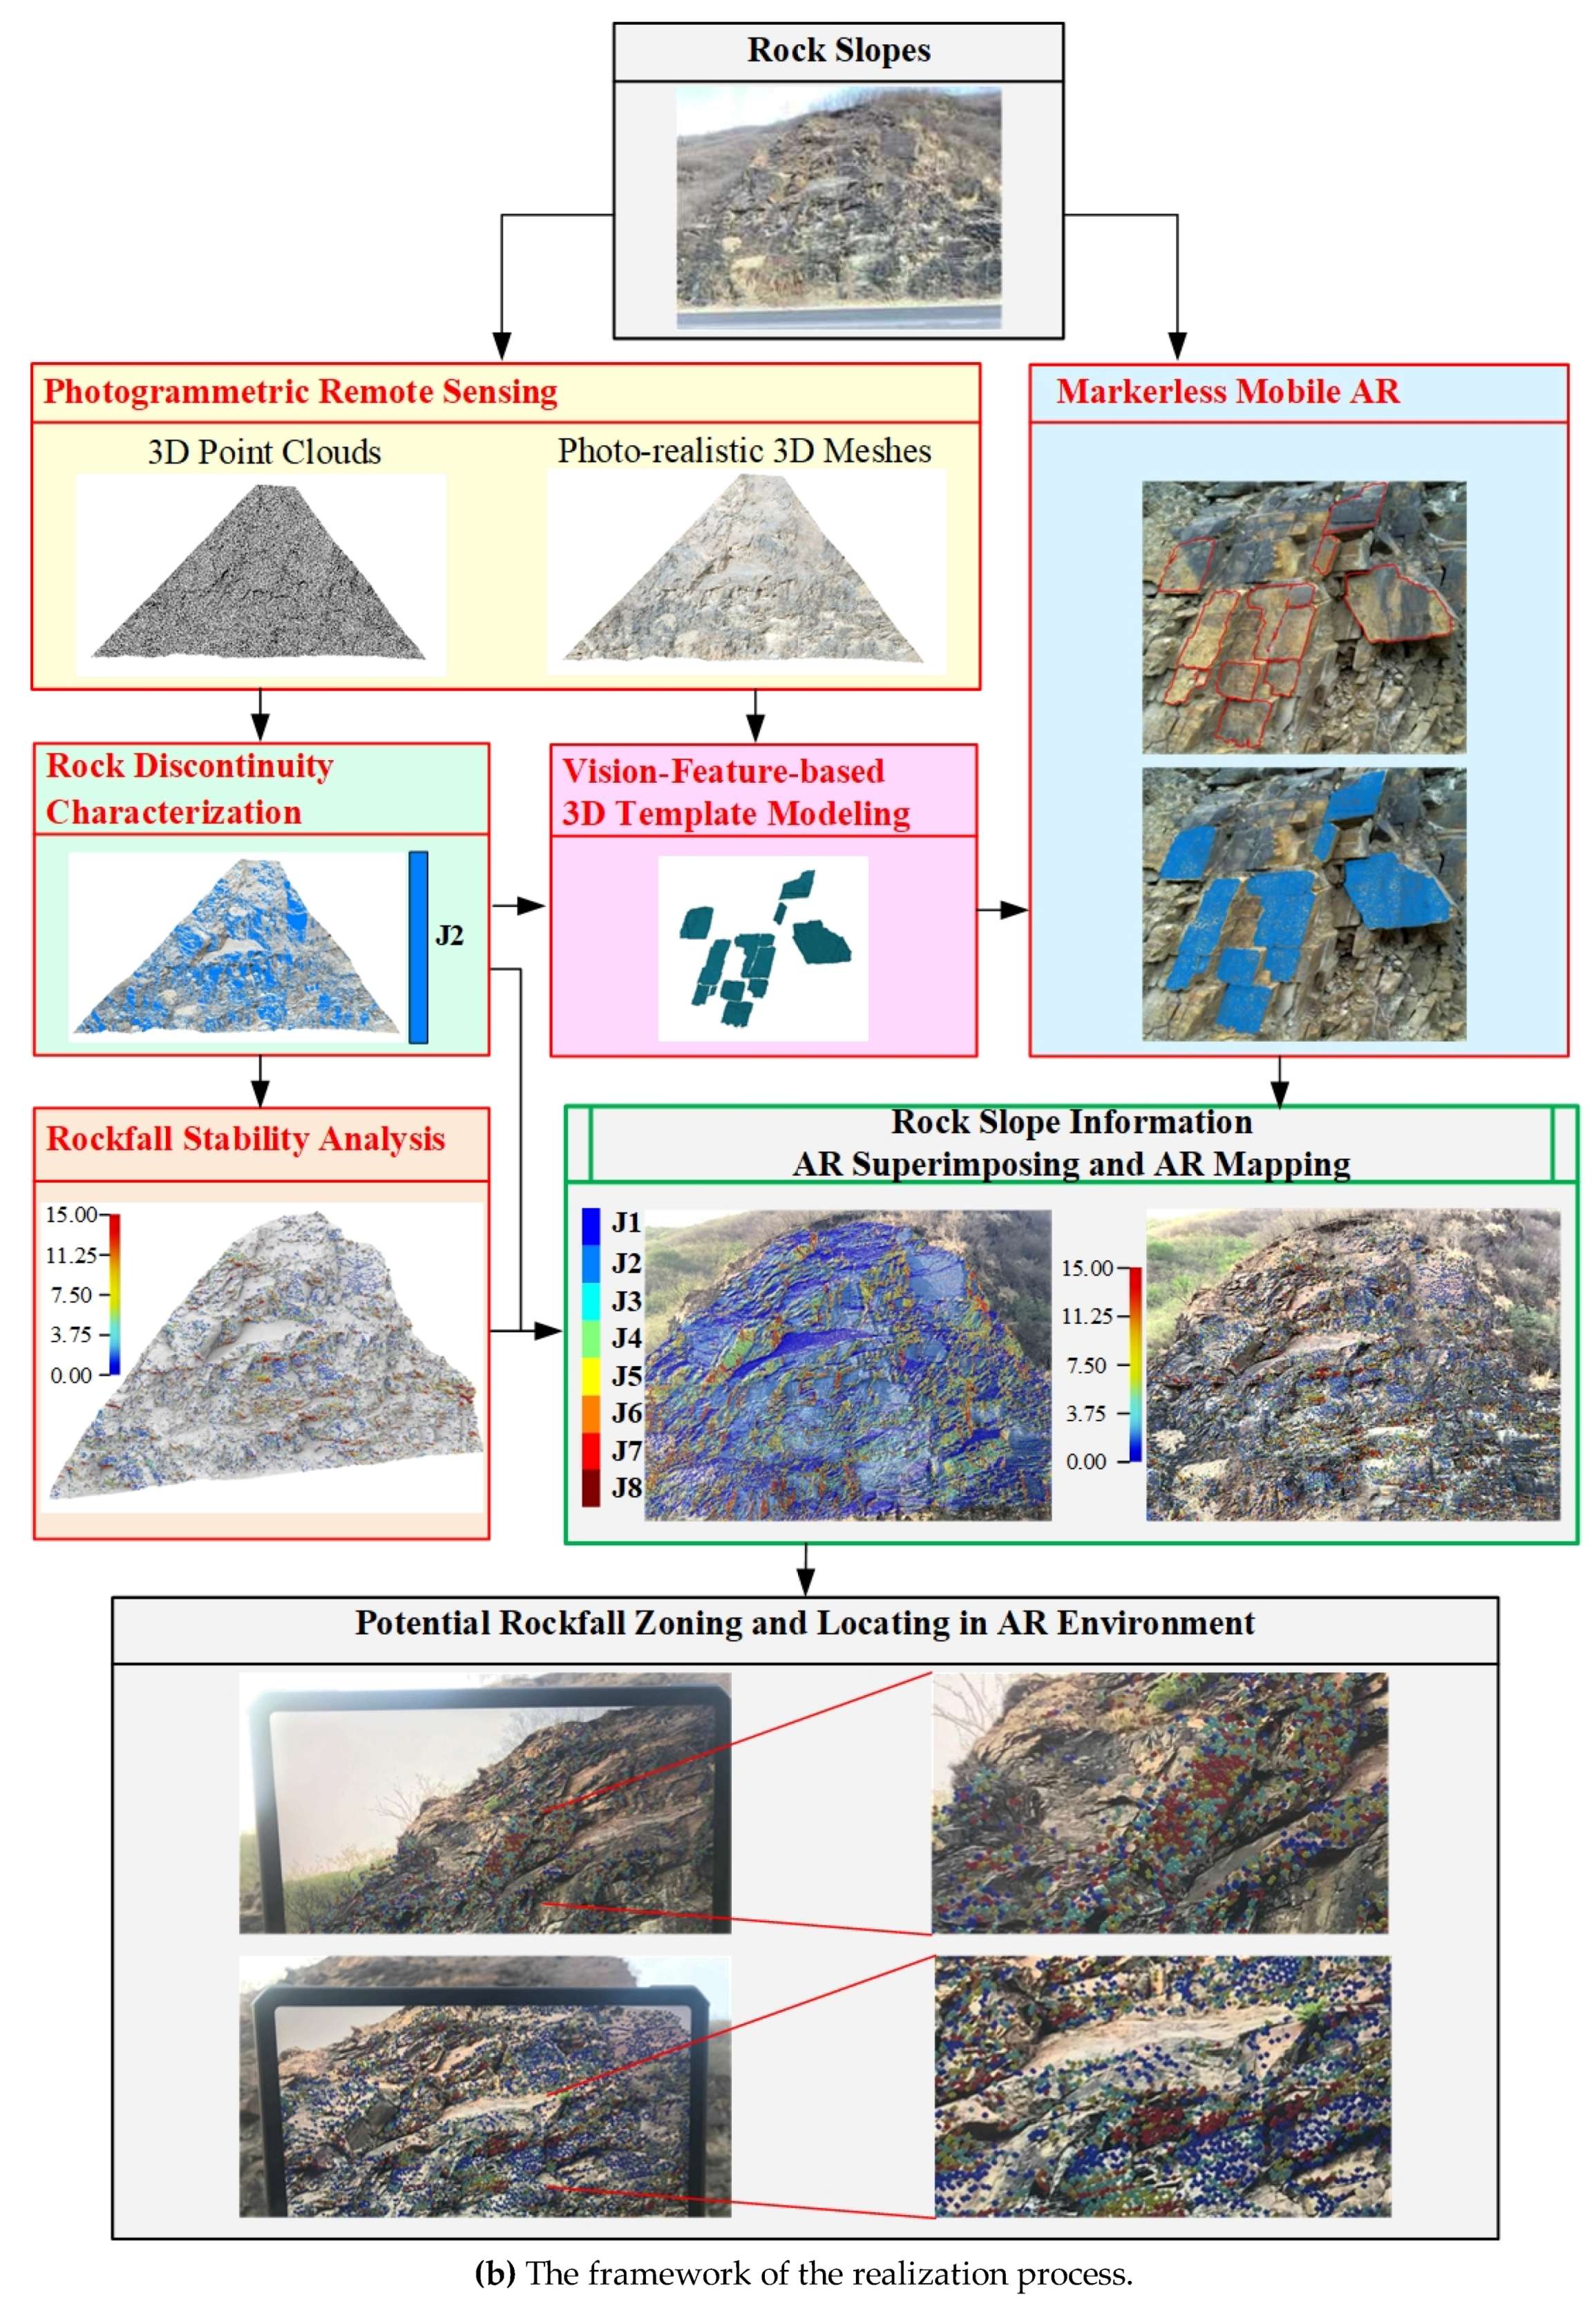
The research framework of the proposed methodology for rock slope information AR mapping and on-site rockfall zoning is shown in
Figure 2. Two aspects of the problem need to be solved: how to generate high-resolution rock fall hazard maps and how to superimpose the hazard maps onto real rock slopes. This paper establishes a novel workflow that solves both problems by using the UAV photogrammetric remote sensing data.
The framework consists of six parts: (1) the photogrammetric remote sensing (
Section 2.1); (2) the rock discontinuity characterization (
Section 2.2); (3) the markerless mobile AR (
Section 2.3); (4) the vision-feature-based 3D template modeling (
Section 2.4); (5) the rockfall stability analysis (
Section 2.5) and (6) the rock slope information AR superimposing and mapping (
Section 2.6).
First, in the photogrammetric remote sensing section, based on multiple UAV imagery of the rock slope, the SfM-MVS technique reconstructs the 3D virtual slope with high resolution and accuracy in the form of both 3D point clouds and photo-realistic 3D mesh models. Compared with other remote sensing approaches, the photogrammetric method can acquire high-quality information on the specific dimension of computer vision such as photo-realistic model textures, which is indispensable for the following vision-based augmented reality, thus making photogrammetry a requisite choice for remote sensing in the proposed methodology. Second, in the rock discontinuity characterization section, joint sets and structural planes are detected from the 3D point clouds. The yielded structural plane model lays the foundation for analyzing both the visual features and rockfall susceptibilities of the slope rock mass. Regarding the first data flow direction, the vision-feature-based 3D template modeling section, the Canny edges detected in the images rendered from the photo-realistic 3D mesh were aligned with the projected structural plane models to distinguish visually prominent structural planes and establish a 3D template model for AR tracking. In the other direction, in the rockfall stability analysis section, the kinematic analysis was conducted using the joint set parameters to generate rockfall susceptibility maps. Furthermore, in the markerless mobile AR section, following the model-based camera pose estimation paradigm, the model features extracted from the 3D template model and the image features detected from the mobile device camera video streaming were matched to perform the model-based tracking. Moreover, the VIO technique based on the camera and IMU of the mobile devices was used to extend the AR tracking when the target object was out of view. Last, but not least, the rock slope information, including rock mass discontinuities and rockfall susceptibility maps were superimposed and AR mapped on real rock slopes. After integrating the methodology and techniques above-mentioned, the potential rockfall sources could finally be zoned and located in the augmented reality environment.
2.1. UAV SfM Modeling
The Structure-from-Motion Multi-View-Stereo (SfM-MVS) technique can flexibly produce 3D models with photo-realistic materials from a highly redundant bundle adjustment based on matching features in multiple overlapping photographs. Combining SfM photogrammetry with UAV oblique photos can significantly promote the routine use of 3D modeling in slope observation practice.
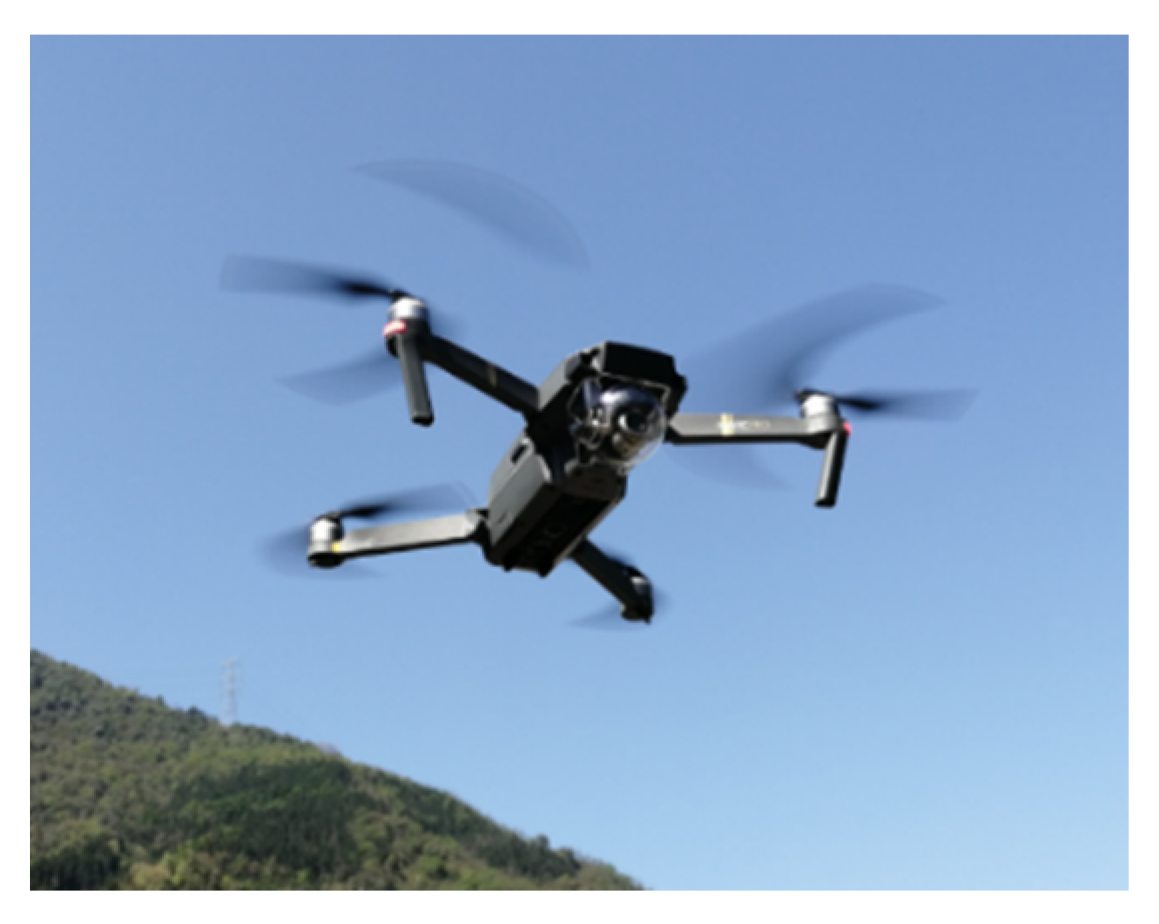
Figure 3 shows the multi-rotor drone DJI Mavic Pro used in this research. The specifications of the built-in camera of DJI Mavic Pro are as follows: image sensor, Sony EXMOR 1/2.3”; sensor type, CMOS; effective pixels, 12.35Mpix; resolution, 4000 * 3000 pixels; pixel size, 1.55 μm.
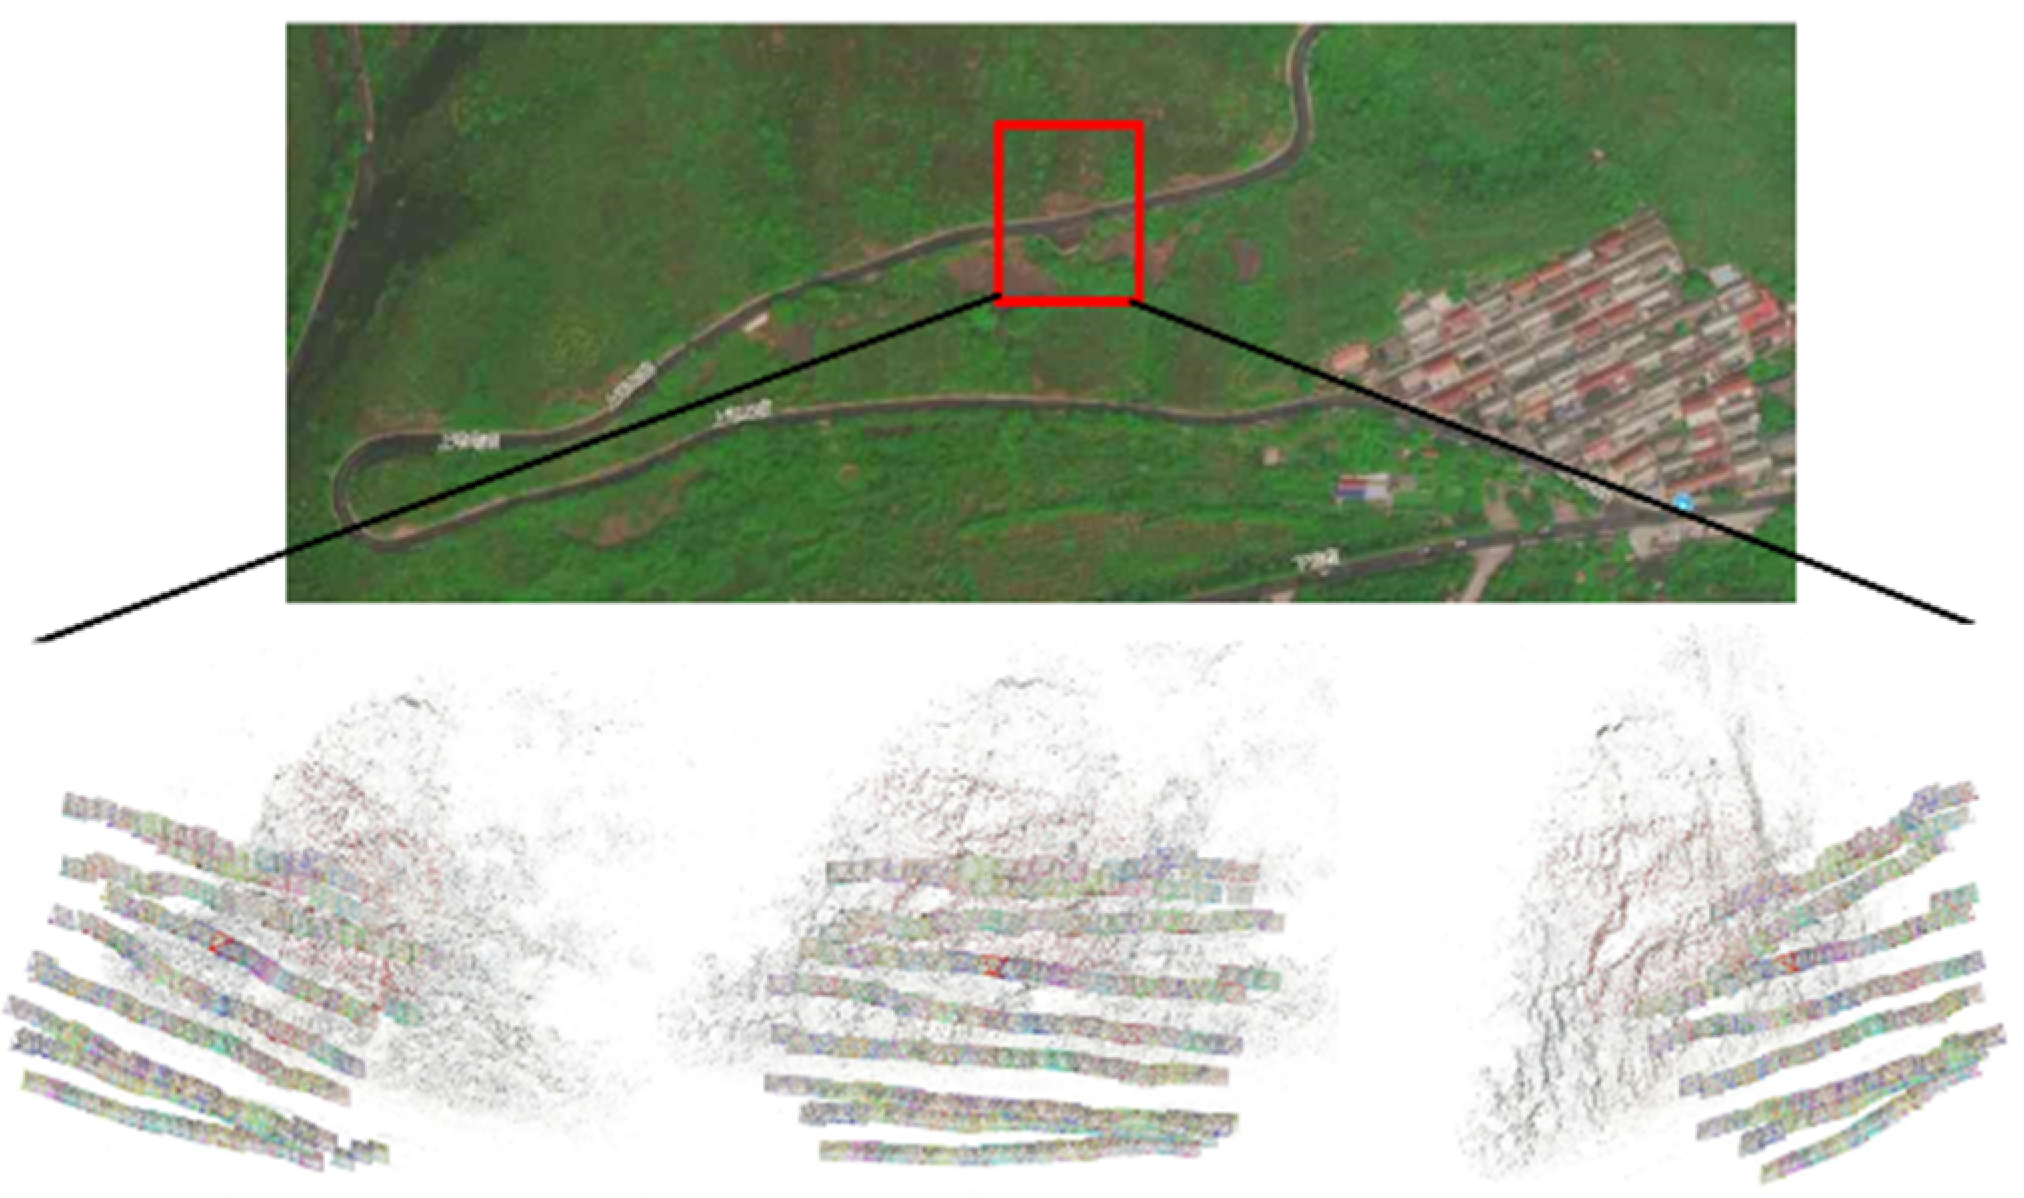
Figure 4 shows the location of the case study, which is a typical roadcut cliff at risk to rockfall, located in the Mentougou District of Beijing, China. UAV imagery is also presented in
Figure 4. The average Ground Sampling Distance (GSD) of the UAV images is around 4mm. The date of the UAV photo shoot was Beijing time, January 5, 2019. The SfM-MVS modeling was performed using open source softwares, including VisualSFM [
40,
41], PMVS [
42,
43], and MeshLab [
44,
45,
46,
47]. The modeling output included high-resolution 3D point clouds and 3D meshes with photo-realistic materials of this slope.
2.2. Rock Discontinuity Characterization
It is interesting that the two different tasks of rockfall analysis and rock mass target AR tracking intersect at the focus of the three-dimensional morphology of exposed slope rock mass, i.e., the outcropping structural planes that geometrically affect the slope stability are just the flat surface planes dominating the visual edge features of slopes [
20,
48].
The recognition and characterization of rock mass discontinuity from 3D point clouds were carried out using the opensource software DSE and the approach proposed in [
11], of which the procedure consists of three steps:
(i) Local curvature calculation
For each 3D point of the point cloud, the K-nearest neighbors (knn) were identified, the coplanarity condition of these k + 1 points were checked, and the normal vector was calculated with a plane adjustment. The normal vectors of the 3D points could both quantify the orientations of the joint sets and slope surface for the later rockfall kinematic analysis in
Section 2.5.
(ii) Statistical analysis of the planes
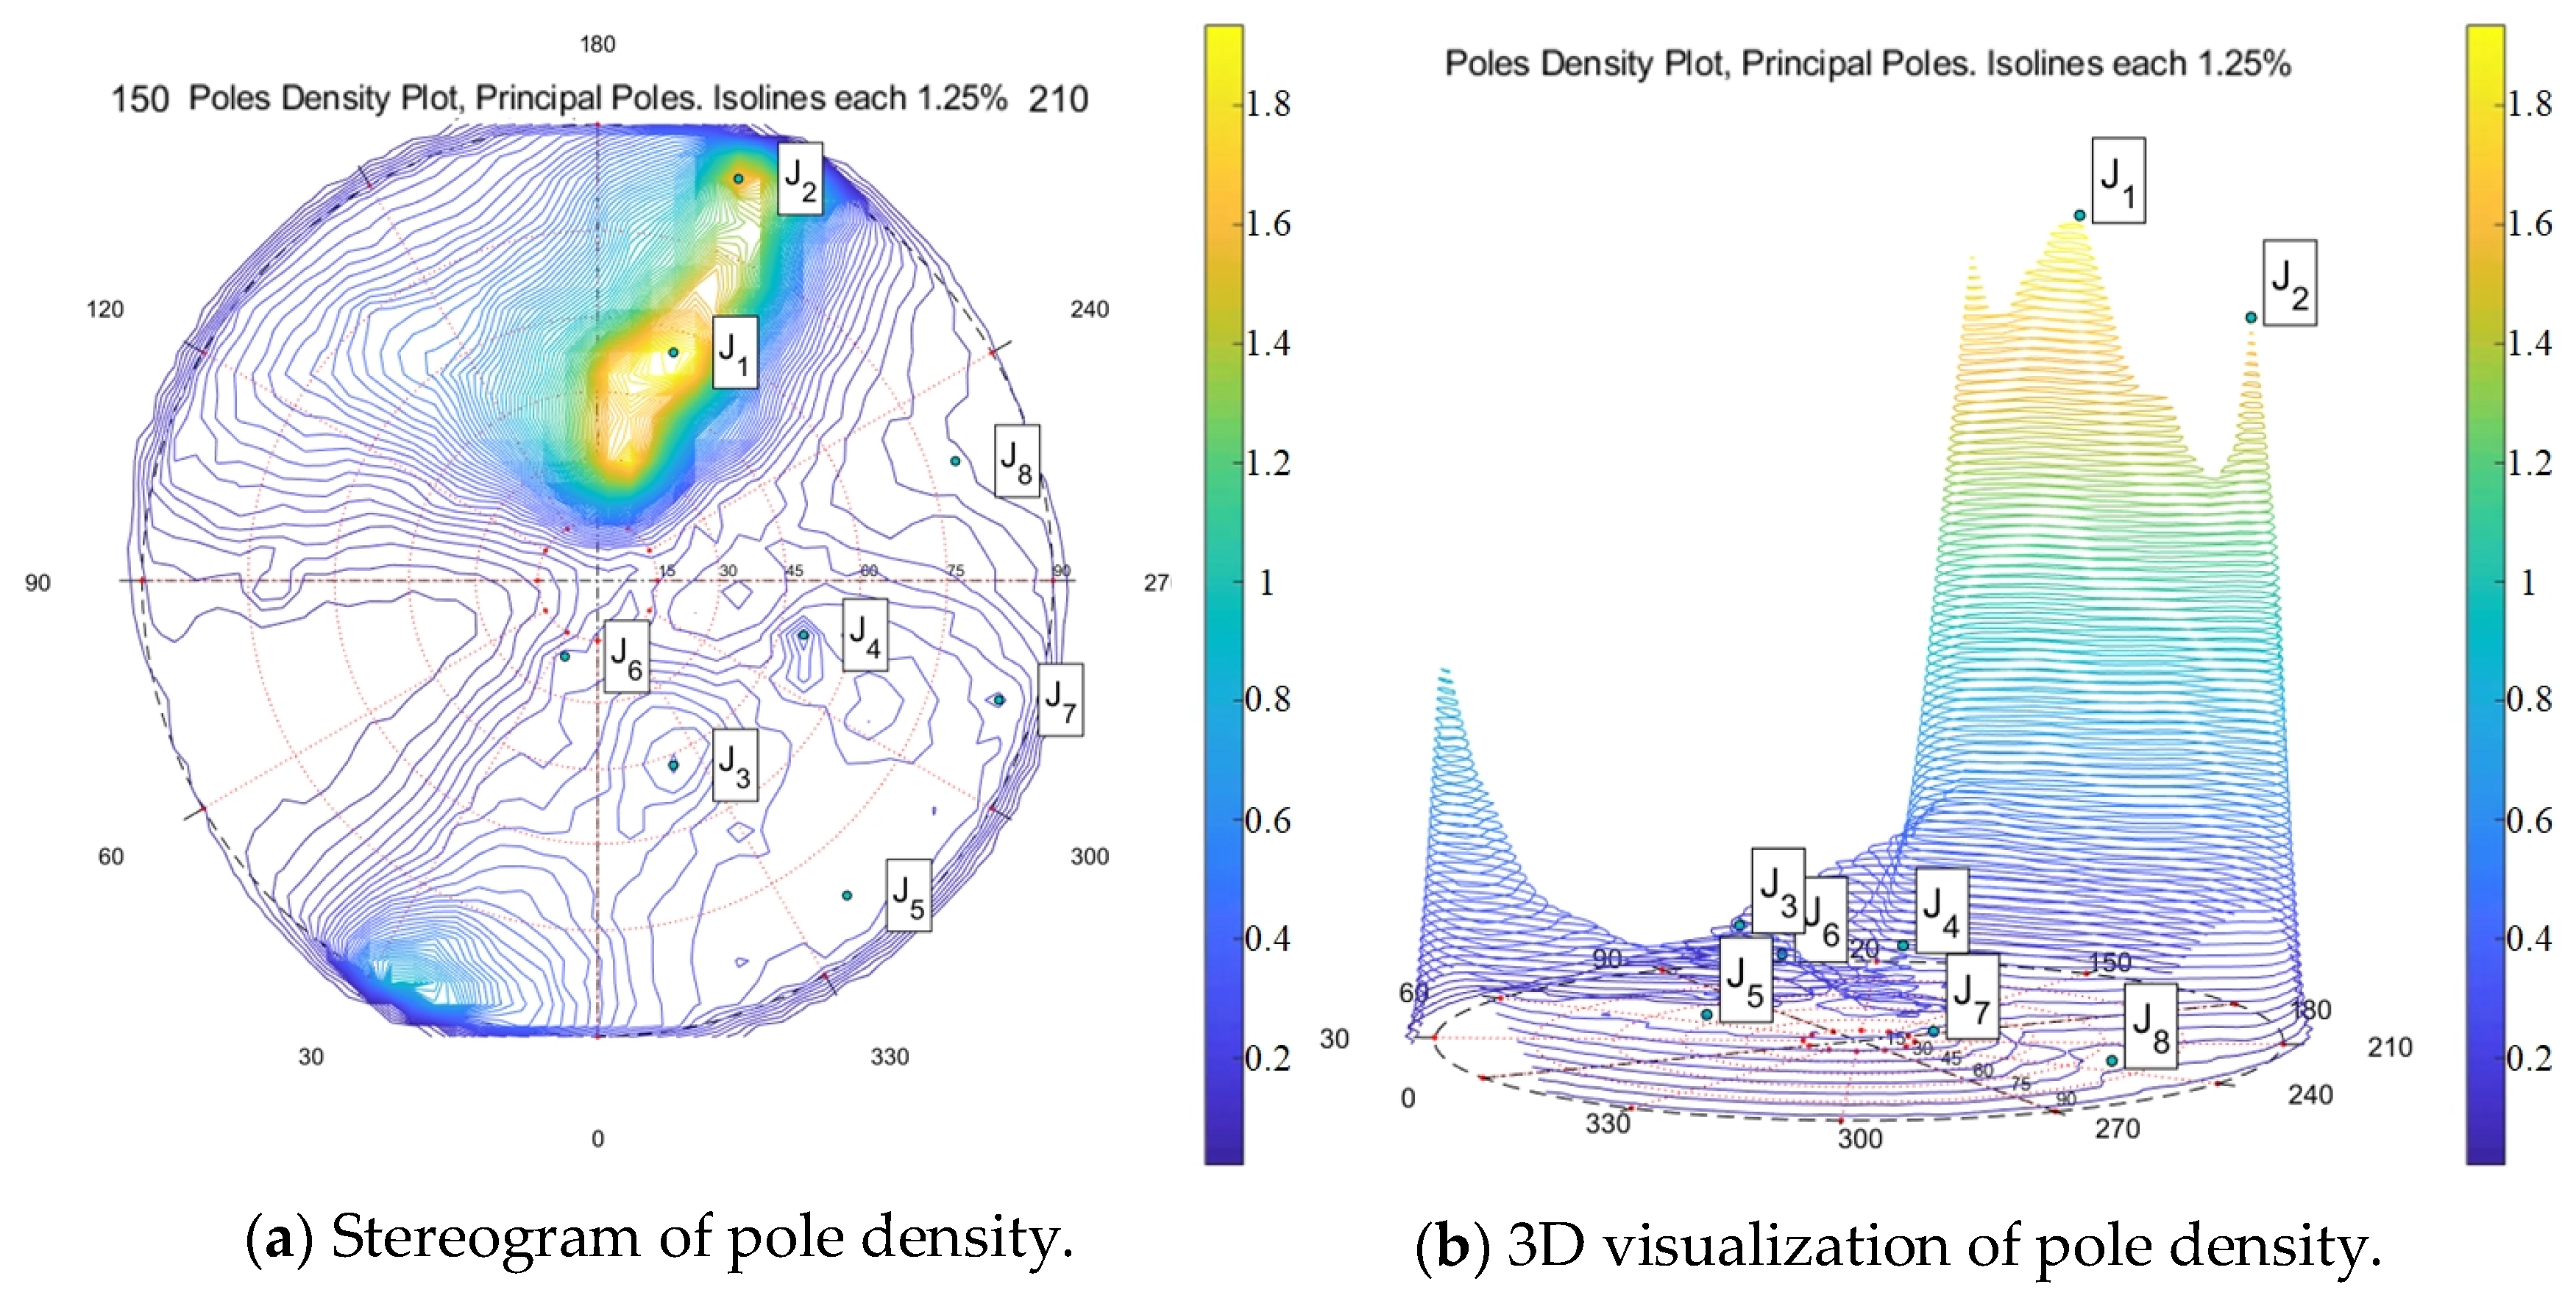
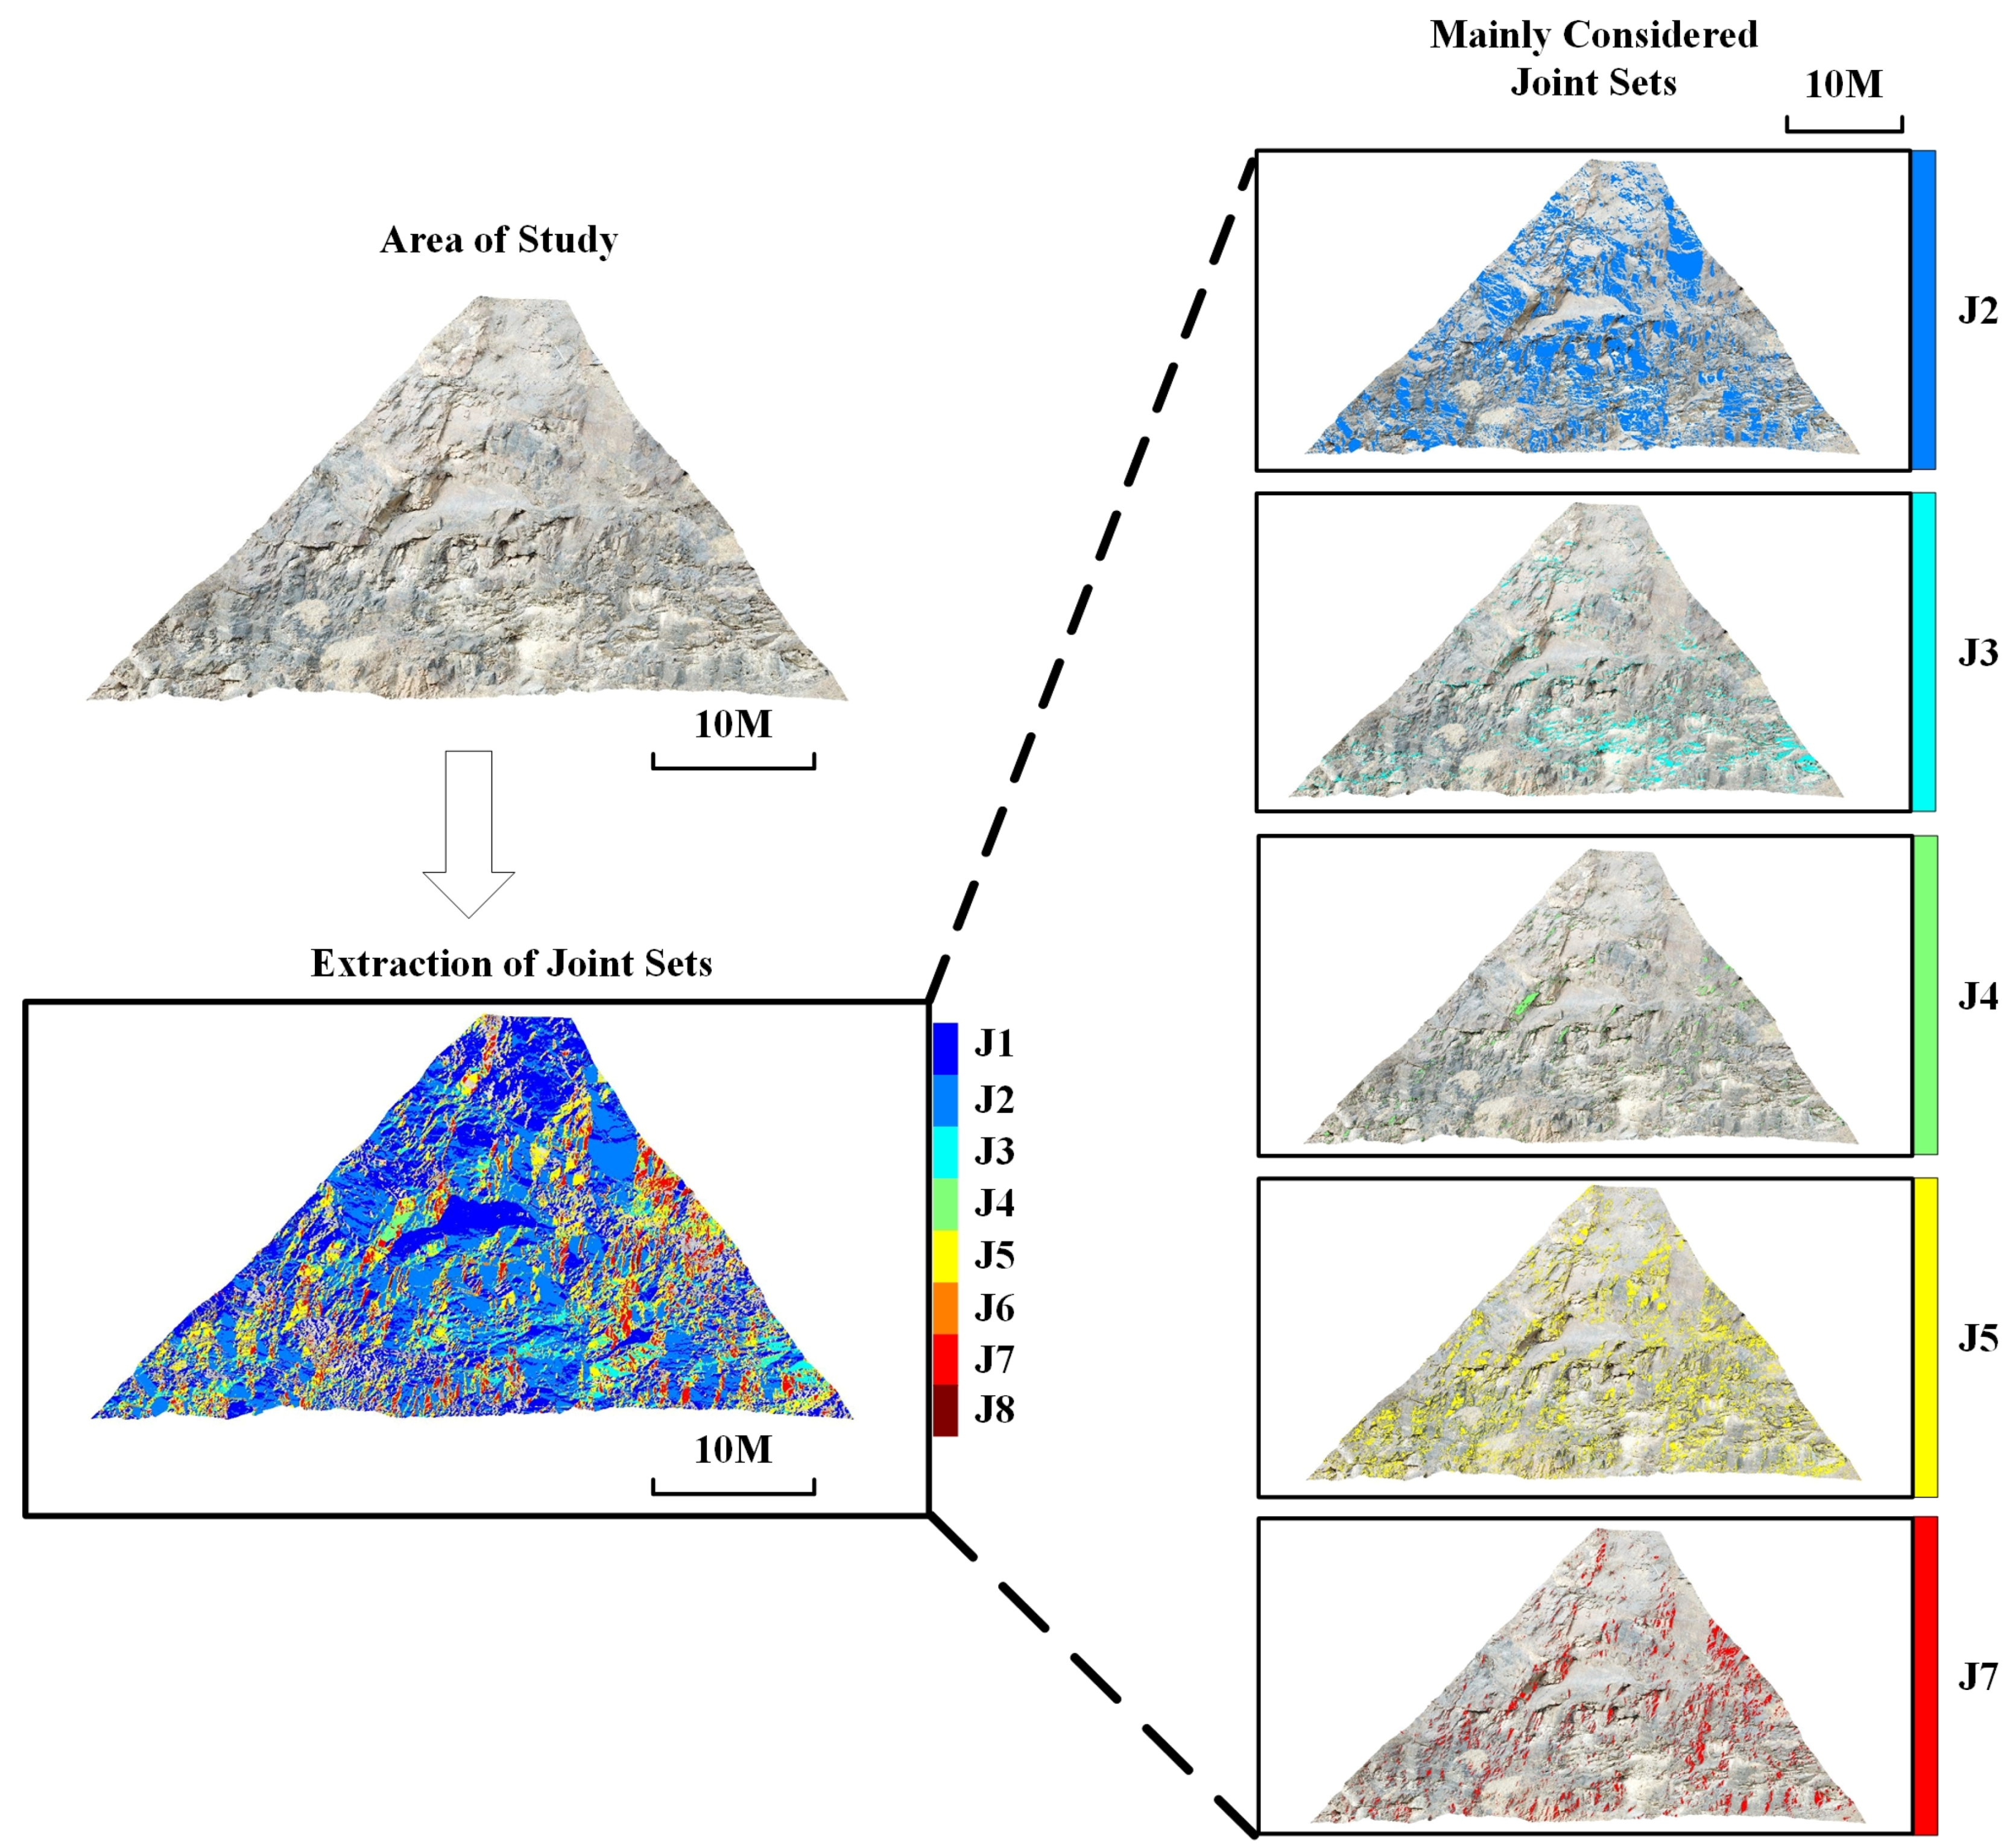
Taking advantage of the stereographic projection of the plane poles, the density of the poles was calculated using kernel density estimation (KDE); the principal orientations of different discontinuity sets were identified through a semi-automatic selection of the local density peaks; point clouds were segmented into different discontinuity sets. The stereographic projection of the studied slope is plotted in
Figure 5, where eight joint sets are clustered, and the segmented point clouds of these joint sets with different colors are shown in
Figure 6. Joint set 1 was considered the main slope direction and five principal joint sets with relatively large percentages of point number in each joint set to the total point number, magnified in
Figure 6, were considered in the rockfall analysis in
Section 2.5.
(iii) Cluster analysis
The points belonging to a common discontinuity set were grouped according to planar clusters by employing the “Density-based Scan Algorithm with Noise”(DBSCAN) before these point clusters were fitted to flat surfaces representing the individual structural planes of the discontinuity set. Some of the dominant structural planes were then filtered based on the structural plane areas for 3D template modeling, as demonstrated in
Section 2.4.
2.3. Edge-Based AR Tracking of Rock Mass Target
As overviewed in
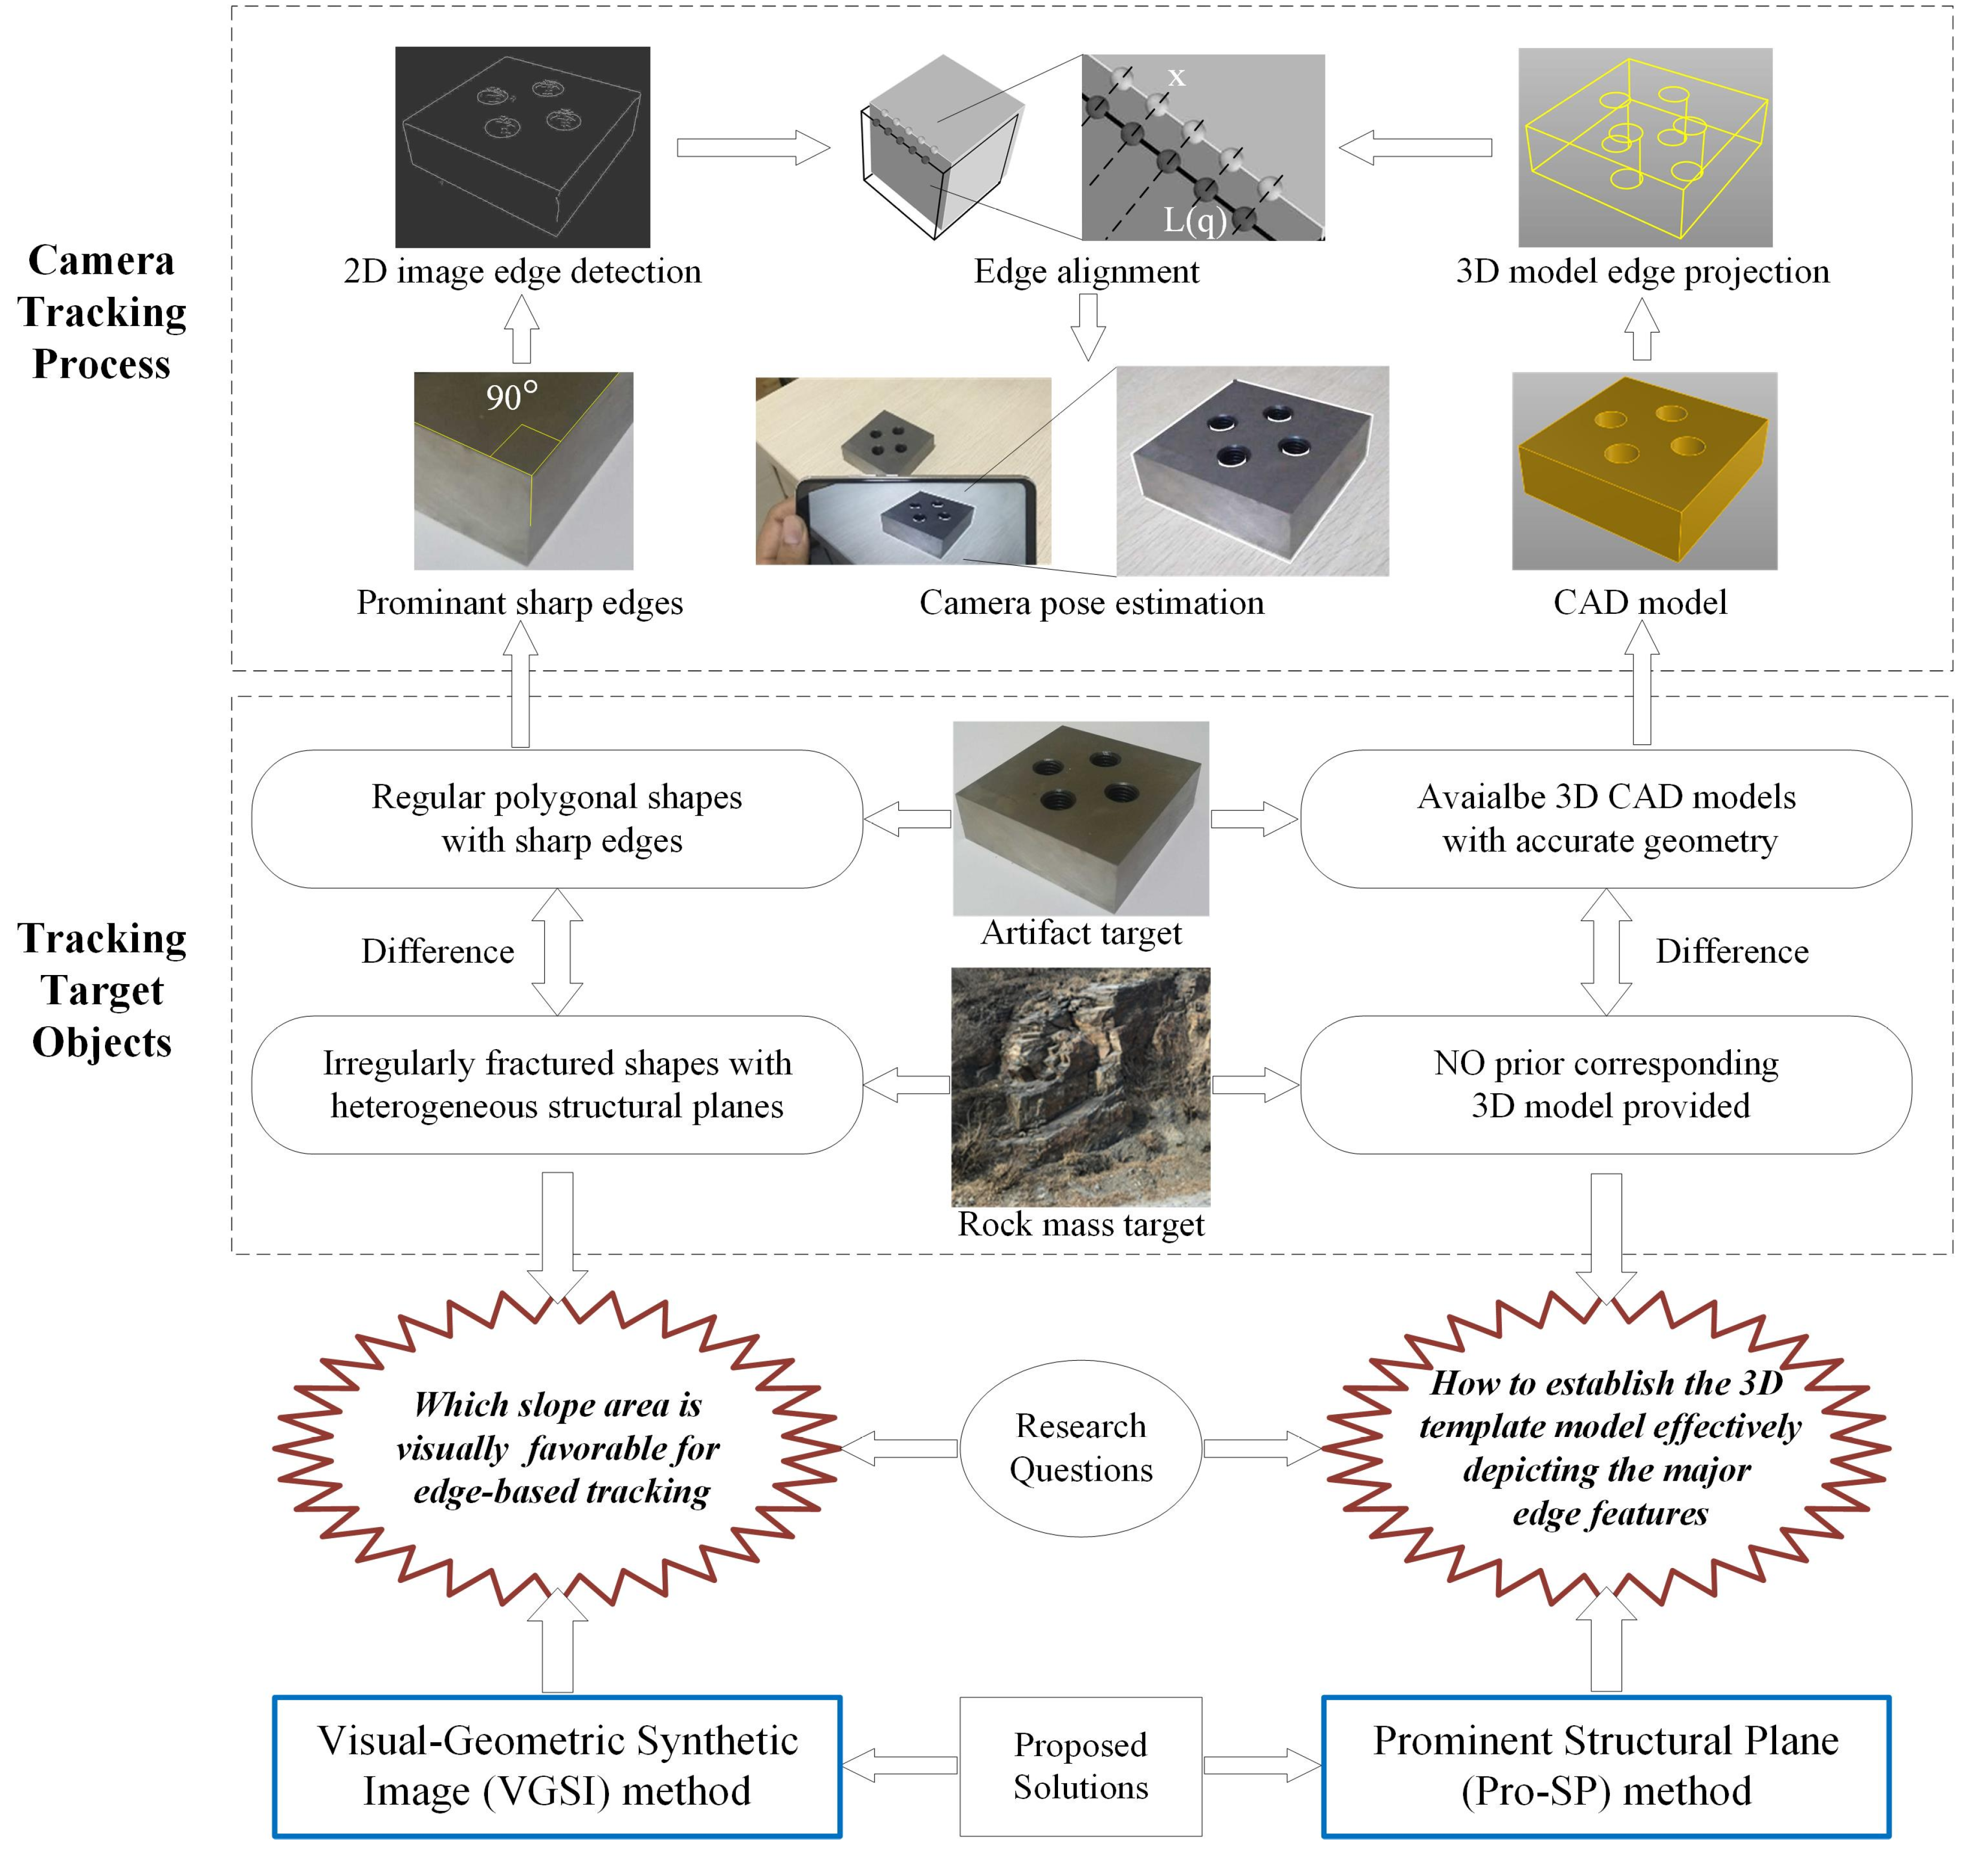
Section 1, there are various camera pose estimation approaches, among which the model-based tracking strategy focusing on edge features from a monocular vision sequence of mobile devices is relatively the most suitable choice in the rock slope context. As illustrated in the camera tracking process part of
Figure 7, the principle behind the edge-based camera tracking process is to define a distance between the edges detected in the 2D image sequence captured by the mobile camera and the projected 3D edges underlying the corresponding 3D model and minimize the norm of the reprojection error [
49].
Two phases of edge alignment are involved: tracking initialization and tracking maintenance. First, the tracking initialization phase requires an initial model pose to be predefined, according to which the 3D model is projected into the 2D image, then the projected 3D edges
need to be aligned to the actual objects to generate an estimation of the initial camera pose as the starting point of the tracking. Subsequently, in the tracking maintenance phase, the edges in the camera images are detected and sampled into point
, and a search is performed along the image edge sampled point
normal to the projected edges
to find strong gradients in the next frame. A nonlinear iterative optimization approach can be used to estimate the camera pose, which minimizes the errors between the selected points and the projected edges [
30], that is:
where
is the translation vector between the world frame and camera frame,
and
are the angle and the axis of the rotation matrix between the world frame and camera frame,
is the squared distance between the point
and the projection of the 3D edges
for the model pose
.
Obviously, according to the above-mentioned mathematical mechanism, the quality of the edge-based pose estimation is highly dependent on two factors: the quality of the detected image edges, which need to be clearly visible and detectable in the camera image sequences, and the quality of the projected model edges, which need to be prominent enough to depict the major edge features of the 3D target object.
As reviewed in
Section 1, in current edge-based camera pose estimation studies, the tracking target is mainly the manufactured artifacts, such as toys, industrial machines, domestic appliance and vehicles, etc. including the standard mechanical parts in
Figure 7. These types of tracking targets generally have regular geometric shapes with simple sharp edges [
51] and are often designed and manufactured by building a corresponding 3D CAD model with an accurate depiction of the geometries [
50]. Therefore, the two requirements of the 2D image edge quality and the 3D model edge quality are naturally met for these targets.
Unfortunately, we have not found previous research on edge-based pose estimation aimed at the specific tracking target of rock mass. When it comes to this specific challenging tracking target, two critical aspects of research questions came to light, as clarified in the tracking target objects part of
Figure 7:
Research question one: Where do we track?
Unlike most industrial objects, which often have a relatively small size and clear outer contours; cliffs with large spatial scales mainly present sharp inner edges at the intersection lines of rock structural planes. However, irregularly fractured morphology can appear heterogeneous in the spatial distribution of edge features, where the scales of extending, winding and crisscrossing of the edges detected in camera images can vary tremendously in different parts of the rock mass. Consequently, the slope region with the most desirable visual features for edge alignment needs to be delineated first.
Research question two: How do we obtain a 3D model for matching?
As there are no previously provided corresponding 3D models (such as CAD models) available to serve as the 3D template model—and even if 3D reconstructions of rock mass are accessible through remote sensing, simply adopting all parts of the 3D rock mass models within the camera’s field of view can involve relatively small and cluttered model edges derived from small-scale fractures, which need to be avoided in the edge tracking paradigm. Consequently, appropriate 3D template models that can selectively represent the prominent sharp edges of rock mass need to be extracted from the remotely sensed 3D models.
Considering the research questions in
Figure 7, two hypotheses regarding AR tracking for the fieldwork scenario were assumed: (a) only some local parts of the rock slope with meter scales would be selected for AR initialization, and (b) the predefined camera pose of the mobile device for AR initialization was approximately horizontal and perpendicular to the main slope surface. From practical experience, the first hypothesis is beneficial in a large-scale outdoor AR context, where regardless of how large the cliff is, the AR initialization is confined to the same spatial scale as a human observer. The second hypothesis is reasonable and in harmony with the actual fieldwork scenarios of rock slope investigation. Accordingly, the region of the rock mass target for model-based tracking is limited to a rectangular part of the rock slope referred to as the
Tracking Initialization Rectangle, as indicated and magnified in
Figure 8 with the yellow dashed rectangle.
To address research question one in
Figure 7, we proposed a novel visual-geometric synthetic image (referred to as VGSI) method to search for a suitable initial camera pose facing the local region of rock mass within the
Tracking Initialization Rectangle in
Figure 8 with relatively preferred edge features for AR tracking. To address research question two in
Figure 7, we proposed a novel prominent structural plane (referred to as Pro-SP) method for the 3D template modeling of a rock mass target in
Figure 8. These two methods are elaborated in
Section 2.4.
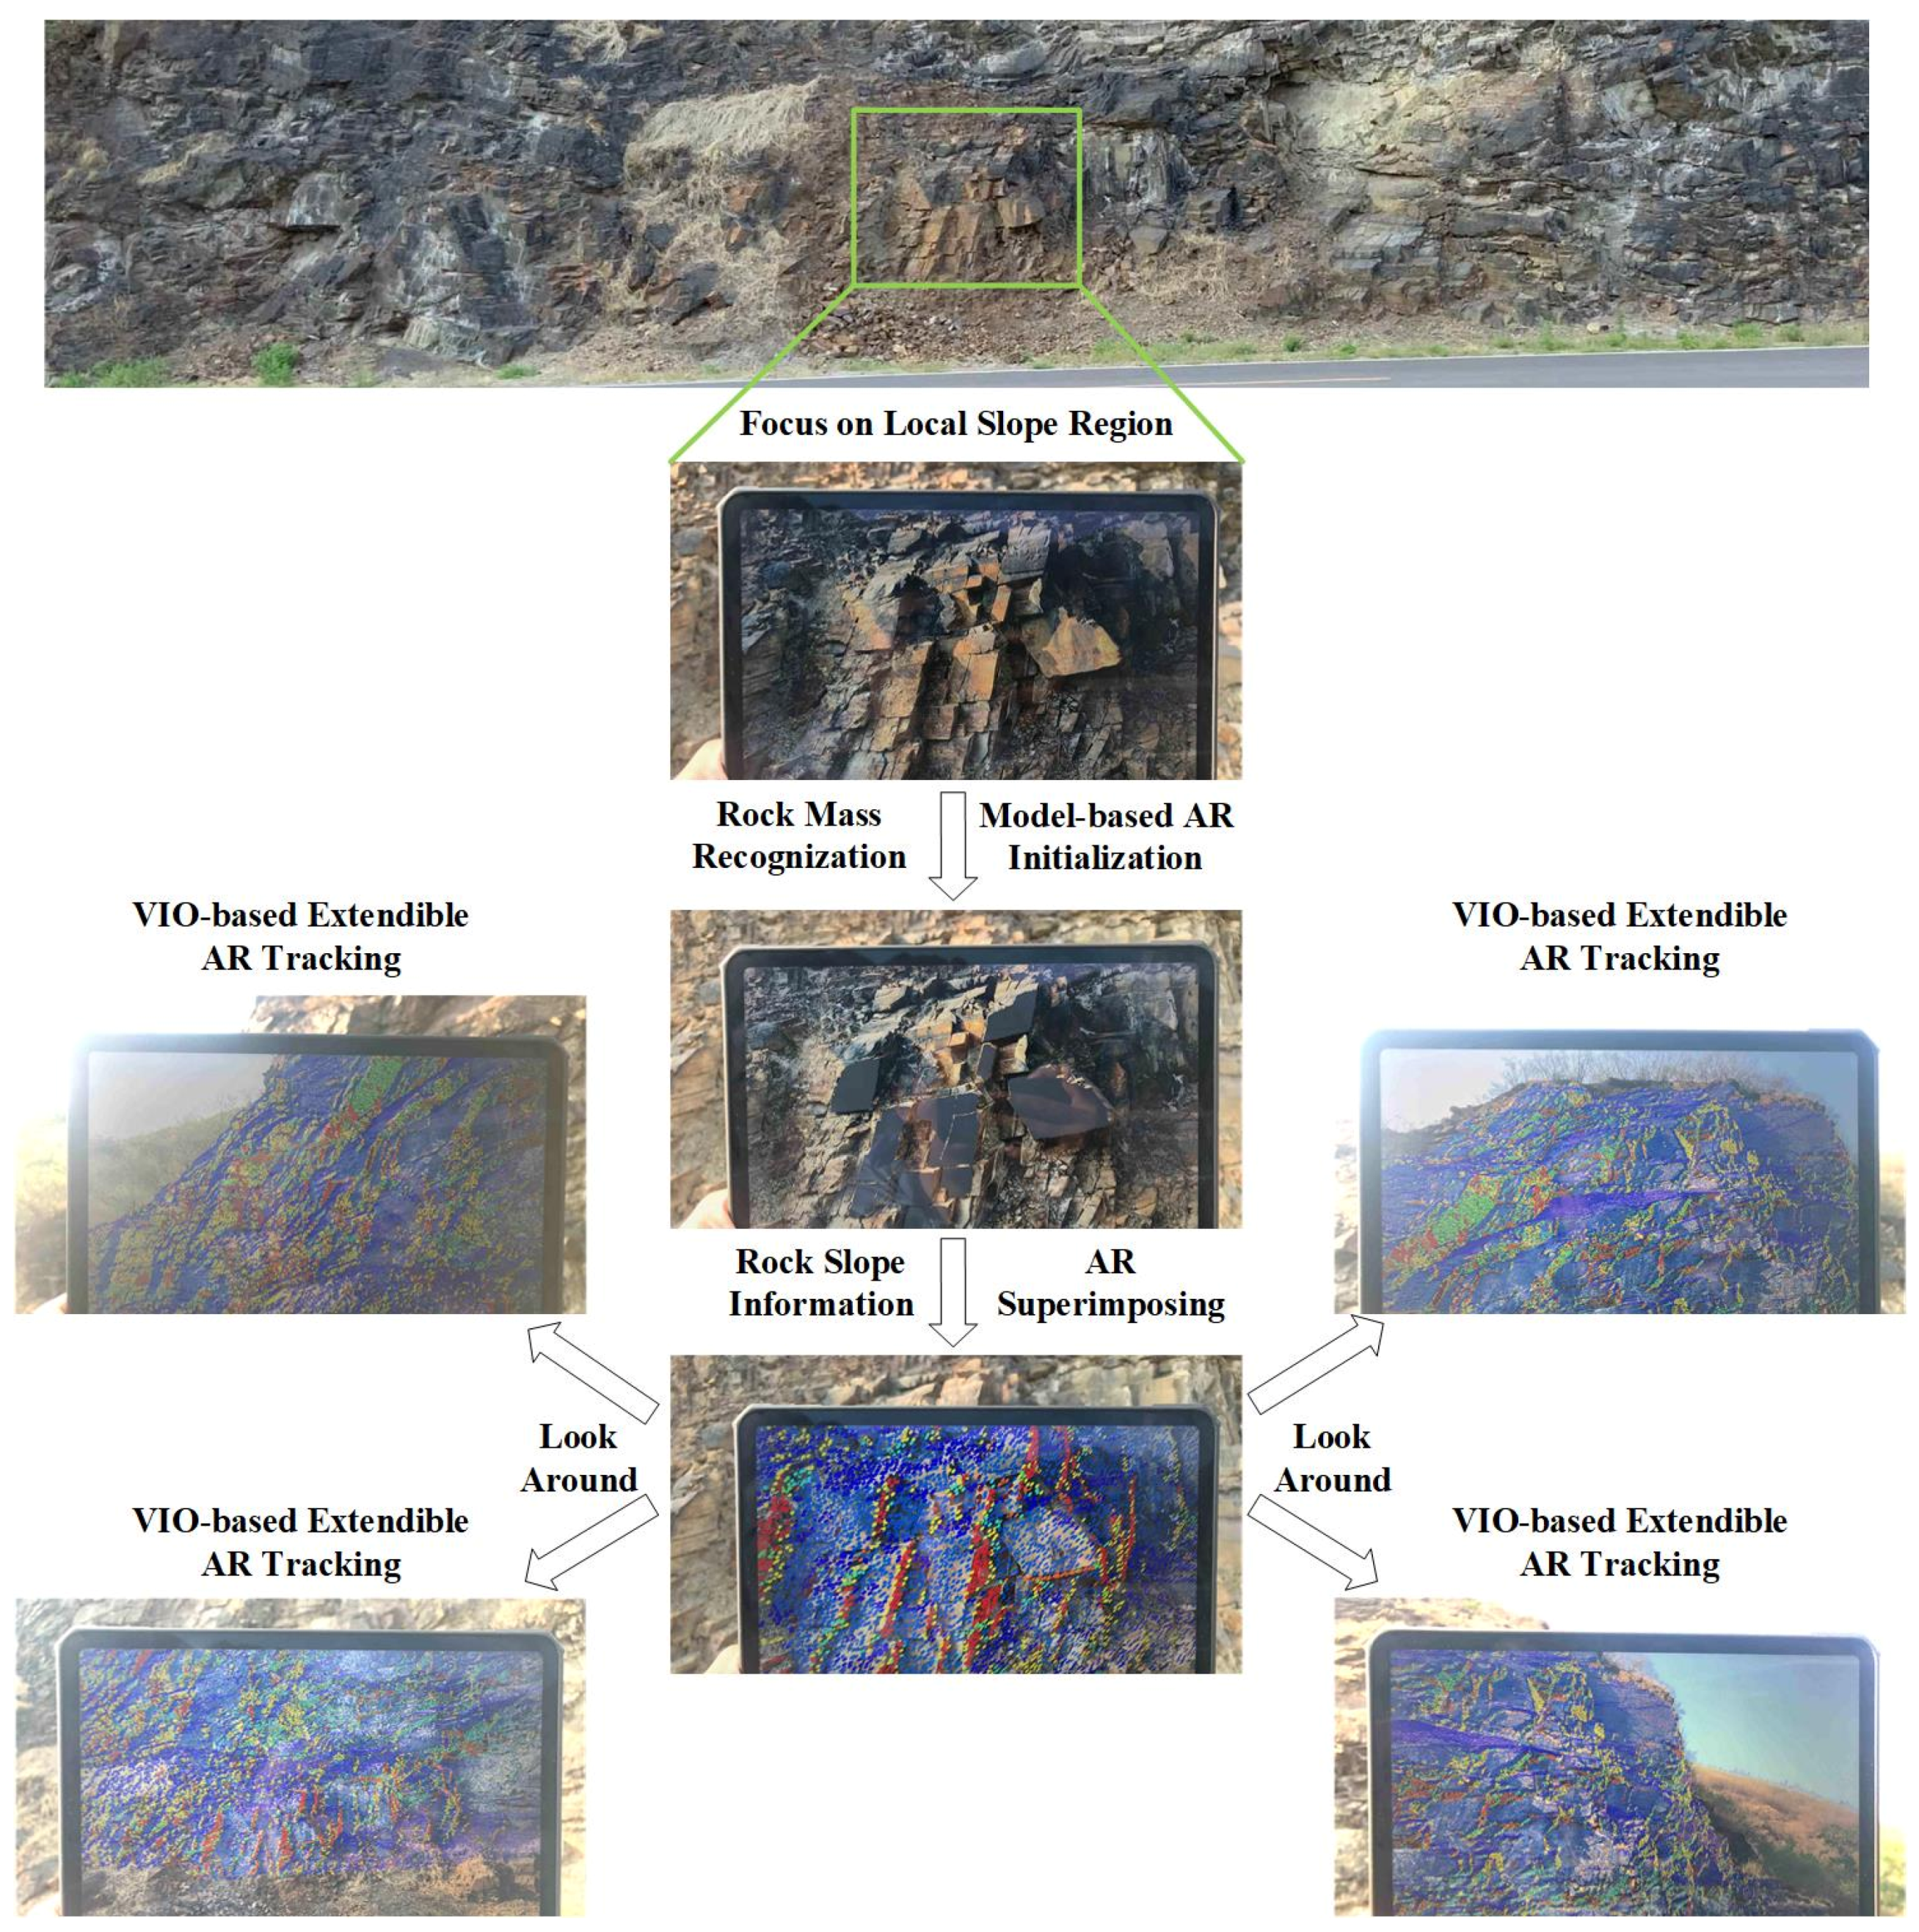
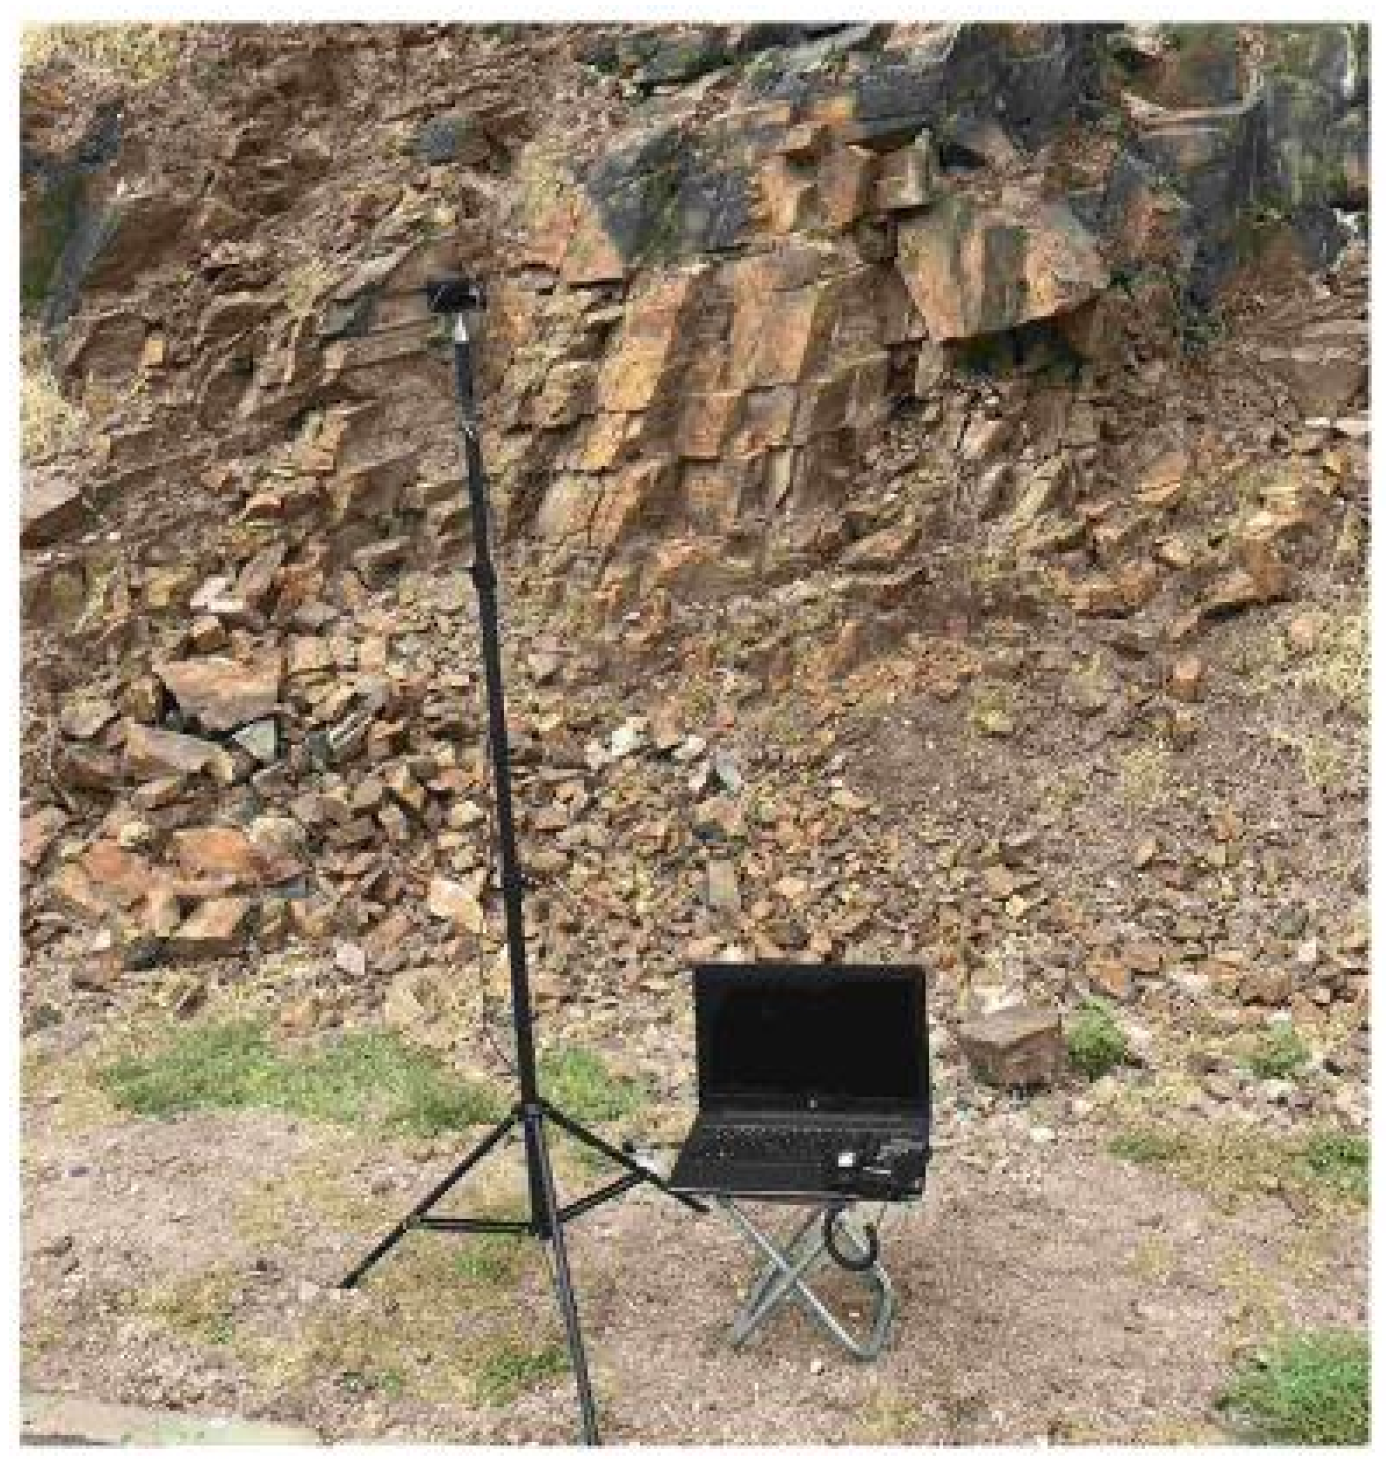
After settling the model-based pose estimation question, the overall procedure of the mobile augmented reality in the slope fieldwork context is demonstrated in
Figure 9. First, we faced the mobile device to the local region of the rock slope selected by the VGSI approach and adjusted the camera to the predefined initialization pose to recognize the rock mass target and trigger the tracking; then we superimposed the AR content onto the rock slope, and look around the whole cliff augmented with overlapping virtual information such as the rock discontinuity point clouds in
Figure 9. When the rock mass tracking region was within the camera’s field of view, the proposed 3D template model Pro-SP maintained the tracking of the real rock mass objects, assisted by the freely available AR engine Vuforia [
52] and game engine Unity3D [
53] for camera pose computation and screen rendering. When the target rock mass was out of sight, the extendible AR tracking was maintained based on SLAM, until the target came back into view, which could ensure a scalable AR experience. The extendible AR could be quickly realized using the VIO approach of the free AR SDK (ARKit [
54] of IOS and ARCore [
55] of Android) embedded in the popular mobile operating systems today.
2.4. VGSI and Pro-SP Method for Tracking Region Selecting and 3D Template Modeling
In the paradigm of edge tracking, the complete alignment between one hundred percent of the detected image edges and the projected model edges is not a requisite for launching an AR session, while the visually prominent edges of the real target objects and the corresponding 3D models play decisive roles in the feasibility, accuracy, and robustness of tracking performance. Therefore, the detection, recognition, and modeling of the prominent edges is the key to those two research questions described in the Introduction Section and
Section 2.3. This section elaborates the proposed novel approaches of the visual-geometric synthetic image (VGSI) for selecting the rock mass tracking region involving more edges that are visually prominent and the prominent structural plane (Pro-SP) for the 3D template modeling of fractured rock mass containing prominent edges, as shown in
Figure 10.
Benefiting from the powerful SfM-MVS modeling technology, the realistic visual appearance of real slope surfaces and the high-resolution geometry of the outcropping structural planes can both be reconstructed in a virtual environment, where the precise spatial overlapping of the photo-realistic 3D mesh model and the discontinuity point clouds of the same slope is achievable, and the pose of a virtual camera can be parametrically controlled. The SfM models provide the precondition for the coupled analysis of the visual-geometric information in the synthetic images captured by the virtual camera. However, previous studies that have applied UAV SfM to rock slope modeling and stability analysis have seldom mined the vision information from the photo-realistic model materials mapped onto the mesh geometry, partly because the idea of combining vision-based augmented reality with rock slope remote sensing has seldom been reported and studied.
In this paper, among the rock discontinuities, the term
dominant structural plane refers to a flat and complete surface of which the area is large enough relative to the
Tracking Initialization Rectangle [
2,
20]. Since the point cloud of the rock outcrop was subsampled with the same minimal space between points, based on the point clouds of individual structural planes segmented and clustered, the number of points in each structural plane could represent the relative size of it. The point cloud of the regional rock outcrop within the
Tracking Initialization Rectangle was grouped into six joint sets in
Section 2.3 as shown in
Figure 8 using the approaches in
Section 2.2. Then, dominant structural planes were filtered from all detected structural planes based on the threshold of the minimal number of points, as revealed in the bottom part of
Figure 8.
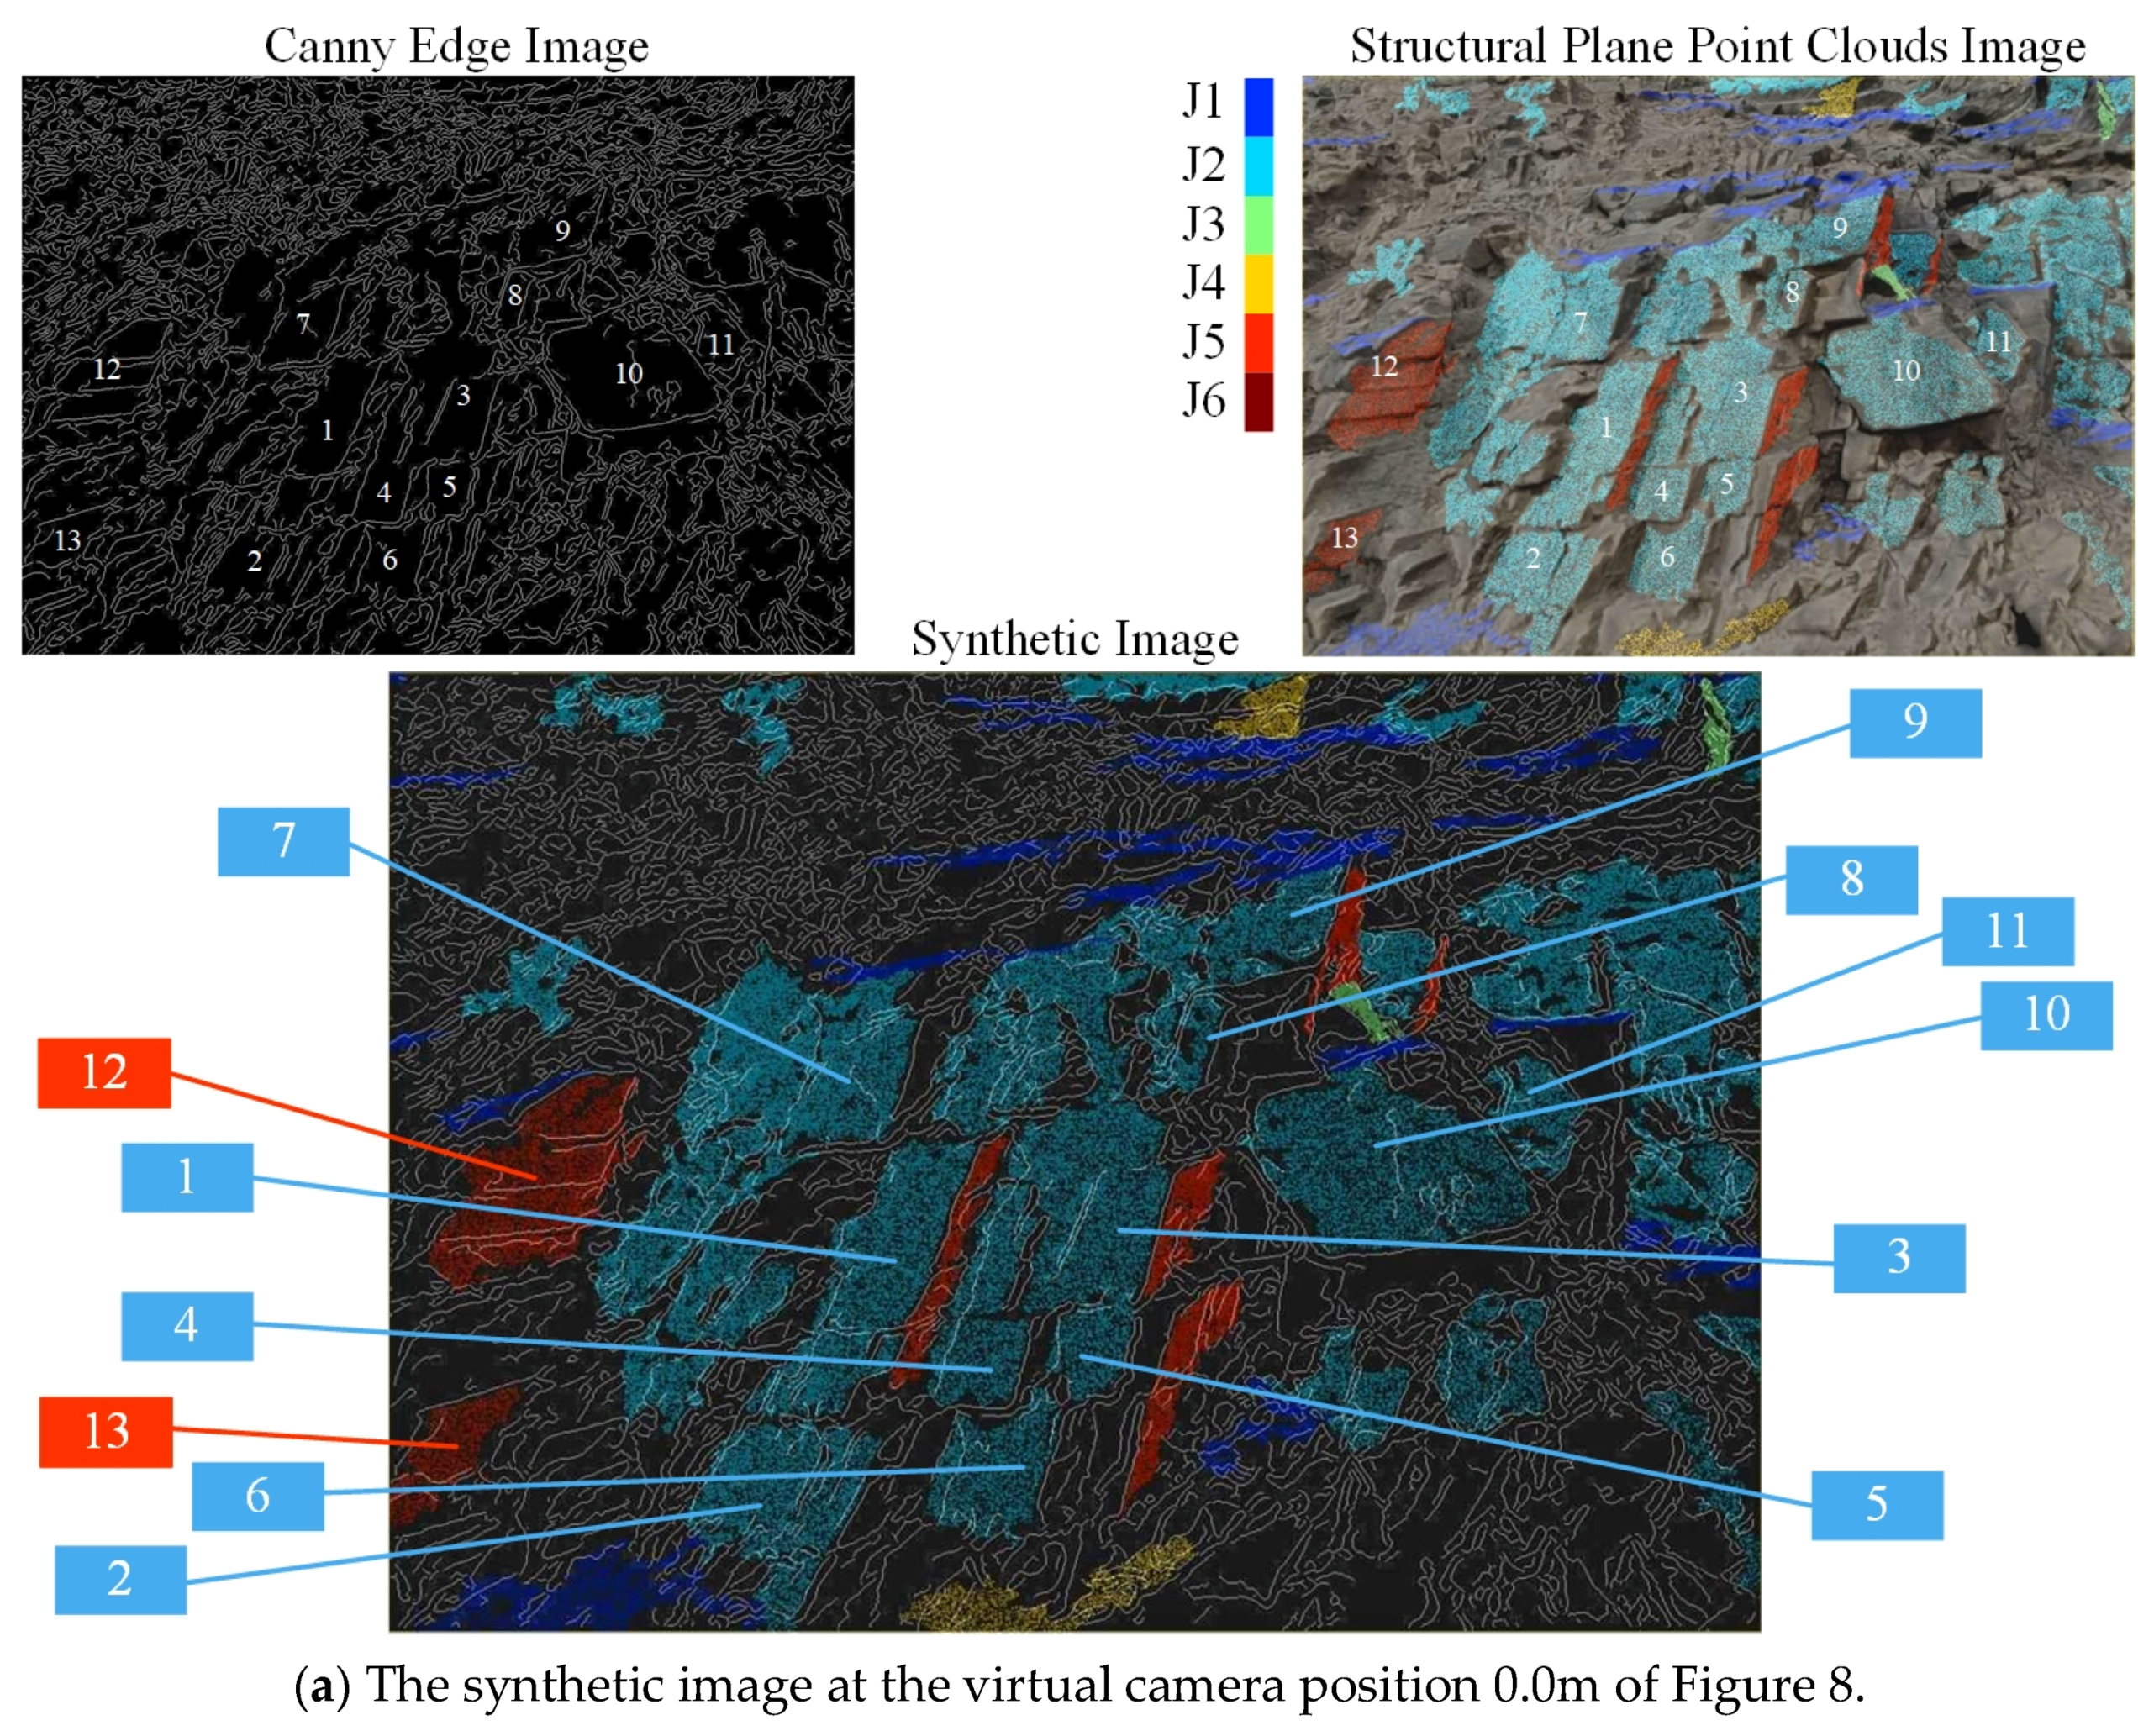
In the proposed VGSI method, from the same position and orientation of a virtual camera, the Canny edge [
48,
56,
57,
58] image detected from rendering the photo-realistic mesh and the perspective projection image of dominant structural planes extracted from the point clouds were overlaid and aligned, resulting in a synthetic image as shown in
Figure 10. Using advanced 3D rendering software, the rendered image in the top left corner of
Figure 10 could achieve a fantastic extent of fidelity when compared with the on-site taken photo in the top right corner of
Figure 10, which can meet the requirements of the following computer vision tasks.
According to the two factors of detected image edges and projected model edges that influence the edge tracking quality as explained in
Section 2.3, three criteria of recognizing
visually prominent edges in a visual-geometric synthetic image are defined as follows:
Criterion 1: Prominent edges should be correlated to dominant structural planes.
The cluttered edges derived from both the structural planes that are relatively too small to the tracking region and the rough slope surface should be excluded. Furthermore, the daylight shadowing edges should also be excluded from the synthetic images. Dominant structural planes can provide useful geometric guidance for recognizing which edges are the traces of structural plane intersections in the Canny edge image. Since the dominant structural planes were 3D expressed by the point clouds filtered with the number of points larger than the threshold, the recognized edges naturally correspond to a relatively large trace length to the tracking region, which makes them visually prominent. In our case study, the threshold for the minimal number of points was semi-automatically adjusted to 1500, according to the relative size of the filtered dominant structural planes to the Tracking Initialization Rectangle.
Criterion 2: Prominent edges should be robustly detectable in the camera image sequences.
The overlapped edges of the dominant structural planes that have large intersection angles with the imaging projection plane, the intermittent edges at the margin of the dominant structural planes that are not sharp enough to be detected as continuous curves, and the cluttered edges derived from the inner fissures, waviness or textures within dominant structural planes should be excluded from the synthetic images since they are not robustly detectable in the camera image sequences.
Criterion 3: Prominent edges should be distinctly extractable from the 3D template model.
The extraction of prominent edges including contour edges and inner edges from 3D template models is a simple geometric process. The contour ones are the edges of 3D meshes, which are effortless to extract wholly, and the inner ones are the edges of mesh faces in the 3D meshes traced along the high curvatures, which can be challenging to wholly extract when the corresponding edges of real rock mass are not sharp enough or when the 3D mesh is oversmoothed.
Then, the terminology prominent structural plane is defined in this paper as the dominant structural plane with edges that are recognized as visually prominent edges in the visual-geometric synthetic images.
In the
Tracking Initialization Rectangle magnified in
Figure 8, the relatively most tracking-suitable rock mass was searched using the visual-geometric synthetic images captured by the virtual camera. The orientation of the virtual camera was fixed, and the location of the virtual camera could only be moved along a horizontal line segment path. When the observer is faced at the main slope surface, the midpoint of the line segment was denoted as “0.0 m”, at which position the purple pyramid representing the camera sight is magnified in
Figure 8; the right hand of the midpoint was denoted with positive distances and the left side with negative distances. In this way, a series of synthetic images were generated.
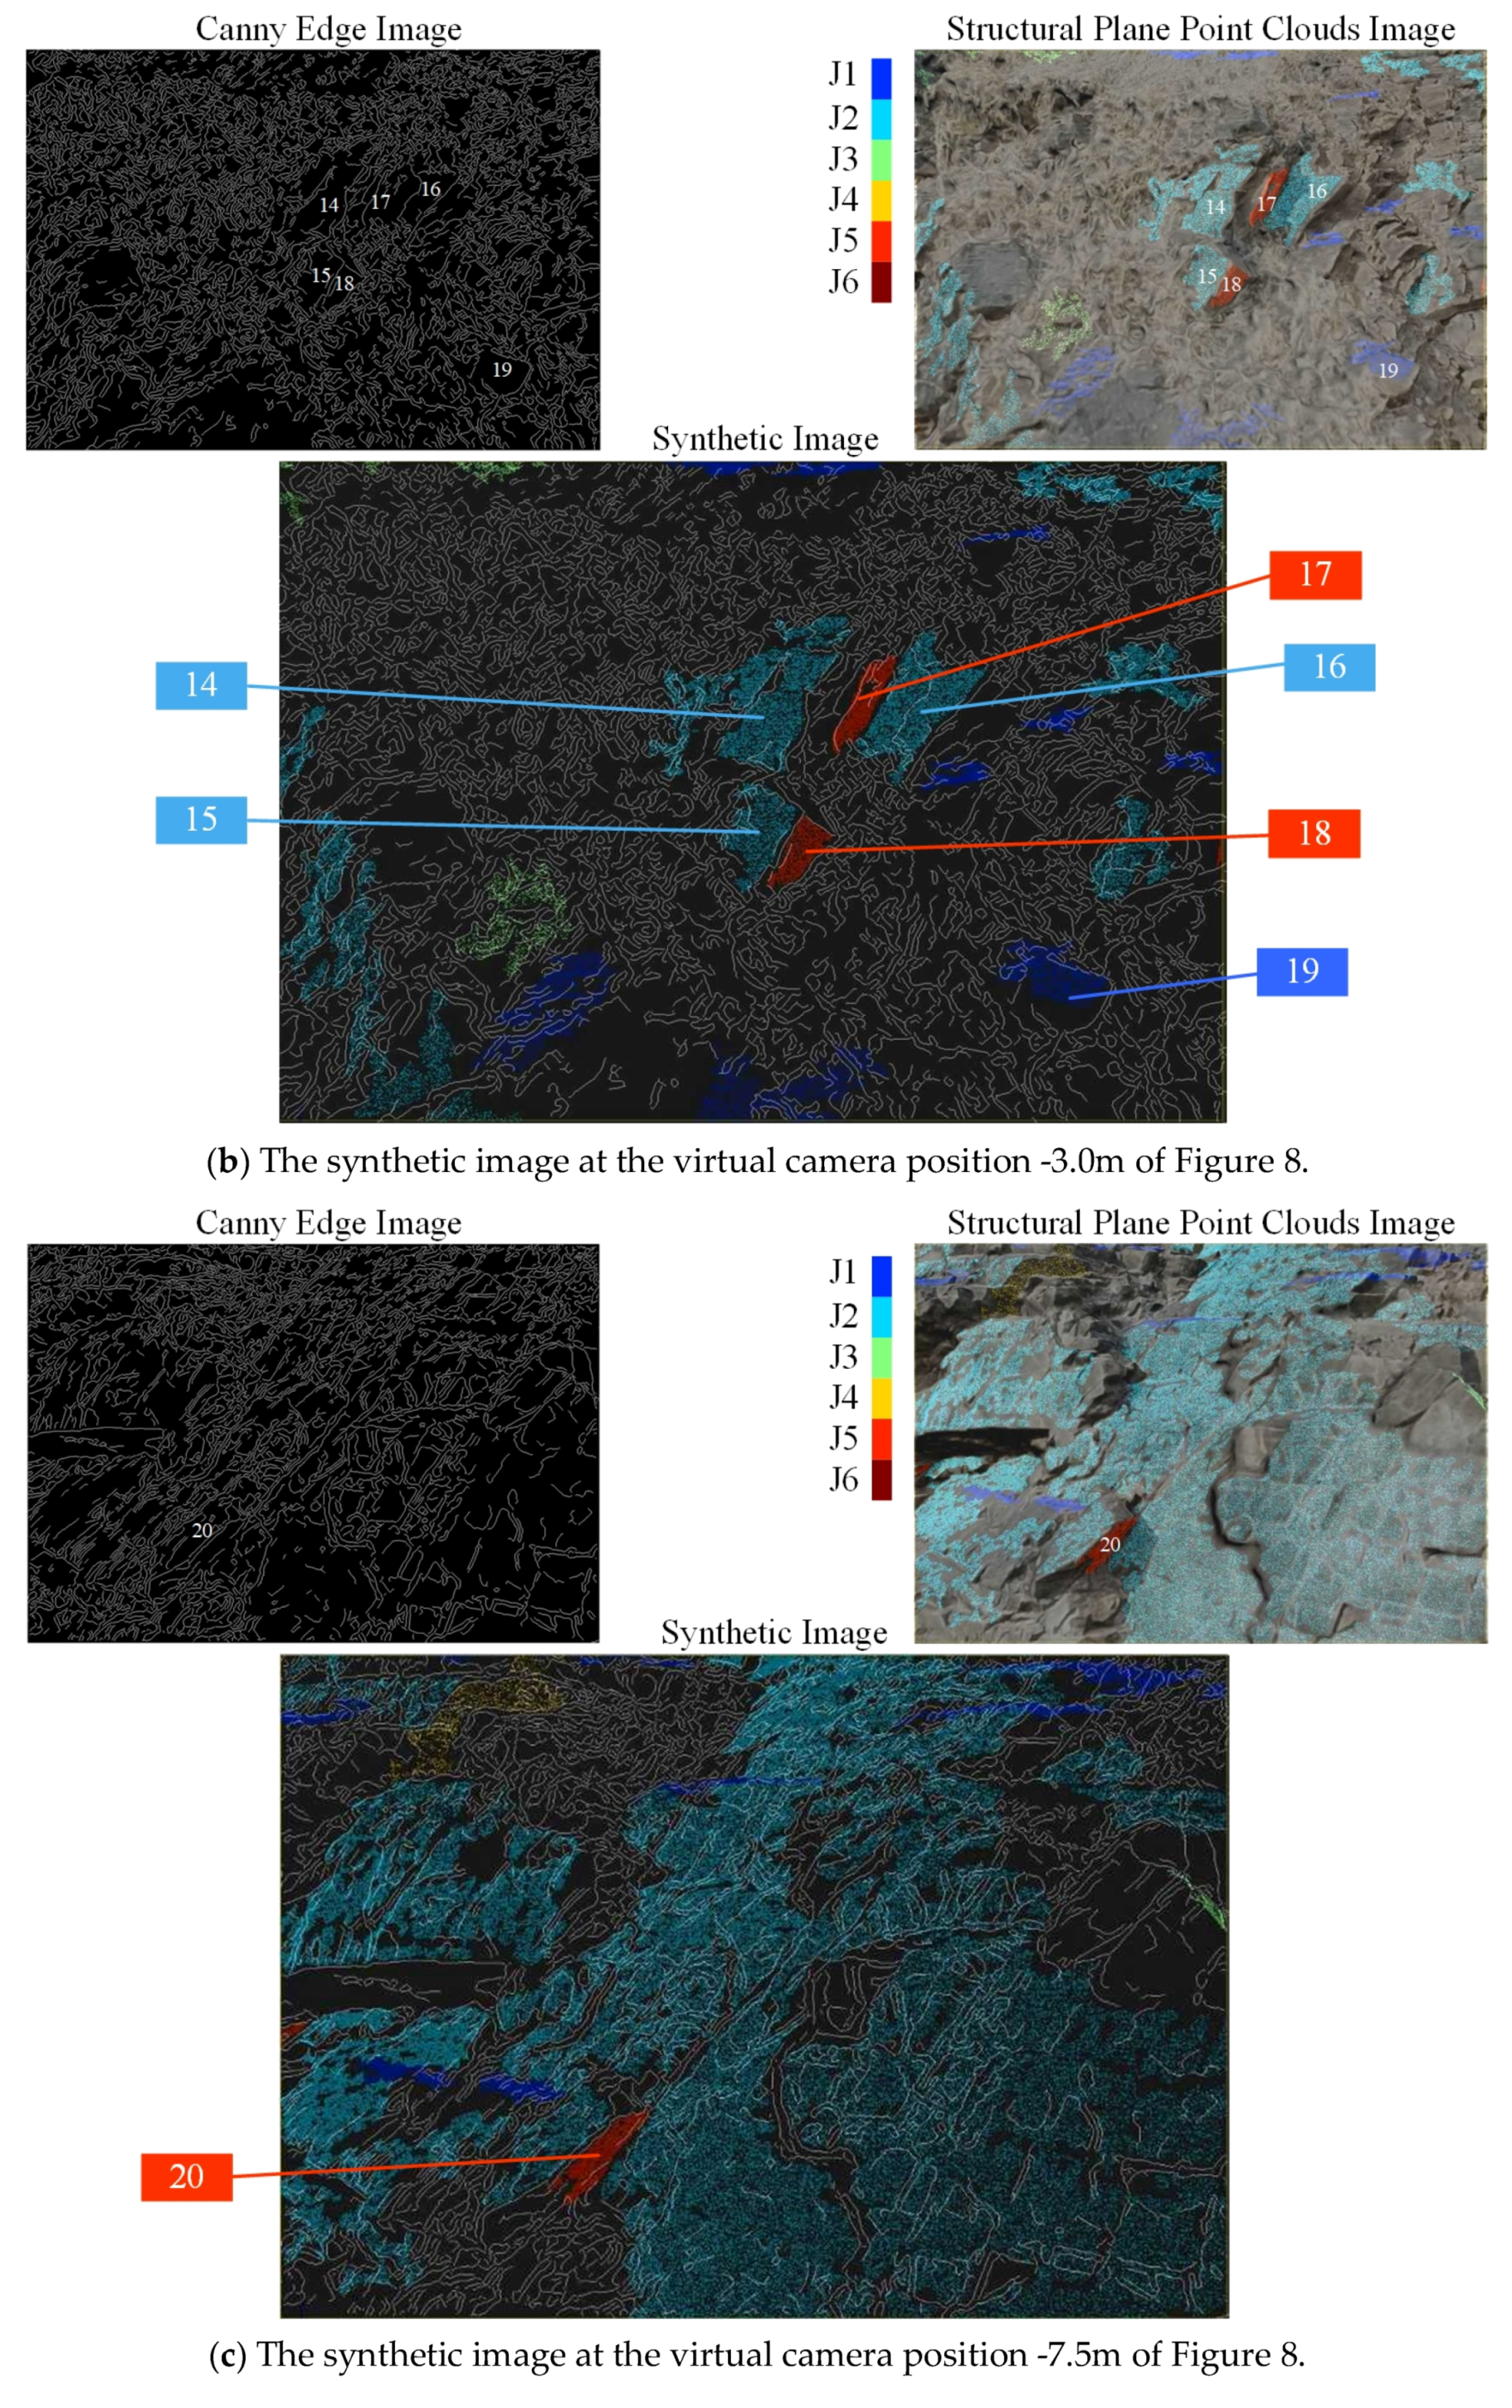
Figure 11 displays some of the synthetic images at different positions on the camera path to reveal the difference in visual-geometric characters of the fractured rock mass. According to Criterion 1 and Criterion 2, to recognize visually prominent edges,
Figure 11a shows a superior candidate camera position where more than 10 prominent structural planes were identified, which were mainly distributed in the middle and bottom part of this synthetic image. The top left corner of
Figure 11a reveals some cluttered edges of small structural planes, and the top right corner of
Figure 11a indicates some overlapped edges of structural planes almost perpendicular to the screen. In contrast,
Figure 11b,c show inferior candidate camera positions with only a few structural planes that are not ideal for edge tracking.
Figure 11b is almost covered with the cluttered edges of a rough slope surface isolating several dominant structural planes, and conversely,
Figure 11c is almost covered by one single dominant structural plane of which the edges are not sharp, but the inner fissures and waviness generate much clutter. Finally, after a comparison of all the candidate positions in this case study, we selected the 0.0 m position on the camera path as the initialization camera pose and the corresponding part of the rock mass in the synthetic image of 0.0 m as the edge-based tracking region.
Subsequently, the proposed Pro-SP method focused on the local part of the rock mass within the intersection volume between the slope surface and the camera sight pyramid, i.e., the rock mass within the purple pyramid in
Figure 8, which corresponded to the selected VGSI
Figure 11a in this case study. The Pro-SP strategy extracts the prominent structural planes as the 3D template model including the following steps: the joint sets’ extraction from slope point clouds, individual structural plane clustering and dominant structural plane filtering from the joint sets’ point clouds, visual-geometric image synthesis and prominent edge recognition, and corresponding prominent structural plane extraction from the 3D mesh. The Pro-SP template model in the case study is presented in the bottom right corner of
Figure 10, where 10 prominent structural planes belonging to joint set 2 at the center of view in
Figure 11a were extracted
2.5. Kinematic Analysis of Rockfall Susceptibility
When calculating a rockfall susceptibility map at the cliff scale, the slope surface topography and the characterized fracture patterns measured from the 3D point cloud data can be utilized to search the geometries that serve to destabilize rock mass. The analysis process of rockfall susceptibility can be divided into two steps: the kinematic test and susceptibility index calculation.
In the kinematic test stage, the normal vector to every point of the rock slope point cloud is first calculated concerning its neighboring points. Then, the dip direction and dip of every point is obtained, and the overhanging areas of the cliff are identified, as shown in
Figure 12. As a rule of thumb, the volumes located above the overhanging regions are less stable given the lack of support at the base. Accordingly, it is indispensable to take the overhanging areas into account in the field investigation and susceptibility analysis, where the utilization of the UAV SfM or ground-based remote sensing approaches is mandatory to overcome the occlusion problems of airborne acquisitions, and the kinematic failure mechanisms of overhanging conditions need to be separately considered. Subsequently, a well-known kinematic test can be conducted by a comparison between the orientations of the main joint sets and the local cliff areas to find out where planar, wedge and toppling failure is geometrically possible.
Planar failure:
For normal slopes (dz > 0), the point P where a planar failure mode is possible must satisfy geometric conditions for values of the dip direction (
) and dip (
) of joint sets
i:
and
where
is the dip direction of a given point P,
is the slope angle of the topography at the given point P, and
t is the tolerance of the dip direction. The tolerance
t is set to 20° in our case study.
For overhanging slopes (i.e., non-normal slopes, dz < 0), all the possible slope steepness is risky to a planar rockslide, so only one condition is demanded [
2]:
Wedge failure:
A wedge failure is generated by two joints, respectively labeled
i and
j. For normal slopes (dz > 0), the point P where a wedge failure mode is possible must also satisfy geometric conditions for values of the trend (
) and plunge (
) of the wedge axis:
and
For overhanging slopes (dz < 0) [
2]:
Toppling detachment:
For normal slopes (dz > 0):
and
For overhanging slopes (dz < 0) [
2]:
At this point, for each rock compartment of the slope at the cliff scale, we know whether a particular failure mechanism attributed to a given joint set (or a couple of joint sets, for wedge failures) is geometrically possible, but the differences in the quantitative values of failure probability further need to be revealed. Then, the rockfall susceptibility is calculated in these rockfall prone areas to define the slope areas with the orientations most favorable to rockfall. The planar, wedge, and toppling rockfall susceptibility indexes proposed in [
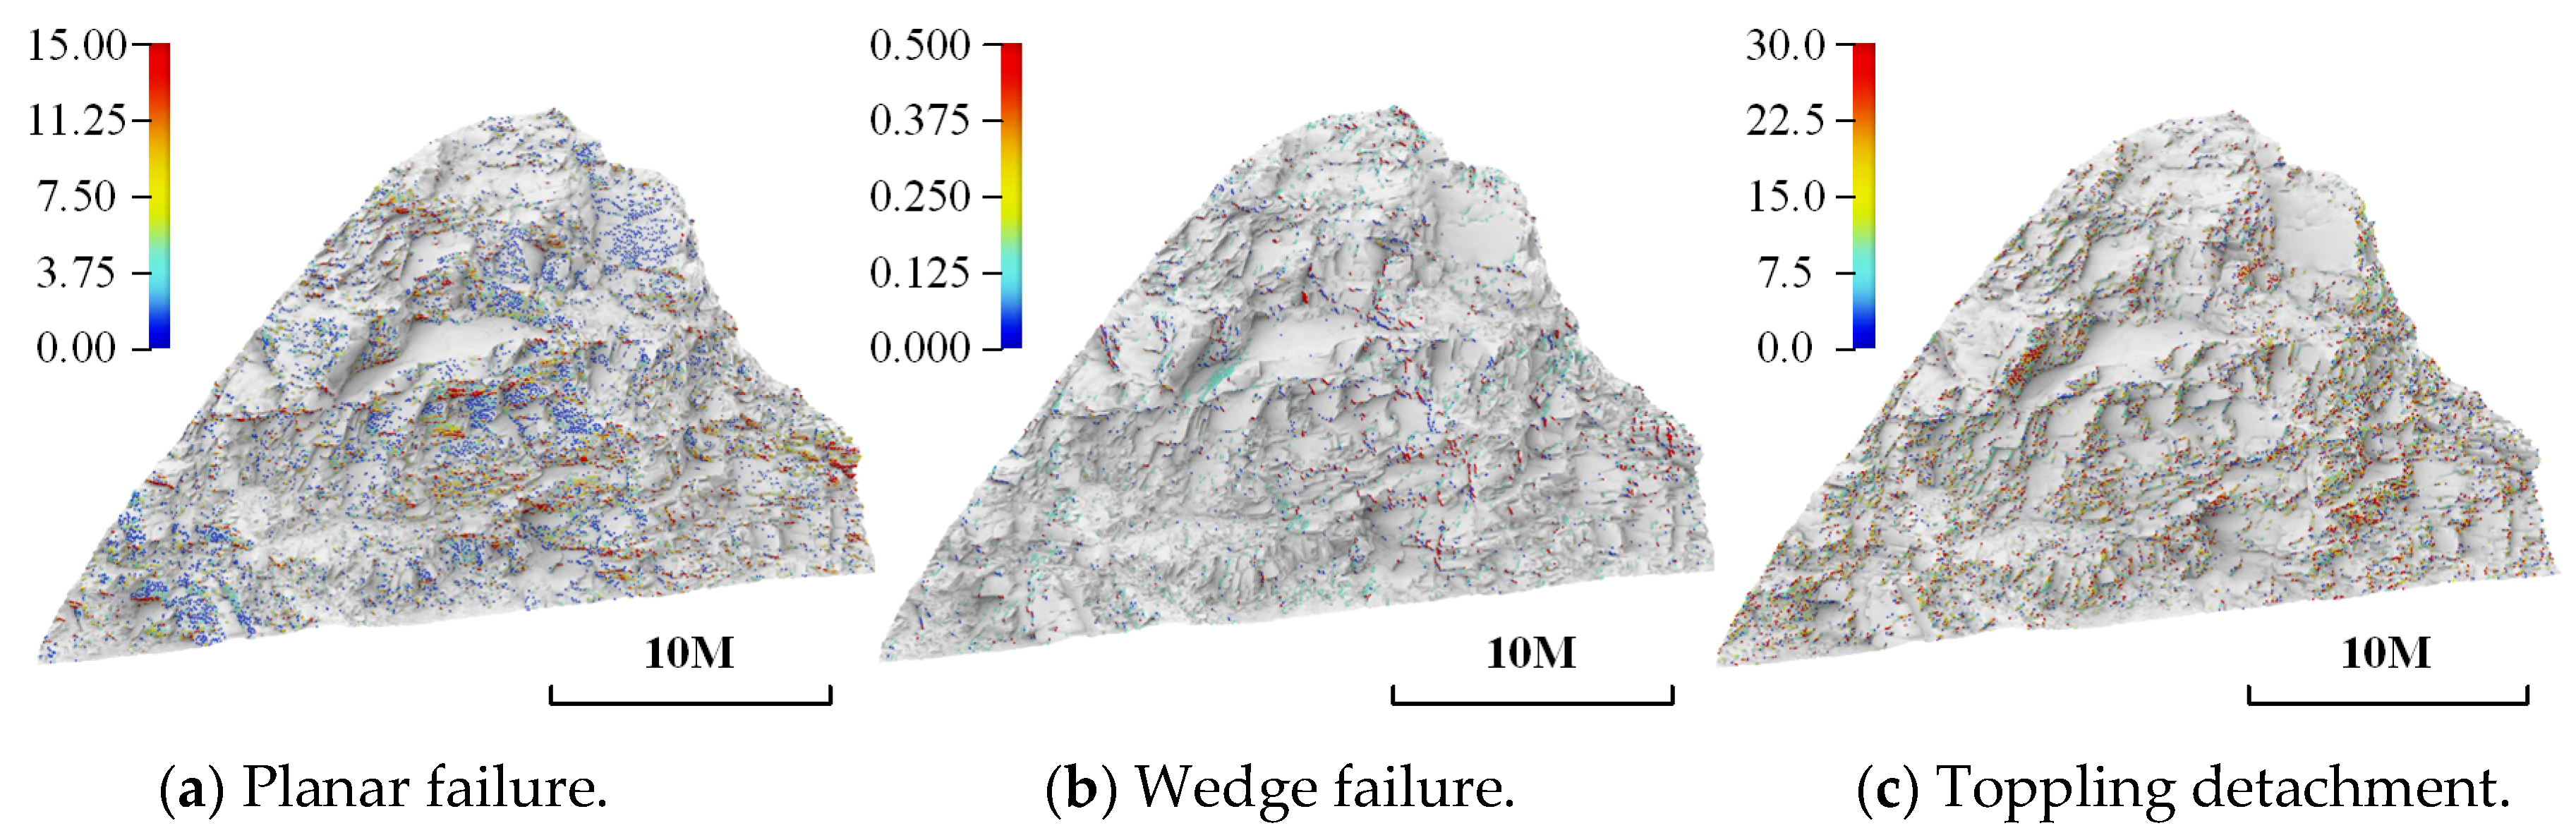
2] were adopted in this study, where the susceptibility equations are defined based on the interaction between the occurrences of discontinuities and the occurrences of local cliff, which respectively treat individual conditions for normal and overhanging slopes and consider the parameters including the average spacing and average persistence of each joint set, the mean incidence angle between the joint set (or wedge axis) and the slope surface, the mean slope angle of each joint set (or wedge axis), and the angle between the two joint sets when dealing with the wedge failure. Finally, each point in the three-point cloud sub-groups in
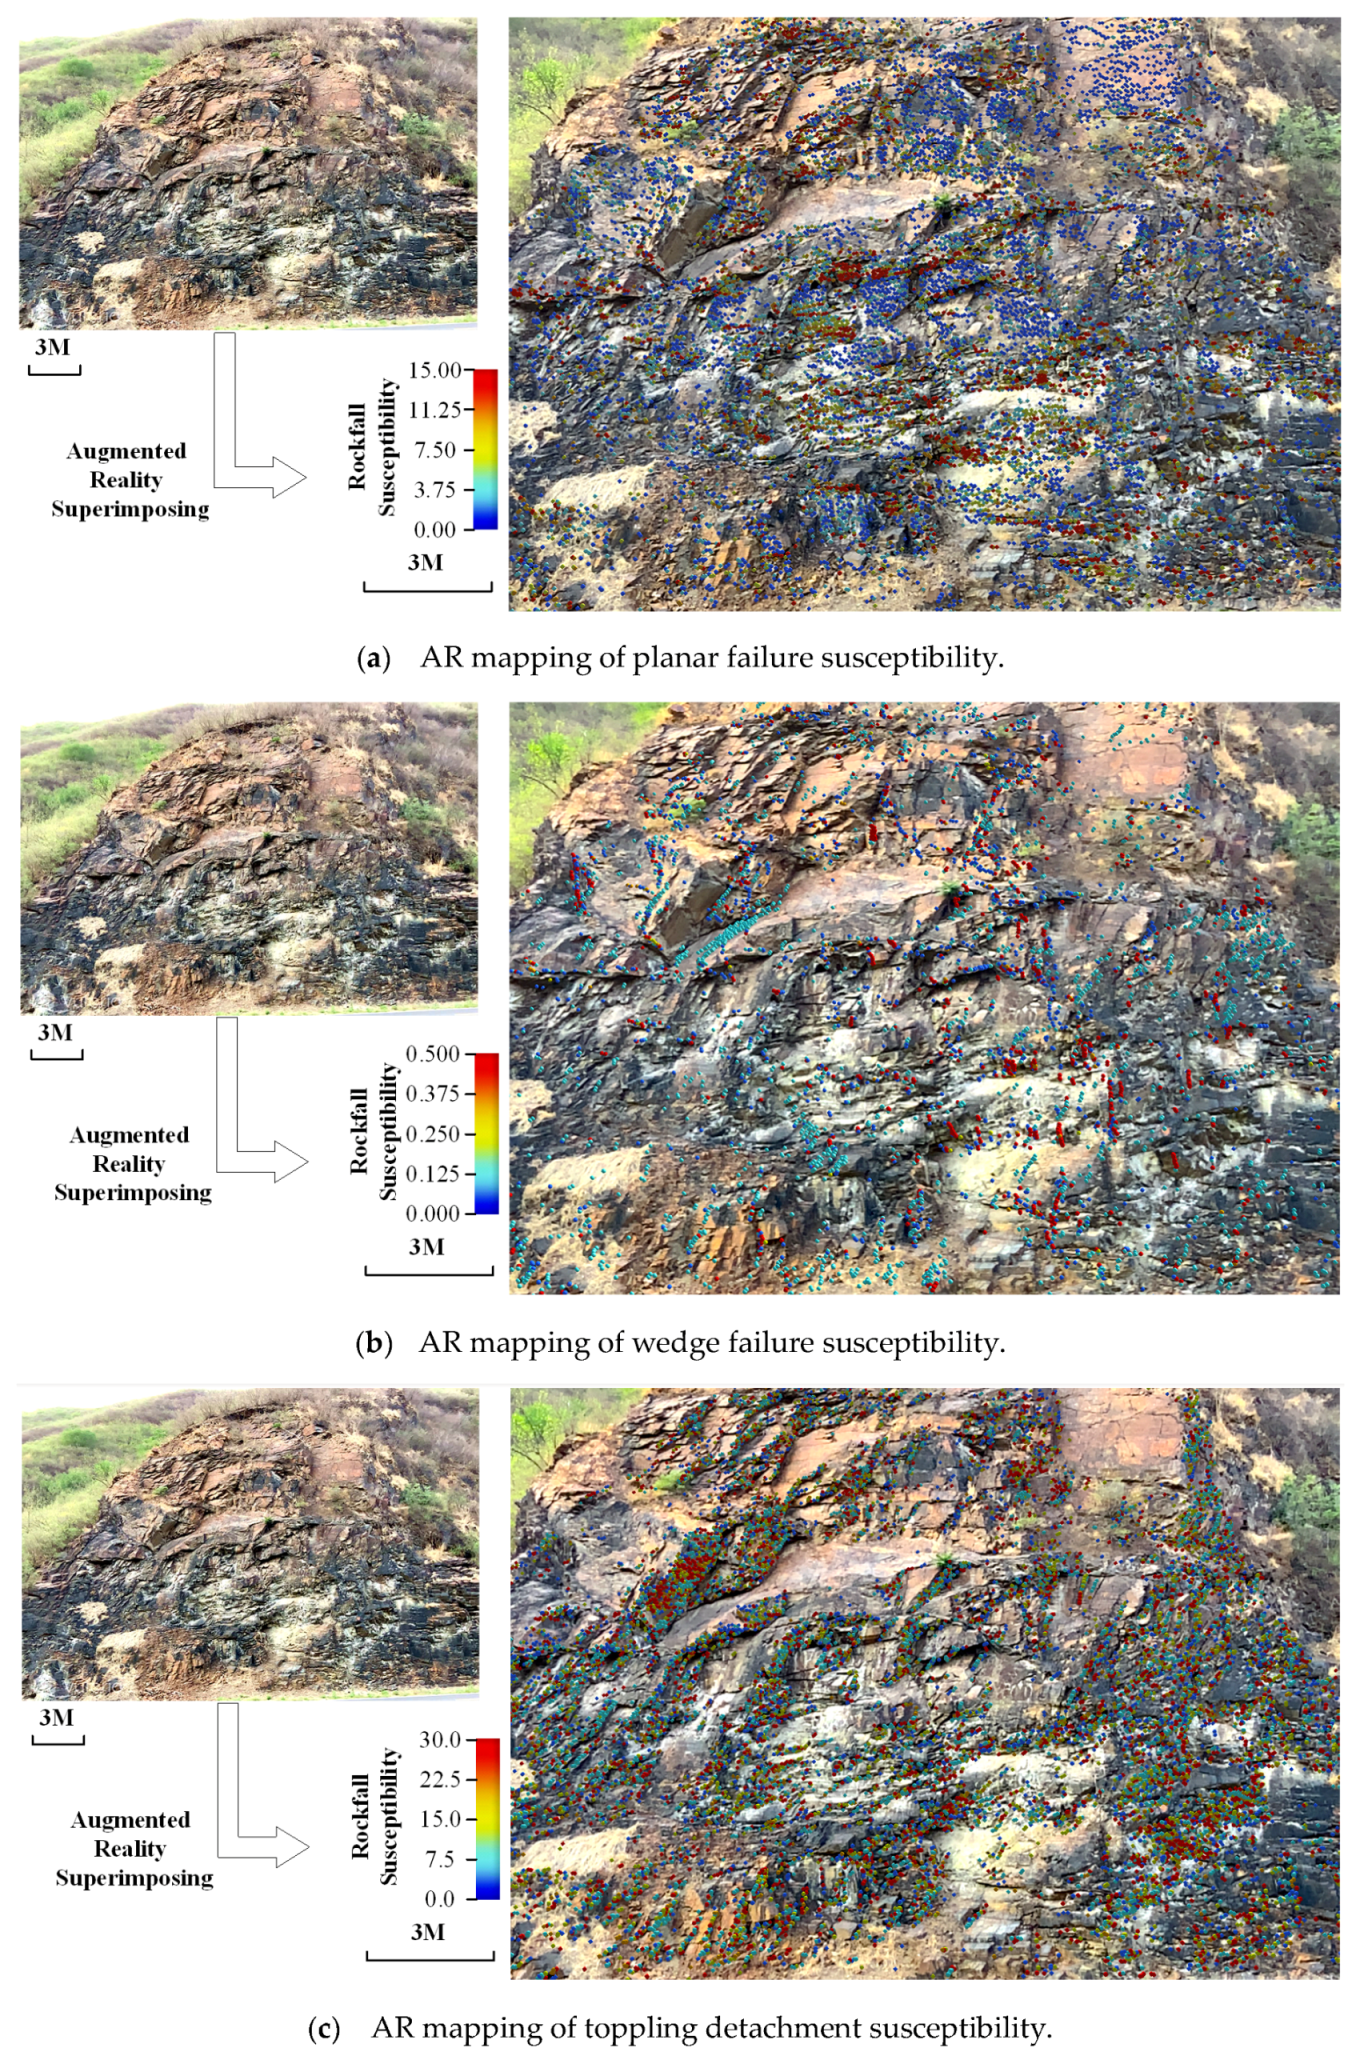
Figure 13 was colored according to the calculated rockfall susceptibility index value yielding three susceptibility maps, which were further AR visualized on the corresponding real slopes in
Section 3.2.
2.6. Rock Slope Information AR Superimposing
Based on the methods above, the process of mobile AR superimposing of rock slope information can be explained as follows. First, video streams of a rock slope was captured using the built-in camera of a mobile device. Then, the relative six-degree-of-freedom poses of the camera to the rock slope was calculated in real-time based on the approaches presented in
Section 2.3 and
Section 2.4. Next, the real rock slope, the corresponding virtual 3D point clouds captured by UAV SfM, and the camera were put in the same local coordinate system, where the real rock slope and the virtual 3D point clouds could naturally overlap with each other, and the camera could capture and render this overlapping. Finally, the 3D point clouds, that conveyed the information of join sets obtained in
Section 2.2 and rockfall susceptibility obtained in
Section 2.5, were superimposed onto the rock slope in these video streams displayed on the screen of the mobile device. The superimposed rockfall susceptibility maps of planar failure, wedge failure, and toppling detachment using mobile augmented reality based on the proposed rock mass 3D template modeling and edge tracking method are shown in
Section 3.2.
4. Discussion
The proposed methodology of augmented reality mapping based on rock mass tracking could establish a cyber-physical fusion of geoinformation in the specific scene of rock slope hazard management. On one side, based on the UAV-SfM modeling, the physical cliffs were photo-realistically reconstructed, from which extremely detailed geometric-visual information of rock mass could be explored in the 3D cyberspace just like the on-site survey. On the other side, massive amounts of cyber information, e.g., rockfall susceptibility maps studied in this paper and rockfall simulation results in future research [
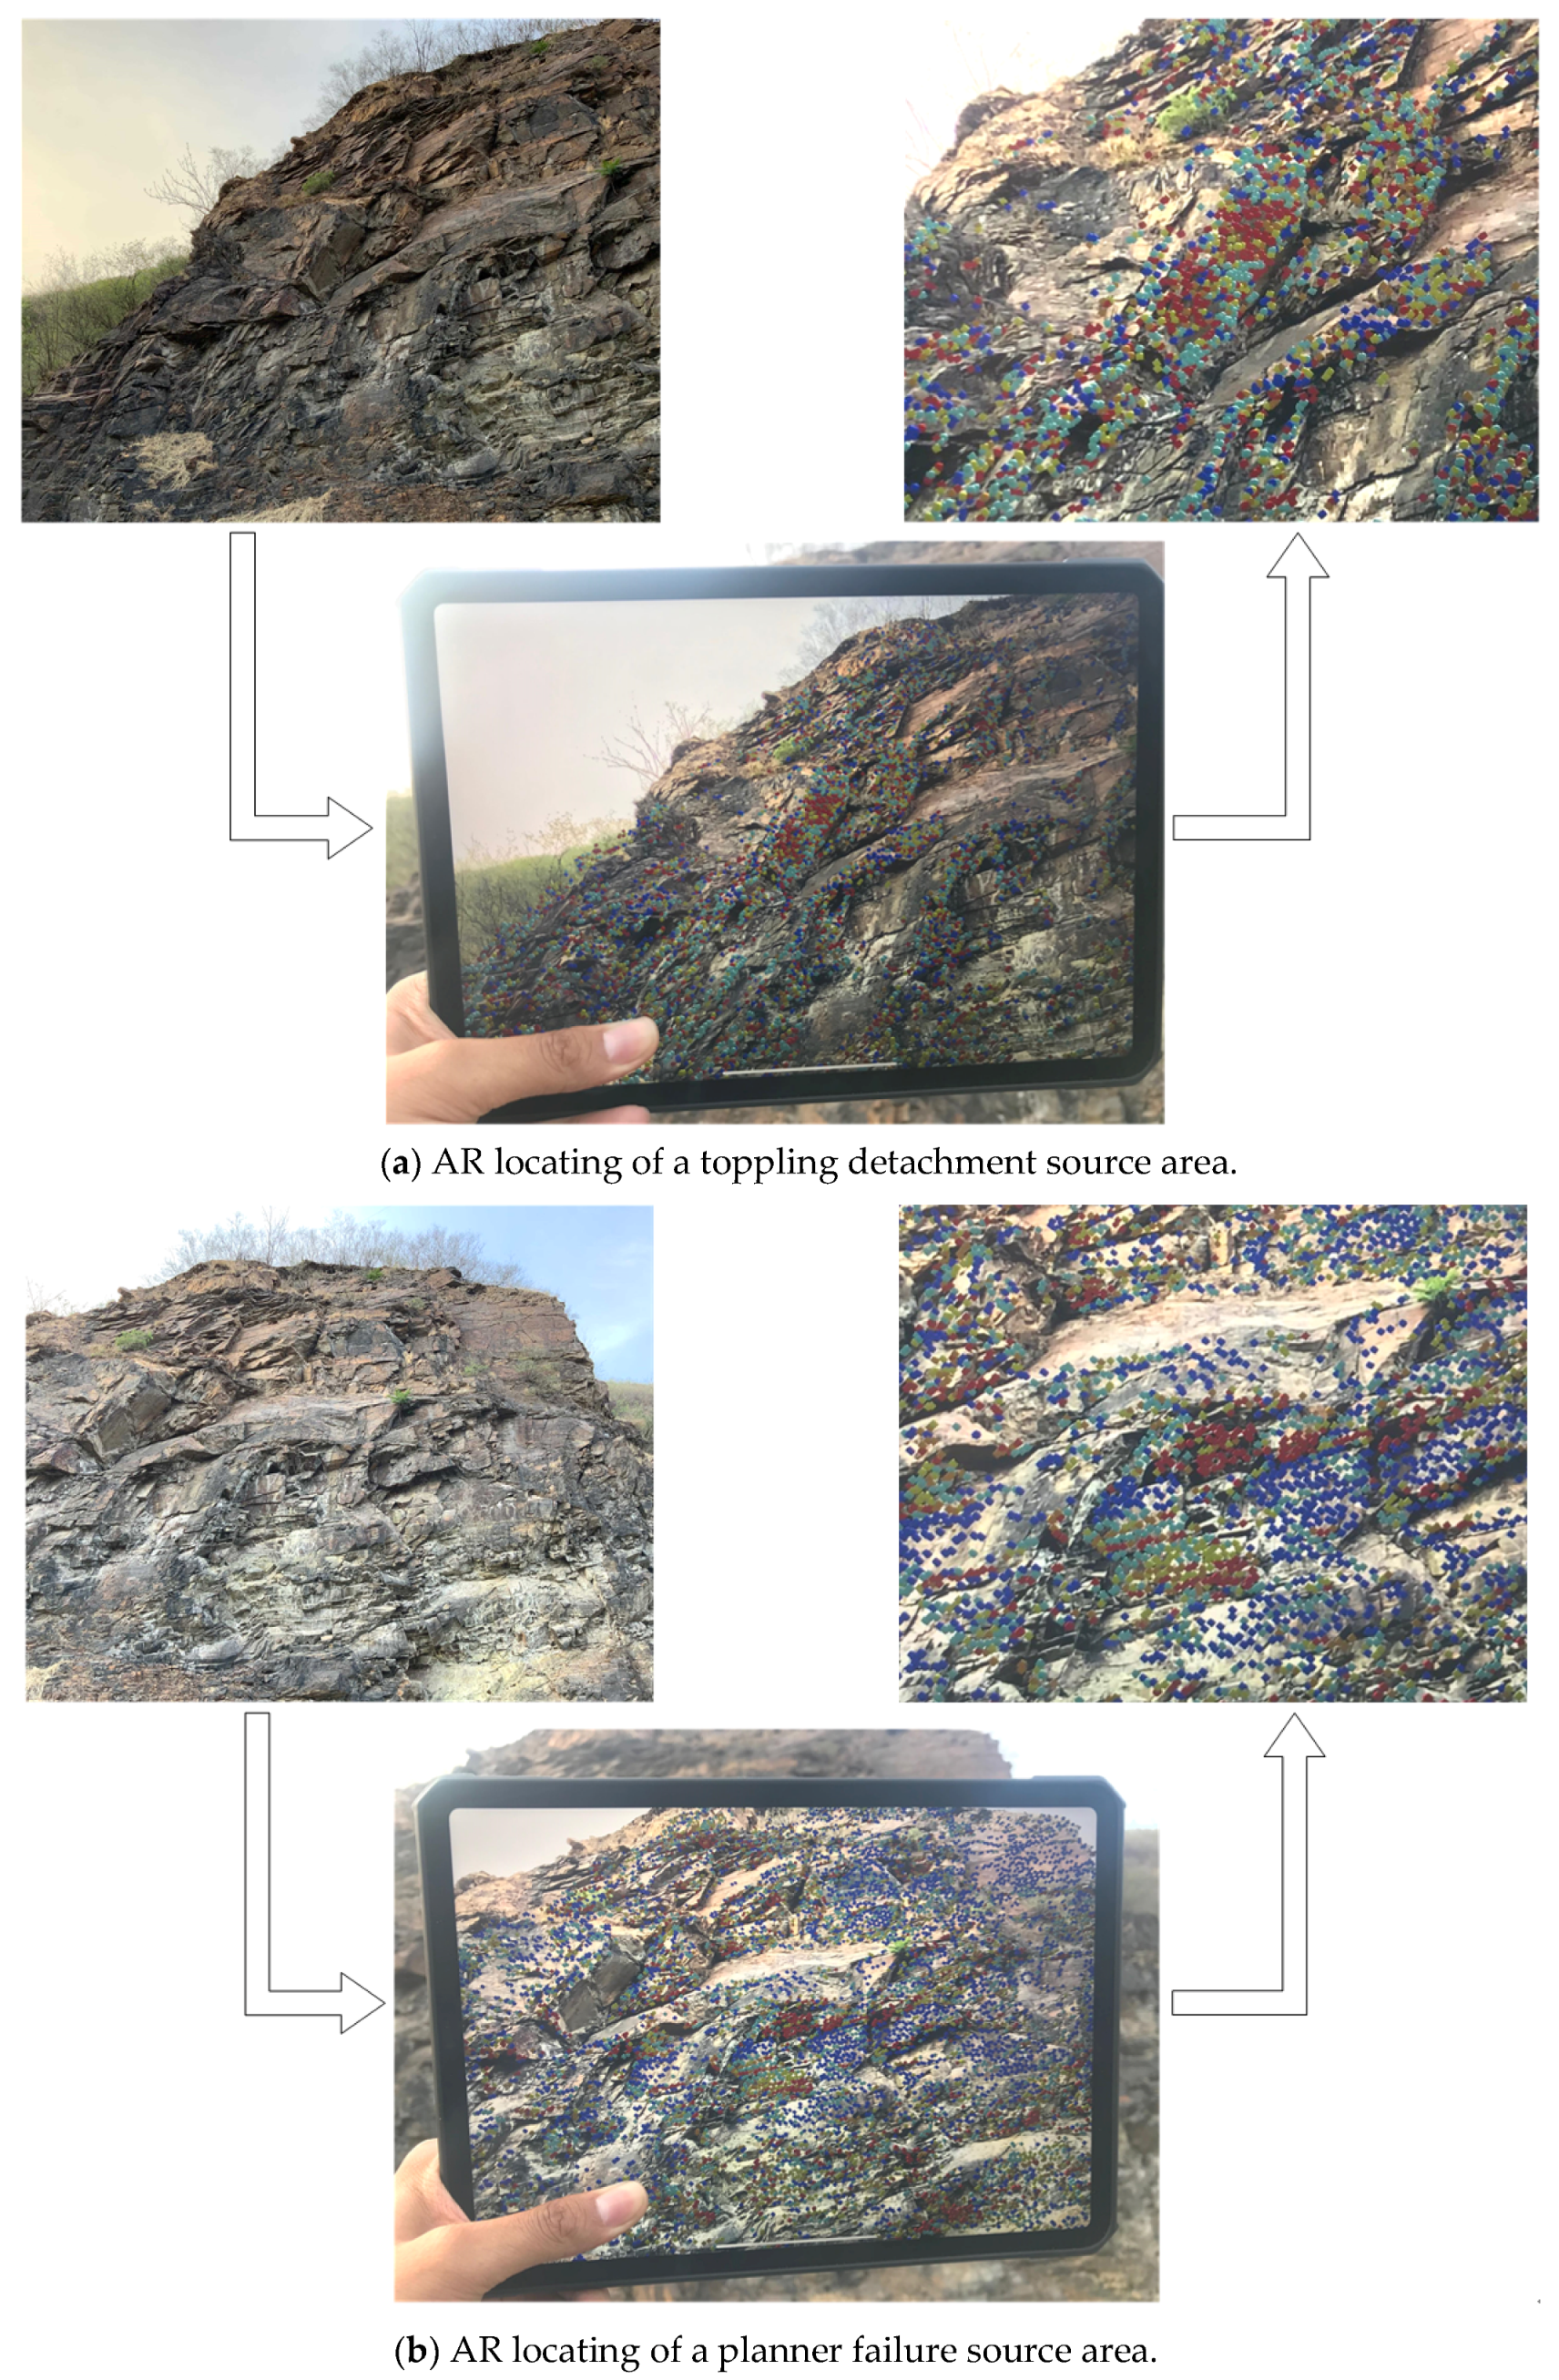
20], could be embedded into the physical cliffs and extracted based on the visual features of rock mass by taking advantage of the context-aware augmented reality. Some of the potential users of such a tool could be the staff involved in rock slope hazard management. For example, a geological investigator can accurately locate the critical rockfall source areas on the rock slopes based on the primary investigation during on-site inspection, and can better plan the further detailed fieldwork that is directly targeted on the most dangerous rock mass. A designer will be able to preview the simulated rockfall damages and compare different slope supporting designs in the real slope environment. In addition, the constructors guided with the augmented reality information of slope supporting construction will benefit from more efficient communication based on the construction information models.
There are many different strategies and paradigms of augmented reality, among which the most suitable approach for the realization of rockfall AR mapping was explored in this paper. First, considering the large-scale outdoor scene of slope fieldwork, the vision-based mobile AR technology was selected, which could perceive a broad enough range, flexibly adjust perspectives and ensure rendering effects in outdoors. Furthermore, to settle the critical problem in mobile AR of camera pose estimation in the rock slope context [
64], the model-based markerless tracking method was adopted which directly recognized the real slope rock mass, and the Simultaneous Localization and Mapping (SLAM) was used for assisting extended tracking. The advantages of this method include relative high overlapping accuracy, compact interaction process, and good feasibility and scalability without the workload of fiducial marker arrangement. Finally, to establish the 3D template model of rock mass target for model-based tracking, based on the Unmanned Aerial Vehicle (UAV) oblique photogrammetry and Structure-from-Motion & Multi-View-Stereo (SfM-MVS) 3D reconstruction, this paper proposed the novel methods visual-geometric synthetic image (VGSI) and prominent structural plane (Pro-SP).
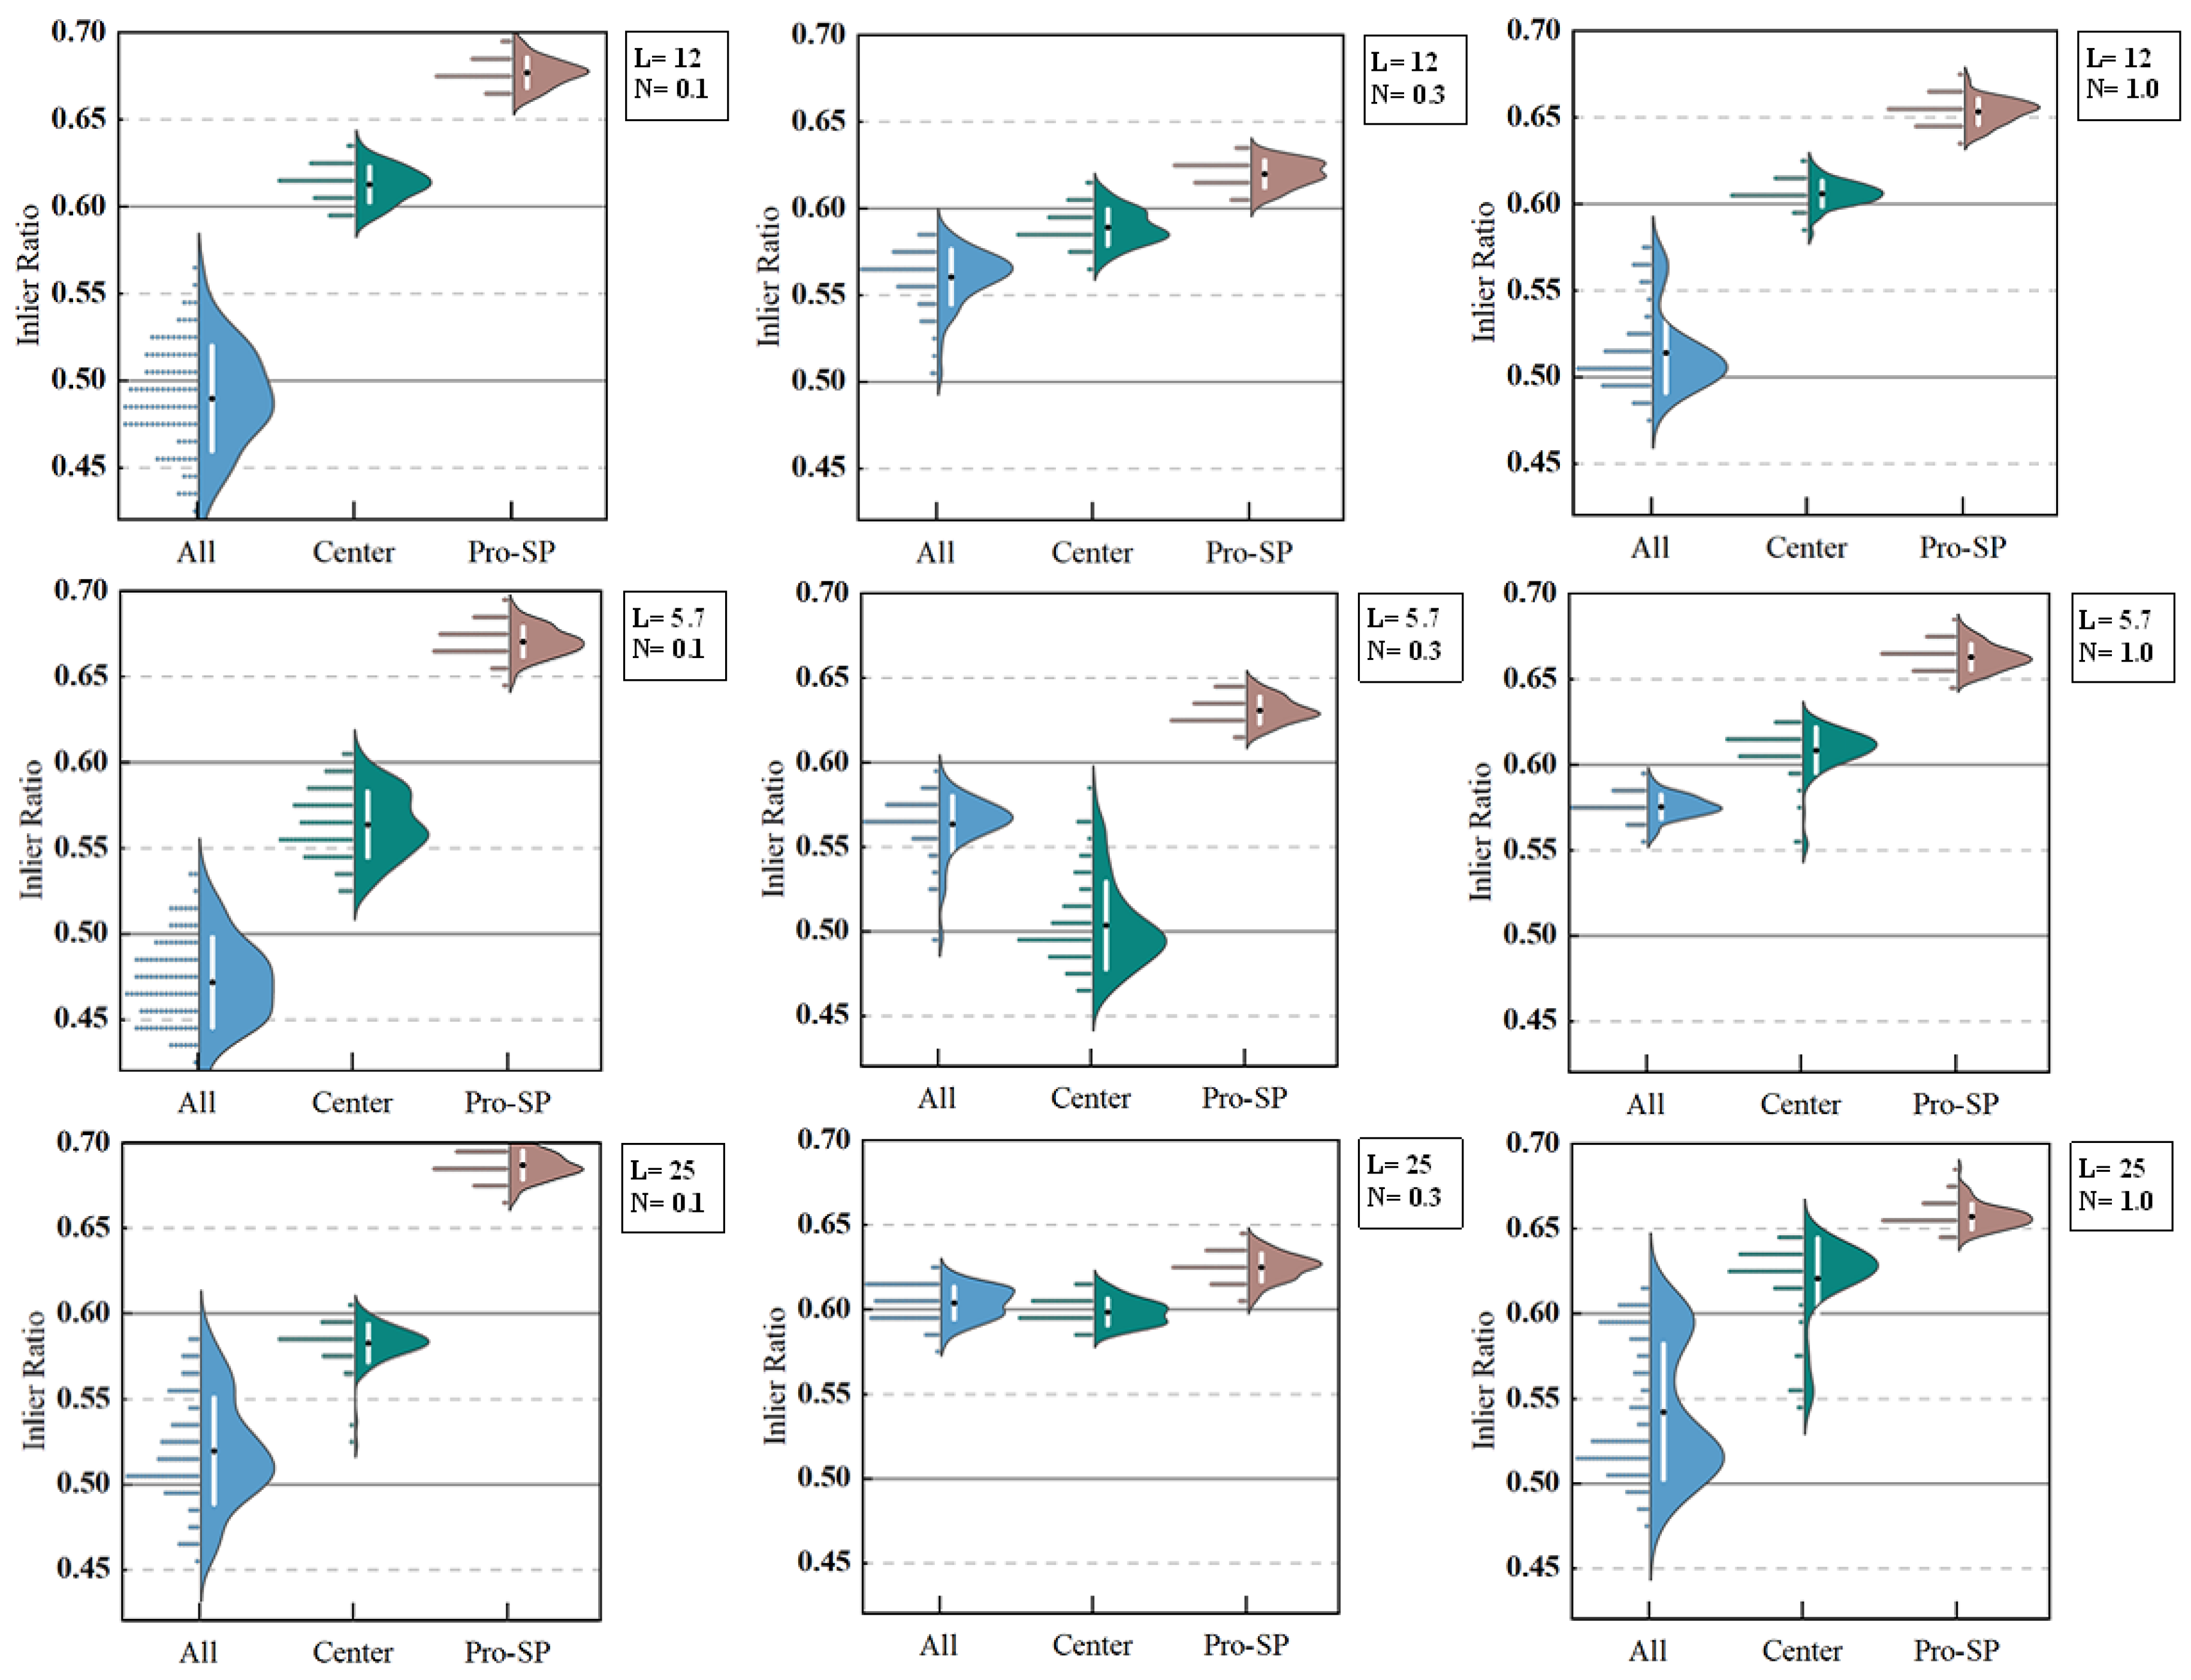
The comparison of the three template modeling strategies in
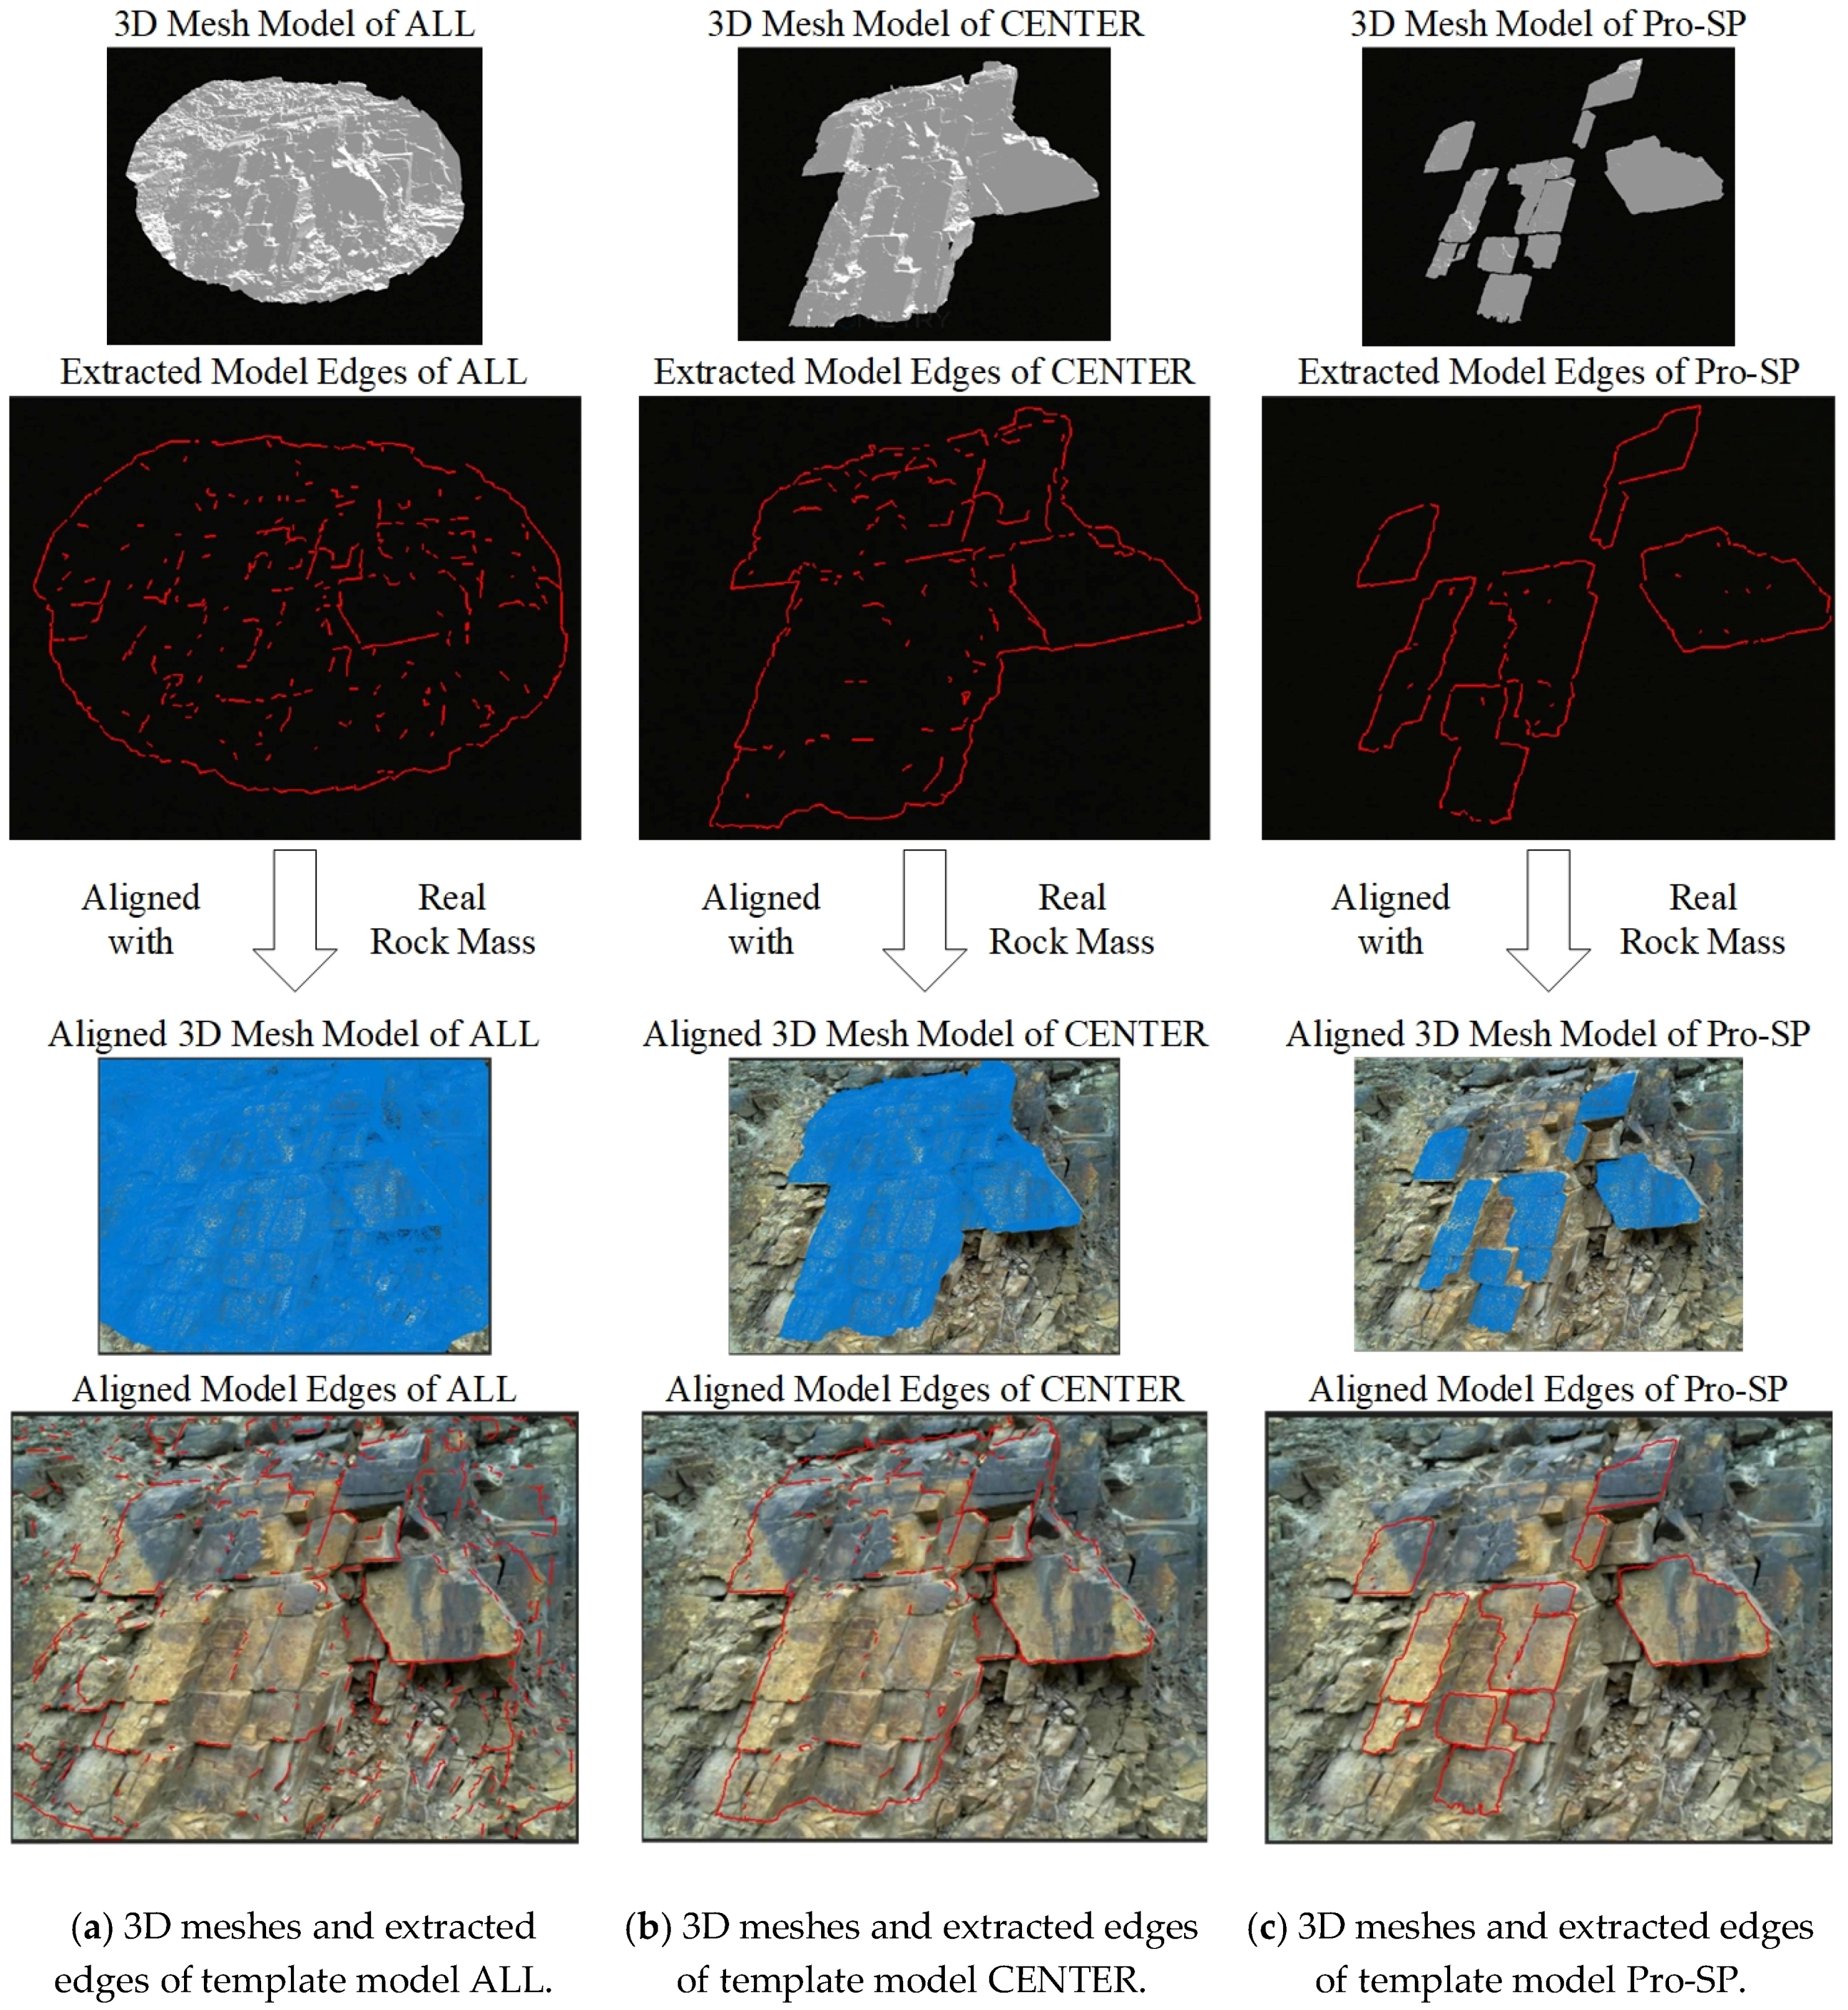
Section 3.1 are further discussed as follows:
When dealing with the specific rock mass target, the template ALL often resulted in poor tracking quality, and sometimes even the initialization of tracking could not be launched. According to Criterion 1 of recognizing visually prominent edges, many bad edges that were not correlated to the dominant structural planes were also extracted from the template model ALL, and further projected and matched with the image edges, which decreased the tracking quality. Furthermore, the manually defined contour edges did not exist in the real slopes, as revealed in
Figure 15a, which confused the edge matching.
The template CENTER could, to some extent, overcome these two drawbacks of template ALL. However, even so, according to the Criterion 3 of recognizing visually prominent edges, the preferred edges were contained as inner edges of the 3D template mesh, which could suffer from incomplete extraction depending on the curvature and smoothness of the mesh surfaces.
Conspicuously, the Pro-SP template model excluded the mesh faces and edges that were not correlated to dominant structural planes and conveyed preferred edges as mesh contours that could be distinctly extracted, which could meet Criterion 1 and 3. Moreover, the Pro-SP also considered Criterion 2 in the VGSI analysis and further excluded the dominant structural planes without prominent edges, such as the ones almost perpendicular to the screen in
Figure 11a, and the ones rounded with blunt edges that were not sharp enough (
Figure 11c). From the perspective of prominent edge criterion, the proposed Pro-SP overcame the shortcomings of the ALL and CENTER strategies.
Different from the indoor lighting in industrial AR applications, the lighting conditions of outdoor AR inspections of rock slopes is controlled by sunlight, which keeps changing during the daytime. In this scene, the edge alignment method can be a more suitable selection for AR tracking realization, because edge alignment abstracts an image as edges with stable distributions and it is naturally robust against the changes in the sunlight conditions, which is not necessarily true of approaches that consider the internal pixels [
29,
65,
66]. The result of the validation test in
Figure 17 further demonstrated that the AR tracking based on the proposed template modeling method could maintain a good performance during daytime, which could effectively guarantee its practicability in actual fieldwork.
In the workflow of the proposed AR inspection of rock slope, although the AR initialization process explained in
Figure 9 had some limitations, it turned out to be feasible and effective in on-site realization practice. The initial edge tracking will not start anywhere on the rock outcrop. Instead, only the selected local region of the slope rock mass will be recognized from a predefined camera pose, so users need to appropriately adjust the pose of their mobile devices to align the edges and trigger the AR tracking and further inspection. As elaborated in
Section 2.3 and
Section 2.4, not every part of the slope rock outcrop is suitable for edge tracking initialization. First, recognizing the local rock mass at a very high position of the cliff or just the whole cliff is usually impractical, since the movement of the mobile devices in the hand of a human observer can only change the relative pose of the camera to the towering cliff target in a very limited range, and setting a suitable predefined initial pose for edge alignment becomes tricky. Second, although the surface of the slopes with rockfall risk generally outcrop fractured rock mass, which presents strong visual edge features at the intersections of structural planes, some other parts of the outcrop have an irregular morphology with weak visual edge features. Our AR initialization strategy simplified the first problem by introducing two hypotheses (explained in
Section 2.3) to confine the slope rock mass targets for edge tracking to a local rectangular region, referred to as the
Tracking Initialization Rectangle (
Figure 8), which had a similar altitude and scale with the observers. In practice, the predefined camera pose can be easily reached with the edge aligned. Furthermore, to solve the second problem, we developed the VGSI and Pro-SP methods to select candidate tracking regions with strong edge features. In our case study, we adopted one of these candidate tracking regions, as shown in
Figure 11a, which also corresponded to the slope rock mass within the purple pyramid camera sight magnified in
Figure 8. One initial tracking region was enough for our case, while the adoption of multiple candidate tracking regions of rock outcrop within the
Tracking Initialization Rectangle will undoubtedly increase the flexibility of AR inspection, which deserves further research.
In our case study, the latest AR inspections were performed more than four months after the initial UAV acquisition, and the tracking performance was still good. The proposed method appeared to be relatively robust to the time span between the SfM modeling and the model-based tracking, under the precondition that the slope deformation of rock mass selected as the tracking target was hardly apparent. However, in other cases where a considerable slope deformation or even rockfall occurred in the tracking region, the initial SfM-derived template model could lose the match with the actual rock mass edge features and may stop working. One interesting future research direction is to study the robustness of the edge tracking to slope deformation through long-term observations and on-site testing on rapidly deforming slopes. In practical applications, if an edge alignment stops working due to slope deformation or rockfalls, a simple solution is to carry out the SfM modeling of the local part of the rock mass within the tracking region again, align the regional model with the original slope model using 3D registration, and use it as an updated new template model. This solution could be acceptable if the template model updating frequency is not too high.

