Article

Long-Term Deflection Monitoring for Bridges Using X and C-Band Time-Series SAR Interferometry

by
Jungkyo Jung
1,
Duk-jin Kim
2,*,
Suresh Krishnan Palanisamy Vadivel
2 and
Sang-Ho Yun
1
1
Jet Propulsion Laboratory, California Institute of Technology, 4800 Oak Grove Drive, Pasadena, CA 91109, USA
2
School of Earth and Environmental Sciences, Seoul National University, Seoul 08826, Korea
*
Author to whom correspondence should be addressed.
Remote Sens. 2019, 11(11), 1258; https://doi.org/10.3390/rs11111258
Submission received: 10 April 2019 / Revised: 21 May 2019 / Accepted: 23 May 2019 / Published: 28 May 2019
(This article belongs to the Section Engineering Remote Sensing)

Abstract

:
This study aims to monitor the deformation of bridges, namely in the form of long-term deflection and thermal dilation, using multi-temporal interferometric synthetic aperture radar (InSAR) observations. To precisely estimate the vertical and longitudinal displacements, we used the InSAR time-series technique with multi-track stacks of Sentinel-1 SAR dataset and a single-track stack of COSMO-SkyMed SAR data over two extradosed bridge cases; Kimdaejung and Muyoung bridges between 2013 and 2017. The vertical and longitudinal displacements are estimated using multi-track Sentinel-1 SAR data and orientation angle of bridges, and we converted the displacements into thermal dilation and long-term vertical deflection. From COSMO-SkyMed data, we calculated the horizontal thermal dilation and long-term vertical deflection assuming that they dominantly contribute to the horizontal and vertical displacements, respectively. This assumption appeared reasonable based on the comparison with calculations from Sentinel-1 data. The deflection patterns exhibit downward movements at the mid-spans between towers. The results reveal that both bridges have been suffering long-term deflection over the observation period. Thus, this study verifies the potential to monitor the long-term deflection and implies that the bridges need to be monitored periodically.

Graphical Abstract

1. Introduction

Periodical condition assessments of bridge structures are necessary for the appropriate maintenance and repair of structural damage and the deterioration caused by natural hazards and aging. In order to ensure the safety of the bridge structures, it is important to monitor the structural behaviors and various dynamic responses of bridge structures over a period. These include deflection, displacement induced by thermal expansion and vibration. Various monitoring methods and sensors, such as leveling, accelerometer, and GPS are being employed to assess the health of bridges [1,2,3,4,5]. Recently, the ground-based microwave interferometer has also been verified for both the static and dynamic monitoring of bridges [6,7]. However, due to the installation costs of in-contact sensors and inadequate periodical field surveys, long-term time-series monitoring for many bridges has not been carried out.
The space-borne InSAR technique is identified as a robust tool to measure the displacements of infrastructure and natural terrain. The main advantage of time-series interferometric techniques such as persistent scatterer interferometry (PSI) and small baseline subset (SBAS) is the measurement of displacement at sub-centimeter accuracy [8,9,10,11]. Also, the high spatial resolution images acquired from the recently developed X-band SAR sensors increase the potential to monitor the bridge structure in detail. In recent times, the constellation of SAR sensors have allowed us to obtain SAR images with a short temporal baseline; thus increasing the interferometric coherence for reliable measurements. Therefore, the potential of space-borne InSAR plays a key role in the long-term monitoring of the bridge structure by providing complementary information about health status.
Several studies have highlighted the estimation of displacement of artificial structures such as dams, skyscrapers, and bridges, and demonstrated the efficiency of time-series interferometry [12,13,14,15]. In the case of bridges, time-dependent deflection and thermally-induced displacements are major displacement components. Numerous studies have shown the potential of InSAR to measure the thermally induced displacement that exhibits a seasonal changing pattern [14,16,17,18,19,20]. However, long-term deflection, which is caused by creep, shrinkage, relaxation, and aging of the bridge structure, have not yet been fully examined using time-series interferometry. The creep in the concrete structure refers to the inelastic strain that gradually increases under the sustained load, and the shrinkage is a shortening caused by the loss of moisture [21,22]. Such factors could affect the internal distribution of stresses and change the characteristics of the structure. Therefore, the deflection term needs to be taken into account as it is an important factor for monitoring the structural health of the bridge. In general, the interferometric phase comprises the mixed signal of thermal dilation effect and long-term deflection signal, among other noise terms. In order to measure the deflection, which is independent of temperature variations, the contribution of thermal dilation and error terms should be isolated from the interferometric phase.
This study aims to estimate the long-term deflection signal from the measured displacement for the case study at Kimdaejung and Muyoung bridges by introducing a novel methodology. Section 2 presents brief descriptions of the bridges and SAR dataset used in this study. Section 3 presents the methodology for estimating displacement through time-series interferometry using X-band COSMO-SkyMed and C-band Sentinel-1A/B SAR datasets and their interpretation based on the structural behavior of bridges (i.e., deflection and thermal expansion). The analysis of displacement on each case studied with subsequent discussion is presented in Section 4. Finally, the conclusion of this paper is summarized.

2. Study Area

In this study, two extradosed bridges located in the southern part of South Korea have been selected as case study areas for monitoring the long-term deflection using time-series interferometry (see Figure 1 and Figure 2). The extradosed bridges are an intermediate type of the cable-stayed bridge and girder bridge, which have been developed since the 1990s as a new type of structure; the lower height of the extradosed bridge is a distinguishing feature from the cable-stayed bridge [23]. In addition, the construction is much easier than constructing the cable-stayed bridges as the optimal height of the tower is nearly half of the cable-stayed bridge. Larger girder stiffness is another special feature of the extradosed bridge compared to the cable-stayed bridge.

2.1. Overview of Bridges

Kimdaejung Bridge is a cross-sea bridge connecting Aphae-do and Muan-gun located on Jeollanam-do. Interestingly, the bridge was designed as a combined form of an extradosed and prestressed concrete box girder bridge. Thus, the center section of the whole structure is categorized as the extradosed bridge with a span of 325 m. This extradosed bridge has two main towers of 15.5 m high from the deck. Twelve piers spanning 60 m each without external cables support the remaining decks; and the mid-span, which is the longest span, is about 155 m. The superstructure consists of a triple-cell prestressed concrete box girder of height varying from 3.58 m at mid-span and 5.5 m at piers. The total length is 925 m and the lateral width is 24 m. As shown in Figure 2a, the bridge was constructed as a symmetrical structure, and the middle part over the whole span is stayed by six external cables connecting the two main towers. The construction of this bridge started in June 2003 and was completed in December 2013.
The second case, Muyoung Bridge, is a six-span continuous extradosed bridge crossing the Yeongsan River. It is located along the national highway connecting Muan-Gun and Yeongam-Gun. This bridge has a total length of 860 m, spans of 100.0 + (165.00 × 4) + 100.0 m and a lateral width of 26.6 m. The superstructure is a triple-cell prestressed concrete box girder of height varying from 3.2 m in the mid-span to 5.5 m over the supports. There are twelve external cables, deflected in steel saddles and anchored in the box girder with 4 m spans. The static scheme of the bridge is illustrated in Figure 2b. Unlike the first case, the Muyoung bridge was designed as an extradosed bridge where all the decks are stayed with cables by five towers of 22.5 m high (Figure 2b). The structure was built between 2004 and December 2011.

2.2. SAR Dataset

In order to estimate the long-term deflection of the bridges, we collected three SAR image stacks from COSMO-SkyMed (CSK) (descending) and Sentinel-1 A/B (ascending and descending). The first stack constitutes 52 CSK stripmap images acquired from 2013 to 2017 from the descending passes, over the Mokpo city, Jeollanam-do, South Korea. As an X-band SAR sensor, its pixel spacing is 1 m in slant range and 2.2 m in the azimuth direction, and its ground range pixel spacing is about 3 m. CSK is a 4-spacecraft constellation that revisits the same site every four days on average and can also achieve a 1-day revisit time. However, we used a limited number of CSK images that maintain a time interval of up to two months between each scene and ensured the maintenance of high interferometric coherence. The acquired CSK images have the same polarization (HH) with an incidence angle of about 26.6 degrees. Both bridges are covered in the same frame.
Secondly, we used two stacks of 61 ascending and 67 descending interferometric wide (IW) mode Sentinel-1 (hereinafter dented as S1) SAR scenes, in order to analyze the vertical and horizontal displacements. The total time spans of S1 data are from October 2014 to July 2018 for ascending pass and from October 2014 to February 2018 for descending pass. S1 operates in C-band having spatial resolution of about 5 m by 20 m with 250 km swath. IW mode has three sub-swaths acquiring the images by electronically steering the beam from backward to forward with dual polarization (i.e., VV and VH). A first and third sub-swath of ascending and descending stacks, respectively, cover both the target bridges. In our study, only VV polarization data were used for analysis. Another specific advantage in the use of S1 stacks is the short temporal baseline. The mission is composed of two identical SAR satellites, Sentinel-1A, and 1B, sharing the same orbital plane. They can provide a short revisit time of six days, minimizing temporal decorrelation. The temporal and perpendicular baselines for the three interferometric stacks are shown in Figure 3.

3. Application and Interpretation of PSI

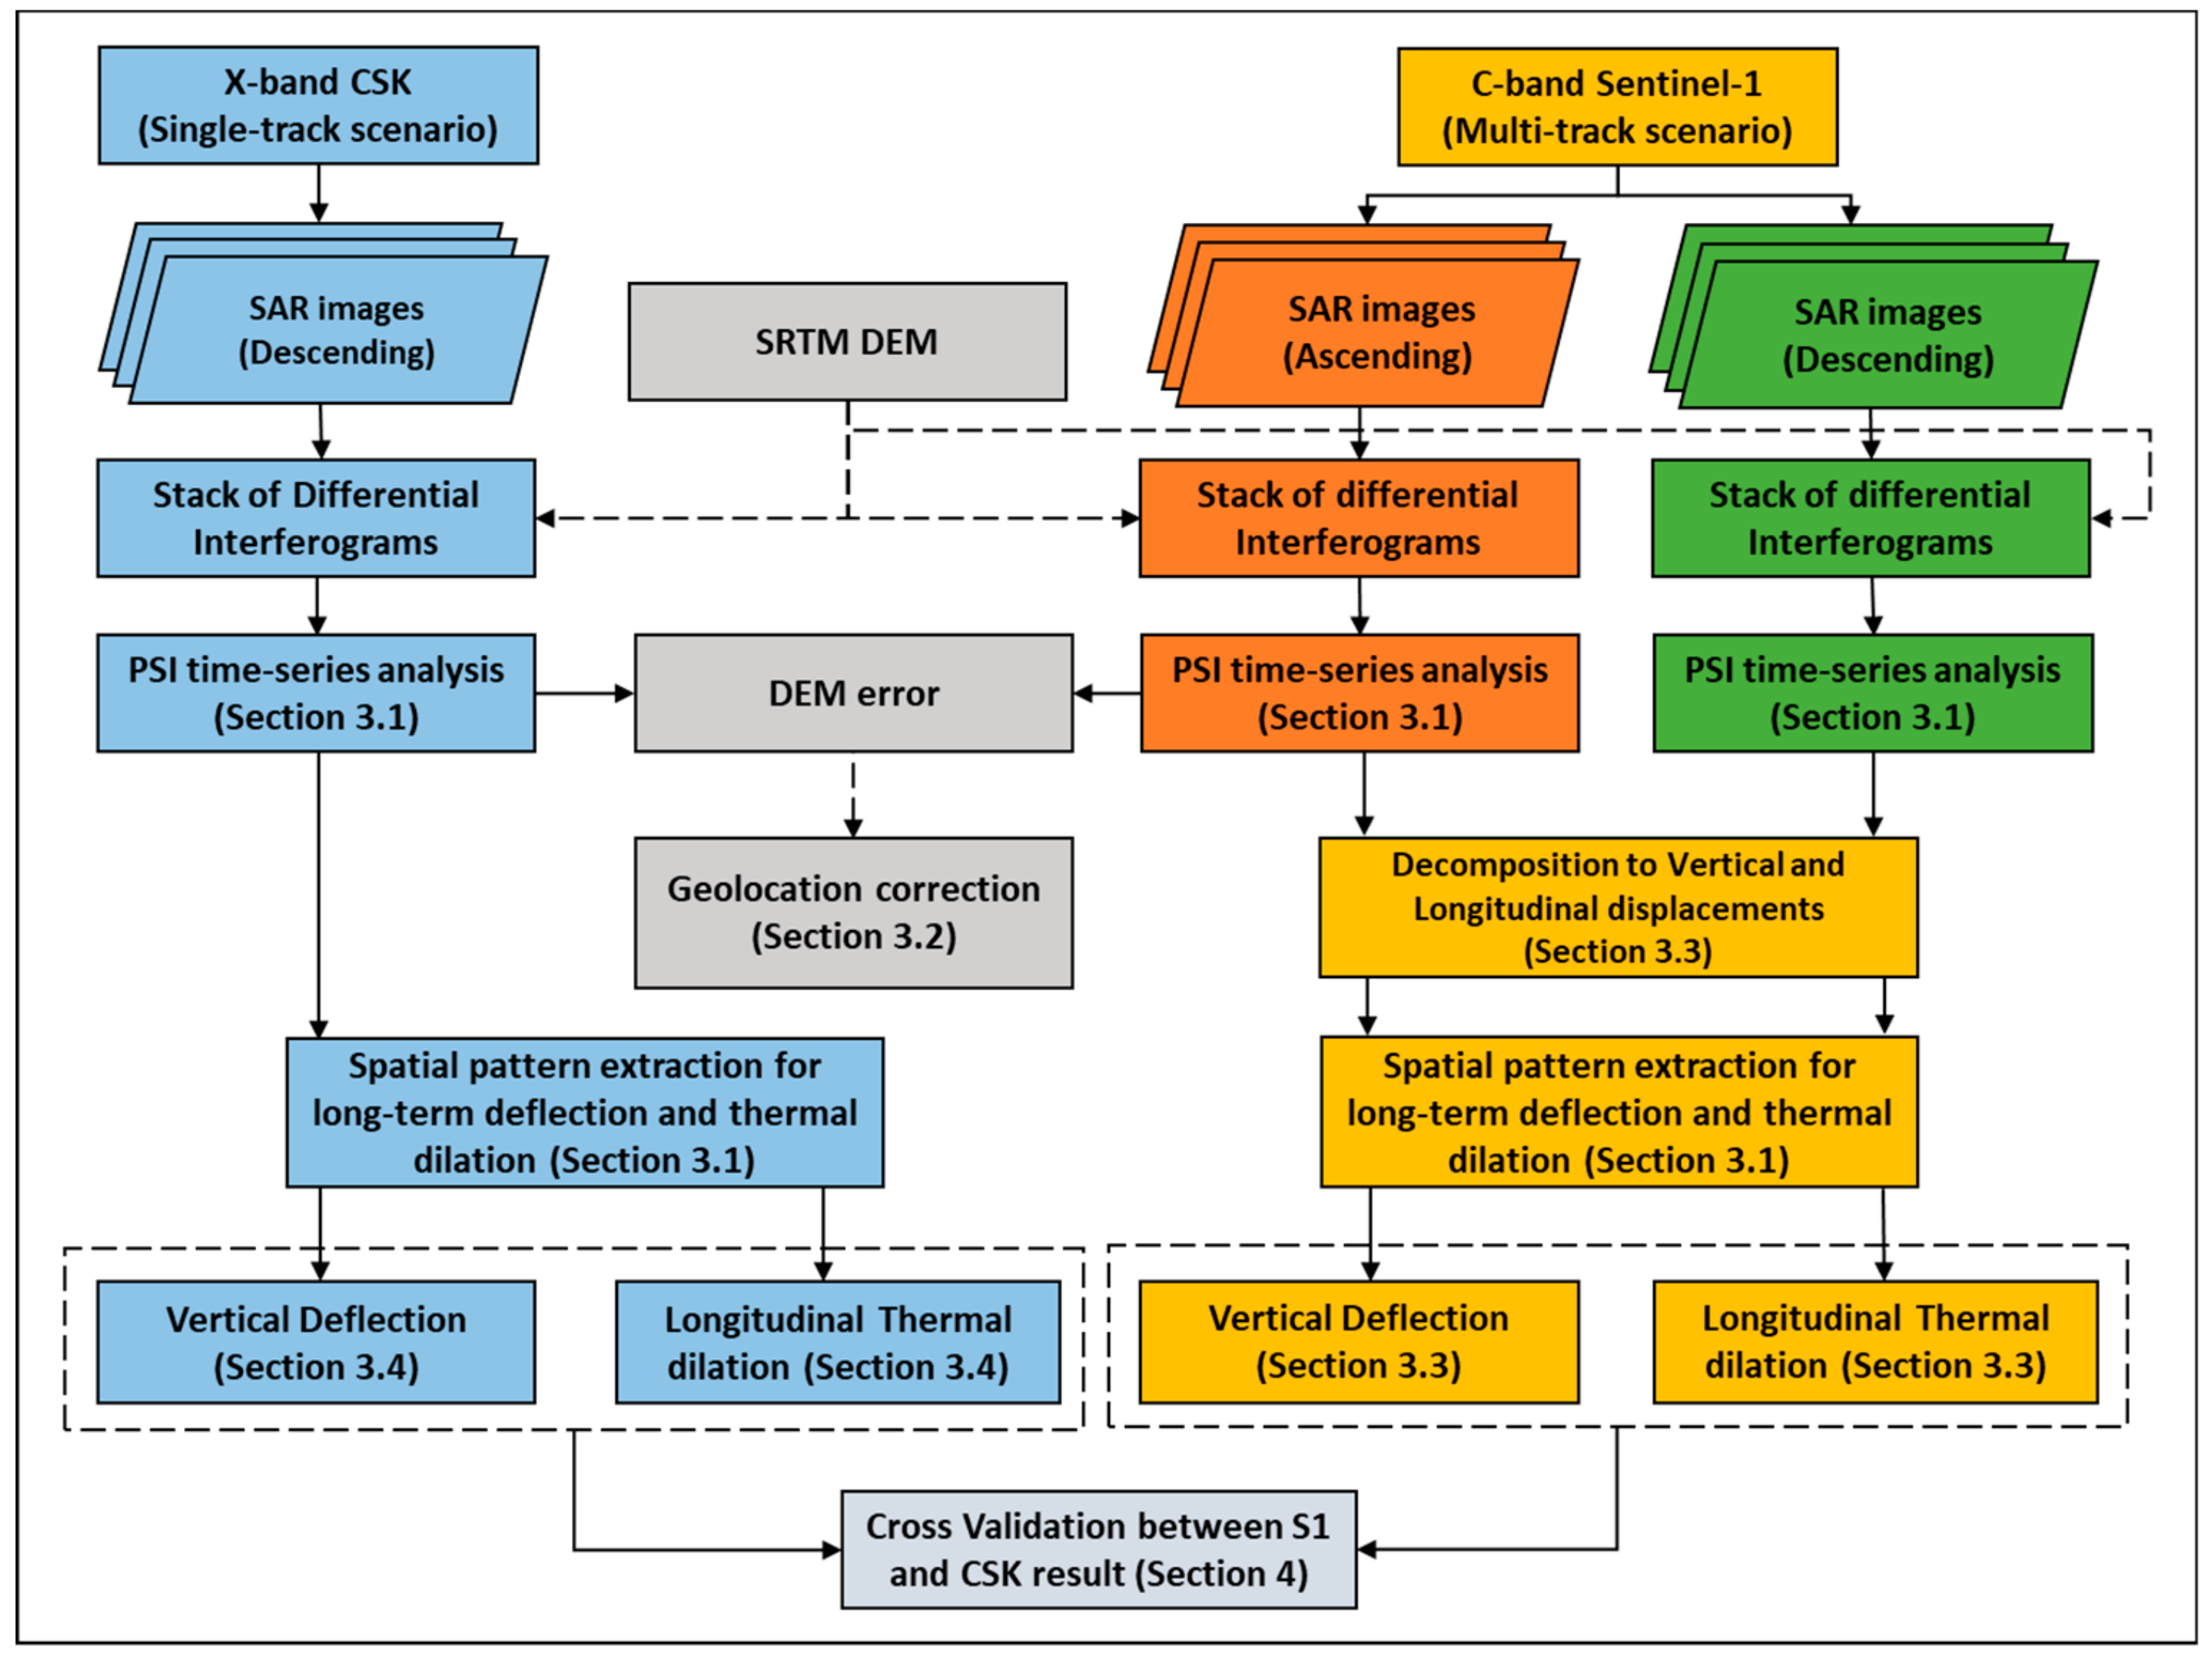
This section describes the methodology to obtain the long-term deflection and the thermal dilation from the single-track scenario (CSK) and multi-track scenario (S1 ascending and descending). Figure 4 briefly shows the workflow of the approach applied in this paper. It is worth noting that the workflow of the single-track scenario was independently carried out with the multi-track scenario (S1 ascending and descending). For the single-track scenario, the procedures to estimate the long-term deflection and thermal dilation mainly consist of three steps: 1) PSI analysis, 2) spatial pattern extraction of the long-term deflection and the thermal dilation and 3) time-series reconstruction of the long-term deflection and the thermal dilation as shown in Figure 4. The PSI analysis is identically applied to the stacks of the single-track and the multi-track scenarios, which will be explained in Section 3.1. However, the additional procedure was carried out for the multi-track scenario, i.e., conversion from LOS displacement to vertical and longitudinal displacement (Section 3.3). Then, the spatial pattern extraction and the reconstruction of the target signals (i.e., long-term deflection and the thermal dilation) were carried out based on what the displacements represent, which will be described in detail in Section 3.3 and Section 3.4. Both results will be cross-validated using the real-data for the two cases in the next section.

3.1. Application of Time-Series PSI and Its Interpretation

Initial steps for the application of the PSI technique start with the co-registration of images by selecting the reference (master) image for each stack concerning the spatial and temporal baselines to minimize decorrelation. For generating the stacks of the conventional differential interferograms, we implemented GAMMA software for both space-borne SAR data [24]. For the CSK dataset, the slave imageries are resampled, referring to the master image acquired on May 5, 2015. In the case of S1, the scenes acquired at Jan 19, 2017 and Nov 26, 2016 were selected as master imageries for the ascending and descending tracks, respectively. In order to remove the topographic phase, the Shuttle radar topography mission (SRTM) Digital Elevation Models (DEMs) with 30 m spatial resolution were used [25]. The multi-looks were not performed in this processing in order to preserve enough pixels along the bridge structure and to prevent smoothing. For InSAR time-series analysis, the StaMPS (Stanford method for persistent scatterers), which is a PSI algorithm, was implemented to the stacked differential interferograms [26]. The initial persistent scatterers (PSs) were selected based on the amplitude dispersion and spatial coherence to eliminate the false-detected PSs which come from the water body. The thresholds of amplitude dispersion and spatial coherence were 0.6 and 0.2, respectively The chosen pixels were further refined based on the noise characteristics, which are residual contribution after discriminating the components related to the linear displacement, and topographic errors. After that, the initial 3D unwrapping procedure, which finds the solution in the space and time domain, were carried [27]. The unwrapped phase consists of three components, namely displacement d , atmospheric phase screen, Φ A P S i , and residual topographic height, H . A stack of N unwrapped interferometric phase can be written as follows [18],
Φ i = 4 π λ d i + B i R i sin θ i H + Φ A P S i ( i =   1 ,   ,   N )
For the ith interferogram, Φ i is the interferometric phase between two acquisitions with the radar wavelength λ , perpendicular baseline B, slant range R and incidence angle θ . The first and second terms are related to displacement and residual topographic error, respectively. The third term is the effect of differential atmospheric phase delay, which was estimated by low-pass filter in space and high-pass filter in time. The atmospheric phase screen was removed from the interferometric phase.
For the displacement d, we can introduce the bridge displacement model to address the two specific terms, namely; (1) thermal dilation and (2) long-term deformation. The thermal expansion exhibits the seasonal change and is often expressed as a function of temperature changes, T i and thermal expansion variable, k T . Thermal dilation is one of the common displacement patterns observed in the human-made structures, and has been presented in several previous studies [14,16,17,18,19,28,29]. The long-term deformation of a bridge structure is induced by shrinkage, aging, and creeps. It scales with time span, t i [21]. Thus, the displacement model, d , for interferometric phase can be introduced as follows [18]:
d t , s = v s · t i + T i · k T s + d r e s i t , s
where v is the linear displacement rate; the residual displacement component, d r e s i , is related to the contribution which is not modeled with the linear displacement, and the thermal expansion. In the context of bridge displacement behavior, the d r e s i consists of a variety of displacement sources. One of them is the dynamic behavior caused by the live loads such as traffic. Also, the non-linearity of the long-term deflection, which is not explained with linear velocity rate, is one of the components of the d r e s i . Since the differences between the observed temperature data and real temperature of the bridge components may mislead the estimation of k T , the remaining contribution of the thermal dilation can be involved in d r e s i . The linear displacement rate v is deeply related to long-term deflection, mainly caused by creep and shrinkage because the time independent effect such as a dynamic deflection is ruled out in this procedure. Thus, the spatial patterns of v extracted from Equation (2) is determined by long-term deformation, governed by the static structure, types of deck, boundary conditions between superstructure and foundations, etc. without the heterogeneous pattern caused by dynamic behaviors over the observation periods. Also, the spatial pattern can be assumed as consistent with the magnitude variation over the time period. For thermal dilation, the same idea can be applied. Consequently, the non-linearity of the long-term deflection and the refined thermal dilation can be recalculated using the spatial patterns of them. We can make the spatial shapes of the long-term deflection and the thermal dilation by normalizing the v and k T .
v = v / s = 1 N v s   and   k T = k T / s = 1 N k T s
where s represents the pixels on the bridge. Note that the v and k T are unitless. The time dependent non-linear effects can be extracted again in time-series using the following equations.
d r e s i i t i = a t i · k T + b t i · v + c t i
The coefficient a t i is related to the refinement of the residual contribution of thermal dilation which is caused by the temperature differences between the observed temperature and real temperature. Meanwhile, the coefficient b t i is the refinement coefficient for non-linear deflection derived from the spatial pattern of linear displacement rate. By adding this term, the temporal evolution of the long-term deflection—whether the deflection is progressing or being stabilized—can be estimated. The coefficients are estimated from a regression method for each scene, which is relying on the spatial pattern of the long-term deflection and the thermal dilations. Finally, the nonlinear displacement due to the long-term deflection and thermal dilation can be obtained as follows:
d d e f i = v · t i + b t i · v
d t h e r m a l i = T i · k T + a t i · k T
The goodness-of-fit of the displacement model to the unwrapped phase can be evaluated using temporal coherence, γ t with the number of the interferometric pairs, N.
γ t = 1 N i = 1 N e j 4 π λ d r e s i
By implementing the long-term deflection and the thermal dilation in the model, the temporal coherences for all cases were improved. For example, in the analysis of Kimdaejung bridge using CSK, we found that the mean value of γ t was enhanced from 0.35 to 0.78. Here, we again excluded the pixels with low temporal coherence below 10% among the whole pixels.
A dynamic deflection induced by the live loads is possibly involved in the interferometric phase. However, this is impossible to estimate and verify without temporally dense independent observations such as an accelerometer, a high-frequency GPS, or a ground-based radar interferometer. To minimize such effects, in the above approach presented here, the non-linearity effects are estimated based on the spatial pattern of the long-term deflection assuming the pattern consistency. The temperature variation could also influence the deflection in some types of bridge. To isolate its contribution and focus on the time-dependent deflection, the thermal dilation variable, k T , is introduced using the temperature data.

3.2. Geolocation Correction

In general, the height information of the newly constructed structures is not available in the digital elevation models. For instance, the SRTM DEM, which is freely available and widely used for topographic phase removal, has the terrain information at the time of data acquisition, which is February 2000 [25]. Both of the bridges in this study did not exist during the time of the SRTM SAR data acquisition. The inaccurate height information leads to errors in displacement estimation and scattering target locations both in the horizontal and vertical planes. In particular, the relocation of the pixels with the elevation error is important for vertical structures such as buildings and bridges as the PS pixels should be mapped onto the three-dimensional space. Fortunately, we can estimate the residual topographic information based on the relationship between the spatial baselines and the residual phases in Equation (1) [19,30]. After estimating the residual topographic error term using Equation (1), the location error in LOS plane can be approximately re-estimated as follows based on the geometry of the SAR sensor:
s = H · cot θ
where, s is the ground distance error caused by the residual topography on the line of ground-projected look vector. The location errors in the east-west plane and north-west plane are expressed with the azimuth heading angle measured clockwise from the north.
x = H · cot θ · cos φ   and   y = H · cot θ · sin φ
Considering the typical heading direction of SAR satellites at the latitude of the study area, φ = −12~−8° along ascending tracks and φ = 188~192° along descending tracks, these expressions indicate the topographic errors are dominantly in the east-west direction.
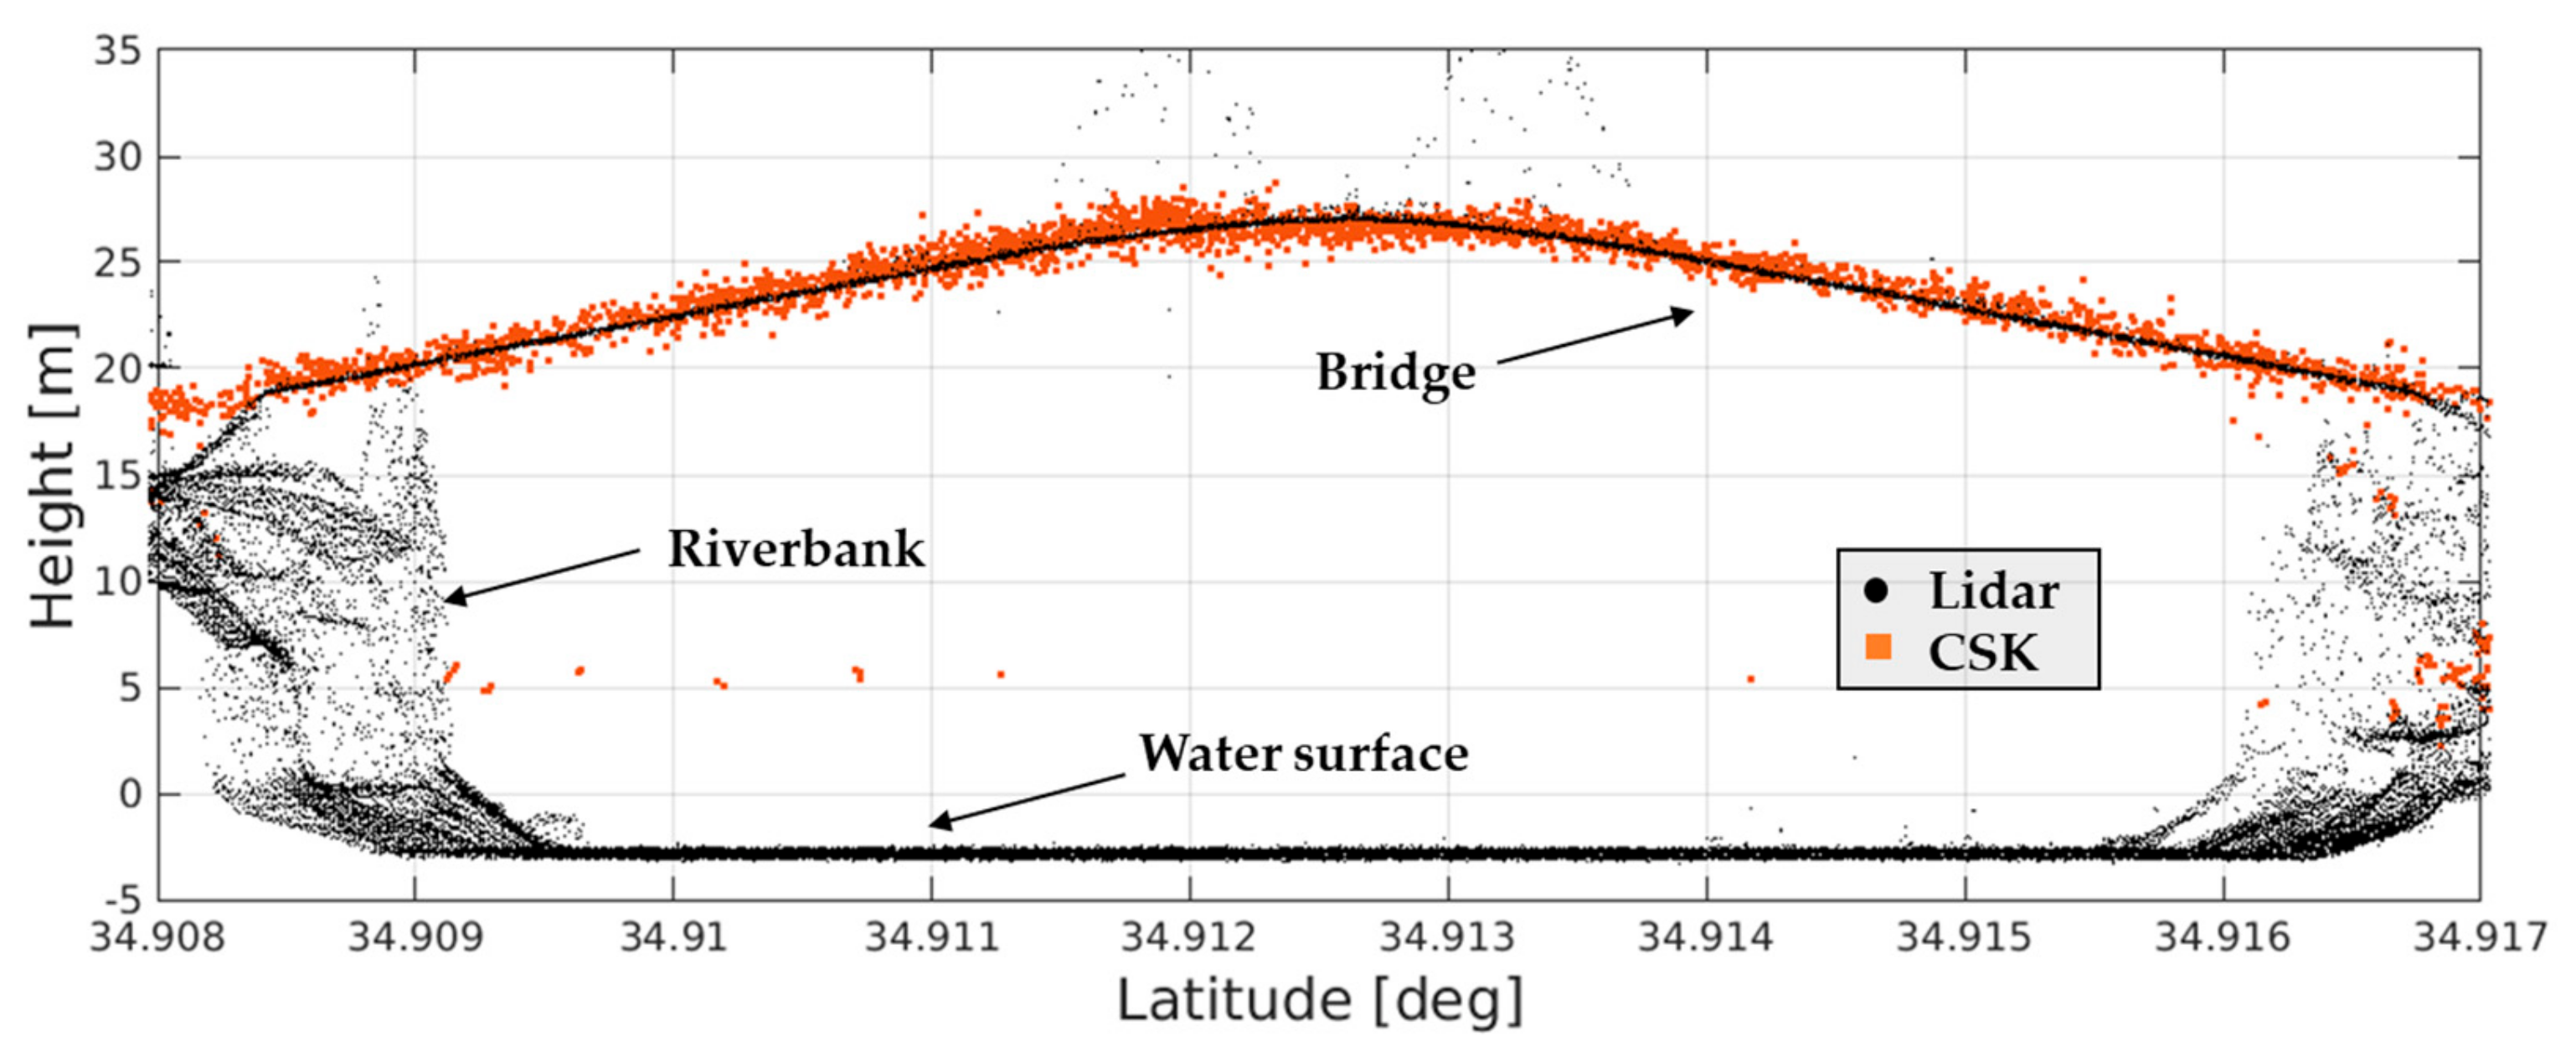
For instance, 52 CSK interferometric pairs having the perpendicular baseline variation are available. Based on the relationship between the perpendicular baseline and the unwrapped phase, the residual topography information can be estimated in Equation (1). The reconstructed topographic information was evaluated with the airborne Lidar data covering Kimdaejung bridge. The comparison shows that PSs are aligned along the deck of the bridge structure (see Figure 5). Its root-mean-square-error (RMSE) is 0.39 m, which indicates the reconstructed topographic height agrees well with actual height. Employing residual topographic information, the geolocation of PSs can be re-geocoded using Equation (9). The PSs overlaid on the aerial photo are shown in Figure 6. It is found that the PSs are located on the barrier wall and guardrail because they have the high-amplitude, meanwhile, the pixels over the pavement road have not selected due to their low-return signals. These results imply that the displacement signal is well isolated from the topographic error terms in Equation. (1).
According to [31], the residual height estimation using multi-temporal interferometric technique is a function of the number of scenes, the geometrical parameters such as a standard deviation of the baseline, slant range distance, and incidence angle, and the radiometric parameters such as wavelength and standard deviation of phase. As shown in Figure 5 and Figure 6, the short wavelength and large orbital tube diameter (~2000 m) of CSK allow the accurate height estimation and geo-relocation. Thus, we can expect the successful extraction of isolating the topographic phase from the displacement component. Meanwhile, S1 has small orbital tube diameter (~100 m) may negatively affect the performance of the residual height estimation. In our case for Kimdaejung bridge, the comparisons between lidar DSM and reconstructed height from S1 show 5.08 m and 2.97 m of RMSE for ascending and descending paths, respectively. These values approximately correspond to 7.42 m and 3.13 m of ground geolocation errors for ascending and descending datasets. S1 is designed to be appropriate for measuring displacements by maintaining the small perpendicular baseline. Thus, the small orbital tube ensures that the sensitivity to inaccuracy of the residual height estimation is relatively low. Therefore, we still rely on the displacement performance of S1 PSI.

3.3. Estimation of Thermal Dilation and Long-Term Deflection Using Asc-Desc PSI

Interferometric SAR dataset acquired from a single track can only measure the one-dimensional displacement along the line of sight (LOS) direction. Using SAR dataset acquired from ascending and descending passes, we can decompose the displacements along the two LOS directions into vertical and horizontal displacements [32,33]. Considering the orientation of the bridge structure and the SAR imaging geometry, and assuming that the bridge-lateral displacement is negligible, the vertical and longitudinal displacements are estimated using the following formula with ascending and descending PSI displacements:
d a s c d d e s =   sin ( φ a s c α ) sin θ a s c cos θ a s c sin φ d e s α sin θ d e s cos θ d e s d l o n d v e r
In Equation (9), θ indicates incidence angle and φ and α represent the azimuth angles of satellite heading vectors and the orientation of bridge, respectively, measured clockwise from the north. The longitudinal and vertical displacement can be obtained by inverting the geometric matrix. The sensitivity of the longitudinal displacement is a function of the heading, orientation, and incidence angles of ascending and descending geometry, while that of the vertical displacement is only determined by the incidence angles.
In practice, the spatial location differences of the identified PSs and the acquisition time differences of ascending and descending SAR dataset could lead to difficulty in retrieving the time-series of the vertical and longitudinal displacements. In order to avoid blurring spatial and temporal pattern of displacement, the interpolation step is needed to be carefully carried out in space and time. After relocating the PSs based on the estimated height error and geometry of each track, as explained in Section 3.2, we evenly defined the interpolated points along the longitudinal axis covering the whole span. The pixels near the points within the window across the longitudinal bridge are averaged separately for the ascending and descending tracks. In the time domain, the whole acquisition time of ascending and descending track are concatenated to create the new acquisition time array. We interpolated each pixel in time and produced the common acquisition time array so that the ascending and descending PSs have concurrent data points. Then they were used to reconstruct the vertical and longitudinal displacements using Equation (10). Using the displacement model, Equations (2)–(6), and ithe nversion process, we estimated long-term displacements and thermal dilation in both longitudinal and vertical directions.

3.4. Estimation of Thermal Dilation and Long-Term Deflection Using Single Stack PSI

The multi-tracks approach allows us to provide the 2-dimensional displacements, which is important for the comprehensive interpretation of the bridge monitoring. However, multi-track data are not always available. Therefore, we studied the performance of a single-track SAR data for the bridge structure monitoring. To accommodate the reduced number of dimensional constraints of the data, we made two assumptions: (1) thermal dilation occurs only in the longitudinal directions, (2) long-term deformation only leads to vertical displacements. Hence, the problem is reduced to estimating vertical long-term deformation and horizontal (longitudinal) thermal dilation. From LOS displacement, the longitudinal thermal dilation can be obtained from the relationship between the temperature and LOS displacement as formulated in Equation (6). The spatial pattern of the long-term deformation can be also extracted from Equation (5) using the temporal baseline. Then, both signals are refined using Equations (3)–(6) in order to extract the nonlinear time-series displacements related to the long-term deflection and residual component of thermal dilation. Since the long-term displacements are assumed to be purely vertical, it can be calculated using the incidence angle as follows (i.e., Equation (5) and the first row of Equation (9)):
d v e r t i c a l _ d e f i = v · t i + b ( t i · v ) / cos θ
Similarly, the thermal dilation is calculated using Equation (6) and the first row of Equation (10) as follows:
d h o r i s o n t a l _ t h e r m a l i = ( T i · k T + a t i k T ) / ( sin φ α sin θ )
We tested our assumptions using the multi-track InSAR observations, and the results are explained in detail in the following section.

4. Results

The estimation of the long-term displacements and thermal dilation of the two bridges are presented in this section. As described in Section 2.2, we used single-track (descending) observations of the CSK data and dual-track (ascending and descending) observations of the Sentinel-1 data. The Sentinel-1 observations were decomposed into two-dimensional space (vertical and longitudinal directions) and were used to estimate the long term and thermal displacements. We quantitatively compare both cases for two bridges.

4.1. PSI Displacements: Kindaejung Bridge

The orientation of the Kimdaejung Bridge is about 189° clockwise from the north, almost parallel (~2°) to the azimuth heading direction of the descending orbit (Table 1 and Figure 1b). This can be recognized as a special case because the observations of descending orbit are not very sensitive to the longitudinal displacements, and we can safely assume that the LOS observations of CSK PSI results are almost entirely from the vertical displacements. We also used the ascending and descending track dataset for the S1 stack, so the vertical displacement can be decomposed using Equation (10).
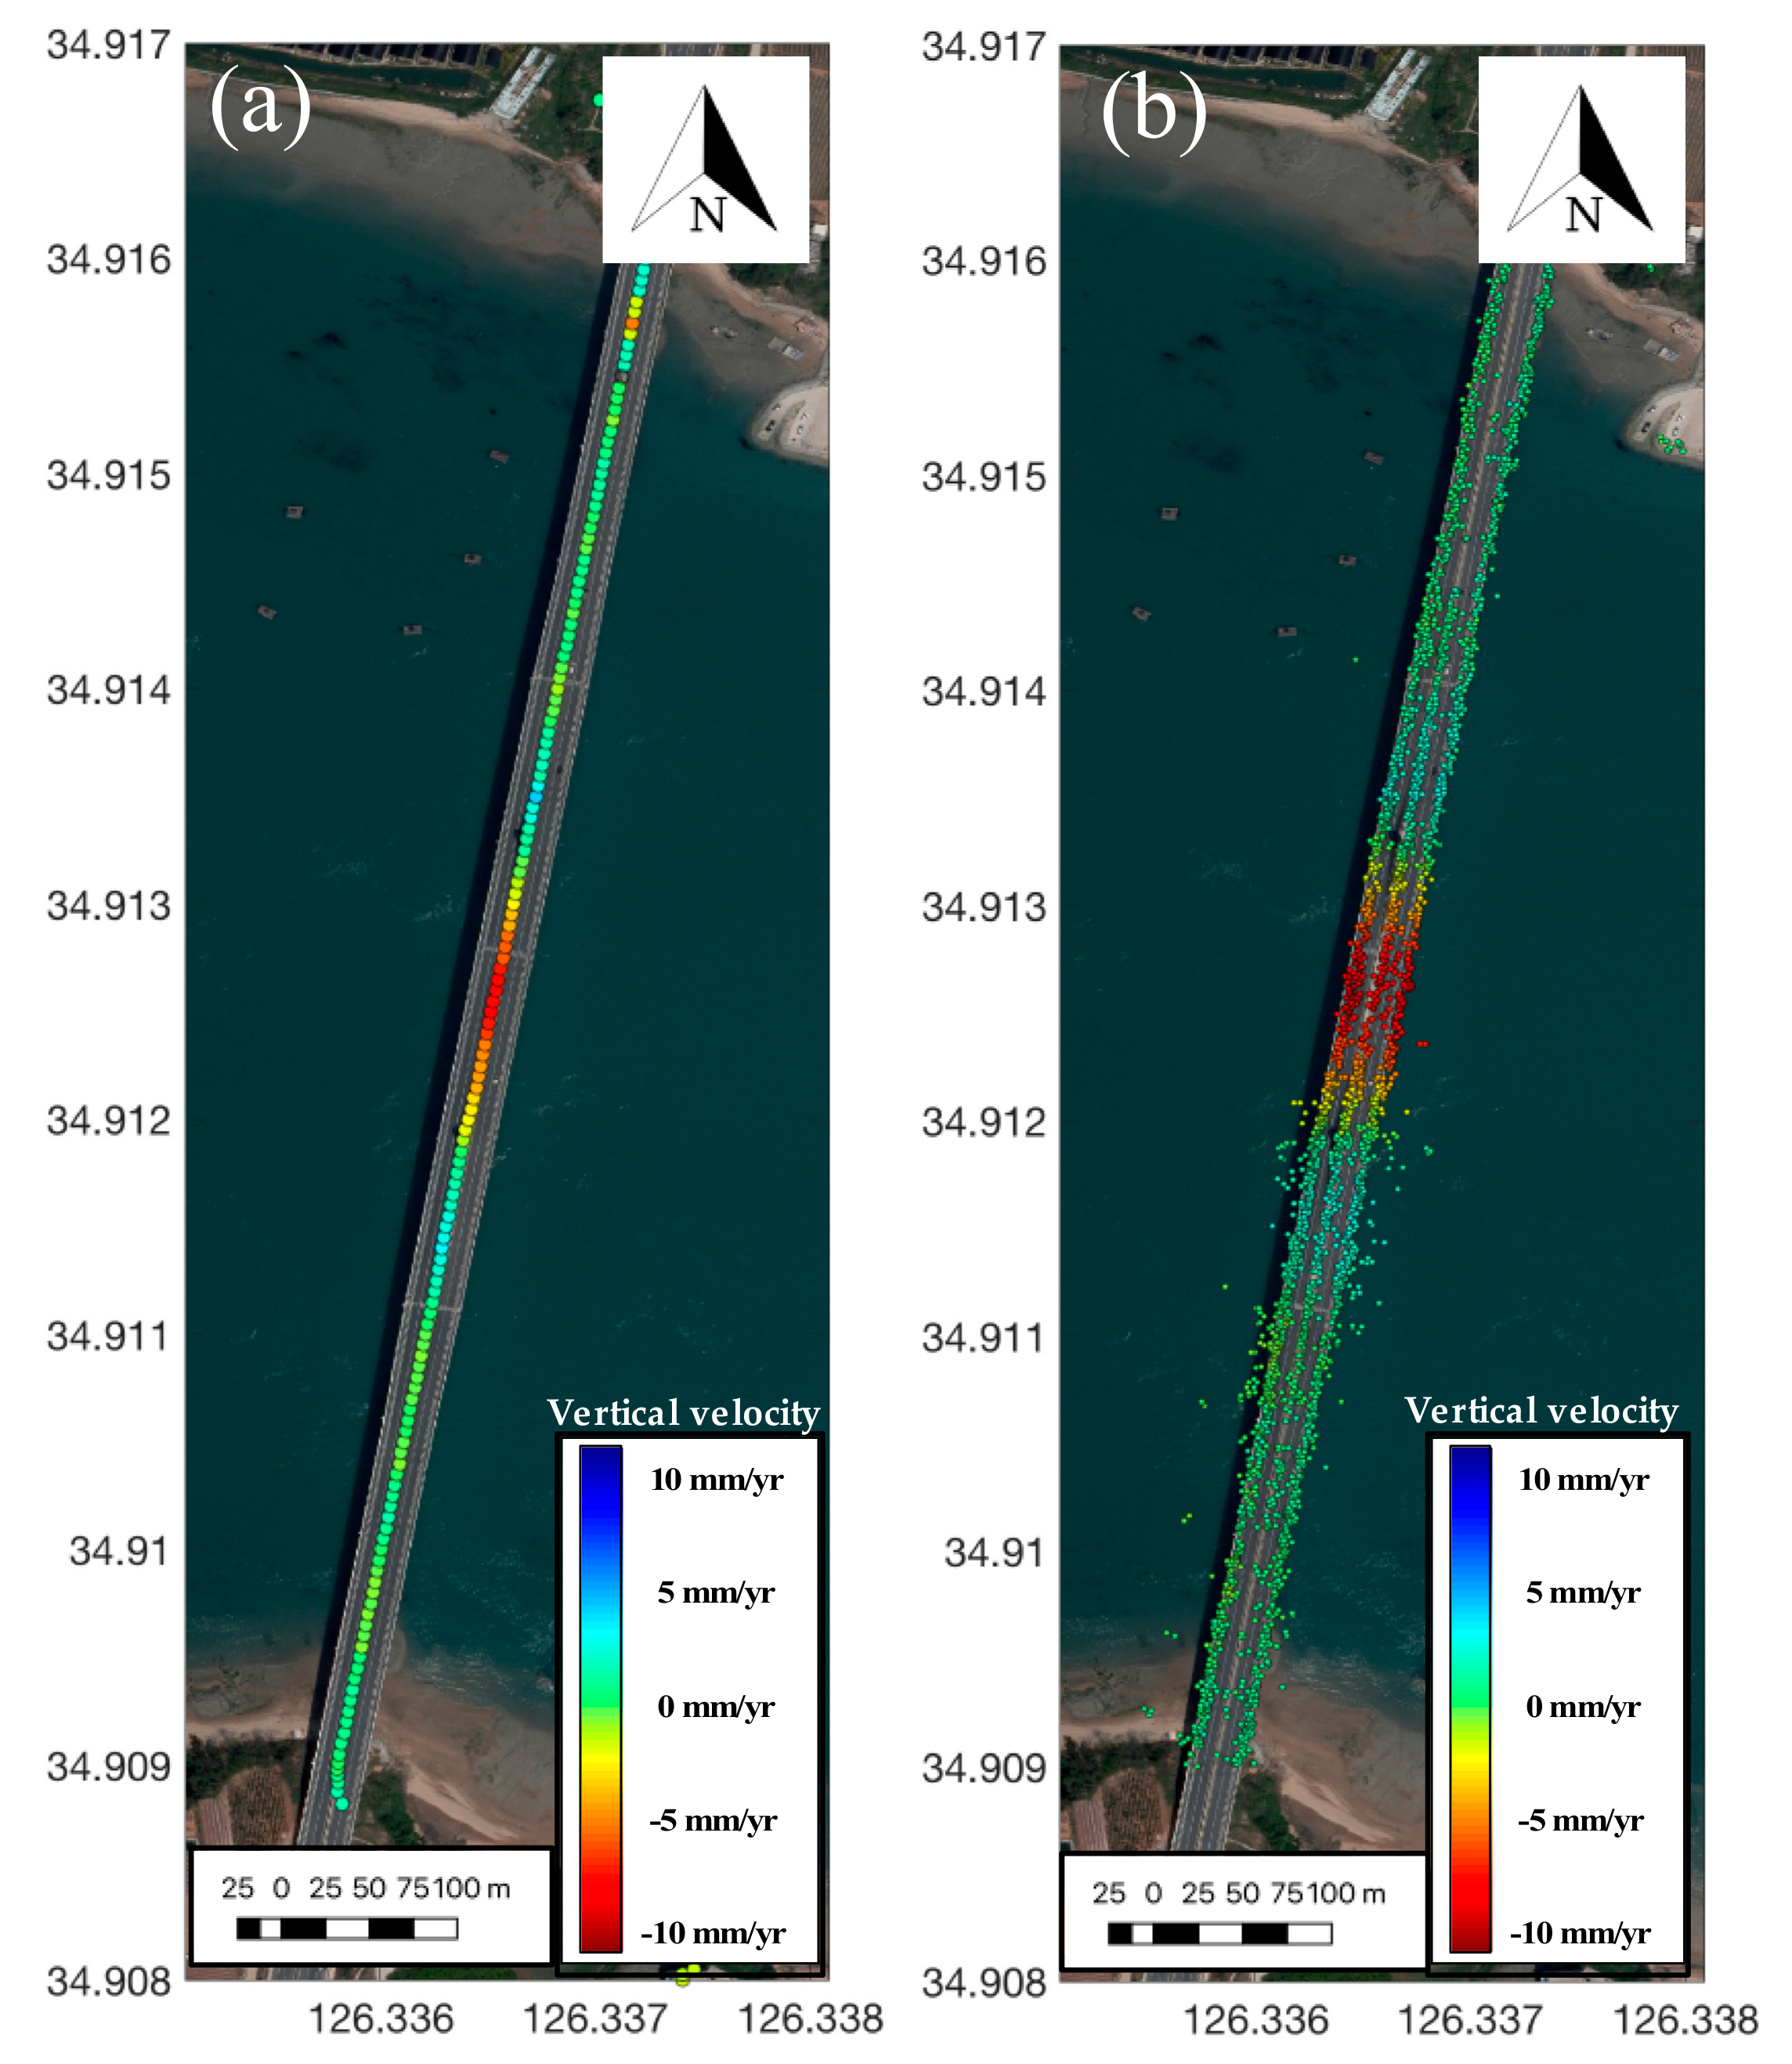
Figure 7 shows that the vertical linear displacement rates obtained from PSI result using CSK stack, and S1 stack. The negative values indicate the downward displacement and the positive values means the upward displacement. It is worth noting that the significant downward displacement is observed at the mid-span between two towers, which is located in the center of extradosed bridge, for both stacks. The observed spatial pattern of the deflection in the single-span bridge is typically observed in many cases [1,34]. The thermal behaviors are also calculated using Equations (2)–(6), however, the displacement caused by the thermal dilation along the vertical direction does not exceed 1 mm over the whole span for the whole observation period. Thus, the contribution of thermal dilation can be safely negligible.
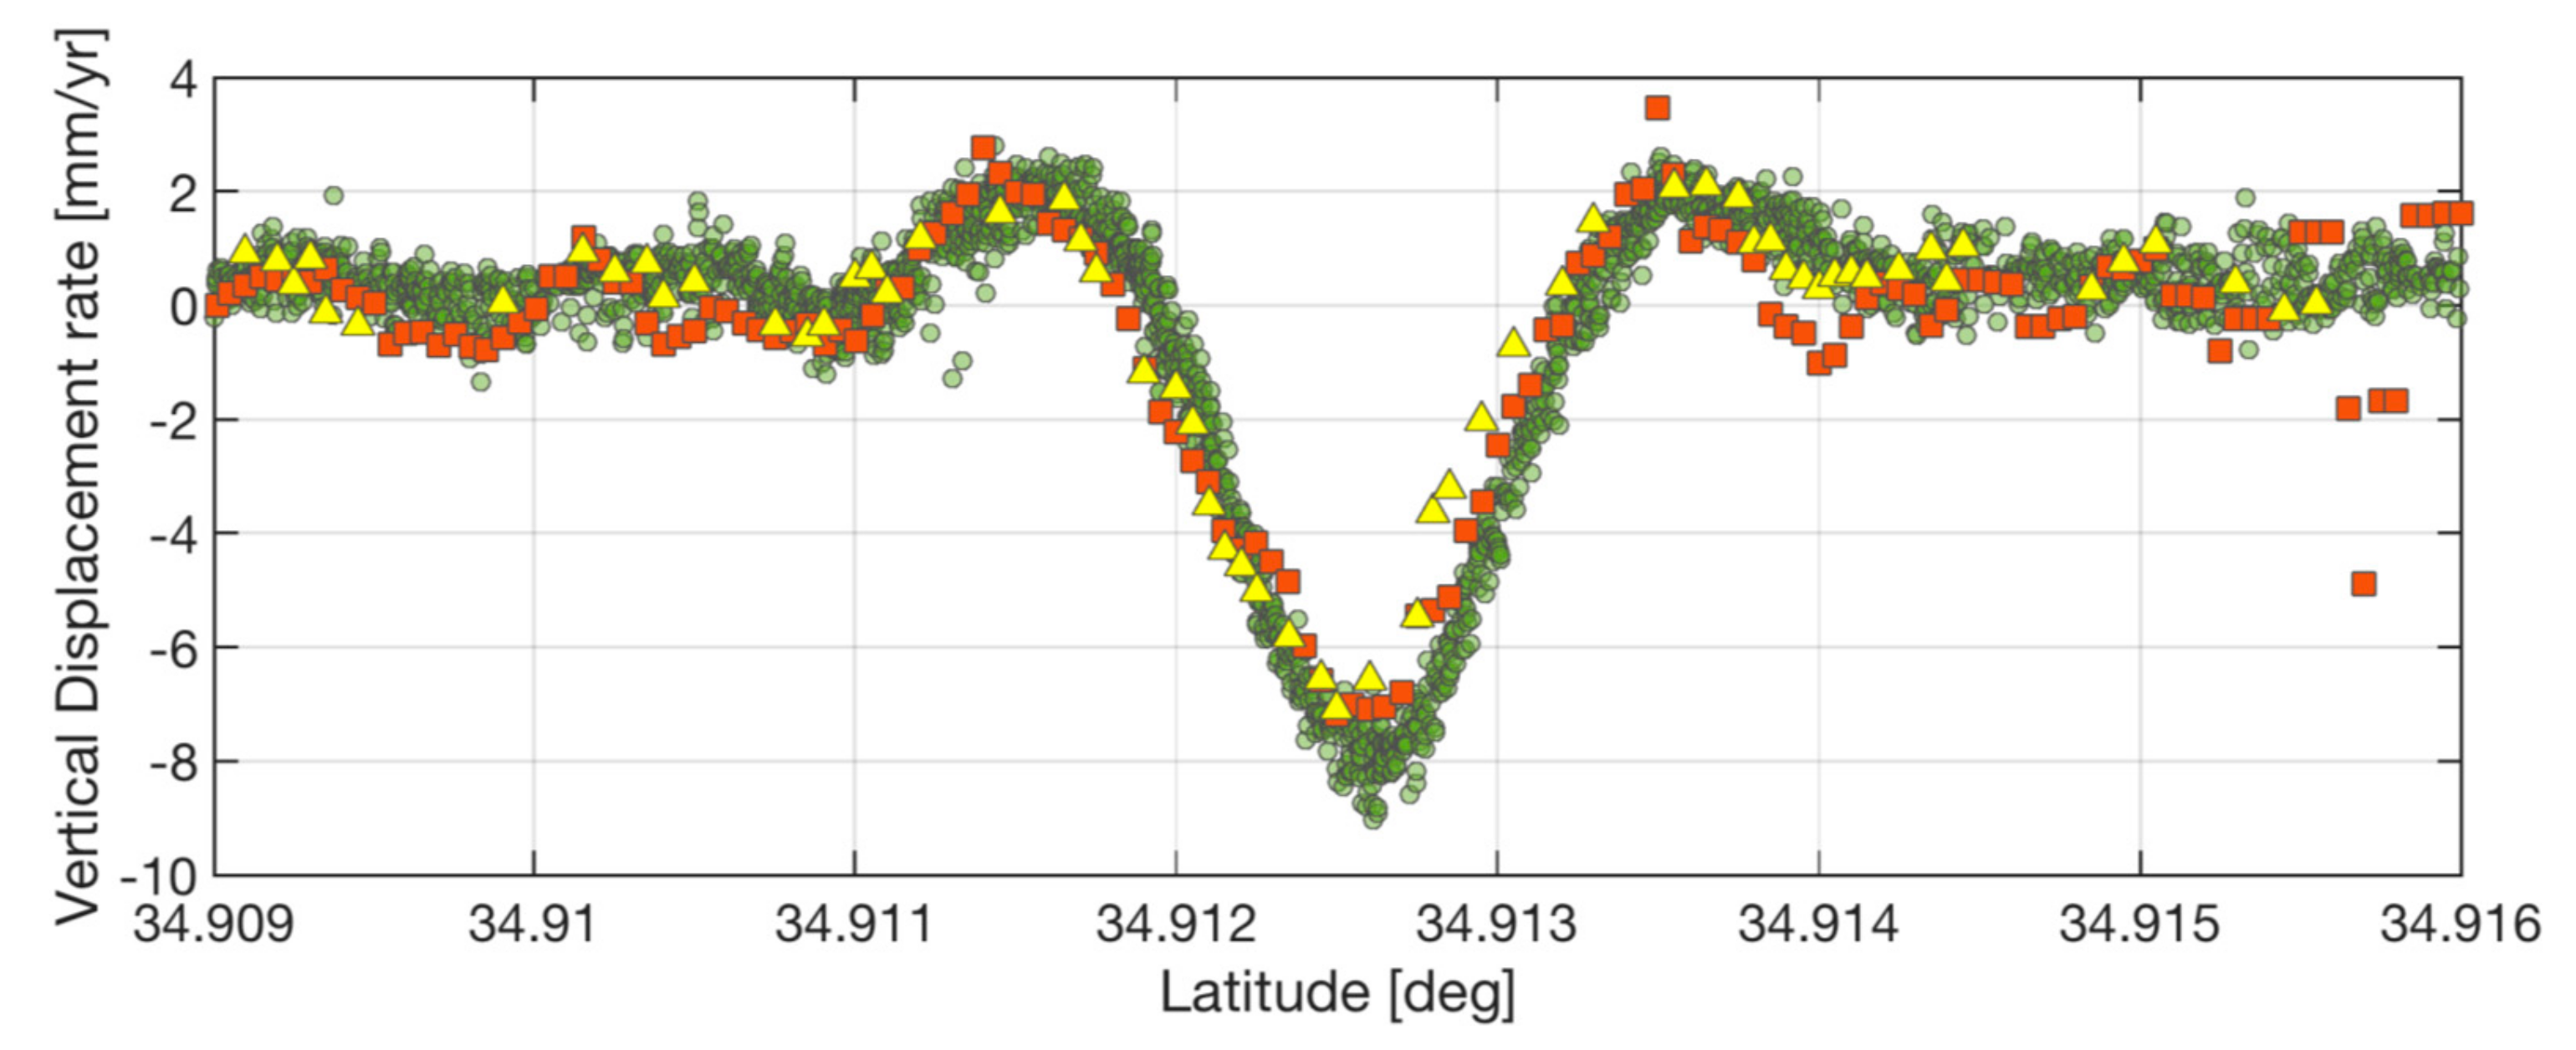
In order to quantitatively evaluate the two PSI results, we illustrate the spatial distributions of vertical displacement rate along the longitudinal axis, as shown in Figure 8. The patterns derived from the two datasets are identical, however, the displacement observed from the CSK were stronger than the S1 results as shown in Figure 8. In particular, the difference significantly appears at the span where the strongest subsidence is observed. The RMSE of the vertical velocity between CSK and S1 reaches 1.26 mm/year. This inconsistency is possibly due to the two reasons which are the underestimation of the horizontal displacement or the characteristic differences between two sensors. In order to clarify the reasons, we also applied PSI to the multi-looked interferograms from CSK dataset. We took 5 (range) × 6 (azimuth) looks to achieve a similar spatial resolution of the Sentinel-1 data. The investigations show that the subsidence rate is much similar to the S1 subsidence rate showing RMSE of 0.85 mm/year, implying the discrepancy is a result of the spatial resolution differences of CSK and S1 dataset.
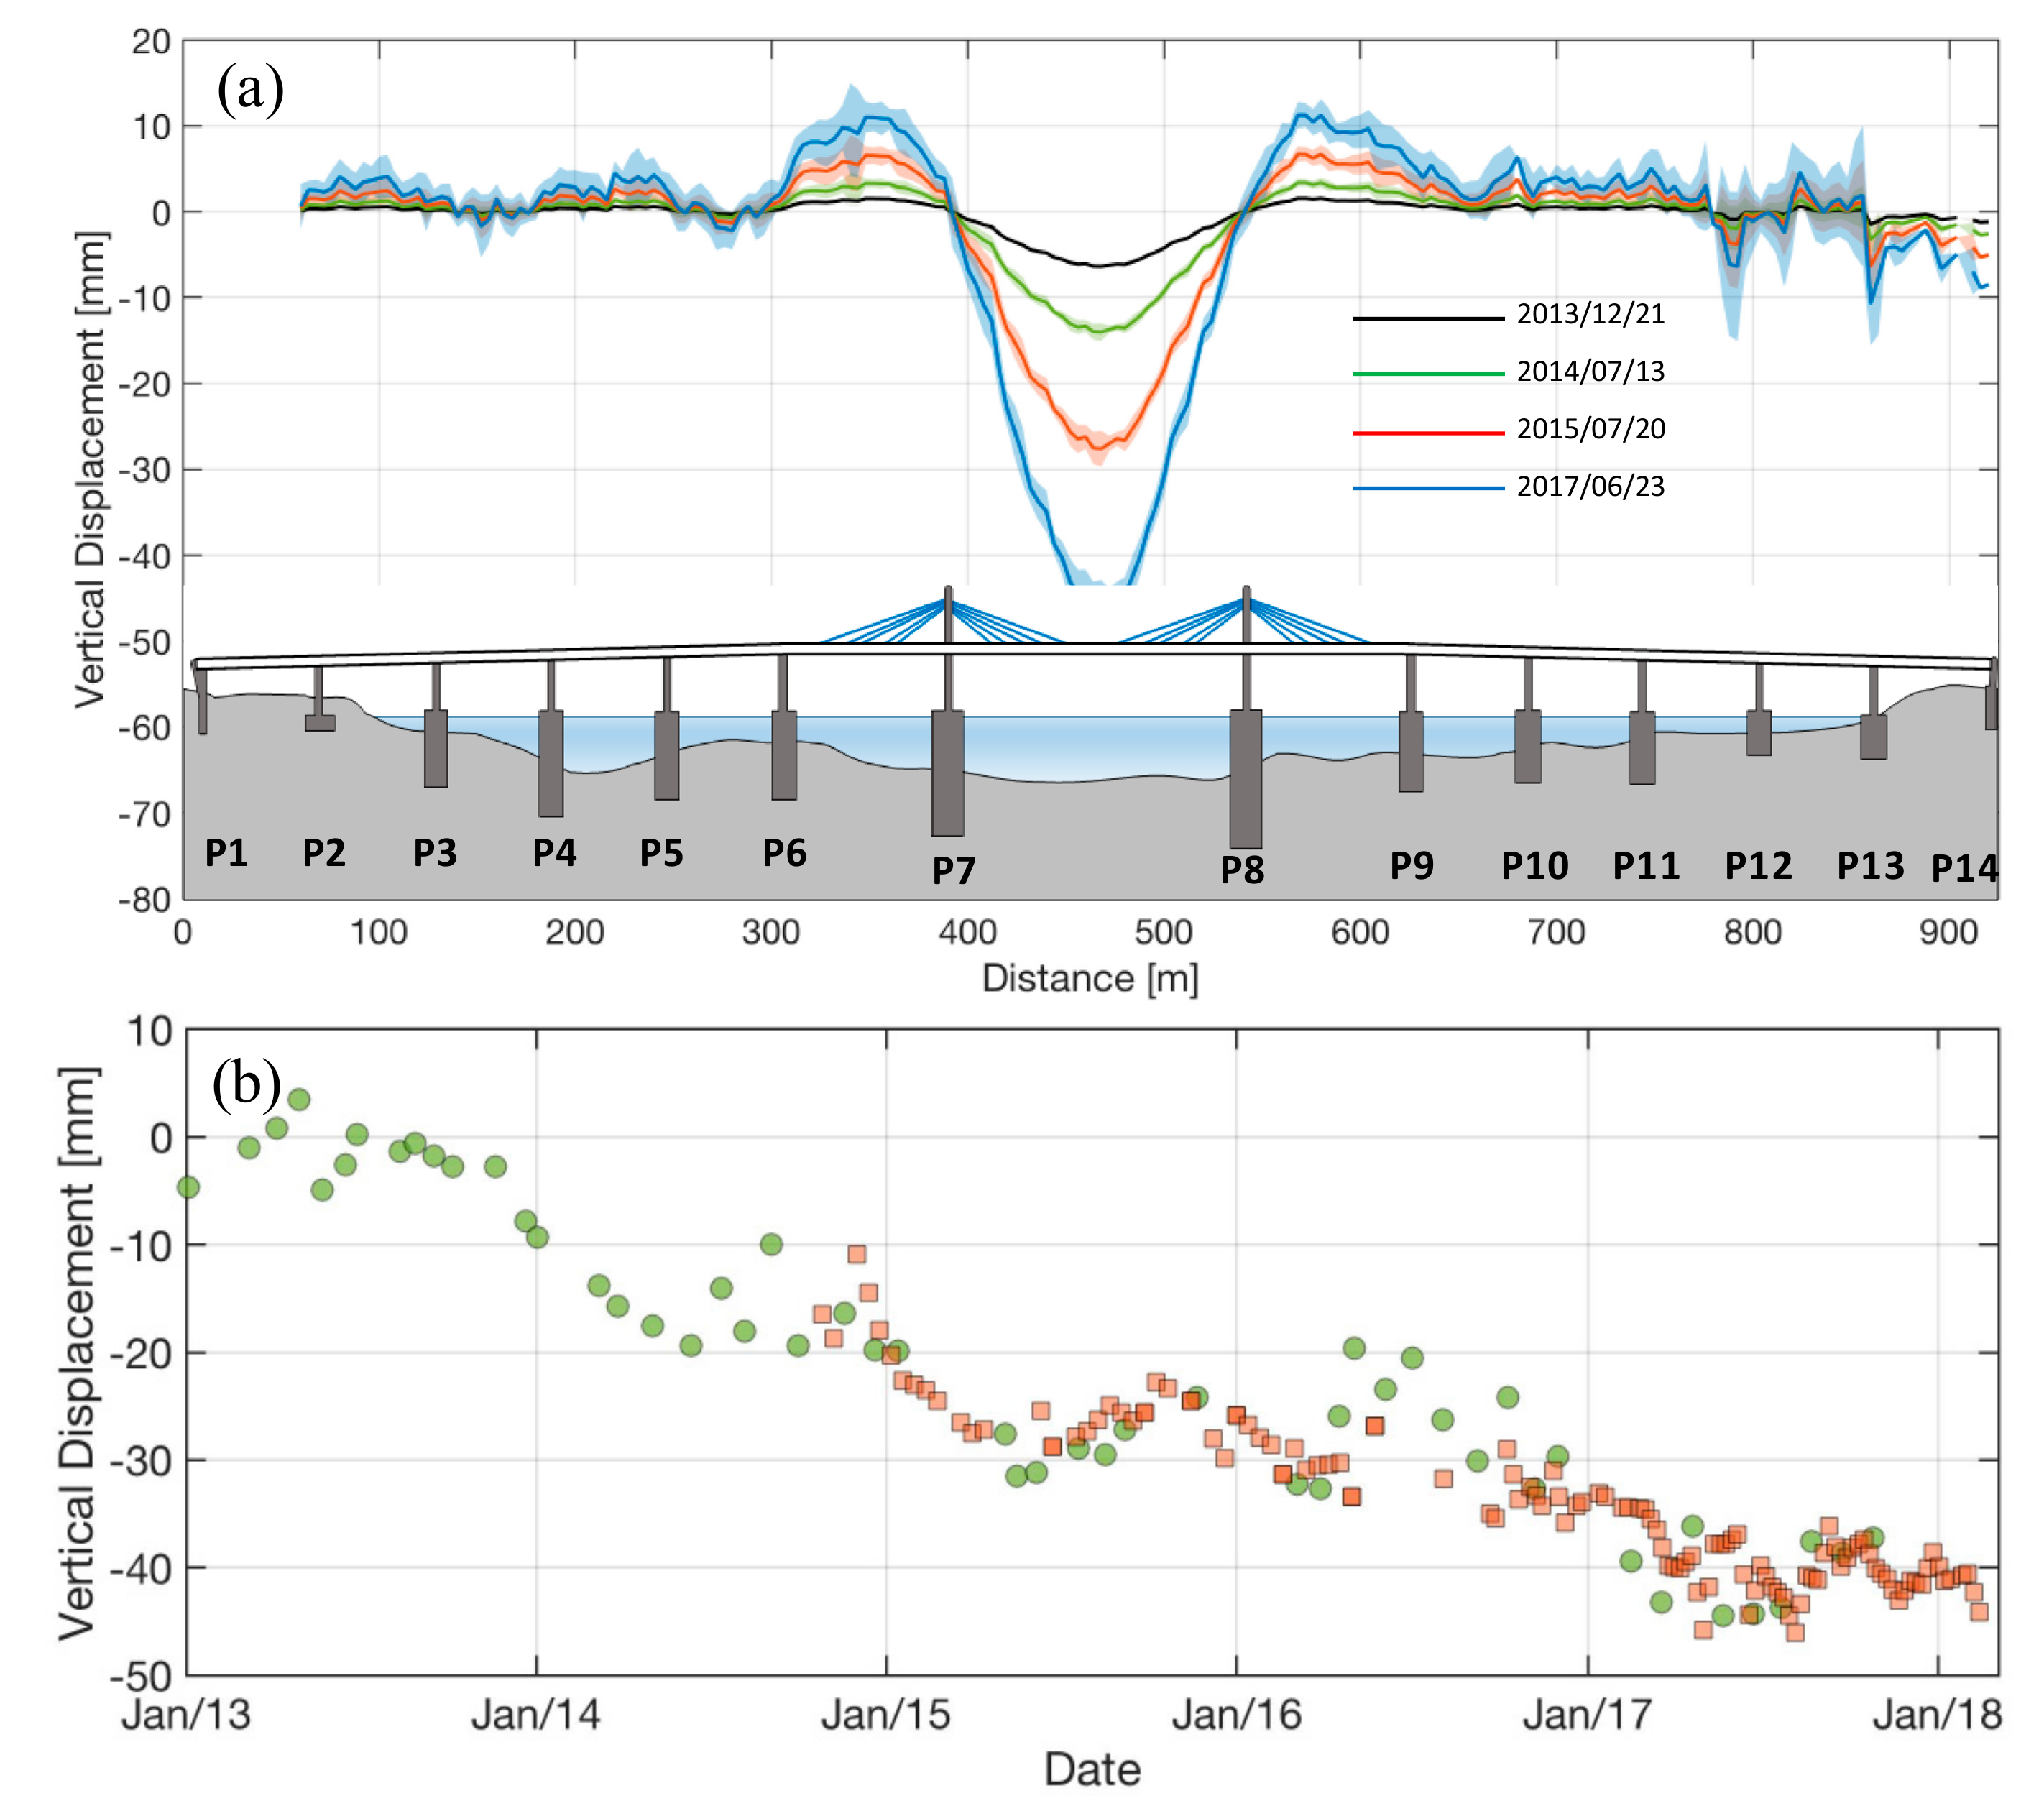
In order to understand the behaviors of long-term deflection in detail, we used the inverted distance weighting (IDW) interpolator to obtain the weighted average displacement for each acquisition date and calculated its standard deviation with a 5-m window along the longitudinal axis. Among them, we selected the representative dates of the displacements and plotted the along cross-section of bridges as shown in Figure 9. Also, we illustrated the time-series of vertical displacement caused by long-term deflection for all acquisition dates including CSK and S1 at the points between P7 and P8 where the most significant displacement shows. The largest downward displacement is observed at mid-span reaching around 47 mm at the end of observation period. Interestingly, the displacement rates are almost zero near the towers (P7 and P8), which means the deck nearby the towers appears to be immovable over the observation period. On the other hand, upward displacements are observed at the middle parts between towers and prestressed concrete box girder bridge, i.e., mid-spans of P6–P7 and P8–P9. Based on this observation, we can identify that the beam stayed by the cable is bending at mid-span and is strongly supported by the piers. Moreover, the significant downward displacement at mid-span of the extradosed bridge leads to hogging the outer parts of the beam. In contrast to the extradosed bridge part, the prestressed box girder bridges show the range between −5 mm to 5 mm for 5.5 years, except P13, which means that the bridge parts along P1-P6 and P10-P13 have remained relatively stable. For P13, it might represent the presence of the ground subsidence, however accurate analysis was not performed because the pixels located on ground near P13 are decorrelated.
The time-series displacements at the location of maximum downward displacement and piers are shown in Figure 9b. The multi-looked time-series displacement extracted from the CSK show a similar level of the displacement of S1 data over the overlapped period. The deflection has been continuing from the first acquisition of the CSK dataset up to end of the observation (S1 dataset) with a similar level of the displacement rates. This indicates that the Kimdaejung Bridge has been undergoing bending and deflection at a constant rate, so continuous monitoring and analysis needs to be carried out in order to assess the health of the structure and potential risk.

4.2. PSI Displacement: Muyoung Bridge

The second case is the Muyoung bridge which has the 144° orientation angle clockwise from the north. Considering the satellite heading directions of descending and ascending track as listed in Table 2, both stacks of CSK and S1 observations have significant sensitivity to the longitudinal displacements and the vertical displacements. Thus, a more comprehensive analysis is required to obtain reliable signals related to the long-term deflection as a general case in practical applications.

4.2.1. Thermal Dilation Analysis

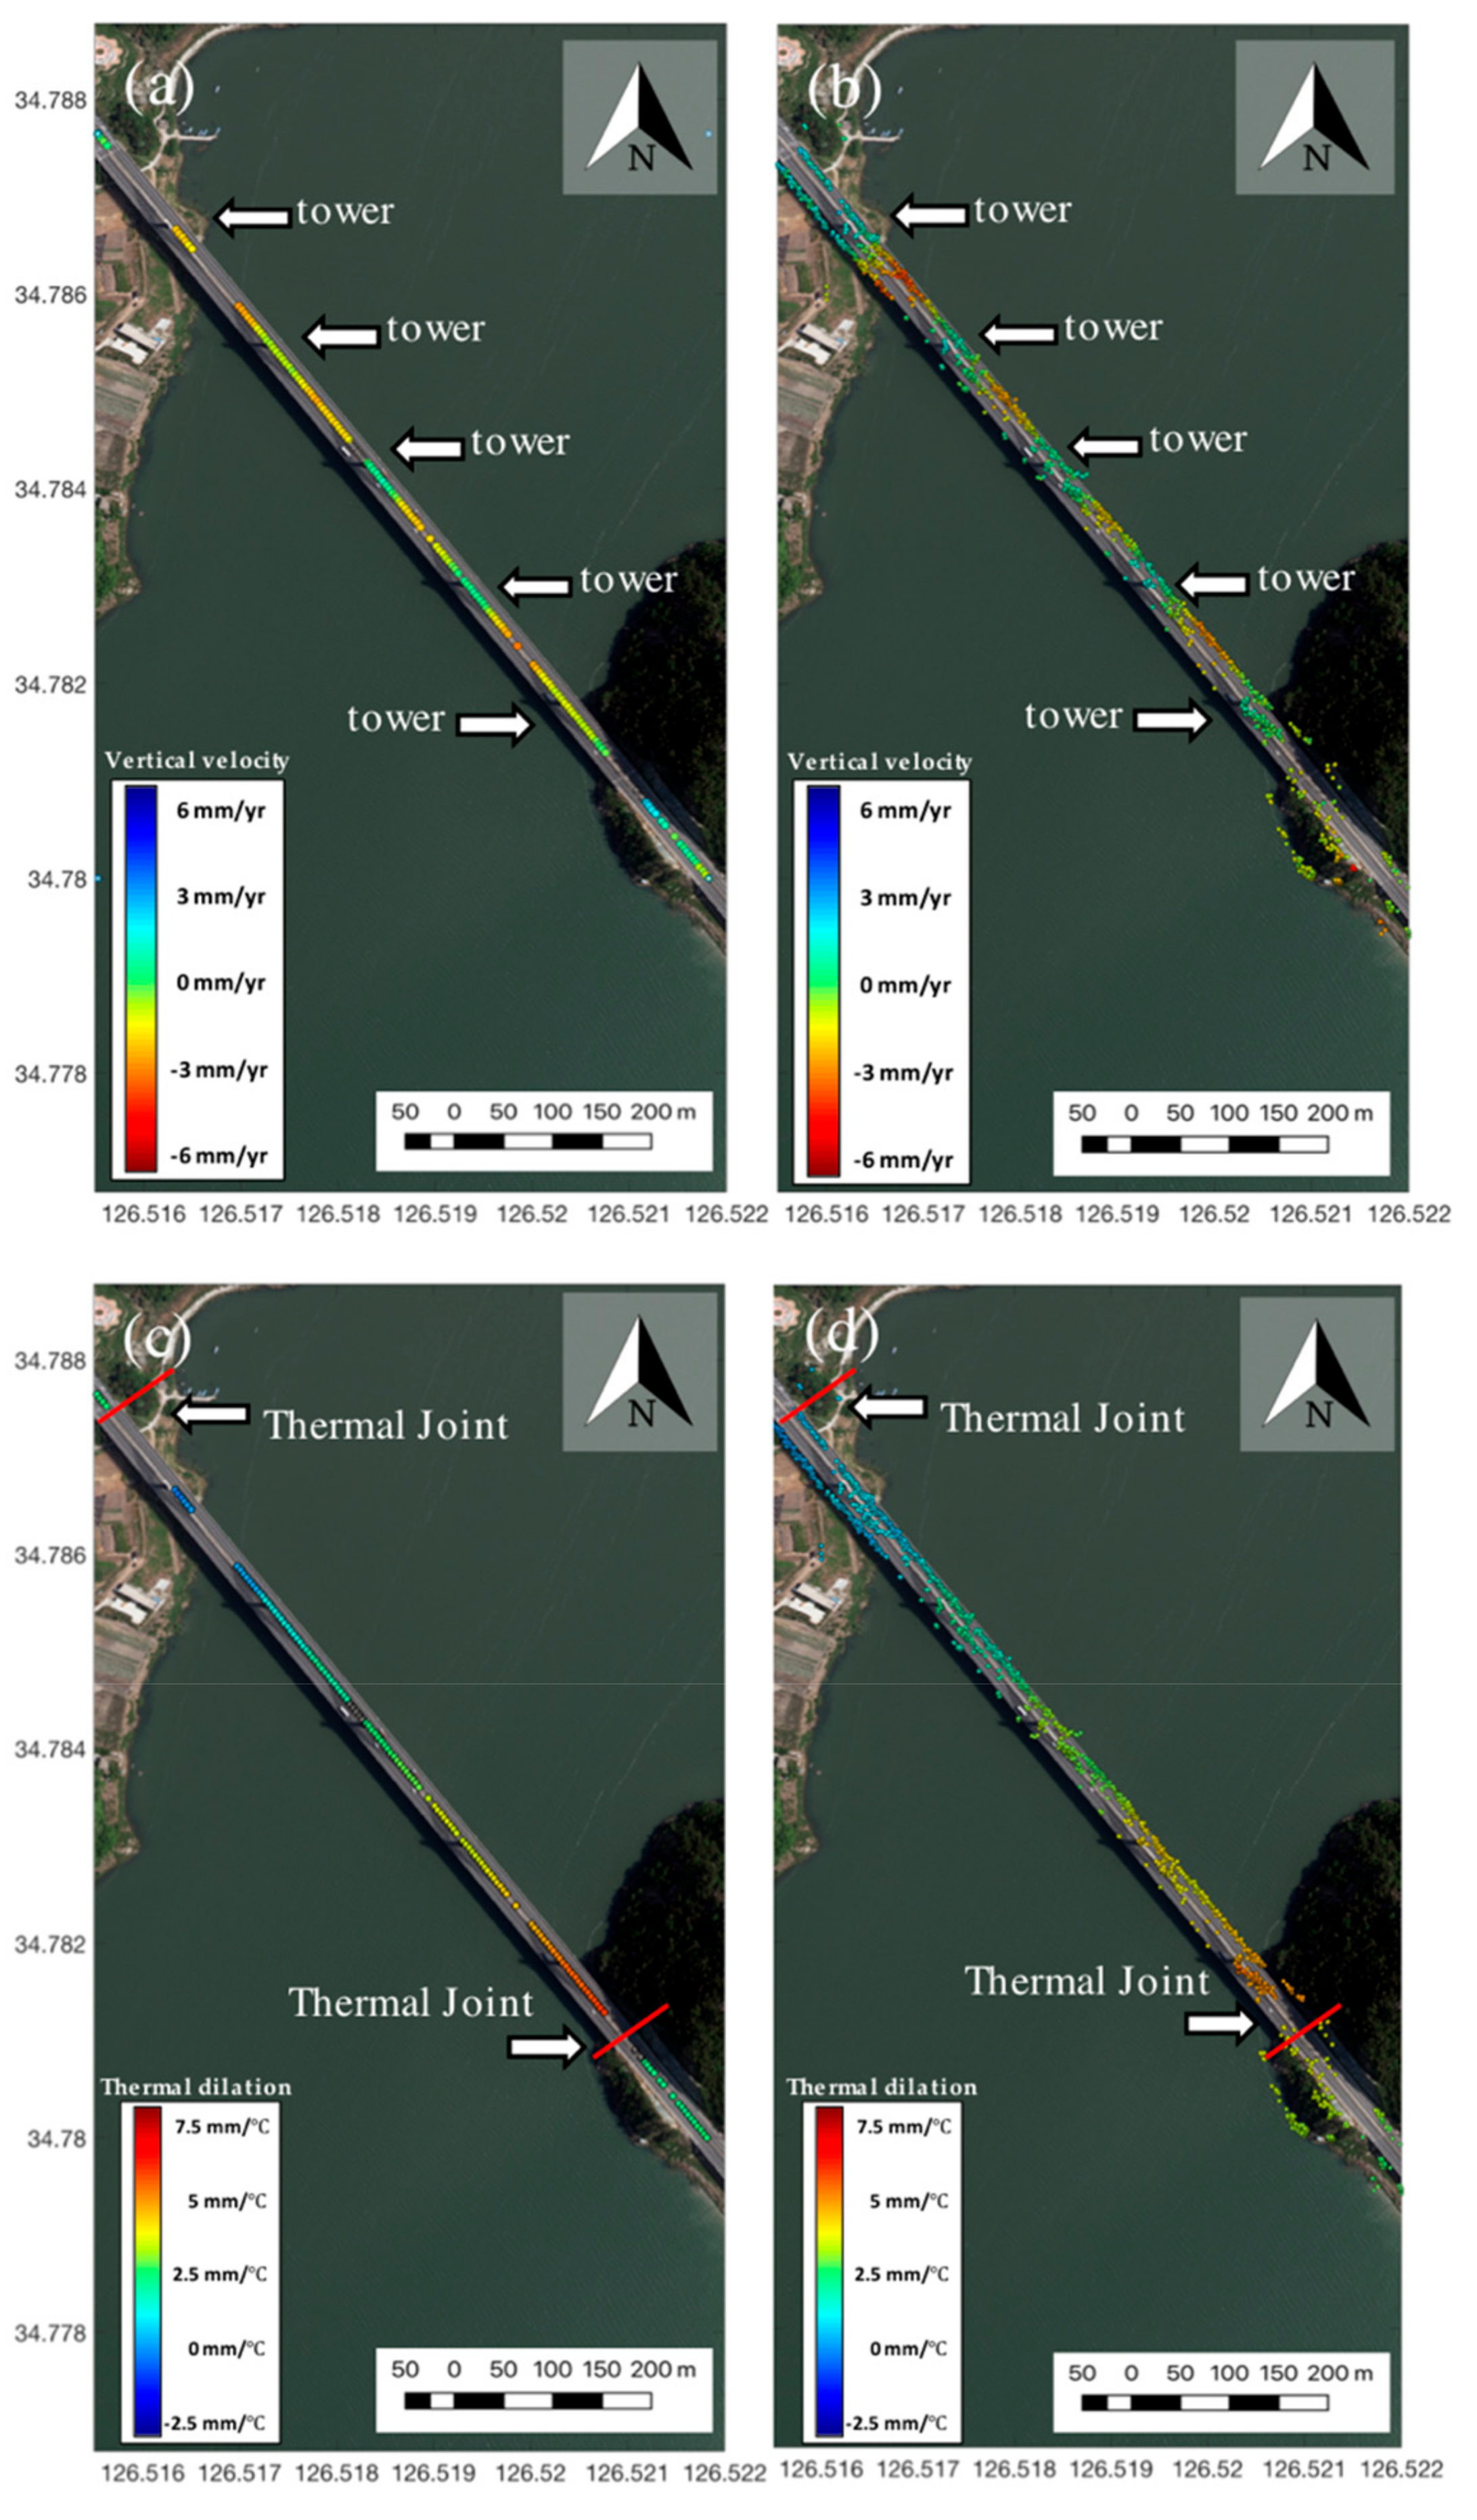
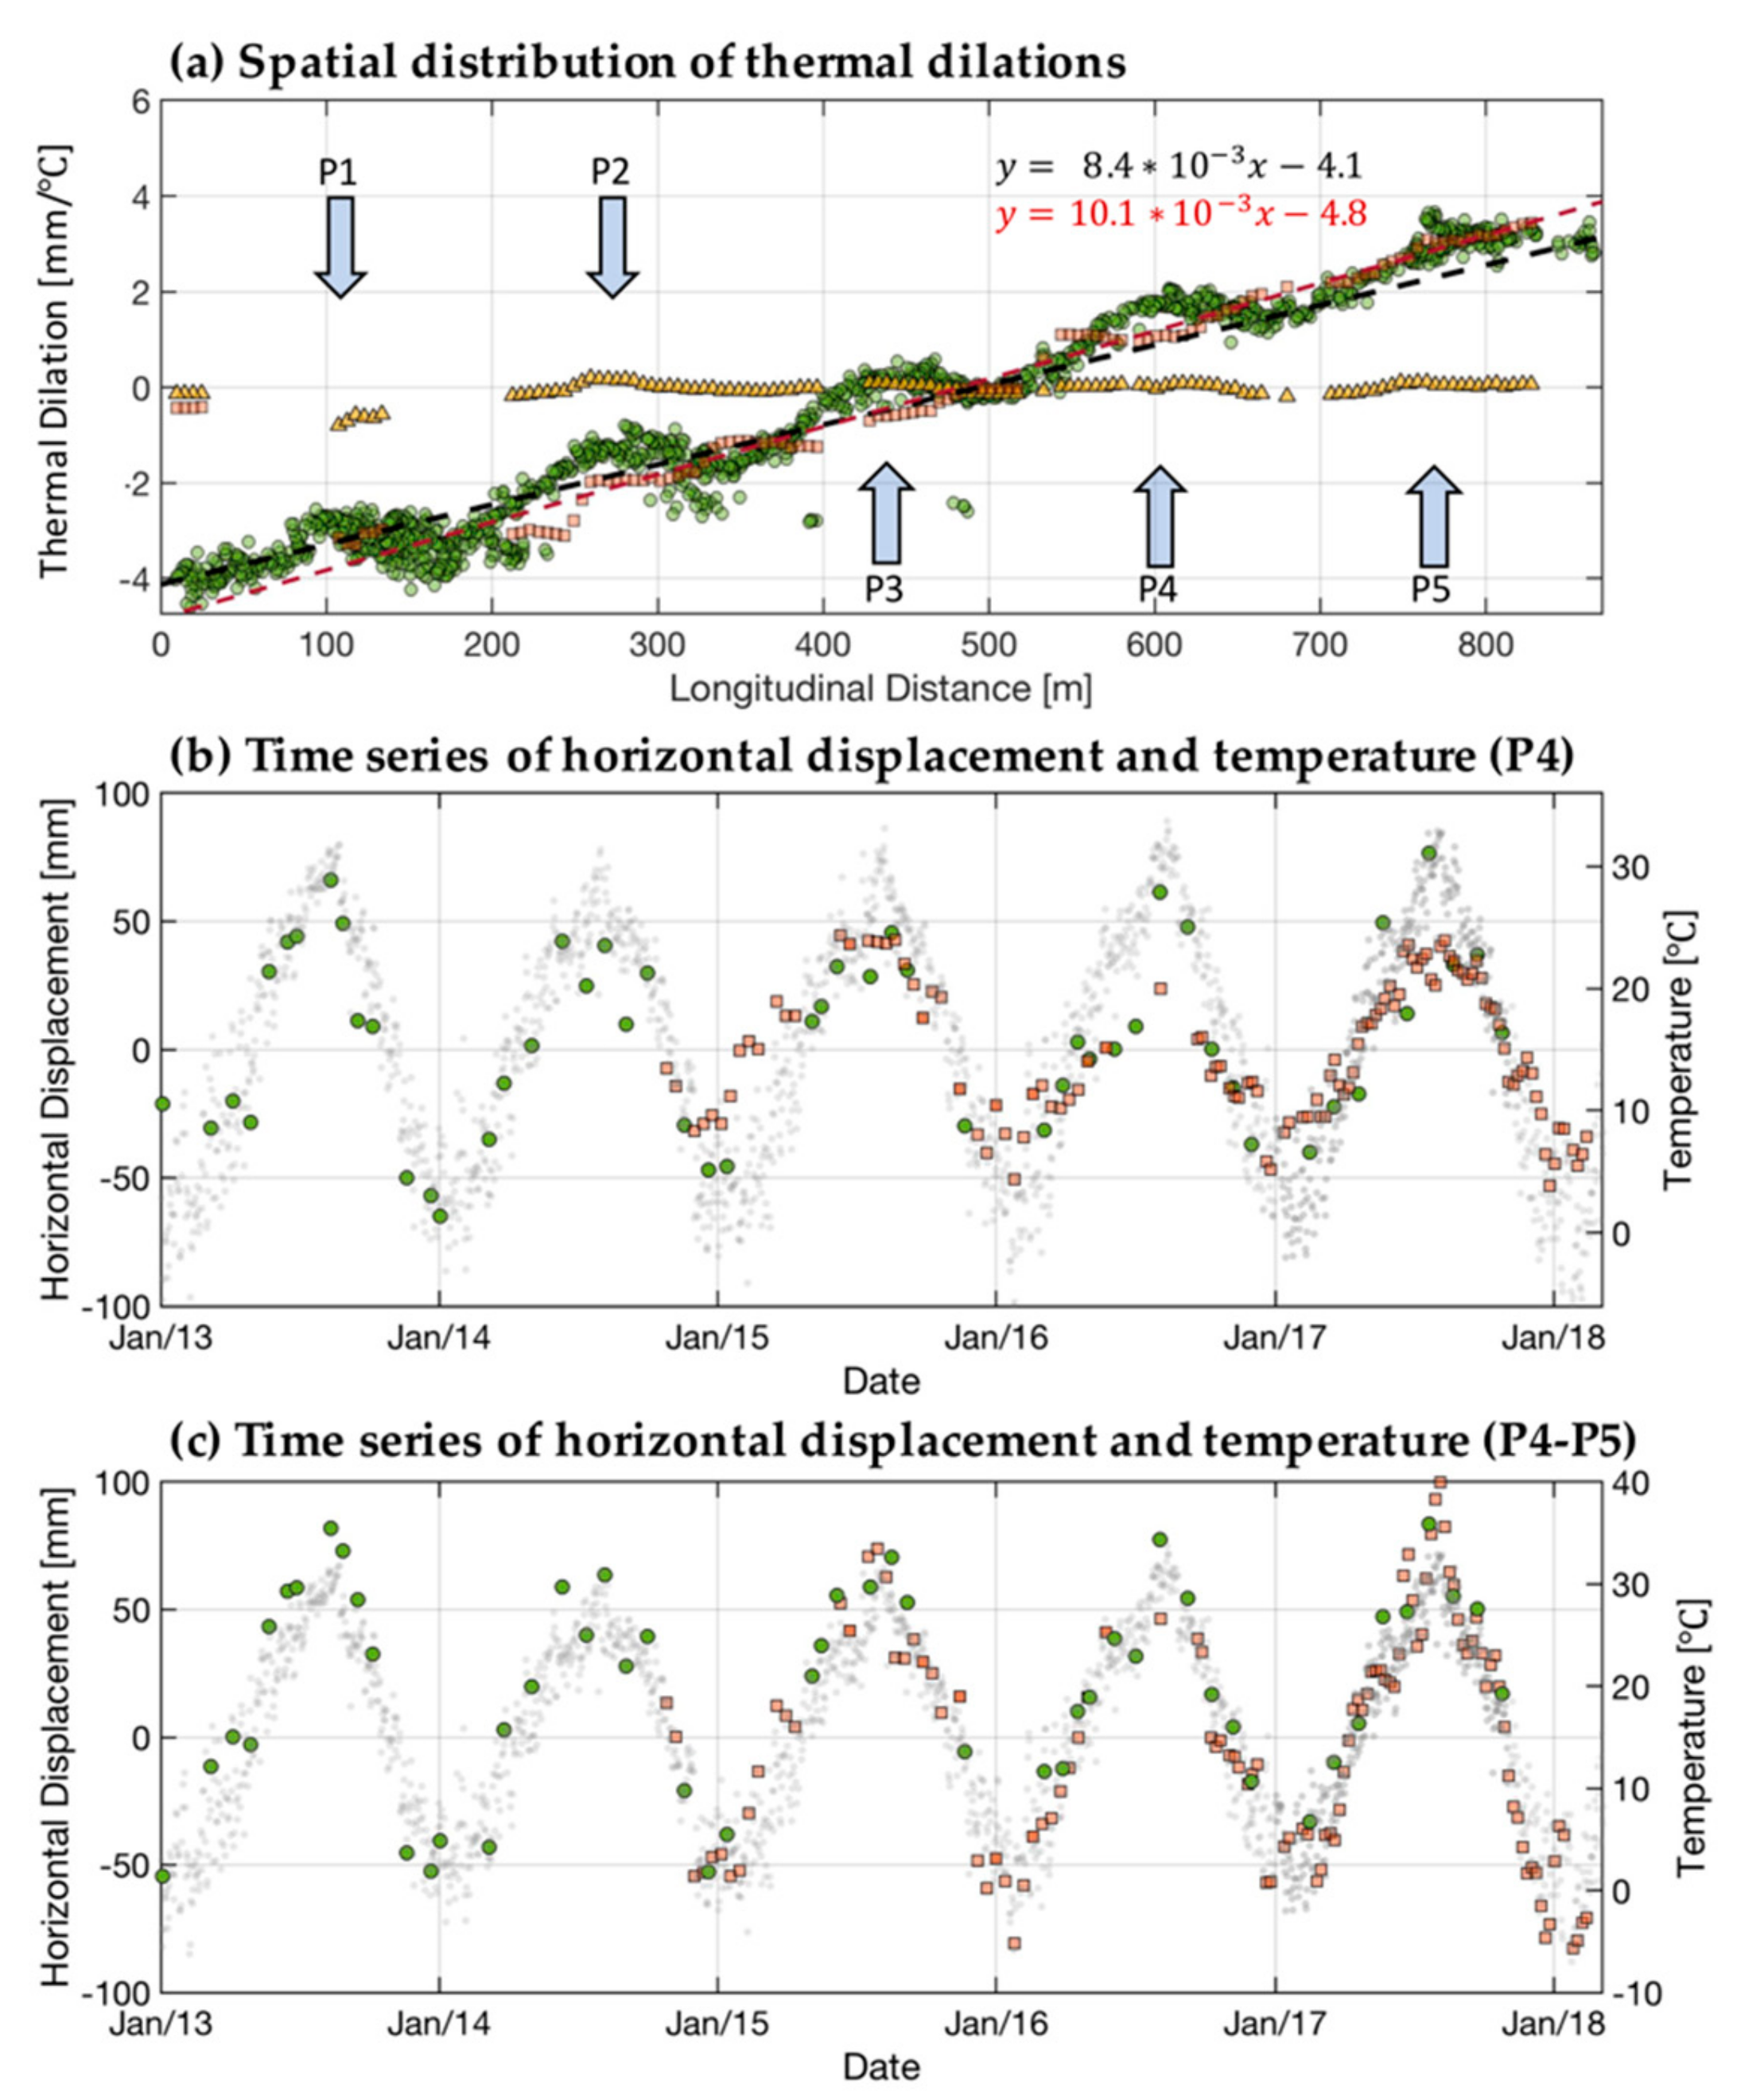
To estimate the thermal dilation effect of the bridges structure, we applied the methods described in Section 3. In detail, the thermal dilations for the vertical and longitudinal displacements can be extracted separately using a combined dataset of the descending and ascending S1 dataset by estimating the component that is linearly correlated with the temperature data (see Figure 10a). Meanwhile, the thermal dilation along the longitudinal axis of the CSK dataset was obtained under the assumption that the temperature variation does not affect the vertical displacements. Hence, the temperature-correlated component was estimated first in LOS direction and converted to the longitudinal direction using the CSK imaging geometry and the orientation of the Muyoung Bridge (see Figure 10b). This assumption is a key component for the estimation of the thermal dilation and the long-term deflection of a bridge using single-track SAR observations. This seems reasonable based on the observation of the spatial distributions of the thermal dilation extracted from the S1 dataset as shown in Figure 11a. Based on the correlation between the vertical displacement and the temperature, its coefficient is relatively smaller than the horizontal thermal dilation. The mean value of the vertical thermal dilation is around 0.03 mm/°C meaning that the temperature variation of this study area only causes the around 1.2 mm of displacement difference between winter and summer season. Thus, it is not surprising that the majority of the thermal dilation is contributed by the horizontal thermal dilation. Figure 11b,c shows the horizontal time-series displacement at span and pier estimated from S1 and CSK datasets. Apparently, both the estimates have strong correlations with temperature variation and magnitude of thermal dilations.
Interestingly, both analyses using the S1 and CSK datasets show the similar increasing patterns of thermal dilation from northwest to southeast. Here, the positive values indicate that the positive temperature variation induces the movement of the object toward the southeast, while the negative values lead to the movement toward the northwest. According to the thermal dilation profile, the values range from –5 mm/°C to 4 mm/°C, which means that the temperature difference between summer and winter can lead to displacement differences in the longitudinal axis. Such dramatic discontinuities are also observed at the end of the bridge, which corresponds to the location of thermal expansion joints. Also, the decks on the piers (towers) are affected by thermal dilation as shown in Figure 11b. From the aspect of bridge engineering, the superstructure of Muyoung bridge is constructed as a continuous span, meaning that all spans are connected and they are behaving as one long structure. This type of structure is preferred in extradosed bridges in order to increase the length of span and to use fewer piers. This is why Muyoung bridge demonstrates a huge magnitude of thermal dilation in the horizontal direction without discontinuities. In previous research focusing on the bridges with multiple thermal expansion joints, the thermal dilation shows discrete patterns at the thermal expansion joints having a relatively small magnitudes [17,35]. Therefore, the spatial pattern of the thermal dilation is governed by the types of deck, boundary conditions, and locations of thermal expansion joints.
The deck, as a superstructure of the Muyoung bridge, is composed of the prestressed concrete. It is possible to analyze the physical property of this material using a linear correlation between the estimated thermal dilation and length of the bridge structure, as shown in Figure 11. Their gradients from CSK and S1 datasets are 8.4 × 10⁻⁶/°C and 10.0 × 10⁻⁶/°C, respectively, indicating that the temperature variation causes the change of the length of the bridge, and it is proportional to the total length of the structure. A typical value for the concrete material is around 10.0 × 10⁻⁶/°C, ranging from 7 to 12 × 10−6/°C [36]. Therefore, the estimates of the thermal dilation coefficient are on reasonable range.

4.2.2. Long-Term Deflection Analysis

The vertical displacement rates calculated from asc-des stack of S1 dataset and single-track CSK dataset clearly reveal the spatial pattern of long-term deflection as shown in Figure 10a,b and Figure 12a. It is interesting that the pixels with high displacement rates are mainly found on the decks between the towers’ staying cables (mid-spans). These phenomena are found identically in both X-band and C-band PSI results and are similar to the case of the single-span extradosed bridge (Kimdaejung Bridge). However, unlike the case of the single-span extradosed bridge, the multiple deflection patterns between towers are also observed due to the structure type of the multi-span bridge. Hence, the results indicate that every span stayed by the cable is prone to long-term deflection. The longitudinal displacement rate derived from the dual-track S1 dataset does not exceed that 0.5 mm/year. This result implies that the single-track PSI assumption for conversion from LOS to vertical direction is acceptable.
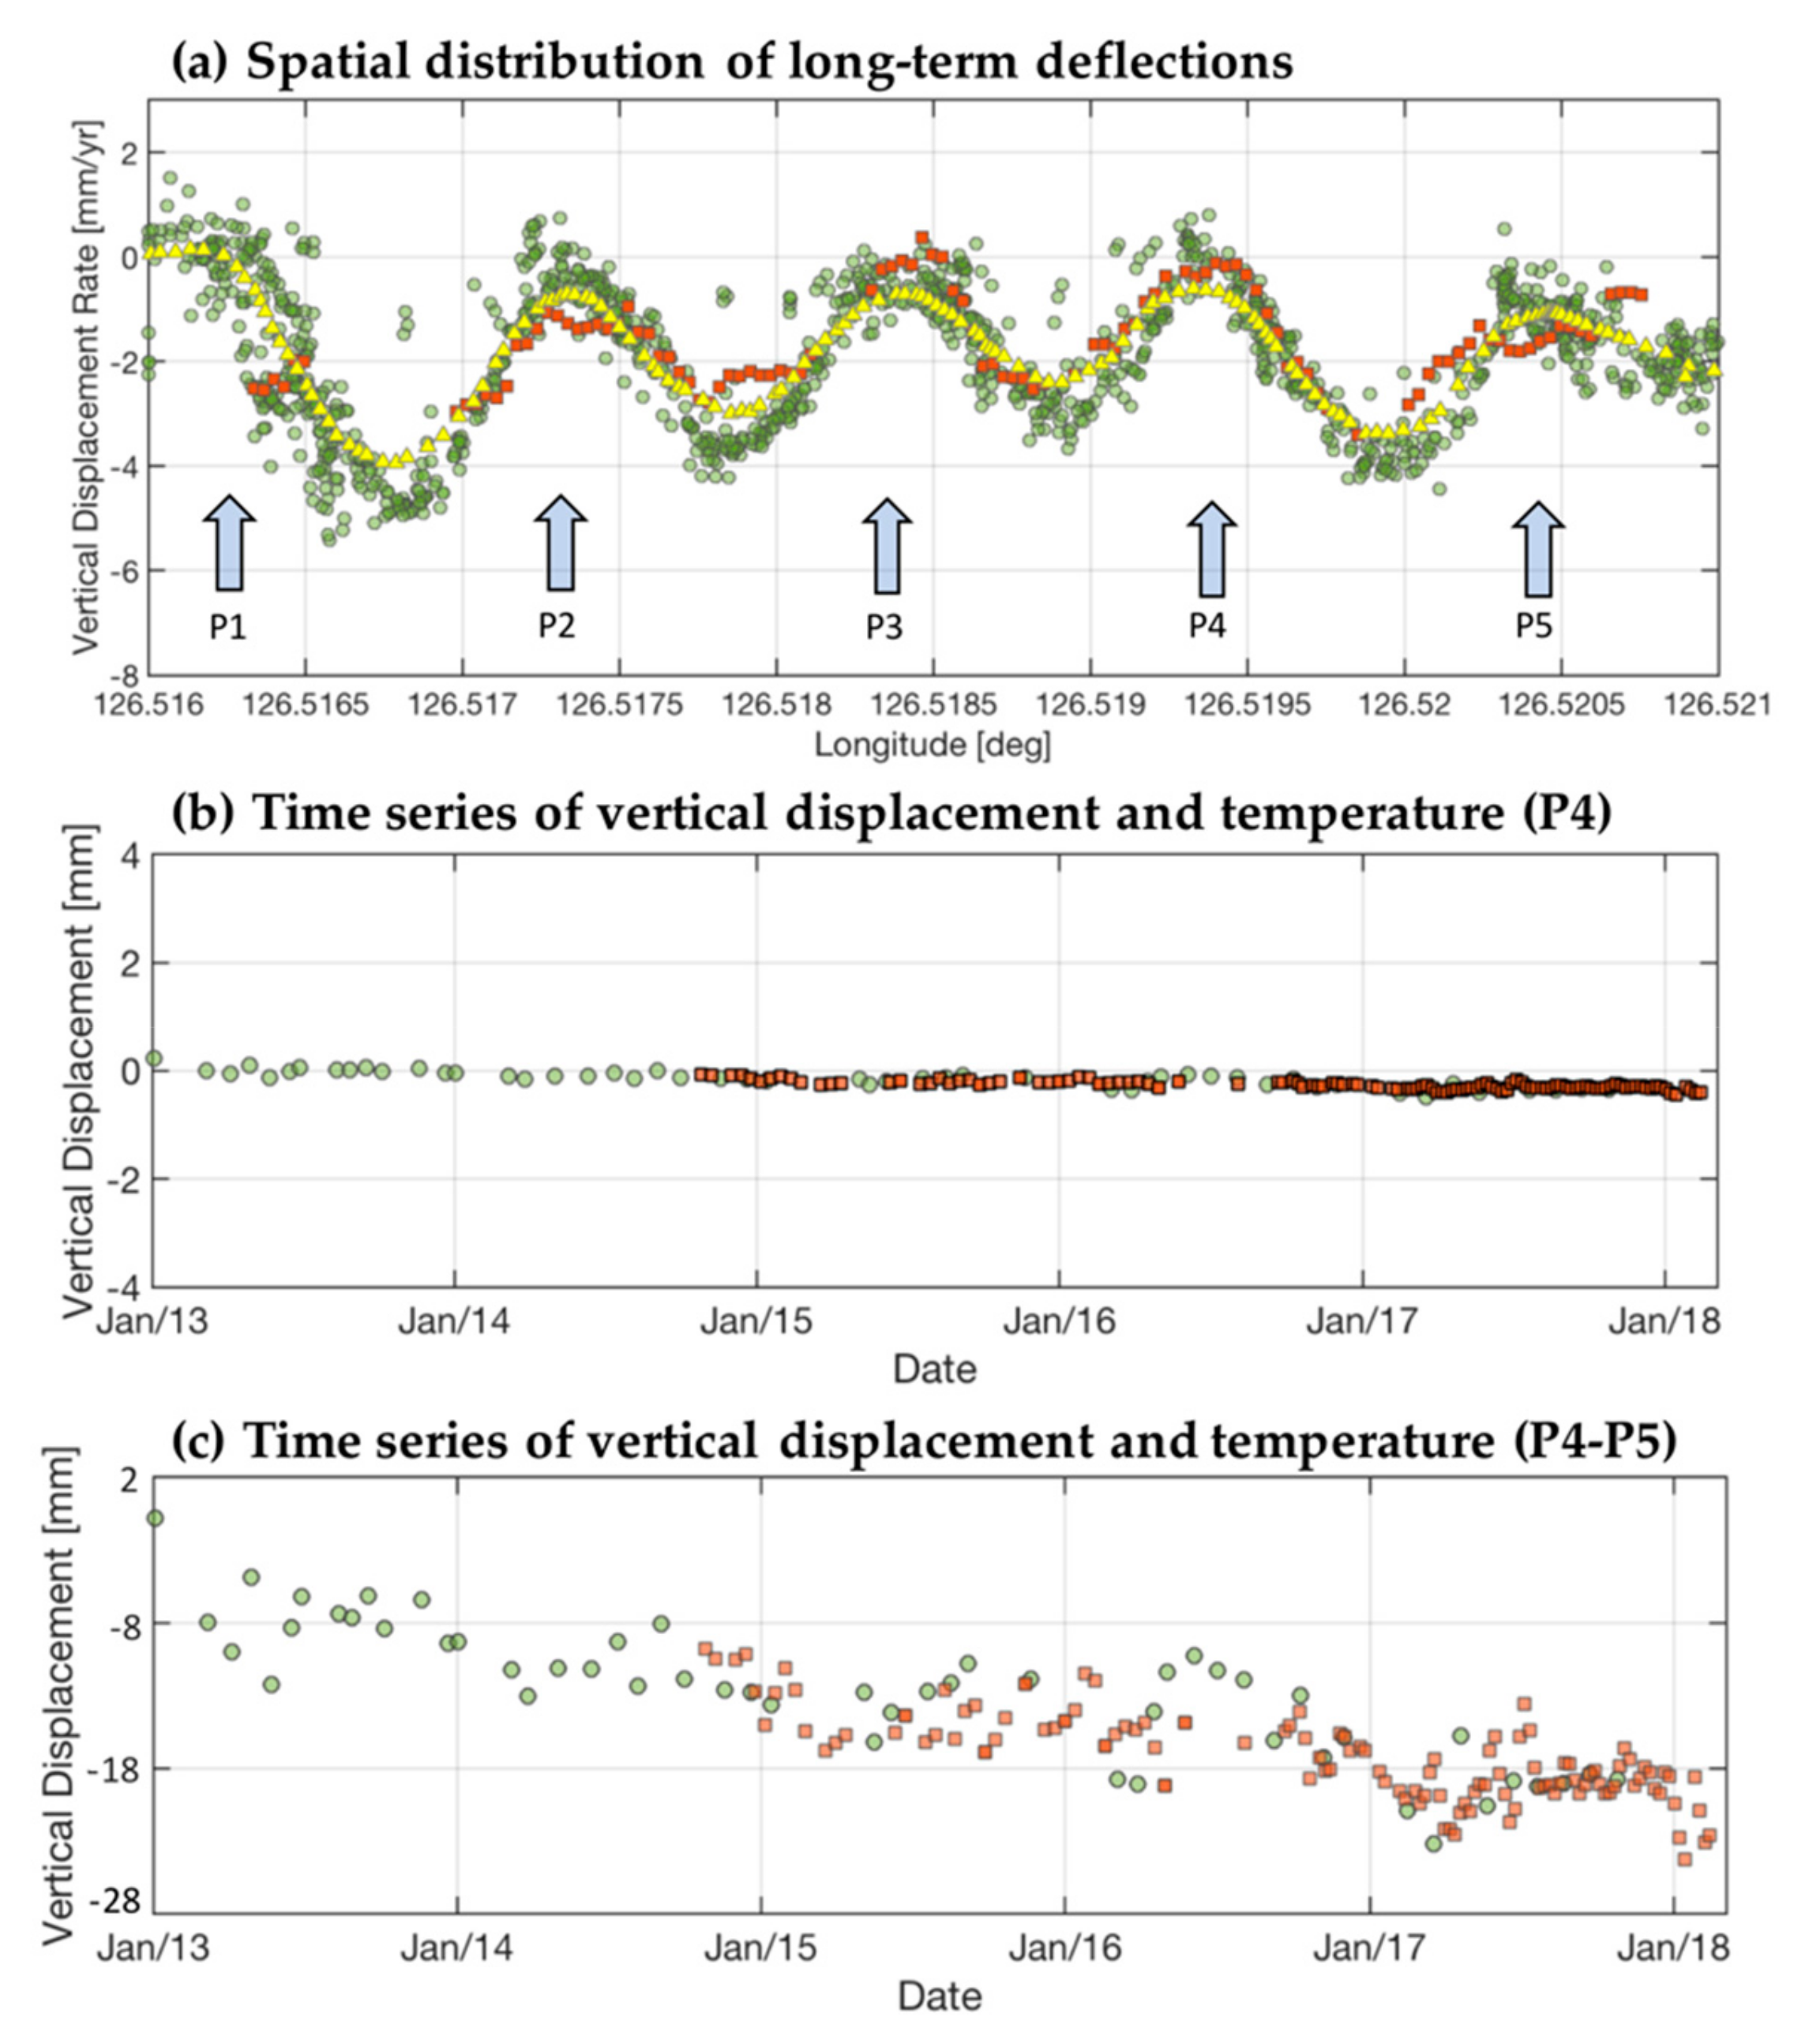
At each mid-span, the vertical displacement rates computed from CSK dataset and S1 dataset show the different range of values, hence, −5 to −3.5 mm/year for the CSK dataset and −3.5 to −2.5 mm/year for the S1 dataset were detected. The RMSE between the two velocities reaches 0.95 mm/year. In order to understand this inconsistency, we reprocessed the PSI method after applying the multi-looking (5 range × 6 azimuth) to CSK dataset corresponding to the similar spatial resolution of S1 dataset. The coarse resolution PSI results closely match the S1 PSI results as illustrated in Figure 12a and its RMSE is 0.75 mm/year. This result represents that the coarse spatial resolution of the S1 dataset can smooth the spatial patterns of the deflection.
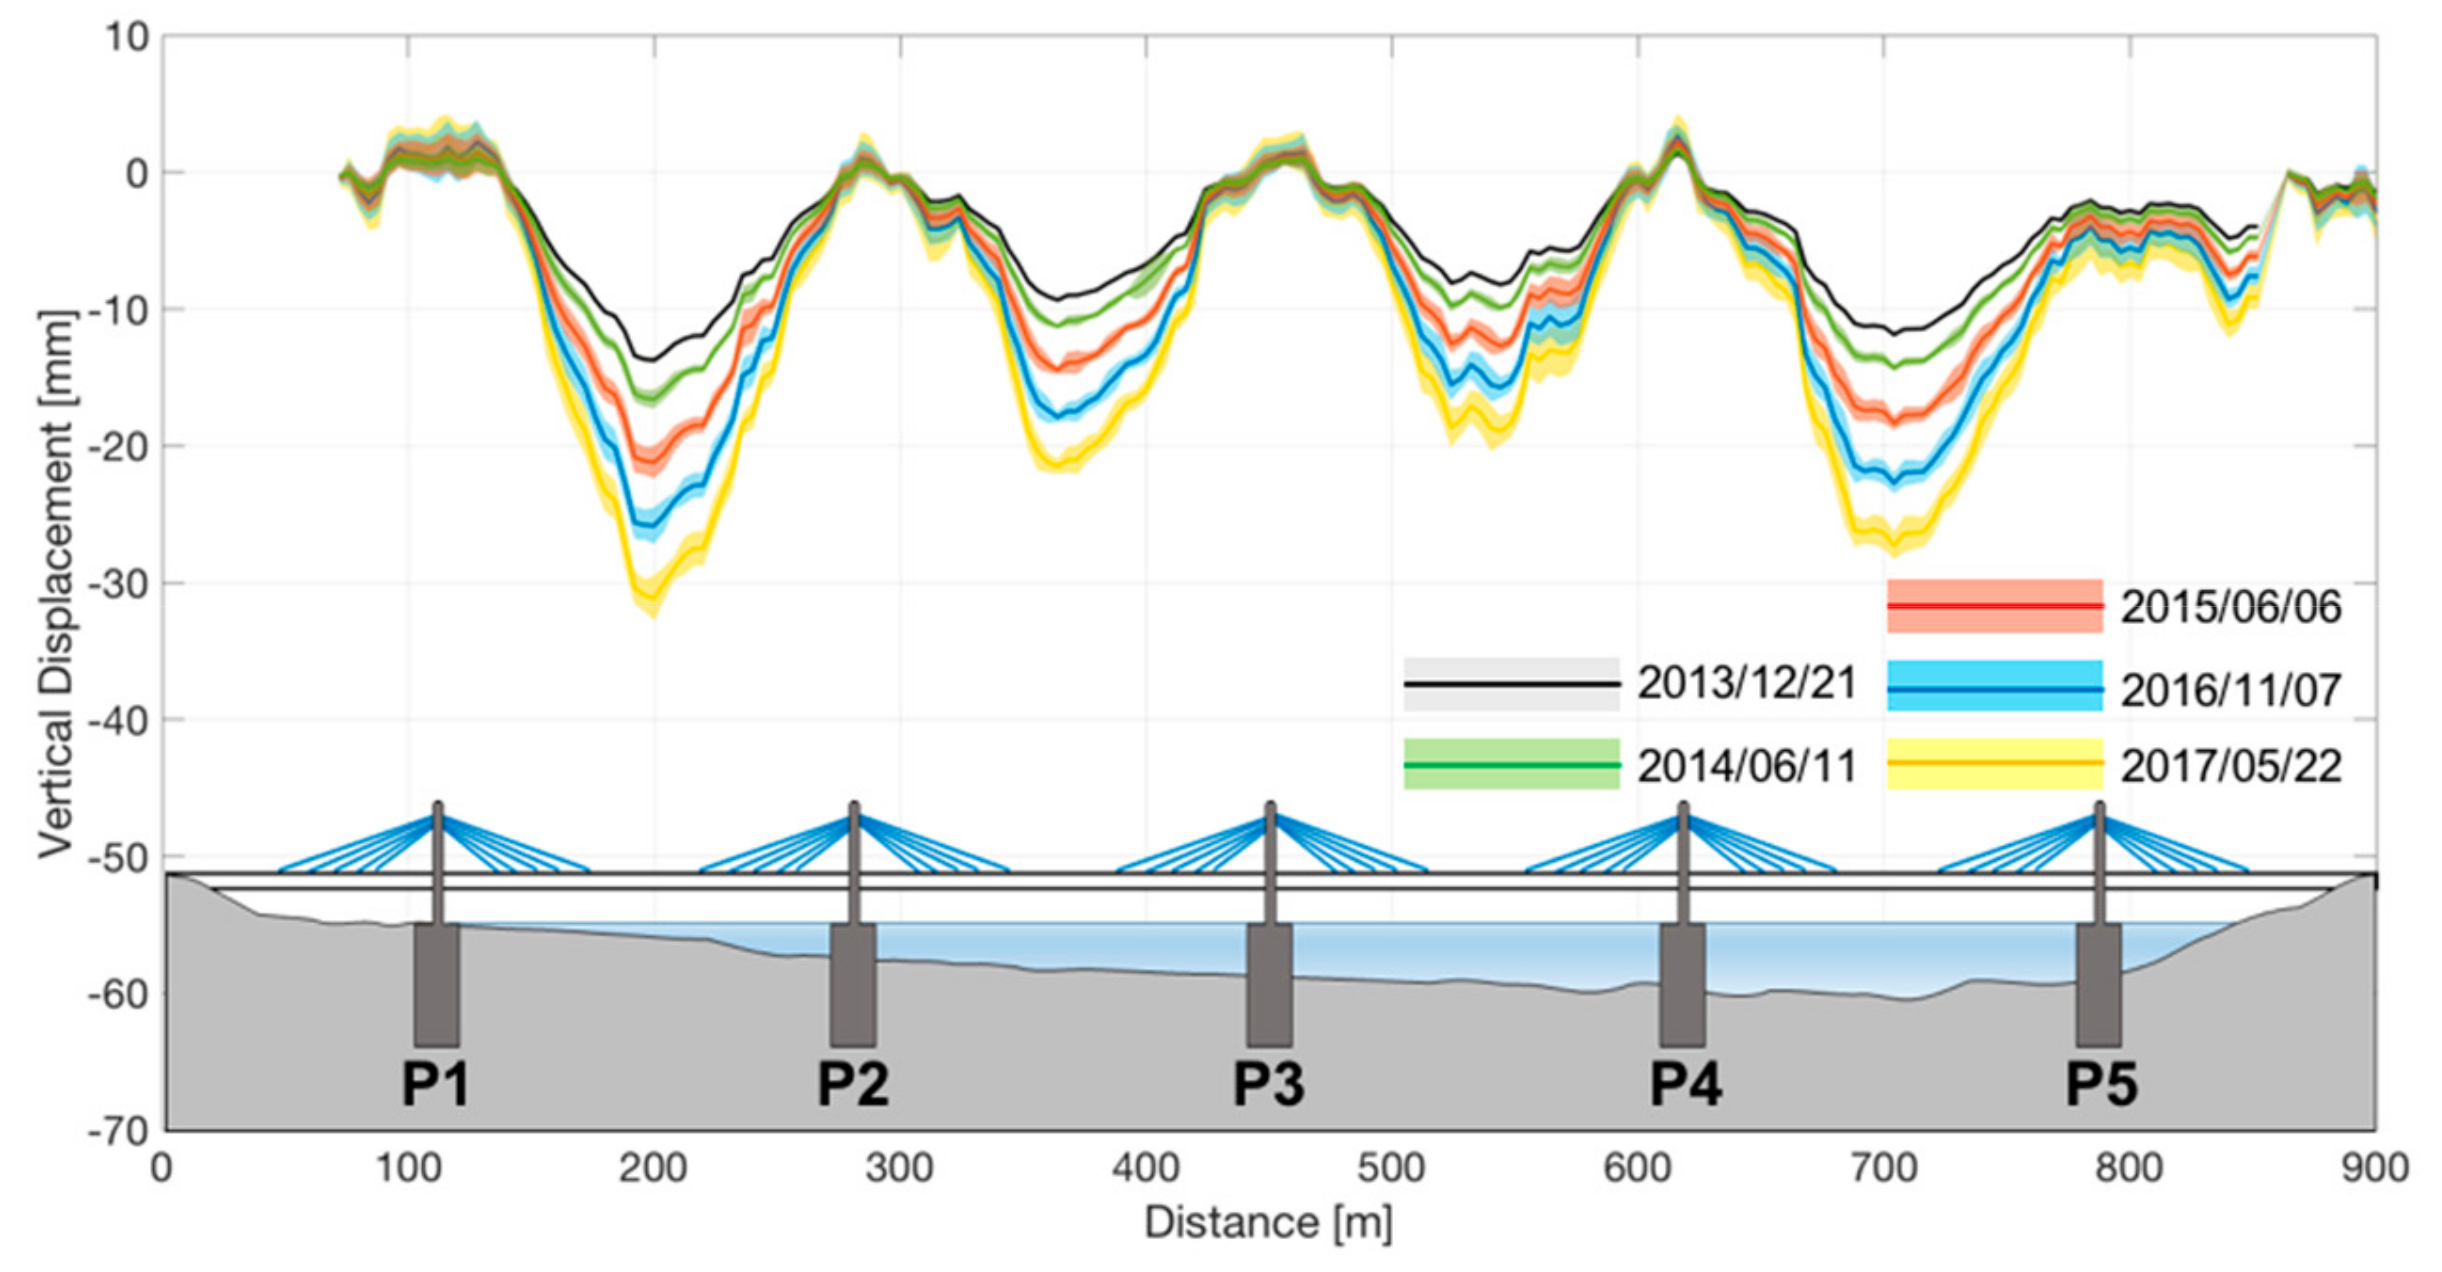
The vertical velocities near the piers are nearly zeros, as expected, implying that the piers are strongly supporting the superstructure (see Figure 12a). The time-series of the vertical displacement at P3 was illustrated in Figure 12b, clearly showing a small variation over the observation time. Meanwhile, the time-series of the displacement between P3 and P4 shows that the span between piers has been continuously subsiding as shown in Figure 12c. Its vertical displacements had reached 8, 12, 17, and 22 mm at end of the year 2013, 2014, 2016, and 2017, respectively.
In order to assess the long-term deflection components in the spatial domain, we made the evenly spacing distance array and applied the IDW interpolator along the longitudinal direction as shown in Figure 13. The spans between towers have been growing over the observation period, in particular, the spans between pier 1 and 2, and pier 4 and 5 show stronger deflection.

5. Discussion

This study analyzed two extradosed bridges, the Kimdaejung Bridge and Muyoung Bridge, for their long-term deflection using the PSI technique on X-band COSMO-SkyMed and C-band Sentinel-1 dataset. Even though the displacements along the LOS direction themselves can be used for the analysis of the thermal dilation and deflection, the interpretations along the vertical and longitudinal axes are obviously more advantageous in order to physically understand the historical behavior of the bridge structures. Therefore, we collected the S1 dataset acquired at the ascending and descending tracks, and resolved the vertical and longitudinal displacements. The S1 dataset, which is freely available to the public and has the small temporal baseline, is appropriate to capture the displacement signals, however, the relatively coarse spatial resolution may smooth the spatial patterns of displacement as found in our case studies. Meanwhile, the X-band CSK sensor has a higher resolution, whereas the cost of collecting dataset may challenge comprehensive analysis such as measuring both vertical and horizontal displacements. With a reasonable assumption that temperature change dominantly induces horizontal displacement, the thermal dilation and the vertical displacements were successfully estimated from the PSI analysis on a single-track stack of CSK data, and they were cross-validated with the values derived from the dual-track S1 data. This implies that the single-track PSI analysis also has the potential to estimate the vertical and longitudinal displacement of bridges. However, the factors which can influence the displacement behaviors, such as types of bridge, static structure and so on, should be taken into account for the purpose of realistic assumptions. For example, temperature variation can also lead to vertical thermal dilation in the case of the deck suspended by a cable because the length of the suspender (steel wire) is elongated by the temperature variation, and results in the vertical movement of the span [20]. If the bridge is a hyperstatic structure, meaning that the number of constraints is greater than the degrees of freedom, the thermal dilation leads to vertical movement as well [16]. Therefore, the background information for the bridge or/and the additional measurement of displacement, including GPS, leveling, and extra PSI results, which were Sentinel-1 A/B results in this study, need to be comprehensively combined for reasonable interpretation.
In addition to the long-term deflection and thermal dilation, the ground subsidence and scouring effect could be sources of the displacement [37,38]. According to [39], the consolidation of the soft layer where the piers are located extensively affects ground subsidence and leads to the subsidence of the bridge as well. Further, significant displacements can be introduced by scouring effects, finally leading the bridge to collapse [40,41]. However, our cases seem to be unlike the above cases. In general, the ground subsidence extensively causes the displacement in space, then accordingly its effect appears over not only spans, but also at the piers. If the scouring effect exists, then displacement around the piers should be noticeably significant. However, the long-term deflections we identified from our cases appear along the spans between piers, not at piers. In contrast, the displacements at piers are stable over the observation period. Thus, the spatial pattern of the long-term deflection is opposed to the scouring effects and distinguishable from the ground subsidence. Also, the temporal behavior of the ground subsidence and souring effects is different from thermal dilation. The ground subsidence often shows steady movement. In the case of the scouring effect, it can show up suddenly before the bridge collapses due to a flood event; alternately, the continuous subsidence caused by periodical erosion process can induce the collapse. In contrast, the displacement caused by the thermal dilation is a seasonal phenomenon, thus an elongated length during the summer season is recovered during the winter season. Therefore, the temporal behavior of the thermal dilation is different from those of the ground subsidence and scouring effects. Based on the above perspective, it is reasonable to understand that the displacements observed on the Kimdaejung and Muyoung bridges are not related to ground subsidence and the scouring effect. It is worth noting that the number of PSs selected from the CSK dataset is much higher than that of S1, as listed in the Table 3. The percentage of S1 is higher than CSK because the CSK has the capability to illuminate objects, including the pavement road, barrier, etc. over the deck in detail; however, the low-backscattered signal of the paved road is not selected as the PS. Meanwhile, in the case of S1, the effective summed scattered signals in the relatively coarse resolution can be selected as a PS candidate by increasing the SNR. Bridges are challenging targets for remote sensing because they contain a variety of sources that affect the interferometric phase. Dynamic motions with a high gradient over the small area, including the thermal dilation, short-term deflection due to vehicle movement, and long-term deflection are reasons for this. Thus, it is advantageous to use high-resolution imagery for unwrapping without ambiguity. Therefore, the efforts presented in this paper to utilize high-resolution imagery even in constrained circumstances, such as single-track PSI, are meaningful.

6. Conclusions

The accurate estimation of long-term displacement is important for the structural health monitoring of bridges. We demonstrate that space-borne SAR observations can be useful for the routine measurement of bridge deformation. Particularly, the spatially dense measurements of the time-dependent displacements can provide useful insights into the characteristics of deformation of the bridge structure. We observed deflection patterns in the mid-spans staying the cables. This phenomenon is commonly observed during the initial stage following bridge construction [1]. However, we identified continuing long-term displacements occurring at Kimdaejung and Muyoung bridges. Continuous monitoring of the bridges will provide useful information for better assessing the long-term behavior and maintenance plans.
Presently, the methods for monitoring infrastructure, including bridges, based on SAR interferometry may not be an alternative way to quantitatively evaluate health status because purchasing the imagery, from sources such as CSK, practically analyzing SAR and implementing the monitoring system require significant cost. Currently SAR communities have been aiming to implement an automatic generation system for the differential interferogram and time-series analysis as new imageries are updated and available [42]. Furthermore, the increment of freely available SAR data, including S1 and NISAR mission, might present benefits with respect to the feasibility and sustainability of providing a cost-effective tool [43].
It is also essential to understand the current state and predict the future state considering time-dependent factors for the maximum allowable deflection of the bridge. This might be possible using three-dimensional finite element analysis. With these improvements, our understanding of the displacement mechanism will be advanced to ensure the health of bridges, and ultimately to prevent catastrophic events.

Author Contributions

Conceptualization, J.K.J. and D.J.K.; methodology, J.K.J.; software, J.K.J., S.K.P.V. and D.J.K.; validation, J.K.J.; formal analysis, J.K.J., D.J.K. and S.H.Y.; investigation, J.K.J. and D.J.K. and S.K.P.V.; resources, D.J.K. and S.H.Y.; data curation, J.K.J. and D.J.K.; writing—original draft preparation, J.K.J.; writing—review and editing, D.J.K. and S.H.Y.; visualization, J.K.J.; supervision, D.J.K.; funding acquisition, D.J.K.

Funding

This research was supported by Ministry of Land, Infrastructure and Transport of the Korean government through the Regional Development Research Program under Grant 19RDRP-B076564-06 and by the Ministry of Science and ICT, Korea, under the ITRC support program(2018-0-01424) supervised by the IITP.

Acknowledgments

Sentinel-1 data used in this study are provide by ESA through the Sentinel-1 Scientific Data Hub. Project carried out using CSK® Products, © ASI (Italian Space Agency), delivered under an ASI license to use. Part of the research was carried out at the Jet Propulsion Laboratory, California Institute of Technology, under a contract with the National Aeronautics and Space Administration.

Conflicts of Interest

The authors declare no conflict of interest.

References

  1. Takács, P.F. Deformations in Concrete Cantilever Bridges: Observations and Theoretical Modelling. Ph.D. Thesis, Fakultet for ingeniørvitenskap og teknologi, Trondheim, Norway, 2002. [Google Scholar]
  2. Moschas, F.; Stiros, S. Measurement of the dynamic displacements and of the modal frequencies of a short-span pedestrian bridge using GPS and an accelerometer. Eng. Struct. 2011, 33, 10–17. [Google Scholar] [CrossRef]
  3. Watson, C.; Watson, T.; Coleman, R. Structural monitoring of cable-stayed bridge: analysis of GPS versus modeled deflections. J. Survey. Eng. 2007, 133, 23–28. [Google Scholar] [CrossRef]
  4. Zhou, G.-D.; Yi, T.-H. Recent developments on wireless sensor networks technology for bridge health monitoring. Math. Prob. Eng. 2013, 2013. [Google Scholar] [CrossRef]
  5. Chae, M.; Yoo, H.; Kim, J.; Cho, M. Development of a wireless sensor network system for suspension bridge health monitoring. Autom. Constr. 2012, 21, 237–252. [Google Scholar] [CrossRef]
  6. Gentile, C. Deflection measurement on vibrating stay cables by non-contact microwave interferometer. NDT E Int. 2010, 43, 231–240. [Google Scholar]
  7. Pieraccini, M.; Parrini, F.; Fratini, M.; Atzeni, C.; Spinelli, P.; Micheloni, M. Static and dynamic testing of bridges through microwave interferometry. NDT E Int. 2007, 40, 208–214. [Google Scholar]
  8. Ferretti, A.; Prati, C.; Rocca, F. Permanent scatterers in SAR interferometry. IEEE Trans. Geosci. Remote Sens. 2001, 39, 8–20. [Google Scholar] [CrossRef]
  9. Berardino, P.; Fornaro, G.; Lanari, R.; Sansosti, E. A new algorithm for surface deformation monitoring based on small baseline differential SAR interferograms. IEEE Trans. Geosci. Remote Sens. 2002, 40, 2375–2383. [Google Scholar] [CrossRef] [Green Version]
  10. Crosetto, M.; Monserrat, O.; Cuevas-González, M.; Devanthéry, N.; Crippa, B. Persistent scatterer interferometry: A review. ISPRS J. Photogramm. Remote Sens. 2016, 115, 78–89. [Google Scholar] [CrossRef]
  11. Ferretti, A.; Prati, C.; Rocca, F. Nonlinear subsidence rate estimation using permanent scatterers in differential SAR interferometry. IEEE Trans. Geosci. Remote Sens. 2000, 38, 2202–2212. [Google Scholar] [CrossRef] [Green Version]
  12. Wang, T.; Perissin, D.; Rocca, F.; Liao, M.-S. Three Gorges Dam stability monitoring with time-series InSAR image analysis. Sci. China Earth Sci. 2011, 54, 720–732. [Google Scholar] [CrossRef]
  13. Reale, D.; Fornaro, G.; Pauciullo, A.; Zhu, X.; Bamler, R. Tomographic imaging and monitoring of buildings with very high resolution SAR data. IEEE Geosci. Remote Sens. Lett. 2011, 8, 661–665. [Google Scholar] [CrossRef]
  14. Lazecky, M.; Hlavacova, I.; Bakon, M.; Sousa, J.J.; Perissin, D.; Patricio, G. Bridge displacements monitoring using space-borne X-band SAR interferometry. IEEE J. Select. Top. Appl. Earth Observ. Remote Sens. 2017, 10, 205–210. [Google Scholar] [CrossRef]
  15. Del Soldato, M.; Tomás, R.; Pont Castillo, J.; Herrera García, G.; Lopez-Davalillos, G.; Carlos, J.; Mora, O. A multi-sensor approach for monitoring a road bridge in the Valencia harbor (SE Spain) by SAR Interferometry (InSAR). Rendiconti Online Societa Geologica Italiana 2016, 41, 235–238. [Google Scholar] [CrossRef] [Green Version]
  16. Fornaro, G.; Reale, D.; Verde, S. Bridge thermal dilation monitoring with millimeter sensitivity via multidimensional SAR imaging. IEEE Geosci. Remote Sens. Lett. 2013, 10, 677–681. [Google Scholar] [CrossRef]
  17. Goel, K.; Gonzalez, F.R.; Adam, N.; Duro, J.; Gaset, M. Thermal dilation monitoring of complex urban infrastructure using high resolution SAR data. In Proceedings of the 2014 IEEE Geoscience and Remote Sensing Symposium (IGARSS 2014), Quebec City, QC, Canada, 13–18 July 2014; pp. 954–957. [Google Scholar]
  18. Monserrat, O.; Crosetto, M.; Cuevas, M.; Crippa, B. The thermal expansion component of persistent scatterer interferometry observations. IEEE Geosci. Remote Sens. Lett. 2011, 8, 864–868. [Google Scholar] [CrossRef]
  19. Zhao, J.; Wu, J.; Ding, X.; Wang, M. Elevation Extraction and Deformation Monitoring by Multitemporal InSAR of Lupu Bridge in Shanghai. Remote Sens. 2017, 9, 897. [Google Scholar] [CrossRef]
  20. Qin, X.; Zhang, L.; Yang, M.; Luo, H.; Liao, M.; Ding, X. Mapping surface deformation and thermal dilation of arch bridges by structure-driven multi-temporal DInSAR analysis. Remote Sens. Environ. 2018, 216, 71–90. [Google Scholar] [CrossRef]
  21. Cluley, N.; Shepherd, R. Analysis of concrete cable-stayed bridges for creep, shrinkage and relaxation effects. Comput. Struct. 1996, 58, 337–350. [Google Scholar] [CrossRef]
  22. Au, F.T.; Si, X. Time-dependent effects on dynamic properties of cable-stayed bridges. Struct. Eng. Mech. 2012, 41, 139–155. [Google Scholar] [CrossRef]
  23. Mermigas, K.K. Behaviour and Design of Extradosed Bridges; University of Toronto: Toronto, ON, Canada, 2008. [Google Scholar]
  24. Wegnüller, U.; Werner, C.; Strozzi, T.; Wiesmann, A.; Frey, O.; Santoro, M. Sentinel-1 support in the GAMMA software. Proc. Computer Sci. 2016, 100, 1305–1312. [Google Scholar]
  25. Farr, T.G.; Rosen, P.A.; Caro, E.; Crippen, R.; Duren, R.; Hensley, S.; Kobrick, M.; Paller, M.; Rodriguez, E.; Roth, L. The shuttle radar topography mission. Rev. Geophys. 2007, 45. [Google Scholar] [CrossRef]
  26. Hooper, A. A multi-temporal InSAR method incorporating both persistent scatterer and small baseline approaches. Geophys. Res. Lett. 2008, 35. [Google Scholar] [CrossRef] [Green Version]
  27. Hooper, A.; Zebker, H.A. Phase unwrapping in three dimensions with application to InSAR time series. JOSA A 2007, 24, 2737–2747. [Google Scholar] [CrossRef] [PubMed] [Green Version]
  28. Gernhardt, S.; Bamler, R. Structural deformation and non-seasonal motion of single buildings in urban areas revealed by PSI. In Proceedings of the 2015 Joint Urban Remote Sensing Event (JURSE 2015), Lausanne, Switzerland, 30 March–1 April 2015; pp. 1–4. [Google Scholar]
  29. Huang, Q.H.; Crosetto, M.; Monserrat, O.; Crippa, B. Displacement monitoring and modelling of a high-speed railway bridge using C-band Sentinel-1 data. ISPRS J. Photogramm. Remote Sens. 2017, 128, 204–211. [Google Scholar] [CrossRef]
  30. Perissin, D.; Rocca, F. High-accuracy urban DEM using permanent scatterers. IEEE Trans. Geosci. Remote Sens. 2006, 44, 3338–3347. [Google Scholar] [CrossRef]
  31. Bovenga, F.; Belmonte, A.; Refice, A.; Pasquariello, G.; Nutricato, R.; Nitti, D.; Chiaradia, M. Performance analysis of satellite missions for multi-temporal SAR interferometry. Sensors 2018, 18, 1359. [Google Scholar] [CrossRef]
  32. Ozawa, T.; Ueda, H. Advanced interferometric synthetic aperture radar (InSAR) time series analysis using interferograms of multiple-orbit tracks: A case study on Miyake-jima. J. Geophys. Res. Solid Earth 2011, 116. [Google Scholar] [CrossRef] [Green Version]
  33. Samsonov, S.; d’Oreye, N. Multidimensional time-series analysis of ground deformation from multiple InSAR data sets applied to Virunga Volcanic Province. Geophys. J. Int. 2012, 191, 1095–1108. [Google Scholar] [Green Version]
  34. Mill, T.; Ellmann, A.; Kiisa, M.; Idnurm, J.; Idnurm, S.; Horemuz, M.; Aavik, A. Geodetic Monitoring of Bridge Deformations Occurring during Static Load Testing. Balt. J. Road Bridge Eng. 2015, 10. [Google Scholar] [CrossRef]
  35. Crosetto, M.; Monserrat, O.; Cuevas-González, M.; Devanthéry, N.; Luzi, G.; Crippa, B. Measuring thermal expansion using X-band persistent scatterer interferometry. ISPRS J. Photogramm. Remote Sens. 2015, 100, 84–91. [Google Scholar] [CrossRef] [Green Version]
  36. Ni, Y.; Hua, X.; Wong, K.; Ko, J. Assessment of bridge expansion joints using long-term displacement and temperature measurement. J. Perf. Constr. Facil. 2007, 21, 143–151. [Google Scholar] [CrossRef]
  37. Teatini, P.; Strozzi, T.; Tosi, L.; Wegmüller, U.; Werner, C.; Carbognin, L.; Rosselli, R.; Cecconi, G.; Giada, M. ERS and envisat SAR interferometry to measure land subsidence in the venice lagoon on natural and artificial point targets. In Proceedings of the Envisat Symposium 2007, ESA Communication Production Office ESTEC. Noordwijk, The Netherlands, 23–27 April 2007. [Google Scholar]
  38. Liu, X.; Wang, P.; Lu, Z.; Gao, K.; Wang, H.; Jiao, C.; Zhang, X. Damage Detection and Analysis of Urban Bridges Using Terrestrial Laser Scanning (TLS), Ground-Based Microwave Interferometry, and Permanent Scatterer Interferometry Synthetic Aperture Radar (PS-InSAR). Remote Sens. 2019, 11, 580. [Google Scholar] [CrossRef]
  39. Parcharidis, I.; Foumelis, M.; Benekos, G.; Kourkouli, P.; Stamatopoulos, C.; Stramondo, S. Time series synthetic aperture radar interferometry over the multispan cable-stayed Rio-Antirio Bridge (central Greece): Achievements and constraints. J. Appl. Remote Sens. 2015, 9, 096082. [Google Scholar] [CrossRef]
  40. Selvakumaran, S.; Plank, S.; Geiß, C.; Rossi, C.; Middleton, C. Remote monitoring to predict bridge scour failure using Interferometric Synthetic Aperture Radar (InSAR) stacking techniques. Int. J. Appl. Earth Observ. Geoinf. 2018, 73, 463–470. [Google Scholar] [CrossRef]
  41. Sousa, J.; Bastos, L. Multi-temporal SAR interferometry reveals acceleration of bridge sinking before collapse. Nat. Hazards Earth Syst. Sci. 2013, 13, 659. [Google Scholar] [CrossRef]
  42. Milillo, P.; Riel, B.; Minchew, B.; Yun, S.-H.; Simons, M.; Lundgren, P. On the synergistic use of SAR constellations’ data exploitation for earth science and natural hazard response. IEEE J. Select. Top. Appl. Earth Observ. Remote Sens. 2016, 9, 1095–1100. [Google Scholar] [CrossRef]
  43. Alvarez-Salazar, O.; Hatch, S.; Rocca, J.; Rosen, P.; Shaffer, S.; Shen, Y.; Sweetser, T.; Xaypraseuth, P. Mission design for NISAR repeat-pass Interferometric SAR. In Proceedings of the Sensors, Systems, and Next-Generation Satellites XVIII, 2013, International Society for Optics and Photonics. Dresden, Germany, 23–26 September 2013; p. 92410C. [Google Scholar]
Figure 1. (a) Footprints of descending Sentinel-1 (yellow polygon), ascending Sentinel-1 (green polygon) and descending COSMO-SkyMed (red polygon) for study areas. Aerial photos of (b) Kimdaejung Bridge and (c) Muyoung Bridge. Green lines and yellow lines indicate ascending and descending tracks, respectively. Red lines indicate the longitudinal direction of the bridges.
Remotesensing 11 01258 g001
Figure 2. Schematic overview of (a) Kimdaejung bridge and (b) Muyoung bridge.
Remotesensing 11 01258 g002
Figure 3. Perpendicular baseline vs Temporal baseline plot (a) CSK (b) Sentinel-1 Ascending (c) Sentinel-1 Descending. Each line represents interferometric pair used in this study.
Remotesensing 11 01258 g003
Figure 4. Flow chart for the bridge monitoring method presented in this paper.
Remotesensing 11 01258 g004
Figure 5. Height comparison for Kimdaejung bridge between airborne Lidar (black) and updated height from the PSI approach for a stack of CSK (red).
Remotesensing 11 01258 g005
Figure 6. Locations of identified PSs (a) before (blue dots) and (b) after the geometric correction (green dots). (c) Zoom-in photo of the yellow rectangle of Figure 4b.
Remotesensing 11 01258 g006
Figure 7. Vertical linear displacement rate (mm/year) derived from (a) S1 PSI and (b) CSK PSI for Kimdaejung Bridge.
Remotesensing 11 01258 g007
Figure 8. Spatial distributions of the vertical displacement estimated from S1 (red rectangle), single-look CSK (green circle), and multi-looked CSK (yellow triangle).
Remotesensing 11 01258 g008
Figure 9. (a) Temporal evolution of the deflection of the Kimdaejung bridge. (b) Time-series of vertical displacement at mid-span between P7 and P8 estimated from S1 (red rectangle) and CSK (green circle).
Remotesensing 11 01258 g009
Figure 10. Vertical displacement rate (mm/year) calculated from (a) Sentinel-1 and (b) COSMO-SkyMed. Thermal dilation (mm/°C) calculated from (c) Sentinel-1 and (d) COSMO-SkyMed for Muyoung bridge.
Remotesensing 11 01258 g010
Figure 11. (a) Vertical thermal dilation estimated from S1 dataset (yellow triangles) and horizontal thermal dilations estimated from CSK (green circles) and S1 (red squares) dataset. Arrows represent the locations of towers. Time-series of horizontal displacements at (b) pier 4 and (c) mid-span between pier 4 and pier 5. Green circles and red squares represent the PSI results of CSK and S1 datasets, respectively. Gray dots indicate the temperature.
Remotesensing 11 01258 g011
Figure 12. (a) Vertical displacement rates derived from CSK (green circles) and S1 (red squares) dataset using PSI analysis. Yellow triangles are from multi-looked CSK dataset. Blue arrows indicate the locations of towers (piers). Time-series of vertical displacements at (b) P3 and (c) mid-span between P3 and P4. Green circles and red squares represent the PSI results of CSK and S1 dataset, respectively.
Remotesensing 11 01258 g012
Figure 13. Temporal evolution of the vertical deflection referring the image acquired at 2013/01/03. Lines indicate the average value and areas represent the confidence interval of one-sigma.
Remotesensing 11 01258 g013
Table 1. Geometric parameters of Sensors over Kimdaejung Bridge.
DescriptionDescending (CSK)Ascending (S1)Descending (S1)
Incidence angle27.9°34.4°43.5°
Azimuth heading angle191°−11°191°
Angle difference ( φ α ) −199°
Table 2. Geometric parameters of Sensors over Muyoung Bridge.
DescriptionDescending (CSK)Ascending (S1)Descending (S1)
Incidence angle26.3°35.2°42.5°
Azimuth heading angle191°−11°191°
Angle difference ( φ α ) 25°−133°25°
Table 3. Statistic of PSs for two bridge cases.
SensorsCSKS1 Asc.S1 Des.CSKS1 Asc.S1 Des.
BridgeKimdaejung BridgeMuyoung Bridge
Number of PS25313113141320239327
Total pixel64225434873896571518
Percentage (PS/Total)39.4%57.3%64.5%33.9%41.9%63.1%
Spatial density
[number/km2]
114,01014,00914,14457,70210,44714,294