1. Introduction
With the intensive development of the unmanned aerial vehicle (UAV) technology, the use of low-altitude imagery is becoming increasingly popular. UAV imagery has been applied in environmental remote sensing, climate change research, and atmospheric composition studies. Intensive research in recent years has involved applying UAV remote sensing techniques in environmental and topographic monitoring [
1], forest studies [
2], and ecohydrology [
3]. Using UAVs with a compact multispectral digital camera has reduced the cost of acquiring image data [
4]. Using UAV photogrammetry, it is possible to quickly obtain extremely high spatial resolution images for topography mapping [
1], three-dimensional (3D) modelling [
5], or point cloud classification [
6,
7]. However, studies have not yet considered the broader aspect of the influence of atmospheric and meteorological conditions on the quality of UAV imagery. Until now, spectral measurements in environmental remote sensing studies were acquired on the basis of data from sensors on-board satellites and manned aircraft. With the advent of UAV imagery technologies, new types of sensors, including remote sensors, have emerged. However, studies have not always considered the radiometric quality of UAV imagery appropriate for applying this type of data in advanced spectral analyses. Differentiating the imaging sensors installed on UAVs requires the development of standardized procedures for assessing the quality of images acquired with these sensors. This is vital, especially for quantitative and spectral remote sensing approaches. An accurate assessment of radiometric quality is also important when considering the complexity of geometric and radiometric corrections necessary for accurate spectroscopy-focused environmental remote sensing.
Low-altitude remote sensing enables acquiring spectral information by measuring the radiation emitted (e.g., measuring the spectral reflectance characteristics of agricultural crops). However, the accuracy of low-altitude spectral information is influenced by image quality, which in turn depends on the lighting and atmospheric conditions, as well as on the type of measurement protocol and data-processing procedure applied [
8]. Thus, developing objective radiometric quality indicators is crucial for eliminating incorrect data, which can significantly impact the results of the spectral analyses conducted and their later application for understanding Earth’s biological processes [
9]. Due to the ever-increasing popularity of small spectral cameras mounted on UAVs, e.g., Tetracam MCA (Multiple Camera Array), Parrot Sequoia, Micasense, etc., there is a need for developing reliable indicators for classifying the images to given quality groups. The quality of UAV imagery data depends above all on the sensor characteristics, lighting geometry, and meteorological conditions. Therefore, digital number (DN) values are not truly representative of the surface reflectance, as they depend on the lighting conditions and the characteristics of the imaging sensor [
10]. Thus, multispectral UAV imagery data should be assessed in terms of quality, considering the influence of lighting and atmospheric conditions, camera noise, and topographic conditions. Only based on an accurate assessment of the radiometric quality of UAV images and their subsequent correction can raw data be processed into physical units of reflectance that are used to develop spatial-temporal spectral representations of the objects studied, e.g., chlorophyll content in plants.
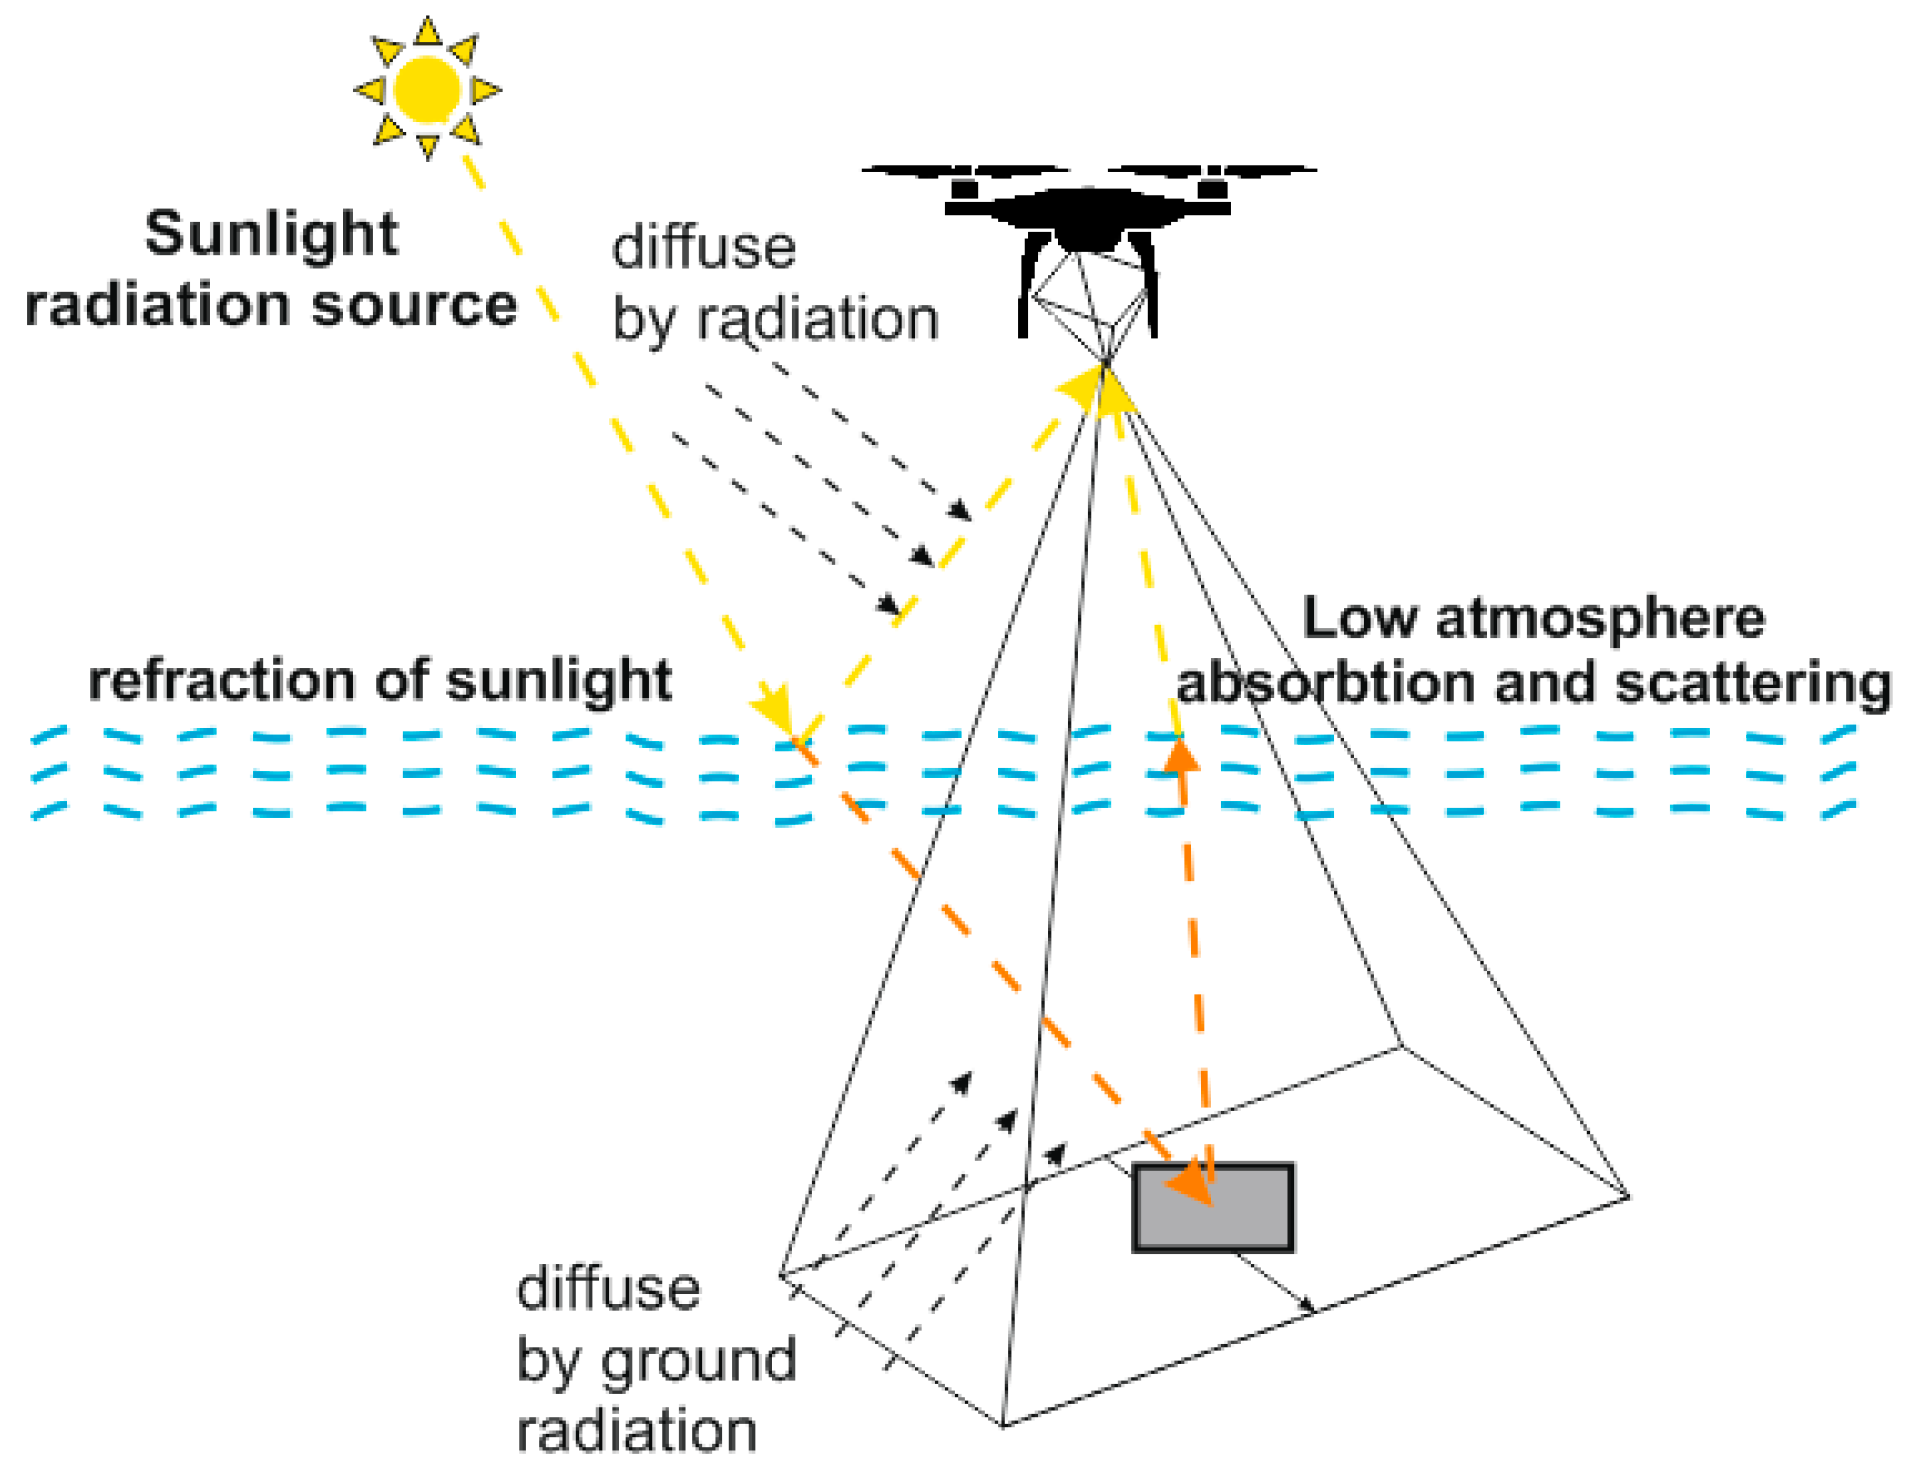
By considering the influence of atmospheric conditions on image quality, it is possible to increase the reliability of absolute radiometric calibration, during which a raw DN is transformed into an absolute reflectance value for every spectral band. In the case of relative radiometric calibration for the entire image, normalized transformation values are applied with the assumption that the sensor’s focal plane is irradiated with a uniform radiance field [
10]. In other cases, DN values are transformed into spectral reflectance characteristics on the basis of the real values of spectral reflectance characteristics measured directly in the field with a spectroradiometer. The spectral range of such measures should be similar to the ranges of the UAV-mounted sensor. The images should include photographs of representative surfaces (reference panels) with known spectral characteristics. Due to the small Instantaneous Field of View (IFOV), the atmosphere is assumed to be homogenous throughout the entire image. When calibrating such images, the atmospheric profile should be measured on the operating altitude; for UAV remote sensing, it is usually between 50 and 300 m. The aim of the radiometric correction of UAV imagery is to eliminate any lower atmosphere interferences, as sunrays reflected from the photographed objects are often non-Lambertian, which leads to intensifying the hot-spot effect. Radiometric correction models can be divided into two types: physical and empirical. So far, several different methods of implementing physical models into radiometric correction of UAV imagery have been tried, e.g., MODTRAN (MODerate resolution atmospheric TRANsmission) [
11,
12]; however, these have not always worked well. When assessing UAV imagery, the empirical models are more practical, for which model parameters can be calculated. Common empirical methods include histogram matching methods, dark object methods, and empirical line methods [
13,
14]. Several remote sensing applications require the elimination of the influence of object reflectance anisotropy. For anisotropic surfaces, a change in any of the parameters leads to a change in surface luminance [
15,
16]. The characteristics of light reflectance for the given surface is described by the Bidirectional Reflectance Distribution Function (BRDF), first defined by Nicodemus [
17].
Increasingly often, UAV imagery is acquired in different weather and lighting conditions, which is why new methods for quality assessment need to be developed for the purposes of radiometric correction. This has been attempted previously [
18,
19,
20,
21,
22]. Assessing the quality of the images and classifying them into the right groups is an indispensable stage before applying radiometric correction.
Researchers have increasingly often mentioned radiometric correction methods based on the empirical approach [
23,
24,
25]. The idea of these methods is to find the connection between known reflectance targets in relation to the DN value measured on the image. The best solution with this approach is to convert all DN values for every spectral band of the image to surface reflectance values. New methods of radiometric correction have been proposed, allowing the generation of an orthomosaics reflectance image without knowing the empirical coefficients. Such solutions are possible due to introducing a priori calibration in multispectral cameras, such as Parrot Sequoia
® (Parrot Drone SAS, Paris, France) and MicaSense RedEdge
® (MicaSense Inc., Seattle, WA, USA) [
26]. Also, with the use of commercial software, e.g., Pix4D (Pix4D, Lausanne, Switzerland), it is possible to conduct color correction and histogram matching, or implement the image-information-based radiometric block adjustment algorithm. These solutions may not return accurate and repeatable results in the remote sensing context, especially when processing images acquired in different seasons and different lighting conditions. That is why it is difficult to select the right normalizing parameter. Additionally, considering the increased variability in the measured spectrum, the reflectance coefficient observed at smaller pixel sizes creates a significant problem for effective radiometric normalization. As a result, low accuracy normalization, when performing remote sensing UAV measurements, effectively limits the possibility of comparing images from the same area acquired at different times and in different seasonal conditions [
25]. Therefore, it is crucial to develop objective indicators of image quality that can be normalized depending on the time of year before implementing further stages of radiometric correction.
1.1. Related Works—Classical Quality Assessment Indexes
Image quality can be defined by several different parameters, such as radiometric resolution and its accuracy, represented by the noise level, and geometric resolution and sharpness, described by the Modulation Transfer Function (MTF) [
27]. The radiometric quality of the digital image can be defined as a detailed mapping of local irradiation changes recorded by the imaging system, while maintaining a continuum of brightness adequate for the mapped scene. The internal quality digital image radiometric is formed by the local image contrast, tonal range, random noise, and radiometric resolution [
28,
29]. Image radiometric quality is influenced by the sensor characteristics defined by sharpness, contrast, and resolution [
30,
31], but also by the atmospheric composition and meteorological conditions at a given time.
In digital image processing, image quality is a multi-aspect problem depending on the application of the processed image. Images represented as matrices are subject to objective and subjective quality assessments. The majority of traditional image assessment methods are comparative methods based on the assumption that the assessed image is compared to the original image. Studies are currently underway to find reliable image quality assessment indexes. At the moment, objective quantitative indexes are usually used for image quality assessment based on comparing the differences between the original image and the image reconstructed after compression [
32,
33,
34]. One of the most popular and simplest objective indexes is the Mean Square Error (MSE) index, i.e., the value of the mean square error for each pixel of the image. To determine MSE, the value of the difference between the reference image and the distorted image is calculated [
35]. This index was further developed as the Root Mean Square Error (RMSE)—the square root of MSE that is used to calculate signal-to-noise ratio (SNR) and peak signal-to-noise ratio (PSNR) [
34]. This index is described by [
36]:
where 255 is the dynamic range of the signal,
N is the number of pixels, and
ei is the difference between the reconstructed and the original image calculated as the
ith pixel.
Although PSNR is simple and widely used, it is not resistant to lighting conditions, so the results may differ from the subjective assessment and may not correlate with human perception. Another quality assessment index is SNR, which calculates the size of the error with respect to the reference image. This index, in turn, served as the basis for developing the signal-to-quantization-noise ratio (SQNR) measure, which determines the impact of quantizing signal quality. This index can be described by [
34]:
where quantization noise represents the difference between the quantized and reference images.
Another important image quality index is the noise quality measure (NQM), a subjective quality measure for images that cause distortions and noise in a video sequence. These two degradation factors are considered as independent and are assessed with two quality measures: a distortion measure (DM) for frequency distortions, and a measure of the impact of noise on the video sequence quality (NQM). The NQM index considers variations in contrast sensitivity as a function of resolution, variations in the local luminance mean, interactions between contrast and spatial frequencies of the image, and contrast masking effects. The DM index is calculated in three stages. The first step consists of finding frequency distortions in the degraded image. Next, the deviation value of this frequency distortion is calculated. At the final stage, the frequency distortion deviation value is weighted so that it fits the model of the frequency response of the human visual system [
37,
38]. Image quality is also assessed with the use of the universal image quality index (UIQI), developed for computing the loss of structural information on images with low radiometric quality. This index presents image quality as a combination of three factors: correlation distortion, luminance distortion, and contrast distortion. This coefficient is referred to as universal because it is independent of the type of distortions, image scale, or type of sensor used. Studies have demonstrated its superiority to the MSE index [
39]. Image signal quality is often assessed using the structural similarity index (SSIM), which considers three types of distortions: image luminance, contrast, and structure. The coefficient can be described as:
where
µx is the mean value on a good-quality image (acquired with no overcast and on flat terrain);
µy is the mean value on the compared image;
σx and
σy stand for the variance of the reference and the compared image, respectively;
σxy is the covariance between the reference and the compared images; and
C1 and
C2 are constant values to prevent the equation from being meaningless. In the experiments,
C1 and
C2 have been assigned values of 0.01 and 0.03, respectively, and the dynamic range of the image was from 0 to 255.
The SSIM coefficient is characterized by contrast, brightness, and structural similarity of an image, taking values from 0 to 1. The closer the value to 1, the higher the image quality [
40].
1.2. Research Purpose
This article presents a new objective index for assessing the quality of UAV imagery, considering the impact of air humidity and the sun zenith angle. The radiometric assessment of UAV images should be the first step in the process of acquiring images with remote sensors, especially in cases where we want to obtain data such as, for example, reflection coefficients necessary for radiometric correction of images. Therefore, it is important to develop an objective indicator of radiometric quality for UAV imagery, which considers the influence of the low atmosphere and direction of sunlight during acquisition of image data. The effectiveness of the developed indicator was verified using two independent test sets.
The aim of this study was to determine the impact of atmospheric fronts, including air humidity and the direction of illumination of the photographed scene, on the quality of low-altitude images. Based on specific relationships between the atmospheric conditions and lighting direction, and the differences in the reflectance values determined on the basis of dedicated radiometric calibration panels, a new image quality indicator was developed. This indicator will be useful in radiometric correction methods, as well as in remote sensing analyses.
This paper discusses the impact of meteorological conditions on the radiometric quality of UAV images, presenting the results of the proposed new quality index and an accuracy analysis based on reference image data.
The paper is structured as follows. In
Section 2, the test data are introduced. In
Section 3, the research method is explained.
Section 4 presents experimental results. In
Section 5, the results are discussed. Finally,
Section 6 provides a brief summary of this work.
3. Proposed Methodology for Radiometric Quality Assessment
At the first stage of this study, based on the previously presented concept [
44,
45], every image acquired from the flights was divided into three bands: red, green, and blue. For each band in each image, the average brightness value of the pixel and the standard deviation of the brightness value of the pixel were computed. Initially, the images were divided into 100 equal fragments. For each fragment, the standard deviation of the brightness value of the pixel for each of the bands was determined. Based on the visual analysis of the images and the distribution of standard deviation values, a pattern was observed that had not been visible in studies that used traditional image quality measures. We found that images acquired in good lighting and weather conditions have high standard deviations values for the red band. For the images acquired in poor lighting in poor weather conditions, in turn, the standard deviation values for the blue band were noticeably higher than the standard deviations for the red and green bands for the same image [
44]. This occurred because heavy overcast and poor lighting produce a greater dispersion of light on particles (precipitation) larger than the wavelength (Mie dispersion) [
44,
45]. We developed an original formula for determining the value of the radiometric quality assessment coefficient for images acquired in high-pressure areas and in autumn conditions for Central and Eastern Europe. The weight values in the
WKW formula component were based on the properties of luminance, which can be defined as follows [
44]:
where
L is the image luminance,
R is the red band,
G is the green band, and
B is the blue band.
The weights for the particular bands can be expressed by means of coefficients as follows [
44]:
where
WKW is the image quality assessment index value; µ
i is the average DN pixel value in a given band (DN in an 8-bit scale, 0–255);
is the pixel brightness standard deviation value in a given band;
is 0.299, which is the weight value of the red band determined empirically based on the luminance value;
is 0.587, which is weight value of the green band determined empirically based on the luminance value; and
is 0.114, which is the weight value of the blue band determined empirically based on the luminance value.
The index WKW (Equation (5)) is not able to consider the influence of humidity and the solar zenith angle on the image quality. Therefore, even though atmospheric parameters and solar zenith angle do effect the pixel values, WKW was not able to measure this influence, because it is only based on the statistical characteristics of the acquired data by the simple weighted sum of three ratio. Precisely for these reasons, the improved variant is proposed. In this way, these factors are explicitly considered.
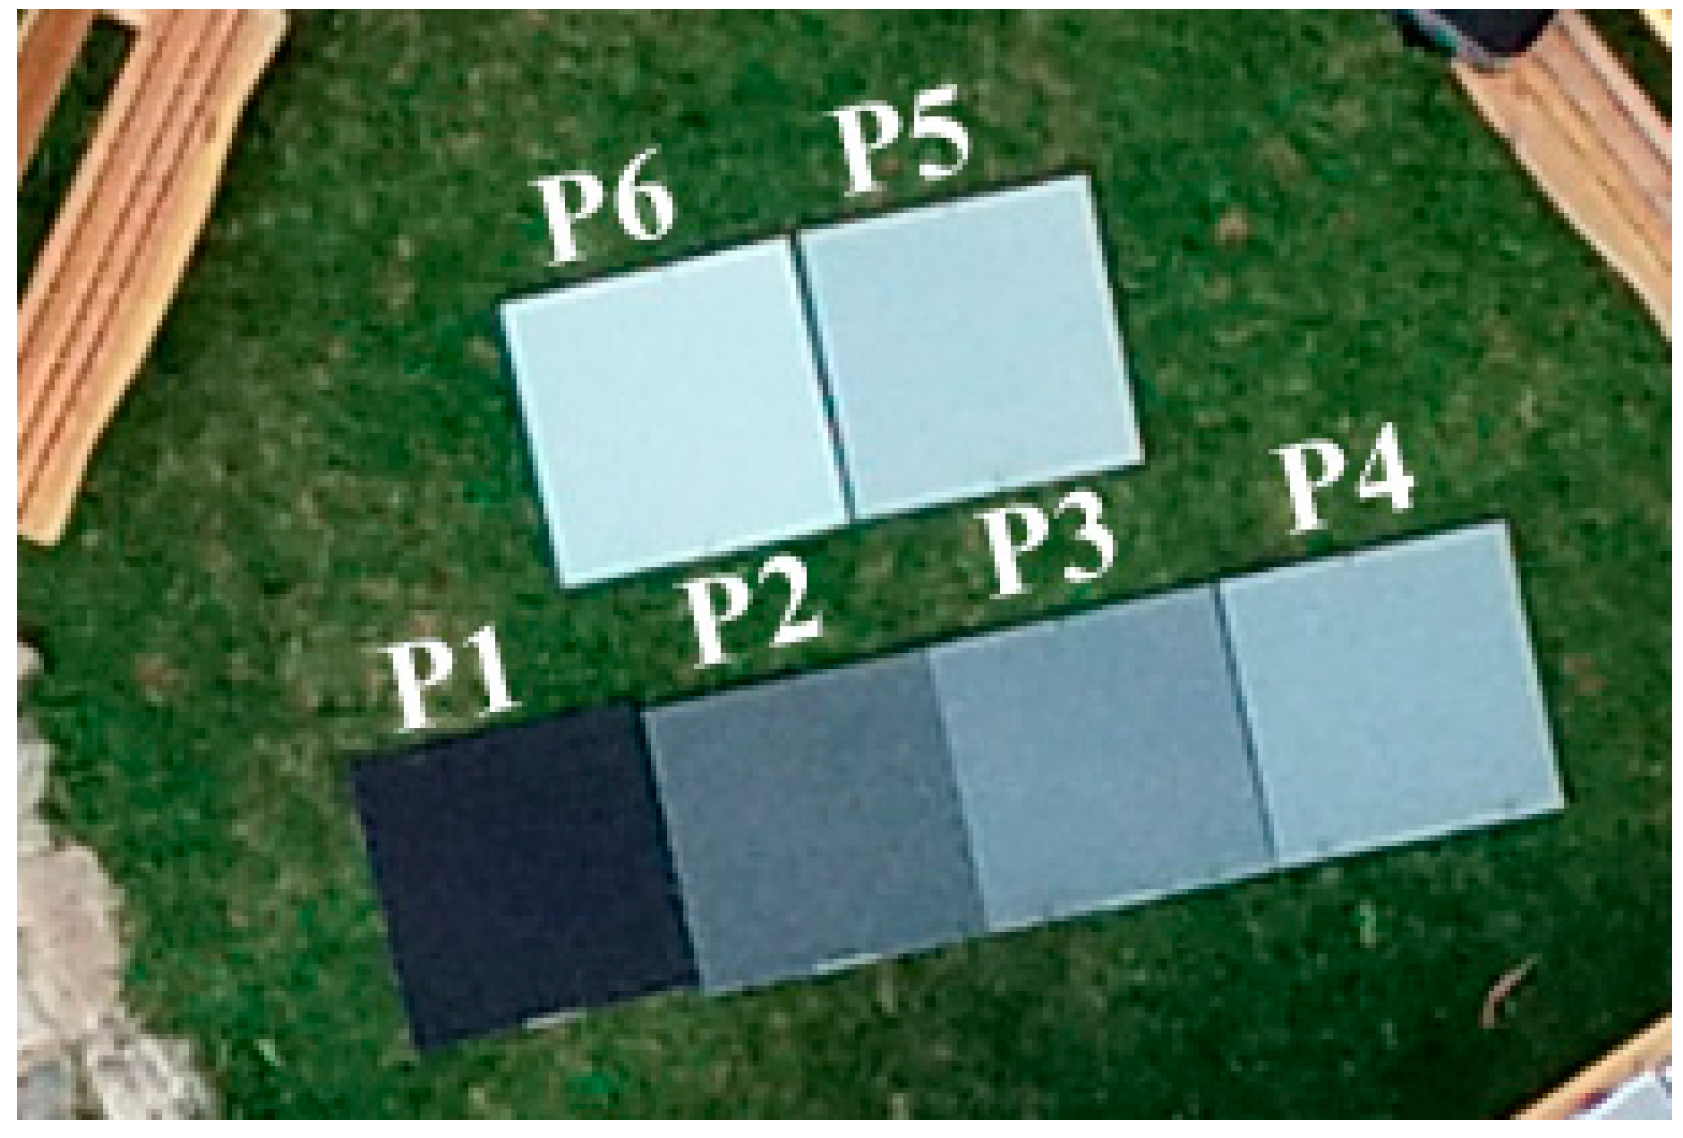
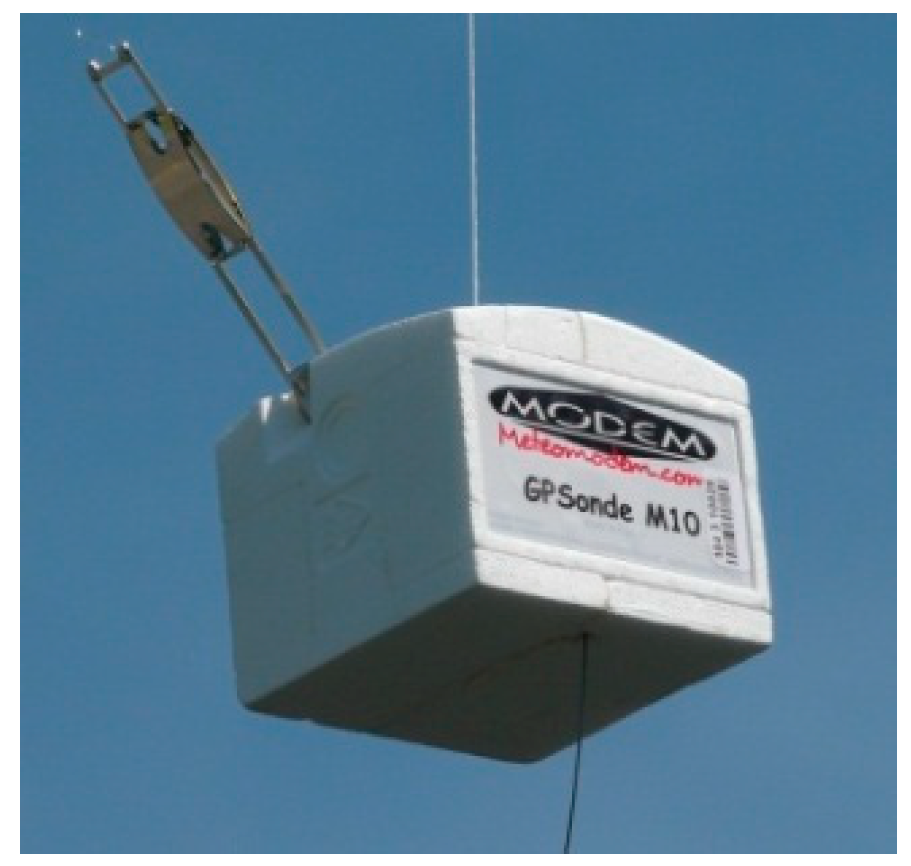
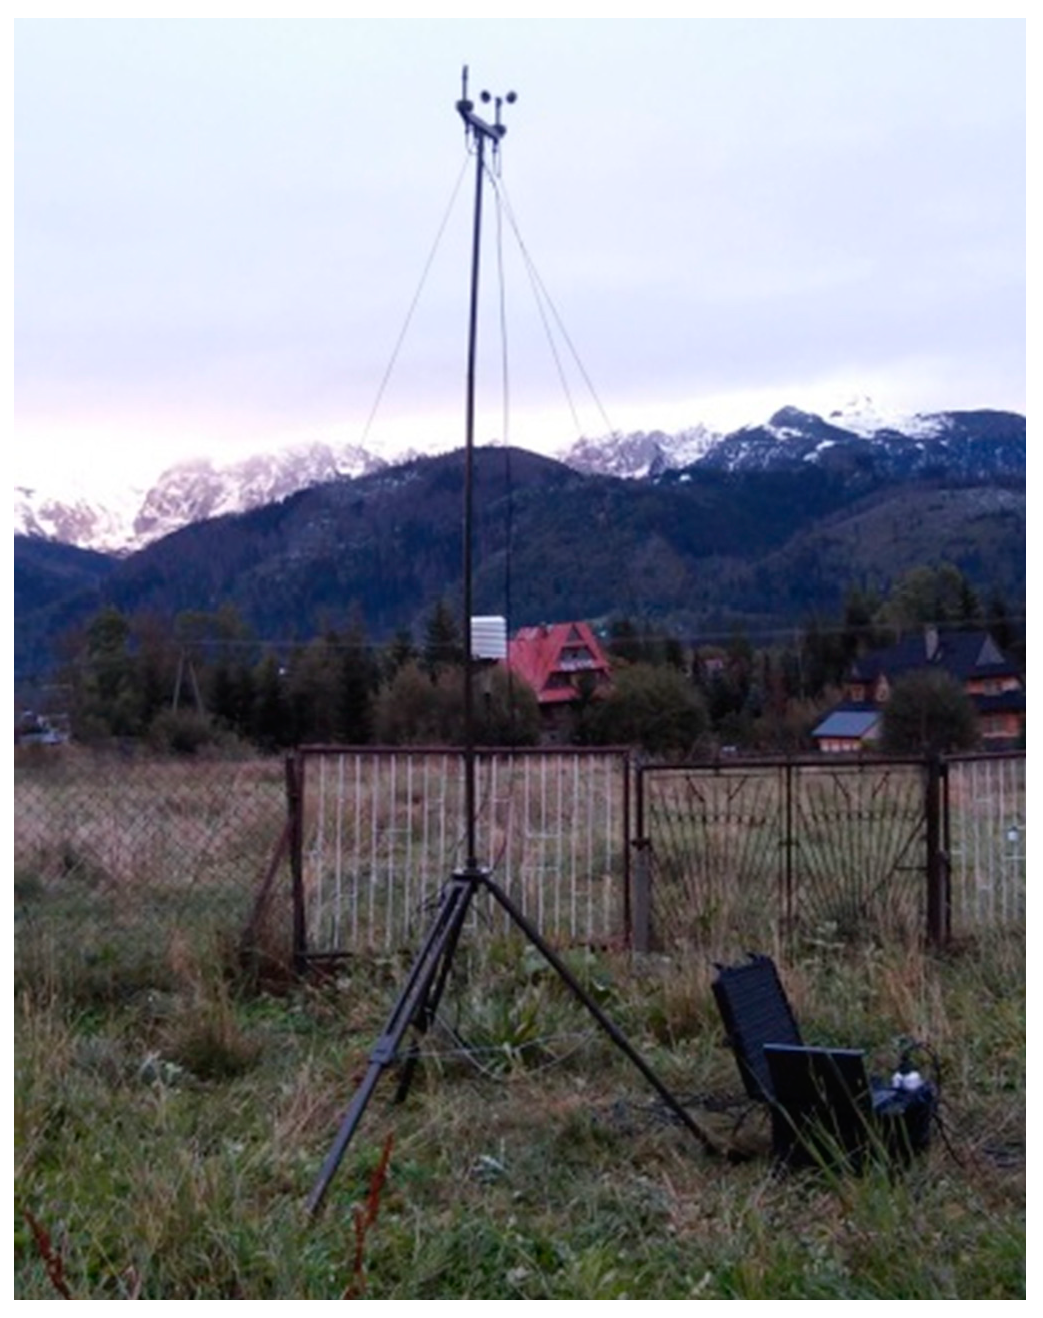
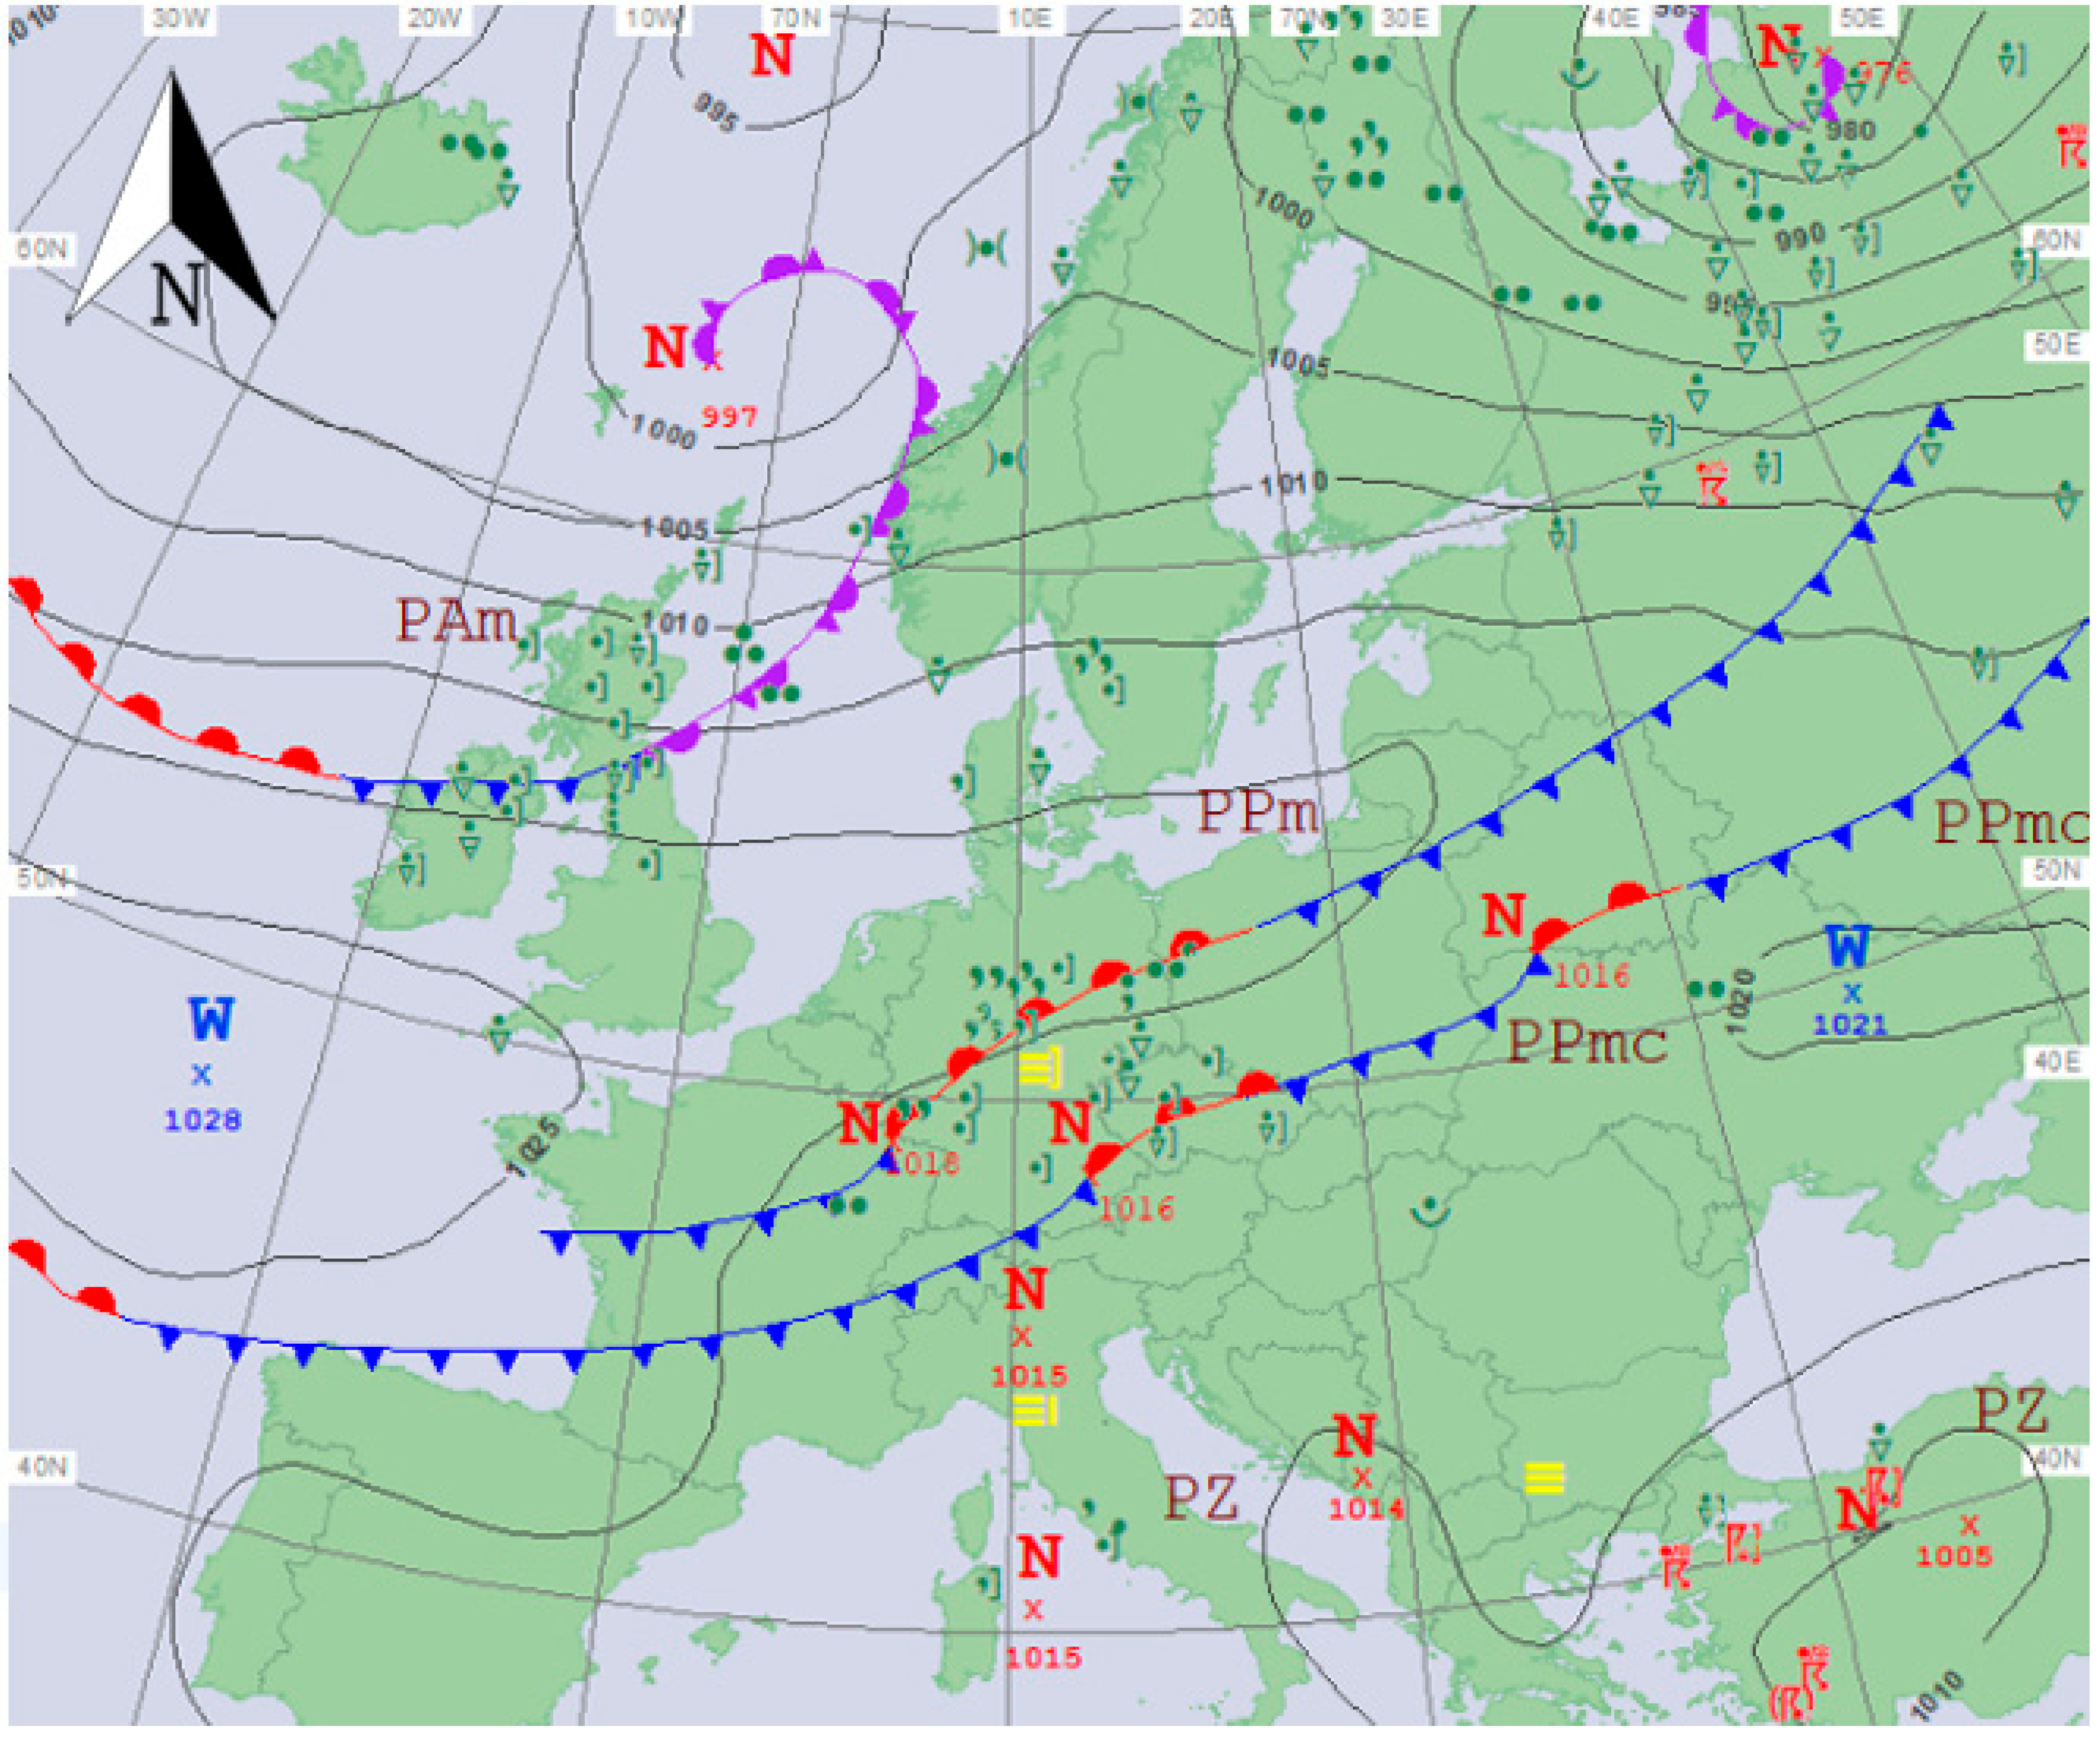
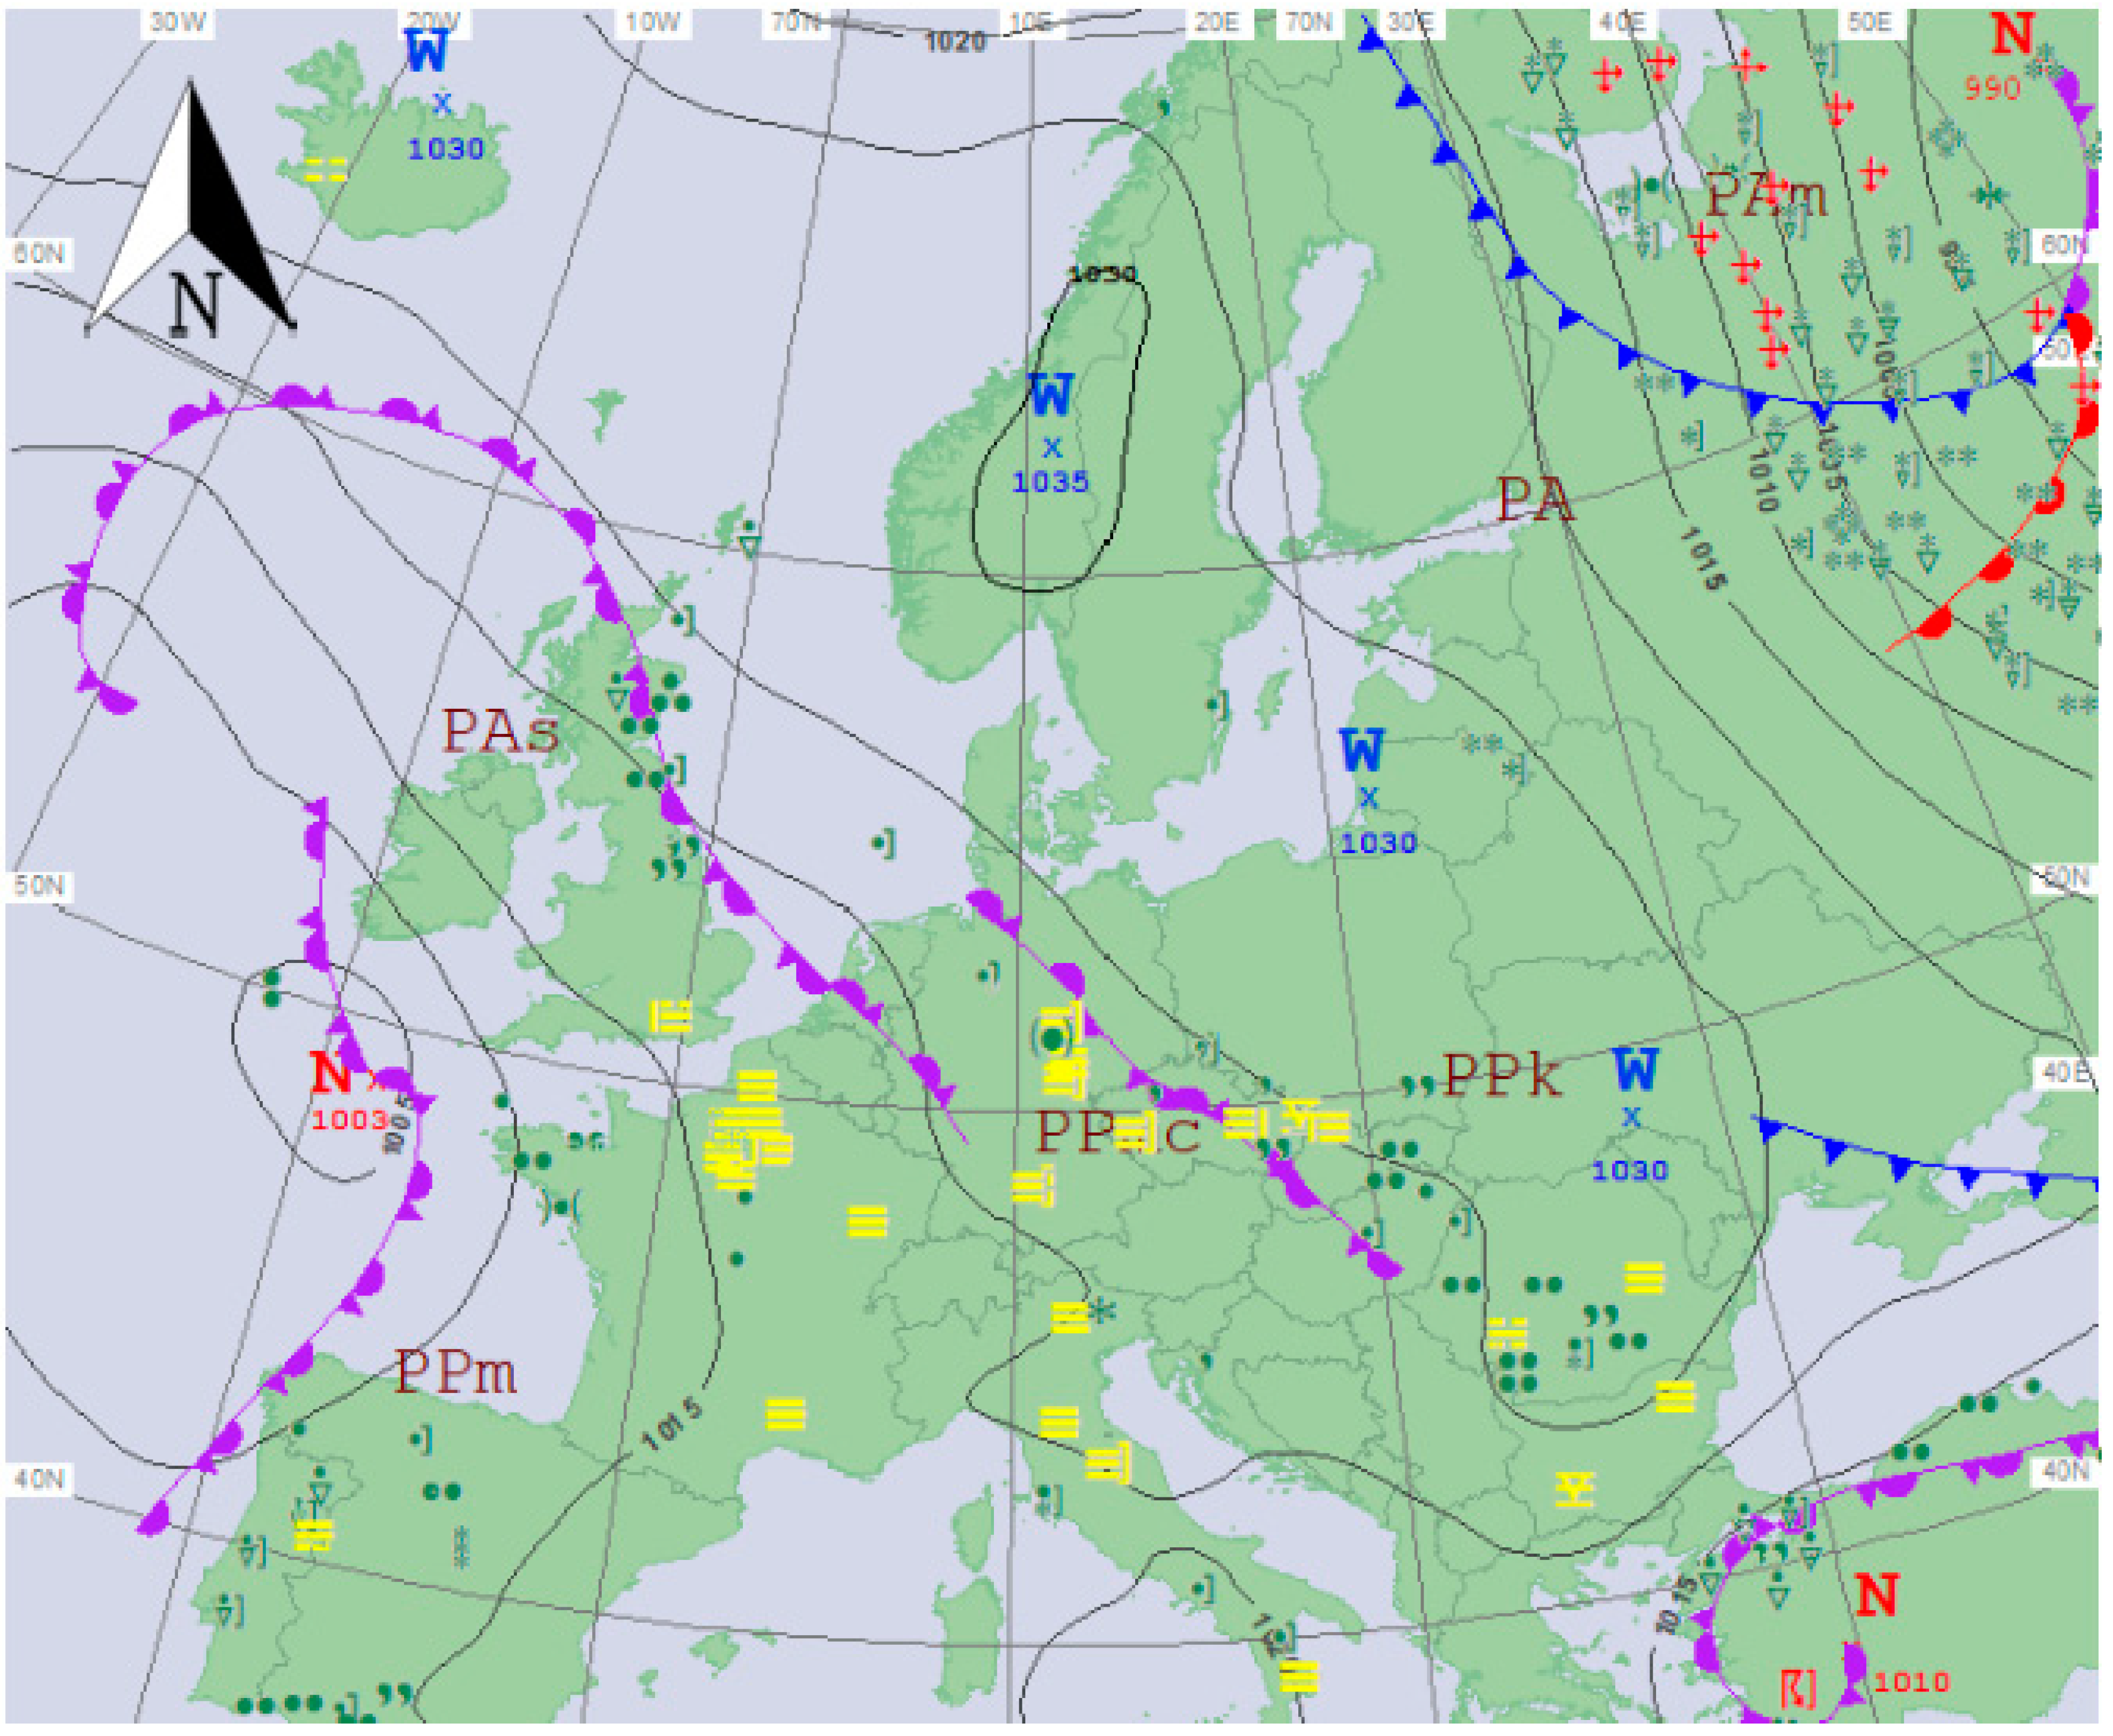
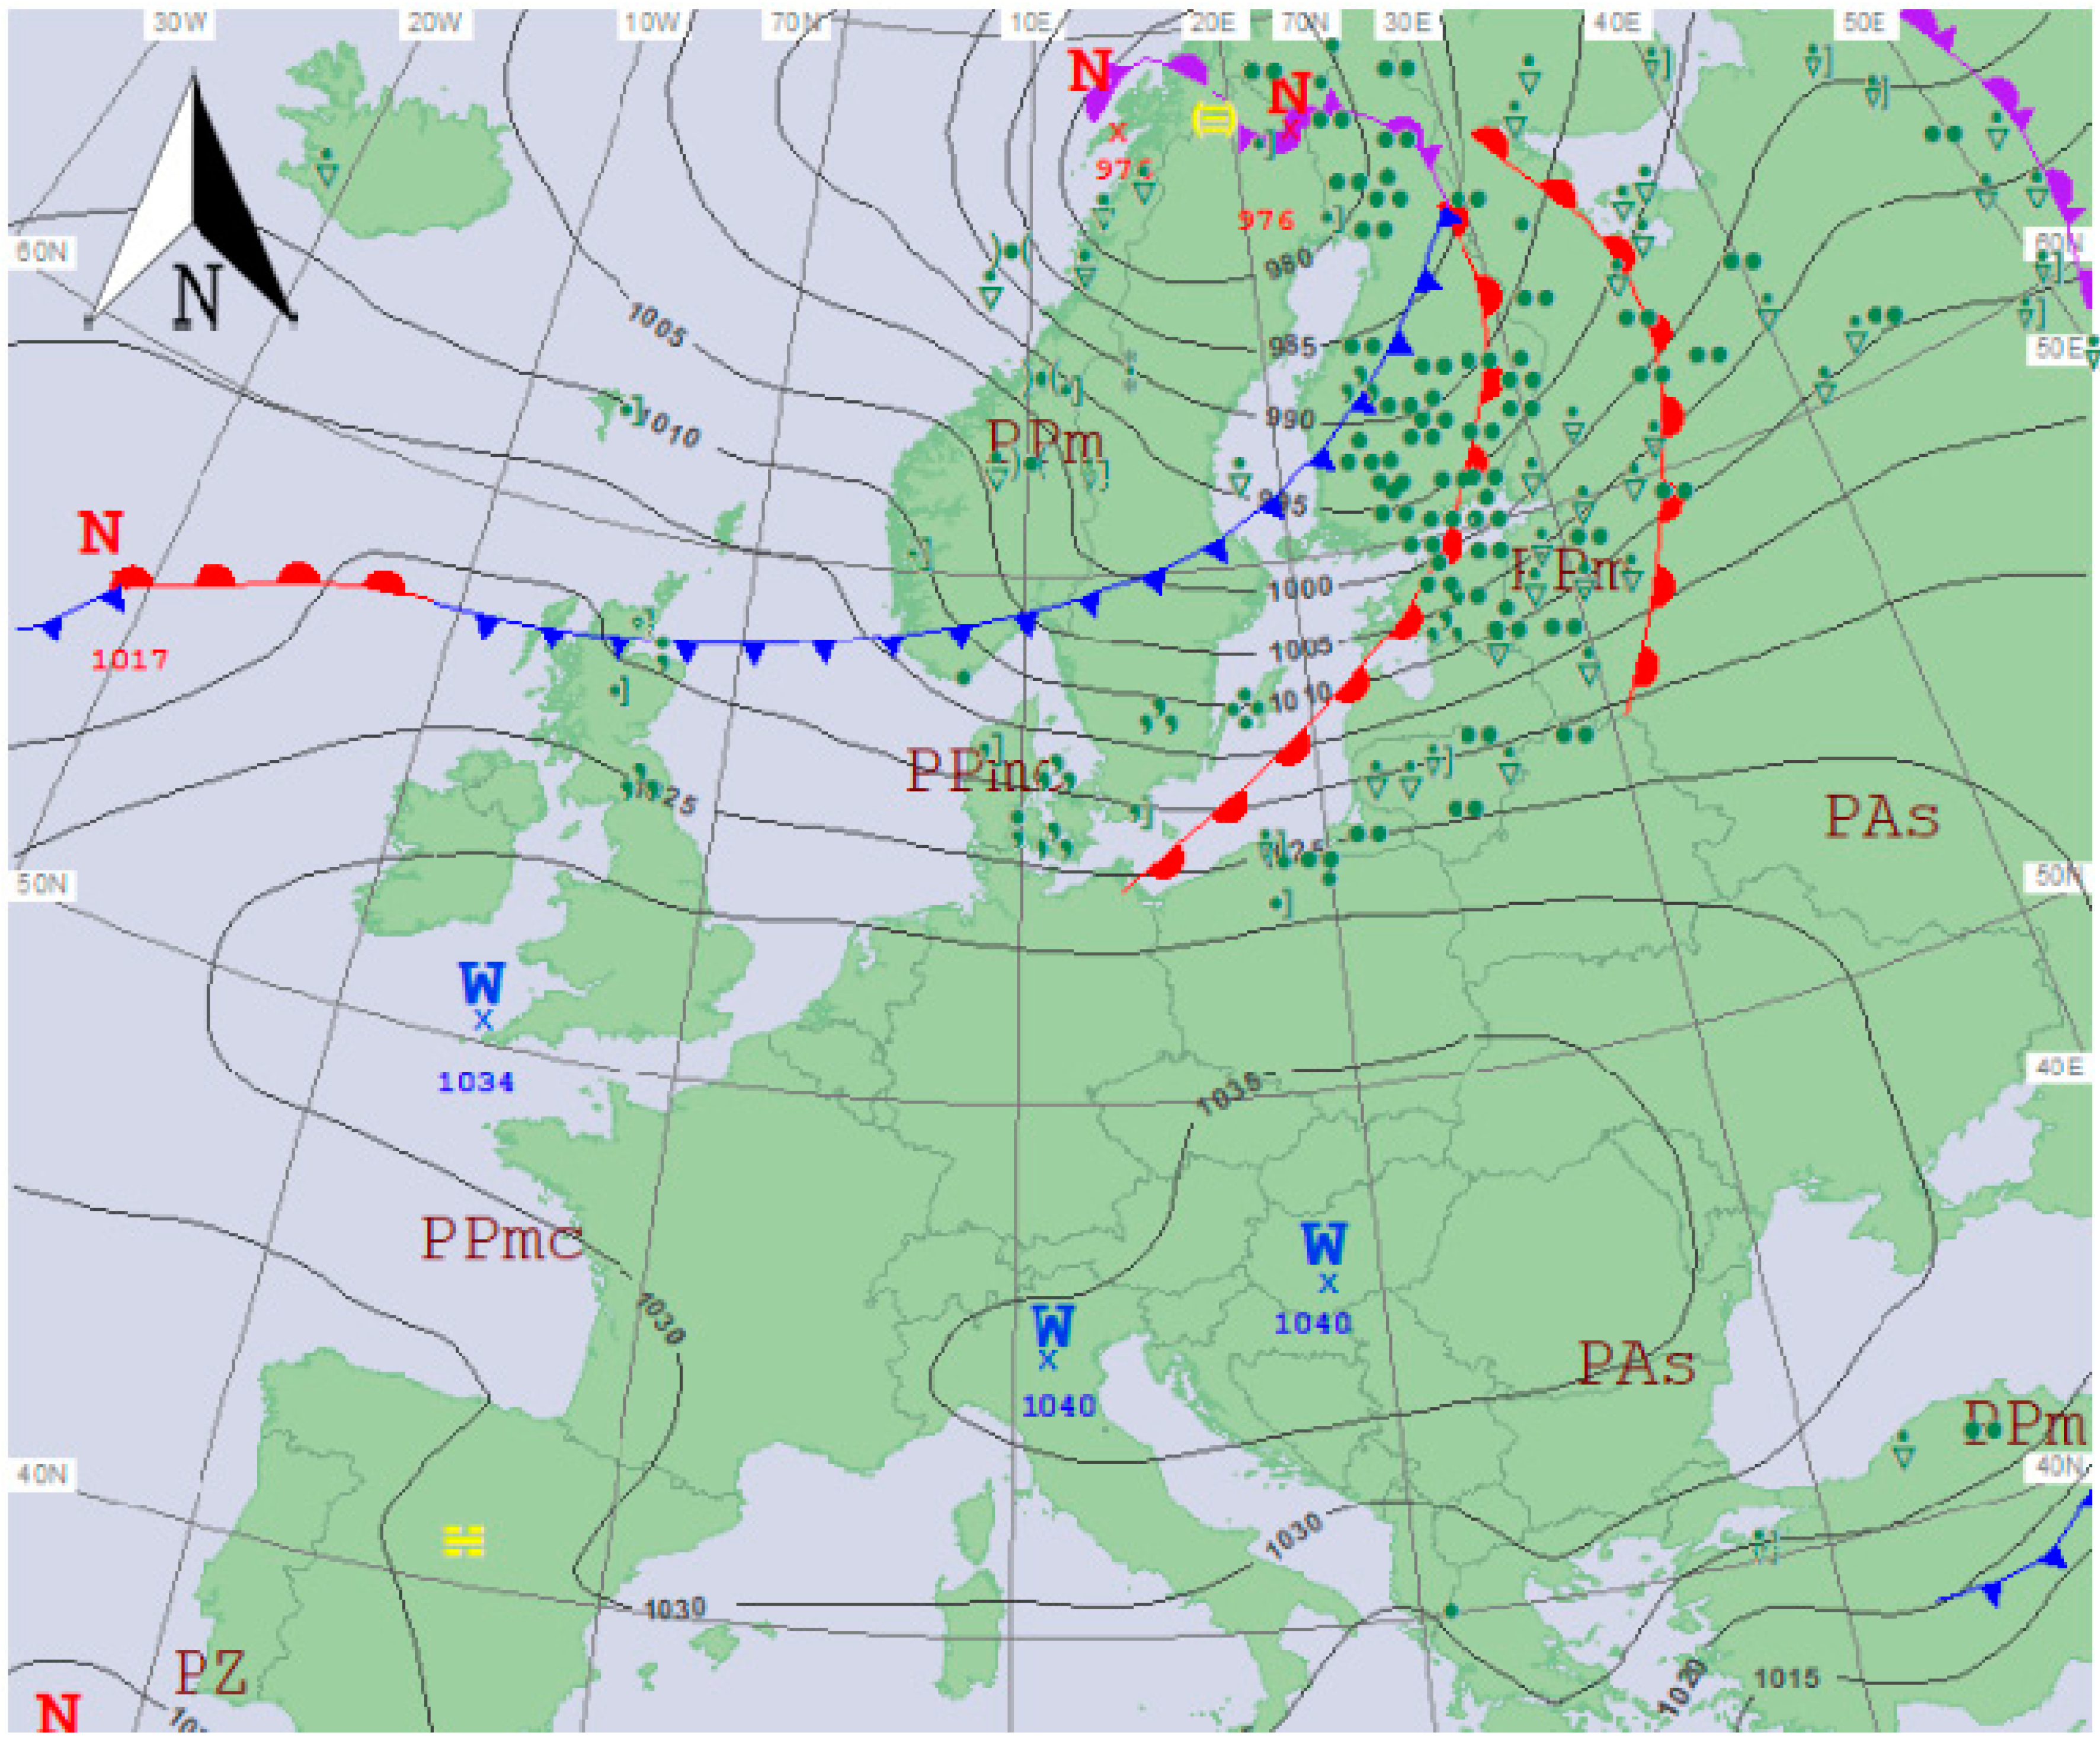
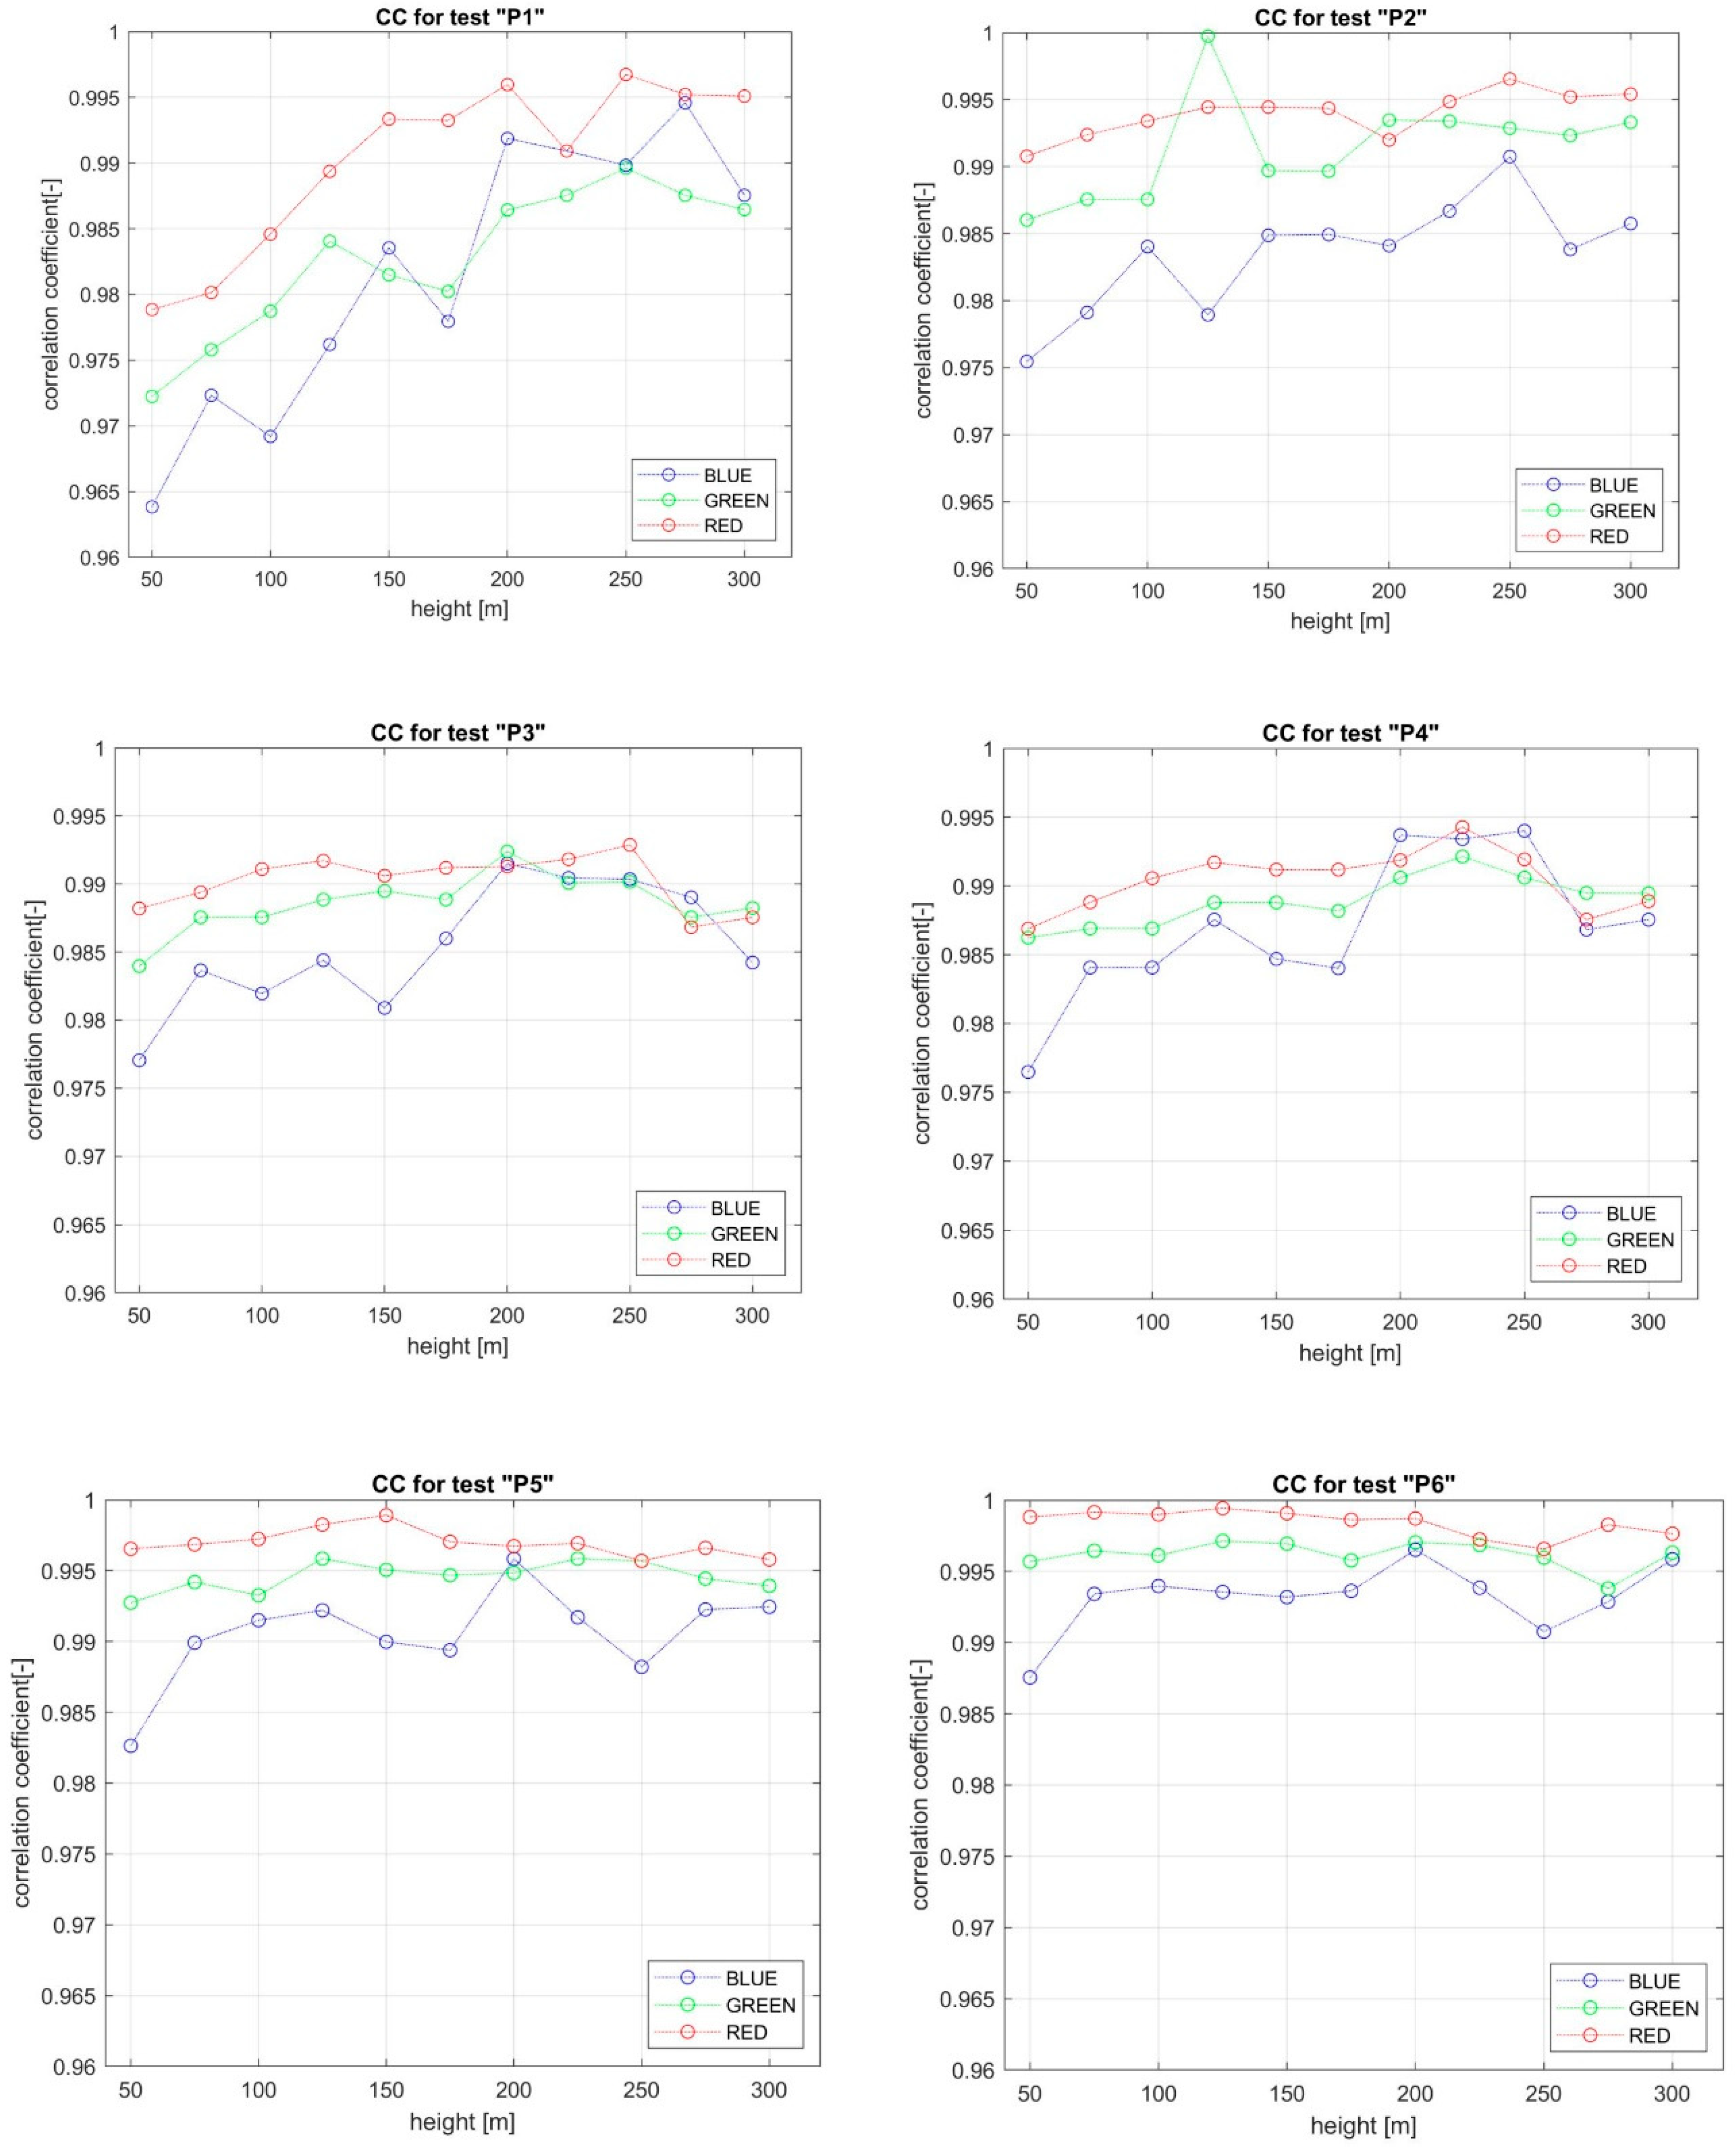
We studied the influence of atmospheric conditions on UAV imagery radiometric quality, which then served as the basis for the proposed solution for the assessment of such data. During the day (from dawn till dusk, when photogrammetric flights could be conducted), a number of measurement sessions were completed at different altitudes, while monitoring the synoptic situation. The radiosonde was also registering information on the atmospheric conditions. The analysis of the synoptic situation showed that the biggest changes occurred with humidity. Therefore, we then focused mostly on assessing the impact of humidity on radiometric quality. Due to the data gathered, it was possible to determine the functions describing the change in humidity and the change in the reflectance coefficient for calibration tests during the day. The correlation coefficient for the function describing the changes in humidity and the reflectance coefficient during the day computed for each flight altitude of the UAV platform were considered as measures of the relationship between the functions. Changes in the reflectance coefficient were determined on the basis of reference panels with known spectral characteristics, as the difference between the theoretical and practical values. The studies used panels from P1 to P6, where the theoretical reflection coefficients ranged from 2 to 95%. The correlation coefficient was calculated separately for each UAV flight altitude, as presented in
Figure 11.
As demonstrated in the figures, regardless of altitude, a strong correlation exists between humidity and differences in reflectance. The correlation coefficient value is higher than 0.90, with most of the values even higher than 0.95. This high correlation between air humidity and the difference in the reflection coefficient points to the significant impact of humidity on UAV imagery radiometric quality. This problem is important especially in the case of photographs with low radiometric quality, where the correct light reflection properties are disturbed (
Figure 12).
It was, therefore, crucial to develop a model for radiometric correction, which consider the impact of air humidity on pixel brightness and enable a correct imaging of objects with different levels of light reflectance. Due to the large numbers of photographs in the photogrammetric blocks, we propose selecting the images that would need correction due to the influence of air humidity. Thus, we propose using a special QA indicator for assessing the quality of low-altitude photographs.
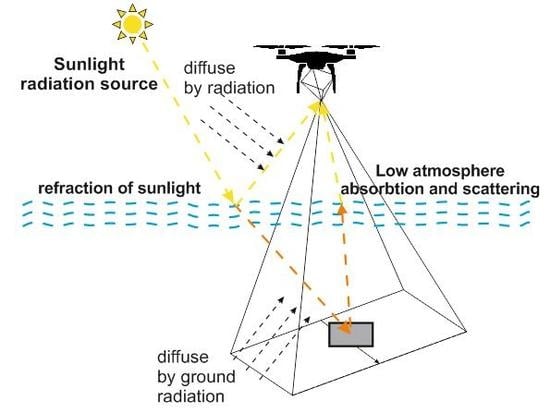
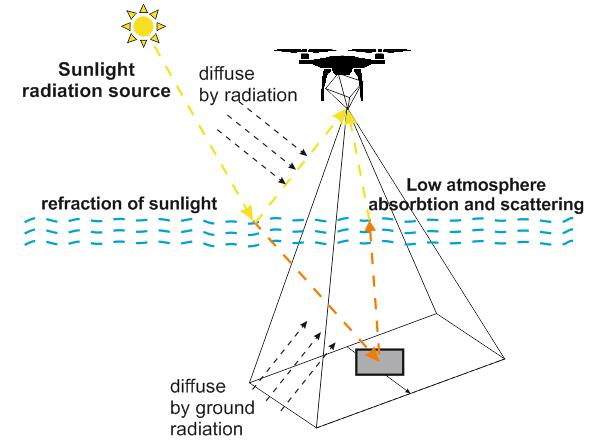
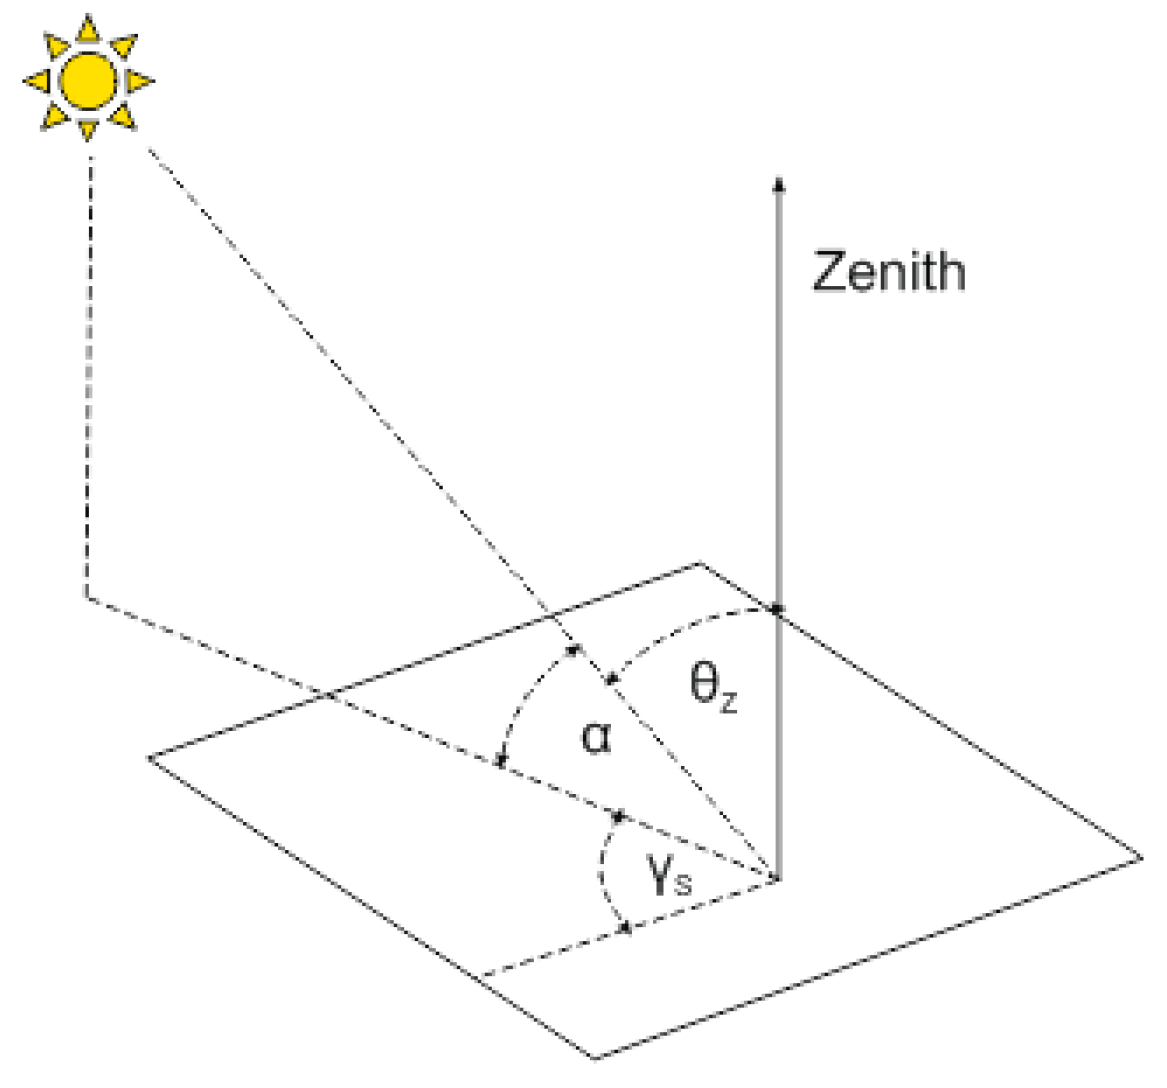
The position of the sun and the direction of the radiation on the test surface is determined by basic angle parameters (
Figure 13).
The θ
z angle is measured between the angle of the rays falling directly on the given surface and the normal to this plane, and is expressed as follows [
46,
47,
48]:
where β is the angle of inclination of the considered surface in relation to the Earth’s surface, φ is the latitude of the photographed location, and ω is the hour angle, i.e., the deviation of the sunrise or sunset from the local meridian as a result of Earth’s rotation about its axis. Values of the hour angles for every hour of photography (hours of the solar day; h) are expressed with:
The δ angle (°) is the solar declination, i.e., the angle between the sun and the plane of the celestial equator. The value of declination for the given day of the year (
n) is computed with Cooper’s formula:
In the case of a horizontal surface, when β = 0, the equation for the solar zenith angle θ
z (during the day, when the sun is over the horizon, the angle must be in the range between 0 and 90°) will be as follows:
Considering the influence of the atmospheric conditions (humidity) and solar zenith angle θ
z, we developed an original formula, shown in Equation (9), enabling the calculation of the coefficient of the radiometric quality assessment for images obtained in a high-pressure area and in autumn conditions for Central and Eastern Europe. The solar zenith angle was calculated based on the geolocation and the time of UAV flight of study area. The solar zenith angle was in the range between 2 and 40°:
where
WKW is the quality assessment index for RGB images from low altitudes
, h is the humidity, and
sinθz is the solar zenith angle. The minimum theoretical value of the
indicator occurs when one of the factors in the nominator equals 0. This situation is only possible in the ideal case when the photograph is taken with perfect exposure parameters (
WKW = min) or when the theoretical humidity is at 0%, which is not possible in real life. Then,
= 0. In reality, however, both
WKW and humidity can approach 0, and then
0, which corresponds to images with good radiometric quality.
The denominator of the proposed equation cannot be equal to 0, and, in practice, it is impossible to take any photograph with the sun at zero height. When , then This describes a situation corresponding to obtaining photos with low radiometric quality. The higher the WKW and humidity values, the closer the to infinity.
In the physical interpretation, we consider a deviation from the ideal model. The higher the value of this deviation, the lower the image quality.
Similarly to the experiments conducted in Kedzierski and Wierzbicki [
44] on the basis of the visual analysis of images and their histograms for individual RGB bands for the obtained W
KW coefficient values, we determined the intervals and classified images as having good radiometric quality, medium radiometric quality, or bad radiometric quality; the latter needed to be subjected to atmospheric correction with the use of a dedicated model, for example, as implemented in the ATmospheric CORrection (ATCOR) [
49].
Selection parameters for the images were supported by the analysis of the images themselves, and of the QA indicator value for the reference block of data acquired at a low altitude in good lighting conditions.
Based on empirical studies and statistical analyses, we determined value intervals for the
QA coefficient (
Table 2).
The limits of the QA coefficient intervals were assigned based on the value of the average and the multiple of the standard deviation value for the coefficient studied for a sample of reference data. The upper limit of good-quality images was set as the average value increased by twice the maximum standard deviation for the tested blocks, which was 6.00. For the medium quality category, the upper limit was the average value increased by three-times the maximum standard deviation, which was 7.65. Images with bad radiometric quality had an indicator higher than 7.65. The higher the coefficient value, the lower the image quality. As the indicator approaches the maximum value, the image approaches the so-called dark image, which is blurry and out of focus.
When examining the properties of the proposed
QA indicator, we conducted case studies of photographs captured in different conditions. We adopted the assumption that all photographs were taken with exposure parameters chosen so that the intensity of light falling on detector arrays was always the same. This guaranteed the same values of the
WKW factor for both photo sets; for example, this value for good-quality photographs can equal 2 [
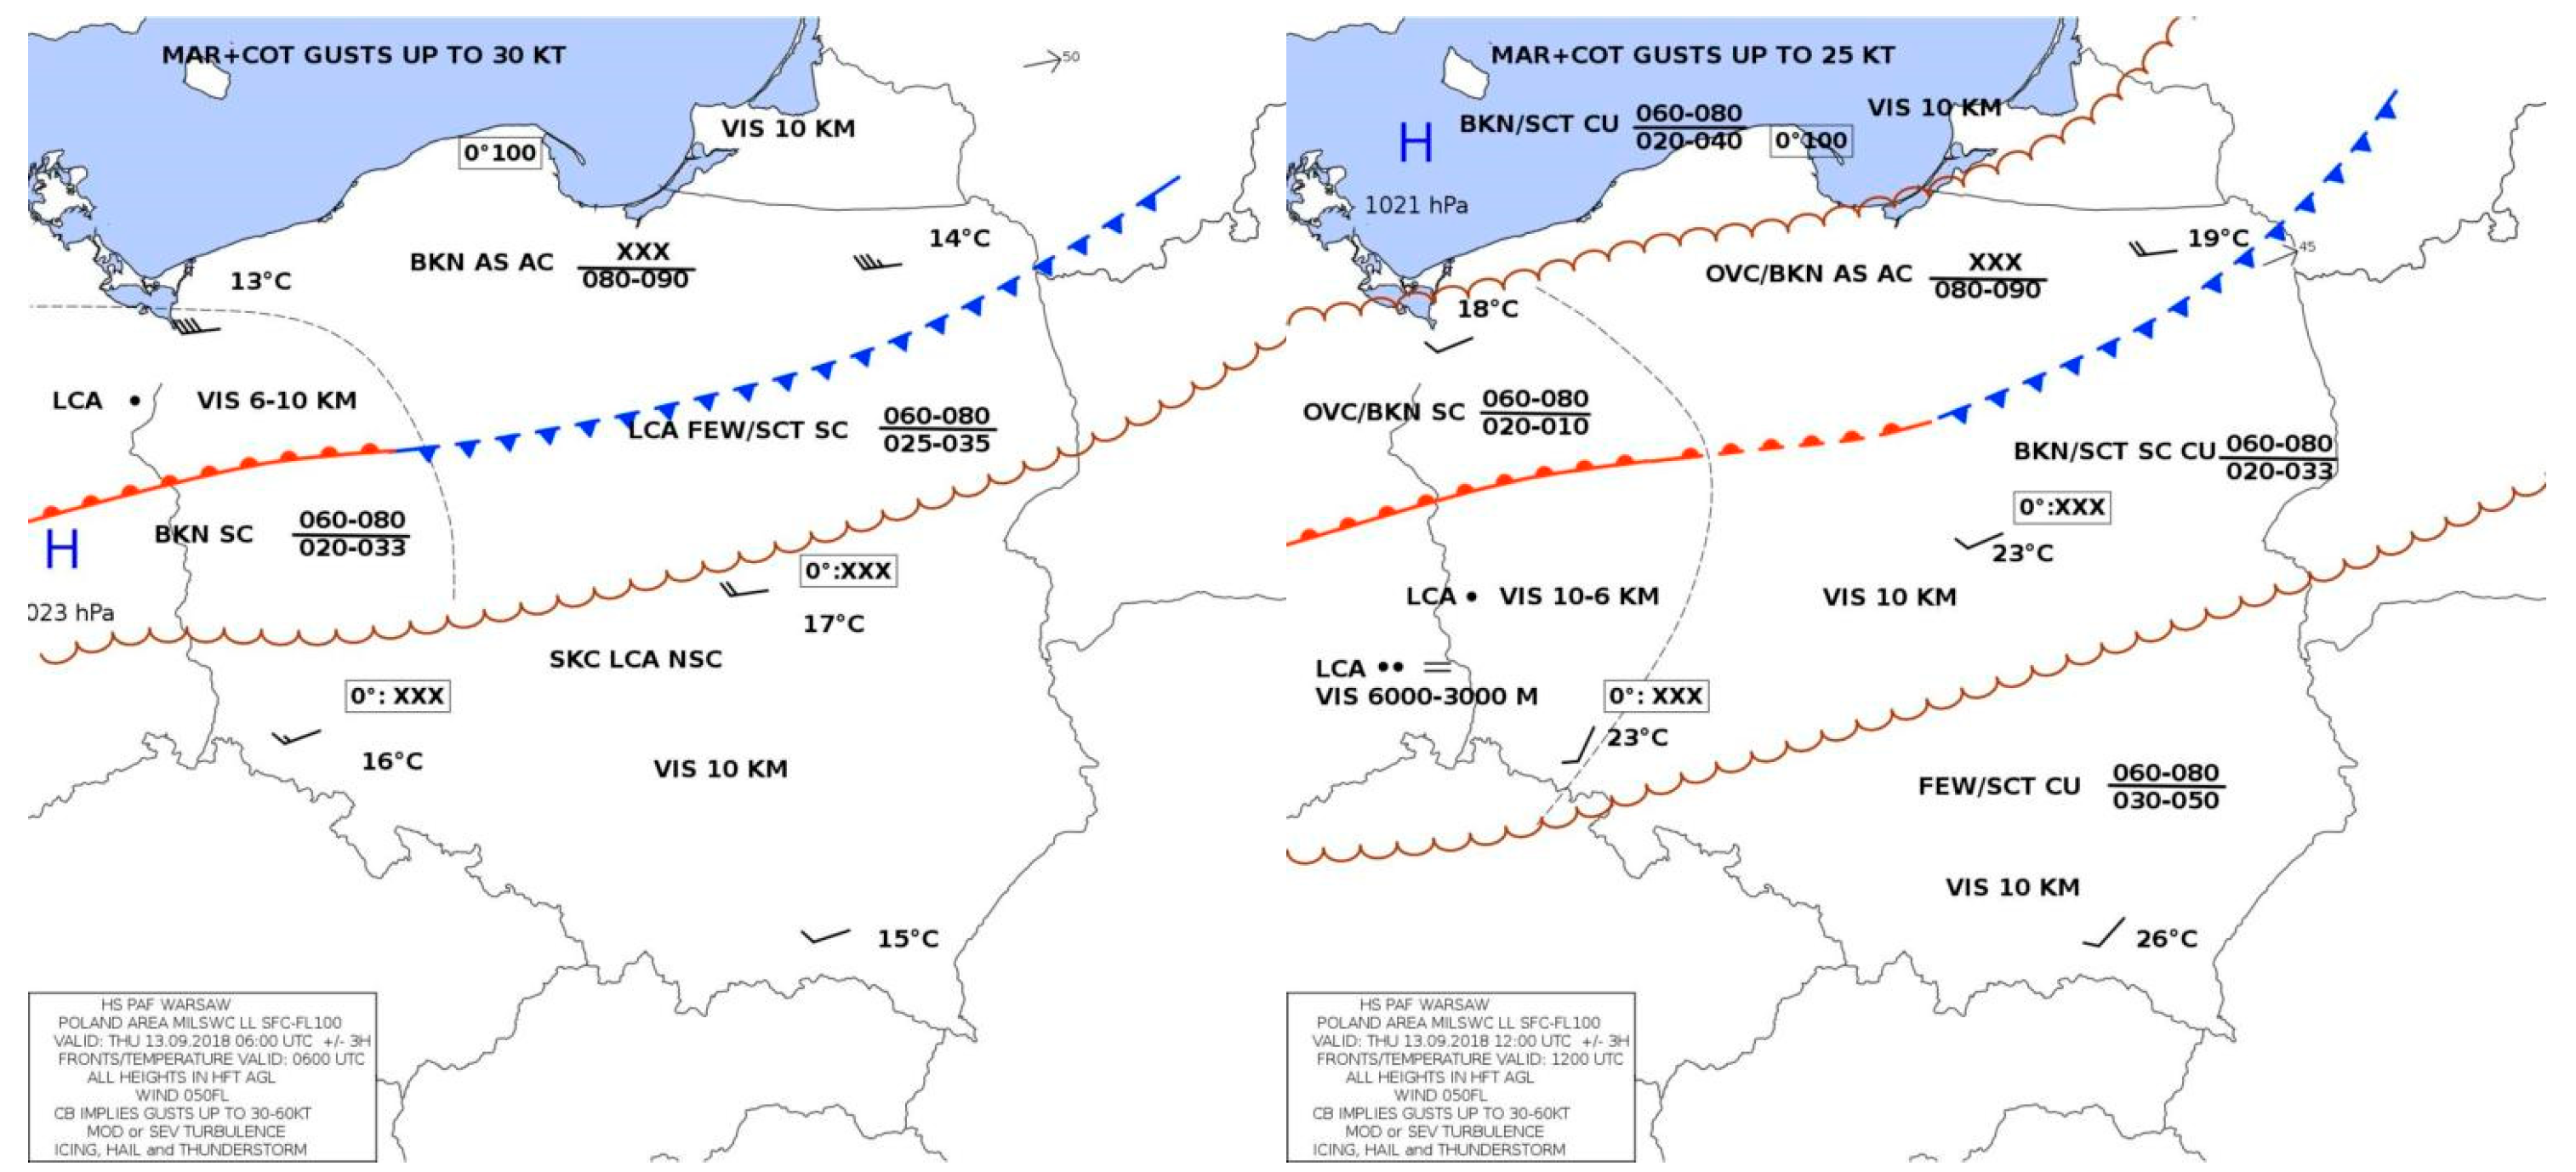
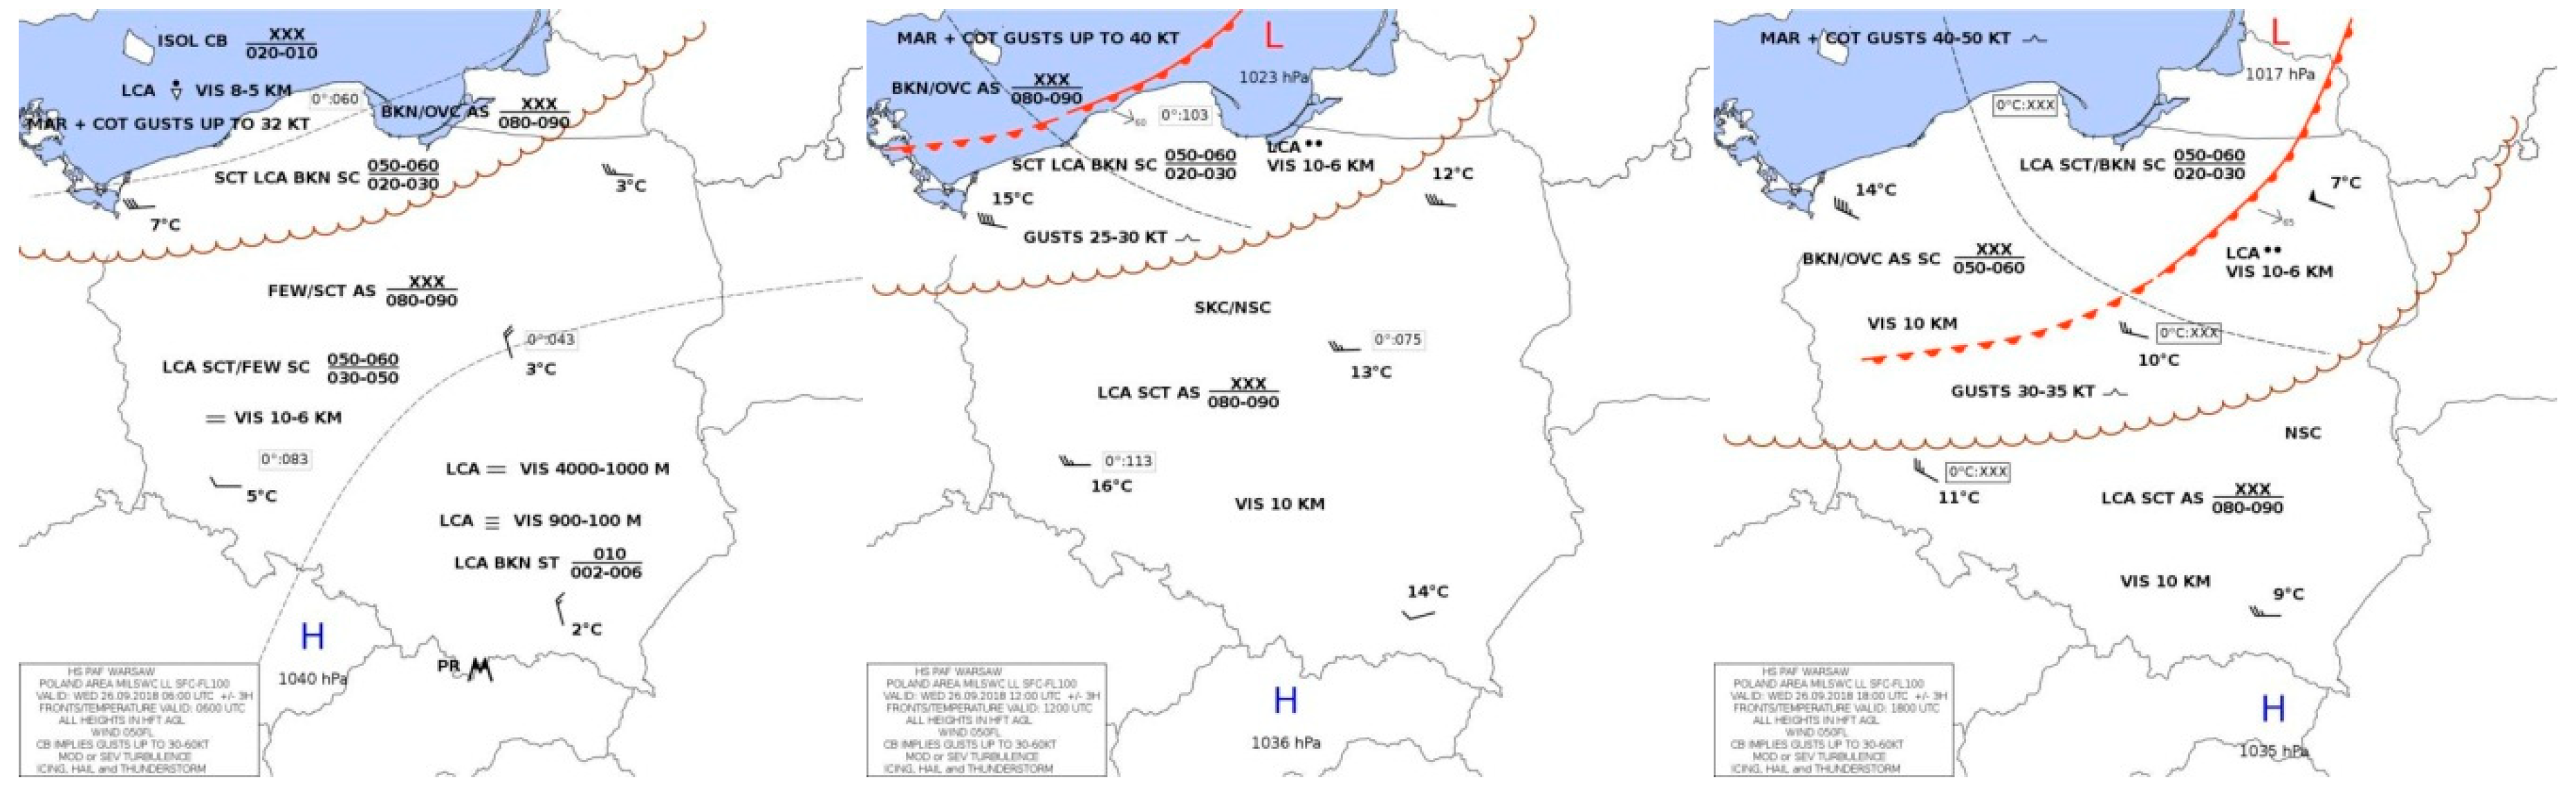
44]. Our proposed solution was verified by assessing the radiometric quality of photographs obtained during separate flights in both good and bad weather conditions. A series of flights were conducted in early autumn (September 13 and 26, 2018) with high and uniform insolation, and in late autumn with a high degree of cloud cover (November 22, 2018). The data were registered at three different altitudes at three times of day, so with different solar angles and air humidity. The
QA indicator was calculated for all the images.
QA can be considered a way that integrates WKW index in order to explicitly take into consideration humidity and solar zenith angle on the quality of the image. The two additional terms of QA compensate the circumstance that WKW is not able to evaluate the influence (that exists) of humidity and solar zenith angle on the acquired data. Therefore, even though the correction proposed is empirical and very simple, the experiments carried out have proved that it is effective.
4. Results
Consider the case of photographs taken in September on 50° N latitude, just after dawn at 06:00 (sun altitude approx. 5°), 07:00 (sun altitude approx. 14°), and at 12:00 (sun altitude approx. 38°) with air humidity at 80% and 40%.
As Equation (10) and the case study presented in
Table 3 demonstrate, higher-quality images can be sometimes be more readily obtained in the morning, with no clouds and low humidity, than at noon with an overcast sky, and thus high air humidity. According to the proposed classification, the photographs capture right after dawn have low radiometric quality. This is consistent with common knowledge and experience; when the angle of the sunrays is too low, there are many shadows and the image is noisy. In turn, photographs taken with the sun at 14° and low humidity have a similar quality to those taken at noon with high humidity. The quality of photographs captured in the morning strongly depend on air humidity and the quality changes dynamically along with the rapid change in the sun’s vertical position in the sky after sunrise. A parallel pattern applies to images obtained in the evening, close to sunset. The highest quality imagery is captured with photographs at noon with low humidity when the
QA coefficient value approaches 0. The proposed indicator closely corresponds to the actual atmospheric conditions during photogrammetric flights and can be used to predict the quality of images obtained on a given day, at a given time, and with the known forecast humidity levels.
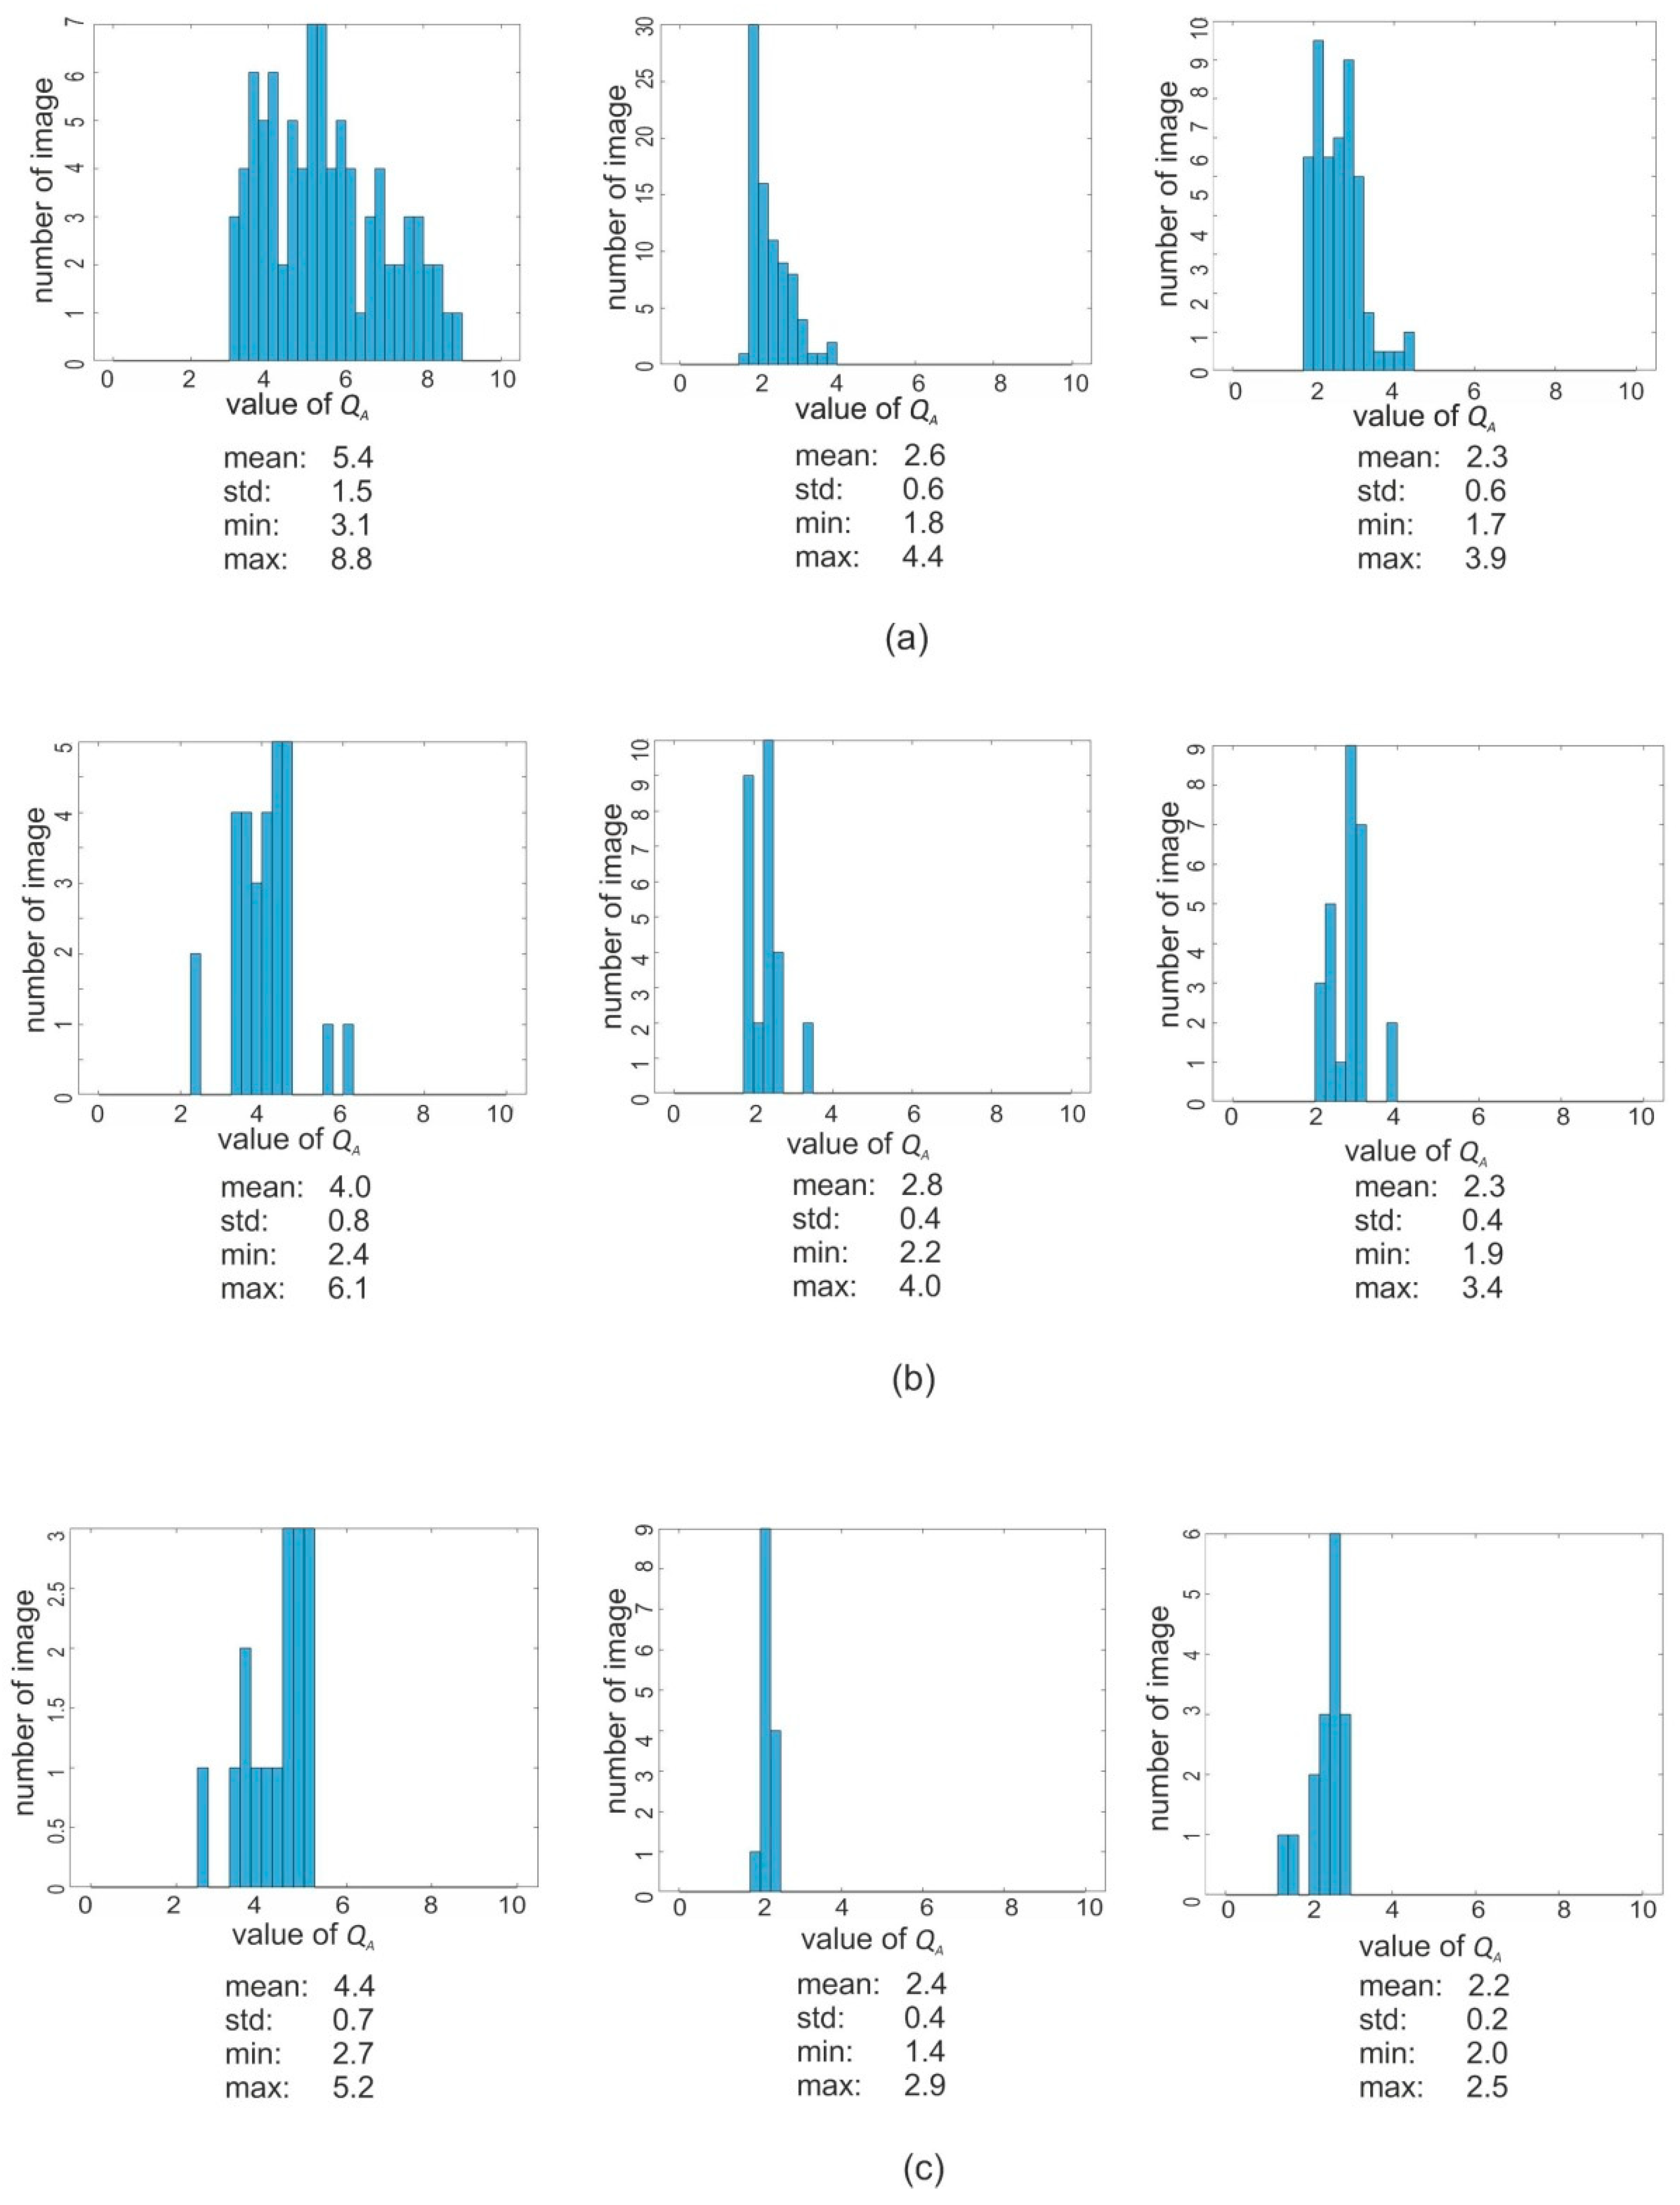
Figure 14 demonstrates the distribution of the
QA indicator values for reference images acquired at three different altitudes in the early morning, late morning, and afternoon.
The average coefficient values for reference images ranged from 1.4 to 5.4, with the standard deviation between 0.2 and 1.5. Maximum values do not exceed 9. The minimum value of the coefficient was 0 and is a theoretical value that the coefficient would reach for photographs taken in perfect conditions, i.e., with zero humidity and a 90° sunlight angle. Such conditions are unfeasible, so the indicator will always have values higher than 0.
In the
Table 4 we presented results of the statistical parameters of the indicator for each photo set.
In the case of data acquired in good conditions, QA values never exceeded 10, independent of the UAV flight altitude. With data obtained before noon, and thus with highest insolation and lowest humidity, all photos were categorized as good-quality. In the sets of photos from the morning and afternoon, there appear some photos had a coefficient exceeding 7.65, which suggests low image quality. This was caused by local radiation fogging. The relatively low SD values demonstrate a narrow distribution of values around the average, which means that the majority of images are characterized by good radiometric quality (especially with photos taken in the morning and afternoon). In turn, for data acquired with high overcast in the morning and afternoon, QA values significantly exceeded 7.65 and were categorized as bad radiometric quality. Only the photos taken before noon, when the lighting was more even, were classified as medium quality, and few were classified as good quality. The relatively high SD values in the morning and afternoon photo sets suggested the occurrence of both good- and bad-quality images; therefore, analyzing the QA coefficient for each photo enables selection of photos in need of radiometric correction.
Figure 15 presents sample images from both data sets. Visual analysis confirmed that the coefficient works correctly. Photos taken in good conditions are sharp and have a low degree of noise, which is reflected by low
QA values. Images acquired in poor conditions, in turn, are blurry, hazy, and noisy, as supported by low coefficient values.
Reflectance panels were also photographed in the test images to verify the accuracy of the proposed
QA indicator.
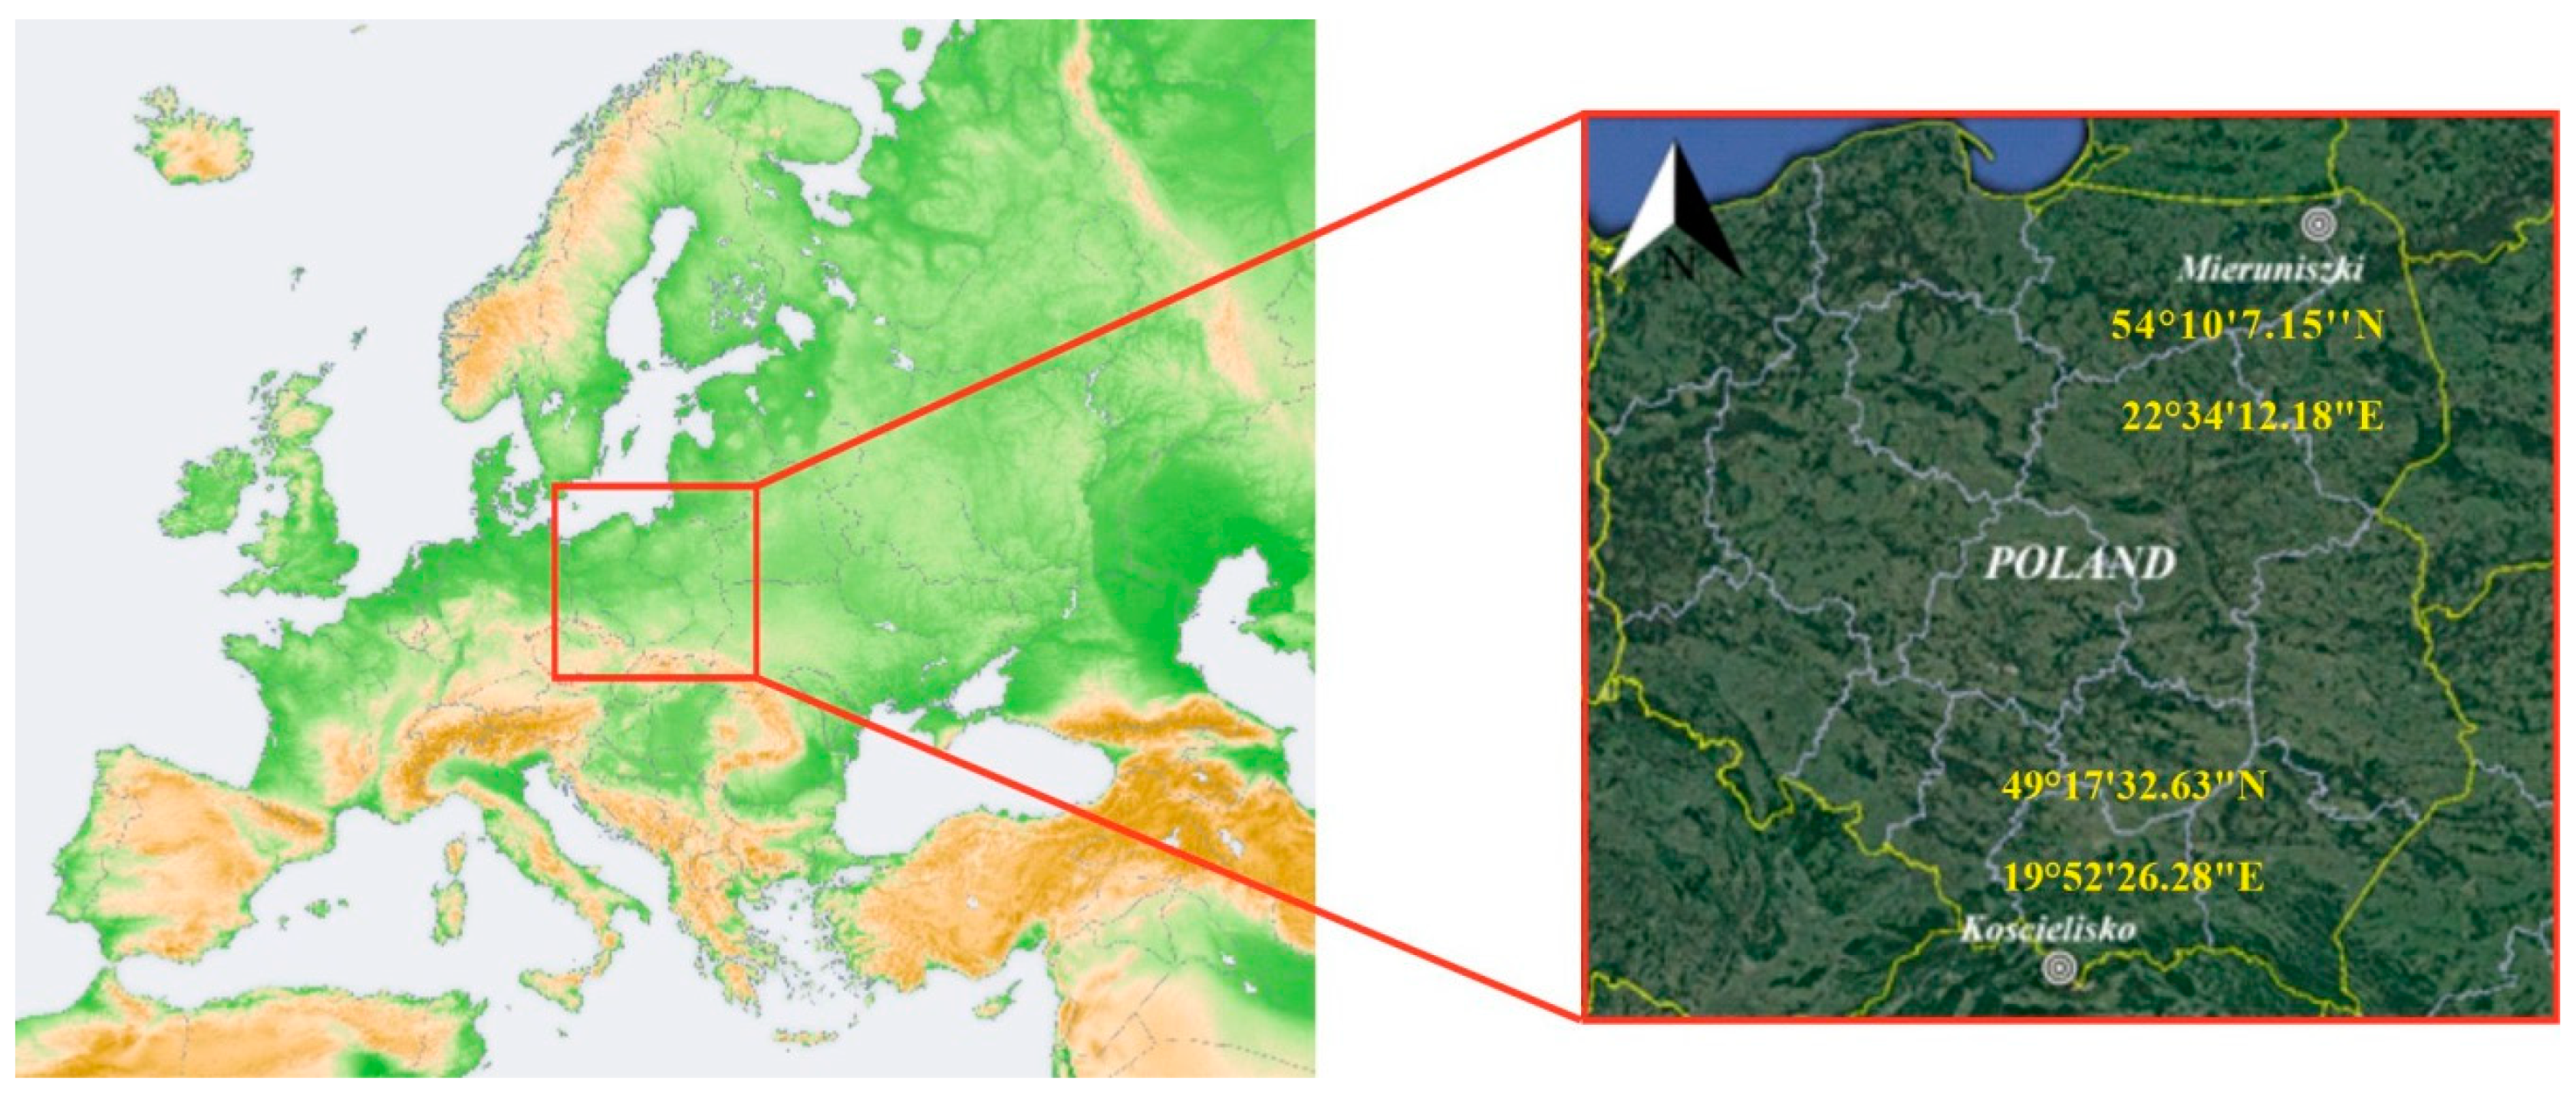
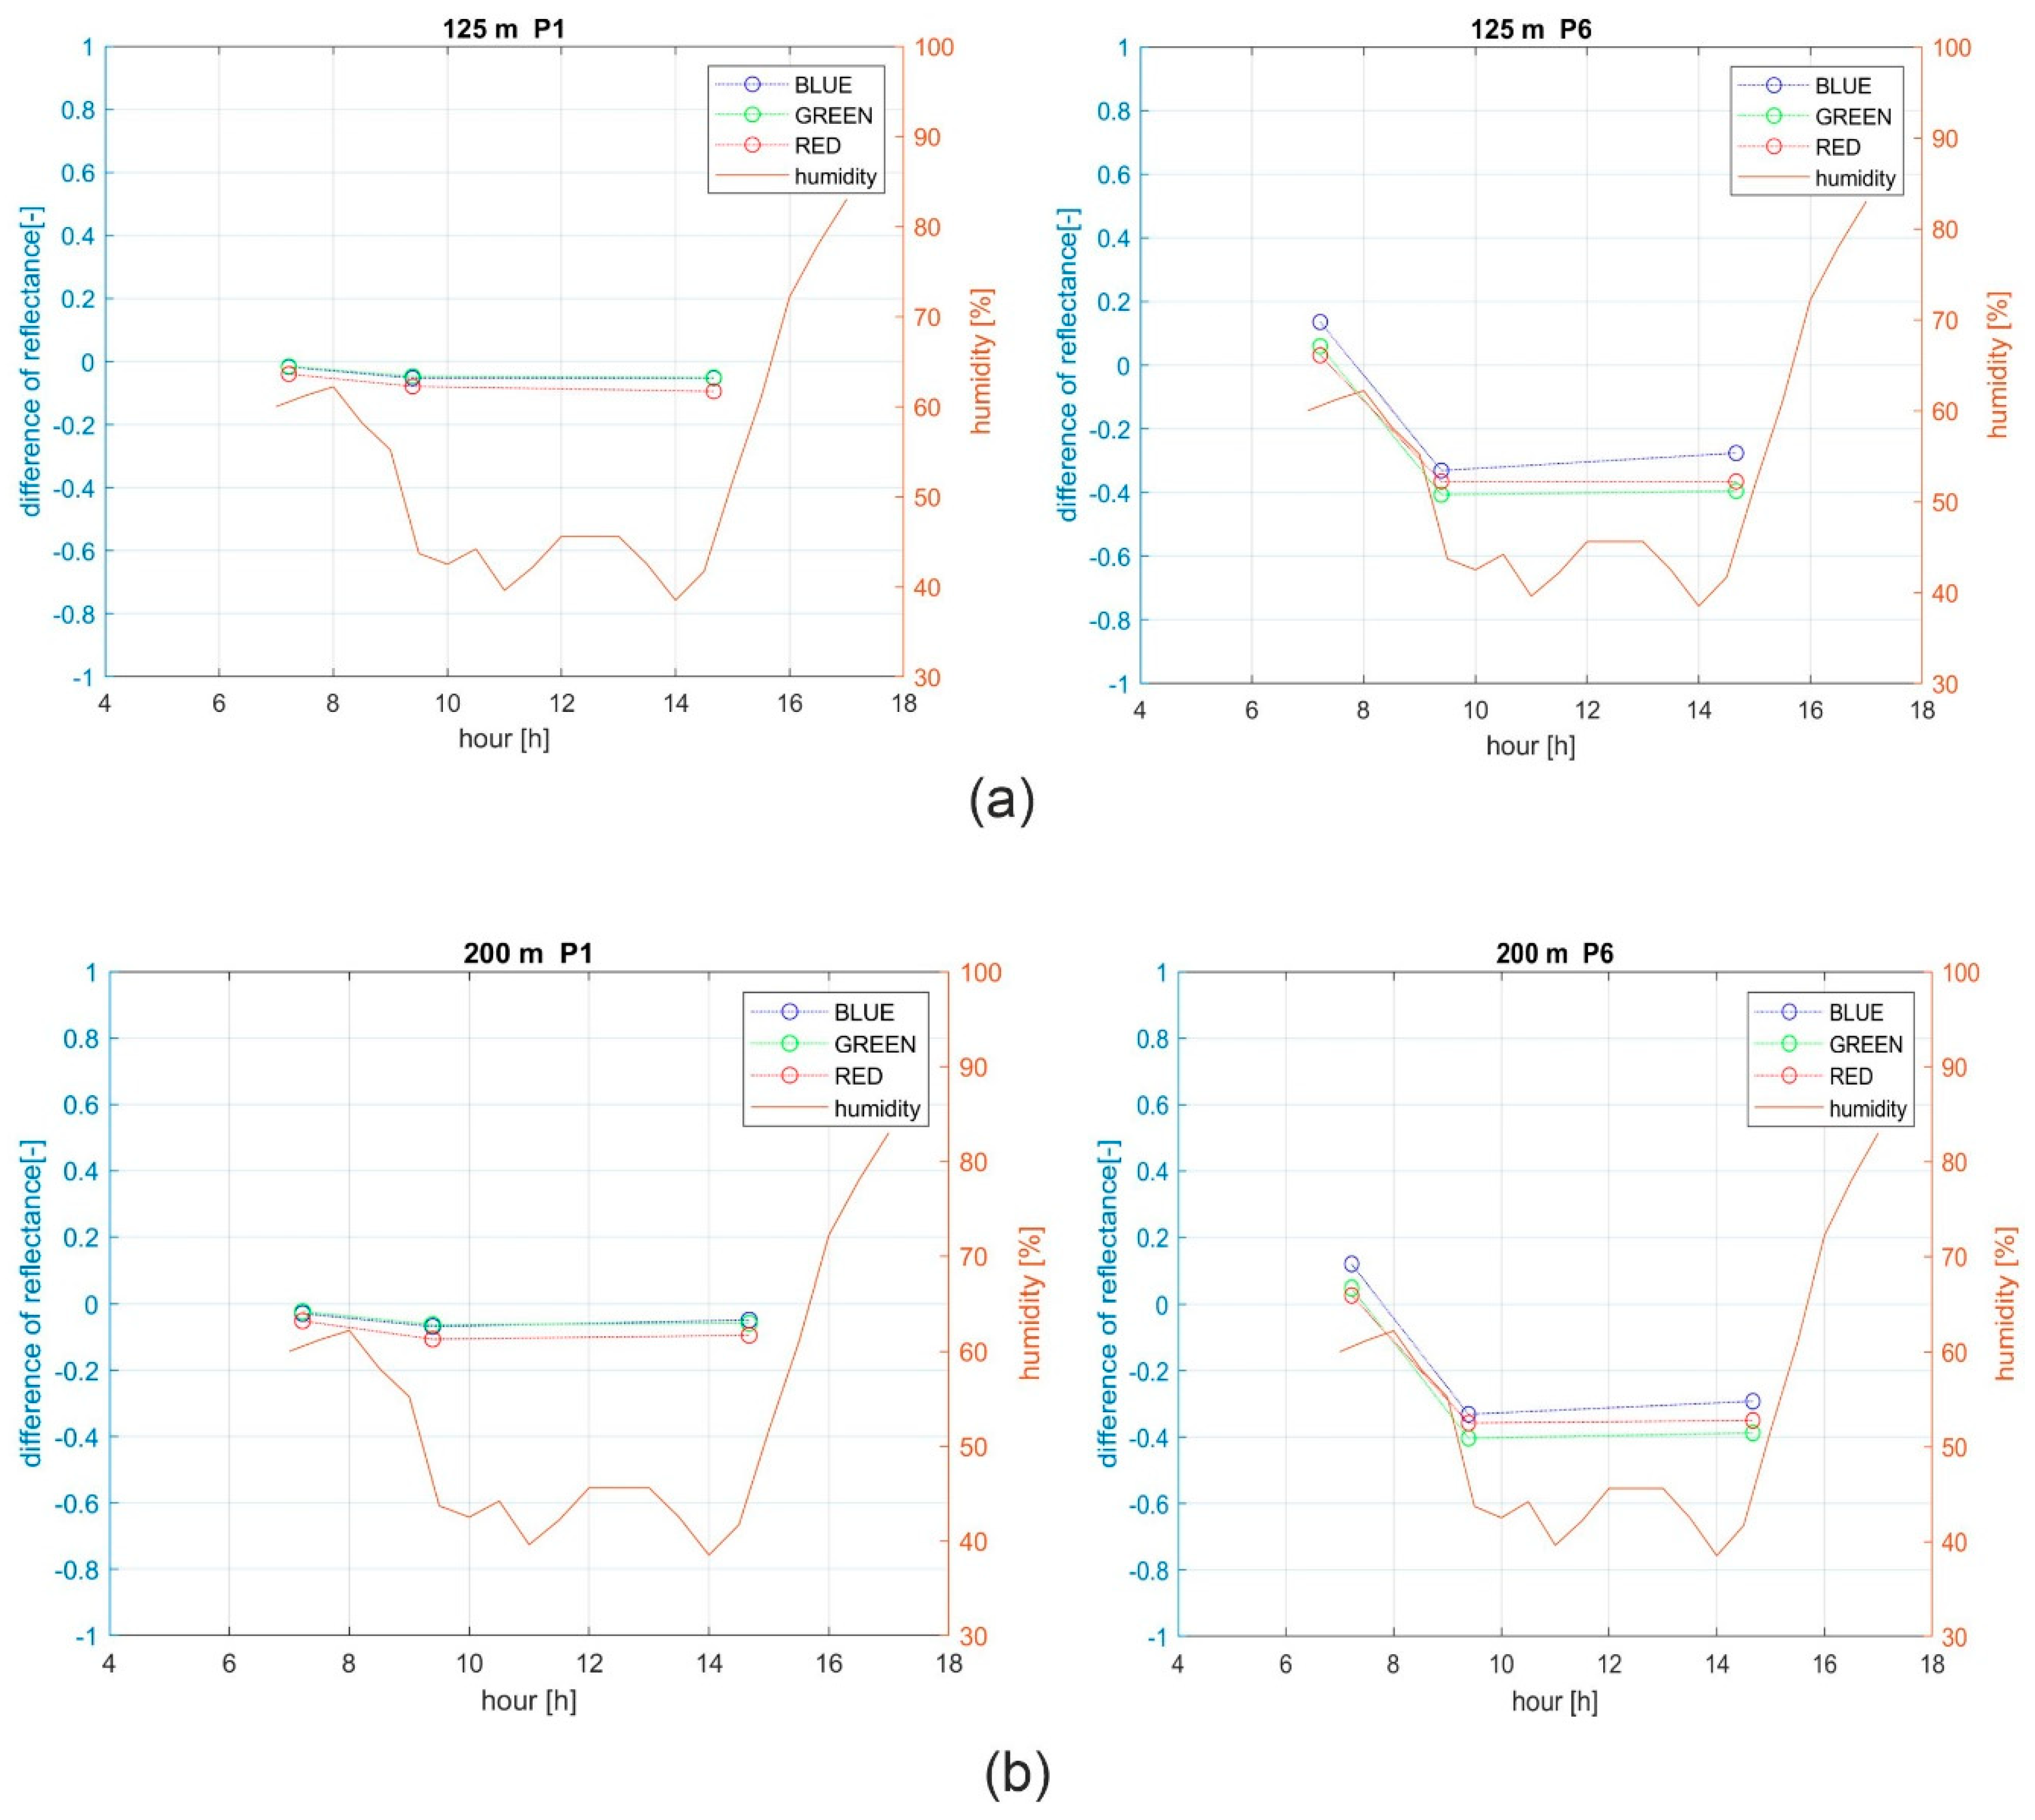
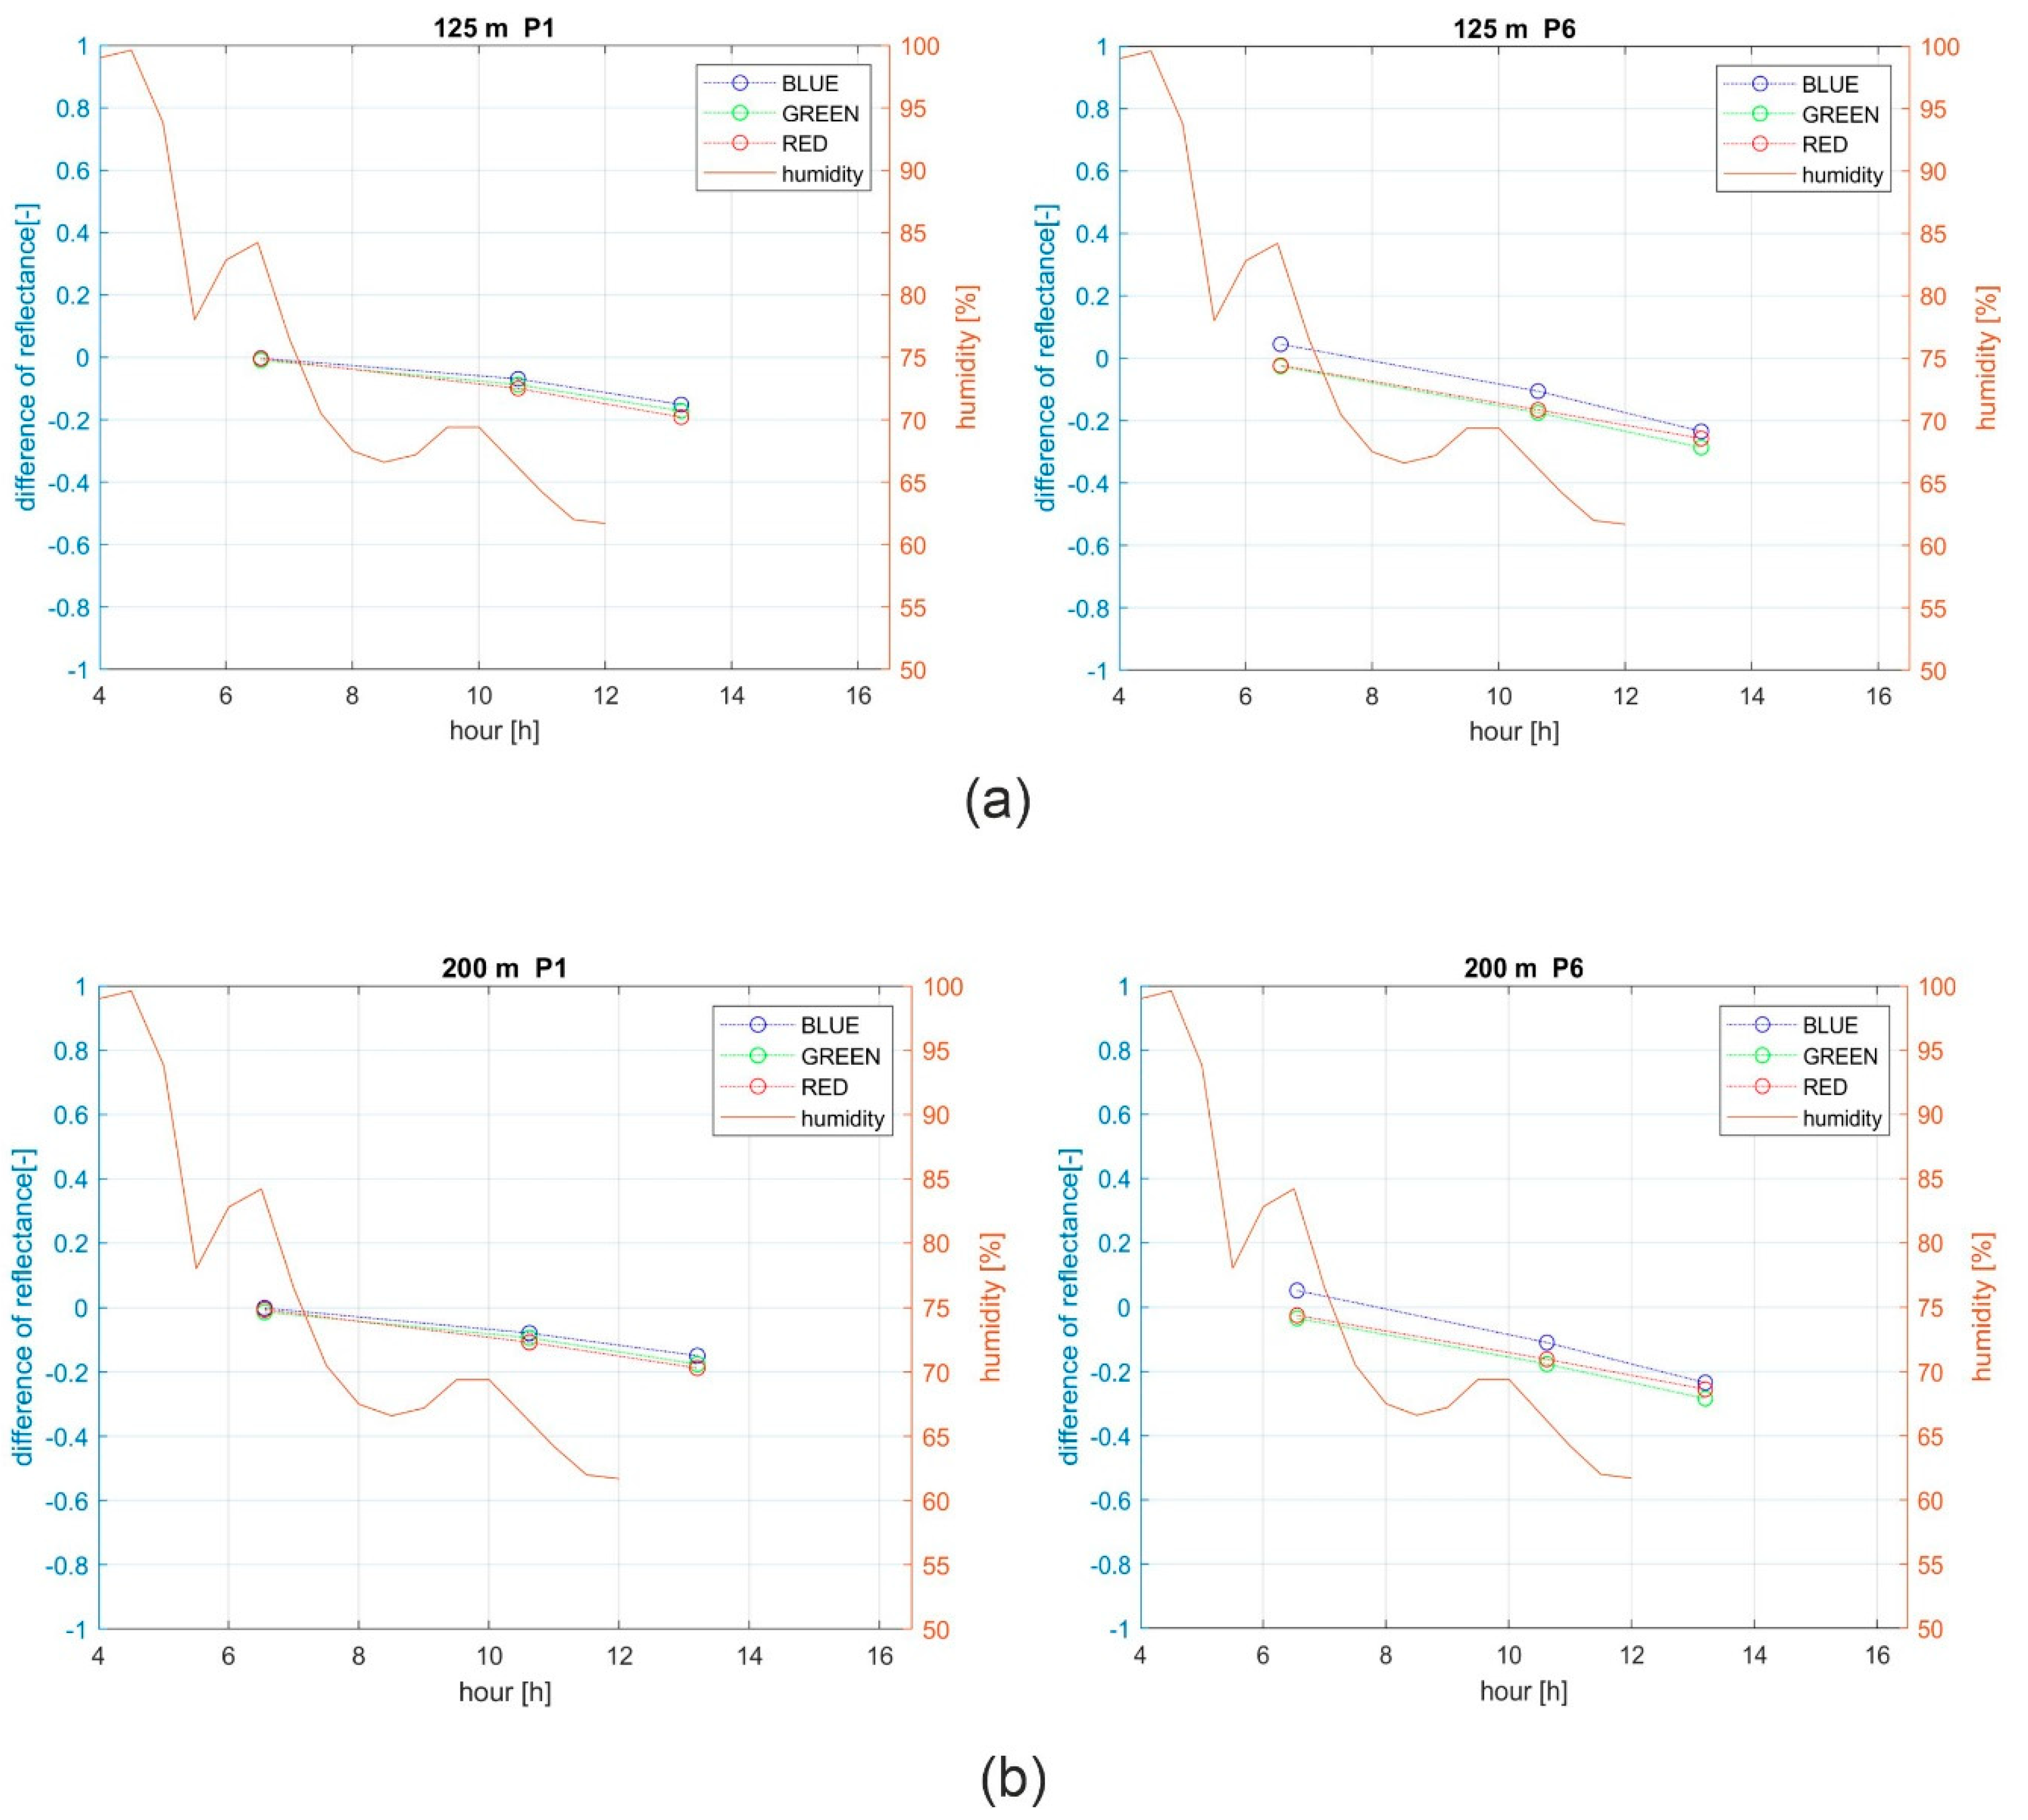
Figure 16 and
Figure 17 depict diagrams of air humidity and residuals from the theoretical value of the reflection coefficient for test with minimum (2%) and maximum (95%) reflectance for two chosen flight altitudes, first for Kościelisko, and then for the Mieruniszki test area.
Figure 16 and
Figure 17 provide the results for sets of data obtained in good weather conditions. The cloudless sky guaranteed a uniform illumination of the entire test area. As shown above, the photographs were clear and free of noise. The absolute values of reflectance residuals for the dark test (2% reflectance) did not exceed 0.2, and for the light test (95% reflectance), they did not exceed 0.4 in every RGB band. Such discrepancies between the theoretical and practical values indicate high radiometric quality and correct registering of light reflecting from objects, which is consistent with the
QA assessment.
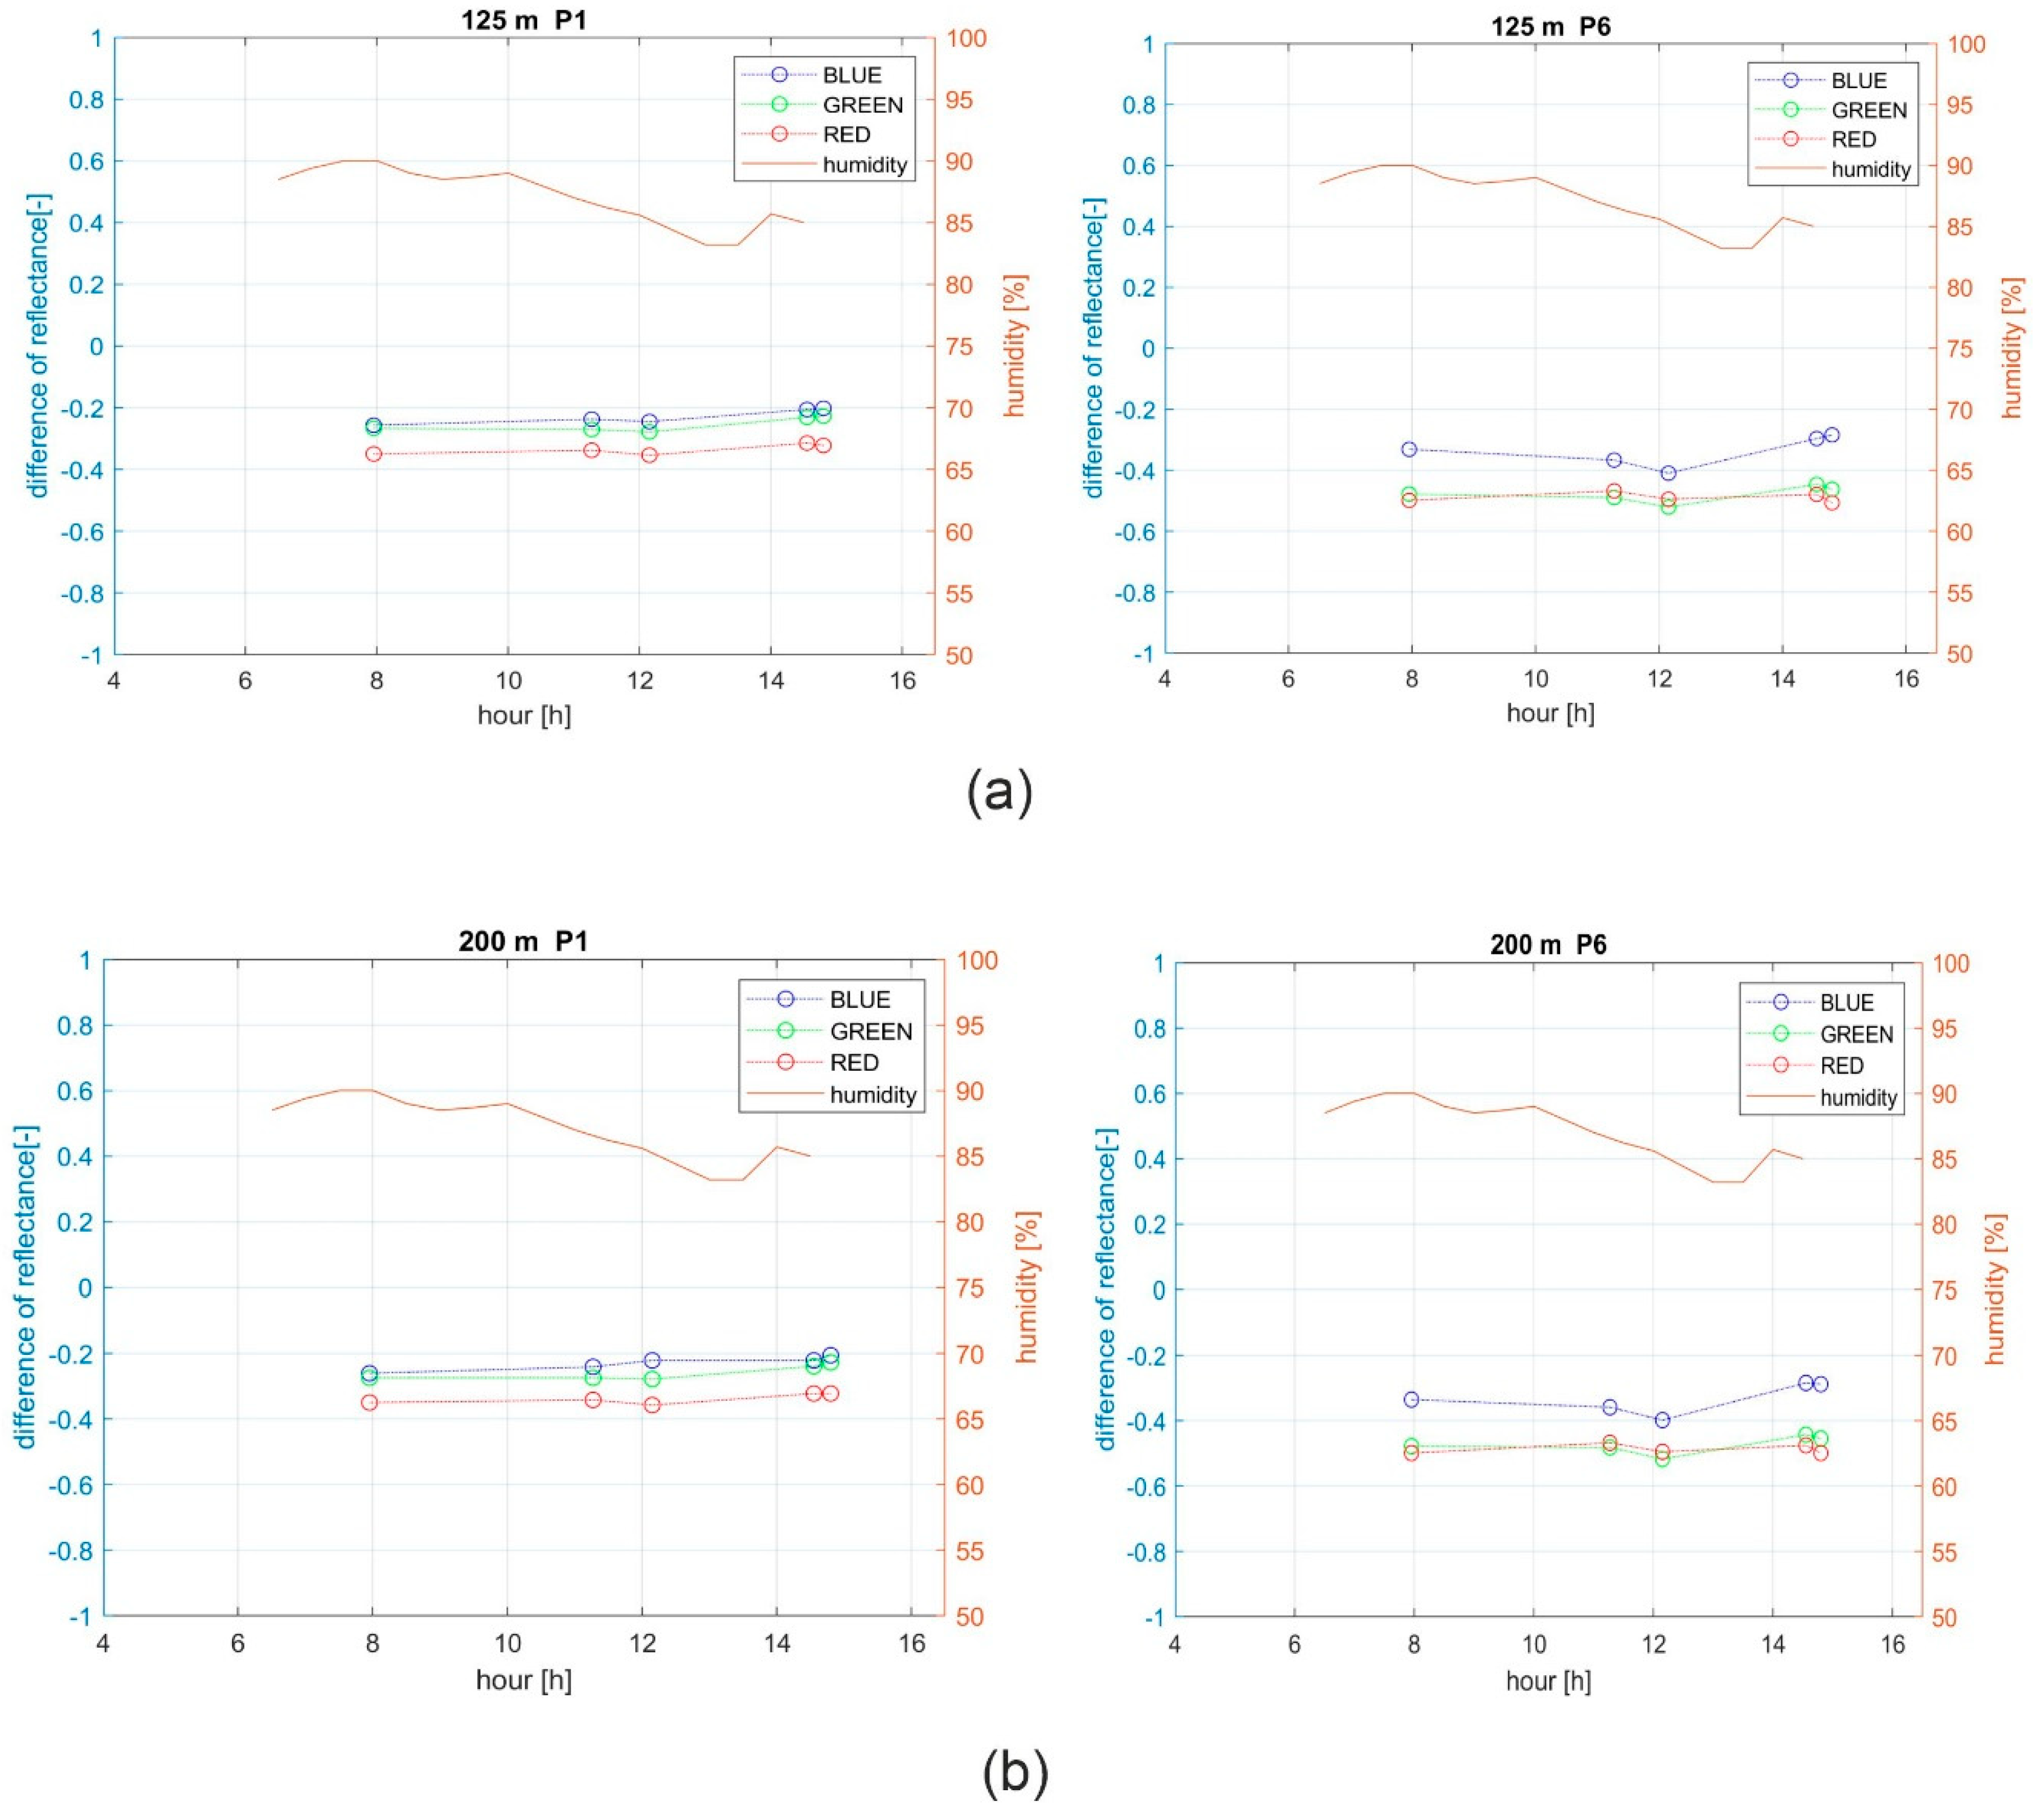
Figure 18 depicts the correspondent analyses of data obtained in poor weather conditions. The most noticeable difference is the increase in the residual for data obtained in poor weather conditions. The absolute value of these residuals increases by approximately 0.2 regardless of the UAV flight altitude, reaching values of 0.4 and 0.6 for the dark and light tests, respectively. Due to clouds, the photographed area was unevenly illuminated, which caused differences in the registered light reflection from the calibration test. Due to the high degree of clouding for the entire day, air humidity underwent only minor changes. There was a noticeable correlation between humidity and the reflection residual size. As the humidity dropped, the difference between the theoretical and practical reflectance coefficient value increased. The correlation might be slightly weaker for images registered in cloudy conditions, but strengthened with photographs captured with little or no cloudy. The conducted analyses confirm that the
QA indicator facilitates the selection of images in need of special radiometric correction.
5. Discussion
Fast and accurate quality assessment of UAV imagery, especially for the purposes of quantitative and qualitative analyses, is an area of active research in remote sensing technologies. Studies conducted to date have not considered the impact of lower-altitude atmospheric conditions on the radiometric quality of UAV imagery. Some studies only mentioned quality assessment based on laboratory experiments, which are usually difficult to replicate in real life when poorer atmospheric conditions have to be considered.
In this study, we proposed a new image radiometric quality assessment indicator that accounts for the influence of air humidity and solar zenith angle. The conducted experiments confirmed the impact of humidity (especially radiation fogs) on the quality of low-altitude images. Atmospheric correction for low-altitude UAVs in environmental monitoring has been generally neglected to date. However, in our experiment, similar to that conducted by Yu et al. [
50], we demonstrated that image quality is closely linked to Mie dispersion and Rayleigh scattering, as well as other factors, such as radiation fog [
51]. We observed that for images captured during high humidity, there is a greater dispersion of light on water vapor molecules, which is dependent on the wavelength (Mie dispersion). The study results also confirm the conclusions reported by Yang et al. [
52], where the relationship between image quality and lighting direction was analyzed. We proved that for areas with no cloud and low humidity, as well as uniform lighting of the entire imaging area, the images are characterized by good radiometric quality, and atmospheric damping does not occur. This was verified by examining the differences between the actual reflectance values and the values read from the images. Absolute reflectance residual values for the dark test (P1, 5% reflectance) did not exceed 0.2, and for the light test (P6, 95% reflectance) they did not exceed 0.4 for any RGB band. Such discrepancies between the theoretical and practical values indicate high radiometric quality and correct registering of light reflecting from objects, which is consistent with the
QA assessment. With the humidity level exceeding 50%, the absolute values of reflectance residuals for the dark test (P1, 2% reflectance) exceeded 0.4, and for the light test, they were even higher than 0.6 (P6). Images captured in such atmospheric conditions and humidity were out of focus, blurry, and noisy, which was reflected in the low
QA values. Therefore, it is crucial to apply atmospheric correction when processing UAV imagery data.
As demonstrated by the results of the verification studies, the methodology adopted for assessing the quality of images obtained under different atmospheric conditions can also be applied to image data acquired in different areas. The proposed methodology considers air humidity for a given altitude, as well as the solar zenith angle. As shown by the correlation coefficient (CC), there is a close link (high correlation) between humidity at a given altitude and the difference in reflection. In many cases, the correlation was higher than 0.8, with the majority of values exceeding 0.9. High correlation between humidity and the reflection coefficient difference indicates a significant impact of humidity on the radiometric quality of UAV images. The results of our experiment show that when assessing the quality of UAV imagery in the process of radiometric correction, it is vital to consider the impact of humidity for the given altitude, as this atmospheric factor distorts the correct reflectance values. The methodology proposed for assessing the impact of humidity and solar zenith angle might constitute a basis for a new model of atmospheric correction using dedicated reflectance panels. We proved that our approach is universal for the most commonly used heights in UAV remote sensing, i.e., heights from 75 to 300 m, lighting conditions, and humidity levels. The presented research demonstrates that performing this type of assessment and classifying the images into different quality groups is a legitimate and necessary approach. The conducted experiments indicate a new avenue of research to develop new models for image radiometric correction, dedicated solely to UAV imagery.
The main limitation of the proposed indicator is that it can only be used for images obtained in the visible range. Its efficiency depends on external measurements of humidity at the given altitude. The studies were conducted during the autumn period in Central and Eastern Europe, and so the thresholds set for classifying the image quality are dedicated for data obtained in similar conditions. New quality classification limits might need to be designated after similar studies are conducted during winter, and particularly in the summer, when there are significant changes not only to air humidity, but especially to the position of the sun. Thus, the indicator might approach higher values and produce different statistics. Similar problems may arise for data registered in other areas of the world. The studies were conducted in Europe, at approximately 50 °N latitude. The height of the sun also changes with the location of the imaged area, which influences the value range of the radiometric quality indicator.

 ,
, 


