Surface Moisture and Vegetation Cover Analysis for Drought Monitoring in the Southern Kruger National Park Using Sentinel-1, Sentinel-2, and Landsat-8

 , , , , , and
Abstract
1. Introduction
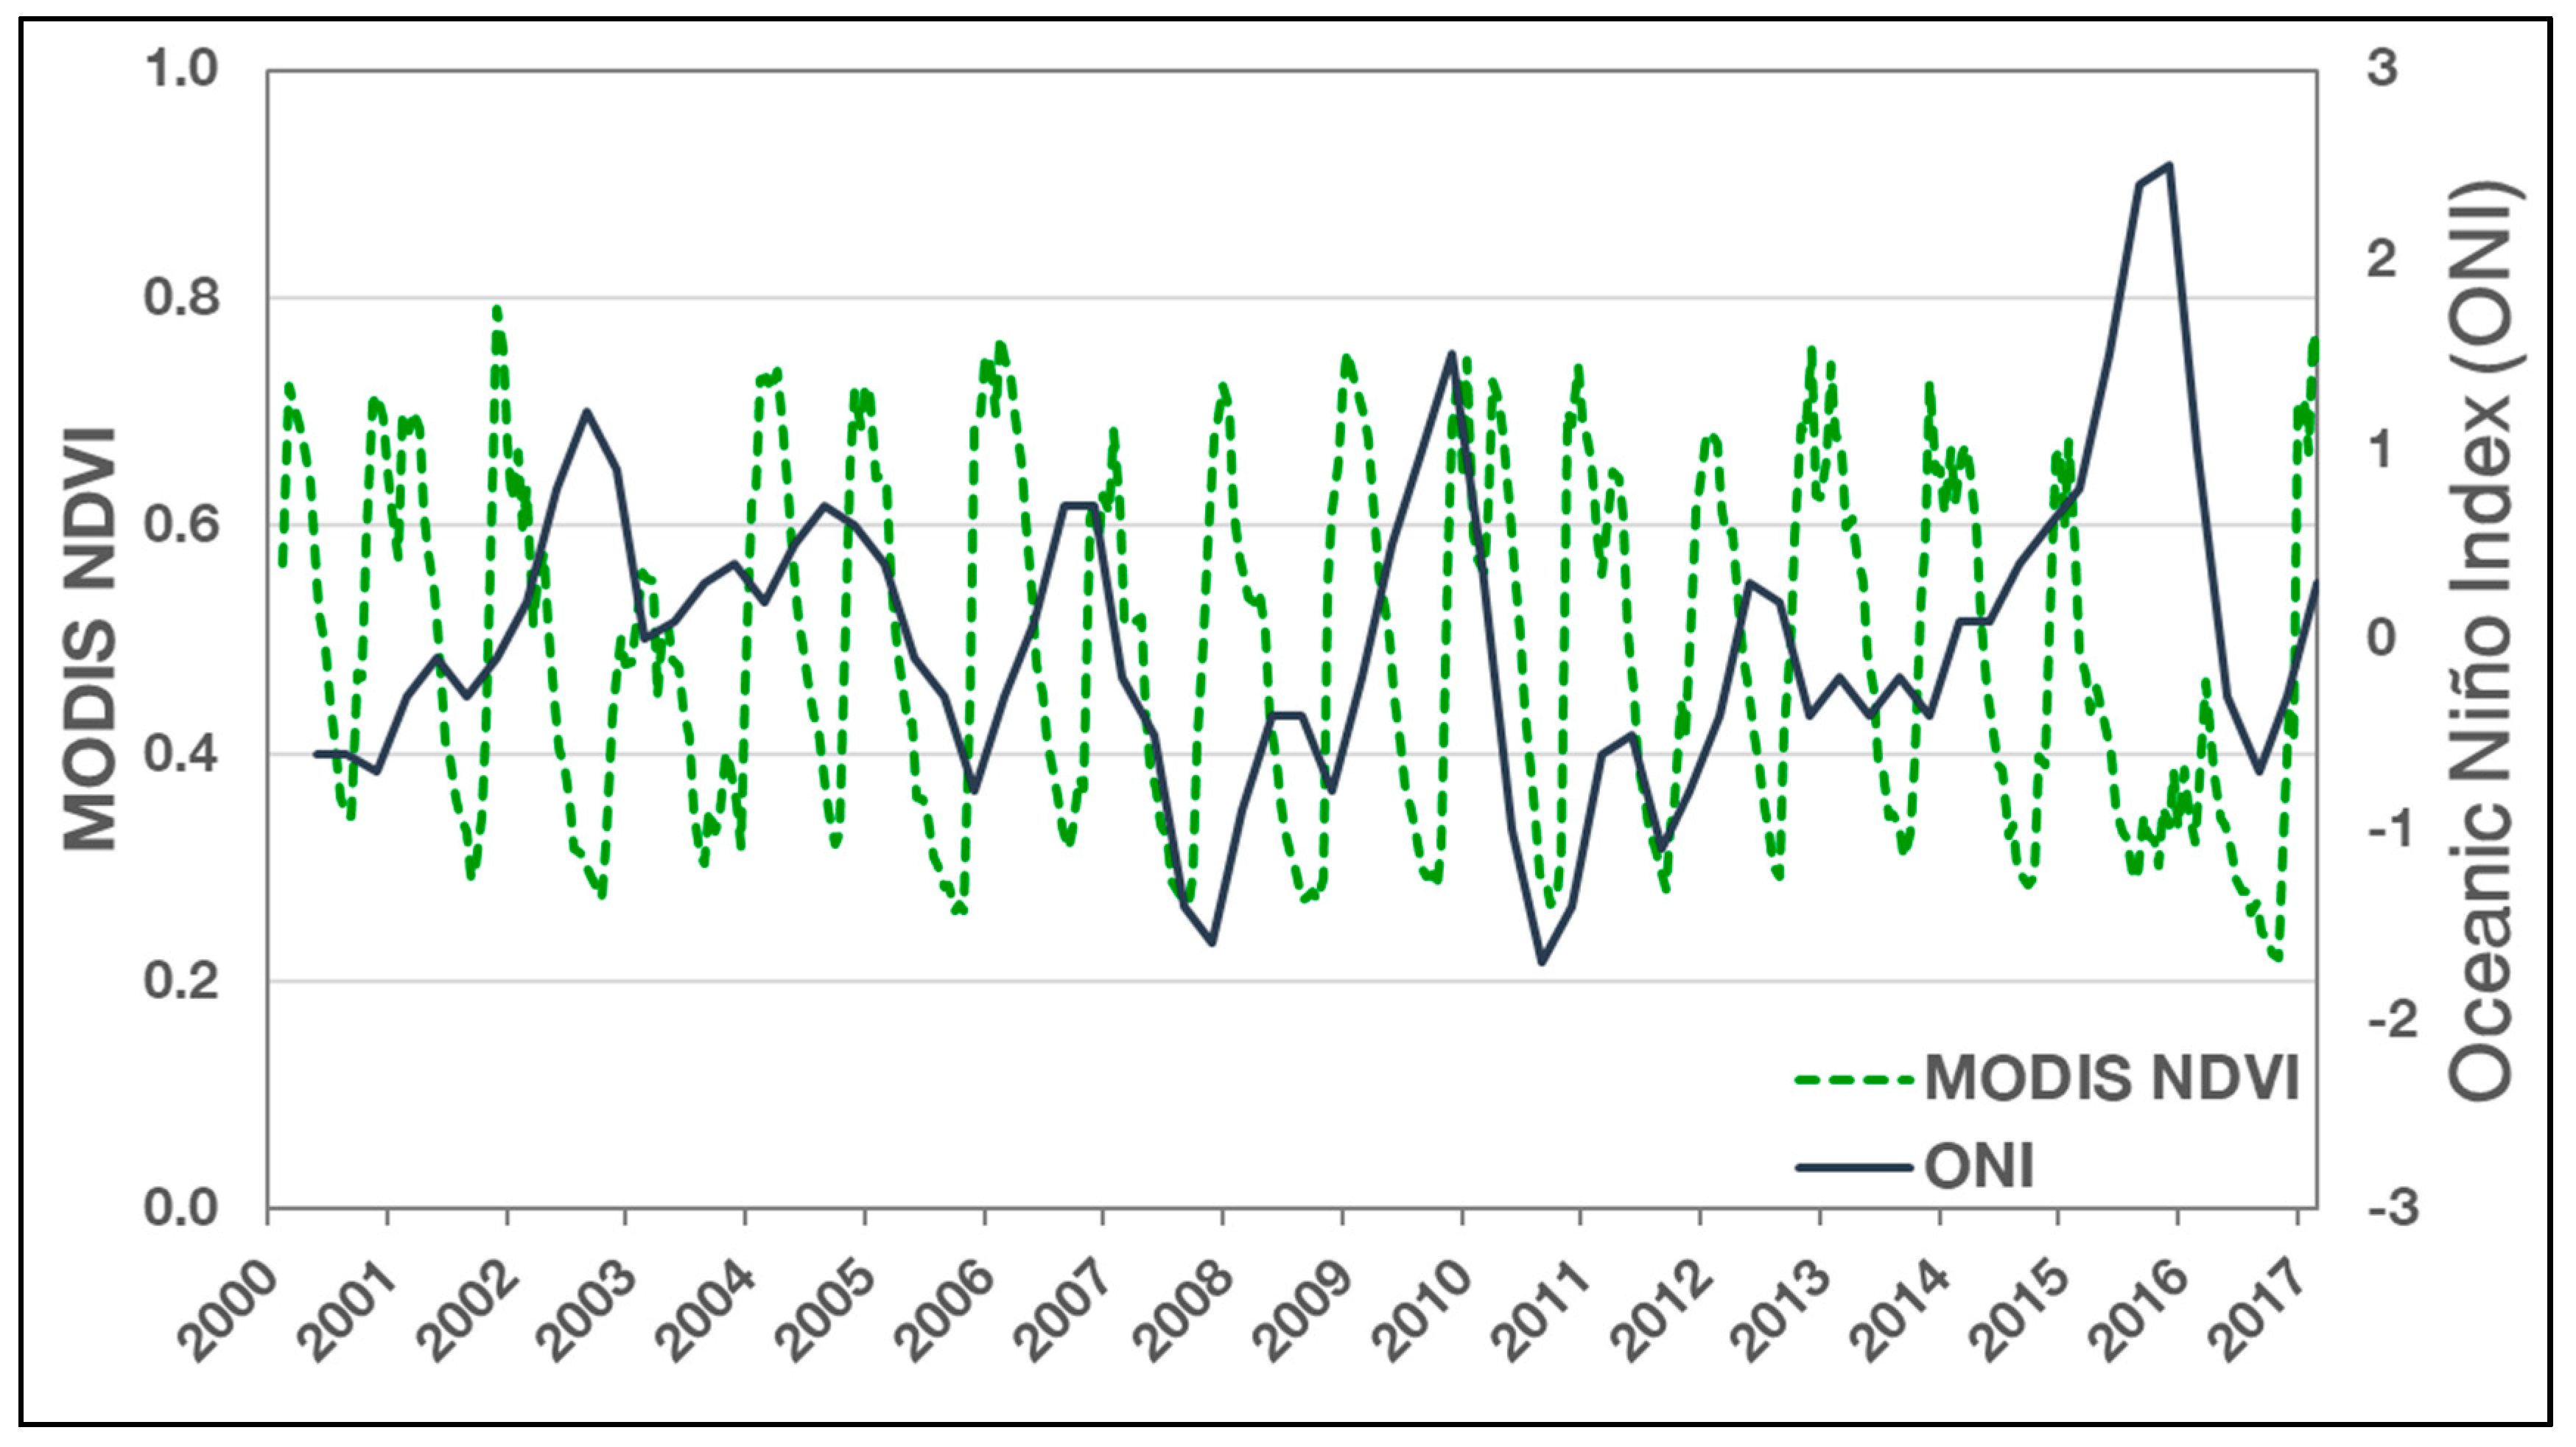
2. Study Area
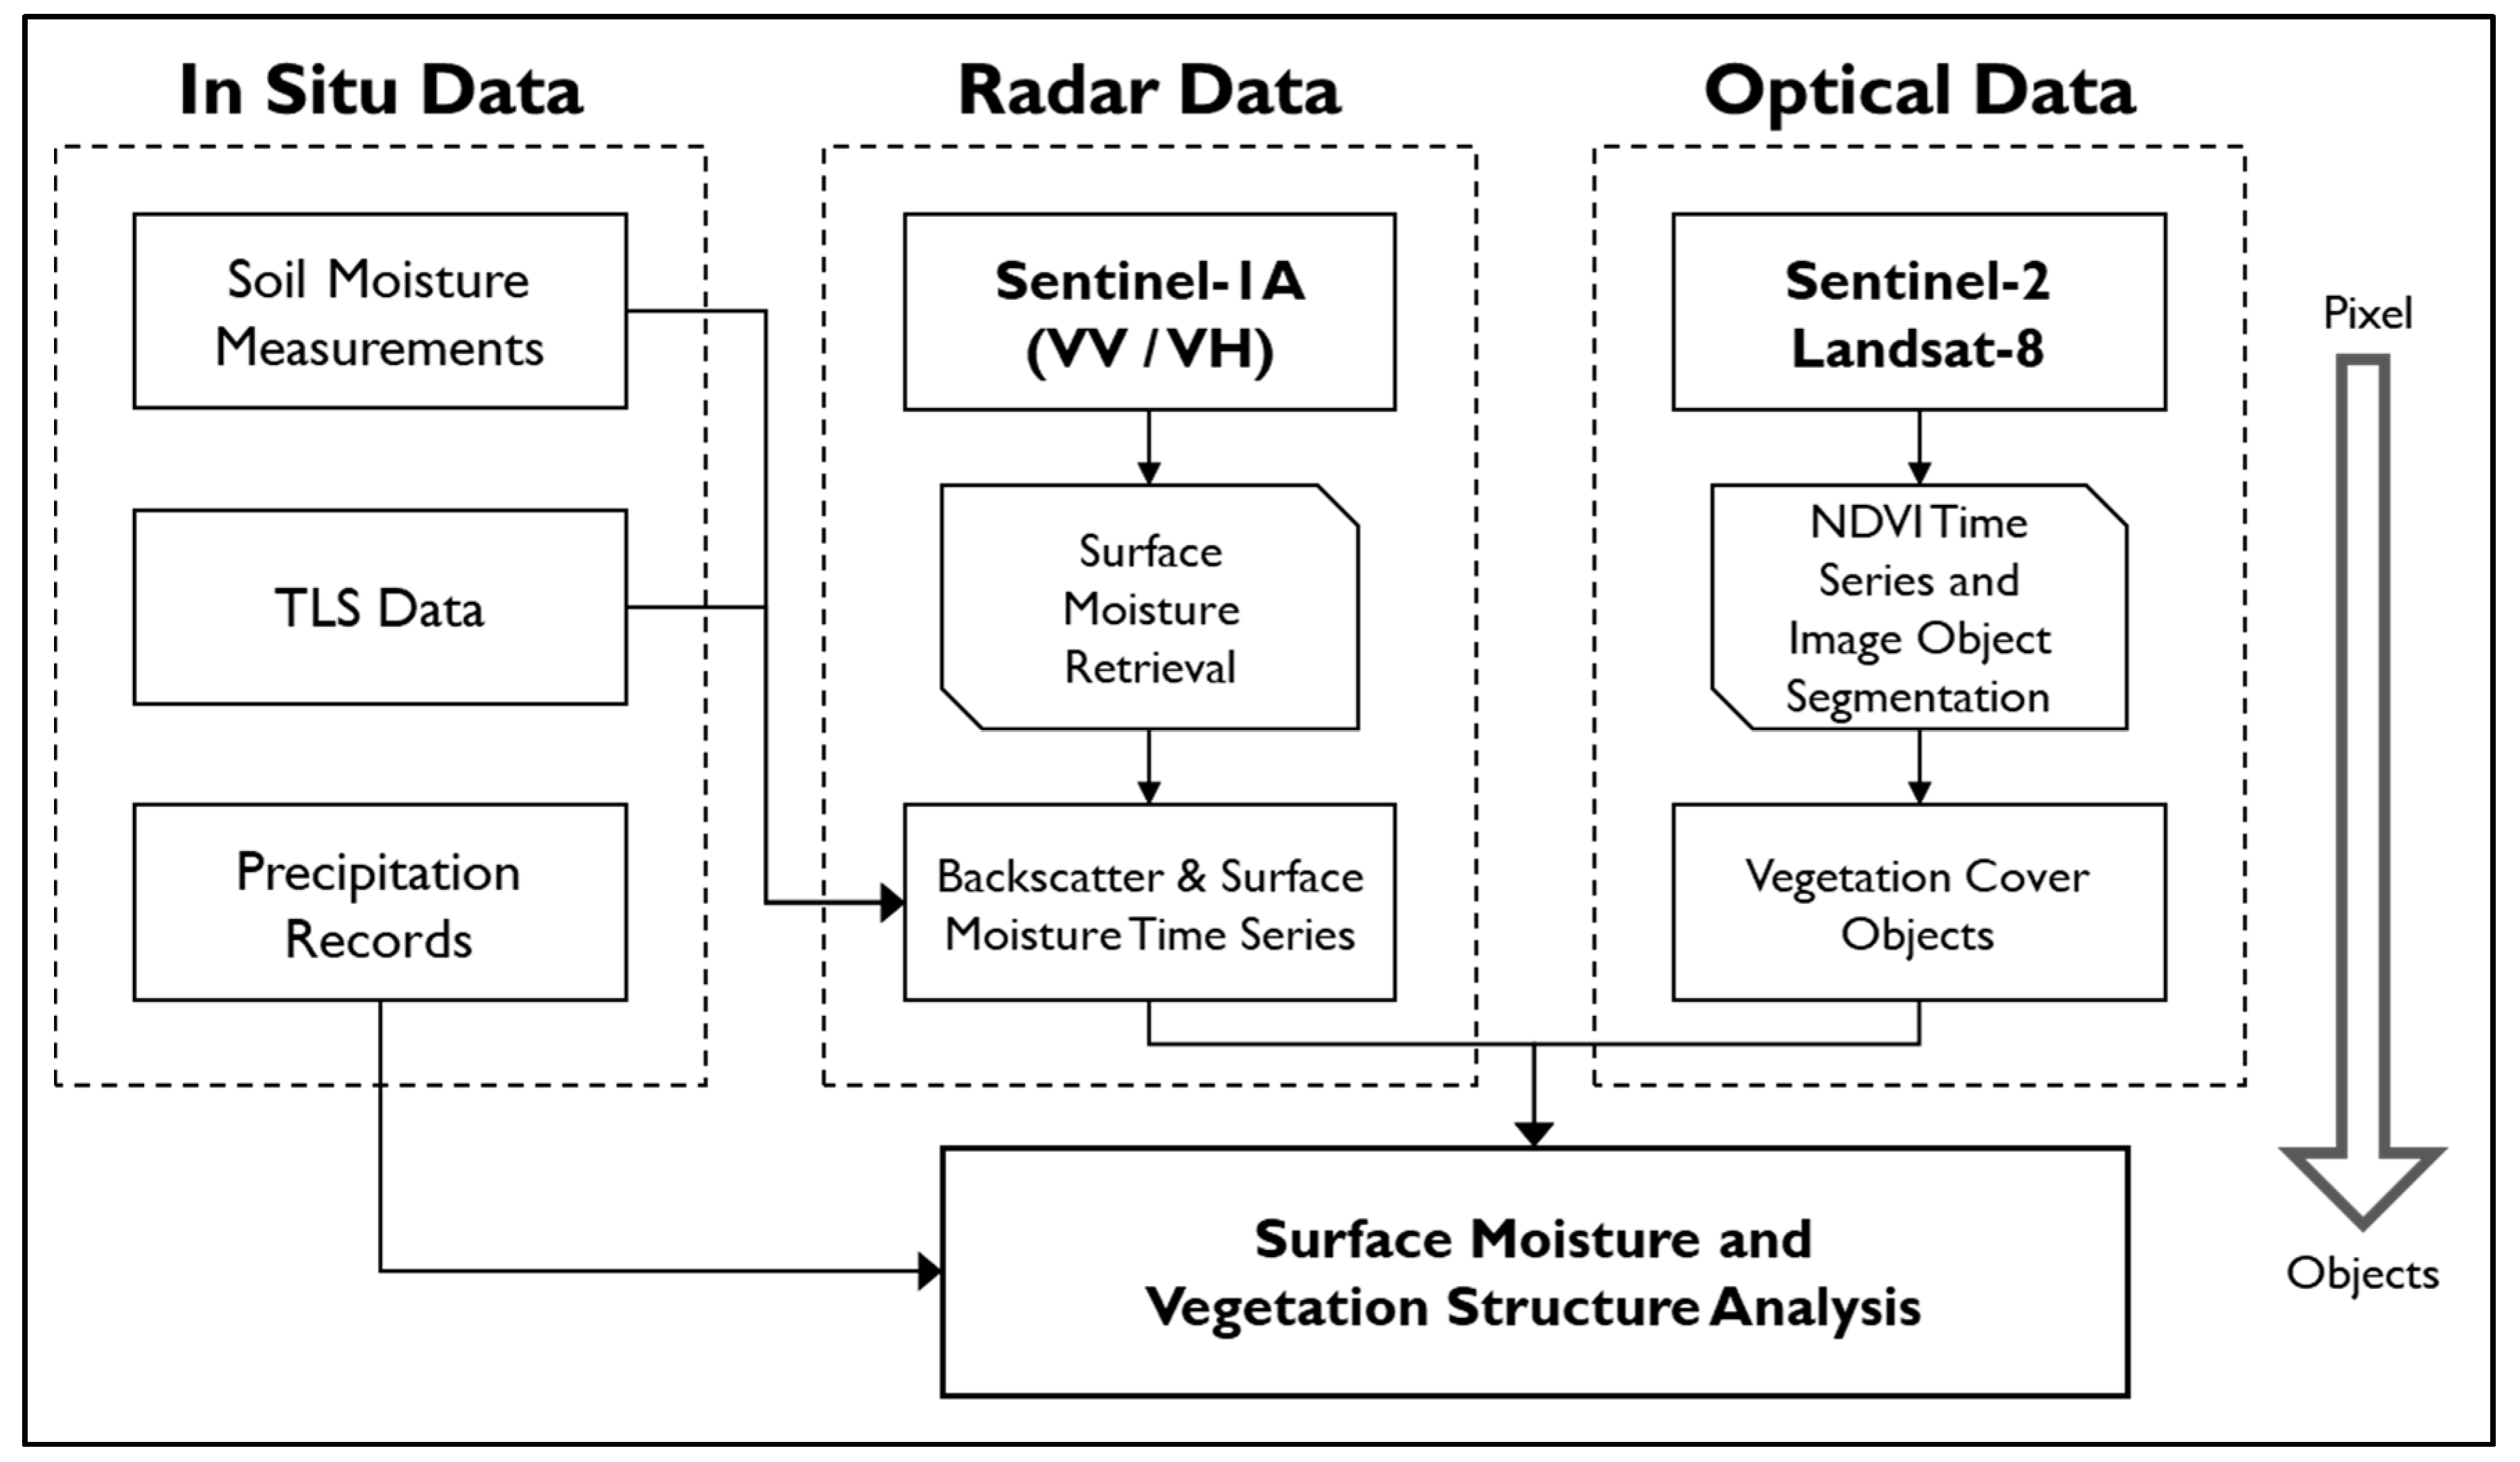
3. Materials and Methods
3.1. Materials
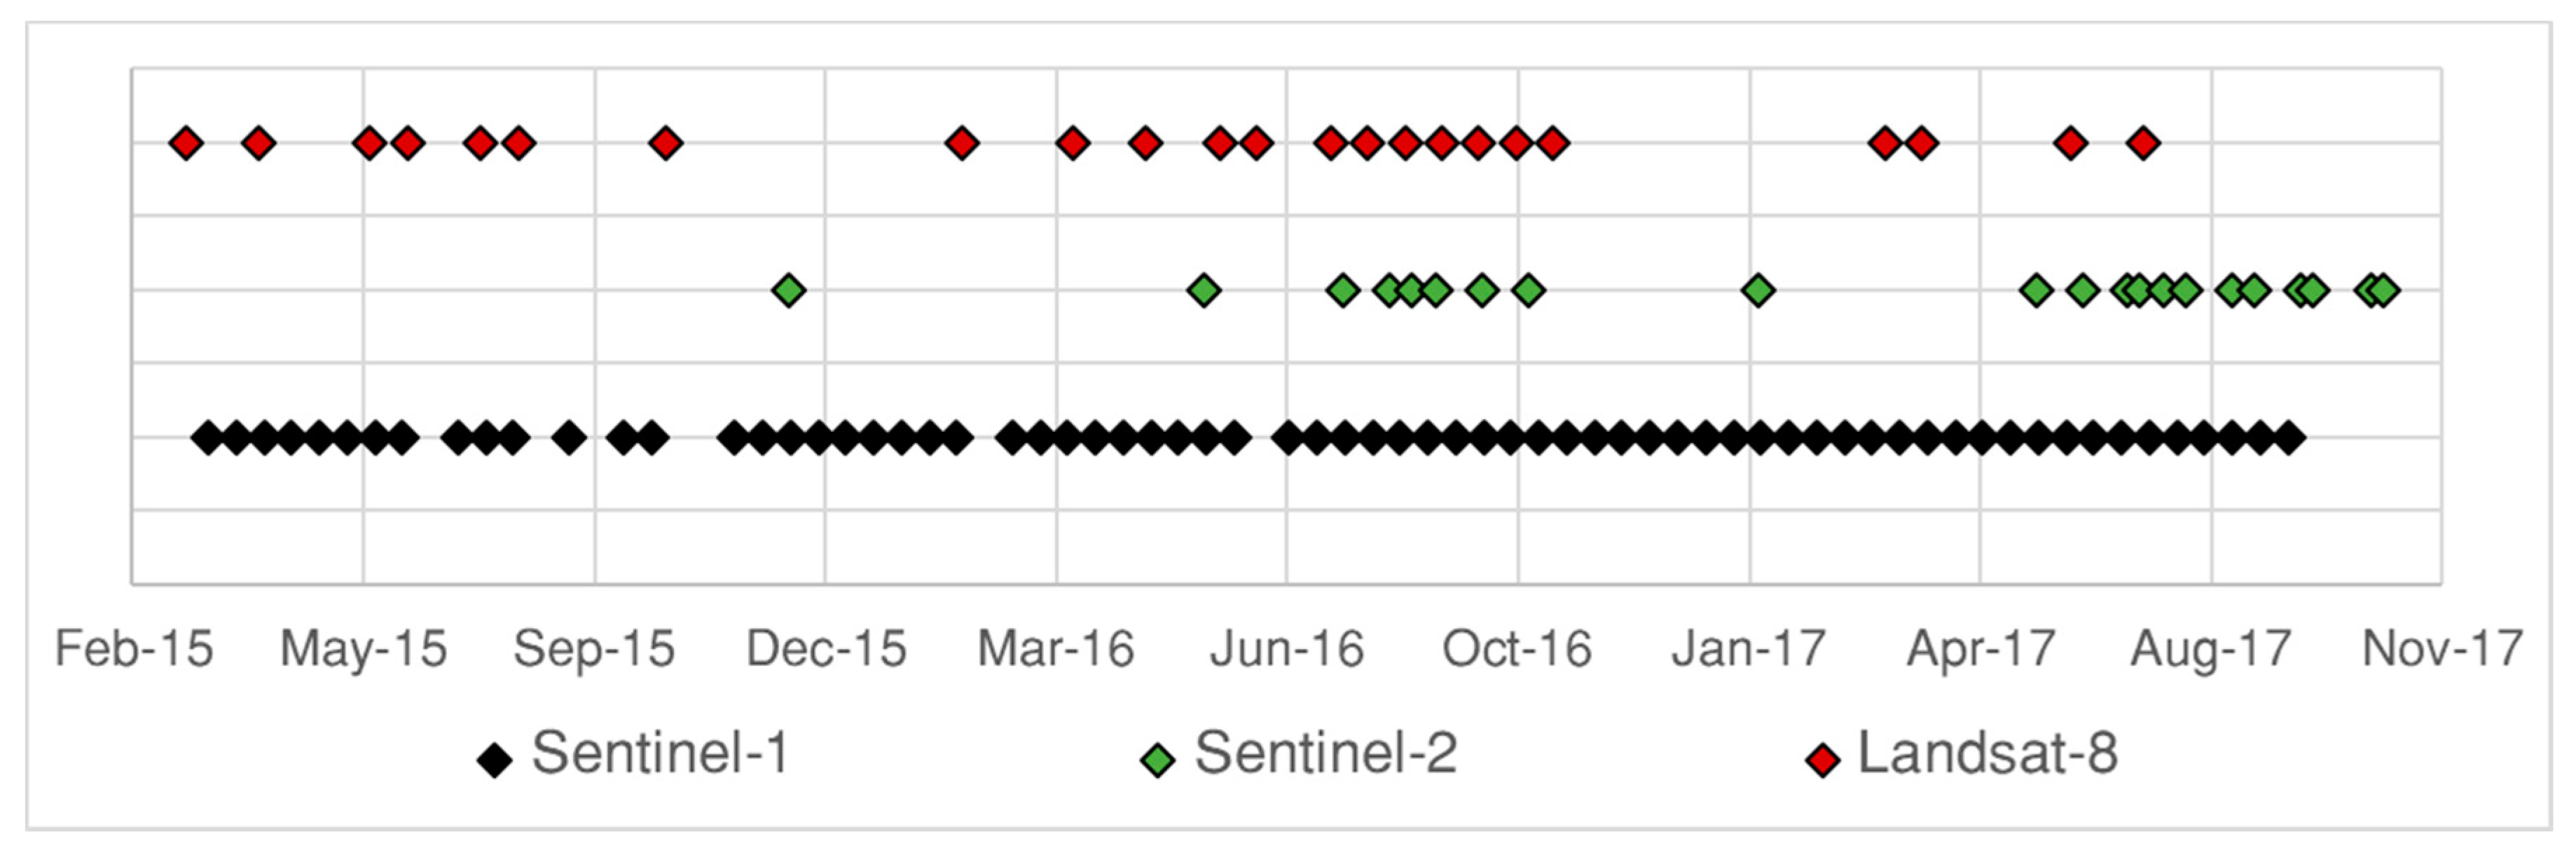
3.1.1. Sentinel-1 Data and Pre-Processing
3.1.2. Optical Earth Observation Data
Sentinel-2 Imagery
Landsat-8 Imagery
3.1.3. In Situ Data Sources
Precipitation Records
In Situ Soil Moisture Measurements
Terrestrial Laser Scanner Data
3.2. Methods
3.2.1. Surface Moisture Retrieval using Sentinel-1 Time Series
3.2.2. Differentiation of Vegetation Cover Classes
4. Results
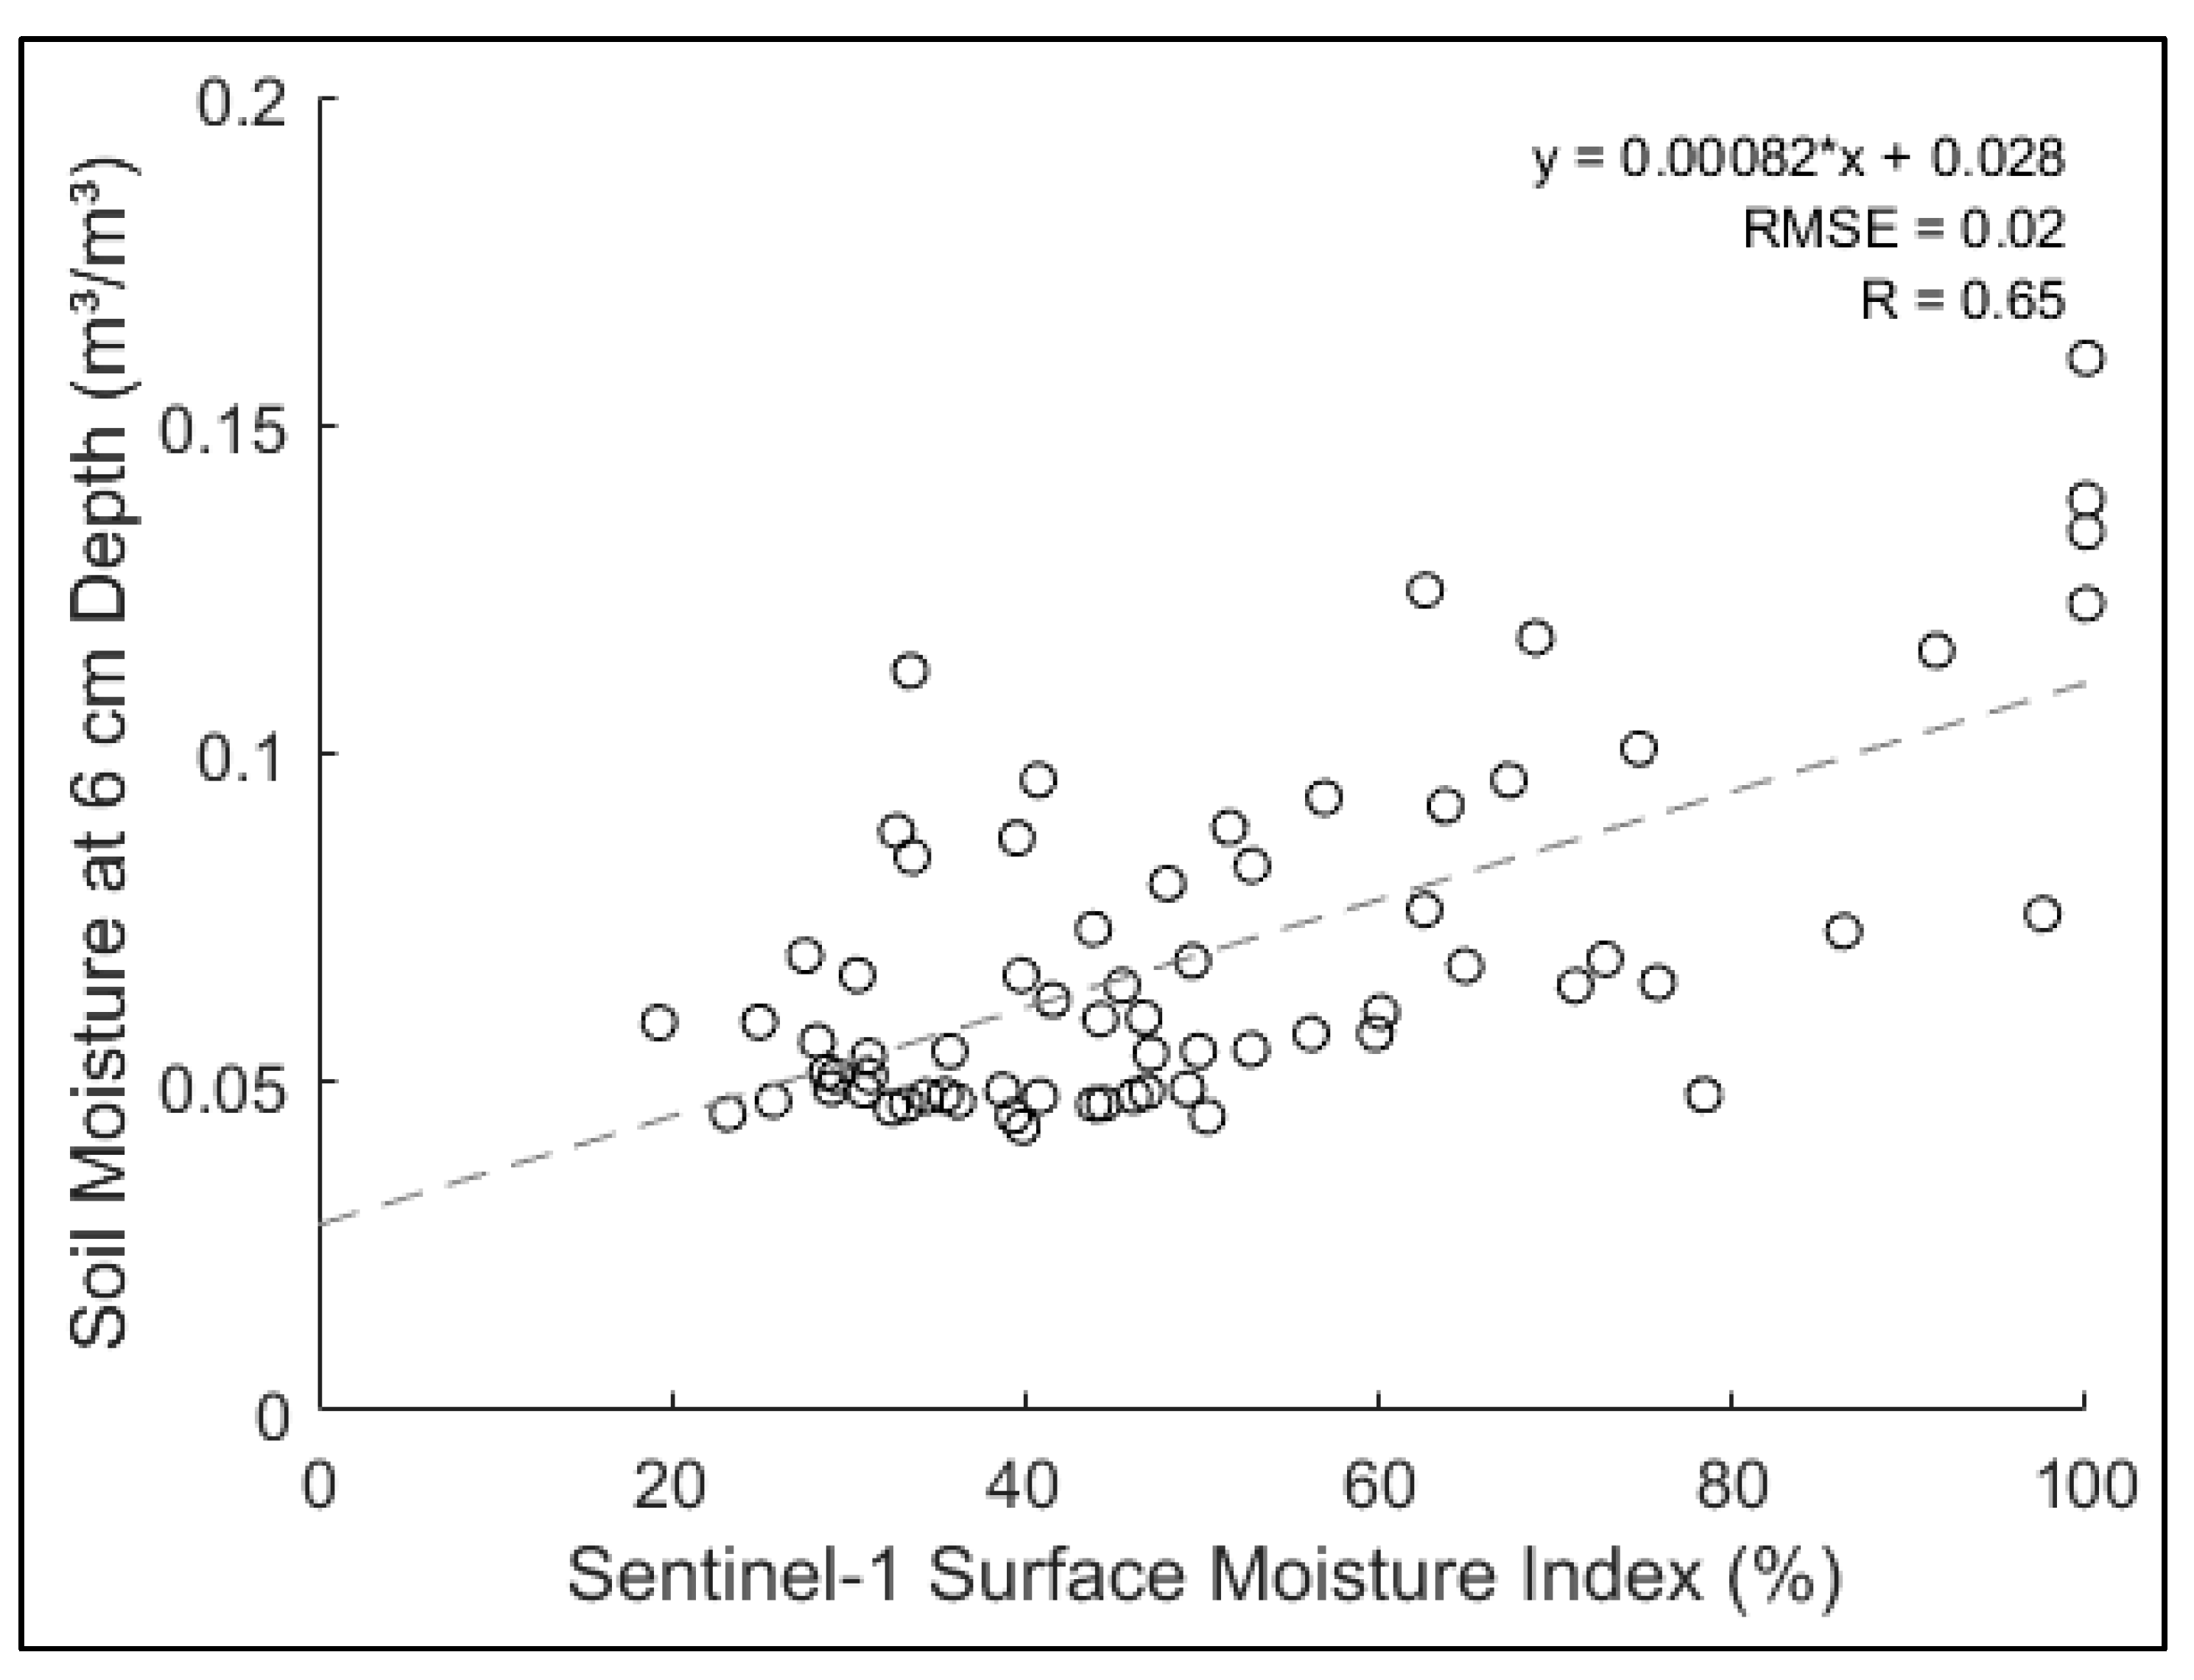
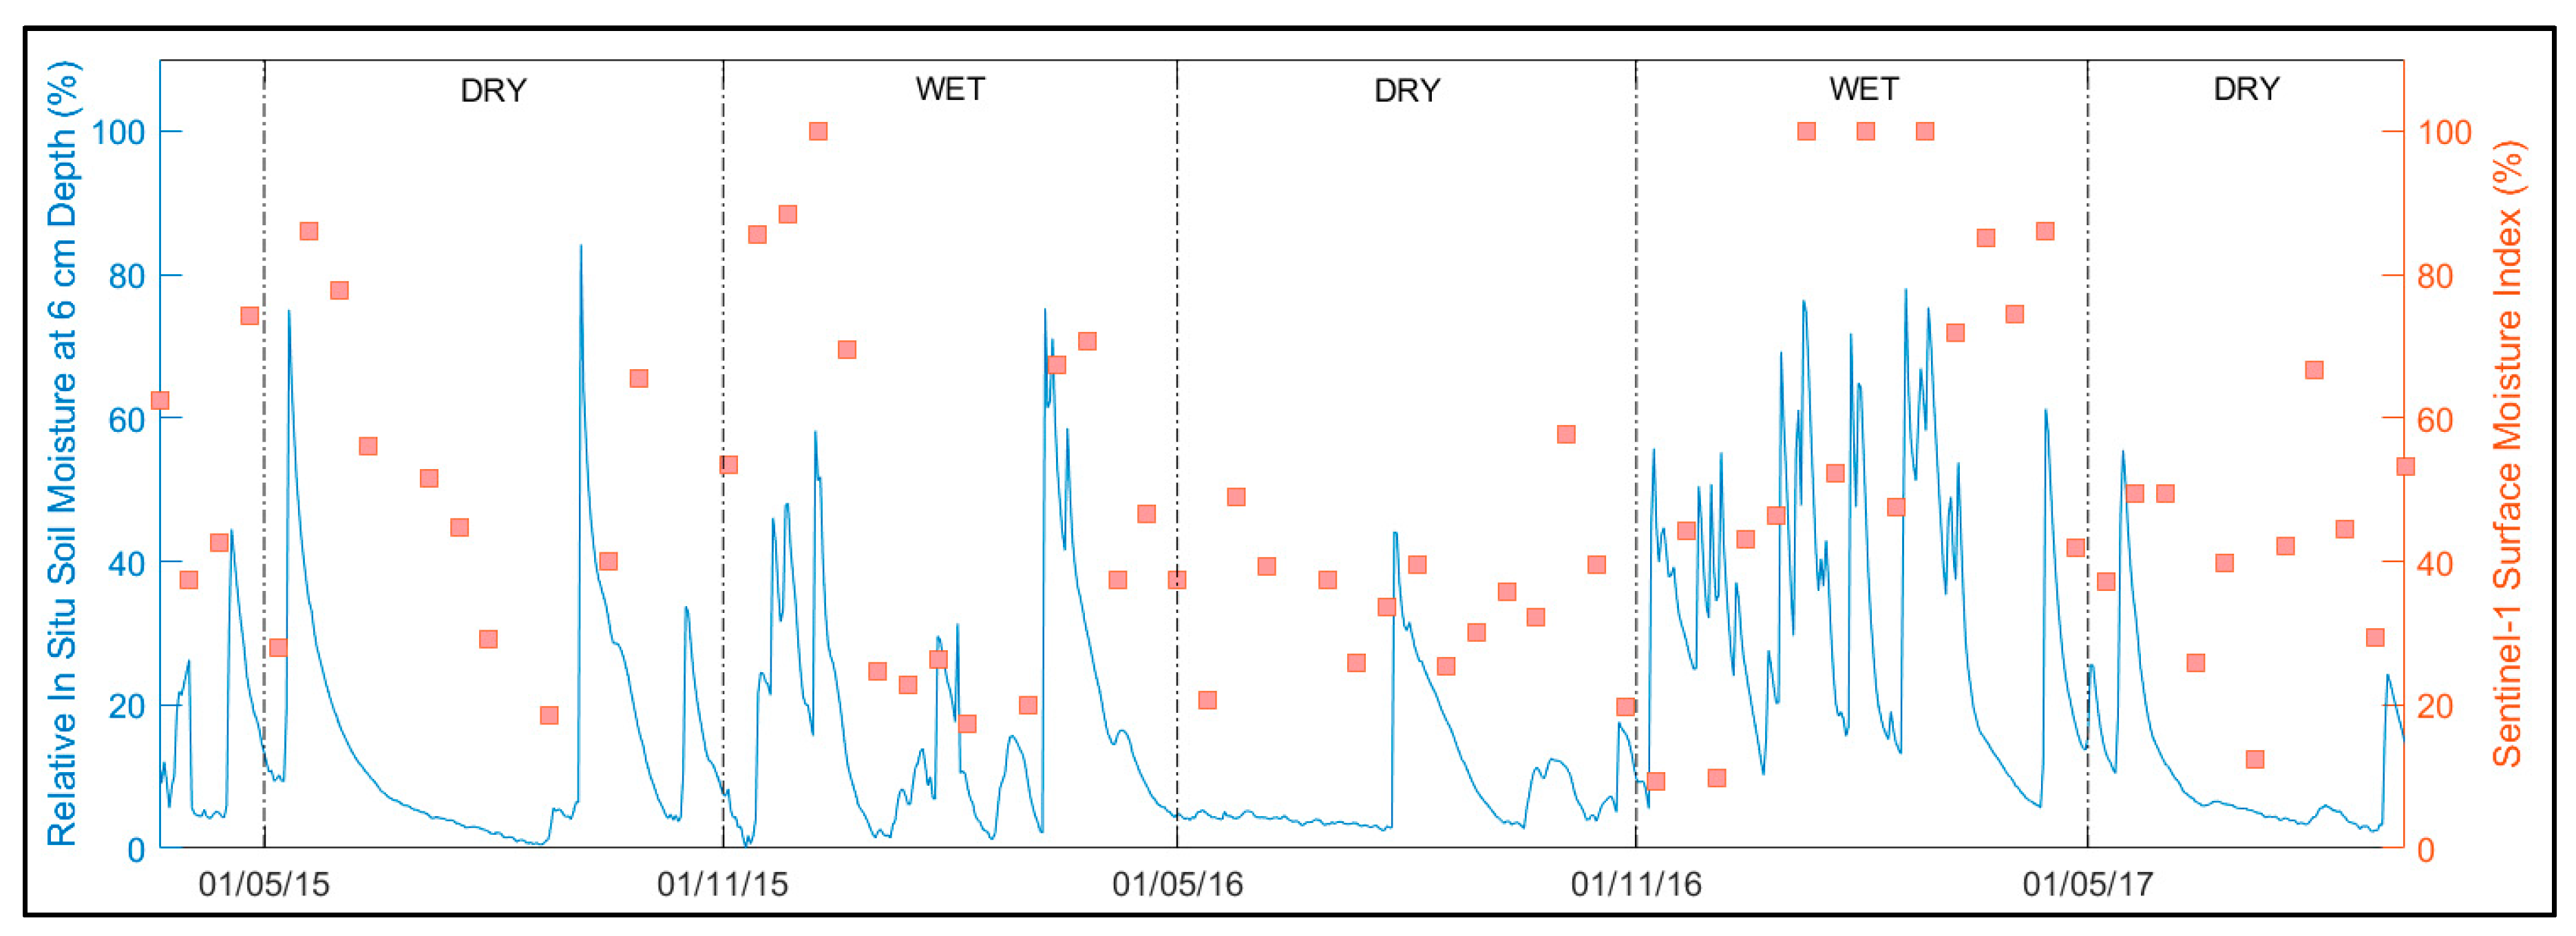
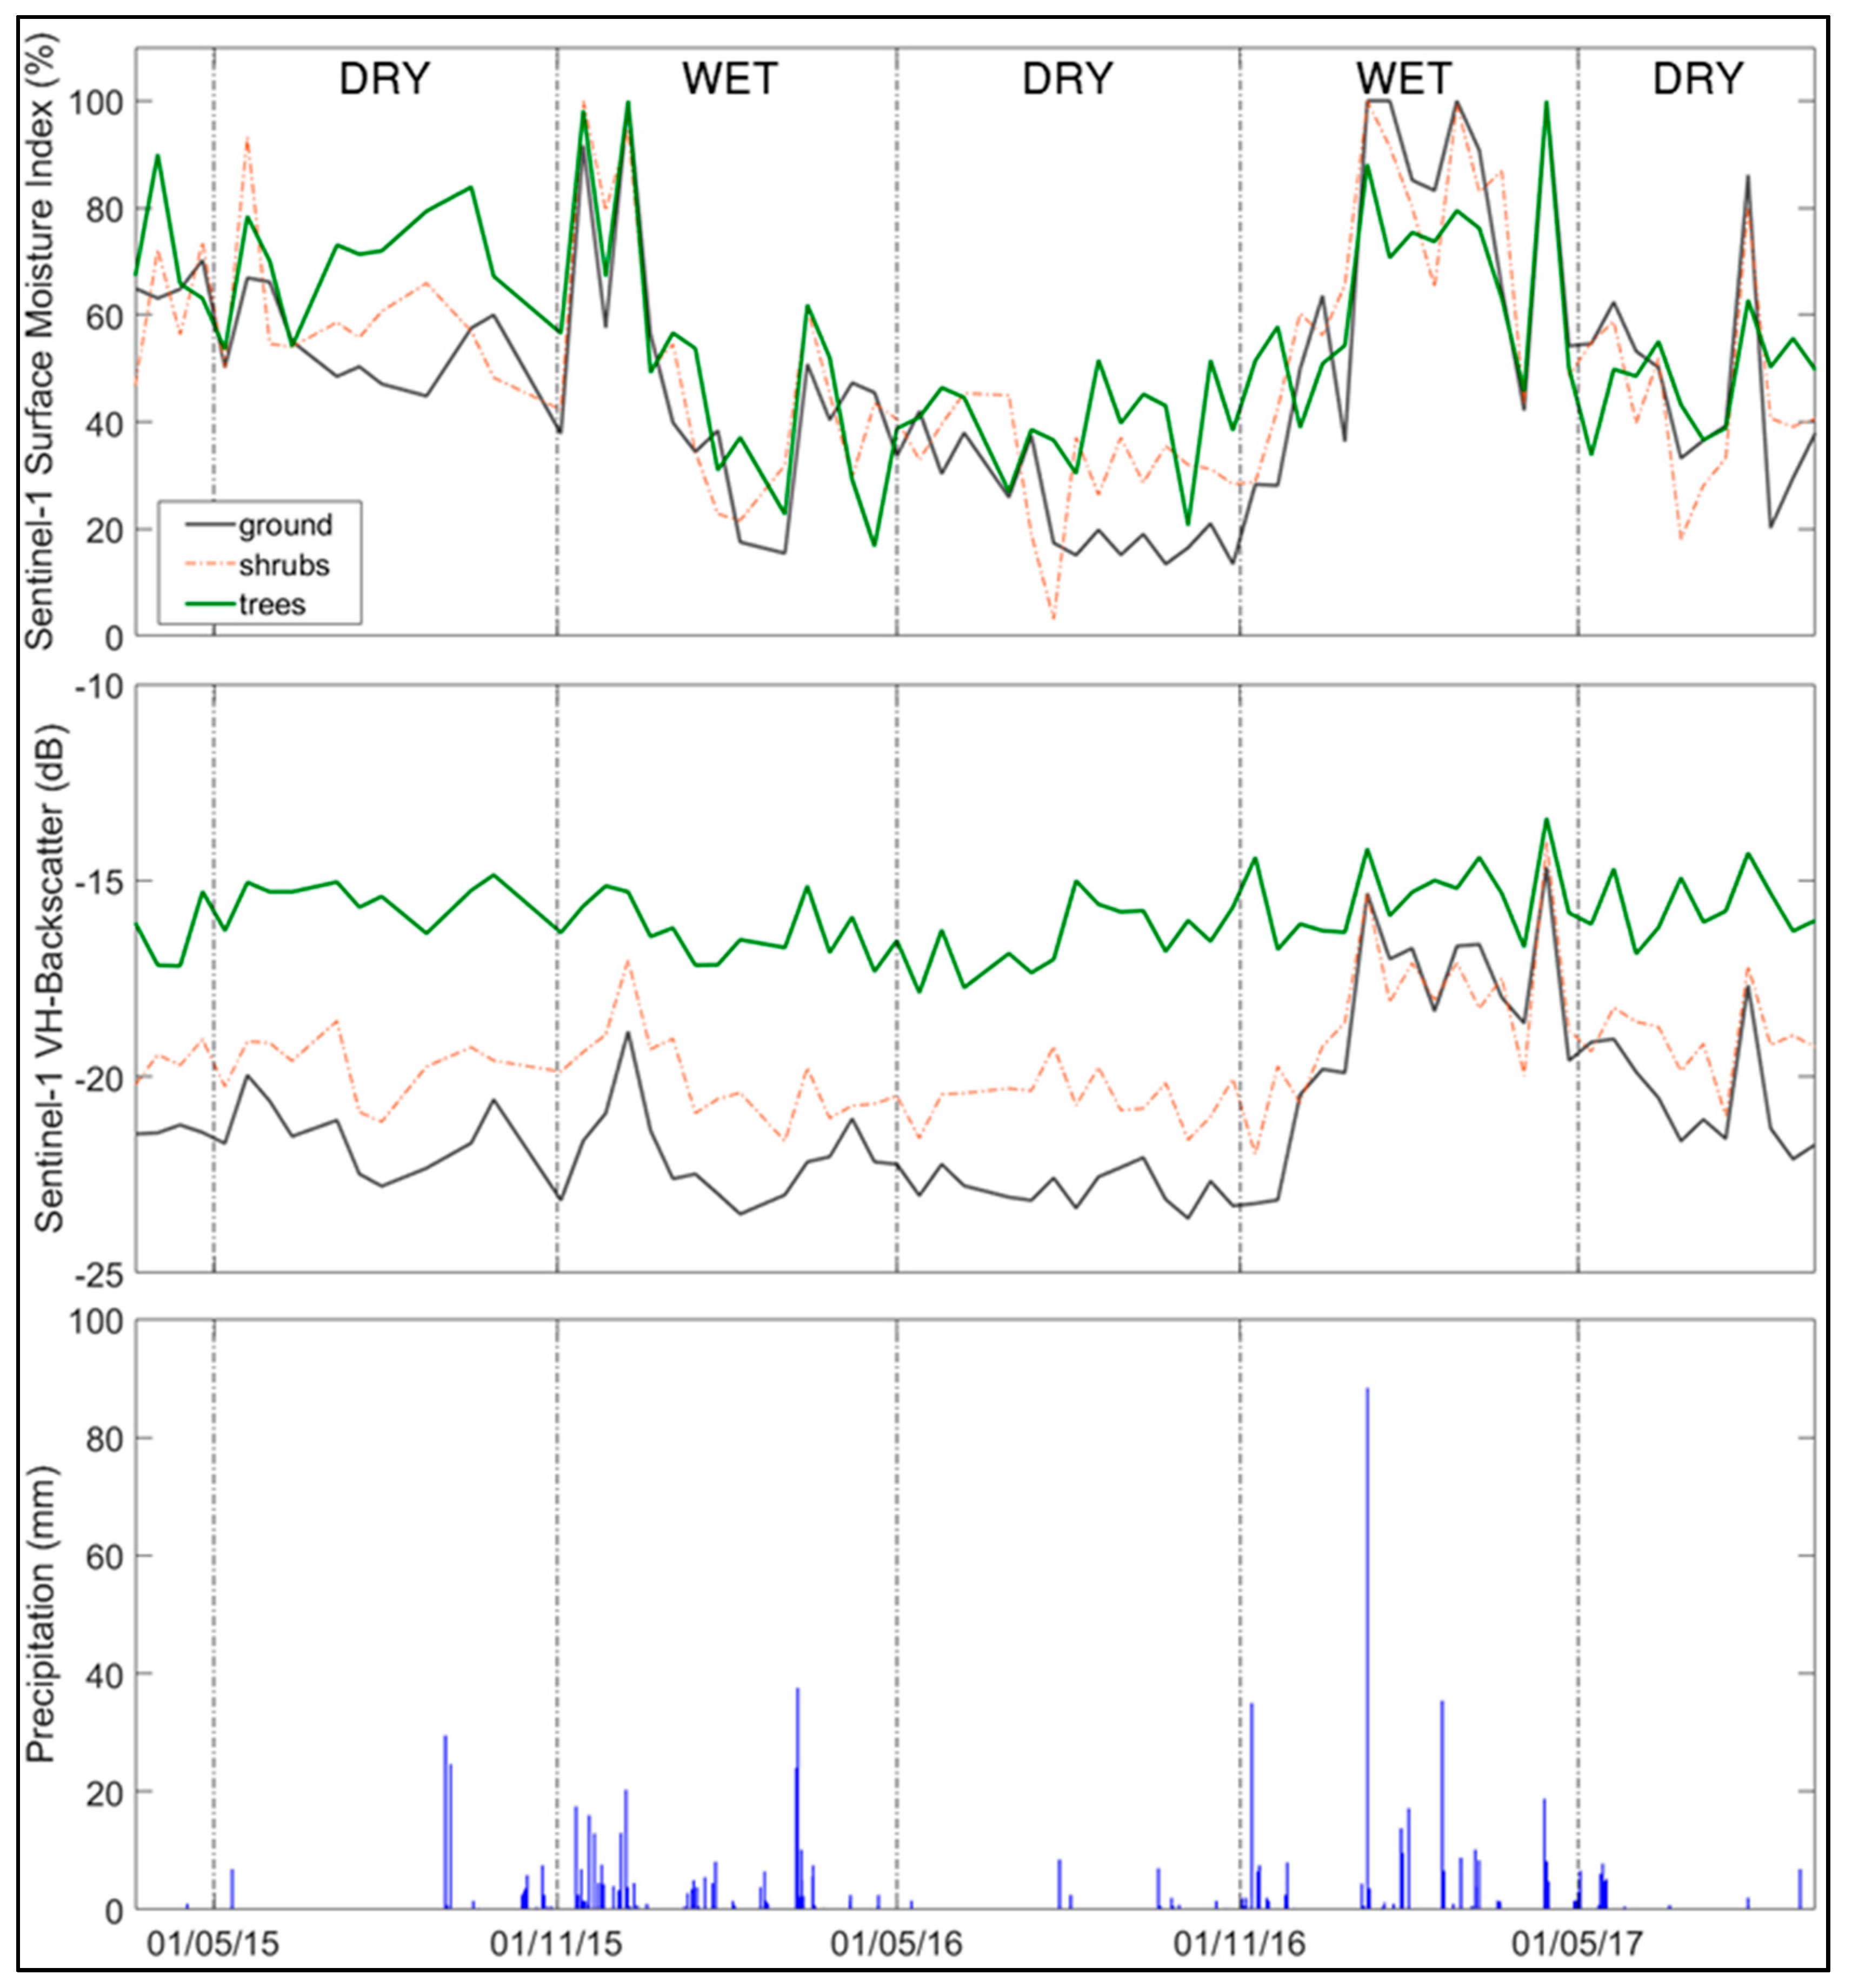
4.1. Comparing Sentinel-1-Derived Surface Moisture Information to In Situ Soil Moisture Information
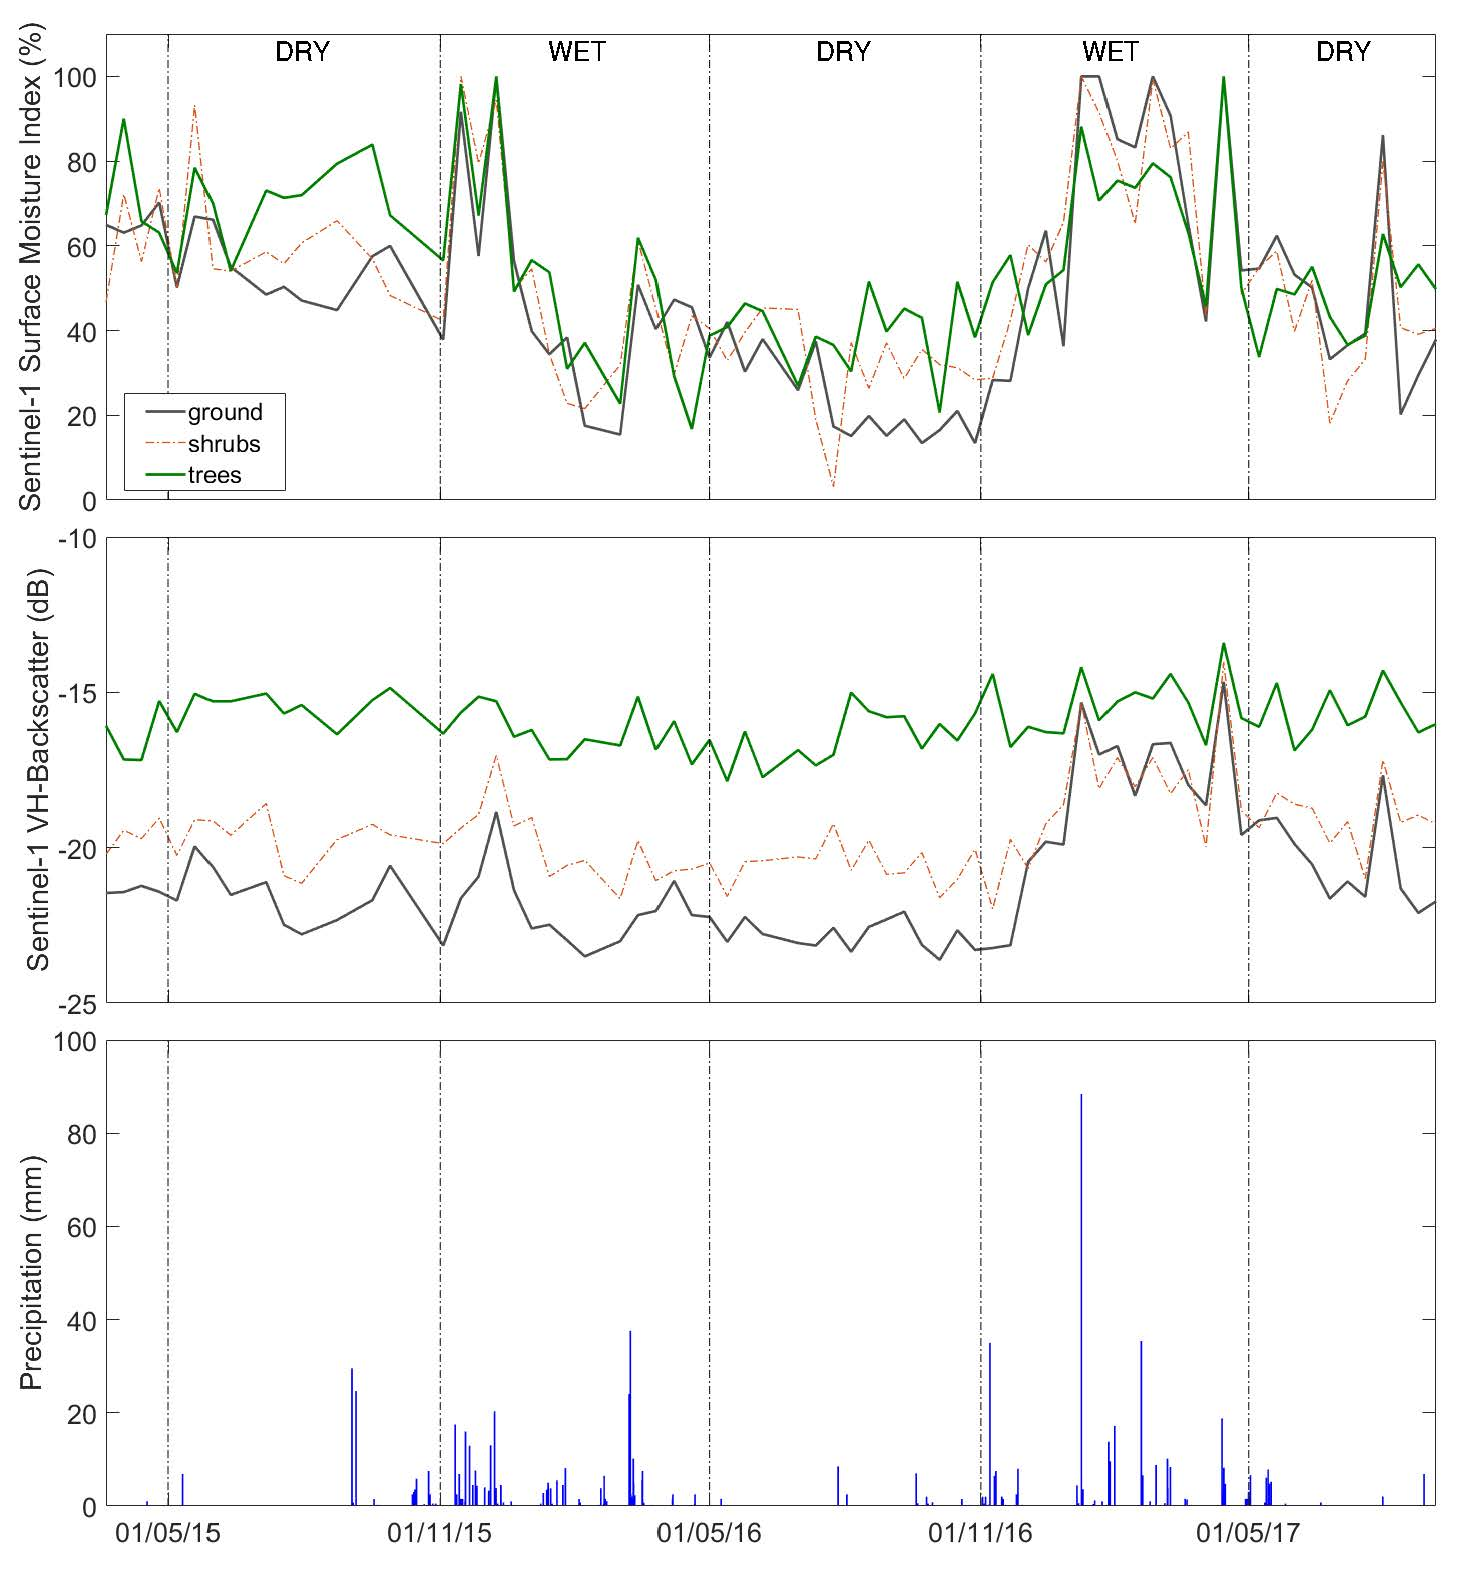
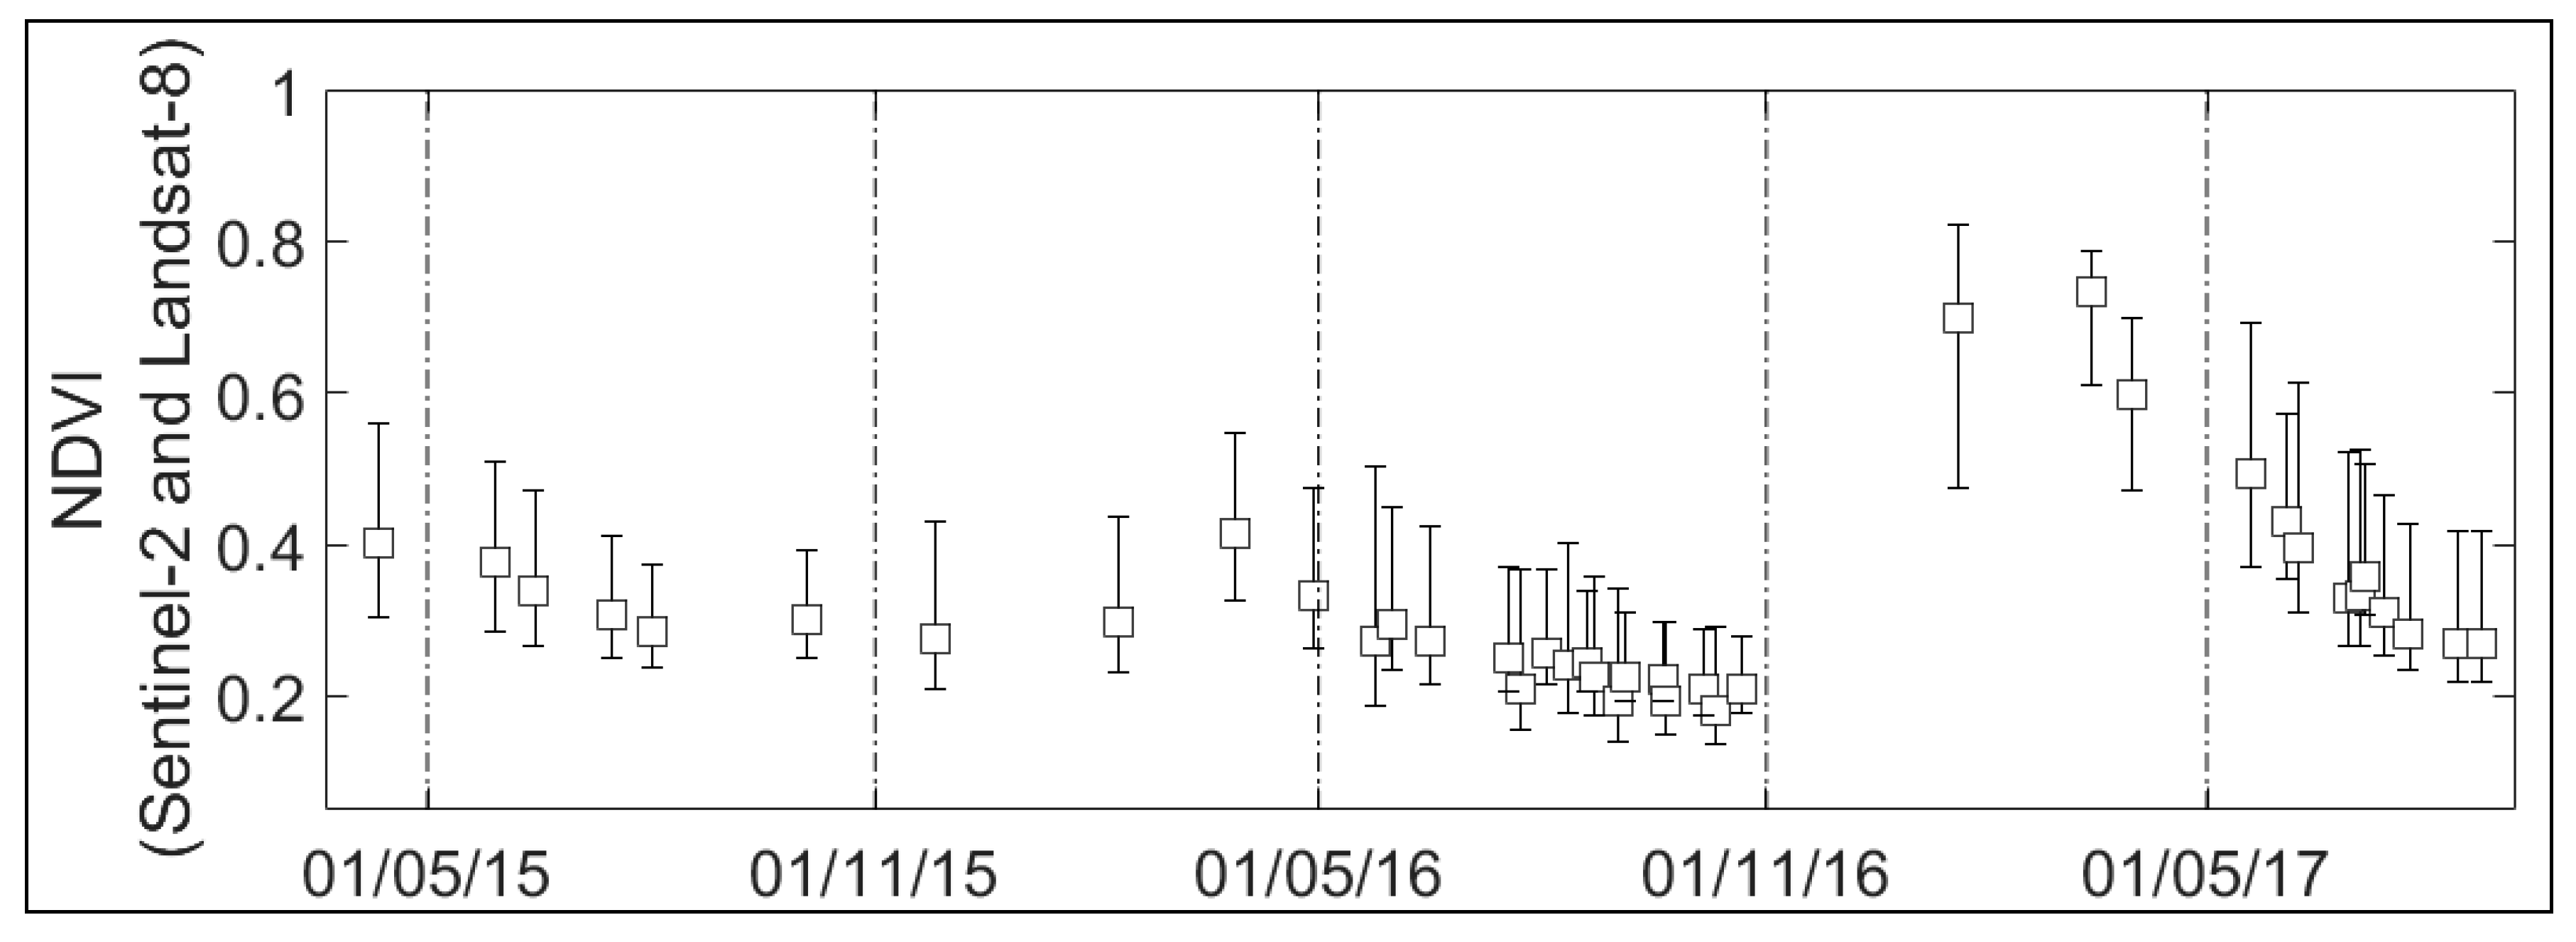
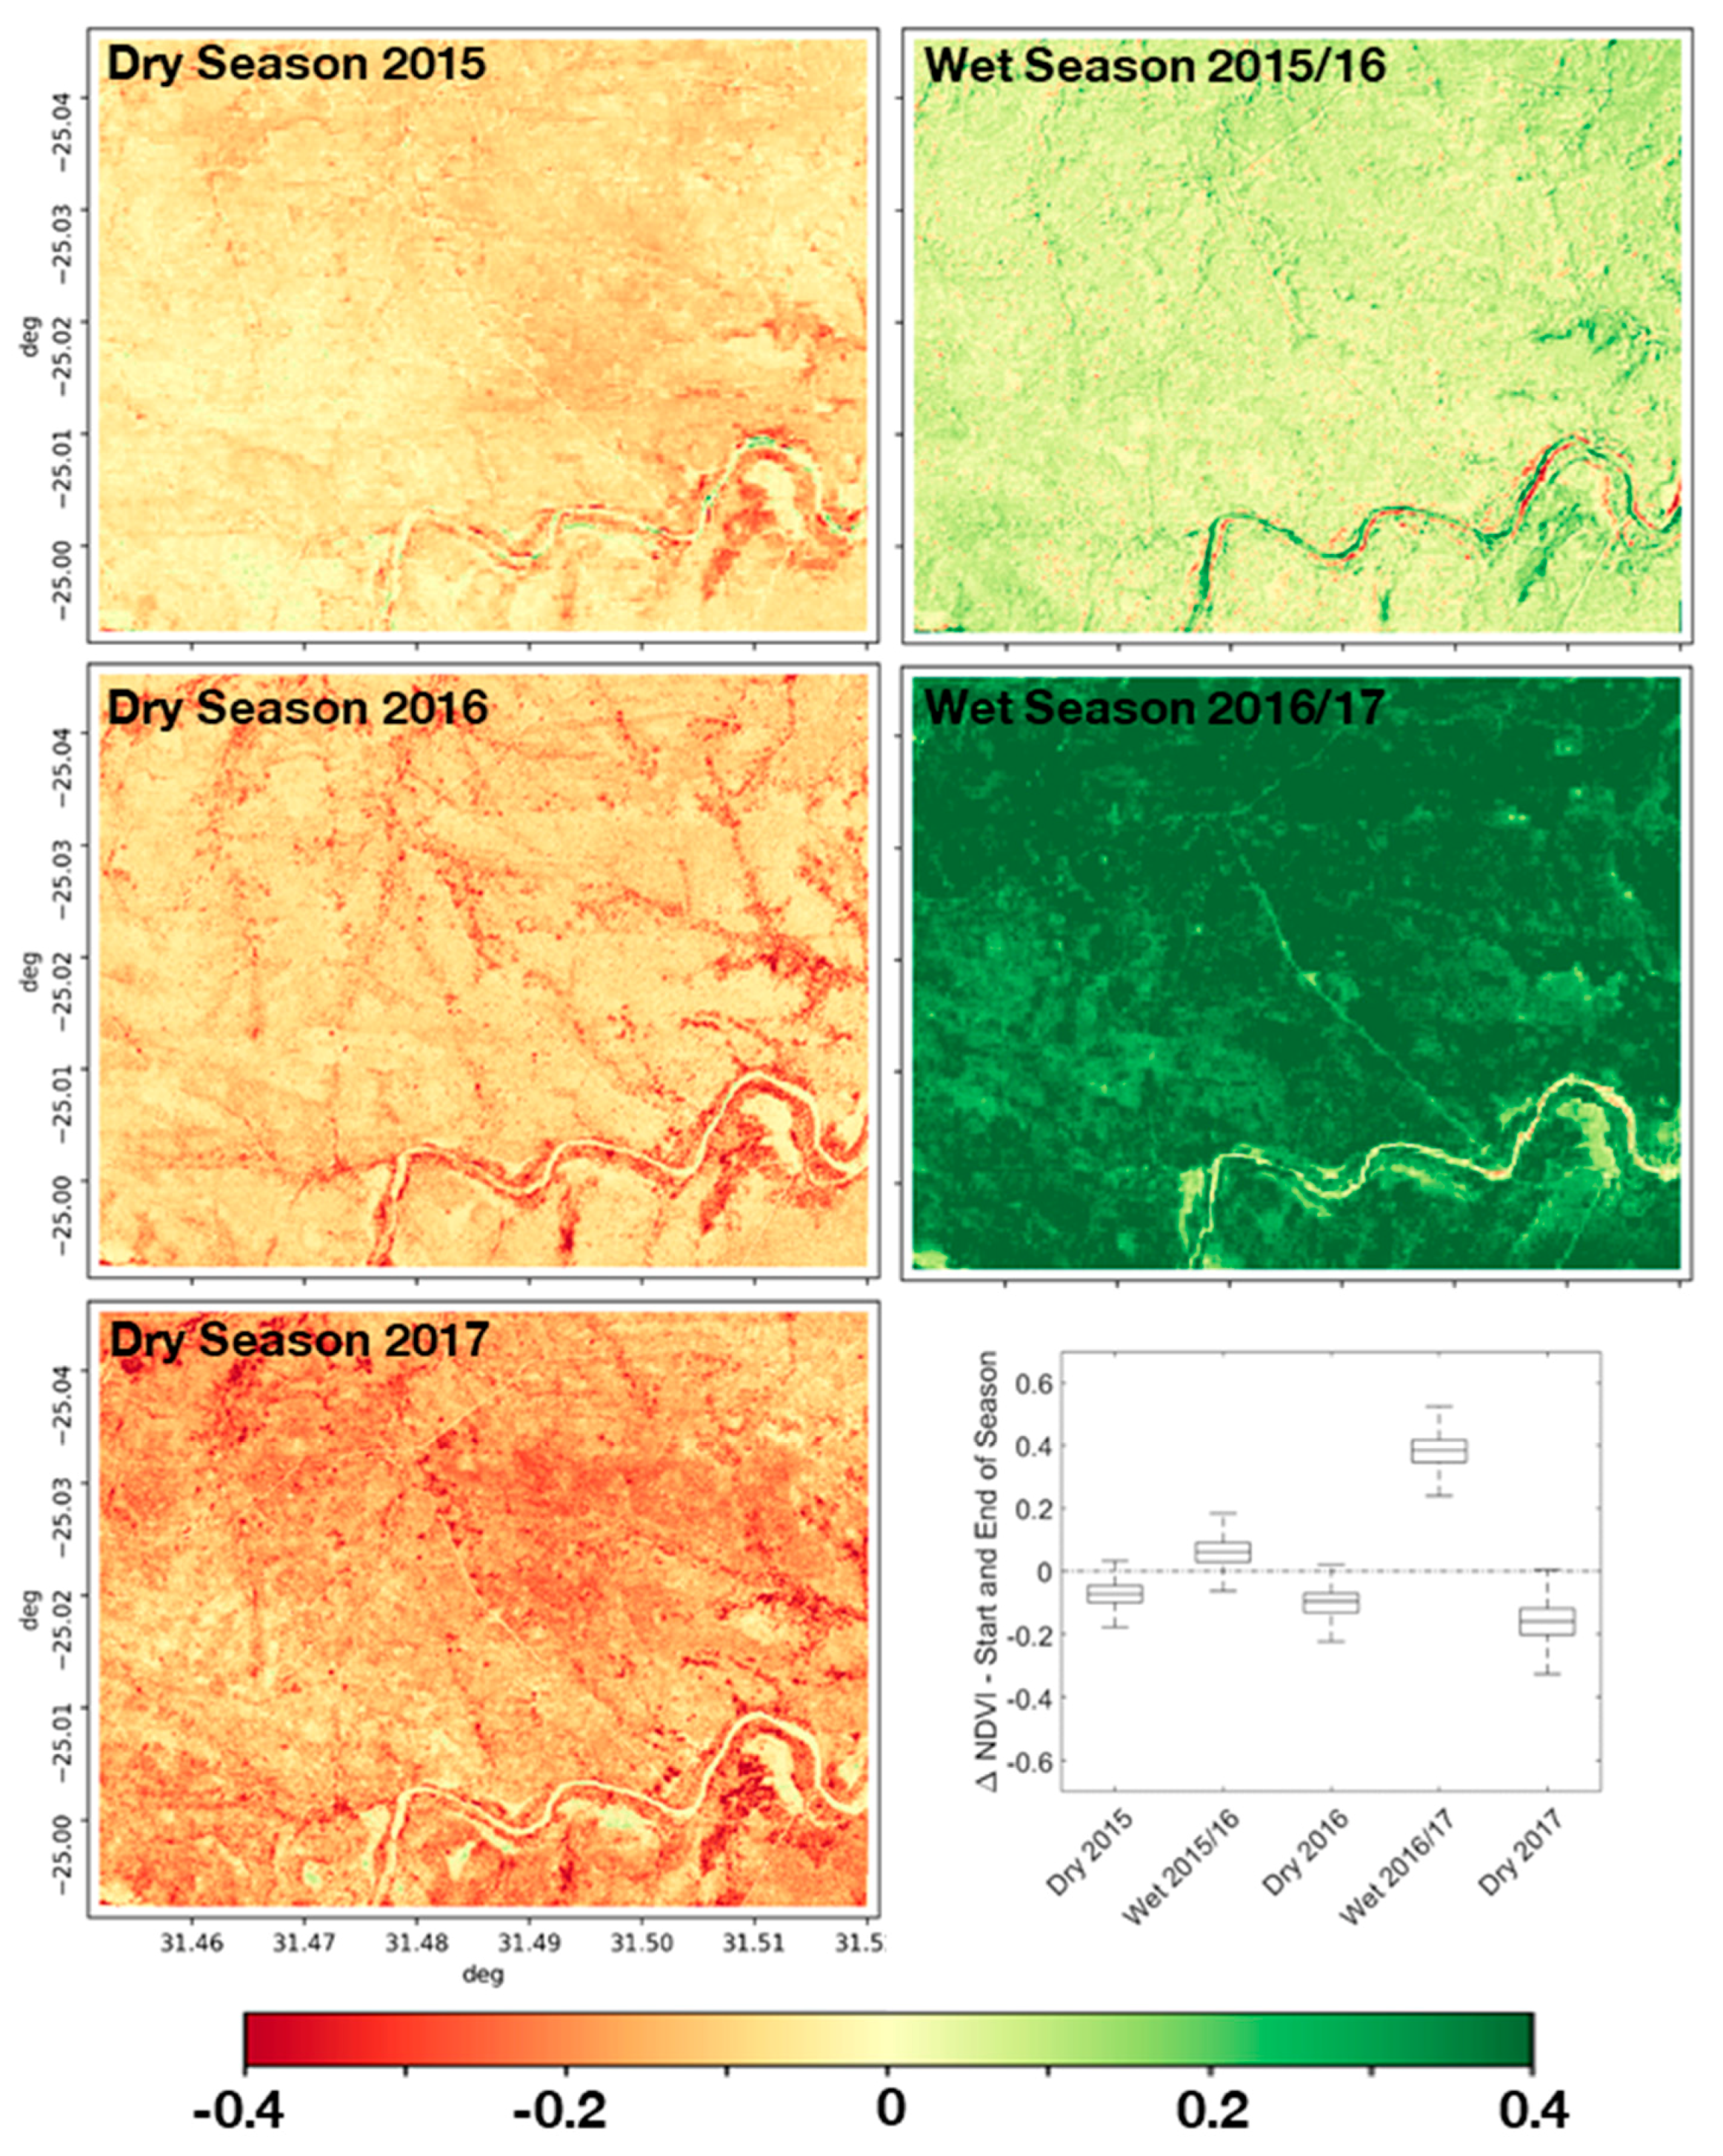
4.2. Drought Impacts on Vegetation Greenness
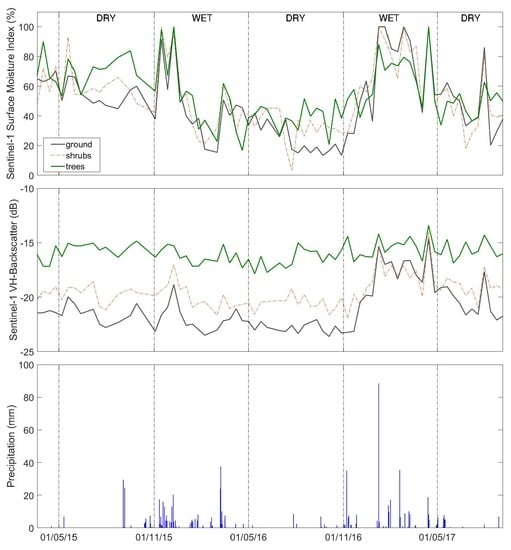
4.3. Drought Impacts to Surface Moisture Dependencies of Vegetation Cover
5. Discussion
6. Conclusions
Author Contributions
Funding
Conflicts of Interest
References
- RIASCO (Regional Interagency Standing Committee). Response Plan for the El Niño-Induced Drought in Southern Africa. 2016. Available online: https://reliefweb.int/report/world/riasco-action-plan-southern-africa-response-plan-el-ni-o-induced-drought-southern (accessed on 14 September 2018).
- Liberto, T. Di A Not so Rainy Season: Drought in Southern Africa in January 2016. Available online: https://www.climate.gov/news-features/event-tracker/not-so-rainy-season-drought-southern-africa-january-2016 (accessed on 25 April 2018).
- Singels, A.; Potgieter, A.B. A technique to evaluate ENSO-based maize production strategies. S. Afr. J. Plant Soil 1997, 14, 93–97. [Google Scholar] [CrossRef]
- Malherbe, J.; Dieppois, B.; Maluleke, P.; Van Staden, M.; Pillay, D.L. South African droughts and decadal variability. Nat. Hazards 2016, 80, 657–681. [Google Scholar] [CrossRef]
- Magrath, J. Entering Uncharted Waters: El Niño and the Threat to Food Security; Oxfam International: Oxfam, UK, 2015. [Google Scholar]
- Cane, M.A.; Eshel, G.; Buckland, R.W. Forecasting Zimbabwean maize yield using eastern equatorial Pacific sea surface temperature. Nature 1994, 370, 204–205. [Google Scholar] [CrossRef]
- Anyamba, A.; Tucker, C.J.; Mahoney, R. From El Niño to La Niña: Vegetation Response Patterns over East and Southern Africa during the 1997–2000 Period. J. Clim. 2002, 15, 3096–3103. [Google Scholar] [CrossRef]
- Trenberth, K.E.; Stepaniak, D.P. Indices of El Niño evolution. J. Clim. 2001, 14, 1697–1701. [Google Scholar] [CrossRef]
- Masih, I.; Maskey, S.; Mussá, F.E.F.; Trambauer, P. A review of droughts on the African continent: A geospatial and long-term perspective. Hydrol. Earth Syst. Sci. 2014, 18, 3635–3649. [Google Scholar] [CrossRef]
- Rouault, M.; Richard, Y. Intensity and spatial extension of drought in South Africa at different time scales. Water SA 2003, 29, 489–500. [Google Scholar] [CrossRef]
- Eberle, J.; Clausnitzer, S.; Hüttich, C.; Schmullius, C. Multi-Source Data Processing Middleware for Land Monitoring within a Web-Based Spatial Data Infrastructure for Siberia. ISPRS Int. J. Geo-Inf. 2013, 2, 553–576. [Google Scholar] [CrossRef]
- NOAA. NOAA’s Climate Prediction Center. Available online: http://origin.cpc.ncep.noaa.gov/products/analysis_monitoring/ensostuff/ONI_v5.php (accessed on 28 November 2017).
- Kutsch, W.; Hanan, N.; Scholes, B.; McHugh, I.; Kubheka, W.; Eckhardt, H.; Williams, C. Response of carbon fluxes to water relations in a savanna ecosystem in South Africa. Biogeosciences 2008, 5, 1797–1808. [Google Scholar] [CrossRef]
- Main, R.; Mathieu, R.; Kleynhans, W.; Wessels, K.; Naidoo, L.; Asner, G.P. Hyper-temporal C-band SAR for baseline woody structural assessments in deciduous savannas. Remote Sens. 2016, 8, 661. [Google Scholar] [CrossRef]
- Scholes, R.J.; Archer, S.R. Tree-Grass Interactions in Savannas. Annu. Rev. Ecol. Syst. 1997, 28, 517–544. [Google Scholar] [CrossRef]
- Druce, D.J.; Shannon, G.; Page, B.R.; Grant, R.; Slotow, R. Ecological thresholds in the Savanna landscape: Developing a protocol for monitoring the change in composition and utilisation of large trees. PLoS ONE 2008, 3, e3979. [Google Scholar] [CrossRef] [PubMed]
- Hill, M.J. Vegetation index suites as indicators of vegetation state in grassland and savanna: An analysis with simulated SENTINEL 2 data for a North American transect. Remote Sens. Environ. 2013, 137, 94–111. [Google Scholar] [CrossRef]
- Archibald, S.; Scholes, R.J. Leaf green-up in a semi-arid African savanna - separating tree and grass responses to environmental cues. J. Veg. Sci. 2007, 18, 583–594. [Google Scholar] [CrossRef]
- Grant, R.C.C.; Peel, M.J.S.; Bezuidenhout, H. Evaluating herbivore management outcomes and associated vegetation impacts. Koedoe 2011, 53, 1–15. [Google Scholar] [CrossRef]
- AghaKouchak, A.; Farahmand, A.; Melton, F.S.; Teixeira, J.; Anderson, M.C.; Wardlow, B.D.; Hain, C.R. Remote sensing of drought: Progress, challenges and opportunities. Rev. Geophys. 2015, 53, 452–480. [Google Scholar] [CrossRef]
- Bijaber, N.; El Hadani, D.; Saidi, M.; Svoboda, M.; Wardlow, B.; Hain, C.; Poulsen, C.; Yessef, M.; Rochdi, A. Developing a Remotely Sensed Drought Monitoring Indicator for Morocco. Geosciences 2018, 8, 55. [Google Scholar] [CrossRef]
- Zeng, L.; Shan, J.; Xiang, D. Monitoring drought using multi-sensor remote sensing data in cropland of Gansu Province. In IOP Conference Series: Earth and Environmental Science; IOP Publishing: Bristol, UK, 2014; Volume 17. [Google Scholar]
- Villarreal, M.L.; Norman, L.M.; Buckley, S.; Wallace, C.S.A.; Coe, M.A. Multi-index time series monitoring of drought and fire effects on desert grasslands. Remote Sens. Environ. 2016, 183, 186–197. [Google Scholar] [CrossRef]
- He, B.; Liao, Z.; Quan, X.; Li, X.; Hu, J. A global Grassland Drought Index (GDI) product: Algorithm and validation. Remote Sens. 2015, 7, 12704–12736. [Google Scholar] [CrossRef]
- Western, D.; Mose, V.N.; Worden, J.; Maitumo, D. Predicting Extreme Droughts in Savannah Africa: A Comparison of Proxy and Direct Measures in Detecting Biomass Fluctuations, Trends and Their Causes. PLoS ONE 2015, 10, e0136516. [Google Scholar] [CrossRef]
- Graw, V.; Ghazaryan, G.; Dall, K.; Gómez, A.D.; Abdel-Hamid, A.; Jordaan, A.; Piroska, R.; Post, J.; Szarzynski, J.; Walz, Y.; et al. Drought dynamics and vegetation productivity in different land management systems of Eastern Cape, South Africa—A remote sensing perspective. Sustainability 2017, 9, 1728. [Google Scholar] [CrossRef]
- Makhado, R.A.; Scholes, R.J. Determinants of soil respiration in a semi-arid savanna ecosystem, Kruger National Park, South Africa. Koedoe 2011, 53, 1–8. [Google Scholar] [CrossRef]
- Entekhabi, D.; Njoku, E.G.; O’Neill, P.E.; Kellogg, K.H.; Crow, W.T.; Edelstein, W.N.; Entin, J.K.; Goodman, S.D.; Jackson, T.J.; Johnson, J.; et al. The Soil Moisture Active Passive (SMAP) Mission. Proc. IEEE 2010, 98, 704–716. [Google Scholar] [CrossRef]
- Kerr, Y.H.; Waldteufel, P.; Richaume, P.; Wigneron, J.P.; Ferrazzoli, P.; Mahmoodi, A.; Al Bitar, A.; Cabot, F.; Gruhier, C.; Juglea, S.E.; et al. The SMOS soil moisture retrieval algorithm. IEEE Trans. Geosci. Remote Sens. 2012, 50, 1384–1403. [Google Scholar] [CrossRef]
- Altese, E.; Bolognani, O.; Mancini, M.; Troch, P.A. Retrieving soil moisture over bare soil from ERS 1 synthetic aperture radar data: Sensitivity analysis based on a theoretical surface scattering model and field data. Water Resour. Res. 1996, 32, 653–661. [Google Scholar] [CrossRef]
- Bourgeau-Chavez, L.L.; Kasischke, E.S.; Riordan, K.; Brunzell, S.; Nolan, M.; Hyer, E.; Slawski, J.; Medvecz, M.; Walters, T.; Ames, S. Remote monitoring of spatial and temporal surface soil moisture in fire disturbed boreal forest ecosystems with ERS SAR imagery. Int. J. Remote Sens. 2007, 28, 2133–2162. [Google Scholar] [CrossRef]
- Haider, S.S.; Said, S.; Kothyari, U.C.; Arora, M.K. Soil moisture estimation using ERS 2 SAR data: A case study in the Solani River catchment/Estimation de l’humidité du sol grâce à des données ERS-2 SAR: Étude de cas dans le bassin de la rivière Solani. Hydrol. Sci. J. 2004, 49, 334. [Google Scholar] [CrossRef]
- Holah, N.; Baghdadi, N.; Zribi, M.; Bruand, A.; King, C. Potential of ASAR/ENVISAT for the characterization of soil surface parameters over bare agricultural fields. Remote Sens. Environ. 2005, 96, 78–86. [Google Scholar] [CrossRef]
- Zribi, M.; Baghdadi, N.; Holah, N.; Fafin, O. New methodology for soil surface moisture estimation and its application to ENVISAT-ASAR multi-incidence data inversion. Remote Sens. Environ. 2005, 96, 485–496. [Google Scholar] [CrossRef]
- Paloscia, S.; Pampaloni, P.; Pettinato, S.; Santi, E. A comparison of algorithms for retrieving soil moisture from ENVISAT ASAR images. IEEE Trans. Geosci. Remote Sens. 2008, 46, 3274–3284. [Google Scholar] [CrossRef]
- Biftu, G.F.; Gan, T.Y. Retrieving near-surface soil moisture from Radarsat SAR data. Water Resour. Res. 1999, 35, 1569–1579. [Google Scholar] [CrossRef]
- Leconte, R.; Brissette, F.; Galarneau, M.; Rousselle, J. Mapping near-surface soil moisture with RADARSAT-1 synthetic aperture radar data. Water Resour. Res. 2004, 40. [Google Scholar] [CrossRef]
- Glenn, N.F.; Carr, J.R. Establishing a relationship between soil moisture and RADARSAT-1 SAR data obtained over the Great Basin, Nevada, USA. Can. J. Remote Sens. 2004, 30, 176–181. [Google Scholar] [CrossRef]
- Mohanty, B.P.; Cosh, M.H.; Lakshmi, V.; Montzka, C. Soil Moisture Remote Sensing: State-of-the-Science. Vadose Zone J. 2017, 16. [Google Scholar] [CrossRef]
- Paloscia, S.; Pettinato, S.; Santi, E.; Notarnicola, C.; Pasolli, L.; Reppucci, A. Soil moisture mapping using Sentinel-1 images: Algorithm and preliminary validation. Remote Sens. Environ. 2013, 134, 234–248. [Google Scholar] [CrossRef]
- Wagner, W.; Sabel, D.; Doubkova, M.; Bartsch, A.; Pathe, C. The Potential of Sentinel-1 for Monitoring Soil Moisture With a High Spatial Resolution At Global Scale. Earth Obs. Water Cycle Sci. 2009, 2009, 18–20. [Google Scholar]
- Garkusha, I.N.; Hnatushenko, V.V.; Vasyliev, V.V. Using Sentinel-1 data for monitoring of soil moisture. In Proceedings of the 2017 IEEE International Geoscience and Remote Sensing Symposium (IGARSS), Fort Worth, TX, USA, 23–28 July 2017; pp. 6–9. [Google Scholar]
- Lievens, H.; Reichle, R.H.; Liu, Q.; De Lannoy, G.J.M.; Dunbar, R.S.; Kim, S.B.; Das, N.N.; Cosh, M.; Walker, J.P.; Wagner, W. Joint Sentinel-1 and SMAP data assimilation to improve soil moisture estimates. Geophys. Res. Lett. 2017, 44, 6145–6153. [Google Scholar] [CrossRef] [PubMed]
- Alexakis, D.D.; Mexis, F.D.K.; Vozinaki, A.E.K.; Daliakopoulos, I.N.; Tsanis, I.K. Soil moisture content estimation based on Sentinel-1 and auxiliary earth observation products. A hydrological approach. Sensors 2017, 17, 1455. [Google Scholar] [CrossRef] [PubMed]
- Cenci, L.; Pulvirenti, L.; Boni, G.; Chini, M.; Matgen, P.; Gabellani, S.; Squicciarino, G.; Pierdicca, N. An evaluation of the potential of Sentinel 1 for improving flash flood predictions via soil moisture-data assimilation. Adv. Geosci. 2017, 44, 89–100. [Google Scholar] [CrossRef]
- Gao, Q.; Zribi, M.; Escorihuela, M.J.; Baghdadi, N. Synergetic use of Sentinel-1 and Sentinel-2 data for soil moisture mapping at 100 m resolution. Sensors 2017, 17, 1966. [Google Scholar] [CrossRef] [PubMed]
- Naeimi, V.; Scipal, K.; Bartalis, Z.; Hasenauer, S.; Wagner, W. An improved soil moisture retrieval algorithm for ERS and METOP scatterometer observations. IEEE Trans. Geosci. Remote Sens. 2009, 47, 1999–2013. [Google Scholar] [CrossRef]
- Wagner, W.; Lemoine, G.; Rott, H. A method for estimating soil moisture from ERS Scatterometer and soil data. Remote Sens. Environ. 1999, 70, 191–207. [Google Scholar] [CrossRef]
- Lenfers, U.A.; Bruggemann, R.; Clemen, T. Exploring survival strategies of African Savanna trees by partial ordering techniques. Ecol. Inform. 2017, 42, 14–23. [Google Scholar] [CrossRef]
- Colgan, M.S.; Asner, G.P.; Levick, S.R.; Martin, R.E.; Chadwick, O.A. Topo-edaphic controls over woody plant biomass in South African savannas. Biogeosciences 2012, 9, 1809–1821. [Google Scholar] [CrossRef]
- Venter, F.J.; Scholes, R.J.; Eckhardt, H.; du Toit, R. The abiotic template and its associated vegetation pattern. In The Kruger Experience: Ecology And Management Of Savanna Heterogeneity; Du Toit, R., Biggs, H.C., Rogers, K.H., Eds.; Island Press: Washington, DC, USA, 2003; pp. 83–129. [Google Scholar]
- Truckenbrodt, J. pyroSAR—A Python Framework for Large-Scale SAR Satellite Data Processing. Available online: https://github.com/johntruckenbrodt/pyroSAR (accessed on 29 November 2017).
- Wegmüller, U.; Werner, C.; Strozzi, T.; Wiesmann, A.; Frey, O.; Santoro, M. Sentinel-1 Support in the GAMMA Software. Procedia Comput. Sci. 2016, 100, 1305–1312. [Google Scholar] [CrossRef]
- USGS (United States Geological Survey). Shuttle Radar Topography Mission (SRTM) 1 Arc-Second Global—Version 3; USGS: Reston, VA, USA, 2018. [Google Scholar]
- Small, D. Flattening gamma: Radiometric terrain correction for SAR imagery. IEEE Trans. Geosci. Remote Sens. 2011, 49, 3081–3093. [Google Scholar] [CrossRef]
- Louis, J.; Debaecker, V.; Pflug, B.; Main-Knorn, M.; Bieniarz, J.; Mueller-Wilm, U.; Cadau, E.; Gascon, F. Sentinel-2 SEN2COR: L2A processor for users. In European Space Agency, (Special Publication) ESA SP; ESA Living Planet Symposium: Praque, Czech Republic, 2016; Volume SP-740. [Google Scholar]
- Vermote, E.; Justice, C.; Claverie, M.; Franch, B. Preliminary analysis of the performance of the Landsat 8/OLI land surface reflectance product. Remote Sens. Environ. 2016, 185, 46–56. [Google Scholar] [CrossRef]
- Goosen, L. Kruger National Park Daily Rainfall Data 2012 until Present. Available online: http://dataknp.sanparks.org/sanparks/metacat (accessed on 30 November 2017).
- Chuvieco, E. Fundamentals of Satellite Remote Sensing an Environmental Approach; CRC Press, an imprint of the Taylor & Francis Group: Boca Raton, FL, USA, 2016; ISBN 9781498728096. [Google Scholar]
- Odipo, V.; Nickless, A.; Berger, C.; Baade, J.; Urbazaev, M.; Walther, C.; Schmullius, C. Assessment of Aboveground Woody Biomass Dynamics Using Terrestrial Laser Scanner and L-Band ALOS PALSAR Data in South African Savanna. Forests 2016, 7, 294. [Google Scholar] [CrossRef]
- Verstraeten, W.W.; Veroustraete, F.; Van Der Sande, C.J.; Grootaers, I.; Feyen, J. Soil moisture retrieval using thermal inertia, determined with visible and thermal spaceborne data, validated for European forests. Remote Sens. Environ. 2006, 101, 299–314. [Google Scholar] [CrossRef]
- Entekhabi, D.; Njoku, E.G.; Houser, P.; Spencer, M.; Doiron, T.; Kim, Y.; Smith, J.; Girard, R.; Belair, S.; Crow, W.; et al. The hydrosphere state (hydros) satellite mission: An earth system pathfinder for global mapping of soil moisture and land freeze/thaw. IEEE Trans. Geosci. Remote Sens. 2004, 42, 2184–2195. [Google Scholar] [CrossRef]
- Tucker, C.J. Red and photographic infrared linear combinations for monitoring vegetation. Remote Sens. Environ. 1979, 8, 127–150. [Google Scholar] [CrossRef]
- Zhang, H.K.; Roy, D.P.; Yan, L.; Li, Z.; Huang, H.; Vermote, E.; Skakun, S.; Roger, J.C. Characterization of Sentinel-2A and Landsat-8 top of atmosphere, surface, and nadir BRDF adjusted reflectance and NDVI differences. Remote Sens. Environ. 2018, 215, 482–494. [Google Scholar] [CrossRef]
- Di Gregorio, A.; Jansen, L.J.M. Land Cover Classification System (LCCS): Classification Concepts and User Manual; Software; FAO: Rome, Italy, 2005. [Google Scholar]
- Hillel, D. Introduction to Environmental Soil Physics; Elsevier Academic Press: Cambridge, MA, USA, 2003; ISBN 9780123486554. [Google Scholar]
- Kirkham, M.B. Principles of Soil and Plant Water Relations; Elsevier Academic Press: Cambridge, MA, USA, 2005; ISBN 9780124097513. [Google Scholar]
- Nicolai-Shaw, N.; Zscheischler, J.; Hirschi, M.; Gudmundsson, L.; Seneviratne, S.I. A drought event composite analysis using satellite remote-sensing based soil moisture. Remote Sens. Environ. 2017, 203, 216–225. [Google Scholar] [CrossRef]
- Shoshany, M.; Svoray, T.; Svoray, T.; Curran, P.J.; Foody, G.M.; Perevolotsky, A. The relationship between ERS-2 SAR backscatter and soil moisture: Generalization from a humid to semi-arid transect. Int. J. Remote Sens. 2000, 21, 2337–2343. [Google Scholar] [CrossRef]
- Berry, R.S.; Kulmatiski, A. A savanna response to precipitation intensity. PLoS ONE 2017, 12, e0175402. [Google Scholar] [CrossRef] [PubMed]
- Cai, W.; Borlace, S.; Lengaigne, M.; Van Rensch, P.; Collins, M.; Vecchi, G.; Timmermann, A.; Santoso, A.; Mcphaden, M.J.; Wu, L.; et al. Increasing frequency of extreme El Niño events due to greenhouse warming. Nat. Clim. Chang. 2014, 4, 111–116. [Google Scholar] [CrossRef]
- Perry, S.J.; McGregor, S.; Gupta, A.S.; England, M.H. Future Changes to El Niño–Southern Oscillation Temperature and Precipitation Teleconnections. Geophys. Res. Lett. 2017, 44, 10608–10616. [Google Scholar] [CrossRef]
- Hunt, E.D.; Hubbard, K.G.; Wilhite, D.A.; Arkebauer, T.J.; Dutcher, A.L. The development and evaluation of a soil moisture index. Int. J. Climatol. 2009, 29, 747–759. [Google Scholar] [CrossRef]
- Senay, G.B.; Budde, M.B.; Brown, J.F.; Verdin, J.P. Mapping flash drought in the US: Southern Great Plains. In Proceedings of the 22nd Conference on Hydrology, AMS, New Orleans, LA, USA, 20–24 January 2008. [Google Scholar]
- Yuan, X.; Wang, L.; Wood, E.F. Anthropogenic Intensification of Southern African Flash Droughts as Exemplified by the 2015/2016 Season. In Explaining Extreme Events of 2016 from a Climate Perspective; Herring, S.C., Christidis, N., Hoell, A., Kossin, J.P., Schreck, C.J., III, Stott, P.A., Eds.; Bulletin of the American Meteorological Society: Boston, MA, USA, 2018; Volume 98, pp. S86–S90. [Google Scholar]
- Wanders, N.; Wood, E.F. Assessing Seasonal Climate Forecasts Over Africa to Support Decision-Making. In Bridging Science and Policy Implication for Managing Climate Extremes; Hong-Sang Jung, B.W., Ed.; World Scientific Publishing Co. Pte. Ltd. and APEC Climate Center: Singapore, 2018; pp. 1–15. ISBN 9789813235663. [Google Scholar]
- Byram, G.M. Combustion of forest fuels. In Forest Fire: Control and Use; Davis, K.P., Ed.; McGraw-Hill: New York, NY, USA, 1959; pp. 155–182. [Google Scholar]
- Wessels, K.J.; Prince, S.D.; Zambatis, N.; MacFadyen, S.; Frost, P.E.; Van Zyl, D. Relationship between herbaceous biomass and 1-km2 Advanced Very High Resolution Radiometer (AVHRR) NDVI in Kruger National Park, South Africa. Int. J. Remote Sens. 2006, 27, 951–973. [Google Scholar] [CrossRef]


© 2018 by the authors. Licensee MDPI, Basel, Switzerland. This article is an open access article distributed under the terms and conditions of the Creative Commons Attribution (CC BY) license (http://creativecommons.org/licenses/by/4.0/).
Share and Cite
Urban, M.; Berger, C.; Mudau, T.E.; Heckel, K.; Truckenbrodt, J.; Onyango Odipo, V.; Smit, I.P.J.; Schmullius, C. Surface Moisture and Vegetation Cover Analysis for Drought Monitoring in the Southern Kruger National Park Using Sentinel-1, Sentinel-2, and Landsat-8. Remote Sens. 2018, 10, 1482. https://doi.org/10.3390/rs10091482
Urban M, Berger C, Mudau TE, Heckel K, Truckenbrodt J, Onyango Odipo V, Smit IPJ, Schmullius C. Surface Moisture and Vegetation Cover Analysis for Drought Monitoring in the Southern Kruger National Park Using Sentinel-1, Sentinel-2, and Landsat-8. Remote Sensing. 2018; 10(9):1482. https://doi.org/10.3390/rs10091482
Chicago/Turabian StyleUrban, Marcel, Christian Berger, Tami E. Mudau, Kai Heckel, John Truckenbrodt, Victor Onyango Odipo, Izak P. J. Smit, and Christiane Schmullius. 2018. "Surface Moisture and Vegetation Cover Analysis for Drought Monitoring in the Southern Kruger National Park Using Sentinel-1, Sentinel-2, and Landsat-8" Remote Sensing 10, no. 9: 1482. https://doi.org/10.3390/rs10091482
APA StyleUrban, M., Berger, C., Mudau, T. E., Heckel, K., Truckenbrodt, J., Onyango Odipo, V., Smit, I. P. J., & Schmullius, C. (2018). Surface Moisture and Vegetation Cover Analysis for Drought Monitoring in the Southern Kruger National Park Using Sentinel-1, Sentinel-2, and Landsat-8. Remote Sensing, 10(9), 1482. https://doi.org/10.3390/rs10091482