Article

Recovery Rates of Wetland Vegetation Greenness in Severely Burned Ecosystems of Alaska Derived from Satellite Image Analysis

NASA Ames Research Center, Moffett Field, CA 94035, USA
Remote Sens. 2018, 10(9), 1456; https://doi.org/10.3390/rs10091456
Submission received: 27 July 2018 / Revised: 6 September 2018 / Accepted: 8 September 2018 / Published: 12 September 2018
(This article belongs to the Special Issue Remote Sensing of Environmental Changes in Cold Regions)

Abstract

:
The analysis of wildfire impacts at the scale of less than a square kilometer can reveal important patterns of vegetation recovery and regrowth in freshwater Arctic and boreal regions. For this study, NASA Landsat burned area products since the year 2000, and a near 20-year record of vegetation green cover from the MODIS (Moderate Resolution Imaging Spectroradiometer) satellite sensor were combined to reconstruct the recovery rates and seasonal profiles of burned wetland ecosystems in Alaska. Region-wide breakpoint analysis results showed that significant structural change could be detected in the 250-m normalized difference vegetation index (NDVI) time series for the vast majority of wetland locations in the major Yukon river drainages of interior Alaska that had burned at high severity since the year 2001. Additional comparisons showed that wetland cover locations across Alaska that have burned at high severity subsequently recovered their green cover seasonal profiles to relatively stable pre-fire levels in less than 10 years. Negative changes in the MODIS NDVI, namely lower greenness in 2017 than pre-fire and incomplete greenness recovery, were more commonly detected in burned wetland areas after 2013. In the years prior to 2013, the NDVI change tended to be positive (higher greenness in 2017 than pre-fire) at burned wetland elevations lower than 400 m, whereas burned wetland locations at higher elevation showed relatively few positive greenness recovery changes by 2017.

Graphical Abstract

1. Introduction

High-severity wildfires have been shown to have long-term impacts on freshwater ecosystems; as nutrients are mobilized, runoff and erosion can increase, and soil properties may be modified [1]. While there is a growing literature for the effects of fire on upland vegetation types [2], the existing information on vegetation removal by burning remains limited for most freshwater plant communities globally.
To extend this knowledge base, satellite remote sensing can be used to effectively monitor changes in high-latitude (boreal and tundra) wetland vegetation cover and productivity, especially following disturbance events such as wildfires [3,4,5,6,7]. Most of these remote sensing studies have been carried out for non-wetland (interior boreal forest and upland tundra) vegetation cover types. Nonetheless, Potter et al. [6] reported that the wetland tundra areas of Alaska that burned since the year 1980 had a 3:2 ratio coverage of significant positive versus negative vegetation greening trends between 2000–2010, whereas non-wetland tundra areas that burned since 1980 had a 2:5 coverage ratio of significant positive versus negative vegetation greening trends between 2000–2010. This result suggested that the wetland areas of Alaska can recover more completely and rapidly in greenness cover from recent wildfires than non-wetland land cover types; however, this supposition remains to be tested region-wide over longer time periods.
Over the past several decades, there has been an increase in the frequency and severity of boreal region wildfires in Alaska [8]. During the 2000s, an average of 767,000 ha per year were burned statewide, which is 50% higher than in any previous decade since the 1940s. In the extreme wildfire year of 2015, nearly 60% of Alaska’s burned area was consumed at moderate-to-high severity levels [9].
Most of the wildfires in the spruce forest ecosystems of Alaska are either crown or ground fires with a high enough severity to kill over-story trees [10,11,12]. Usually, some of the organic layer of the forest floor remains, but fires in late summer following exceptionally dry or windy conditions may consume all of the organic layer, exposing mineral soil [13]. Jiang et al. [14] and Brown et al. [15] reported that the post-fire thickness of the soil organic layer and its impact on soil thermal conductivity was the most important factor determining post-fire soil temperatures and thaw depth. In moderately burned sites, the presence of permafrost can mitigate the loss of the insulating soil organic layer, decrease soil drying, and increase surface water pooling.
The objective of this study was to analyze the vegetation recovery patterns of all of the Alaska wetlands that have burned at high severity since the year 2000 using a combination of the Landsat and MODIS (Moderate Resolution Imaging Spectroradiometer) satellite datasets. A statistical analysis of the changes in the MODIS vegetation index time series was conducted using the “Breaks for Additive Seasonal and Trend” method (BFAST, Verbesselt et al. [16,17]). de Jong et al. [18] analyzed trends in the normalized difference vegetation index (NDVI) satellite time series using the BFAST procedure, and detected both abrupt and gradual changes in large parts of the world, especially in shrubland and grassland biomes where abrupt greening was often followed by gradual browning.
This study was undertaken as a contribution to the NASA Arctic Boreal Vulnerability Experiment (ABoVE) field campaign, chiefly to better understand changes in related hydrologic and biogeochemical mechanisms in the years following high-latitude wildfires. One of the major questions being addressed by ABoVE, and in this type of Landsat/MODIS study, is “What processes are controlling changes in boreal–Arctic land cover properties, and what are the impacts of these changes?”

2. Materials and Methods

2.1. Landsat Burn Severity Classes

Digital maps of burn severity classes at 30-m spatial resolution were obtained from the Monitoring Trends in Burn Severity (MTBS; www.mtbs.gov) project, which has consistently mapped fires greater than 1000 acres (405 ha) across the United States from 1984 to the present [19]. The MTBS project is conducted through a partnership between the United States (US) Geological Survey (USGS) National Center for Earth Resources Observation and Science (EROS) and the Unites States Department of Agriculture (USDA) Forest Service. Landsat data have been analyzed through a standardized and consistent methodology by the MTBS project.
The normalized burn ratio (NBR) index was calculated by MTBS using approximately one-year pre-fire and post-fire images from the near infrared (NIR) and shortwave infrared (SWIR) bands of the Landsat sensors, with reflectance values scaled to between 0–10,000 NBR units.
NBR = (NIR − SWIR)/(NIR + SWIR)
Pre-fire and post-fire NBR images were next differenced for each Landsat scene pair to generate the Relative dNBR (RdNBR) [20].
RdNBR = [(NBRpre-fire − NBRpost-fire)]/√ABS (NBRpre-fire)
The RdNBR severity classes of low, moderate, and high (LBS, MBS, HBS) have been defined previously by Miller and Thode [20] and cover a range of −500 to +1200 over burned land surfaces. Positive RdNBR values represent a decrease in vegetation cover and a higher burn severity, while negative values would represent an increase in live vegetation cover following the fire event.

2.2. MODIS Vegetation Index Time Series

NASA’s MODIS (Moderate Resolution Imaging Spectroradiometer) satellite sensors Terra and Aqua have been used to generate a 250-m resolution NDVI (MOD13) global product on 16-day intervals since the year 2000 [21,22]. The MODIS Collection 6 NDVI data set provides consistent spatial and temporal profiles of vegetation canopy greenness according to the equation:
NDVI = (NIR − Red)/(NIR + Red)
where NIR is the reflectance of wavelengths from 0.7 μm to 1.0 μm, and Red is the reflectance from 0.6 μm to 0.7 μm, with values scaled to between 0 and 10,000 NDVI units to preserve decimal places in integer file storage. Low values of NDVI (near 0) indicate barren land cover, whereas high values of NDVI (above 8000) indicate dense canopy greenness cover.
The MOD13 250-m vegetation indices (VIs) have been retrieved from daily, atmosphere-corrected, bidirectional surface reflectance. The VIs were computed from MODIS-specific compositing methods based on product quality assurance metrics to remove all of the low-quality pixels from the final NDVI value reported. Cloud and water pixels were identified and excluded using other MODIS atmospheric data masks. From the remaining good-quality NDVI values, a constrained view-angle approach (closest to nadir) then selected the optimal pixel value to represent each 16-day compositing period. These MOD13 data sets were downloaded from the files that were available at modis.gsfc.nasa.gov/data/dataprod/mod13.php for time series analysis across Alaska wetland locations.

2.3. Elevation and Land Cover Map Layers

Digital elevation (in vertical meters) for Alaska was derived from USGS [23] mapping at 300-m ground resolution. Wetland cover was mapped for the state at 30-m ground resolution from the 2011 National Land Cover Dataset (NLCD) of Alaska ([24]; available at www.mrlc.gov/nlcd11_leg.php). The overall thematic accuracy for the previous Alaska NLCD was 76% at Level II (12 classes evaluated). For contextual comparison purposes, the open water (class 11), barren land (class 31), and evergreen forest (class 42) classes of this NLCD were mapped with high users accuracy, while the herbaceous wetland (class 95) was mapped with moderate users accuracy.
For this study, the NLCD woody wetland (class 90) together with all of the herbaceous wetland pixels were combined into one class, and were all overlaid 200 × 200-m resolution areas with a majority of the wetland surface coverage identified and mapped for the entire state (Figure 1). This combined wetland coverage was overlaid with statewide MTBS high burn severity (HBS) class pixels from the years 2001 to 2015, and with MODIS 250-m summer season NDVI (from the composite Julian day 177; 26 June) images for each of these years to carry out a time trend analysis of the burned wetland area NDVI changes statewide. “Pre-fire” MODIS NDVI values were all derived from the Julian day 177 NDVI from the year before the fire date for change detection.
The section of the Julian date 177 for NDVI change detection over time was not an arbitrary choice, but rather was determined to be a seasonally consistent metric of green cover change, since 26 June is nearly always near the seasonal maximum in interior Alaska for green cover, which was verified by examining thousands of pixels in time-stacked NDVI maps of Alaska wetland locations. Wetland areas that covered less than a majority of 200 × 200-m resolution areas in the statewide grid were too small to be matched consistently with MODIS 250-m summer season NDVI, and were therefore not included in the results.

2.4. Statistical Analysis Methods

The BFAST (Breaks for Additive Seasonal and Trend) methodology was applied to a MODIS NDVI monthly time series for selected wetland locations that covered the majority of a 250 × 250 m pixel area within severely burned locations. BFAST was developed by Verbesselt et al. [16,17] for detecting and characterizing abrupt changes within a time series, while also adjusting for regular seasonal cycles. A harmonic seasonal model is first applied in BFAST to account for regular seasonal phenological variations. BFAST next computes the Ordinary Least Squares Moving Sum (OLS-MOSUM) by considering that the moving sums of the residuals after the harmonic seasonal model have been removed from the time series data values. MOSUM tests for structural change using the null hypothesis that all regression coefficients are equal i.e., every observed value can be expressed as a linear function with the same slope [25]. If the null hypothesis is true, the values can be modeled by one line with that slope, and the sum of residuals will have a zero mean. MOSUM compares moving sums of residuals to test the likelihood of the regression coefficient for a certain time period based on a user’s input stating the minimum time between potential “breakpoints”. A rejection of the null hypothesis indicates that the regression coefficient changes at that point in time.
The MOSUM uses a default p-value of 0.05, meaning that the probability of it detecting a structural change when none has occurred is less than 5%. If MOSUM does not detect some structural change with a confidence level of 95%, it returns a “no breakpoints” result. If MOSUM detects some structural change with a confidence level of 95%, it then processes the time series through a second test, which is used to determine where the breakpoints are located in time. The output of this function is a 95% confidence interval for each breakpoint (expressed as two date numbers that define a range, before and after a breakpoint.).
For BFAST timer-series analysis, MOD13 NDVI data values (2000 to 2017) from Alaska wetland locations were subsampled to include only the growing season values during the low snow cover period of 1 May to 1 October, leaving about 10 observations per year. If a “no data” value was present in the growing season MOD13 record, then the NDVI from the previous 16-day period was substituted. Change metrics generated by BFAST from the time series analysis results included the number of breakpoints, date of each breakpoint, and the slope of the NDVI between breakpoint dates.

3. Results

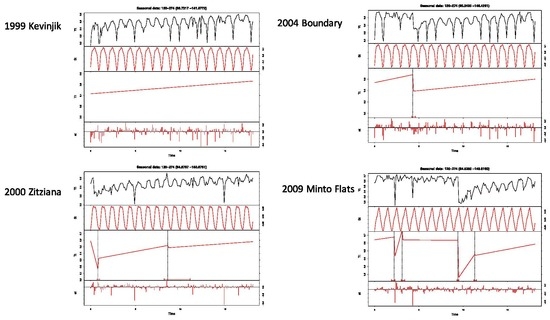
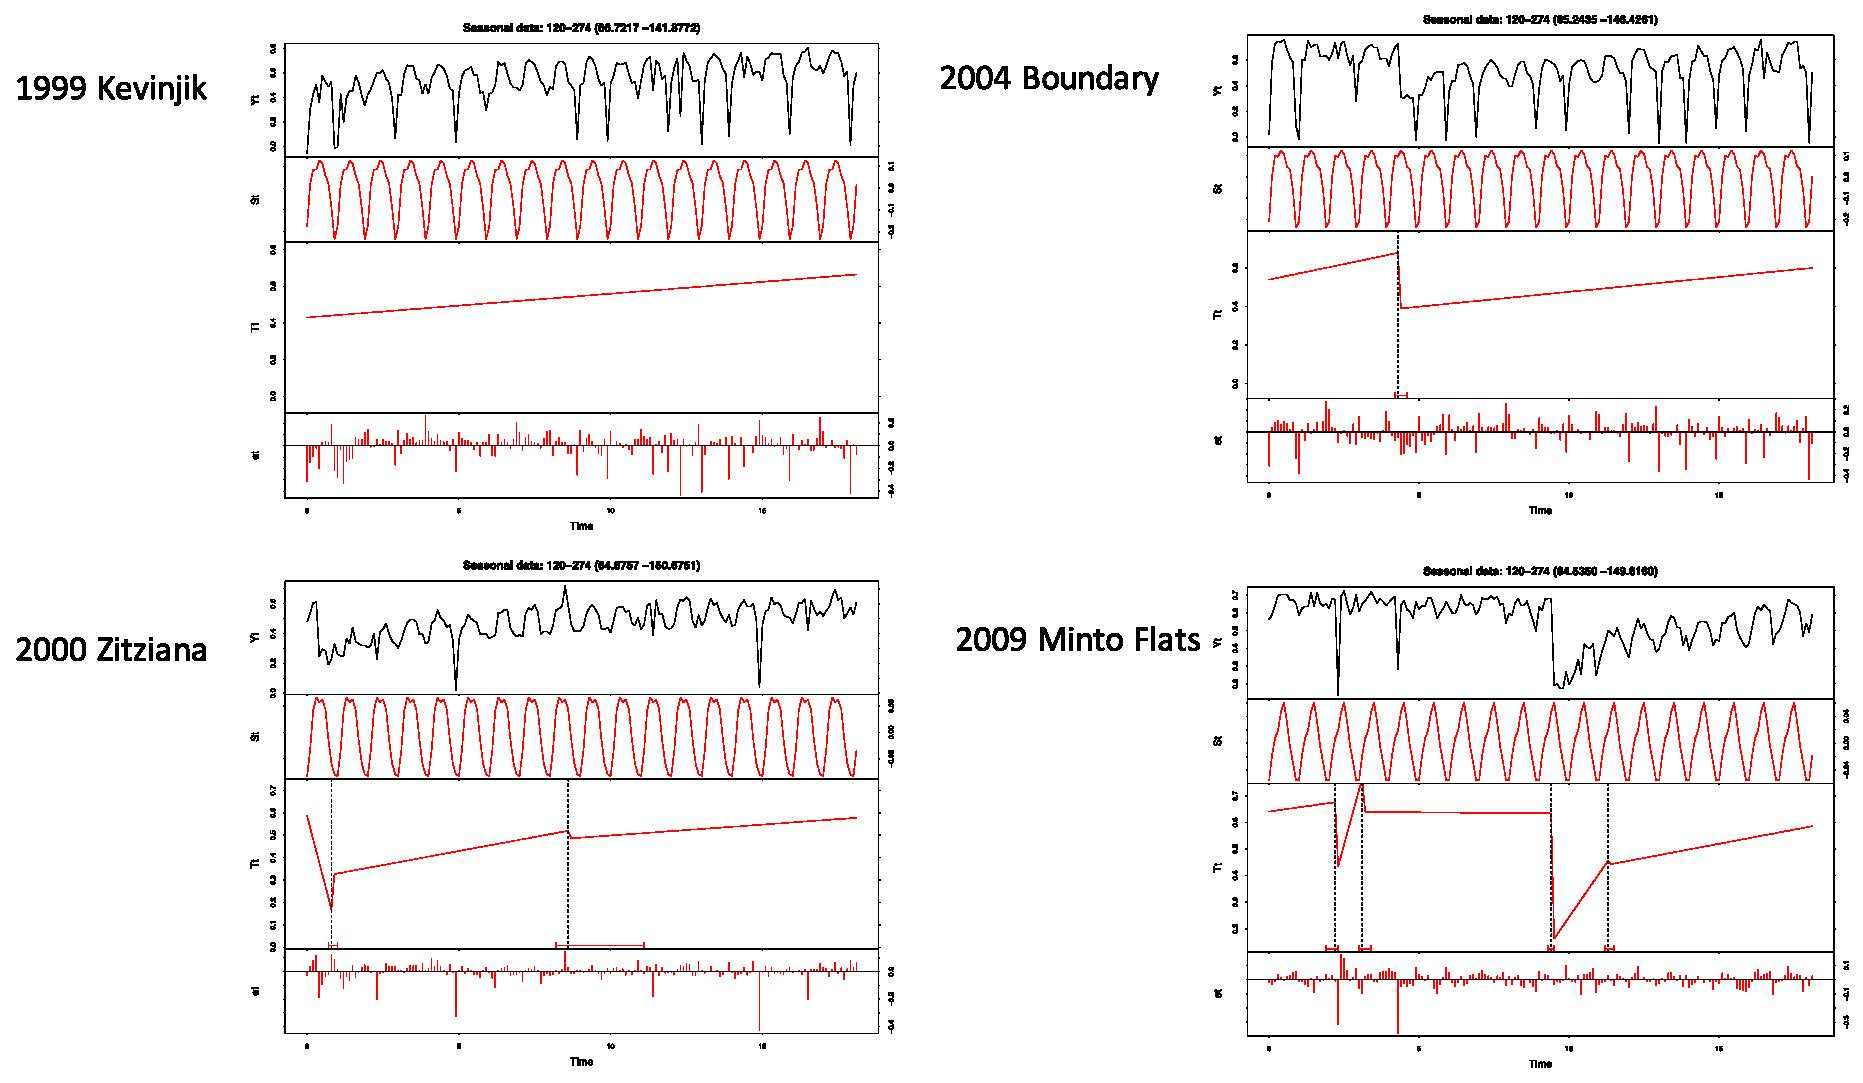
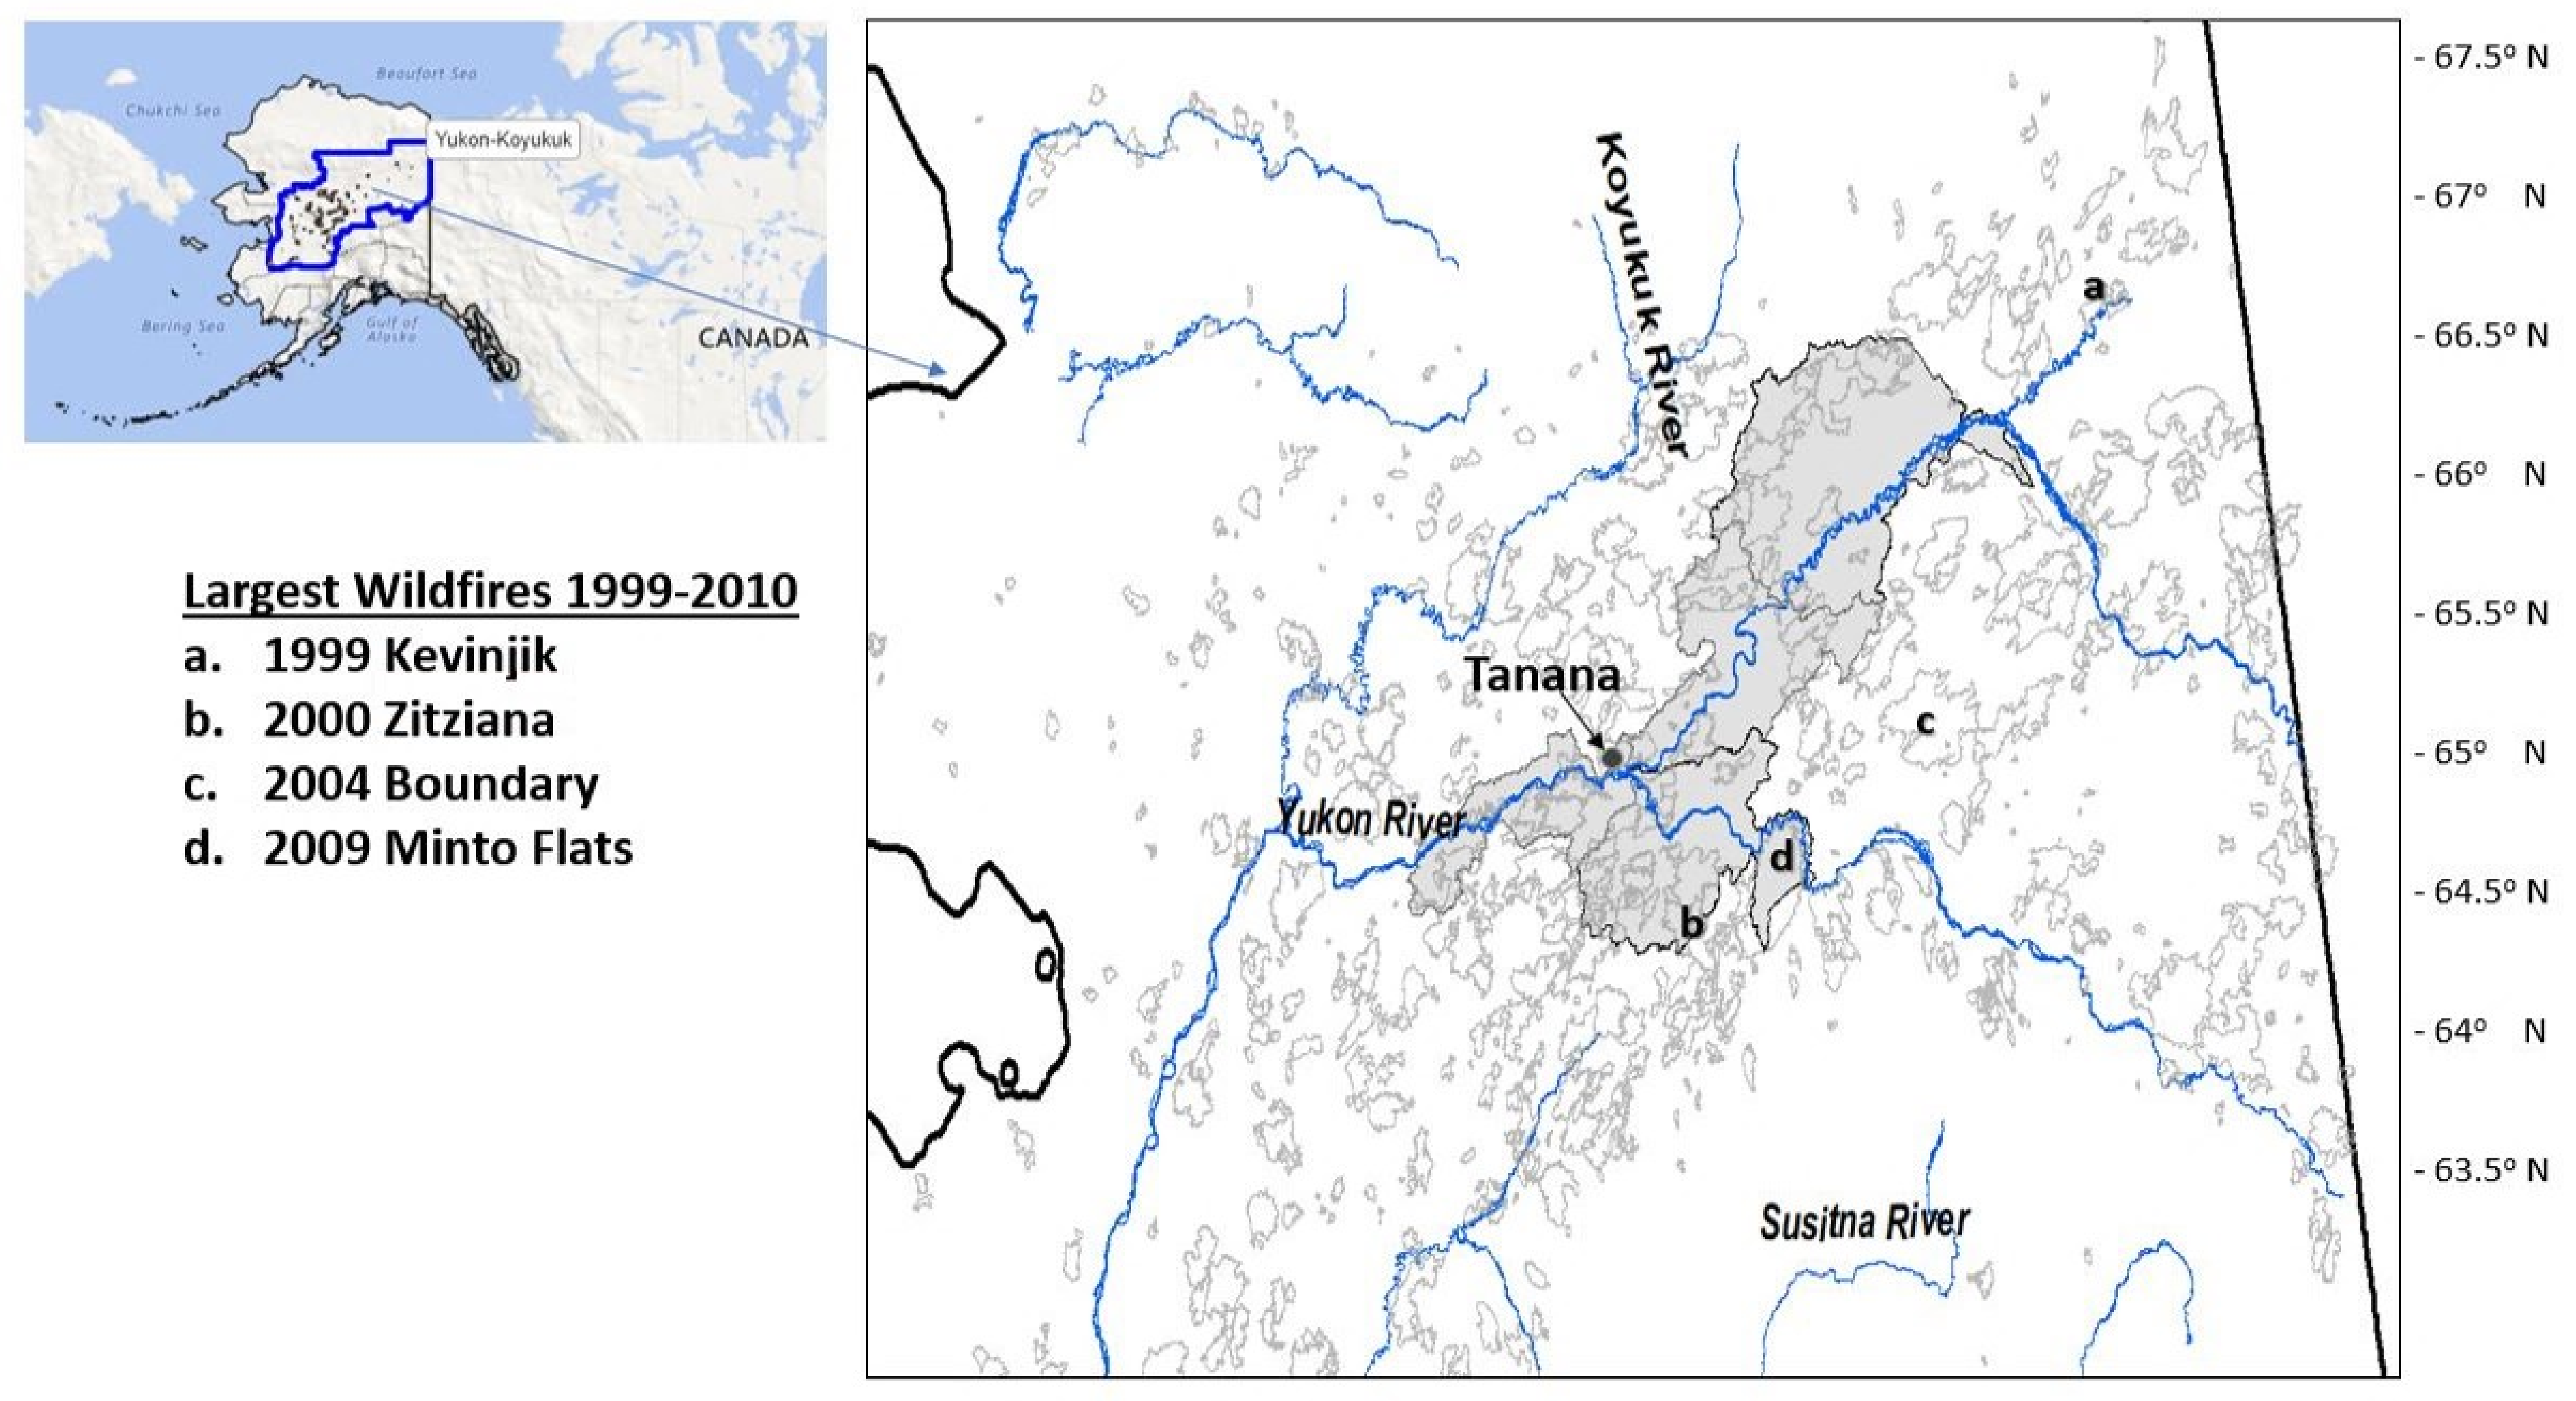
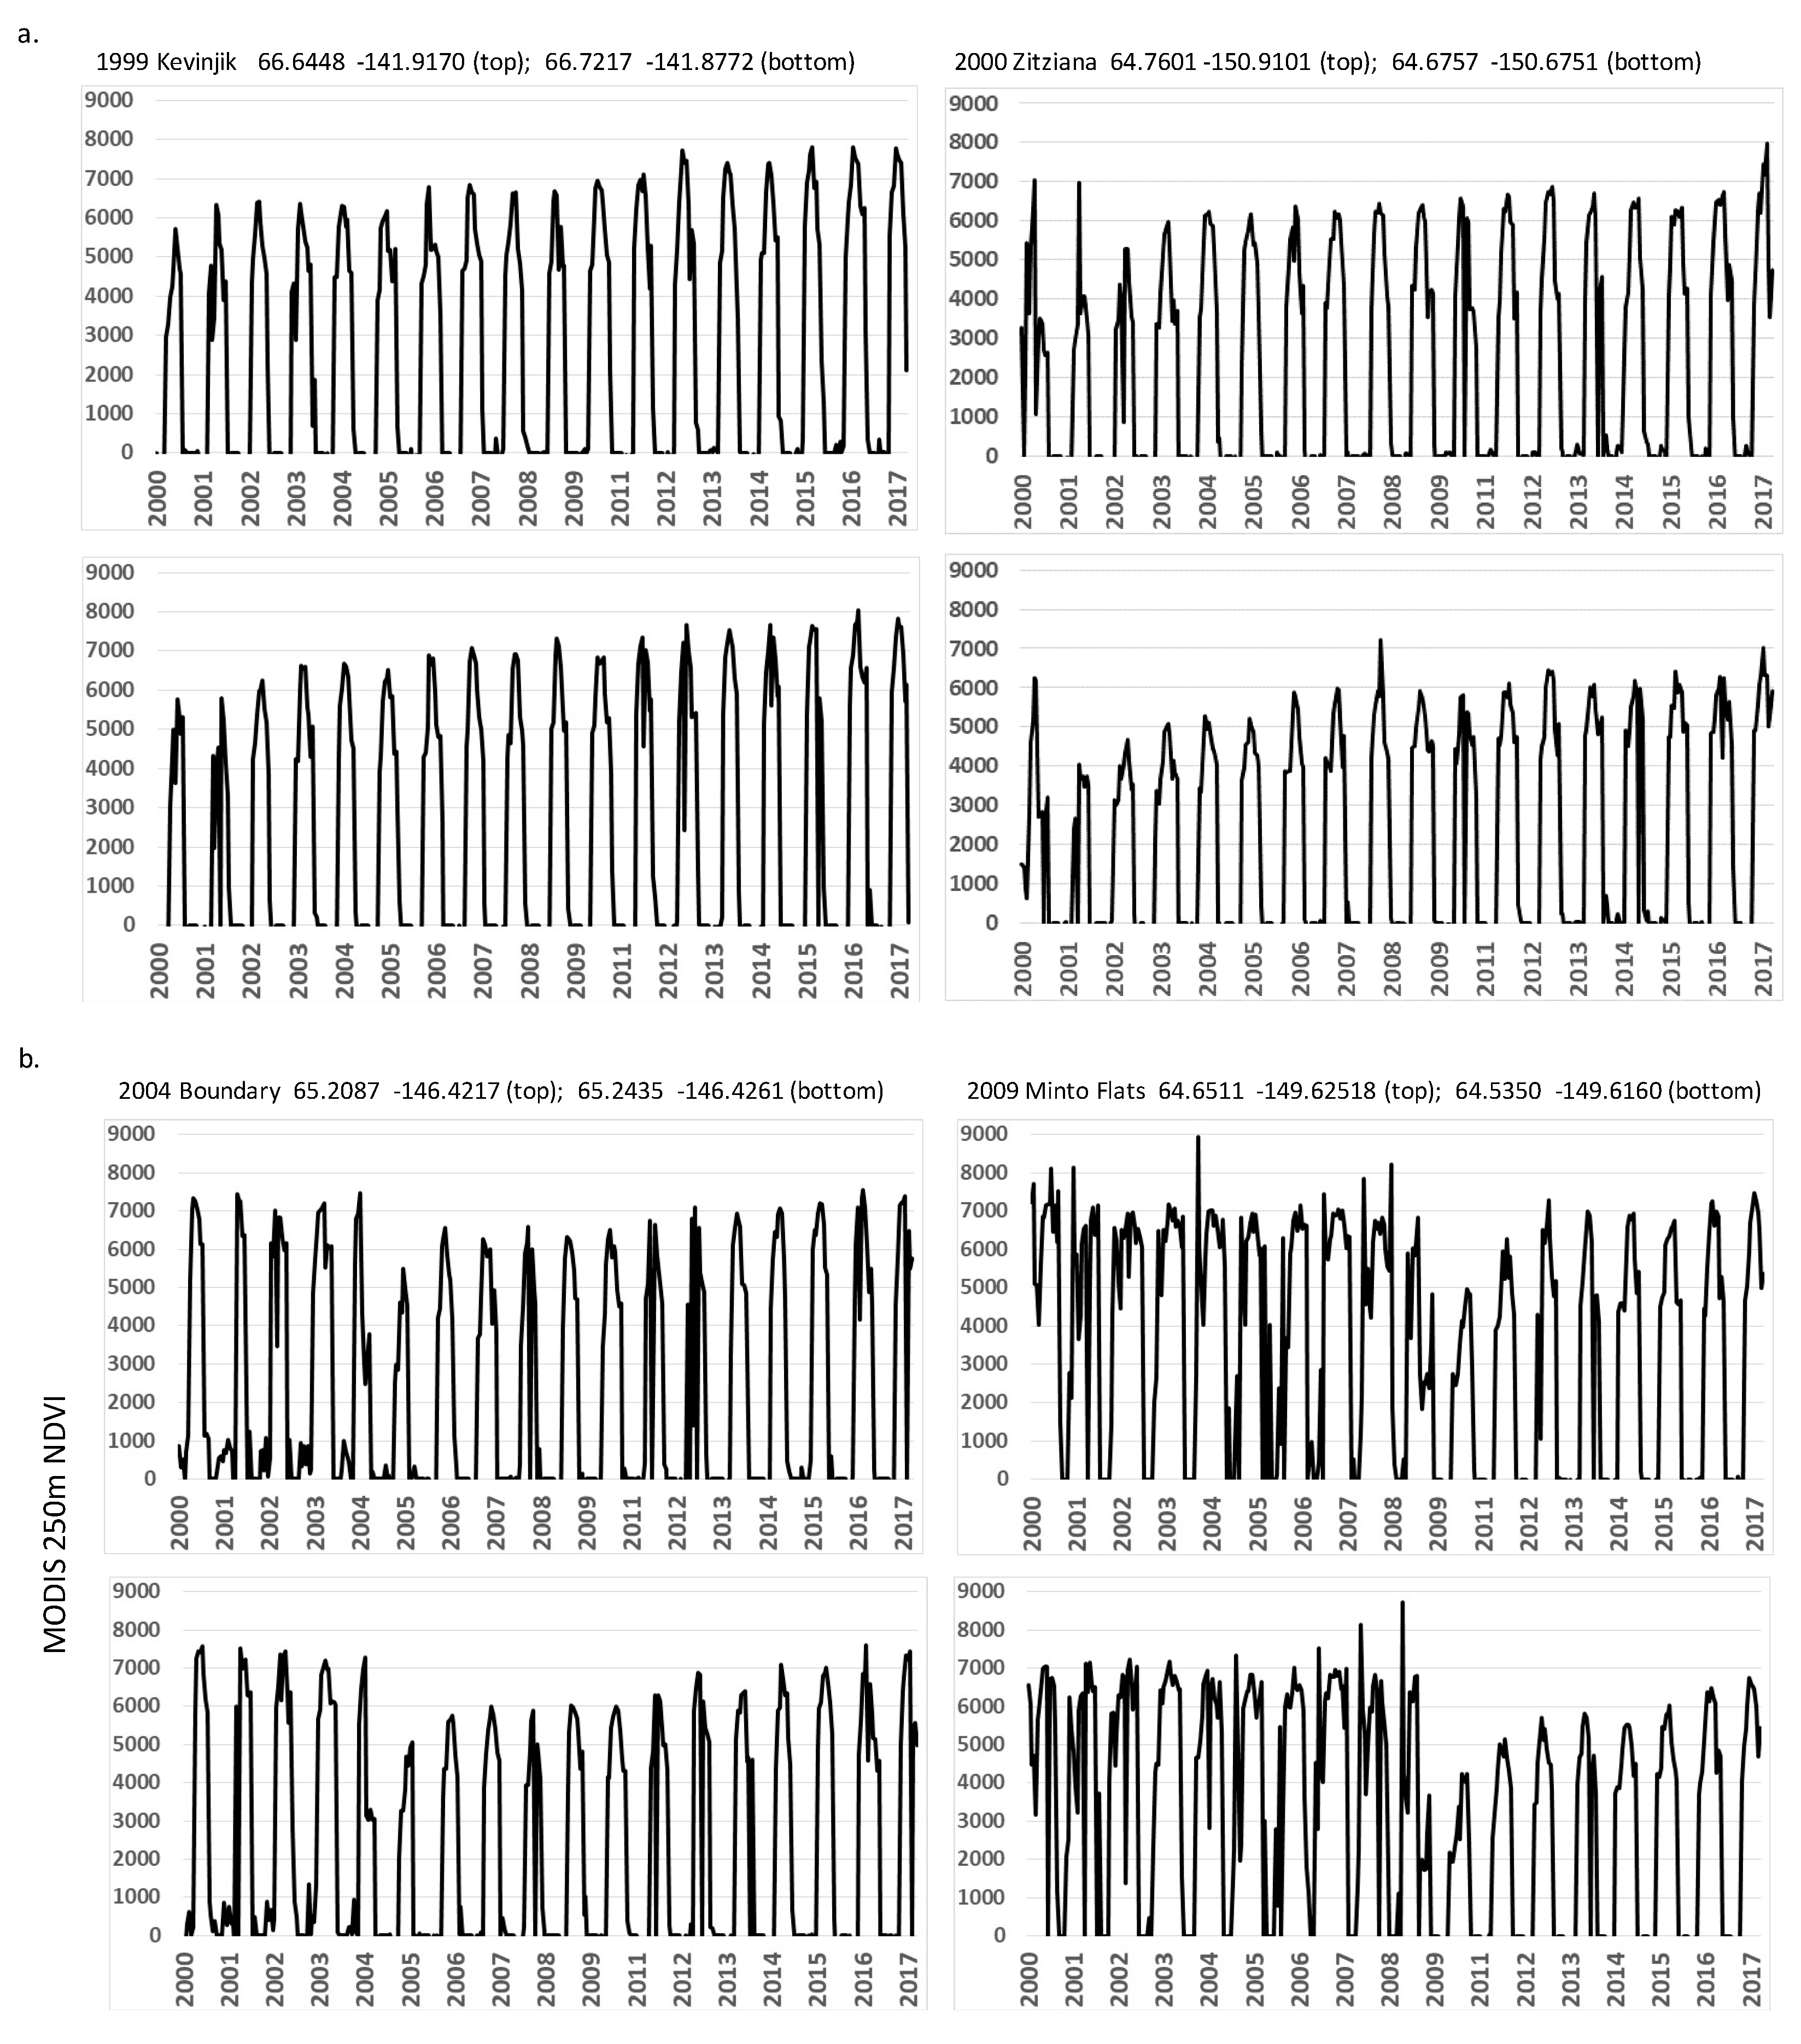
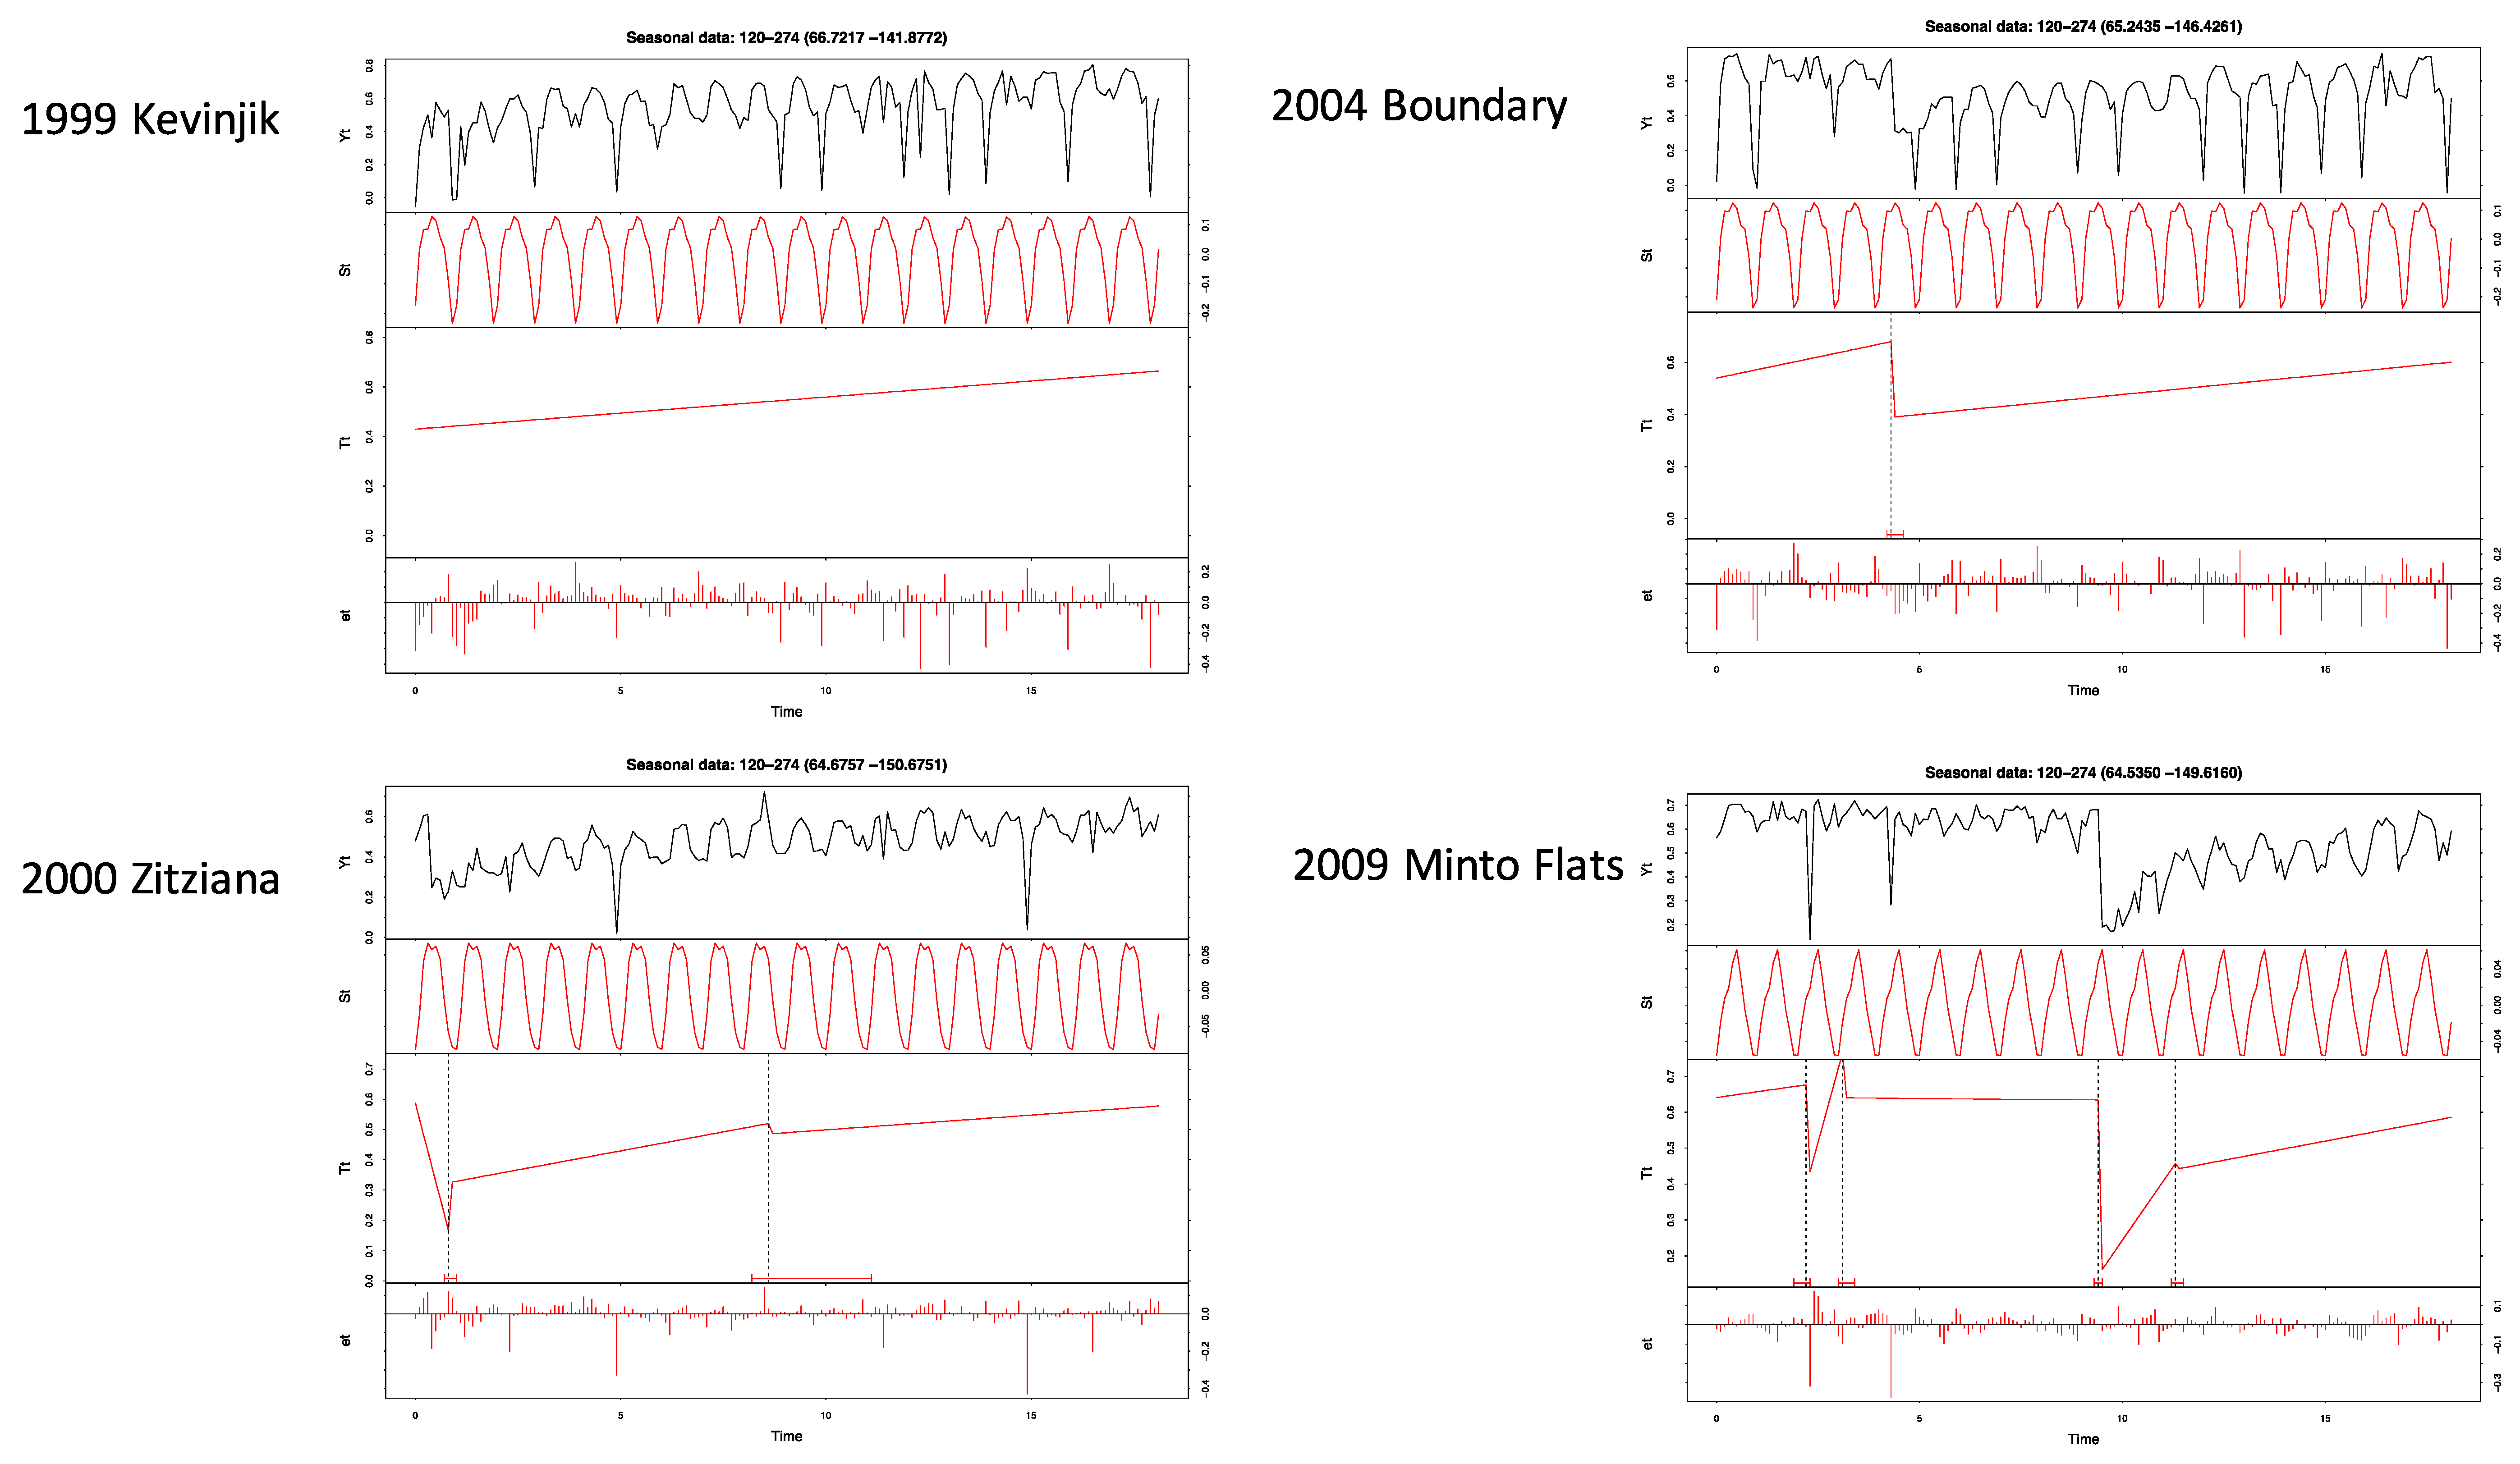
3.1. Wetland NDVI Changes within Large Wildfires 1999–2009

Based on yearly MTBS RdNBR map collections, the names and locations of the largest contiguous wetland area that burned at high severity in Alaska were determined for each year since 2000. Four of the largest wildfires were selected (Figure 2) to generate examples of post-fire NDVI time series analysis results using BFAST.
The complete MODIS 16-day NDVI record was plotted for these wetland-dominated pixels from 2000 to 2017, starting with the 102,385 ha 1999 Kevinjik Fire (Figure 3a). Two HBS wetland cover locations were plotted for each large wildfire, and the time series showed that the recovery of NDVI seasonal profiles following this 1999 fire was gradual and relatively stable by about the year 2012. Comparing the HBS wetland vegetation profiles following the 67,987 ha Zitziana Fire from the year 2000, NDVI recovery appeared to be even more rapid (than for the Kevinjik Fire) and became relatively stable by about the year 2007.
The largest contiguous wetland areas that had burned at high severity within the 217,720 ha Boundary Fire of 2004 recovered to near pre-fire NDVI profile levels by 2014 (Figure 3b visual assessment), whereas the largest contiguous wetland areas that had burned at high severity within the 212,050 ha Minto Flats Fire in 2009 had yet to fully recover to pre-fire NDVI profile levels by 2017. It was noteworthy that the change that can be visually detected in seasonal NDVI profiles before and after the Minto Flats Fire may be indicative of a shift from the longer (broader) green-season evergreen (conifer forest) profile to a mixed deciduous (birch, alder, willow) shrub and herbaceous cover profile.
The BFAST results for these four large fires for wetland-dominated MODIS pixels showed significant (p < 0.01) downward breakpoint shifts in NDVI (Table 1 and Figure 4) during the MTBS-document years of the most severe burning (2001, 2004, and 2009) detected in the Landsat NBR records. As expected, the BFAST results for the selected pixel location of the 1999 Kevinjik fire showed no breakpoints, but instead a showed strong upward slope in the de-seasonalized NDVI values for the years following 2000. The significant wildfire-related breakpoints detected for the Zitziana, Boundary, and Minto Flats wetland fire areas were commonly followed by one to two years of relatively rapid recovery of NDVI, and then by about five years of relatively slower NDVI recovery (Figure 4).
To expand the BFAST results to a regional level for interior Alaska, breakpoint analysis was applied to a total of 3200 wetland locations (mapped at 200-m resolution) that were recorded as burned at high severity by large wildfires [19] between 2001–2015 within the following Yukon River drainage sub-basins: Yukon Flats, Ramparts, Lower Tanana River, and the Klatsuta River (USGS Level 8 Hydrologic Units, [26], as shown in Figure 2). Results showed that at least one breakpoint was detected by BFAST analysis in the MODIS NDVI time series at 85% of these HBS wetland locations in interior Alaska. The distribution of dates (binned by year) of burning from Landsat HBS mapping [19] at these wetland locations closely matched the distribution of dates of breakpoints from the MODIS NDVI time series BFAST analysis, with the exception of 2015, for which BFAST did not detect the highest number of breakpoints (Figure 5).
The histogram of the BFAST 18-year trend results of MODIS NDVI for 3200 wetland locations that were recorded as having burned at high severity between 2001–2015 within the Yukon River drainage basins (detected with at least one breakpoint) showed a strong skewness (2.8) and the predominance of positive greening trends that reflect regrowth from disturbance (Figure 6). For comparison, the BFAST results for 1000 wetland locations in the Upper Yukon Flats sub-drainage basin that had not been burned by large wildfires between the years 2001–2015 [19] showed the opposite frequency distribution to Figure 6, with a strong negative skewness (−3.0) in slope values and almost no positive NDVI slope values greater than 100 units per year.

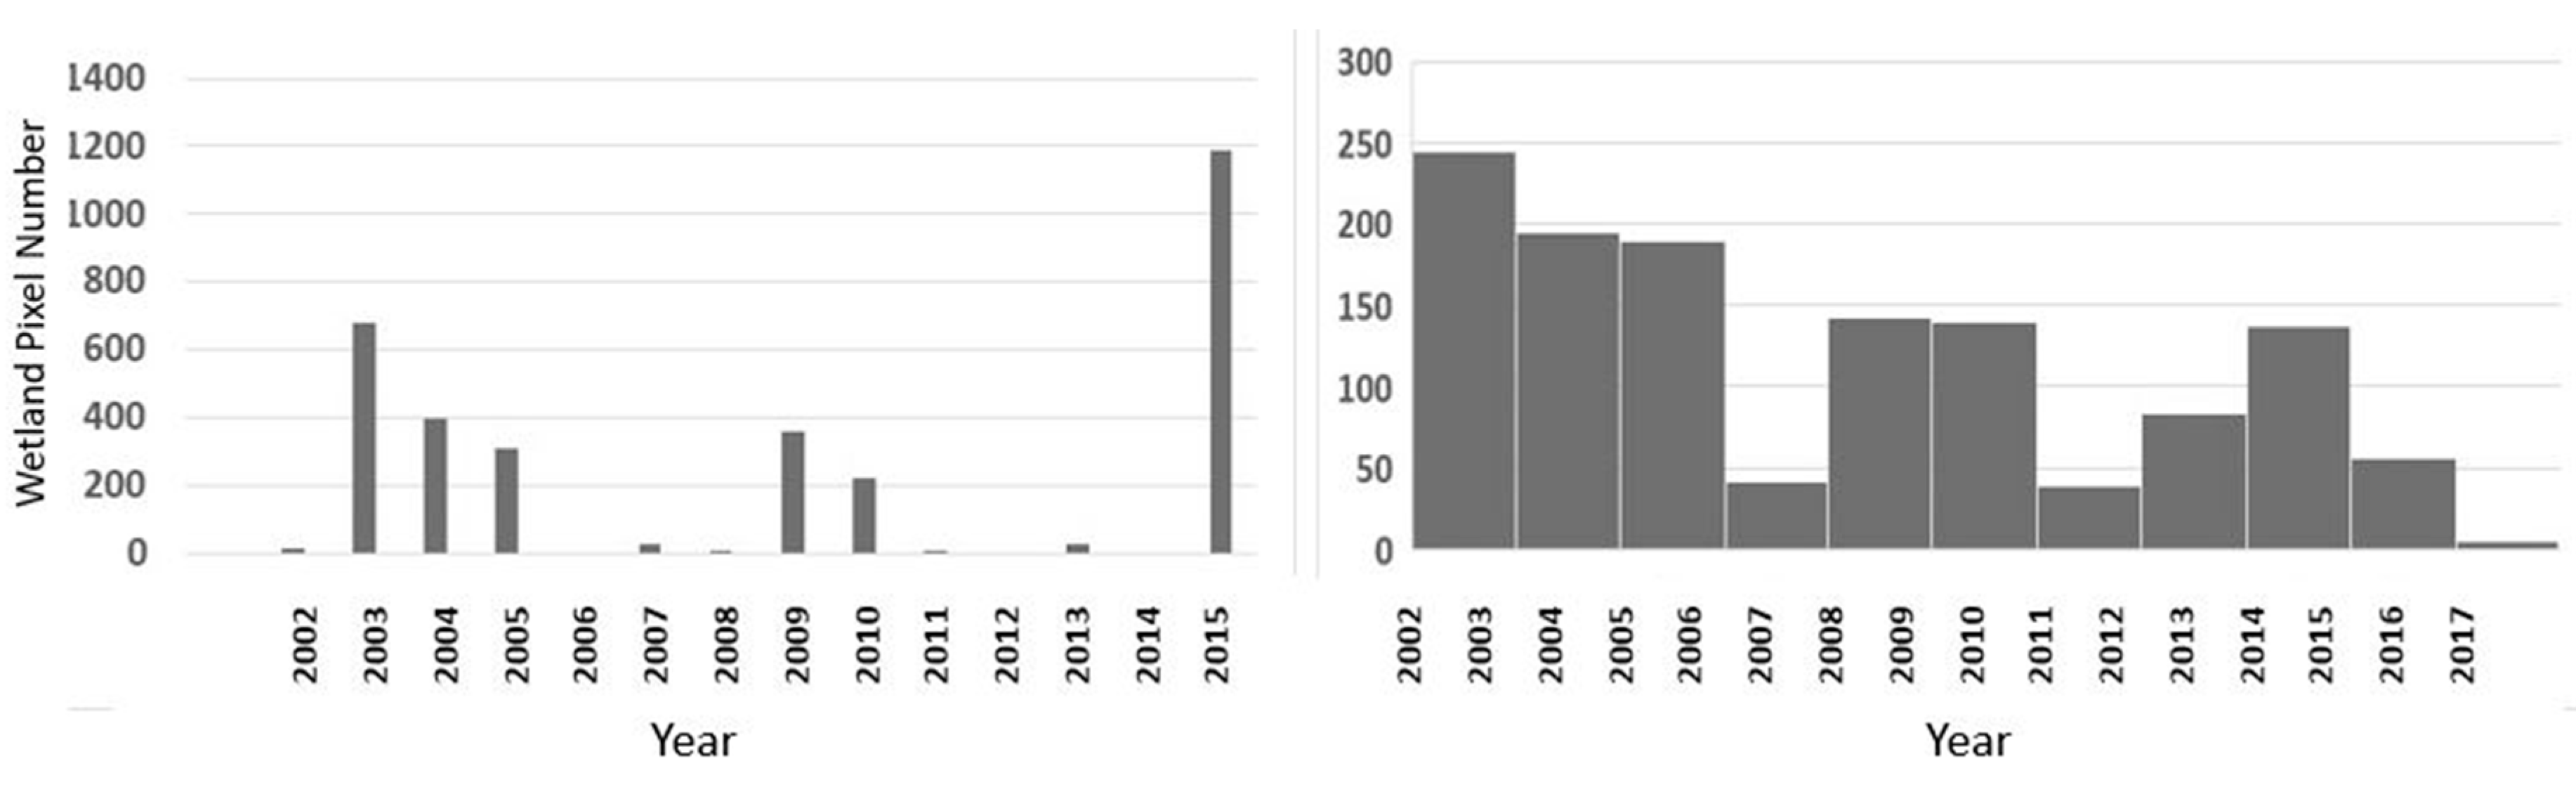
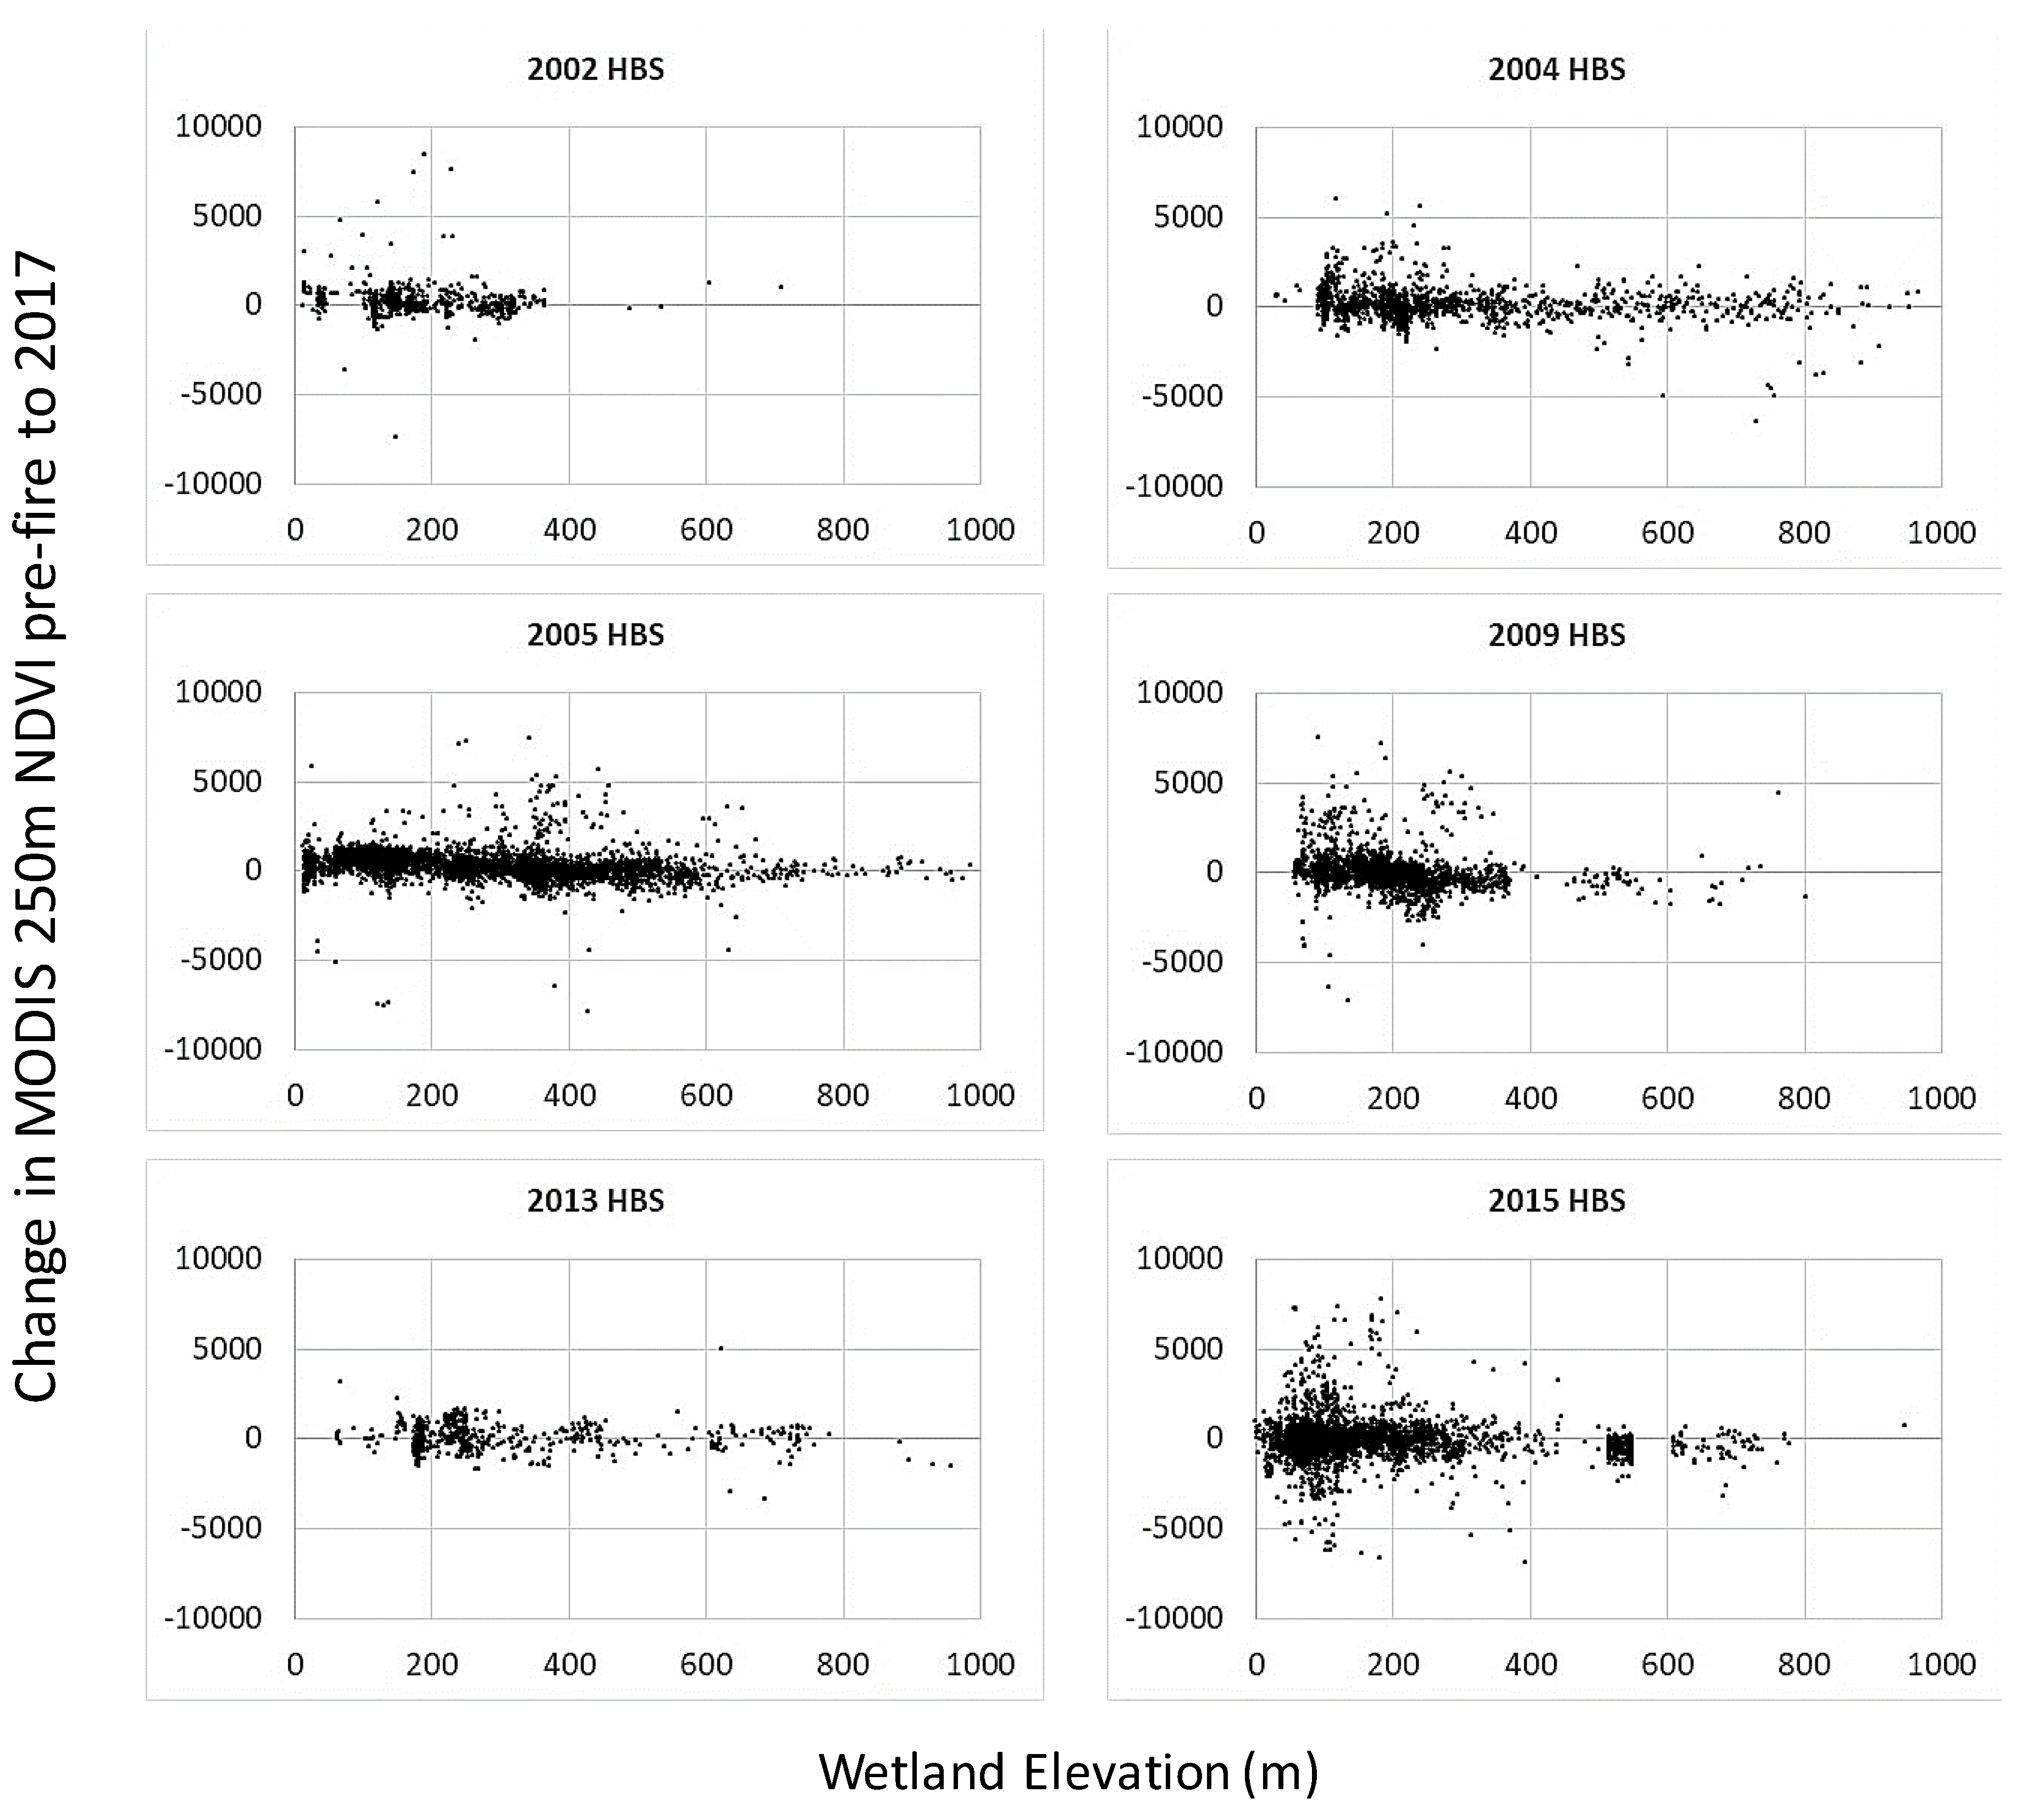
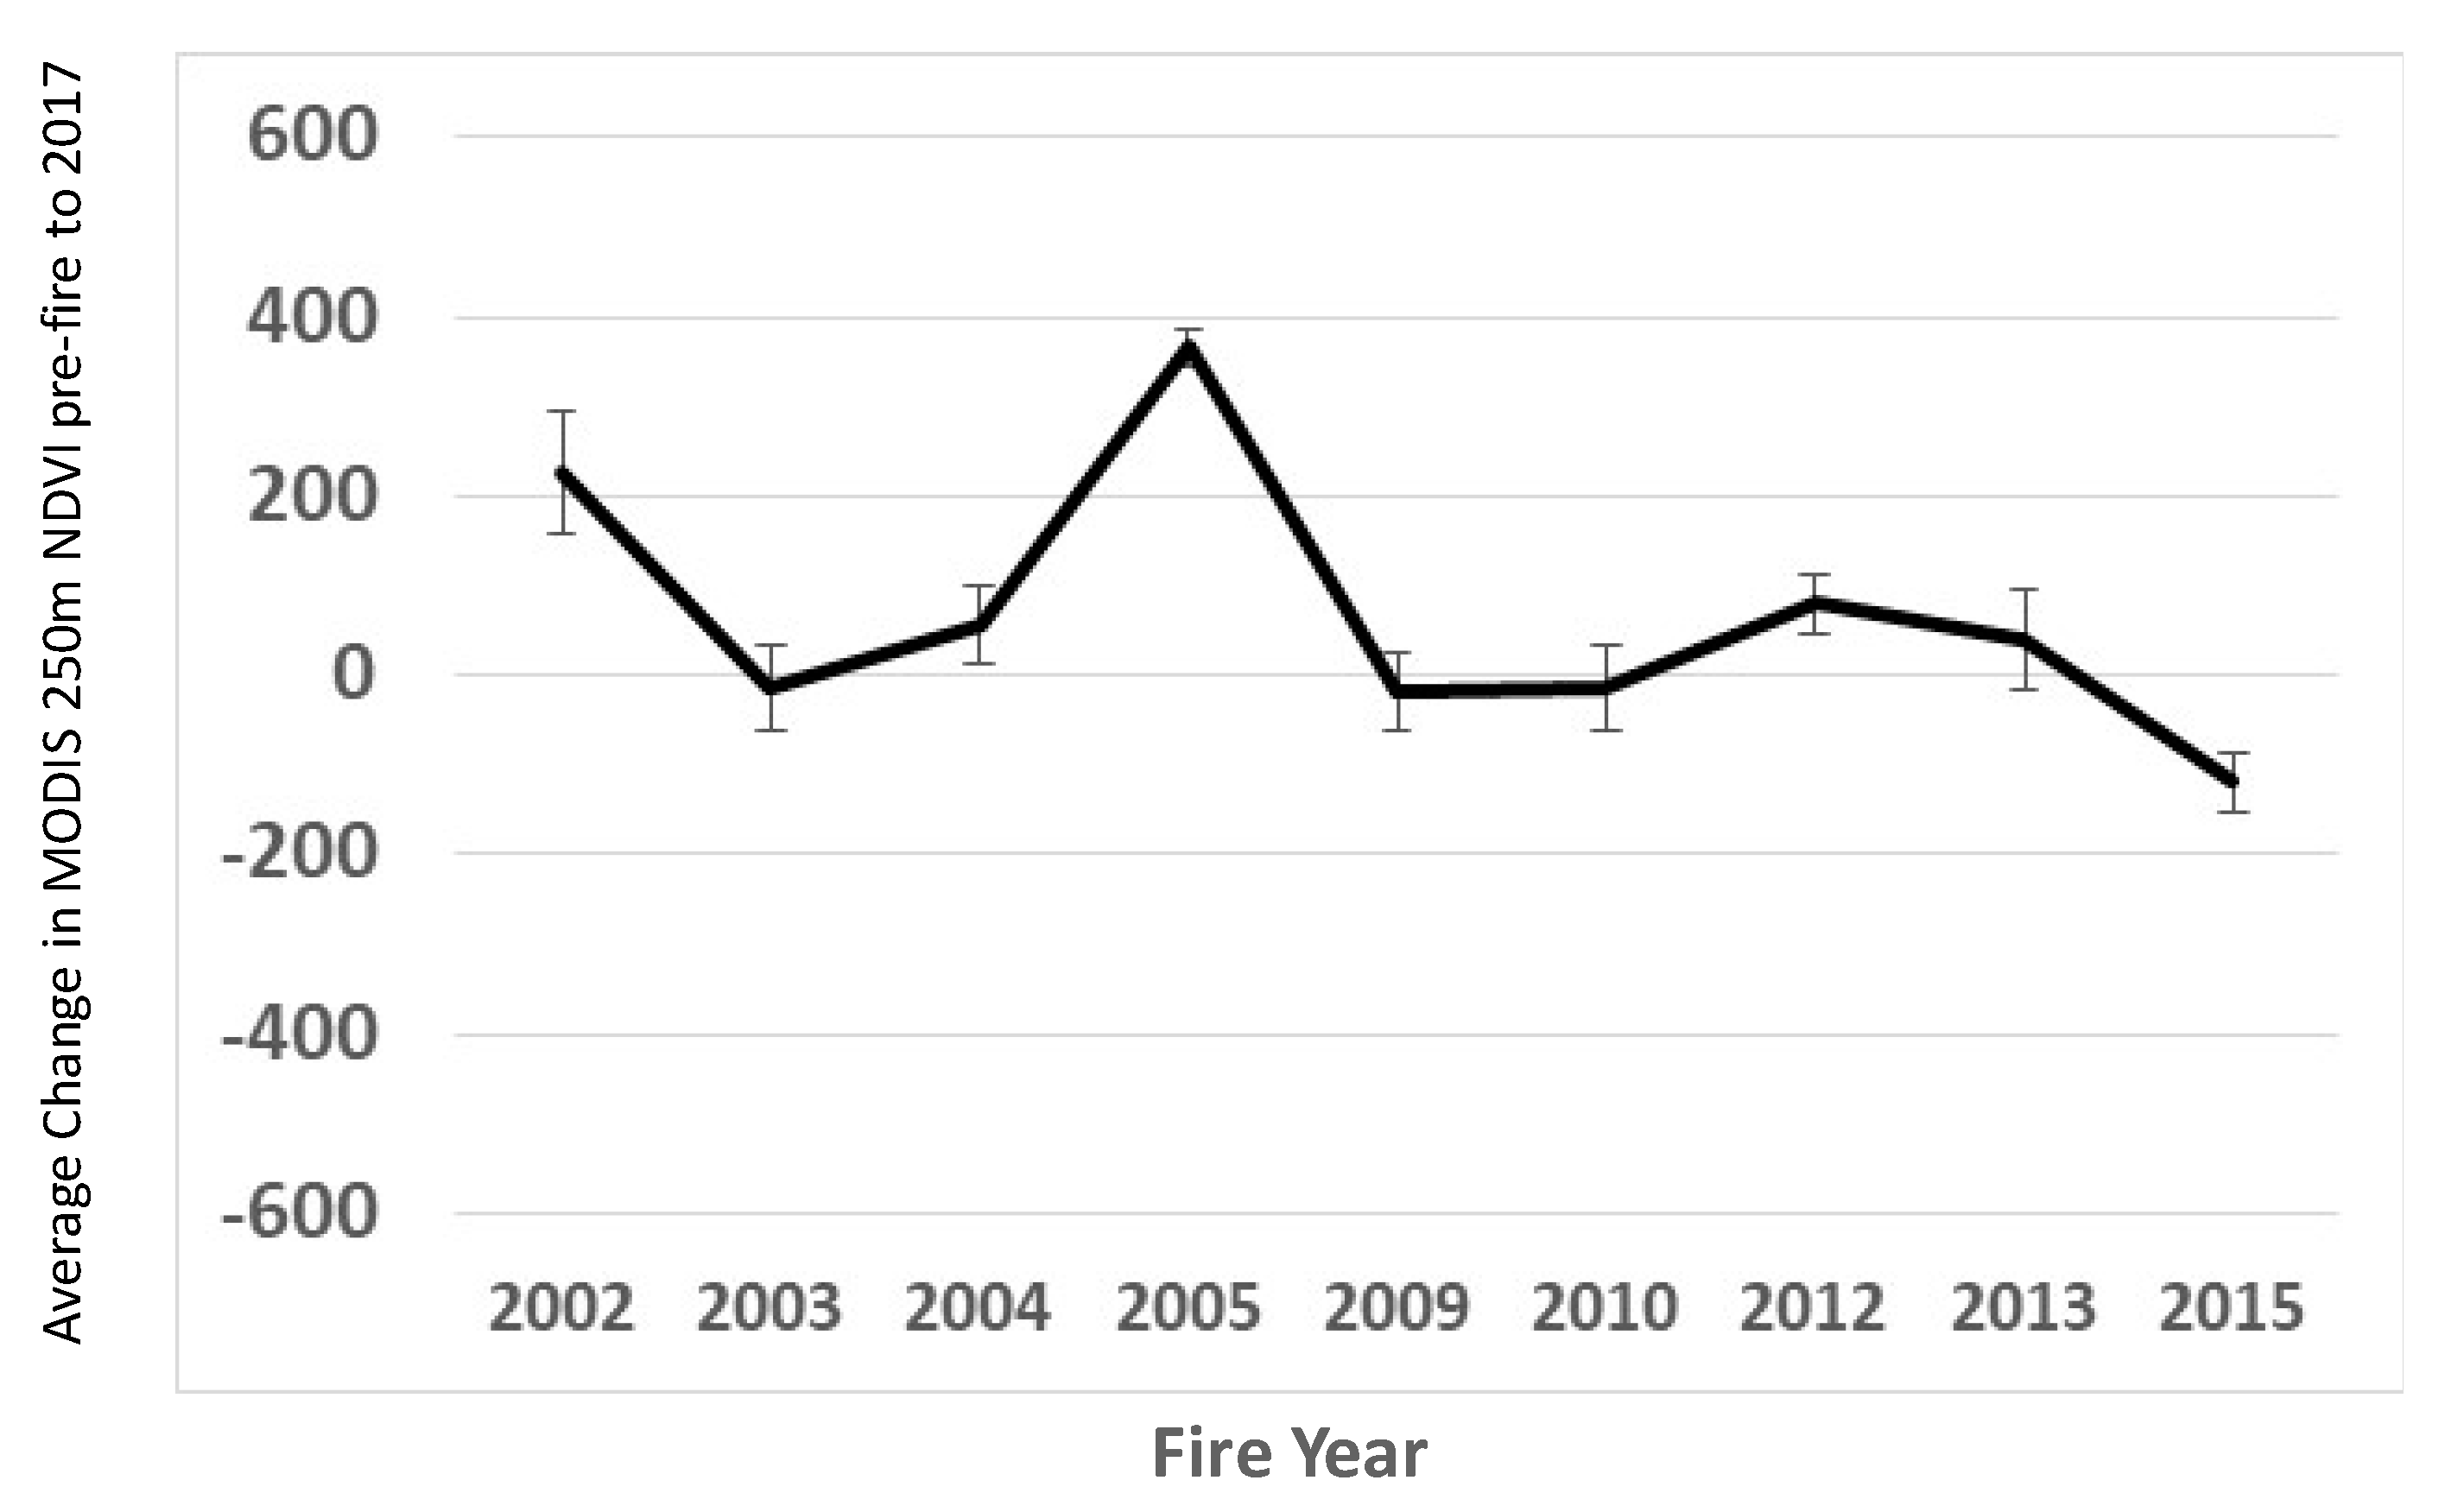
3.2. Statewide Wetland NDVI Change for HBS Areas 2000–2015

For standardized comparisons, “pre-fire” MODIS NDVI values were all derived from the Julian day 177 NDVI from the year before the fire date for change detection. The resulting plots of the NDVI change (pre-fire to post-fire summer of 2017, both on Julian day 177) for years when the total HBS wetland areas were greater than 2000 ha, statewide, showed that the fraction of negative change in the NDVI (lower greenness in 2017 than pre-fire and incomplete greenness recovery) increased markedly after the 2013 wildfires (Figure 7). In years prior to 2013, the NDVI change tended to be positive (higher greenness in 2017 than pre-fire) at HBS wetland elevations lower than 400 m, whereas higher elevation HBS wetland locations showed relatively few positive greenness recovery changes by 2017.
The selection of the NDVI from the summer of 2017 as the post-fire comparison year made the change in greenness comparisons consistent among all of the previous years of recorded wetland wildfires. According the long-term weather station records from Fairbanks (available at w1.weather.gov/obhistory/PAFA.html), 2017 had a total of 40.6 cm of precipitation, compared to the average annual total of 29.7 cm since 1999. The mean annual temperature in 2017 was recorded in Fairbanks as 29.5 °C versus the annual average of 28.1 °C since the year 1999. Therefore, 2017 would not have been a particularly dry year with poor growing conditions for these post-fire NDVI computations.
The year (since 2000) that was calculated with the highest area of HBS wetland vegetation loss was 2005 with 20,700 ha, followed by 2015 with 16,540 ha, 2009 with 9280 ha, and 2004 with 6460 ha of wetland vegetation consumed by wildfire across the state of Alaska. The average change in NDVI from pre-fire levels to post-fire (2017) levels, along with the within-year variability, that was estimated across these acreages showed that severely burned Alaska wetlands from the years 2002 and 2005 have had a significant (t-test, p < 0.05) positive recovery of green vegetation cover since wildfire. For all of the other years before 2014, the average wetland change in NDVI since wildfire was not different from zero, indicating a full recovery of green vegetation cover by 2017. On the other hand, severely burned wetlands from the year 2015 still had a significantly (p < 0.05) lower average level of green vegetation cover than was estimated from the years before the wildfires (Figure 8).

4. Discussion

The principal findings of this study were that wetland cover locations across Alaska that burned at high severity subsequently recovered their green cover seasonal profiles to relatively stable pre-fire levels in less than a decade. The large wetland fires in Alaska from 2013 to 2016 showed an incomplete greenness recovery compared to earlier fires. In the years prior to 2013, the NDVI change tended to be positive at HBS wetland elevations lower than 400 m, whereas higher elevation HBS wetland locations showed much weaker greenness recovery changes by 2017. This elevation threshold of 400 m for positive post-fire NDVI recovery is not obviously related to any known topoecological changes for high-latitude wetlands, which is a new finding that merits more field research to understand this remote sensing observation. By all accounts, this is the first statewide or regional study of wetland burning and greenness recovery for Alaska that has been published, making comparisons to previous published results of a similar nature unattainable.
Nonetheless, the outcomes of recovery and regrowth pathways after high severity burning over the next few decades will be of significant consequence to the local community members in Alaska who have depended on wetland ecosystems for subsistence hunting and trapping. In and around mesic soil locations, the deep surface organic material of low bulk density in evergreen tree stands generally precludes deciduous boreal species from establishing seedlings [10].
However, relatively thin post-fire organic layer depths, such as those measured by Potter [9] in field surveys in the Tanana Area fires of 2015, may cause notable alterations in the successional outcomes of severely burned ecosystems, including a shift from the conifer-dominated thick organic layer to an increase in the dominance of deciduous or shrub species [10,26]. Barrett et al. [27] reported that the areas with less than 3 cm of surface organic layer depth after boreal forest fires will be susceptible to deciduous-dominated regeneration, whereas areas with 3–10 cm of organic layer depth will be susceptible to co-dominant regeneration by both coniferous and deciduous trees.
The aboveground biomass levels in the tundra wetlands of Alaska have been positively correlated with NDVI, and with elevated ecosystem carbon (CO2) fluxes, including net ecosystem production and ecosystem respiration [3]. Anywhere that most of the live vegetation is consumed by intense wildfire, nutrients can be mobilized, surface water temperature can become elevated, and soil erosion may increase [1]. The recovery of wetland vegetation production and live green foliage cover after wildfires can help stabilize hydrological and thermal regimes, promote biodiversity, and reduce the seepage of dissolved nutrients to adjacent fluvial systems [28].
In previously published studies of satellite greenness (NDVI) in Alaska using the BFAST method, Forkel et al. [29] found the region to be of special interest for the analysis of trend change detection, because of greening NDVI trends in the tundra ecosystems of the North Slope as well as browning trends in the interior boreal forests. These authors reported that most of the breakpoints in NDVI time series coincided with large wildfire events. As in the present study of wetland NDVI trends and wildfire, BFAST methods detected stronger greening and browning trends if snow-affected values were excluded from the analysis or when only peak seasonal NDVI values were used. Breakpoints with abrupt changes, i.e., higher magnitudes, were detected more frequently than were breakpoints with gradual changes, i.e., low magnitudes.
Forkel et al. [29] further reported that downward (browning) trends in the NDVI between 20–30 years long occurred in some of the boreal regions of central Alaska and in southwestern Alaska, usually with uncertainties of up to four years. The detection of breakpoints in the NDVI time series in 2004 agreed with the spatial distribution of Landsat-mapped large wildfires and other field-based observations. Seasonal NDVI patterns suggested that the conifer forests that burned in 2004 tended to be replaced by broad-leaved shrubs (dwarf birch and aspen) and grasses during post-fire recovery years, which resulted in a structural change in the NDVI time series.
The region-wide BFAST analysis results from the present study similarly indicated that significant structural change (in the form of breakpoints) could be detected in the 250-m NDVI time series for the vast majority of wetland locations in the major Yukon river drainages of interior Alaska that had burned at high severity since the year 2001. The lower-than-expected number of breakpoints in the MODIS NDVI time series detected by BFAST in 2015 may be explained by (1) there being fewer dates in 2016 and 2017 to compare to pre-2015 NDVI levels than for other fire years, and (2) the presence of fires prior to 2015 at the same wetland location, which would have depressed NDVI values in 2015 more than unburned locations. The predominance of positive overall slopes in the NDVI time series of wetlands with breakpoints indicated rates of vegetation recovery that are typically in the range of 40 to 200 NDVI units per year (scaled from 0–1 by a factor or 10,000).

5. Conclusions

Breakpoint analysis was able to detect significant structural change and increasing yearly slopes (since fire) in the 250-m NDVI time series for most of the wetland locations in interior Alaska that had burned at high severity since the year 2001. The results from this study of greenness recovery in Alaska wetlands following high severity burns support the supposition that vegetation cover density in these ecosystems, albeit possibly with a higher fraction of annual herbaceous cover than was present before the fire, will make a nearly complete recovery within 10 years, and often within five years post-fire. A corollary hypothesis worth testing in future field and remote sensing studies is that relatively low-elevation wetlands are not as susceptible to drying and warming trends in the Arctic and boreal regions as are upland forest and tundra shrublands, and therefore wetlands on the whole will recover aboveground biomass more rapidly than non-wetlands over the same period of climate change.

Funding

This research received no external funding.

Acknowledgments

This work was supported by NASA Ames Research Center and the NASA ABoVE Logistics Office in Fairbanks, Alaska.

Conflicts of Interest

The author declares no conflict of interest.

References

  1. Bixby, R.J.; Cooper, S.D.; Gresswell, R.E.; Brown, L.E.; Clifford, D.N.; Dwire, K.A. Fire effects on aquatic ecosystems: An assessment of the current state of the science. Freshw. Sci. 2015, 34, 1340–1350. [Google Scholar] [CrossRef]
  2. Richardson, C.J. The Everglades: North America’s subtropical wetland. Wetl. Ecol. Manag. 2010, 18, 517–542. [Google Scholar] [CrossRef]
  3. Boelman, N.T.; Stieglitz, M.; Rueth, H.M.; Sommerkorn, M.; Griffin, K.L.; Shaver, G.; Gamon, J. Response of NDVI, biomass, and ecosystem gas exchange to long-term warming and fertilization in wet sedge tundra. Oecologia 2003, 135, 414–421. [Google Scholar] [CrossRef] [PubMed]
  4. Epting, J.; Verbyla, D.L. Landscape level interactions of pre-fire vegetation, burn severity, and post-fire vegetation over a 16-year period in interior Alaska. Can. J. For. Res. 2005, 35, 1367–1377. [Google Scholar] [CrossRef]
  5. Goetz, S.J.; Bunn, A.G.; Fiske, G.J.; Houghton, R.A. Satellite observed photosynthetic trends across boreal North America associated with climate and fire disturbance. Proc. Natl. Acad. Sci. USA 2005, 103, 13521–13525. [Google Scholar] [CrossRef] [PubMed]
  6. Potter, C. Regional analysis of MODIS satellite greenness trends for ecosystems of interior Alaska. GISci. Remote Sens. 2014, 51, 390–402. [Google Scholar] [CrossRef]
  7. Potter, C.; Li, S.; Crabtree, R. Changes in Alaskan tundra ecosystems estimated from MODIS greenness trends, 2000 to 2010. J. Geophys. Remote Sens. 2013, 2, 107. [Google Scholar] [CrossRef]
  8. Kasischke, E.S.; Turetsky, M.R. Recent changes in the fire regime across the North American boreal region: Spatial and temporal patterns of burning across Canada and Alaska. Geophys. Res. Lett. 2006, 33, L09703. [Google Scholar] [CrossRef]
  9. Potter, C.S. Ecosystem carbon emissions from 2015 forest fires in interior Alaska. Carbon Balance Manag. 2018, 13, 2. [Google Scholar] [CrossRef] [PubMed]
  10. Johnstone, J.F.; Chapin, F.S.; Hollingsworth, T.N.; Mack, M.C.; Romanovsky, V.; Turetsky, M. Fire, climate change, and forest resilience in interior Alaska. Can. J. For. Res. 2010, 40, 1302–1312. [Google Scholar] [CrossRef]
  11. Kasischke, E.S.; Johnstone, J.F. Variation in postfire organic layer thickness in a black spruce forest complex in interior Alaska and its effects on soil temperature and moisture. Can. J. For. Res. 2005, 35, 2164–2177. [Google Scholar] [CrossRef]
  12. Kasischke, E.S.; Verbyla, D.L.; Rupp, T.S.; McGuire, A.D.; Murphy, K.A.; Jandt, R.; Barnes, J.L.; Hoy, E.E.; Duffy, P.A.; Calef, M.; et al. Alaska’s changing fire regime -implications for the vulnerability of its boreal forests. Can. J. For. Res. 2010, 40, 1313–1324. [Google Scholar] [CrossRef]
  13. Viereck, L. The Effects of Fire in Black Spruce Ecosystems of Alaska and Northern Canada. In The Role of Fire in Northern Circumpolar Ecosystems; Wein, R.W., MacLean, D.A., Eds.; Wiley: Chichester, UK, 1983; pp. 201–220. [Google Scholar]
  14. Jiang, Y.; Rocha, A.V.; O’Donnell, J.A.; Drysdale, J.A.; Rastetter, E.B.; Shaver, G.R.; Zhuang, Q. Contrasting soil thermal responses to fire in Alaskan tundra and boreal forest. J. Geophys. Res. Earth Surf. 2015, 120, 363–378. [Google Scholar] [CrossRef] [Green Version]
  15. Brown, D.R.N.; Jorgenson, M.T.; Kielland, K.; Verbyla, D.L.; Praka, A.; Koch, J.C. Landscape effects of wildfire on permafrost distribution in Interior Alaska derived from remote sensing. Remote Sens. 2016, 8, 654. [Google Scholar] [CrossRef]
  16. Verbesselt, J.; Hyndman, R.; Newnham, G.; Culvenor, D. Detecting Trend and Seasonal Changes in Satellite Image Time Series. Remote Sens. Environ. 2010, 114, 106–115. [Google Scholar] [CrossRef]
  17. Verbesselt, J.; Hyndman, R.; Zeileis, A.; Culvenor, D. Phenological change detection while accounting for abrupt and gradual trends in satellite image time series. Remote Sens. Environ. 2010, 114, 2970–2980. [Google Scholar] [CrossRef] [Green Version]
  18. De Jong, R.; Verbesselt, J.; Schaepman, M.E.; de Bruin, S. Trend changes in global greening and browning: Contribution of short-term trends to longer-term change. Glob. Chang. Biol. 2012, 18, 642–655. [Google Scholar] [CrossRef]
  19. Eidenshink, J.; Schwind, B.; Brewer, K.; Zhu, Z.; Quayle, B.; Howard, S. A project for monitoring trends in burn severity. Fire Ecol. Spec. Issue 2007, 3, 3–21. [Google Scholar] [CrossRef]
  20. Miller, J.D.; Thode, A.E. Quantifying burn severity in a heterogeneous landscape with a relative version of the delta Normalized Burn Ratio (dNBR). Remote Sens. Environ. 2007, 109, 66–80. [Google Scholar] [CrossRef]
  21. Didan, K.; Munoz, A.B.; Solano, R.; Huete, A. MODIS Vegetation Index User’s Guide (MOD13 Series) 2016; Version 3.00, June 2015 (Collection 6); University of Arizona, Vegetation Index and Phenology Lab: Tucson, AZ, USA, 2016. [Google Scholar]
  22. Shao, Y.; Lunetta, R.; Wheeler, B.; Iiames, J.; Campbell, J. An evaluation of time-series smoothing algorithms for land cover classifications using MODIS-NDVI multi-temporal data. Remote Sens. Environ. 2016, 174, 258–265. [Google Scholar] [CrossRef]
  23. United States Geological Survey (USGS). Digital Elevation Model 300M Grid for Alaska, from Defense Mapping Agency 3-Arc Second 1x1 Degree 1, 250,000 Scale, Digitial Elevation Models. Source Data for Digital Shaded-Relief Image of Alaska, USGS Map I-2585; U.S. Geological Survey EROS Alaska Field Office: Anchorage, AK, USA, 2016.
  24. Selkowitz, D.J.; Stehman, S.V. Thematic accuracy of the National Land Cover Database (NLCD) 2001 land cover for Alaska. Remote Sens. Environ. 2011, 115, 1401–1407. [Google Scholar] [CrossRef]
  25. Kleiber, C.; Hornik, K.; Leisch, F.; Zeileis, A. Strucchange: An R package for testing for structural change in linear regression models. J. Stat. Softw. 2002, 7, 1–38. [Google Scholar]
  26. Seaber, P.R.; Kapinos, F.P.; Knapp, G.L. Hydrologic Unit Maps: U.S. Geological Survey Water-Supply Paper 2294; US Geological Survey: Denver, CO, USA, 1987; p. 63.
  27. Barrett, K.; McGuire, A.D.; Hoy, E.E.; Kasischke, E.S. Potential shifts in dominant forest cover in interior Alaska driven by variations in fire severity. Ecol. Appl. 2011, 21, 2380–2396. [Google Scholar] [CrossRef] [PubMed]
  28. Hood, E.; Fellman, J.; Spencer, R.; Hermes, P.; Edwards, R.; D’Amore, D.; Scott, S. Glaciers as a source of ancient and labile organic matter to the marine environment. Nature 2009, 462, 1044. [Google Scholar] [CrossRef] [PubMed]
  29. Forkel, M.; Carvalhais, N.; Verbesselt, J.; Mahecha, M.D.; Neigh, C.S.; Reichstein, M. Trend change detection in NDVI time series: Effects of inter-annual variability and methodology. Remote Sens. 2013, 5, 2113–2144. [Google Scholar] [CrossRef]
Figure 1. Alaska wetland cover (blue pixels) at 200-m resolution derived from the 2011 National Land Cover Dataset (NLCD) map.
Remotesensing 10 01456 g001
Figure 2. Wildfire boundaries (as gray outlines) mapped by the Monitoring Trends in Burn Severity (MTBS) project for interior Alaska in from 2000 to 2015, along with the locations of the largest wildfires recorded from the years 1999, 2000, 2004, and 2009. Yukon River drainage basins comprised of the Yukon Flats, Ramparts, Lower Tanana River, and the Klatsuta River sub-basins (USGS Level 8 Hydrologic Units, [26]), are delineated in shaded boundaries.
Remotesensing 10 01456 g002
Figure 3. Yearly time series plots (16-days) of 250-m resolution normalized difference vegetation index (NDVI) from Moderate Resolution Imaging Spectroradiometer (MODIS) for all of the wetland cover pixels within the four largest Alaska wildfires from the years 1999, 2000, 2004, and 2009. The latitude and longitude of each pixel center is shown.
Remotesensing 10 01456 g003
Figure 4. Breaks for Additive Seasonal and Trend (BFAST) plot outputs for large fire locations (labelled in Figure 3) between 1999–2009 covering wetland-dominated Moderate Resolution Imaging Spectroradiometer (MODIS) pixels in Alaska. Yt is the time-series MODIS NDVI value; St is the fitted seasonal component; Tt is the fitted trend component; et is the noise component [16]; statistical breakpoints (p < 0.01) are identified by vertical dashed lines. Year numbers on the horizontal axis start at 1 = 2000 and end in early 2018.
Remotesensing 10 01456 g004
Figure 5. Histograms of the years of fire dates for wetland areas that burned at high severity in interior Alaska from the MTBS Landsat [19] (left) and the BFAST analysis of the MODIS NDVI time series (right).
Remotesensing 10 01456 g005
Figure 6. Histogram of the slopes of MODIS NDVI trends for wetland areas that burned at high severity in interior Alaska between 2001–2015 from BFAST breakpoint analysis.
Remotesensing 10 01456 g006
Figure 7. Yearly plots of change in MODIS 250-m resolution wetland NDVI between pre-fire years and 2017 versus wetland elevation for years with the largest areas that burned at high severity.
Remotesensing 10 01456 g007
Figure 8. Average change in MODIS 250-m resolution wetland NDVI between pre-fire years and 2017, for all of the MTBS wildfires in Alaska greater than 2000 ha in the National Land Cover Dataset (NLCD) wetland area burned at high severity. Error bars of post-fire NDVI minus pre-fire NDVI represent two standard errors of the average change in NDVI.
Remotesensing 10 01456 g008
Table 1. BFAST results for large wildfire locations between 1999–2009 covering wetland-dominated MODIS pixels in Alaska. Breakpoint dates that corresponded to Monitoring Trends in Burn Severity (MTBS) severe burn events are shown in boldface, followed by the NDVI slope after each date. For locations with no breakpoint detected, the overall slope of the entire NDVI time series, 2000 to 2017, was listed in the second column.
Overall Slope (da−1)Breakpoint 1Breakpoint 2Breakpoint 3Breakpoint 4
Date 1Slope 1Date 2Slope 2Date 3Slope 3Date 4Slope 4
Kevinjik 19990.0012none
0.0013none
Zitziana 2000 10 June 2001−0.02112 July 20020.001
14 September 20000.00313 August 20080.001
Boundary 2004 26 June 20010.00326 June 20040.01530 September 20050.001
26 June 20040.002
Minto Flats 20090.0005none
10 June 20020.03925 May 20030.00012 July 20090.01126 June 20110.002

