


Abstract
The aim of this study is to evaluate the potential of multifrequency and Full-polarimetric Synthetic Aperture Radar (SAR) data for retrieving both Above Ground Biomass (AGB) and Leaf Area Index (LAI) in the Amazon floodplain forest environment. Two specific questions were proposed: (a) Does multifrequency SAR data perform more efficiently than single-frequency data in estimating LAI and AGB of várzea forests?; and (b) Are quad-pol SAR data more efficient than single- and dual-pol SAR data in estimating LAI and AGB of várzea forest? To answer these questions, data from different sources (TerraSAR-X Multi Look Ground Range Detected (MGD), Radarsat-2 Standard Qual-Pol, advanced land observing satellite (ALOS)/ phased-arrayed L-band SAR (PALSAR-1). Fine-beam dual (FDB) and quad Polarimetric mode) were combined in 10 different scenarios to model both LAI and AGB. A R-platform routine was implemented to automatize the selection of the best regression models. Results indicated that ALOS/PALSAR variables provided the best estimates for both LAI and AGB. Single-frequency L-band data was more efficient than multifrequency SAR. PALSAR-FDB HV-dB provided the best LAI estimates during low-water season. The best AGB estimates at high-water season were obtained by PALSAR-1 quad-polarimetric data. The top three features for estimating AGB were proportion of volumetric scattering and both the first and second dominant phase difference between trihedral and dihedral scattering, extracted from Van Zyl and Touzi decomposition, respectively. The models selected for both AGB and LAI were parsimonious. The Root Mean Squared Error (RMSEcv), relative overall RMSEcv (%) and R2 value for LAI were 0.61%, 0.55% and 13%, respectively, and for AGB, they were 74.6 t·ha−1, 0.88% and 46%, respectively. These results indicate that L-band (ALOS/PALSAR-1) has a high potential to provide quantitative and spatial information about structural forest attributes in floodplain forest environments. This potential may be extended not only with PALSAR-2 data but also to forthcoming missions (e.g., NISAR, Global Ecosystems Dynamics Investigation Lidar (GEDI), BIOMASS, Tandem-L) for promoting wall-to-wall AGB mapping with a high level of accuracy in dense tropical forest regions worldwide.
1. Introduction
The estimation and monitoring of Above Ground Biomass (AGB) and Leaf Area Index (LAI) in tropical forests is of great relevance for understanding biogeochemical cycles and the effects of climate change on forest resources. Such measurements also support international protocols such as the United Nations Reducing Emissions from Deforestation and Forest Degradation (REDD+) [1]. AGB is regarded as an important indicator in ecological studies and management of vegetation, whereas LAI is a key parameter in plant ecology.
Due to frequent cloud coverage [2], Synthetic Aperture Radar (SAR) remote sensing has been shown to be an important tool for the assessment of both LAI and AGB in tropical regions [3,4,5]. This is due to the capacity of SAR systems to both penetrate clouds and interact with vegetation canopies, with the volumetric backscattering component being a function of canopy structure. Although SAR systems are not able to retrieve the vertical structure of vegetation as easily as airborne Light Detection and Ranging (LiDAR) systems, the wide swath orbital coverage capability of SAR systems is useful for assessing large wetland ecosystems such as the floodplains along Amazonian rivers, known for their biodiversity, complexity and difficult access [6].
The applicability of SAR data to determine forest biophysical parameters depends on the number of polarizations and the frequency or wavelength used [6,7]. Most orbital SAR platforms acquire data in only single- and dual-polarization modes, thus having limited potential for discriminating subtle structural differences in the vegetation [7,8,9,10]. Quad-pol, or full-polarimetric mode, provide the complete scattering matrix of the backscattered wave, allowing the calculation of polarimetric decomposition and other polarimetric descriptors, which can potentially better describe canopy structural properties [11,12]. This has already been shown by several studies [12,13,14,15,16,17,18,19,20]. Multi-frequency SAR data can also be used as an alternative to single-frequency single- or dual-pol data. Its synergy enables discrimination of subtle vegetation types and assessment of structural properties, albeit with different degrees of success, as different frequencies interact with distinct sections of the plant canopy [15,21,22,23].
To date, provision of orbital quad-pol SAR data has been limited to experimental mode, with limited swath coverage, and/or the data are more expensive than single- and dual-pol images. Multi-frequency analysis entails acquisition of data from different orbital sensors provided by different space agencies, therefore raising project costs and computational demands and complexity. However, it is still important to assess the efficacy and feasibility of applying both multi-polarimetric and multi-frequency methods to estimate forest structural attributes. SAR literature indicates that both X- and C-band backscattering coefficient images (σ0) saturate at relatively low AGB levels (i.e., up to 50 and 250 t/ha, respectively [21,24,25,26,27,28,29]). L-band saturates at 88 to 900 t/ha [30,31,32,33,34,35,36], depending on vegetation structural complexity. In general, SAR signal saturation thresholds tend to decrease with vegetation structural complexity, especially for tropical forests. Therefore, exploring the saturation threshold and investigating the potential of polarimetric features in such environments is still necessary.
Várzeas are eutrophic river floodplains associated with large high-sediment load (“white water”) rivers in the Amazon. They occupy approximately 200,000 km2 within the Amazon basin [37], providing important ecosystem services to human populations and hosting endemic fauna and flora species, such as the Amazonian manatee (Trichechus inunguis) [38] and the Pirarucu fish (Arapaima gigas) [39]. They also have an important role in regional biogeochemical cycles, although estimates are still quite uncertain as they are one of the most under-sampled Amazon ecosystems [40,41]. Várzeas are currently threatened by anthropogenic land-use/land-cover changes [42]; approximately 54% of the original forest cover in lower Amazon várzeas was lost between 1984 and 2009 [43,44]. Therefore, developing efficient remote sensing methods for assessing structural forest attributes such as Leaf Area Index (LAI) and Above Ground Biomass (AGB) is of major importance to further ecological and biogeochemical studies in várzeas, because these attributes have noticeable relationships with ecophysiological processes such as evapotranspiration, photosynthetic activity, carbon assimilation and biomass stocks [45]. Such information may also serve as more accurate proxies for habitat structure in biodiversity studies. Quantitative data about várzea forests can also assist decision-makers, public governance and environmental policies regarding planning and conservation.
Therefore, this paper answers two questions: (a) Does multifrequency SAR data perform more efficiently than single-frequency data in estimating LAI and AGB of várzea forests?; and (b) Are quad-pol SAR data more efficient than single- and dual-pol SAR data in estimating LAI and AGB of várzea forest?
2. Materials and Methods
2.1. Study Area and Field Inventories
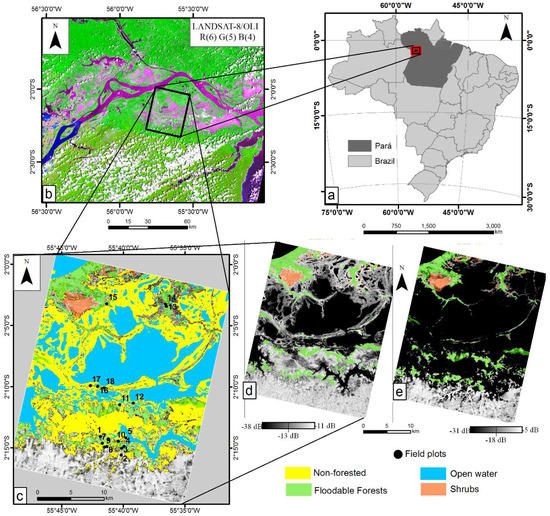
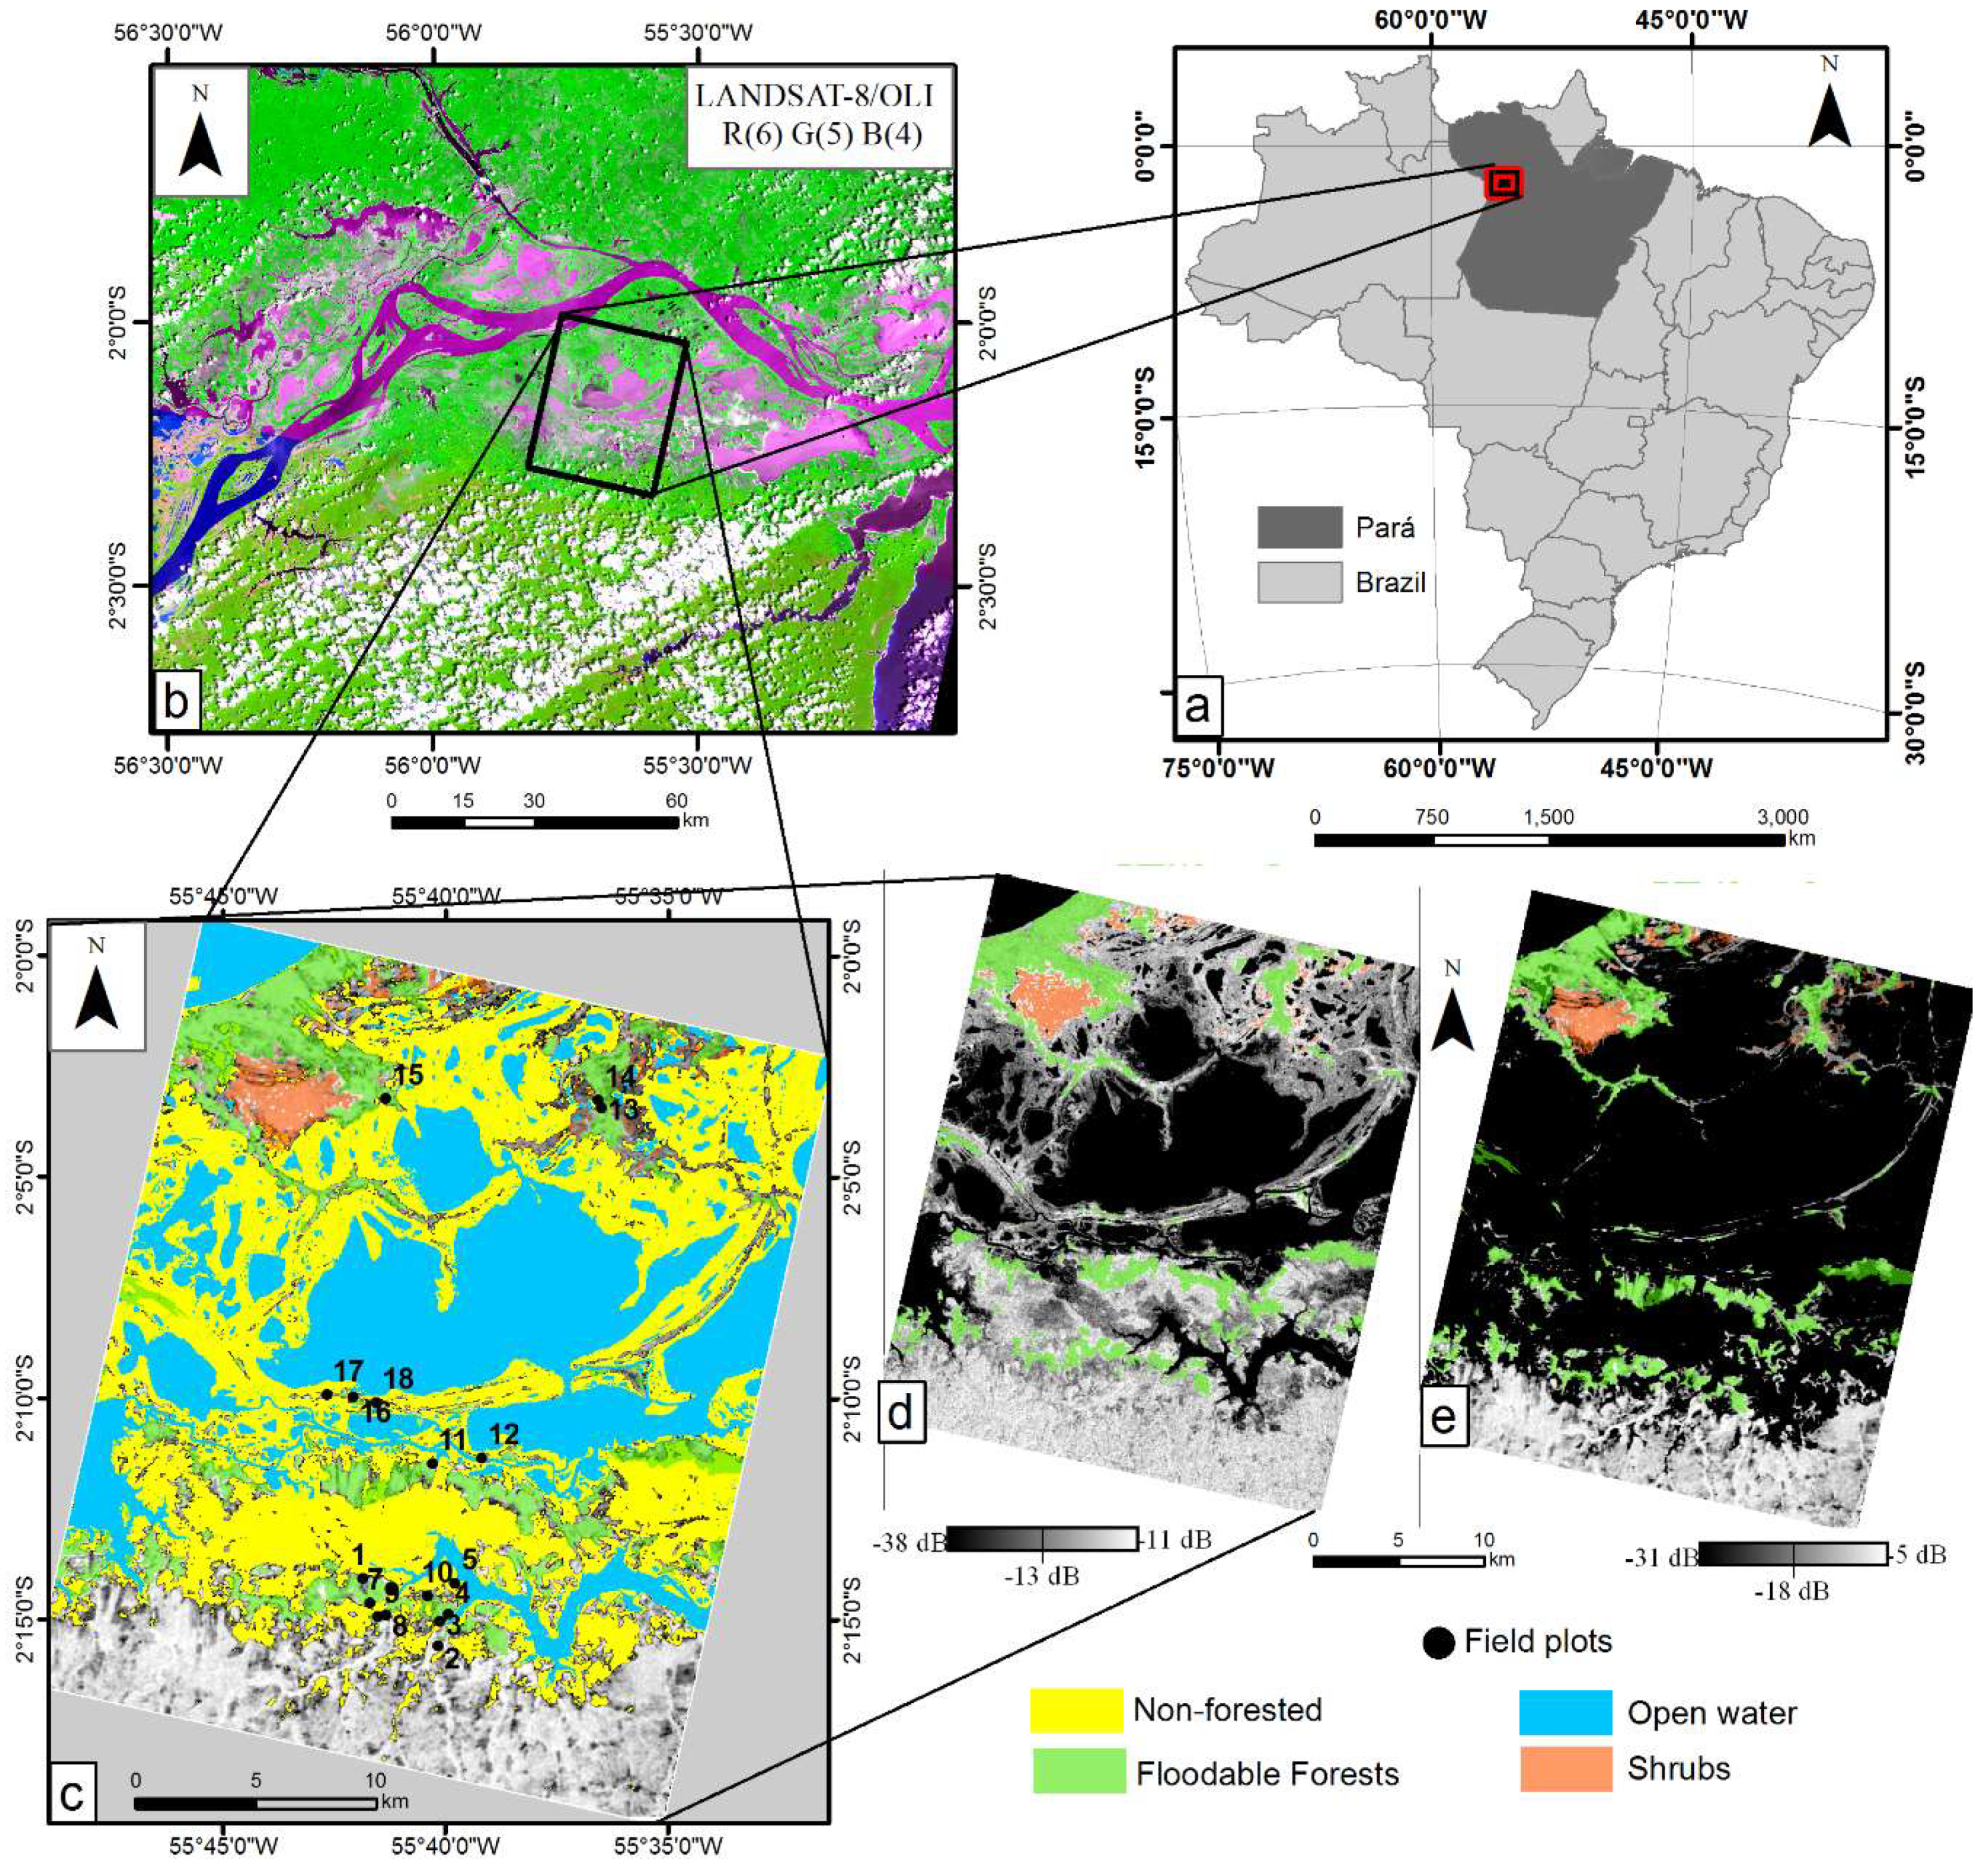
The study area is located within Pará State (Brazil) and encompasses an ~88 ha section of the Lago Grande de Curuai (Figure 1). This floodplain lake has an annual and monomodal flooding regime, with high-water season occurring between May and June, and low-water season occurring from November to December [46].
Figure 1.
(a) Location of Pará state (dark gray) within Brazil (light gray); (b) detailed view of the Lago Grande de Curuai; (c) classes and field plots location; (d) Radarsat-2 HV image in low-water season; (e) advanced land observing satellite (ALOS)/ phased-arrayed L-band Synthetic Aperture Radar (PALSAR-1) HV image in high-water season.
The vegetation comprises a mosaic of vegetation types, including grasslands, shrubs and forests, whose distribution, species composition, canopy structure and phenology are strongly linked to the seasonal flooding dynamics [40,47,48]. Specifically, the land cover in the study area comprises six major classes, previously defined and mapped using dual-season PolSAR Radarsat-2 data [8].
The Open Water class corresponds to the water surface previously mapped using C-band SAR imagery (Figure 1d) acquired during the low-water season. The water surface during the high-water season was mapped using the L-band SAR image (Figure 1e) and will be referenced here as Open Water High Season class. Therefore, the class Várzea Fields was mapped as the difference in water surface between the two periods.
In this study, floating and emergent macrophytes (Figure 1d) were merged because they are not distinguishable from each other in L-band SAR scenes [21]. As the Várzea fields correspond to the regions colonized by grasses during the low-water season, we decided to group all these classes into a new class named Non-forested. Therefore, the following classes were examined in this study: (1) Floodable Forests: forest growing on high floodplains subject to shorter seasonal flooding periods; (2) Shrubs: shrubs and/or early succession tree vegetation with sparse canopies and low height, subject to longer seasonal flooding; and (3) Non-forested: emergent and floating herbaceous plant communities dominated by palustrine grasses, with high biomass and density levels and subject to longer seasonal flooding periods, and floodplain regions that are colonized by terrestrial herbaceous plants during low-water season.
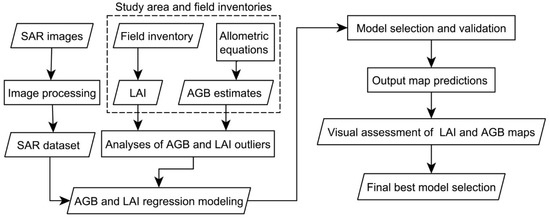
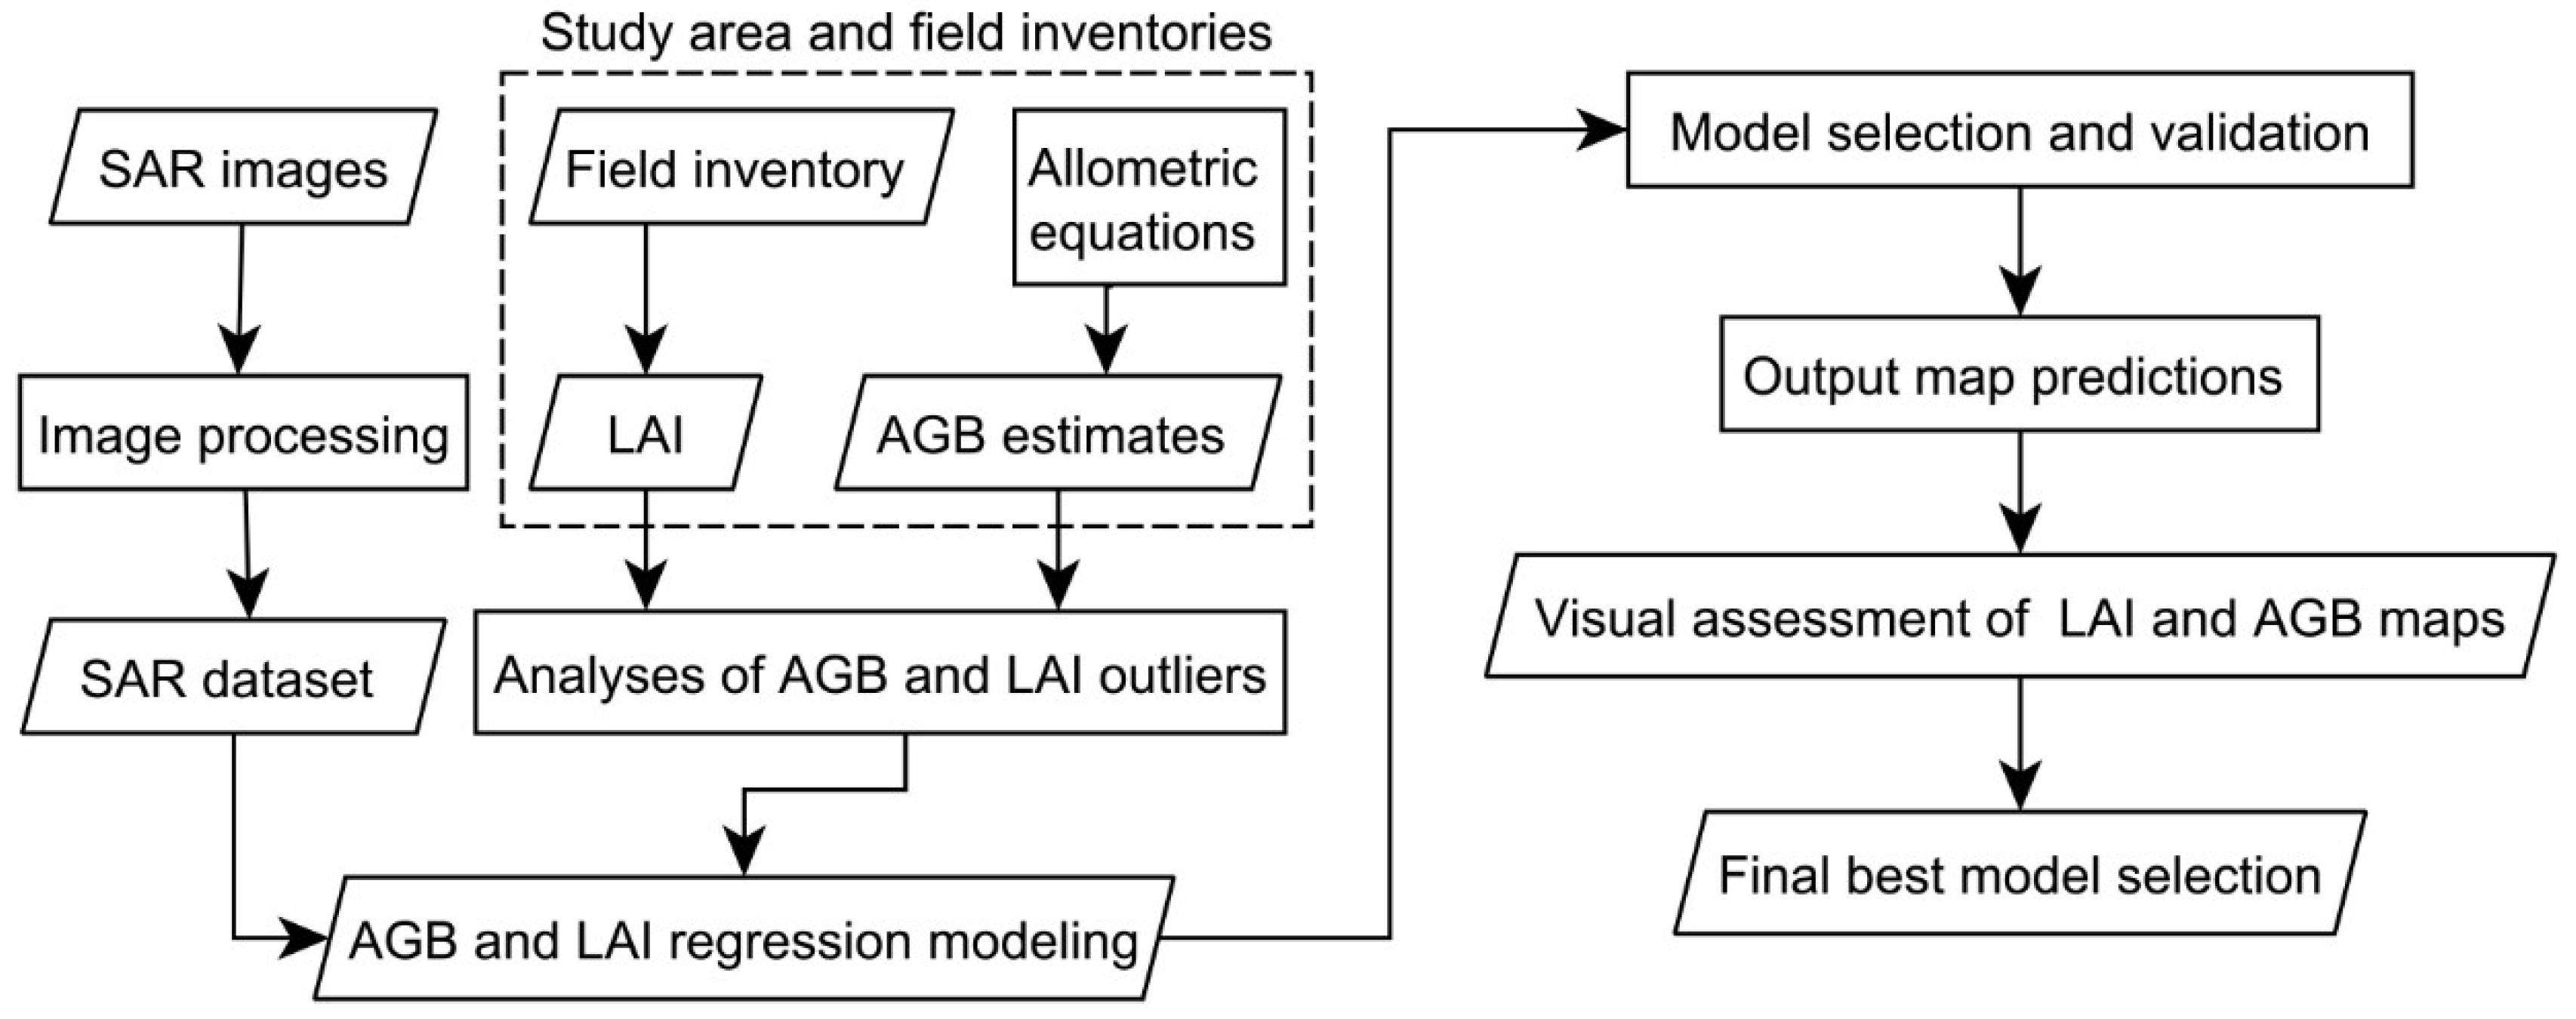
The flowchart (Figure 2) summarizes the main steps described in the following sections.
Figure 2.
Flowchart for estimating above-ground biomass and leaf area index from the SAR dataset on Amazon floodplain forests.
Forest inventories were carried out from 18 October 2013 to 29 October 2013, during the low-water season, by establishing eighteen 25 × 25 m (0.0625 ha) sample plots, distributed between Flooded Forest areas (Figure 1c). LAI was measured using an LAI-2200 Plant Canopy Analyzer (Li-Cor Inc., Lincoln, NE, USA). Eight measurements were taken within each sample plot beneath the canopy (two rows of four measurements), using a 270-degree lens cap with the closure turned towards the holder. All measurements were taken with the sun at low elevation angles, always located behind the operator, avoiding the incidence of direct light on the sensor. Clear sky reference measurements were taken before and after plot sampling, no earlier or later than 10 min from the observations, at nearby clearings.
At each sample plot, we measured the total height (h, in m) and the diameter at the breast height (DBH > 10 cm) (d, in cm) for all living tree individuals. Each single tree species was identified in the field by a trained parabotanist. Based on this identification, we compiled measurements of wood density (p, in g cm3) from Wittmann, et al. [49] and from the Global Wood Density Database—GWDD; (http://datadryad.org/handle/10255/dryad.235). Wood density of similar species within the family/genera was used whenever the species were not found in the database.
The AGB of each single tree was computed as the average AGB obtained from Equations (1)–(3), according to Schöngart and Wittmann [50] for Amazonian flooded forests.
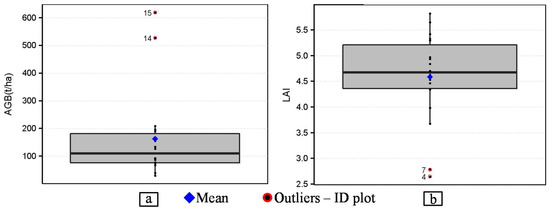
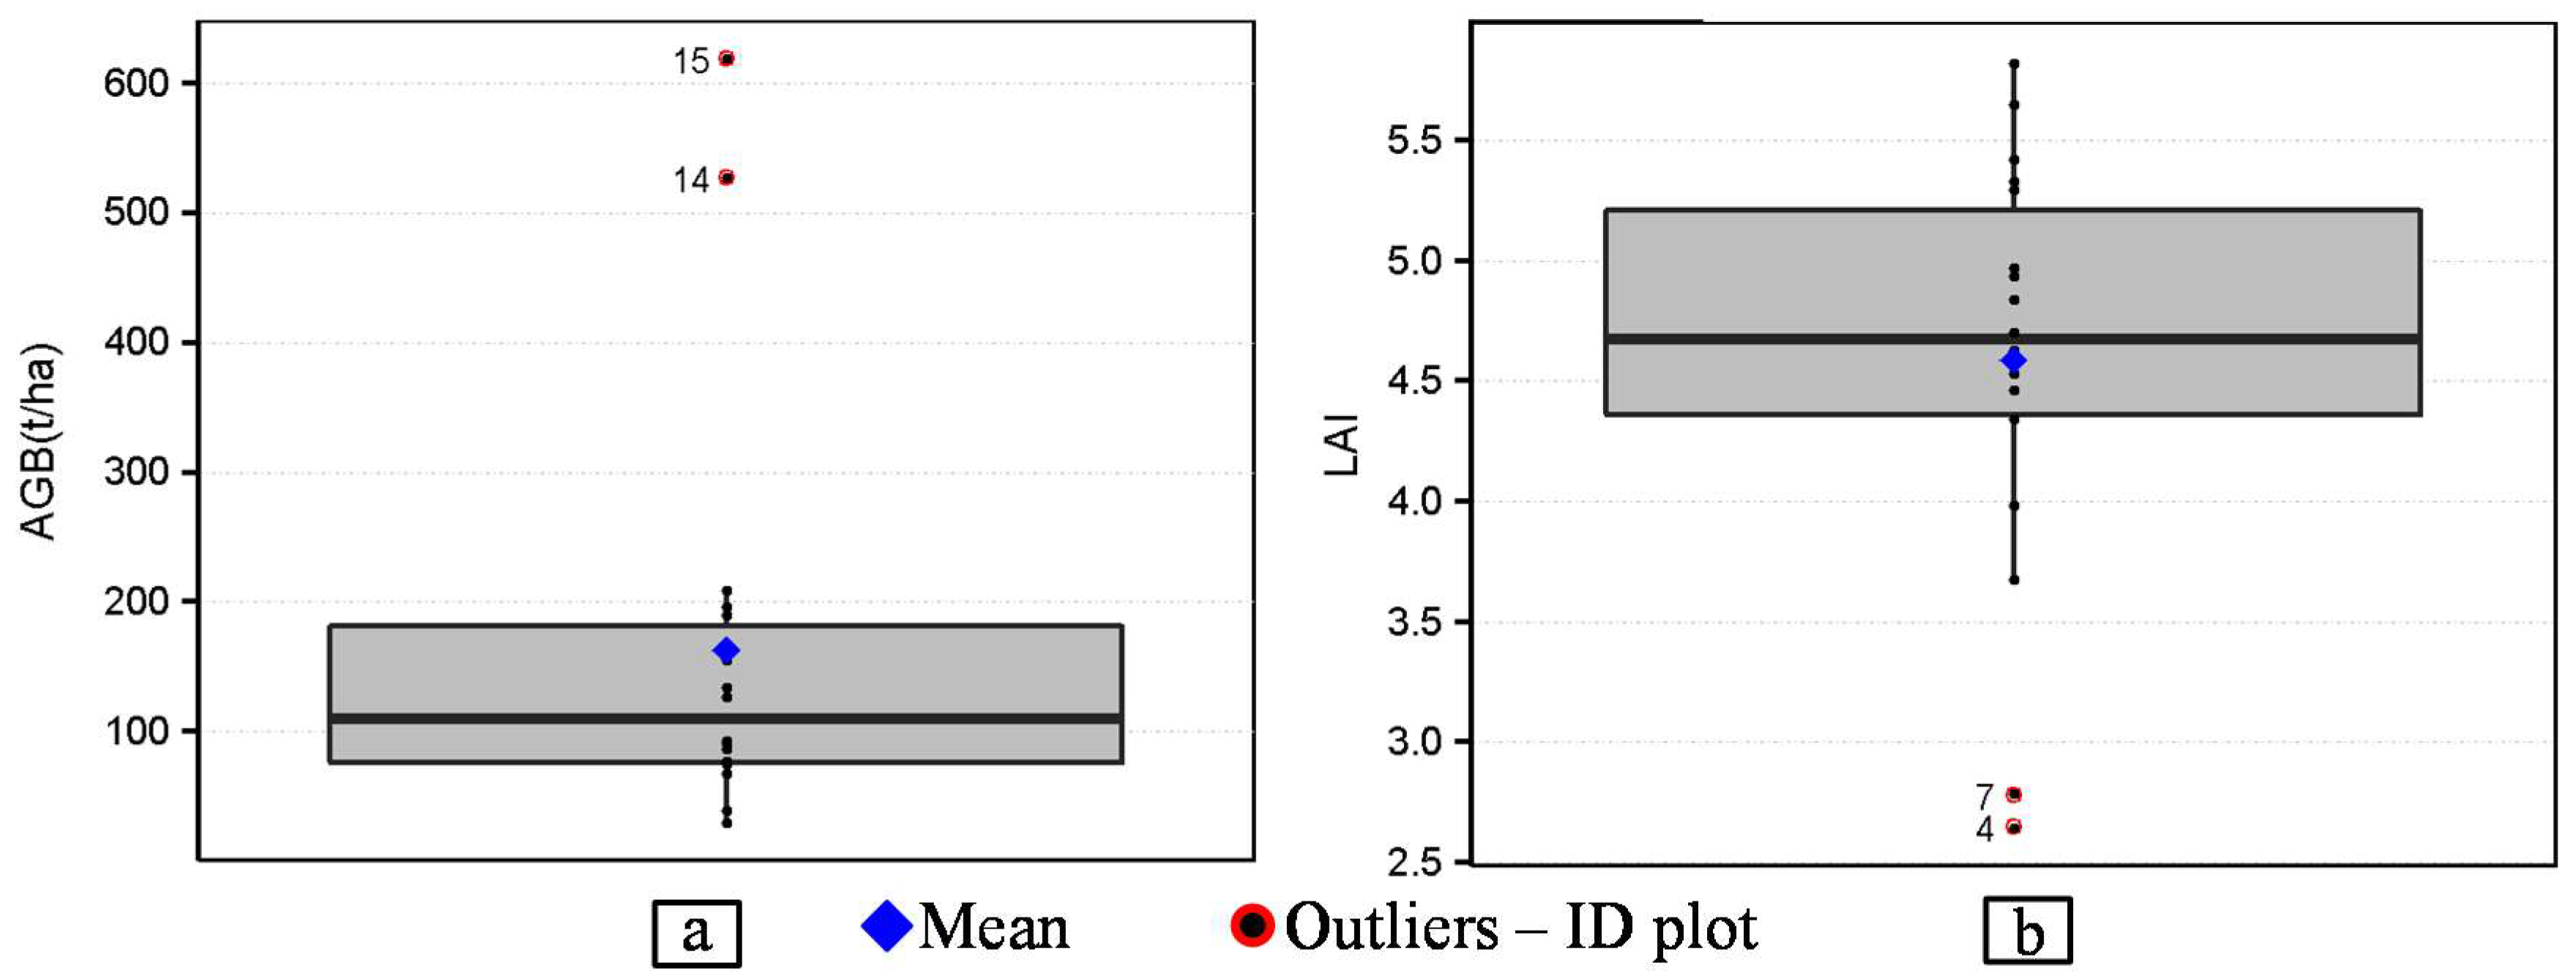
In (2), F is a fixed form factor of 0.6 [51]. The AGB of individual trees of each plot were then summed, and their values scaled to t/ha. Boxplots for both AGB and LAI helped identify possible outliers that could impact model fitting [52].
2.2. SAR Image Acquisition
SAR satellite data from three sensor platforms were acquired: advanced land observing satellite (ALOS)-phased-arrayed L-band (i.e., 1.27-GHz center frequency, ~23 cm) SAR (PALSAR-1) [53], Radarsat-2 at the C-band frequency [54], and TerraSAR-X at the X-band frequency [55]. Radarsat-2 and TerraSAR-X images were provided through the Science and Operational Applications Research (SOAR) program of the Canadian Space Agency (CSA), and PALSAR-1 scenes were provided by the ALOS Kyoto & Carbon Initiative and the ALOS PI program of the Japan Aerospace Exploration Agency (Table 1).
Table 1.
Characteristics of SAR data.
All SAR images were acquired in October (low-water season), except for the ALOS/PALSAR-1 PLR scene, which was obtained during the high-water season. This seasonal variation may influence forest backscattering signals according to vegetation structure, affecting the estimates of LAI and AGB. It must be noted that forest inventory was not concurrent with satellite overpasses. Nevertheless, most Floodplain Forest regions have remained unchanged for the past seventeen years, according to [56].
2.3. Image Processing
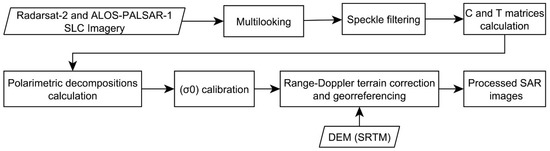
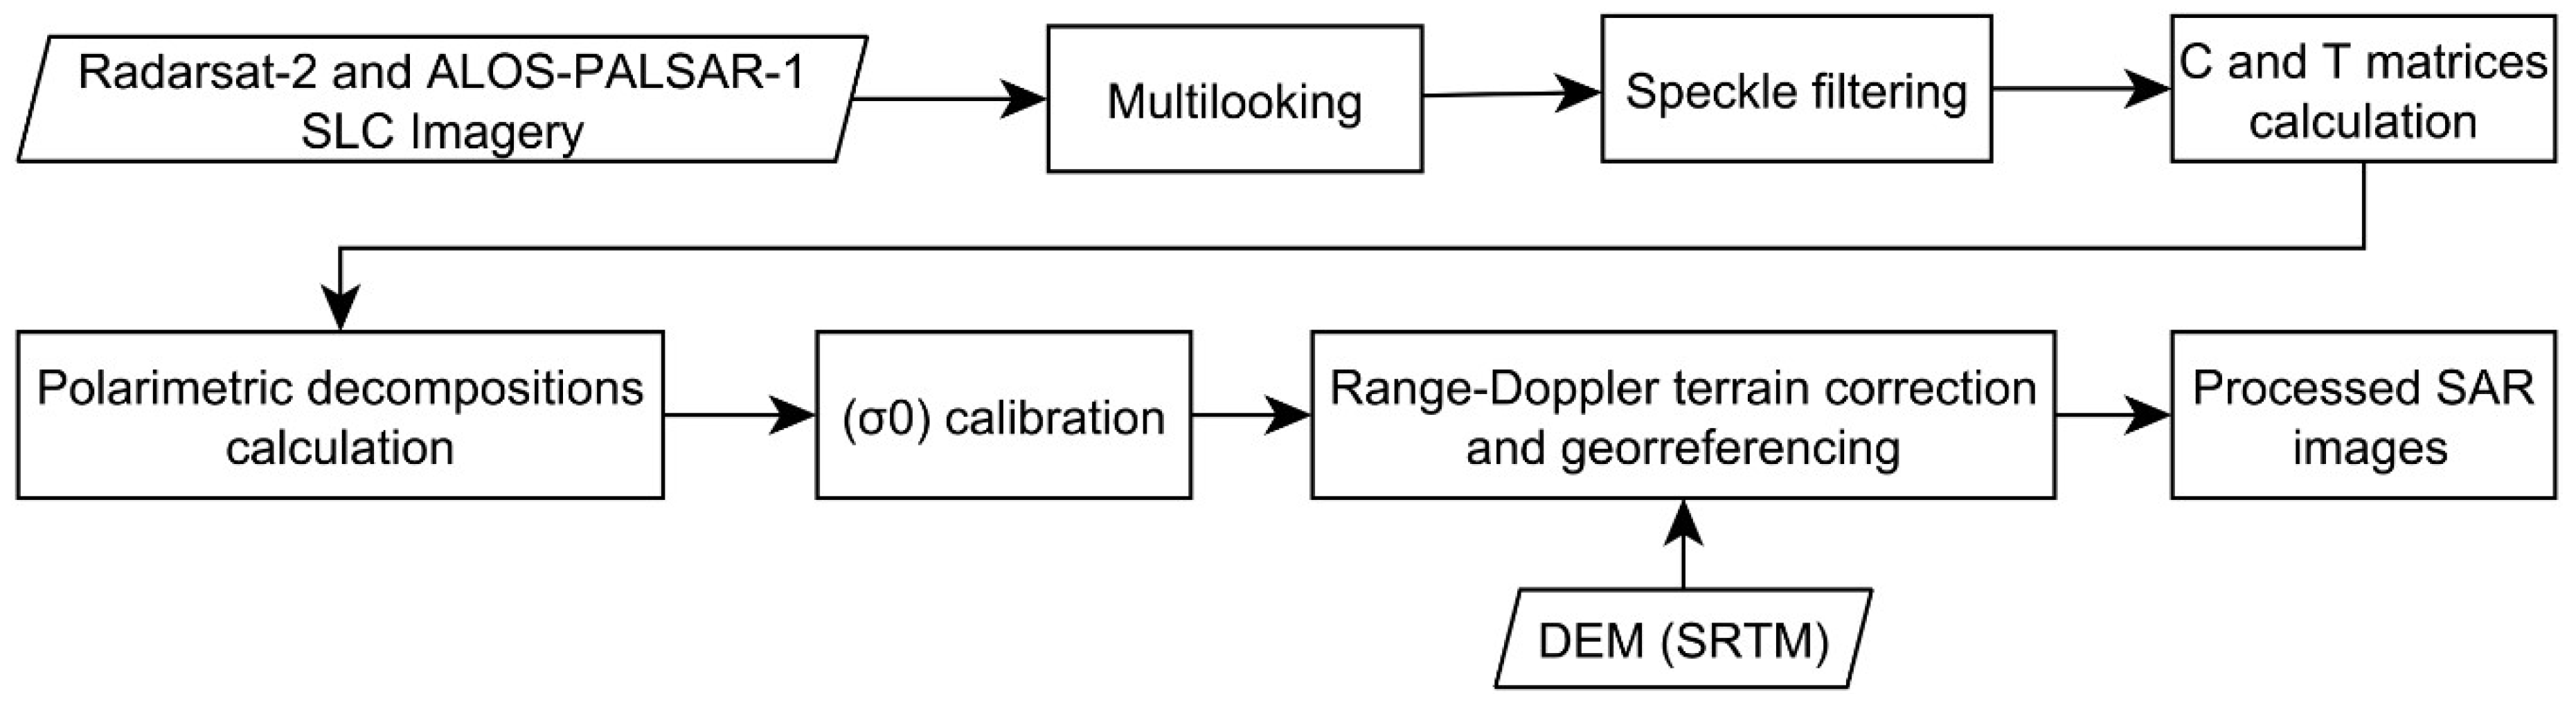
The full polarimetric image processing is summarized in Figure 3. The Radarsat-2 SQ image was multilooked using four looks in azimuth and one look in range, resulting in approximately 20 × 20 m ground-range spatial resolution. The ALOS/PALSAR-1 PLR image was multilooked using six looks in azimuth and one look in range, which resulted in approximately 23 × 23 m spatial resolution. Both Radarsat-2 and ALOS/PALSAR-1 PLR scenes were used to compute the Covariance (C) and Coherence (T) matrices. In order to minimize speckle noise and preserve image spatial resolution and information, the Refined Lee adaptive filter with a 5 × 5 window size was applied over the full-polarimetric scenes. For consistent results, filtering with similar window sizes was applied to both ALOS/PALSAR-1 FBD and TerraSAR-X images. Table 2 shows the polarimetric decomposition and incoherent SAR features (including sigma-nought (σ0)) extracted from the full-polarimetric data.
Figure 3.
Full polarimetric image processing.
Table 2.
Polarimetric Features extracted from the full-polarimetric SAR data (quad-pol).
Range-doppler terrain correction and georeferencing were applied using the digital elevation model (DEM) extracted from the Shuttle Radar Topography Mission (SRTM), with a spatial resolution of 3 arc-seconds (90 m) and approximately 5 m of vertical resolution [63]. All processing steps were performed with the polarimetric SAR Data Processing and Educational Tool (PolSARPRO) software, version 5.0 [64], with exception of the range-doppler correction, which was carried out with the Sentinel-1 Toolbox version 4.0 [65].
TerraSAR-X and PALSAR-1 FBD images were converted to sigma-nought (σ0) intensity backscattering coefficients (dB) using the Equation (4) [66,67].
where DN is Digital Number (amplitude) and CF is the calibration factor in dB for the channels. For PALSAR-1 FBD and TerraSAR-X MGD the CF is equal to −83 and −46.7, respectively.
2.4. Assembly of SAR Modeling Sets
In order to answer the proposed scientific questions, the SAR data were grouped as follows: (i) single/dual pol: TerraSAR-X band, ALOS PALSAR-1 FDB, and the features (HH and HV) extracted from Radarsat-2 SQ and PALSAR-1 PLR (acquired in the high-water season); (ii) multifrequency group: combination of the features extracted from TerraSAR-X, Radarsat-2 and ALOS/PALSAR-1 FBD images acquired during the low-water season; (iii) full-polarimetric data (Table 3).
Table 3.
Definition, acronyms and description of SAR predictor sets. The description and acronyms of features composing the single and dual-pol groups (Table 2) are highlighted in gray. The original datasets identified by the symbol * in the Table 2 are replaced by their acronyms shown in the third column of this table.
2.5. Above Ground Biomass and Leaf Area Index Modeling
Univariate and multivariate Generalized Linear Models (GLMs) were estimated for predicting both AGB and LAI, using SAR datasets as predictor (Table 3). Two different link functions were tested for GLM specification, the identity function (i.e., Multivariate Linear Regression, Equation (5)), and the log link function (Equation (6)), since AGB and LAI variables ϵ R+ [68]. The predicted quantities will hereafter be referred as E(Yi) and lnE(Yi), respectively.
where b0, bρ, xp, ln are the intercept, regression coefficients, the predictor variables (features) and natural logarithm, respectively.
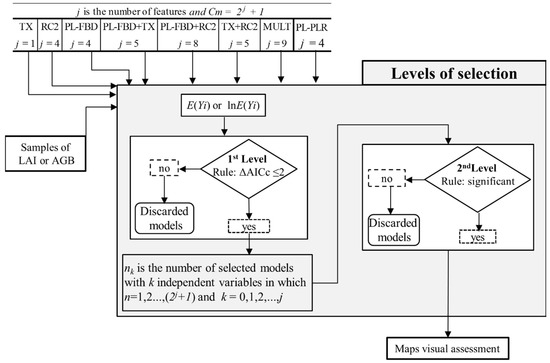
Mean SAR responses (Table 2) correspond to a homogenous region around each 0.0625 ha plot, encompassing a minimum of four pixels. A routine was implemented in the R scripting language [69] for automatic model calibration, selection and assessment, as well as for outputting AGB and LAI maps (Supplementary Material). The core package of the routine is the “glmult” package [70], which allows model fitting using all predictor variable combinations. A two-level routine (Figure 4) applies different numerical criteria for defining the best models. Thus, for j independent predictor (Table 3), the number of calibrated models is 2j + 1.
Figure 4.
Flowchart: Models selection process for SAR Single/dual-pol and Multifrequency data type.
In the first selection level, the small-sample-size corrected version of the Akaike information criterion (AICc) was applied, following the recommendation that models with ΔAICc ≤ 2 units, relative to the lowest AICc value, should not be dismissed [71] (Figure 4). At the second level, models were assessed based on statistical significance (α = 0.05), R-squared (R2) or pseudo R-squared (for lnE(Yi)), and leave-one-out cross-validation using the Root Mean Squared Error (RMSEcv). To support model assessment, the relative overall RMSEcv (Rel. RMSE) in percentage, bias and average relative error (ARE) were also reported. Pixel level spatial prediction maps (output maps) were then generated from all significant models and submitted to visual assessment.
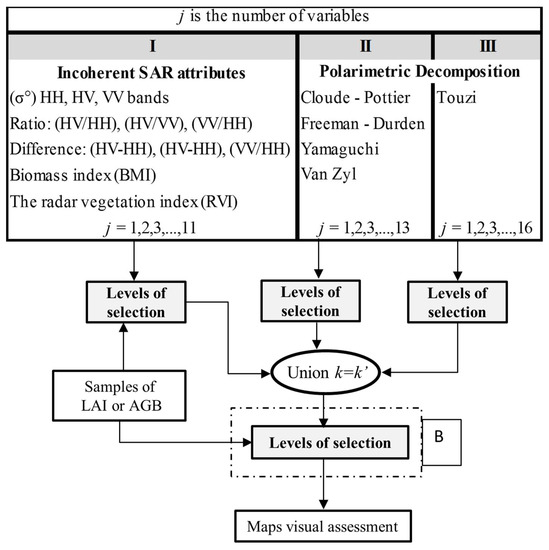
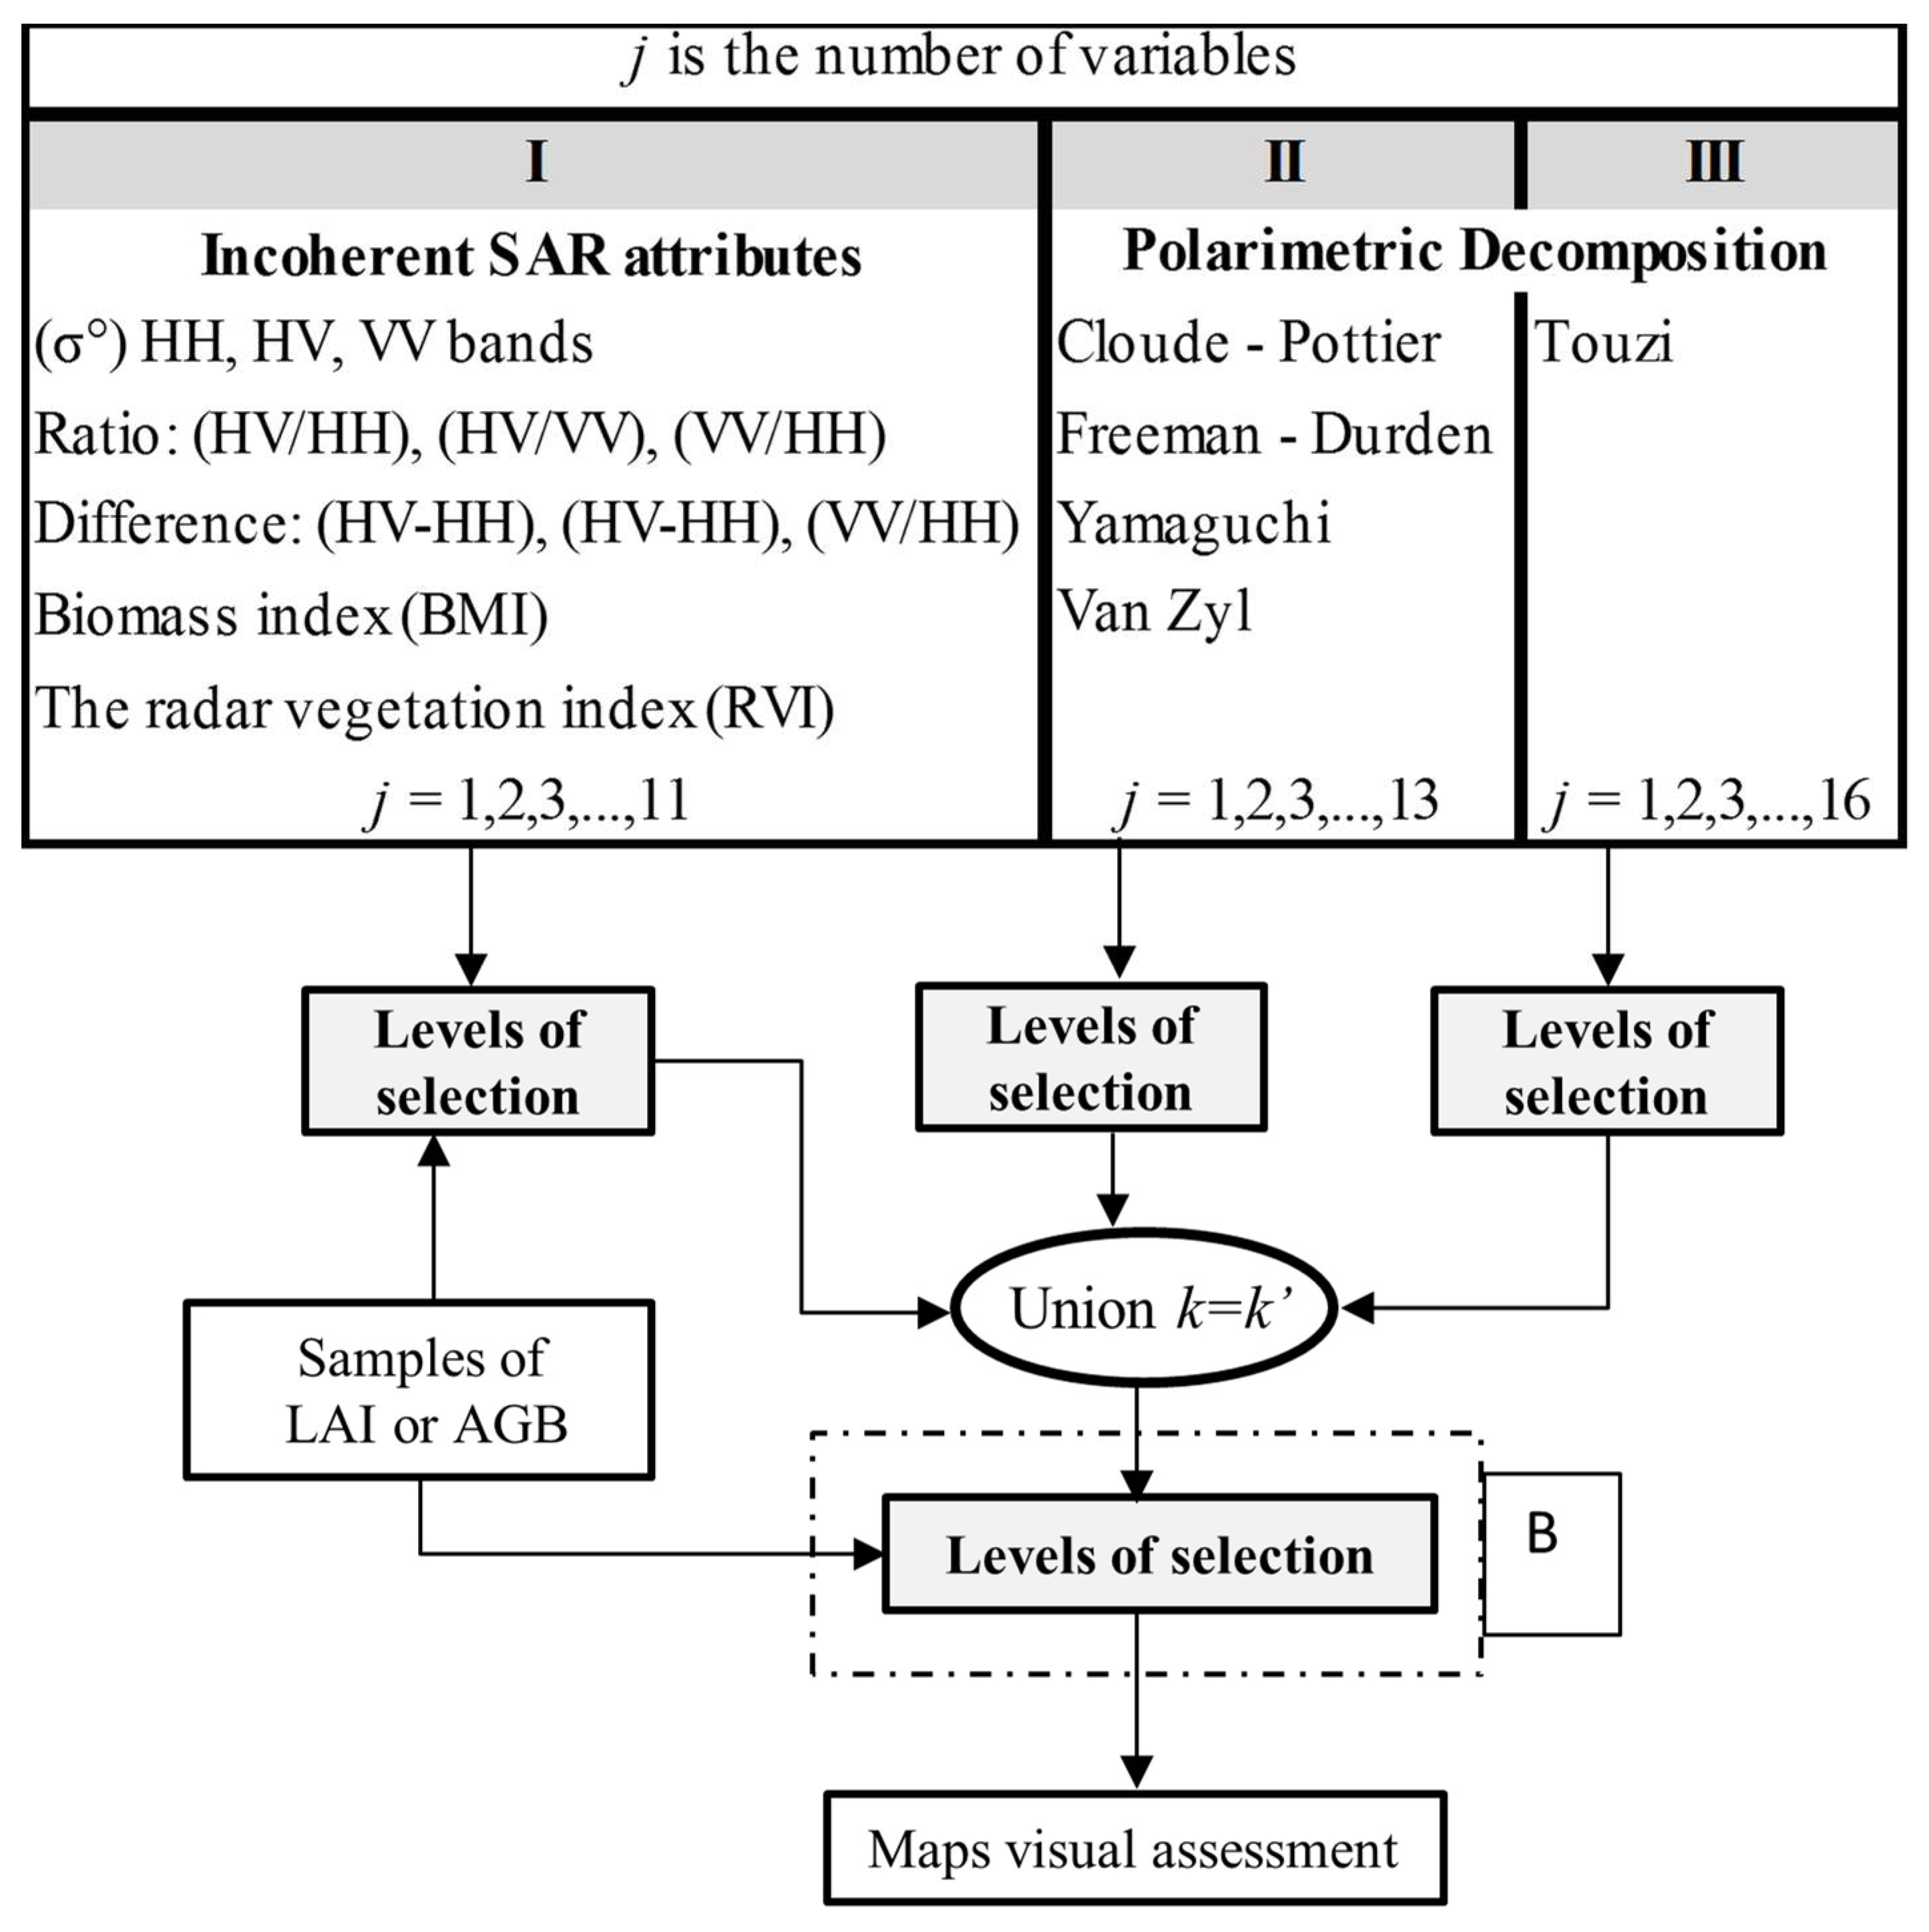
Given the high computation cost of full-polarimetric based models (i.e., j = 40), polarimetric features were split into three groups of analogous decompositions that could represent similar information (Figure 5). Then, each group was submitted to the levels of selection (see gray box in Figure 4). The predictors of the selected models were then regrouped into a new set of predictors (k’), which was subsequently used as input to the “Levels of selection”, showed as step B in Figure 5.
Figure 5.
Flowchart: Model selection process for the quad-pol SAR data type.
2.6. Visual Assessment of Maps LAI and AGB Maps
Finally, the LAI and AGB output maps from selected models for both polarimetric and non-polarimetric SAR data were submitted to visual analyses (Figure 4 and Figure 5) in order to assess their suitability with respect to the reference map, land-cover classes (Figure 1c–e; Table 1), and ground information regarding land-use and land-cover classes (April 2011) and from field observations provided by Arnesen, et al. [72], Furtado, et al. [73] and Furtado, Silva and Novo [8]. The best model was that with the minimum RMSEcv and the highest agreement with the spatial distribution of woody vegetation cover classes (Figure 1), assessed by inspecting the output maps. To facilitate this inspection, the maps were generated automatically in ascending order of RMSEcv.
All final predictions were cut considering the lower and upper thresholds observed in the LAI and AGB data (Figure 6). Thus, the lower and upper bounds for AGB were 0 and 600 t/ha, and for LAI, 2 and 6. Values outside this range were clipped to the nearest threshold.
Figure 6.
Boxplot graphic: (a) Above Ground Biomass (AGB) e (b) Leaf Area Index (LAI).
3. Results
3.1. Exploratory Analysis of LAI and AGB Data
Both boxplots contain two AGB (the largest-Figure 6a) and LAI (the smallest-Figure 6b) values that may be outliers. To better understand the impact of these possible outliers on model calibration and/or map accuracy, the selection process was carried out by including and excluding them. To refer to the number of LAI or AGB samples used in the model calibration, subscribed numbers (16 or 18) were added to the dataset acronyms henceforth (Table 3). To compare the results of equivalent models calibrated with either 18 or 16 samples for both LAI and AGB, their observed versus predicted scatterplots (OBS vs. PREDs) were joined.
3.2. LAI Models
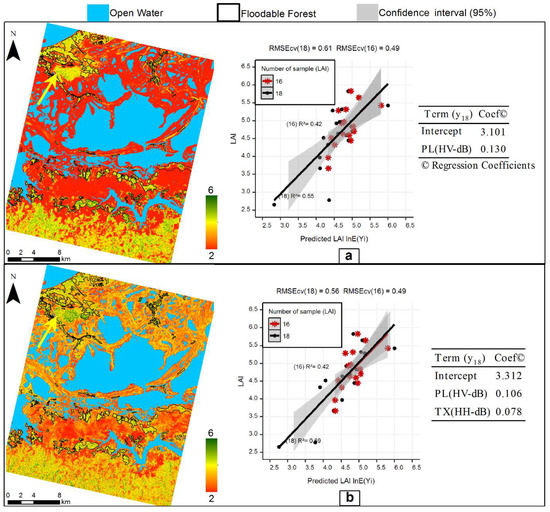
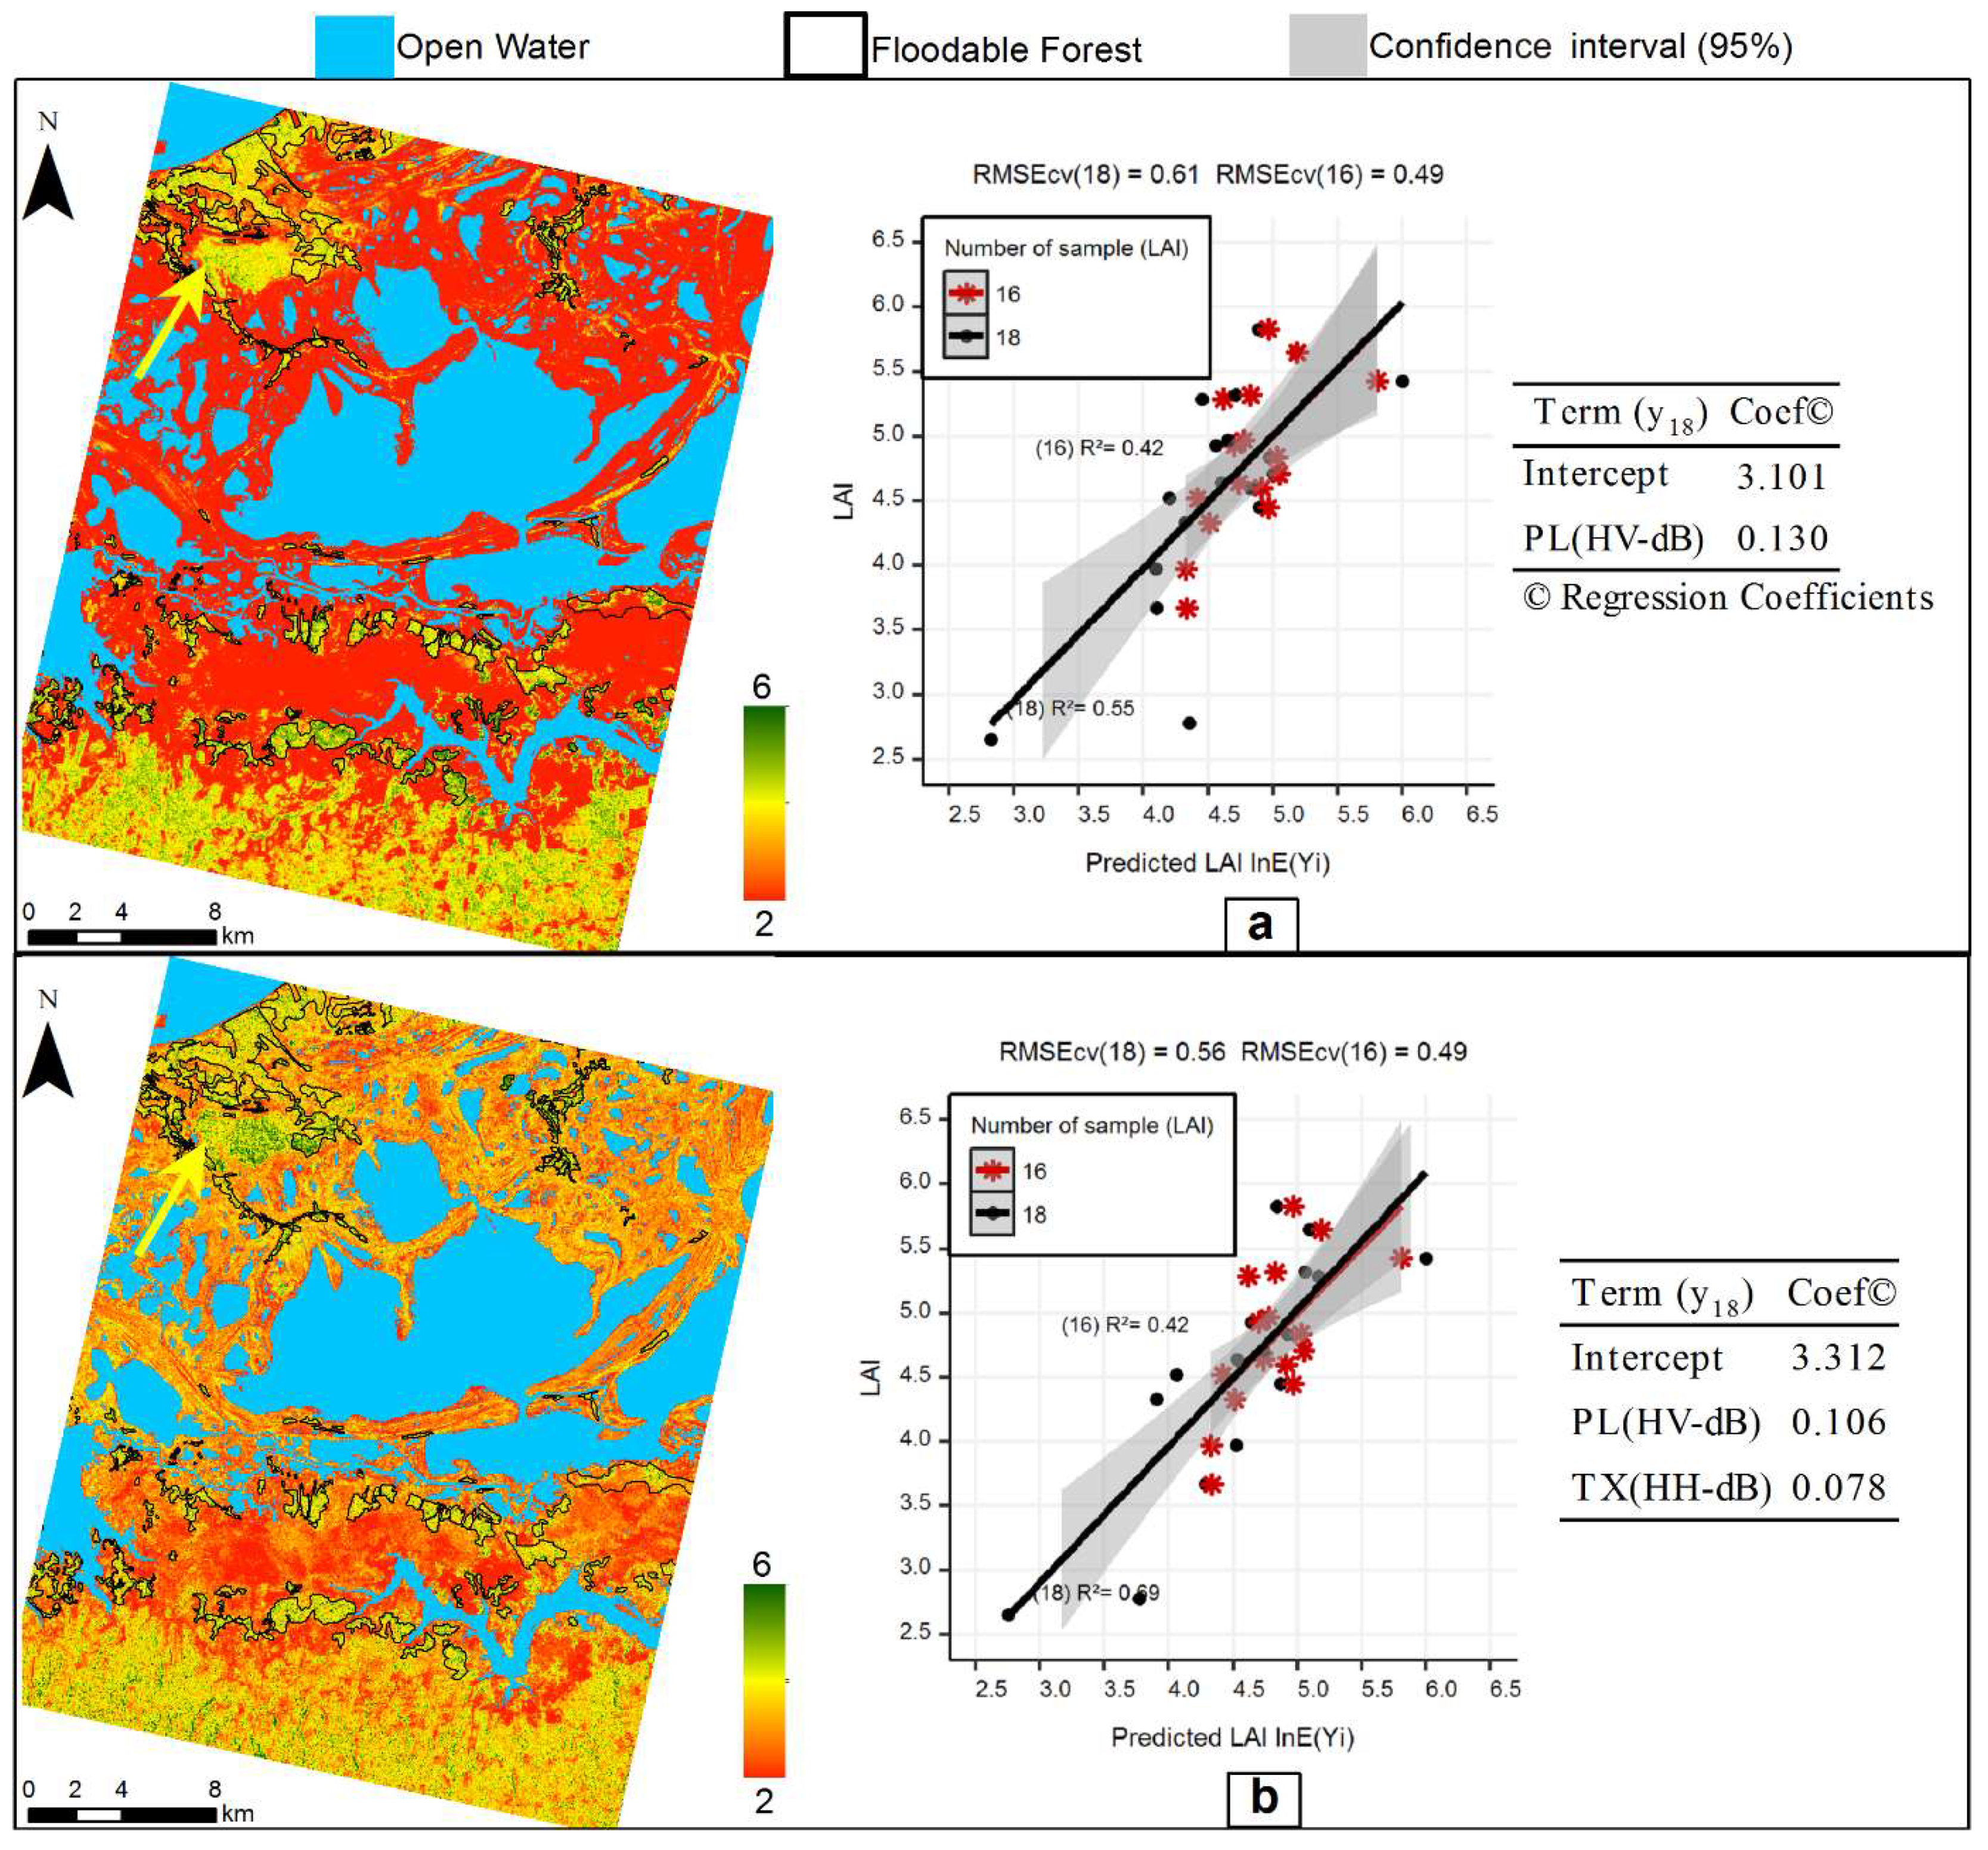
In general, all model biases were low, however the LAI estimates obtained from the lnE(Yi) models had better spatial correspondence with land-cover classes (Figure 1), supported by the empirical knowledge of study area (Table 4). Models selected from RC2(POL) and PL-PLR(POL)16 did not provide reliable maps and were therefore not considered further. Among the models selected from SAR single/dual-pol dataset, PL-FBD18 showed the highest R2 and the lowest RMSEcv and Rel. RMSE with HV-dB as predictor (Table 4). The same feature was also ranked in the model PL-FBD16 OBS vs. PREDs distribution (Figure 1). The best output LAI map resulted from the 18 LAI samples model (Figure 7a).
Table 4.
Generalized Linear Model (GLM) specifications and model evaluation for predicting Leaf Area Index from synthetic aperture radar data in floodplain forests of the Amazon basin.
Figure 7.
Comparison of predicted and observed values of LAI and spatial prediction for the models: (a) PL-FBD+TX18; (b) PL-FBD18. The yellow arrow indicates some high-density shrubby areas. Central Amazon Floodplain, Brazil.
Regarding the multifrequency dataset, the best model (highest R2 and the lowest RMSEcv and Rel. RMSE was provided by PL-FBD+TX18 (Figure 7b). Despite the similarity in the R2 and the RMSEcv and Rel. RMSE statistics of both PL-FBD+TX18 and PL-FBD18, their output maps are quite different. This is clearly observed when comparing the regions with high and low LAI values (i.e., green and red regions, respectively) because there are not coincident. PL-FBD18 was selected as best model, because it presented coherent results based on visual analyses and consists of a single predictor (HV-dB) (thus having operational advantages).
Visual analysis of the best LAI map (Figure 7a) indicated that the regions in red (i.e., lowest values set for the LAI maps) match with the locations of the Non-forested class (Figure 1). This is a clear indication that L-band dual-pol SAR images are less sensitive to lower LAI values (i.e., 2 or less), likely due to the longer wavelength. The LAI map also shows that the Flooded Forest class is clearly discriminated from the Non-forested class, because most of the regions with the highest LAI values are located within it, except for some of the Shrub areas.
3.3. AGB Regression Models
The AGB models fitted with lnE(Yi) presented lower RMSEcv and Rel. RMSE values and, in general, showed better spatial correspondence with land-cover classes (Figure 1) than those estimated with E(Yi) models (Table 5). The models estimated using single/dual-pol SAR data did not provide satisfactory results, neither in terms of RMSEcv, Rel. RMSE and R2 values, nor for map visual analysis. Thus, these models were not considered further.
Table 5.
GLM model specifications and model evaluation for predicting aboveground biomass from synthetic aperture radar data in floodplain forests of the Amazon basin.
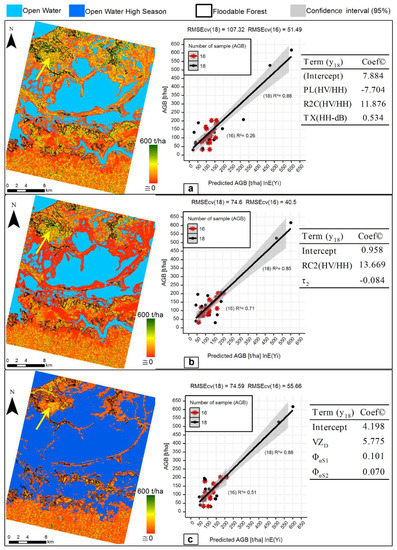
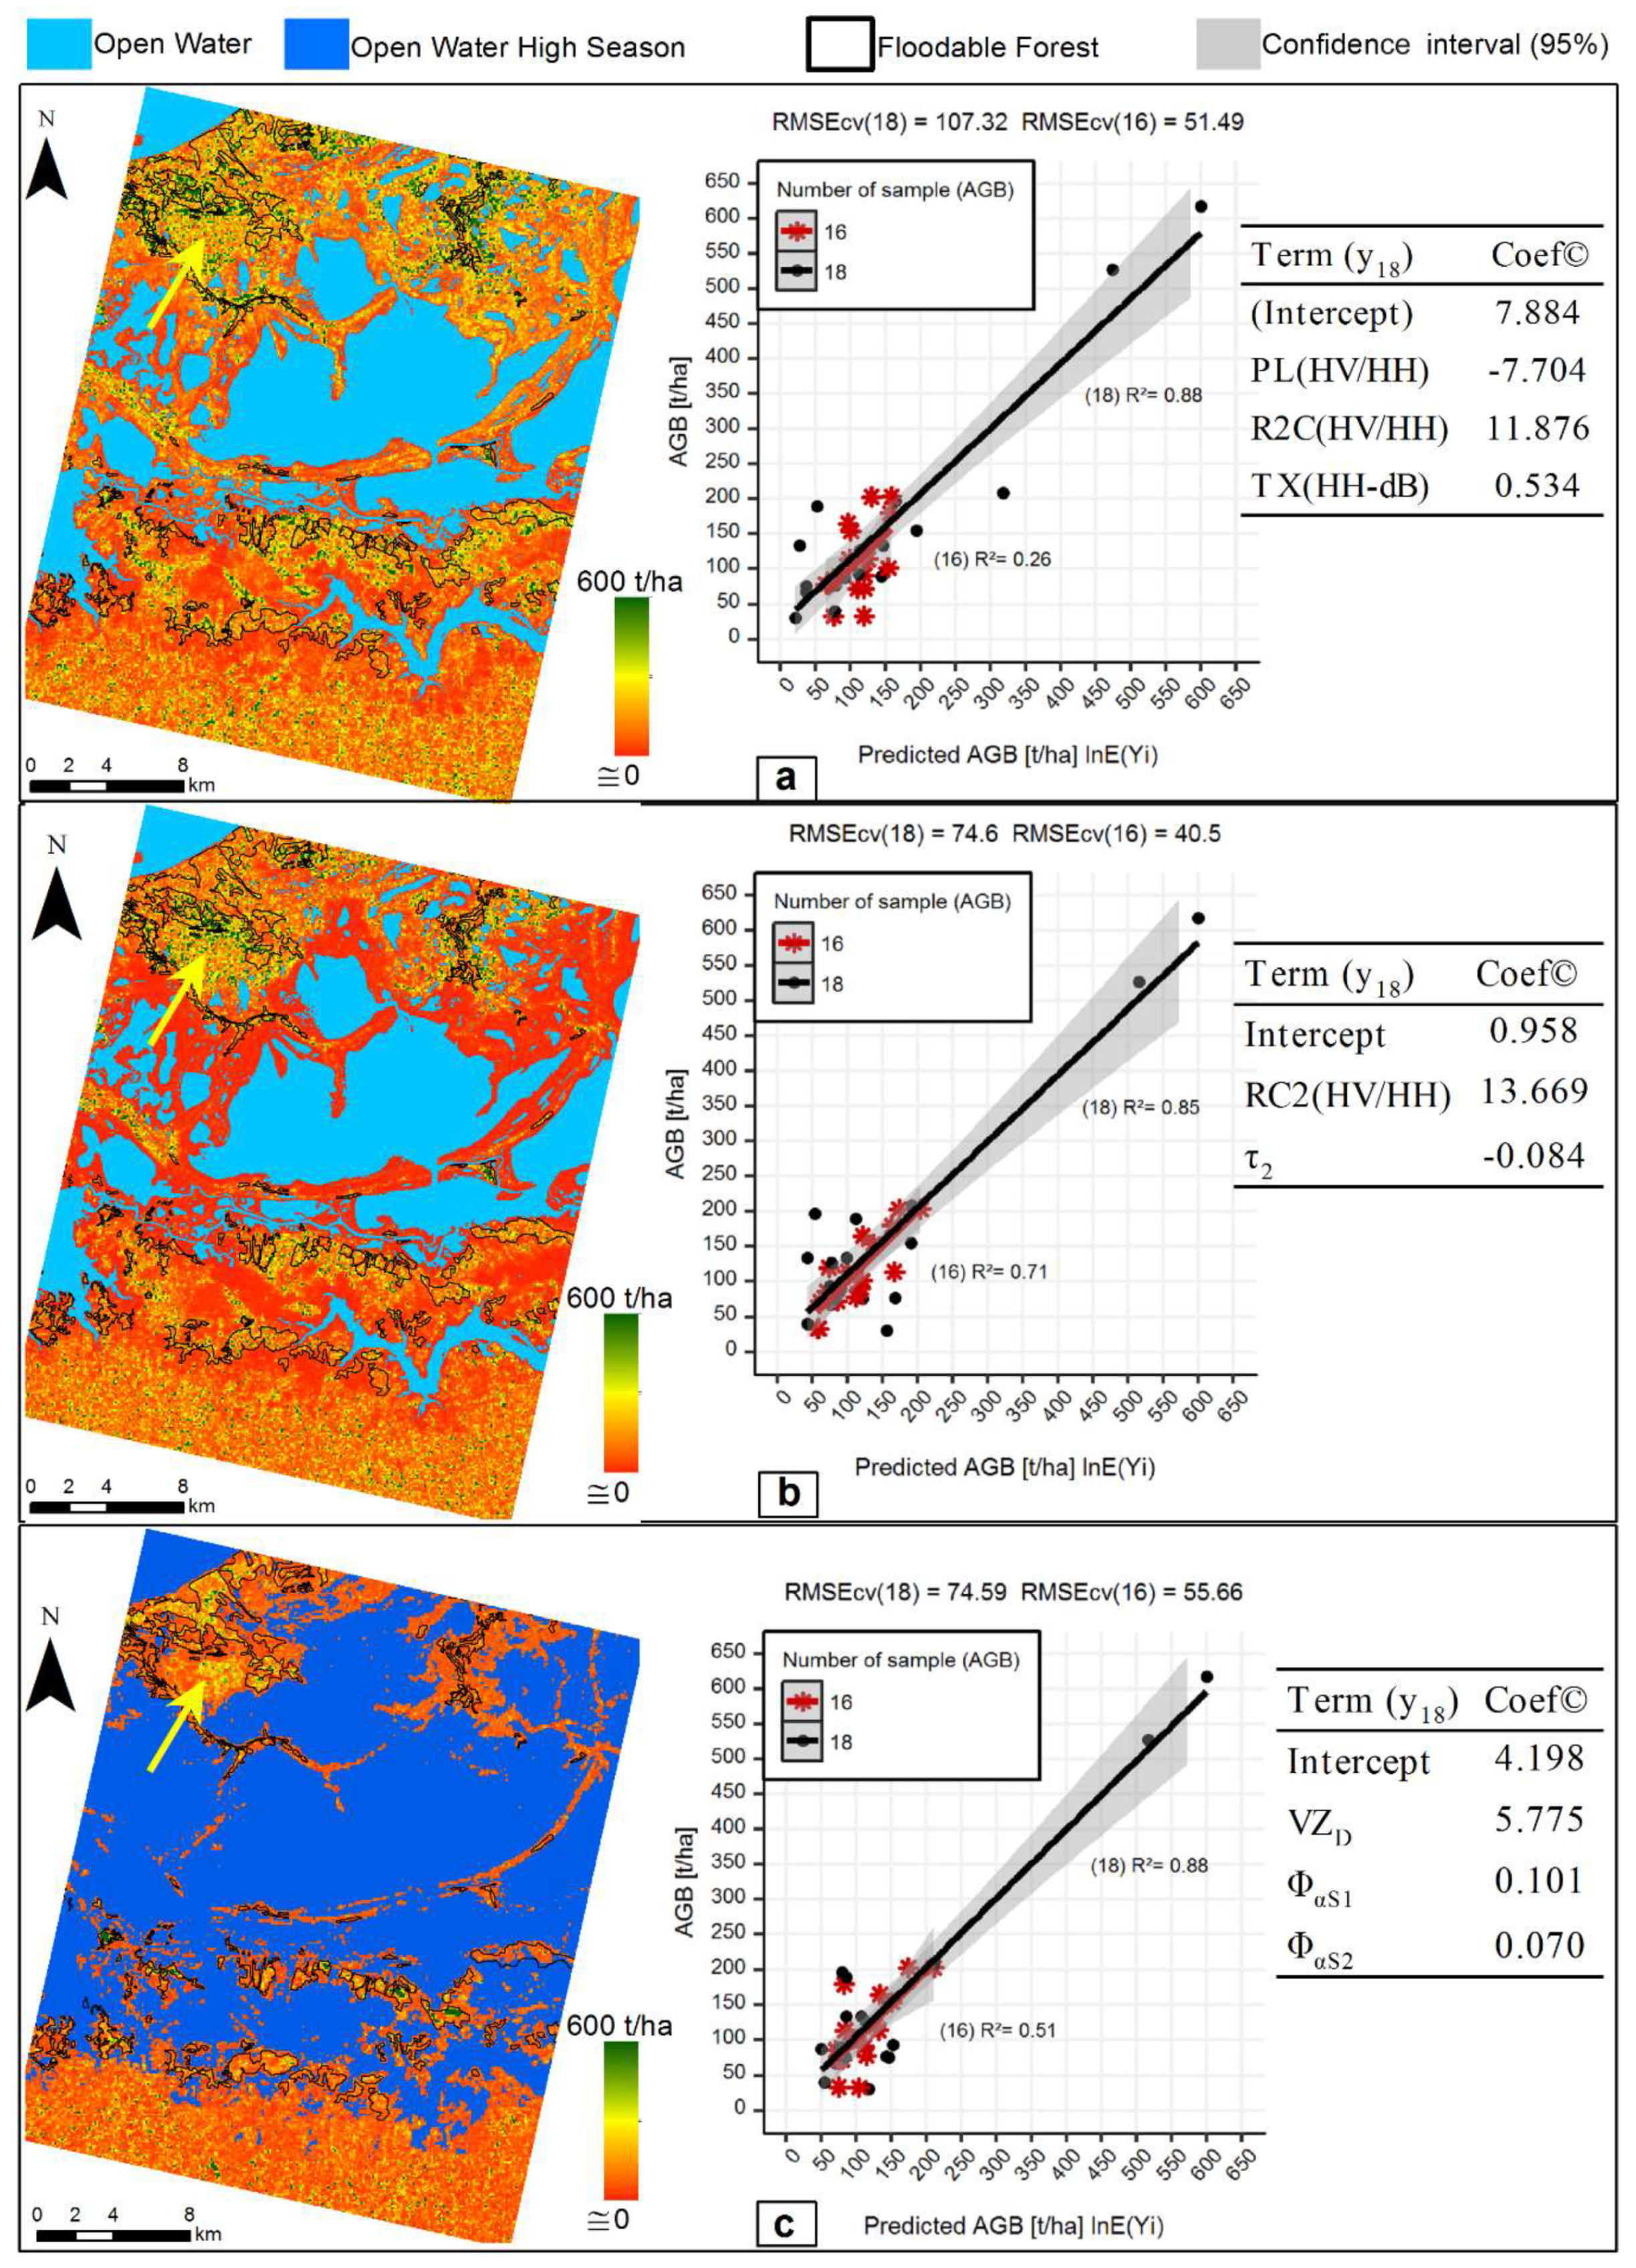
As can be observed in the graphic OBS vs. PRED in Figure 8, the absence of possible outliers in the estimated models did not positively impact their accuracy. Thus, the further analyses considered only the models calibrated with 18 samples of AGB.
Figure 8.
Comparison of predicted and observed values of AGB and spatial prediction for the models: (a) MULT18, (b) RC2(POL)18, and (c) PL-PLR(POL)18. The yellow arrow indicates some high-density shrub areas. Central Amazon floodplain, Brazil.
The models PL-FBD+RC218 and MULT18 presented satisfactory accuracy (i.e., the lowest RMSEcv, Rel. RMSE and highest R2). However, the last one displayed better results in the map visual analyses (Figure 8a). Therefore, considering multifrequency data, the best result was achieved by MULT18 (Figure 8a).
The RMSEcv, Rel. RMSE and R2 values were similar, with a low bias for the models calibrated from full-polarimetric data (i.e., RC2(POL)18 and PL-PLR(POL)18); their output maps are displayed in the Figure 8b,c, respectively. The best AGB map was estimated from PL-PLR(POL)18 model (Figure 8c). This map, unlike other AGB maps, shows the highest AGB value within the Flooded Forest class and in some high-density shrub areas (indicated by a yellow arrow in this Figure). This also allows us to discriminate the Flooded Forest class from the Non-forested class. Furthermore, most of the regions with highest AGB values (around 600 t/ha−1) are located in the interior regions of the Flooded Forest class, which agrees with the AGB spatial distribution patterning observed during field work. This model also presented the best accuracy, resulting in the lowest average relative error (46.4%). Therefore, we can conclude that the best AGB model is PL-PLR(POL)18.
4. Discussion
The RMSEcv, Rel. RMSE and relative error were comparatively low (0.65, 13% and 10.3%, respectively) for the LAI model adjusted with only one predictor, HV-dB. Thus, the model had satisfactory accuracy. These results indicate the importance of cross-polarized data in providing information about the structural complexity of vegetation canopy by means of volumetric scattering in wetland environments [74]. As the results (i.e., map visual analyses and statistic indexes) from model PL-PLR18 were less accurate than those provided by PL-FBD18, we inferred that the hydrological seasonality of the region might impact the accuracy of the models and the estimated maps.
Considering the AGB range analyzed in this work and the structural complexity of floodable forests, we can state that the selected model for AGB provided good results, with comparatively low RMSEcv (74.59 t/ha), Relative RMSEcv and average relative error (both around 46%). The predictors composed of the polarimetric models were coherent, that is, phase dependent. One of them is VZD, which provides information about the proportion of double-bounce scattering generated by Van Zyl decomposition [60]. The others two selected parameters are ΦαS1 and ΦαS2, extracted by the Touzi decomposition [58]. These predictors provide information about the first and the second dominant phase difference between trihedral and dihedral scattering, respectively. Some works, such as Martins, et al. [75], identified that the proportion of double-bounce scattering is an important feature for estimating the AGB in the Amazon forest. A possible explanation is that this kind of scattering mechanism may be enhanced due to the clear floor of floodable forests and the reduced understory layer [74,76]. However, this may be detected only by L or longer SAR band systems [77].
In relation to the predictors ΦαS1 and ΦαS2, some researchers, such as Li, et al. [78], Sartori, Imai, Mura, Novo and Silva [12], Storie, et al. [79] and Touzi [58], reported that ΦαS1 improves the classification accuracy and thus the discrimination between some wetland vegetation types, such as macrophyte, open bog and small shrubs. This predictor has also been reported as sensitive to the water under vegetation [80].
The analyses related to AGB, presented above, lead us to conclude that L-band full-polarimetric data is an important predictor of AGB in both Amazonian flooded forests and dense forest regions characterized by high AGB values; thus, it has the potential to overcome the current limitations of orbital SAR data in mapping AGB with reliable accuracy in dense forest regions [5].
Furthermore, vegetation structural parameters such as canopy height and crown diameter are important for the development of ecological studies related to dynamic and spatial characterization of vegetation [81], which can also be used indirectly for estimating AGB (i.e., as data input in the allometric equations) [82] or can be integrated with other methodologies such as presented in [83].
Since the SAR signal is sensitive to form and structure of targets—rather than tree species and wood density, which are important parameters for estimating ground AGB [84]—we expect that the L-band polarimetric will presented the same or even more potential to estimate and map vegetation structural parameters such as canopy height and crown diameter. Therefore, we encourage the development of studies with this aim and highlight that the routine presented in this work can assist in their development.
These results endorse and reinforce the potential of the forthcoming SAR missions at L-band, such as TanDEM-L [85]. Although data policy will restrict public access to the data, TanDEM-L is expected to overcome the current SAR data limitation in both mapping and monitoring AGB on a global scale with satisfactory accuracy and spatial resolution [86].
This potential is amplified with Airborne Light Detection and Ranging (LiDAR) data, which can be used to calibrate and validate SAR-adjusted models through the upscale approach, reducing the dependency of field inventory data. This is especially true in regions with difficult access, such as several environments found in the Amazon forest biome. Furthermore, information such as crown diameter, canopy height and number of individuals (trees) can be extracted directly from this source of data and can potentially be used as input in the allometric equations and, indirectly, to improve AGB estimation [82]. Thus, the data generated by future missions such as Global Ecosystems Dynamics Investigation Lidar (GEDI) [87] can extend the applicability of the methodology presented in this work to other forest environments worldwide. In addition, we stress that the quad-polarimetric SAR images with larger wavelengths, such as P-band and S-band, provide results quite similar or even better than those achieved in this work [88]. This is especially true given that the SAR signal can penetrate deeper in the dense multi-layer of the tropical forests. Thus, missions such as BIOMASS, which will generate P-band SAR images [88], and NISAR, which will generate quad-polarimetric images in L-band and S-band frequencies, hold promise for mapping and monitoring AGB with relatively high accuracy on a global scale [89,90,91,92].
5. Conclusions
Our results show that the model approach lnE(Yi) generally presented better results than E(Yi), especially in the visual analyses of the AGB and LAI maps. Furthermore, the models selected for both AGB and LAI were parsimonious, and their output maps matched with the classes and empirical knowledge about the study area. For both LAI and AGB retrievals, the best results were achieved using the features extracted from ALOS-PALSAR-1 scenes. This result indicates that, for the estimation and mapping both LAI and AGB parameter in a Floodable Forest environment, single-frequency polarimetric L-band images are more efficient than multifrequency dual-pol or single-pol SAR. For the estimation of LAI, the cross-polarization data (HV-dB) was sufficient. For AGB, however, the features extracted from polarimetric decompositions seems to be essential. Thus, for mapping LAI, dual-pol SAR images performed best, as they have operational advantages when compared with quad-polarimetric SAR. For AGB mapping procedures, the full-polarimetric data is preferable. These results reinforce the potential of this kind of data in mapping AGB in Floodable Forest environments. We also believe that this result can be extended to other dense forest environments worldwide.
Considering the wide range of AGB values contemplated in this work, we strongly believe that the results achieved by the best AGB model were satisfactory and that the methodology presented is suitable for estimating this parameter. We believe this can be extended to vegetation structure parameters such as canopy height and crown diameter. However, to confirm these findings, more tests must be performed in other regions and environments, with more samples of AGB if possible. To better understand the potential and limitations of this routine, we encourage the development of future works with other modeling methods such as random forest and genetic algorithms.
Finally, the authors believe that the results and the feature selection process presented in this research may provide important information for the scientific community regarding the applicability of L-band quad-polarimetric SAR images. This is related to the estimation of AGB and its potential to overcome the current limitation in the context of wetlands and densely tropical forests environments. In this sense, we expect to collaborate on the construction of a background for analysis and assessment of current (PALSAR-1 and -2) and future missions (NISAR, GEDI, BIOMASS, Tandem-L), which we believe have enormous potential for mapping of AGB with high accuracy on a global scale in the near future. Such information can provide essential information for future generations to better understand the dynamics of our planet in the face of modern issues such as climate change and anthropogenic land-cover change.
Supplementary Materials
The following are available online at http://www.mdpi.com/2072-4292/10/9/1355/s1.
Author Contributions
L.O.P., L.F.A.F., T.S.F.S. and E.M.L.M.N. conceived the study questions and sampling design. L.O.P. and L.F.A.F. were responsible for image processing. L.P.O., T.S.F.S., S.J.S.S. and V.L. implemented, validated and interpreted models and results. L.O.P. led the writing of the manuscript with significant inputs from all authors.
Funding
This research was funded by Graduate Program in Remote Sensing of the National Institute for Space Research (INPE), São Paulo Research Foundation (FAPESP) [#2011/23594-8] and Conselho Nacional de Desenvolvimento Científico e Tecnológico (CNPq) [454779/2015-1].
Acknowledgments
L.O. Pereira thanks INPE and CNPq for the granted PCI-DC fellowship (Grant #301118/2017-5) and University of Exeter for the PhD`s degree fellowship. L.F.A. Furtado thanks INPE and CNPq for the granted PCI-DC fellowship, and CAPES for the master’s degree fellowship. Field data collection was funded by the Graduate Program in Remote Sensing of the National Institute for Space Research (INPE) and by grant #2011/23594-8, São Paulo Research Foundation (FAPESP). During the development of this work, TSF Silva received postdoctoral support from grant #2010/11269-2, São Paulo Research Foundation (FAPESP), grant #458038/2013-0 CNPq, and currently receives a CNPq Productivity Grant (#310144/2015-9). We thank the Canadian Space Agency (CSA) for the Radarsat-2 images granted to TSF Silva by the Science and Operational Applications Research (SOAR) program, project number 5052. Radarsat-2 data and products are licensed by MacDonald, Dettwiler and Associates, Ltd. This work has been undertaken within the framework of JAXA’s Kyoto & Carbon Initiative, with ALOS PALSAR data provided by JAXA EORC. VL is supported by FAPESC 1703/2017.
Conflicts of Interest
The authors declare no conflict of interest. The funding sponsors had no role in the design of the study; in the collection, analysis, or interpretation of data; in the writing of the manuscript, and in the decision to publish the results.
References
- Gibbs, H.K.; Brown, S.; Niles, J.O.; Foley, J.A. Monitoring and estimating tropical forest carbon stocks: Making redd a reality. Environ. Res. Lett. 2007, 2, 45023. [Google Scholar] [CrossRef] [Scilit]
- Asner, G.P. Cloud cover in Landsat observations of the brazilian Amazon. Int. J. Remote Sens. 2010, 22, 3855–3862. [Google Scholar] [CrossRef] [Scilit]
- Kumar, L.; Sinha, P.; Taylor, S.; Alqurashi, A.F. Review of the Use of Remote Sensing for Biomass Estimation to Support Renewable Energy Generation; SPIE: Bellingham, WA, USA, 2015; p. 28. [Google Scholar]
- Lu, D. The potential and challenge of remote sensing-based biomass estimation. Int. J. Remote Sens. 2006, 27, 1297–1328. [Google Scholar] [CrossRef] [Scilit]
- Lu, D.; Chen, Q.; Wang, G.; Liu, L.; Li, G.; Moran, E. A survey of remote sensing-based aboveground biomass estimation methods in forest ecosystems. Int. J. Digit. Earth 2014, 9, 63–105. [Google Scholar] [CrossRef] [Scilit]
- Henderson, F.M.; Lewis, A.J. Radar detection of wetland ecosystems: A review. Int. J. Remote Sens. 2008, 29, 5809–5835. [Google Scholar] [CrossRef] [Scilit]
- Silva, T.; Melack, J.; Streher, A.; Ferreira-Ferreira, J.; de Almeida Furtado, L. Capturing the dynamics of amazonian wetlands using synthetic aperture radar: Lessons learned and future directions. In Remote Sensing of Wetlands: Applications and Advances; CRC Press: Boca Raton, FL, USA, 2015; pp. 453–470. [Google Scholar]
- Furtado, L.F.A.; Silva, T.S.F.; Novo, E.M.L.M. Dual-season and full-polarimetric C band SAR assessment for vegetation mapping in the Amazon várzea wetlands. Remote Sens. Environ. 2016, 174, 212–222. [Google Scholar] [CrossRef] [Scilit]
- Hess, L.L.; Melack, J.M.; Simonett, D.S. Radar detection of flooding beneath the forest canopy: A review. Int. J. Remote Sens. 1990, 11, 1313–1325. [Google Scholar] [CrossRef] [Scilit]
- Silva, T.S.F.; Costa, M.P.F.; Melack, J.M. Spatial and temporal variability of macrophyte cover and productivity in the eastern Amazon floodplain: A remote sensing approach. Remote Sens. Environ. 2010, 114, 1998–2010. [Google Scholar] [CrossRef] [Scilit]
- Lee, J.S.; Pottier, E. Polarimetric Radar Imaging: From Basics to Applications; CRC Press: Boca Raton, FL, USA, 2009. [Google Scholar]
- Sartori, L.R.; Imai, N.N.; Mura, J.C.; Novo, E.M.L.d.M.; Silva, T.S.F. Mapping macrophyte species in the Amazon floodplain wetlands using fully polarimetric ALOS/PALSAR data. IEEE Trans. Geosci. Remote Sens. 2011, 49, 4717–4728. [Google Scholar] [CrossRef]
- Ranson, K.J.; Saatchi, S.; Guoqing, S. Boreal forest ecosystem characterization with SIR-C/XSAR. IEEE Trans. Geosci. Remote Sens. 1995, 33, 867–876. [Google Scholar] [CrossRef] [Scilit]
- Ranson, K.J.; Sun, G. An evaluation of AIRSAR and SIR-C/X-SAR images for mapping northern forest attributes in maine, USA. Remote Sens. Environ. 1997, 59, 203–222. [Google Scholar] [CrossRef] [Scilit]
- Novo, E.M.L.M.; Costa, M.P.F.; Jose, E.M.; Lima, I.B.T. Relationship between macrophyte stand variables and radar backscatter at L and C band, Tucuruí reservoir, Brazil. Int. J. Remote Sens. 2002, 23, 1241–1260. [Google Scholar] [CrossRef] [Scilit]
- Proisy, C.; Mougin, E.; Fromard, F.; Trichon, V.; Karam, M.A. On the influence of canopy structure on the radar backscattering of mangrove forests. Int. J. Remote Sens. 2002, 23, 4197–4210. [Google Scholar] [CrossRef] [Scilit]
- Saatchi, S.; Halligan, K.; Despain, D.G.; Crabtree, R.L. Estimation of forest fuel load from radar remote sensing. IEEE Trans. Geosci. Remote Sens. 2007, 45, 1726–1740. [Google Scholar] [CrossRef] [Scilit]
- Kovacs, J.M.; Jiao, X.; Flores-de-Santiago, F.; Zhang, C.; Flores-Verdugo, F. Assessing relationships between Radarsat-2 C-band and structural parameters of a degraded mangrove forest. Int. J. Remote Sens. 2013, 34, 7002–7019. [Google Scholar] [CrossRef] [Scilit]
- Huang, W.; Sun, G.; Ni, W.; Zhang, Z.; Dubayah, R. Sensitivity of multi-source SAR backscatter to changes in forest aboveground biomass. Remote Sens. 2015, 7, 9587–9609. [Google Scholar] [CrossRef] [Scilit]
- Sinha, S.; Jeganathan, C.; Sharma, L.K.; Nathawat, M.S. A review of radar remote sensing for biomass estimation. Int. J. Environ. Sci. Technol. 2015, 12, 1779–1792. [Google Scholar] [CrossRef] [Scilit]
- Costa, M.P.F.; Niemann, O.; Novo, E.; Ahern, F. Biophysical properties and mapping of aquatic vegetation during the hydrological cycle of the Amazon floodplain using JERS-1 and Radarsat. Int. J. Remote Sens. 2002, 23, 1401–1426. [Google Scholar] [CrossRef] [Scilit]
- Costa, M.P.F. Use of SAR satellites for mapping zonation of vegetation communities in the Amazon floodplain. Int. J. Remote Sens. 2004, 25, 1817–1835. [Google Scholar] [CrossRef] [Scilit]
- Hess, L.L.; Melack, J.M.; Davis, F.W. Mapping of floodplain inundation with multi-frequency polarimetric SAR: Use of a tree-based model. In Proceedings of the IGARSS ‘94—1994 IEEE International Geoscience and Remote Sensing Symposium, Pasadena, CA, USA, 8–12 August 1994; pp. 1072–1073. [Google Scholar]
- Pandey, U.; Kushwaha, S.; Kachhwaha, T.; Kunwar, P.; Dadhwal, V. Potential of Envisat ASAR data for woody biomass assessment. Trop. Ecol. 2010, 51, 117. [Google Scholar]
- Treuhaft, R.; Lei, Y.; Gonçalves, F.; Keller, M.; dos Santos, J.R.; Neumann, M.; Almeida, A. Tropical-forest structure and biomass dynamics from TanDEM-X radar interferometry. Forests 2017, 8, 277. [Google Scholar] [CrossRef] [Scilit]
- Luckman, A.; Baker, J.; Kuplich, T.M.; Corina da Costa, F.Y.; Alejandro, C.F. A study of the relationship between radar backscatter and regenerating tropical forest biomass for spaceborne SAR instruments. Remote Sens. Environ. 1997, 60, 1–13. [Google Scholar] [CrossRef] [Scilit]
- Kuplich, T.M.; Curran, P.J.; Atkinson, P.M. Relating SAR image texture to the biomass of regenerating tropical forests. Int. J. Remote Sens. 2005, 26, 4829–4854. [Google Scholar] [CrossRef] [Scilit]
- Kuplich, T.M.; Salvatori, V.; Curran, P.J. JERS-1/SAR backscatter and its relationship with biomass of regenerating forests. Int. J. Remote Sens. 2000, 21, 2513–2518. [Google Scholar] [CrossRef] [Scilit]
- Santos, J.R.; Pardi Lacruz, M.S.; Araujo, L.S.; Keil, M. Savanna and tropical rainforest biomass estimation and spatialization using JERS-1 data. Int. J. Remote Sens. 2002, 23, 1217–1229. [Google Scholar] [CrossRef] [Scilit]
- Austin, J.M.; Mackey, B.G.; Van Niel, K.P. Estimating forest biomass using satellite radar: An exploratory study in a temperate australian eucalyptus forest. For. Ecol. Manag. 2003, 176, 575–583. [Google Scholar] [CrossRef] [Scilit]
- Morel, A.C.; Saatchi, S.S.; Malhi, Y.; Berry, N.J.; Banin, L.; Burslem, D.; Nilus, R.; Ong, R.C. Estimating aboveground biomass in forest and oil palm plantation in sabah, Malaysian borneo using ALOS PALSAR data. For. Ecol. Manag. 2011, 262, 1786–1798. [Google Scholar] [CrossRef] [Scilit]
- Englhart, S.; Keuck, V.; Siegert, F. Aboveground biomass retrieval in tropical forests—The potential of combined X- and L-band SAR data use. Remote Sens. Environ. 2011, 115, 1260–1271. [Google Scholar] [CrossRef] [Scilit]
- Carreiras, J.M.B.; Jones, J.; Lucas, R.M.; Shimabukuro, Y.E. Mapping major land cover types and retrieving the age of secondary forests in the brazilian Amazon by combining single-date optical and radar remote sensing data. Remote Sens. Environ. 2017, 194, 16–32. [Google Scholar] [CrossRef] [Scilit]
- Berninger, A.; Lohberger, S.; Stängel, M.; Siegert, F. SAR-based estimation of above-ground biomass and its changes in tropical forests of Kalimantan using L- and C-Band. Remote Sens. 2018, 10, 831. [Google Scholar] [CrossRef] [Scilit]
- Lucas, R.; Bunting, P.; Clewley, D.; Armston, J.; Fairfax, R.; Fensham, R.; Accad, A.; Kelley, J.; Laidlaw, M.; Eyre, T.; et al. An evaluation of the ALOS PALSAR L-Band backscatter—Above ground biomass relationship queensland, Australia: Impacts of surface moisture condition and vegetation structure. IEEE J. Sel. Top. Appl. Earth Obs. Remote Sens. 2010, 3, 576–593. [Google Scholar] [CrossRef] [Scilit]
- Mitchard, E.T.A.; Saatchi, S.S.; Woodhouse, I.H.; Nangendo, G.; Ribeiro, N.S.; Williams, M.; Ryan, C.M.; Lewis, S.L.; Feldpausch, T.R.; Meir, P. Using satellite radar backscatter to predict above-ground woody biomass: A consistent relationship across four different African landscapes. Geophys. Res. Lett. 2009, 36. [Google Scholar] [CrossRef] [Scilit]
- Wittmann, F.; Schöngart, J.; Junk, W.J. Phytogeography, species diversity, community structure and dynamics of central amazonian floodplain forests. In Amazonian Floodplain Forests; Springer: Berlin, Germany, 2010; pp. 61–102. [Google Scholar]
- Arraut, E.M.; Marmontel, M.; Mantovani, J.E.; Novo, E.M.L.M.; Macdonald, D.W.; Kenward, R.E. The lesser of two evils: Seasonal migrations of amazonian manatees in the western Amazon. J. Zool. 2010, 280, 247–256. [Google Scholar] [CrossRef] [Scilit]
- Arantes, C.C.; Castello, L.; Cetra, M.; Schilling, A. Environmental influences on the distribution of arapaima in Amazon floodplains. Environ. Boil. Fishes 2013, 96, 1257–1267. [Google Scholar] [CrossRef] [Scilit]
- Melack, J.M.; Hess, L.L. Remote sensing of the distribution and extent of wetlands in the Amazon basin. In Amazonian Floodplain Forests; Springer: Berlin, Germany, 2010; pp. 43–59. [Google Scholar]
- Hawes, J.E.; Peres, C.A.; Riley, L.B.; Hess, L.L. Landscape-scale variation in structure and biomass of amazonian seasonally flooded and unflooded forests. For. Ecol. Manag. 2012, 281, 163–176. [Google Scholar] [CrossRef] [Scilit]
- Castello, L.; McGrath, D.G.; Hess, L.L.; Coe, M.T.; Lefebvre, P.A.; Petry, P.; Macedo, M.N.; Renó, V.F.; Arantes, C.C. The vulnerability of Amazon freshwater ecosystems. Conserv. Lett. 2013, 6, 217–229. [Google Scholar] [CrossRef] [Scilit]
- Renó, V.; Novo, E.; Suemitsu, C.; Rennó, C.; Silva, T. Assessment of deforestation in the lower Amazon floodplain using historical Landsat MSS/TM imagery. Remote Sens. Environ. 2011, 115, 3446–3456. [Google Scholar] [CrossRef] [Scilit]
- Fragal, E.H.; Silva, T.S.F.; Novo, E.M.L.D.M. Reconstructing historical forest cover change in the lower Amazon floodplains using the landtrendr algorithm. Acta Amaz. 2016, 46, 13–24. [Google Scholar] [CrossRef] [Scilit]
- Inoue, Y. Synergy of remote sensing and modeling for estimating ecophysiological processes in plant production. Plant Prod. Sci. 2003, 6, 3–16. [Google Scholar] [CrossRef] [Scilit]
- Rudorff, C.M.; Melack, J.M.; Bates, P.D. Flooding dynamics on the lower Amazon floodplain: 1. Hydraulic controls on water elevation, inundation extent, and river-floodplain discharge. Water Resour. Res. 2014, 50, 619–634. [Google Scholar] [CrossRef] [Scilit]
- Junk, W.J.; Piedade, M.T.F.; Schöngart, J.; Wittmann, F. A classification of major natural habitats of amazonian white-water river floodplains (várzeas). Wetl. Ecol. Manag. 2012, 20, 461–475. [Google Scholar] [CrossRef] [Scilit]
- Junk, W.J.; Bayley, P.B.; Sparks, R.E. The flood pulse concept in river-floodplain systems. Can. Spec. Publ. Fish. Aquat. Sci. 1989, 106, 110–127. [Google Scholar]
- Wittmann, F.; Schongart, J.; Brito, J.M.D.; Wittmann, A.D.O.; Piedade, M.T.F.; Parolin, P.; Junk, W.J.; Guillaumet, J.-L. Manual of Trees from Central Amazonian Várzea Floodplains: Taxonomy, Ecology and Use Manual de Árvores de Várzea da Amazônia Central: Taxonomia, Ecologia e Uso; Editora INPA: Manaus, AM, Brasil, 2010.
- Schöngart, J.; Wittmann, F. Biomass and net primary production of central amazonian floodplain forests. In Amazonian Floodplain Forests: Ecophysiology, Biodiversity and Sustainable Management; Junk, J.W., Piedade, F.M.T., Wittmann, F., Schöngart, J., Parolin, P., Eds.; Springer: Dordrecht, The Netherlands, 2011; pp. 347–388. [Google Scholar]
- Cannell, M.G.R. Woody biomass of forest stands. For. Ecol. Manag. 1984, 8, 299–312. [Google Scholar] [CrossRef] [Scilit]
- Hubert, M.; Vandervieren, E. An adjusted boxplot for skewed distributions. Comput. Stat. Data Anal. 2008, 52, 5186–5201. [Google Scholar] [CrossRef] [Scilit]
- Rosenqvist, A.; Shimada, M.; Ito, N.; Watanabe, M. ALOS PALSAR: A pathfinder mission for global-scale monitoring of the environment. IEEE Trans. Geosci. Remote Sens. 2007, 45, 3307–3316. [Google Scholar] [CrossRef] [Scilit]
- Burini, A.; Schiavon, G. RADARSAT-2: Main features and near real-time applications. In Proceedings of the 2009 European Radar Conference (EuRAD), Rome, Italy, 30 September–2 October 2009; pp. 153–155. [Google Scholar]
- Roth, A. TerraSAR-X: A new perspective for scientific use of high resolution spaceborne SAR data. In Proceedings of the 2003 2nd GRSS/ISPRS Joint Workshop on Remote Sensing and Data Fusion over Urban Areas, Berlin, Germany, 22–23 May 2003; pp. 4–7. [Google Scholar]
- Hansen, M.C.; Potapov, P.V.; Moore, R.; Hancher, M.; Turubanova, S.A.; Tyukavina, A.; Thau, D.; Stehman, S.V.; Goetz, S.J.; Loveland, T.R.; et al. High-resolution global maps of 21st-century forest cover change. Science 2013, 342, 850–853. [Google Scholar] [CrossRef] [Scilit] [PubMed]
- Cloude, S.R.; Pottier, E. A review of target decomposition theorems in radar polarimetry. IEEE Trans. Geosci. Remote Sens. 1996, 34, 498–518. [Google Scholar] [CrossRef] [Scilit]
- Touzi, R. Target scattering decomposition in terms of roll-invariant target parameters. IEEE Trans. Geosci. Remote Sens. 2007, 45, 73–84. [Google Scholar] [CrossRef] [Scilit]
- Yamaguchi, Y.; Yajima, Y.; Yamada, H. A four-component decomposition of POLSAR images based on the coherency matrix. IEEE Geosci. Remote Sens. Lett. 2006, 3, 292–296. [Google Scholar] [CrossRef] [Scilit]
- Van Zyl, J.J. Application of cloude’s target decomposition theorem to polarimetric imaging radar data. Proc. SPIE 1992, 1748, 184–212. [Google Scholar]
- Pope, K.; Benayas, J.; Paris, J. Radar remote sensing of forest and wetland ecosystems in the central american tropics. Remote Sens. Environ. 1994, 48, 205–219. [Google Scholar] [CrossRef] [Scilit]
- Kim, Y.; Zyl, J.J.V. A time-series approach to estimate soil moisture using polarimetric radar data. IEEE Trans. Geosci. Remote Sens. 2009, 47, 2519–2527. [Google Scholar]
- Bhang, K.J.; Schwartz, F.W.; Braun, A. Verification of the vertical error in C-Band SRTM DEM using ICESat and Landsat-7, otter tail county, mn. IEEE Trans. Geosci. Remote Sens. 2007, 45, 36–44. [Google Scholar] [CrossRef] [Scilit]
- Pottier, E.; Ferro-Famil, L. PolSARPro v5.0: An esa educational toolbox used for self-education in the field of POLSAR and POL-INSAR data analysis. In Proceedings of the 2012 IEEE International Geoscience and Remote Sensing Symposium, Munich, Germany, 22–27 July 2012; pp. 7377–7380. [Google Scholar]
- ESA. Sentinel-1 Toolbox. Available online: https://sentinel.esa.int/web/sentinel/toolboxes/sentinel-1 (accessed on 7 June 2016).
- Shimada, M.; Isoguchi, O.; Tadono, T.; Isono, K. PALSAR radiometric and geometric calibration. IEEE Trans. Geosci. Remote Sens. 2009, 47, 3915–3932. [Google Scholar] [CrossRef] [Scilit]
- Breit, H.; Fritz, T.; Balss, U.; Lachaise, M.; Niedermeier, A.; Vonavka, M. TerraSAR-X SAR processing and products. IEEE Trans. Geosci. Remote Sens. 2010, 48, 727–740. [Google Scholar] [CrossRef] [Scilit]
- Dobson, A.J.; Barnett, A. An Introduction to Generalized Linear Models; CRC Press: Boca Raton, FL, USA, 2008. [Google Scholar]
- R Development Core Team R: A Language and Environment for Statistical Computing; R Foundation for Statistical Computing: Vienna, Austria, 2016.
- Calcagno, V. Glmulti: Model Selection and Multimodel Inference Made Easy, R Package. 2013. Available online: https://cran.r-project.org/web/packages/glmulti/glmulti.pdf (accessed on 15 January 2018).
- Burnham, K.; Anderson, D.; Huyvaert, K. Aic model selection and multimodel inference in behavioral ecology: Some background, observations, and comparisons. Behav. Ecol. Sociobiol. 2011, 65, 23–35. [Google Scholar] [CrossRef] [Scilit]
- Arnesen, A.S.; Silva, T.S.F.; Hess, L.L.; Novo, E.M.L.M.; Rudorff, C.M.; Chapman, B.D.; McDonald, K.C. Monitoring flood extent in the lower Amazon river floodplain using ALOS/PALSAR scansar images. Remote Sens. Environ. 2013, 130, 51–61. [Google Scholar] [CrossRef] [Scilit]
- Furtado, L.F.d.A.; Silva, T.S.F.; Fernandes, P.J.F.; Novo, E.M.L.d.M. Land cover classification of lago grande de curuai floodplain (Amazon, Brazil) using multi-sensor and image fusion techniques. Acta Amaz. 2015, 45, 195–202. [Google Scholar] [CrossRef] [Scilit]
- Liesenberg, V.; Gloaguen, R. Evaluating SAR polarization modes at L-band for forest classification purposes in eastern Amazon, Brazil. Int. J. Appl. Earth Obs. 2013, 21, 122–135. [Google Scholar] [CrossRef] [Scilit]
- Martins, F.S.R.V.; Santos, J.R.; Galvão, L.S.; Xaud, H.A.M. Sensitivity of ALOS/PALSAR imagery to forest degradation by fire in northern Amazon. Int. J. Appl. Earth Obs. 2016, 49, 163–174. [Google Scholar] [CrossRef] [Scilit]
- Toan, T.L.; Beaudoin, A.; Riom, J.; Guyon, D. Relating forest biomass to SAR data. IEEE Trans. Geosci. Remote Sens. 1992, 30, 403–411. [Google Scholar] [CrossRef] [Scilit]
- Treuhaft, R.; Gonçalves, F.; Santos, J.R.D.; Keller, M.; Palace, M.; Madsen, S.N.; Sullivan, F.; Graça, P.M.L.A. Tropical-forest biomass estimation at X-Band from the spaceborne TanDEM-X interferometer. IEEE Geosci. Remote Sens. Lett. 2015, 12, 239–243. [Google Scholar] [CrossRef] [Scilit]
- Li, X.; Touzi, R.; Guo, H. Land cover characterization and classification using polarimetric ALOS PALSAR. In Proceedings of the IGARSS 2008—2008 IEEE International Geoscience and Remote Sensing Symposium, Boston, MA, USA, 7–11 July 2008; pp. IV-1276–IV-1279. [Google Scholar]
- Storie, J.; Lawson, A.; Storie, C. Using L-band SAR images to map coastal wetlands. In Proceedings of the 2012 IEEE International Geoscience and Remote Sensing Symposium, Munich, Germany, 22–27 July 2012; pp. 757–759. [Google Scholar]
- Touzi, R.; Omari, K.; Gosselin, G.; Sleep, B. Polarimetric L-band ALOS for peatland subsurface water monitoring. In Proceedings of the 2013 Asia-Pacific Conference on Synthetic Aperture Radar (APSAR), Tsukuba, Japan, 23–27 September 2013; pp. 53–56. [Google Scholar]
- Feldpausch, T.R.; Banin, L.; Phillips, O.L.; Baker, T.R.; Lewis, S.L.; Quesada, C.A.; Affum-Baffoe, K.; Arets, E.J.M.M.; Berry, N.J.; Bird, M.; et al. Height-diameter allometry of tropical forest trees. Biogeosciences 2011, 8, 1081–1106. [Google Scholar] [CrossRef] [Scilit]
- Kaasalainen, S.; Holopainen, M.; Karjalainen, M.; Vastaranta, M.; Kankare, V.; Karila, K.; Osmanoglu, B. Combining Lidar and synthetic aperture radar data to estimate forest biomass: Status and prospects. Forests 2015, 6, 252–270. [Google Scholar] [CrossRef] [Scilit]
- Feldpausch, T.R.; Lloyd, J.; Lewis, S.L.; Brienen, R.J.W.; Gloor, M.; Monteagudo Mendoza, A.; Lopez-Gonzalez, G.; Banin, L.; Abu Salim, K.; Affum-Baffoe, K.; et al. Tree height integrated into pantropical forest biomass estimates. Biogeosciences 2012, 9, 3381–3403. [Google Scholar] [CrossRef] [Scilit]
- Mitchard, E.T.A.; Feldpausch, T.R.; Brienen, R.J.W.; Lopez-Gonzalez, G.; Monteagudo, A.; Baker, T.R.; Lewis, S.L.; Lloyd, J.; Quesada, C.A.; Gloor, M.; et al. Markedly divergent estimates of Amazon forest carbon density from ground plots and satellites. Glob. Ecol. Biogeogr. 2014, 23, 935–946. [Google Scholar] [CrossRef] [Scilit] [PubMed]
- Moreira, A.; Krieger, G.; Younis, M.; Hajnsek, I.; Papathanassiou, K.; Eineder, M.; Zan, F.D. Tandem-L: A mission proposal for monitoring dynamic earth processes. In Proceedings of the 2011 IEEE International Geoscience and Remote Sensing Symposium, Vancouver, BC, Canada, 24–29 July 2011; pp. 1385–1388. [Google Scholar]
- Krieger, G.; Hajnsek, I.; Papathanassiou, K.; Eineder, M.; Younis, M.; Zan, F.D.; Huber, S.; Lopez-Dekker, P.; Prats, P.; Werner, M.; et al. Tandem-L: And innovative interferometric and polarimetric SAR mission to monitor earth system dynamics with high resolution. In Proceedings of the 2010 IEEE International Geoscience and Remote Sensing Symposium, Honolulu, HI, USA, 25–30 July 2010; pp. 253–256. [Google Scholar]
- Nasa Science Missions, Global Ecosystem Dynamics Investigation Lidar (GEDI). Available online: http://science.nasa.gov/missions/gedi/ (accessed on 1 December 2017).
- Ho Tong, D.; Le Toan, T.; Rocca, F.; Tebaldini, S.; Villard, L.; Réjou-Méchain, M.; Phillips, O.L.; Feldpausch, T.R.; Dubois-Fernandez, P.; Scipal, K.; et al. SAR tomography for the retrieval of forest biomass and height: Cross-validation at two tropical forest sites in french guiana. Remote Sens. Environ. 2016, 175, 138–147. [Google Scholar] [CrossRef] [Scilit]
- Rosen, P.A.; Kim, Y.; Kumar, R.; Misra, T.; Bhan, R.; Sagi, V.R. Global persistent SAR sampling with the NASA-ISRO SAR (NISAR) mission. In Proceedings of the 2017 IEEE Radar Conference (RadarConf), Seattle, WA, USA, 8–12 May 2017; pp. 0410–0414. [Google Scholar]
- Ningthoujam, R.K.; Balzter, H.; Tansey, K.; Feldpausch, T.R.; Mitchard, E.T.A.; Wani, A.A.; Joshi, P.K. Relationships of S-band radar backscatter and forest aboveground biomass in different forest types. Remote Sens. 2017, 9, 1116. [Google Scholar] [CrossRef] [Scilit]
- Ningthoujam, R.K.; Balzter, H.; Tansey, K.; Morrison, K.; Johnson, S.C.M.; Gerard, F.; George, C.; Malhi, Y.; Burbidge, G.; Doody, S.; et al. Airborne S-band SAR for forest biophysical retrieval in temperate mixed forests of the UK. Remote Sens. 2016, 8, 609. [Google Scholar] [CrossRef] [Scilit]
- Ningthoujam, R.K.; Tansey, K.; Balzter, H.; Morrison, K.; Johnson, S.C.M.; Gerard, F.; George, C.; Burbidge, G.; Doody, S.; Veck, N.; et al. Mapping forest cover and forest cover change with airborne S-band radar. Remote Sens. 2016, 8, 577. [Google Scholar] [CrossRef] [Scilit]


© 2018 by the authors. Licensee MDPI, Basel, Switzerland. This article is an open access article distributed under the terms and conditions of the Creative Commons Attribution (CC BY) license (http://creativecommons.org/licenses/by/4.0/).