Article

Simulation of Bidirectional Reflectance in Broken Clouds: From Individual Realization to Averaging over an Ensemble of Cloud Fields

by
Tatiana Zhuravleva
* and
Ilmir Nasrtdinov
V.E. Zuev Institute of Atmospheric Optics SB RAS, 1, Academician Zuev Square, Tomsk 634055, Russia
*
Author to whom correspondence should be addressed.
Remote Sens. 2018, 10(9), 1342; https://doi.org/10.3390/rs10091342
Submission received: 11 July 2018 / Revised: 16 August 2018 / Accepted: 16 August 2018 / Published: 22 August 2018
(This article belongs to the Special Issue Radiative Transfer Modelling and Applications in Remote Sensing)

Abstract

:
In this paper, we describe the results of simulating the bidirectional reflectance in three-dimensional (3D) cloud fields. For the calculations of reflectance, we use original statistical algorithms that ensure the effects of atmospheric sphericity and molecular absorption in the solar spectral range are accounted for. Cloud fields are simulated on the basis of a Poisson model of broken clouds; clouds are approximated by truncated paraboloids of rotation. The cloud heterogeneity effect on the averaging of reflection functions over an ensemble of cloud fields is estimated using numerical averaging of the stochastic radiative transfer equation, using a randomization. The simulation is performed for a mono-directional receiver with wavelength channels 0.55 and 2.15 µm, different realizations with small and moderate cloud fractions, and a set of sun-view geometries. With the appearance of an isolated cloud in the sky, the reflection function is determined by cloud presence/absence on the line of sight (LS), shading of LS by clouds/non-obscuration directed “toward the Sun,” and illumination of LS by cloud-reflected radiation. Passage to cloud fields gives rise to such additional factors as mutual shading and multiple scattering between clouds, which are mainly determined by cloud elements located near LS and directed “toward the Sun”. Strong fluctuations of reflectance as a function of the relative azimuth angle between sun and view directions in a specific realization are smoothed out after averaging over an ensemble of cloud fields. In interpreting the results of retrieving the cloud characteristics according to measurements of reflected radiation, it should be kept in mind that for fixed illumination conditions, the mean bidirectional reflectance may differ several-fold from bidirectional reflectance in a specific 3D cloud structure.

Graphical Abstract

1. Introduction

For more correct solutions to a number of atmospheric remote sensing problems (retrieval of aerosol and cloud characteristics, improved interpretation of ground-based and satellite observations, cloud “screening” in solving inverse problems [1,2,3,4,5,6,7,8,9,10,11,12,13], etc.), it is necessary to calculate the spatial, spectral, and angular characteristics of radiance fields of the cloudy atmosphere, taking into account its spatial inhomogeneity.
Solving the radiative transfer equation (RTE) in a specific two-dimensional (2D) or three-dimensional (3D) realization and ensuring a correct account of the spatial inhomogeneity of optical-geometric characteristics of clouds envisages the availability of methods for constructing the cloud fields. At present, the existing approaches make it possible to solve this problem using two main classes of cloud models. One class consists of dynamic, physical-based models requiring specification of the set of atmospheric parameters (in particular, Large Eddy Simulation (LES) cloud models [14]). The other class consists of stochastic cloud models, which are based on satellite, aircraft, or ground-based measurements and generate cloud fields, which are close, in some degree, to the observed ones: Gauss [15,16,17], cascade [18,19], Poisson [20,21], and other models [22,23,24,25,26]. These models are undoubtedly advantageous in that they are constructive in character, making it possible to interpret the results of solving the RTE, taking into account the cloud configuration in an individual realization.
However, the realizations of 3D cloud fields cannot always be constructed or are expensive to obtain. Besides, in many practical applications, RTE in complex media cannot be solved numerically in view of enormous computer time consumptions. At the same time, the regularities of radiative transfer in the cloudy atmosphere and the development of possible approaches to parametrizing the 3D cloud-radiation interaction can be gained on the basis of a statistical approach, essentially consisting of determining and analyzing the interrelation between statistical characteristics of the cloud and radiation fields.
The mean radiative properties can be obtained by numerical or analytical averaging of the radiative transfer equation. An ideologically simple method is numerical RTE averaging, reduced to simulating a large number of cloud realizations and solving the deterministic radiative transfer equation for each 3D realization of the scattering and absorbing medium. However, even with the use of certain extra tricks, such as randomization (introducing additional randomness [27]), these methods are still computationally inefficient. Analytical RTE averaging is based on solving new transport equations, which are derived in the framework of statistical radiative transfer theory and relate the statistical characteristics of cloud and radiation fields [20,21,28,29,30,31,32] (Subsequently, this approach was adapted to describe vegetation reflective properties and partly implemented to operationally produce the leaf area index and the fraction of canopy absorbed radiation from MODIS and MISR data [33,34]).
The analytical RTE averaging approach ensures much less labor for the radiation calculations compared to numerical RTE averaging. However, it should be kept in mind that analytical averaging can be performed only under certain assumptions on the structure of the cloud field; therefore, equations obtained as a result of the procedure of averaging are approximate.
In this paper, we present the results of simulating bidirectional reflectance, R [35,36], in individual deterministic realizations
R λ ( μ , μ 0 , φ ) = π I λ ( μ , μ 0 , φ ) / ( μ 0 F 0 λ )
and in ensemble averages R
R λ ( μ , μ 0 , φ , ) = π I λ ( μ , μ 0 , φ ) / ( μ 0 F 0 λ )
where I ( μ , μ 0 , φ ) is the reflected radiance at the top of the atmosphere (TOA), μ 0 is the cosine of the solar zenith angle (SZA), μ is the cosine of the viewing zenith angle (VZA), φ is the relative azimuth angle between sun azimuth angle and viewing azimuth angle, F 0 λ is the incident solar irradiance at the TOA, and subscript λ is the wavelength. Brackets indicate the radiative characteristics averaged over the ensemble of cloud fields.
Since bidirectional reflectance is an input parameter in the algorithms for retrieving cloud characteristics from satellite sensing data (cloud optical depth (COD, τ c l d ) and effective radius of cloud particles (REF, r e f )), in past decades there appeared numerous theoretical studies of reflection function R that were compared with data from measurements [35,36,37,38,39]. It is shown that, besides such characteristics as the averaging scale, instrument/orbit properties, etc., the results of retrieving COD and REF depend strongly on sun-view geometry and cloud heterogeneity. This is confirmed by the simulation results in 2D and 3D cloud models [38,40,41,42,43,44,45,46].
In a number of works, the reflectances were calculated in inhomogeneous cloud fields, constructed in the frameworks of LES models: e.g., in [4,47] the reflection functions are simulated in cumulus (Cu) and stratocumulus (Sc) clouds, presented in the International Intercomparison of 3D Radiation Codes (I3RC) phase 2 [48]. Here we present model calculations of bidirectional reflectance, performed using the Poisson model of broken clouds [20,21], which, as with other stochastic models, makes it possible to substantially increase the set of cloud realizations considered.
At the initial stage of model development, the intensity moments (average, variance, and correlation function) were calculated in the plane–parallel model of the atmosphere on the basis of both numerical and analytical averaging of the radiative transfer equation. The approach to analytical RTE averaging presented by G. Titov in [20,21] is designed for use in the model of statistically homogeneous clouds (clouds are approximated by right parallelepipeds and cylinders, the bases of which may be shaped as circles, ellipses, polygons, etc., and the optical characteristics do not change after transition from one cloud to another). E. Kassianov [49] generalized this approach for a statistically inhomogeneous Markovian model; however, the derived equations for calculating the ensemble-averaged radiative properties are also approximate. In our later works, we developed algorithms for calculating the spectral-angular characteristics of radiance fields of reflected and transmitted solar radiation in the presence of an isolated cloud, a specific cloud realization, and ensemble average cloud fields, taking into account the effects of atmospheric sphericity [50,51,52].
The outline of this paper is as follows. Section 2 describes the atmospheric model and Monte Carlo algorithms for radiation calculations in an individual realization and averaging over an ensemble of cloud fields. Section 3 analyzes the regularities of formation of bidirectional reflectances of isolated clouds and specific 3D cloud fields, as well as mean reflection functions for different sun-view geometries and cloud fractions. A summary is given in Section 4. The Appendix A is devoted to a brief description of techniques that make it possible to reduce the laboriousness of the radiation codes used.

2. Model of the Atmosphere and Calculation Algorithms

This section briefly describes the model of the spherical atmosphere and the algorithms for calculating the spectral-angular characteristics of radiance fields in individual cloud realization and for ensemble averages [50,51,52].

2.1. Atmospheric Model

The spherical model was specified in the global Cartesian coordinate system (GCS) OXYZ, whose origin coincides with the Earth’s center (point O), while the OZ axis is defined by the position of receiver (point A) at the level of the underlying surface or at the top of the atmosphere, see Figure 1a. For convenience in specifying the input parameters and representing the calculation results, we also introduced a local coordinate system (LCS) AXYZ′, defined by the axis AZ′ passing through the observation point (OP) A′ on the Earth’s surface and origin O of the global coordinate system. When viewed from the Earth’s surface, GCS and LCS differ only by positions of origins of coordinate systems, and when viewed from TOA, the coordinate systems also differ in the orientation of axes. Directions “toward receiver” ω r e c = ( VZA ,   VAA ) and “toward the Sun” ω S u n = ( SZA ,   SAA ) were defined by zenith and azimuth angles in the local coordinate system: The zenith angles were counted from the positive direction of the AZ′ axis, and the positive direction of the AX′ axis was chosen such that VAA = 180°.
A parallel flux of monochromatic solar radiation with power F 0 λ is incident on the outward surface of the atmosphere, i.e., a sphere with radius R a t m = R 0 + 100 km, where R 0 = 6371 km is the Earth’s radius.

2.1.1. Poisson Cloud Model

In the Poisson model, the 3D cloud fields are simulated in two stages. At the first stage, we determine the amount of clouds N on a limited section of surface with area S in accordance with the specified cloud fraction CF and the area of cloud base S b . The second task is to generate the coordinates of cloud centers on a given surface.
The number of cloud centers N is simulated according to the Poisson distribution and determined from the formula
N = min { i : k = 0 i α k < e η S } ,   η = ln ( 1 C F ) / S b ,
where 0 α k 1 are random numbers, and η is the two-dimensional Poisson parameter [21]. Analysis showed that in order to simulate N in fields with large areas, it is reasonable to divide S into n sections with area S i , and to simulate the quantity N i , i = 1 , n ¯ , each in accordance with Equation (3). The final number of cloud centers on the surface with area S is determined by the sum N = i = 1 n N i .
Clouds are approximated by inverted truncated paraboloids of rotation with semiaxes of base p x = p y , geometric thickness H c l d , and constant optical characteristics. Cloud centers are defined in the local coordinate system AXYZ′ by distance D c l d between observation point A′ and the projection of paraboloid center onto the Earth (C), by the azimuth angle φ c l d between rays AX′ and AC, and by the height of the center of cloud base above the Earth’s surface Z c l d , as shown in Figure 1b.
In the plane-parallel model of the atmosphere, the coordinates of cloud centers are simulated using standard algorithms for modeling points, uniformly distributed over a circle of a given radius or an area-equivalent square [21]. In the spherical model, a cloud center is taken to mean the center of the cloud base, formed at the intersection of a paraboloid with a sphere with the radius ( R 0 + Z c l d ). In this case, uniformly distributed cloud centers are simulated on a segment of the sphere. Since the segment of the sphere is an unfolded curvilinear surface, the solution of the problem becomes nontrivial. In the present work, this task was solved using the approach in [53].

2.1.2. Optical Model of the Atmosphere

It is assumed that the atmosphere consists of N l a y layers, and within each layer the pressure, the temperature, and the concentration of the atmospheric gases are constant.
The optical model of the molecular-aerosol atmosphere is completely defined, if each ith layer is assigned the coefficients of aerosol extinction σ a ( λ , z ) = σ a , i ( λ ) and scattering σ a , s ( λ , z ) = σ a , s , i ( λ ) , aerosol scattering phase function g a ( λ , z , μ ) = g a , i ( λ , μ ) , coefficients of molecular scattering σ R ( λ , z ) = σ R , i ( λ ) and absorption ε m ( λ , z ) = ε m , i ( λ ) , as well as the Rayleigh scattering phase function g R ( μ ) = 3 ( 1 + μ 2 ) / 8 ; z is the altitude above the Earth’s surface. Clouds may reside within more than one layer; however, in the framework of this work, the vertical variations in extinction and scattering coefficients, as well as in the scattering phase function were disregarded: σ c l d ( λ , z ) = σ c l d ( λ ) , σ c l d , s ( λ , z ) = σ c l d , s ( λ ) , g c l d ( λ , z , μ ) = g c l d ( λ , μ ) .
The stratification and spectral behavior of the aerosol optical characteristics and cloud optical characteristics are specified on the basis of commonly adopted models (see [54,55] for examples), while the molecular scattering coefficients are those on the basis of a LOWTRAN7 model [56]. It is assumed that the incident radiation is reflected from the underlying surface according to the Lambert law with albedo A s ( λ ) [57].
Note that the above-listed characteristics pertain to monochromatic radiation. However, they can also be extended to a finite spectral interval Δ λ = ( λ 1 , λ 2 ) , provided that the optical properties of the medium within Δ λ do not change significantly. In the case of the selective absorption, ε m ( λ ) may be strongly oscillating functions even within very narrow spectral intervals. In this case, the molecular absorption is accounted for using the k-distribution method, in accordance with which the transmission function of atmospheric gases T Δ λ within the wavelength interval Δ λ is represented as a finite exponential series [58].

2.2. Calculation Algorithms

This subsection briefly describes the Monte Carlo algorithms to calculate the intensities of solar radiation I in the spherical atmospheric model within 3D cloud fields and ensemble averages I ([50,51,52], see also Appendix A). These algorithms are parts of the Monte Crlo Codes for THree-DimensionAl Radiative Transfer (MATHART) software package developed by the Institute of Atmospheric Optics, Siberian Branch, Russian Academy of Sciences.

2.2.1. 3D Cloud Fields

To solve the RTE in a realization of an inhomogeneous cloud field, modelers have recently developed many radiation codes, mostly relying upon statistical algorithms (see [59] for example and the bibliography therein). Despite the general ideology, the Monte Carlo algorithms differ in the features of their implementation. The specific features of the algorithms stem, in particular, from the manner of specifying the spatial distribution of optical and geometrical cloud characteristics.
One of the most widespread techniques for specifying 2D and 3D cloud fields is to represent them as a set of cuboids with small sizes (from tens to hundreds of meters), within each of which the cloud optical characteristics are constant. A reliable method of identifying the errors and improving the specific radiation codes in such complex media is to compare the calculations using different methods of RTE solution or modifications within the same method. These comparisons were performed, e.g., in the framework of I3RC [48].
In the Poisson model, cloud elements are approximated by inverted truncated paraboloids “embedded” in the molecular-aerosol atmosphere. Within a paraboloid, which has vertical and horizontal sizes of a few hundred meters, the cloud optical characteristics are constant. Taking into account the complex structure of this field and the effects caused by the sphericity of the atmosphere, we developed a few modifications of the statistical algorithm to simulate scattered solar radiation. A common feature of all the modifications is the method of adjoint walks, but they differ in the manners in which they simulate the free path length (analog simulation and method of maximal cross-section) and account for the molecular absorption [60].
Cross-checks of different modifications of the algorithms showed that the relative difference between simulation results is comparable to the relative calculation error (1–2%) [50]. Comparing algorithm labor consumption, it follows that algorithm efficiency depends on cloud amount N in a specific cloud realization. For a small cloud amount, the most efficient modification will be the one in which a photon-free path length is simulated in accordance with the principles of analog simulation. As the cloud amount increases, the method of maximal cross-section leads to a certain decrease in the algorithm laboriousness for comparable calculation accuracy.
Represented as a finite exponential series, the atmospheric gas transmission function makes it possible to account for the molecular absorption in two ways [61]. In the present work, scattered solar radiation is simulated using the most efficient method, based on the idea of time separation of the events of (i) molecular absorption and (ii) scattering and absorption by cloud and aerosol particles [60,62], permitting the transmission function T Δ λ ( l ) to be interpreted as the photon survival probability on a path of length l from the moment of photon entry into the medium along the given trajectory [60].

2.2.2. Averaging over Ensemble of Realizations

Calculation of mean intensity I was based on numerical averaging of stochastic RTE. When this approach is used, no restrictions on cloud models are essentially imposed, except the requirement to construct a sampling realization of the cloud field in the form of a three-dimensional scattering and absorbing medium.
Efficiency of simulating mean intensity was achieved by introducing additional randomness (randomization) [21,27,52]. At the first step, a 3D cloud field is constructed in accordance with the approach described in Section 2.1.1. Next, an approximate value of radiation intensity I is calculated for each cloud field out of the specified set of N κ realizations. (An approximate solution of RTE envisages that simulation is performed with a smaller number of photon trajectories N χ compared to the number of trajectories required for an “exact,” in a statistical sense, RTE solution.) At the final stage, values of radiation intensity are averaged over the ensemble of cloud field realizations.
In calculating average values I , it is important to select a statistic ( N χ ,   N κ ) that ensures the prescribed accuracy of the calculations using reasonable computer time. A no less considerable task is to choose the size of the cloud field and its position in space. Both of these problems are discussed in Appendix A.

3. Results of Numerical Simulation

We will consider how reflectance is formed in the appearance of an isolated cloud in the sky, in a specific 3D cloud field, and, finally, during averaging over the set of cloud realizations. Certain regularities of solar radiative transfer in the presence of an isolated cloud and in individual cloud realizations were presented in our earlier work [51]. However, for deeper insight into the effects of the horizontal cloud inhomogeneity observed in the analysis of mean reflectance R , we will briefly describe the most important of these results. We note that, in contrast to [53], in the present paper we consider not the intensity of reflected radiation, but rather the reflection functions, calculated according to Equations (1) and (2).
The main calculations were performed for two spectral intervals, 0.55 μm and 2.15 μm (spectral resolution is 0.025 μm), and fixed cloud parameters: p x = p y = 0.5   km , H c l d = 1 km, Z c l d = 1 km, extinction coefficient σ c l d = 10 km–1, surface albedo AS(λ = 0.55 μm) was equal to 0.097 (grass) [59], aerosol optical depth was assumed to be τa(λ = 0.55 μm) = 0.15. The spectral scattering phase functions and single scattering albedo of the aerosol (continental average) and clouds (cumulus continental clean, r e f = 5.77   μ m ) are those from the OPAC model [55]. The relative error of the intensity calculation does not exceed 1–3% in most cases. In this work, we confined ourselves to the consideration of a mono-directional receiver.

3.1. Isolated Cloud

Reflection in the presence of isolated cloud R c l d depends on a set of factors that can be conventionally divided into geometrical (viewing directions and illumination conditions, vertical and horizontal cloud sizes, cloud position in space) and optical (optical depth, and single scattering albedo and phase function). Below, we discuss the effects caused by the geometrical factors.
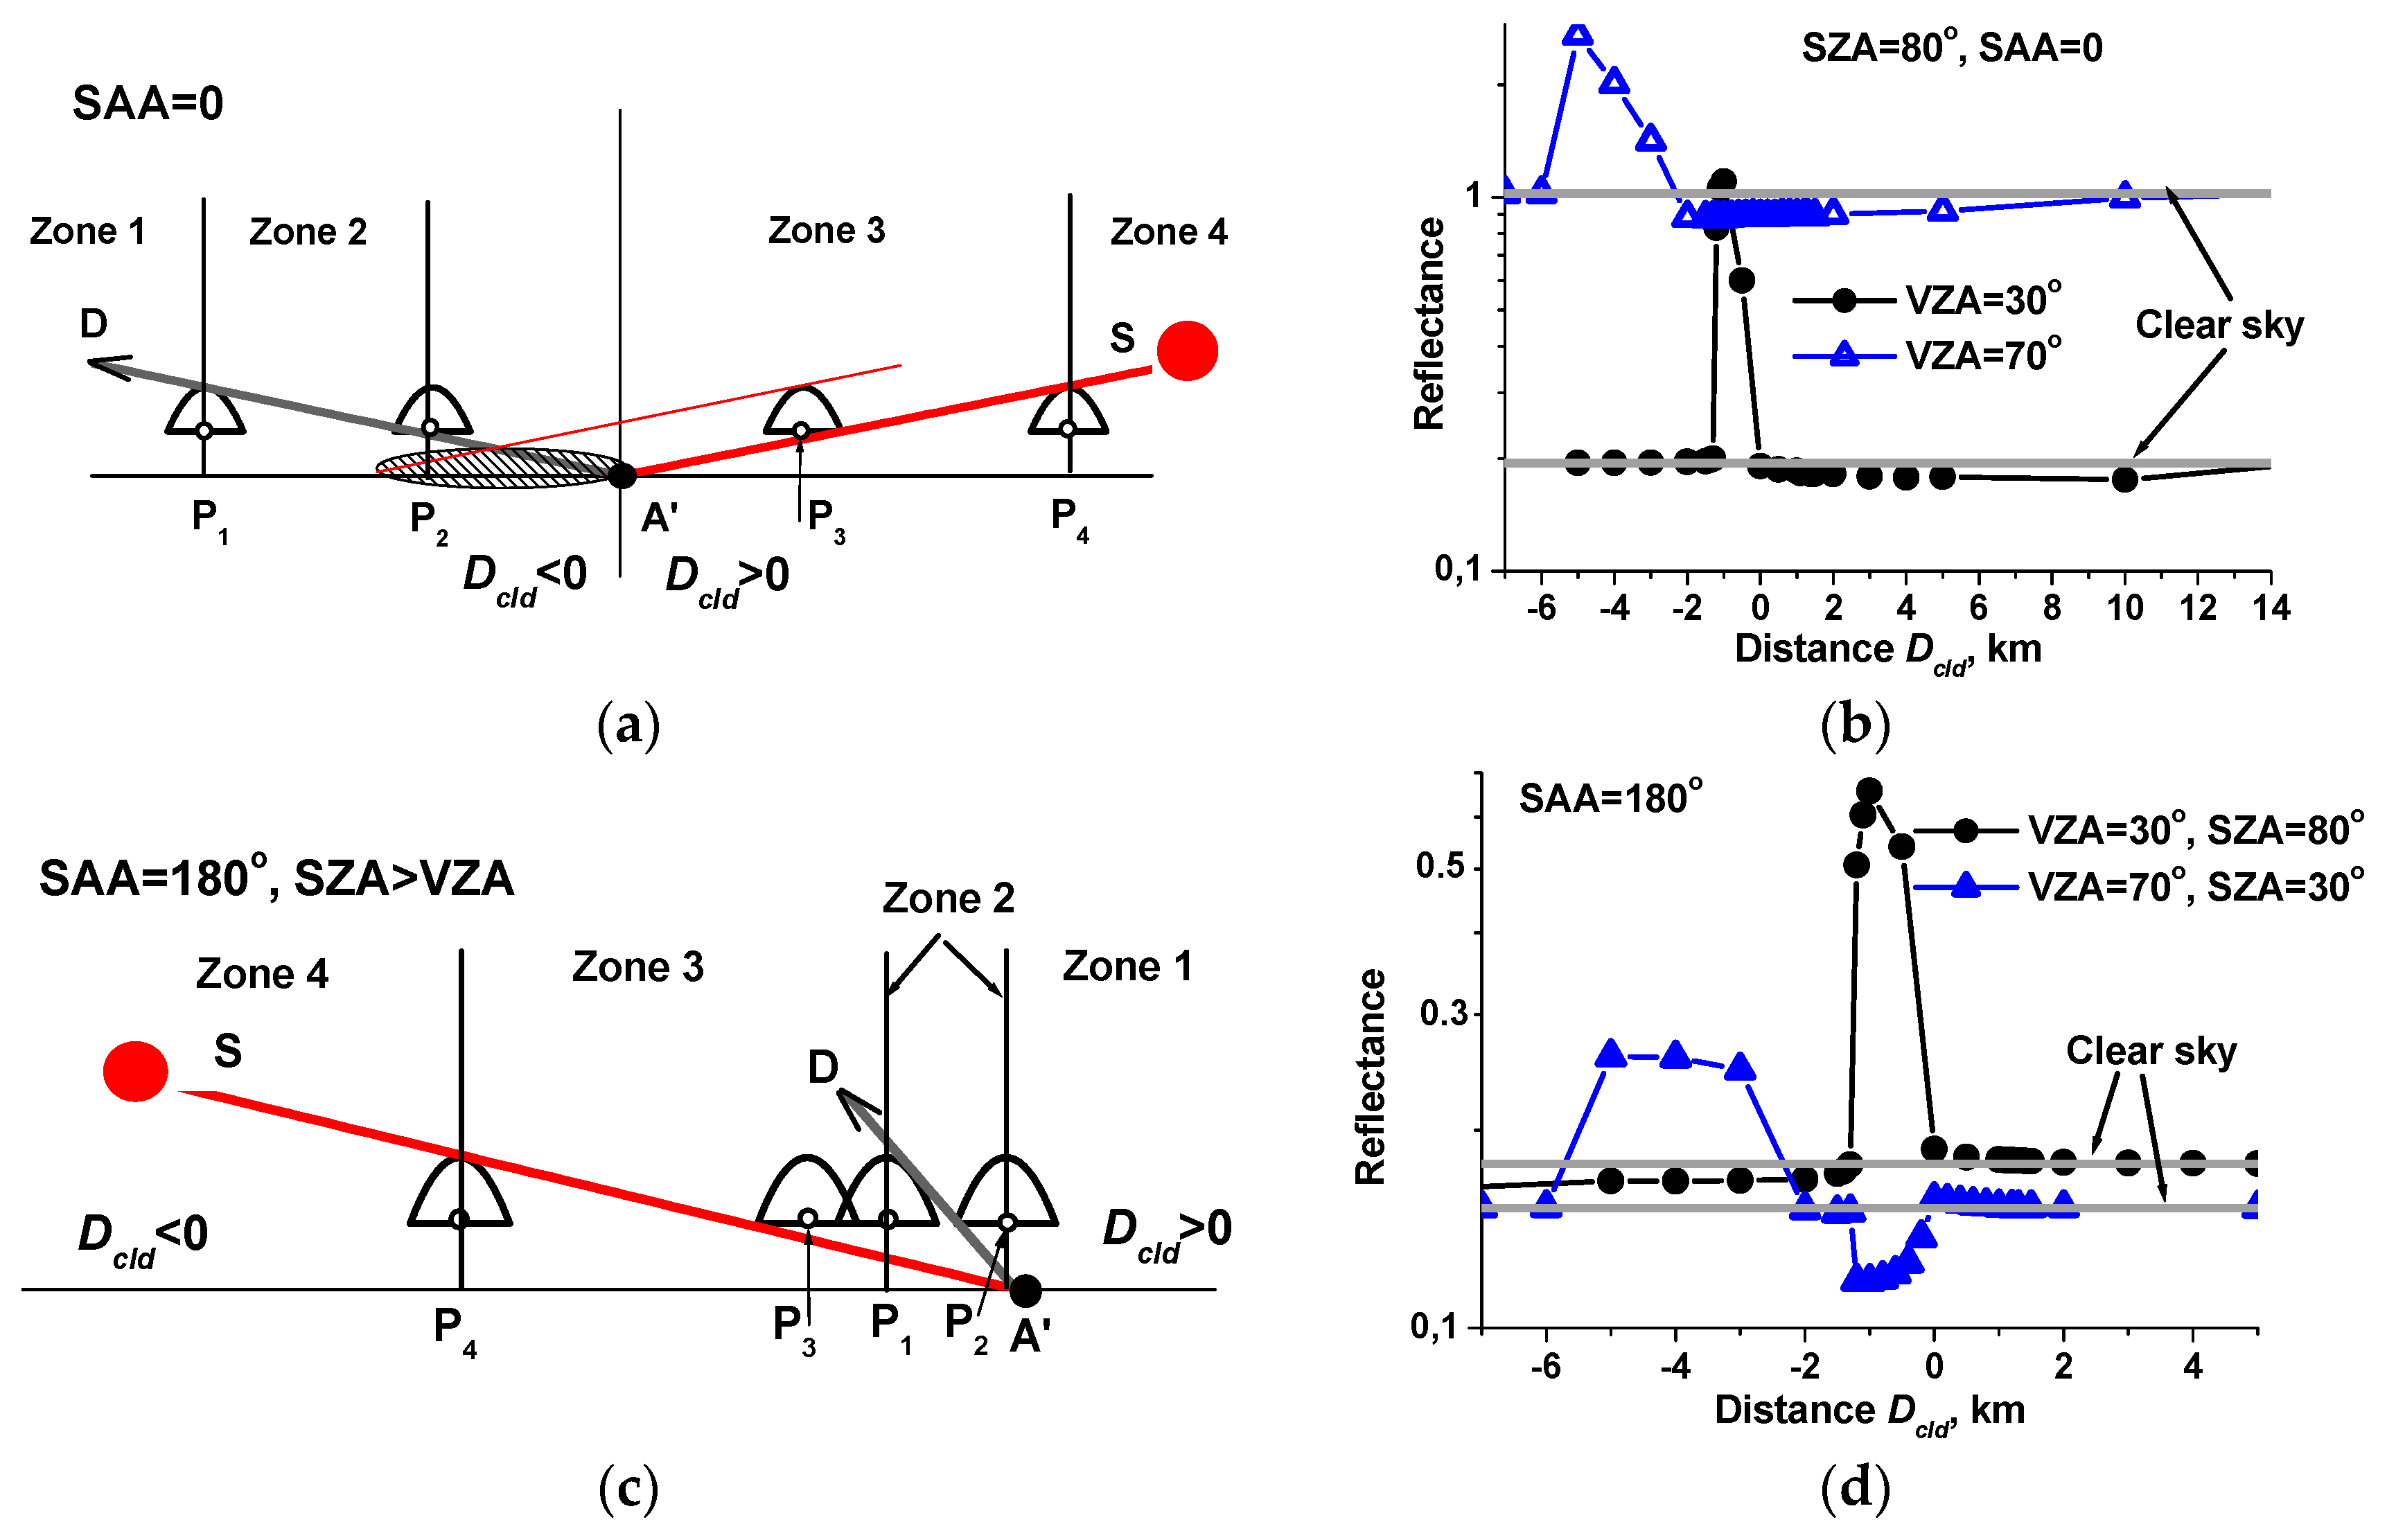
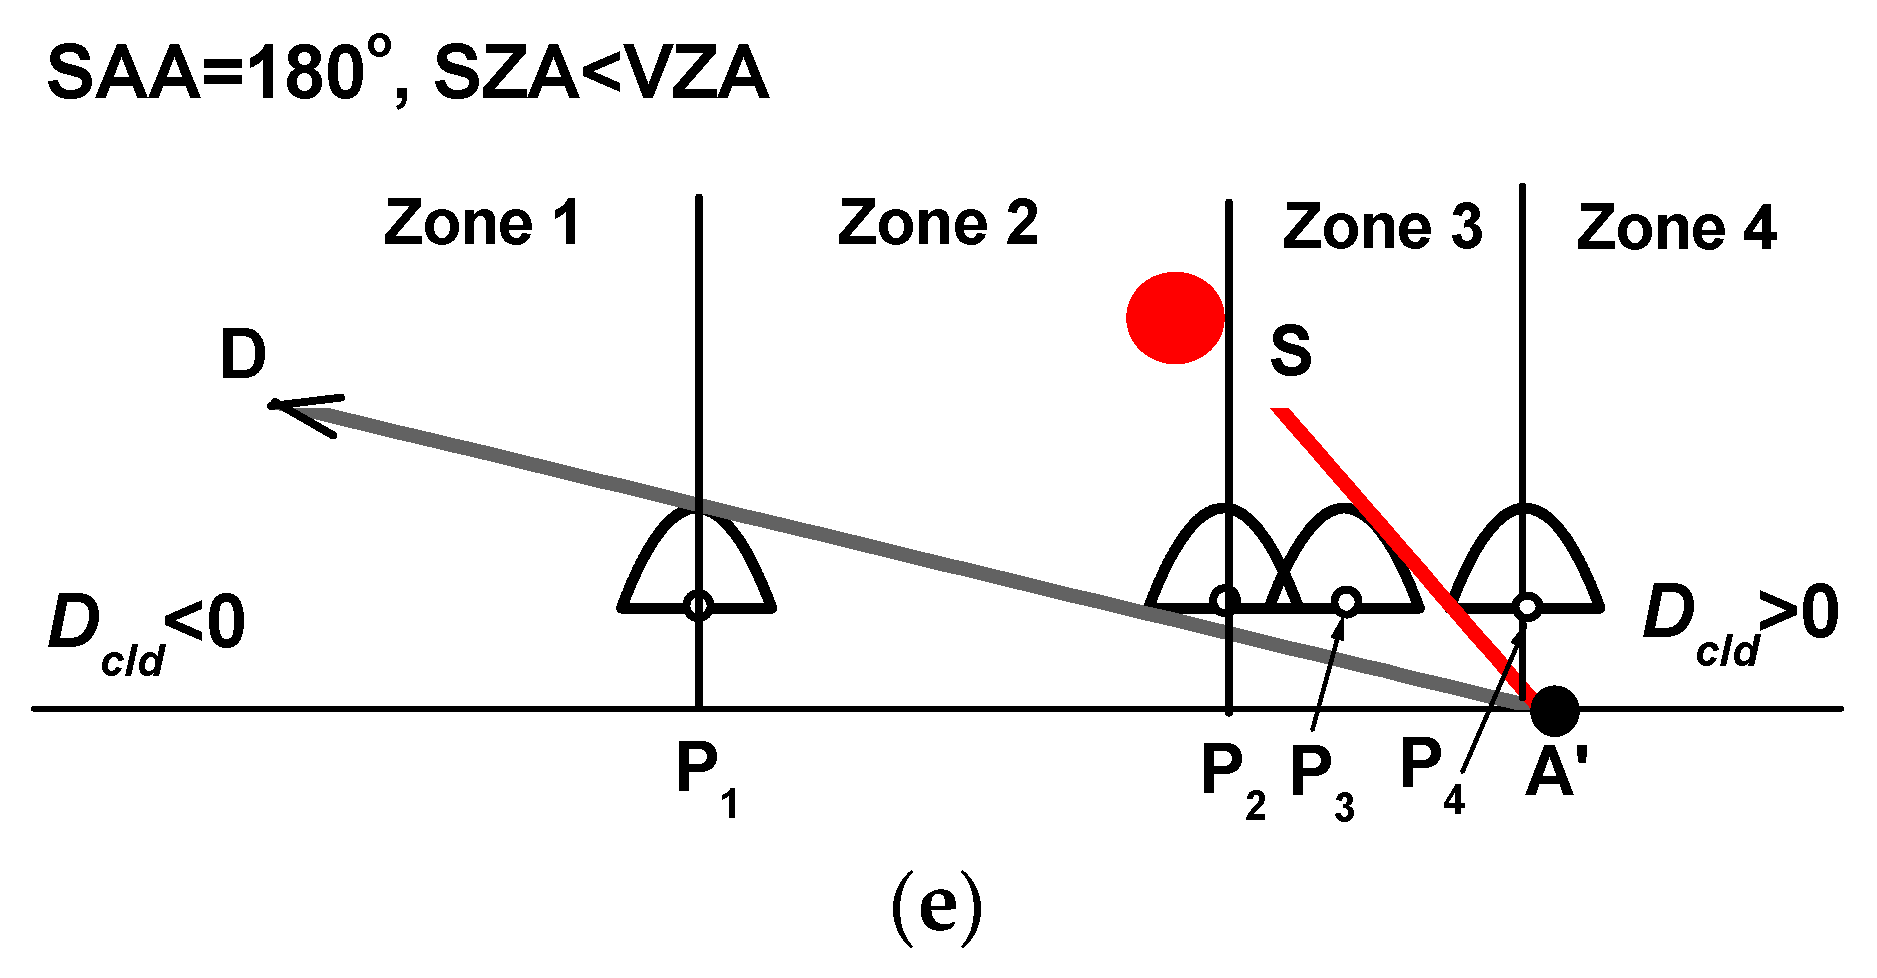
The spatial and angular characteristics of the sky radiance field were simulated under the assumption that the AXY′ plane, to which the line of sight (LS; ray AD) belongs, divides the cloud into two equal parts, as shown in Figure 2a,c,e. Negative and positive D c l d values correspond to cloud positions “to the left” ( φ c l d = 180°) and “to the right” ( φ c l d = 0 ) of observation point A′. The cloud is assumed to move from left to right relative to the observation point.
Depending on the D c l d , SZA, and VZA values, we can single out a few geometric zones, within each of which reflectance is governed by the same regularities. In the AXY′ plane, the boundaries between zones will be determined by the distance from point A′ to the projection of the cloud center onto the Earth’s surface, see Figure 2a,c,e.
We will consider the observation geometries, differing in viewing angles and illumination conditions: Solar azimuth angle SAA = 0 and SAA = 180°.
Case 1: SAA = 0 (antisolar location; Figure 2a,b).
The boundaries between Zones 1 and 2 (point P 1 ) and between Zones 3 and 4 (point P 4 ) are defined by the tangent planes to the paraboloid: The tangent line is defined by the viewing direction (ray AD) for Zones 1 and 2 and by the direction of direct solar rays (ray AS) for Zones 3 and 4, as shown in Figure 2a. A specific feature of Zone 2 is that the cloud is intersected by the line of sight. The boundary between Zones 2 and 3 is defined by point P 2 , where the cloud “leaves” LS. Within Zone 3, the cloud may shadow the line of sight and an area on the underlying surface, and may even shadow the observation point after its passage over point P 3 , where the cloud starts intersecting ray AS.
If the cloud is at quite a large distance from the OP, it has almost no effect on reflectance, as is the case for Zones 1 and 4 shown in Figure 2a: The difference between the reflection function in the presence ( R c l d ) and absence ( R c l r ) of cloud is comparable to the relative calculation error, as shown in Figure 2b. As the cloud approaches LS, radiation reflected from the cloud contributes to R c l d .
In Zone 2, the cloud is on the LS and R c l d is determined by two opposite factors. On the one hand, the increase in R c l d is due to the appearance of additional scatterers on the LS compared with the clear sky. The cloud is approximated by a truncated paraboloid, so that when it moves to the OP, the number of scatterers first increases and then decreases. On the other hand, the photon optical path length in the cloud is of importance (in terms of the single scattering theory, it is determined by the sum of photon optical paths from the point of photon entry into the cloud to the ray AD, and from the scattering point on the ray AD to the exit from the cloud). The greater the photon optical path length in the cloud, the smaller the reflectance.
At the beginning of Zone 2 (point P 1 ), the increased number of scatterers and relatively small photon optical path length within the cloud start to dominate. As a consequence, R c l d rapidly increases compared to clear-sky reflectance R c l r , see Figure 2b. As the cloud center approaches point P 2 , the effect of the second factor intensifies, causing the reflection function to decrease compared to R c l r .
Point P 2 is the boundary between Zones 2 and 3: When the cloud leaves LS, no extra attenuation of radiation by the cloud along this direction occurs, as shown in Figure 2a. As the cloud moves in Zone 3 from P2 to P3, the inequality R c l d < R c l r holds because a part of the line of sight is shaded, with the length and position of the shaded part on ray AD varying. As the cloud center moves from point P 3 to point P 4 , the observation point A′ is within the cloud shadow zone. This circumstance can also influence the relationship between R c l d and R c l r , especially for surface types with large A s ( λ ) .
In the examples considered above, the selected cloud sizes and observation geometries made it possible to distinctly single out the zones of motion, within each of which the reflectance was formed according to the same regularities. Obviously, the simulation results are far from being so easily interpreted all the time. For instance, for large horizontal cloud sizes, and for SZA and VZA close to zenith, the line of sight may intersect the cloud (Zone 2), and a segment of LS in the lower part of the atmosphere and the observation point may be shaded (Zone 3). In this case, the effects that dominate and determine the formation of the reflection function R c l d can be identified in numerical experiments.
Case 2: SAA = 180° (Figure 2c–e).
Analogous to the SAA = 0 case, the region between points P 1 and P 2 , where the cloud lies on the line of sight AD, will be called Zone 2: R c l d R c l r , see Figure 2c,e. In this region, reflectance R c l d is determined by the appearance of additional scatterers and a change in the photon optical path length in the cloud. The competitive character of these factors explains the nonmonotonic behavior of the reflection function as D c l d varies, see Figure 2d.
Analyzing variations in reflectance outside Zone 2, we consider two situations: SZA > VZA, see Figure 2c, and SZA < VZA, see Figure 2e. When SZA = 80° > VZA = 30°, the shadow region (Zone 3) occurs between points P 4 and P 1 . For the case when SZA = 30° < VZA = 70°, LS is shaded when the cloud moves from P 2 to P 4 . As in the SAA = 0 case, outside Zones 2 and 3, radiances R c l d and R c l r agree within the relative calculation error, as shown in Figure 2d.
Thus, with the appearance of an isolated cloud in the sky, reflection function R is determined by the presence or absence of cloud on the LS, the shading of LS by clouds/non-obscuring directed “toward the Sun”, and illumination of the LS by cloud-reflected radiation. If the LS intersects the cloud, reflectance R c l d may substantially exceed R c l r . The reflection function decreases due to the effects of cloud shading of the LS and OP on the Earth’s surface. The cloud impact zone may exceed the horizontal cloud sizes several-fold and substantially increases with solar and detector zenith angles.

3.2. Broken Cloud Field

In Section 3.1, we studied the changes in clear sky reflectance with the appearance of an isolated cloud in the sky. In a cloud field, 3D effects of isolated clouds are complemented by the effects of mutual cloud shading and radiation interaction, when part of the radiation, leaving through a cloud lateral surface, can be multiply scattered by surrounding clouds.
The joint effect of these factors is discussed below. The purpose of this research stage was to identify the specific features of the formation of reflection functions for different cloud configurations in a specific cloud field. Therefore, for ease of interpretation of results, we confine ourselves to the consideration of cloud fields of a relatively small area (S = 200 km2). The centers of cloud fields are located immediately above the observation point.
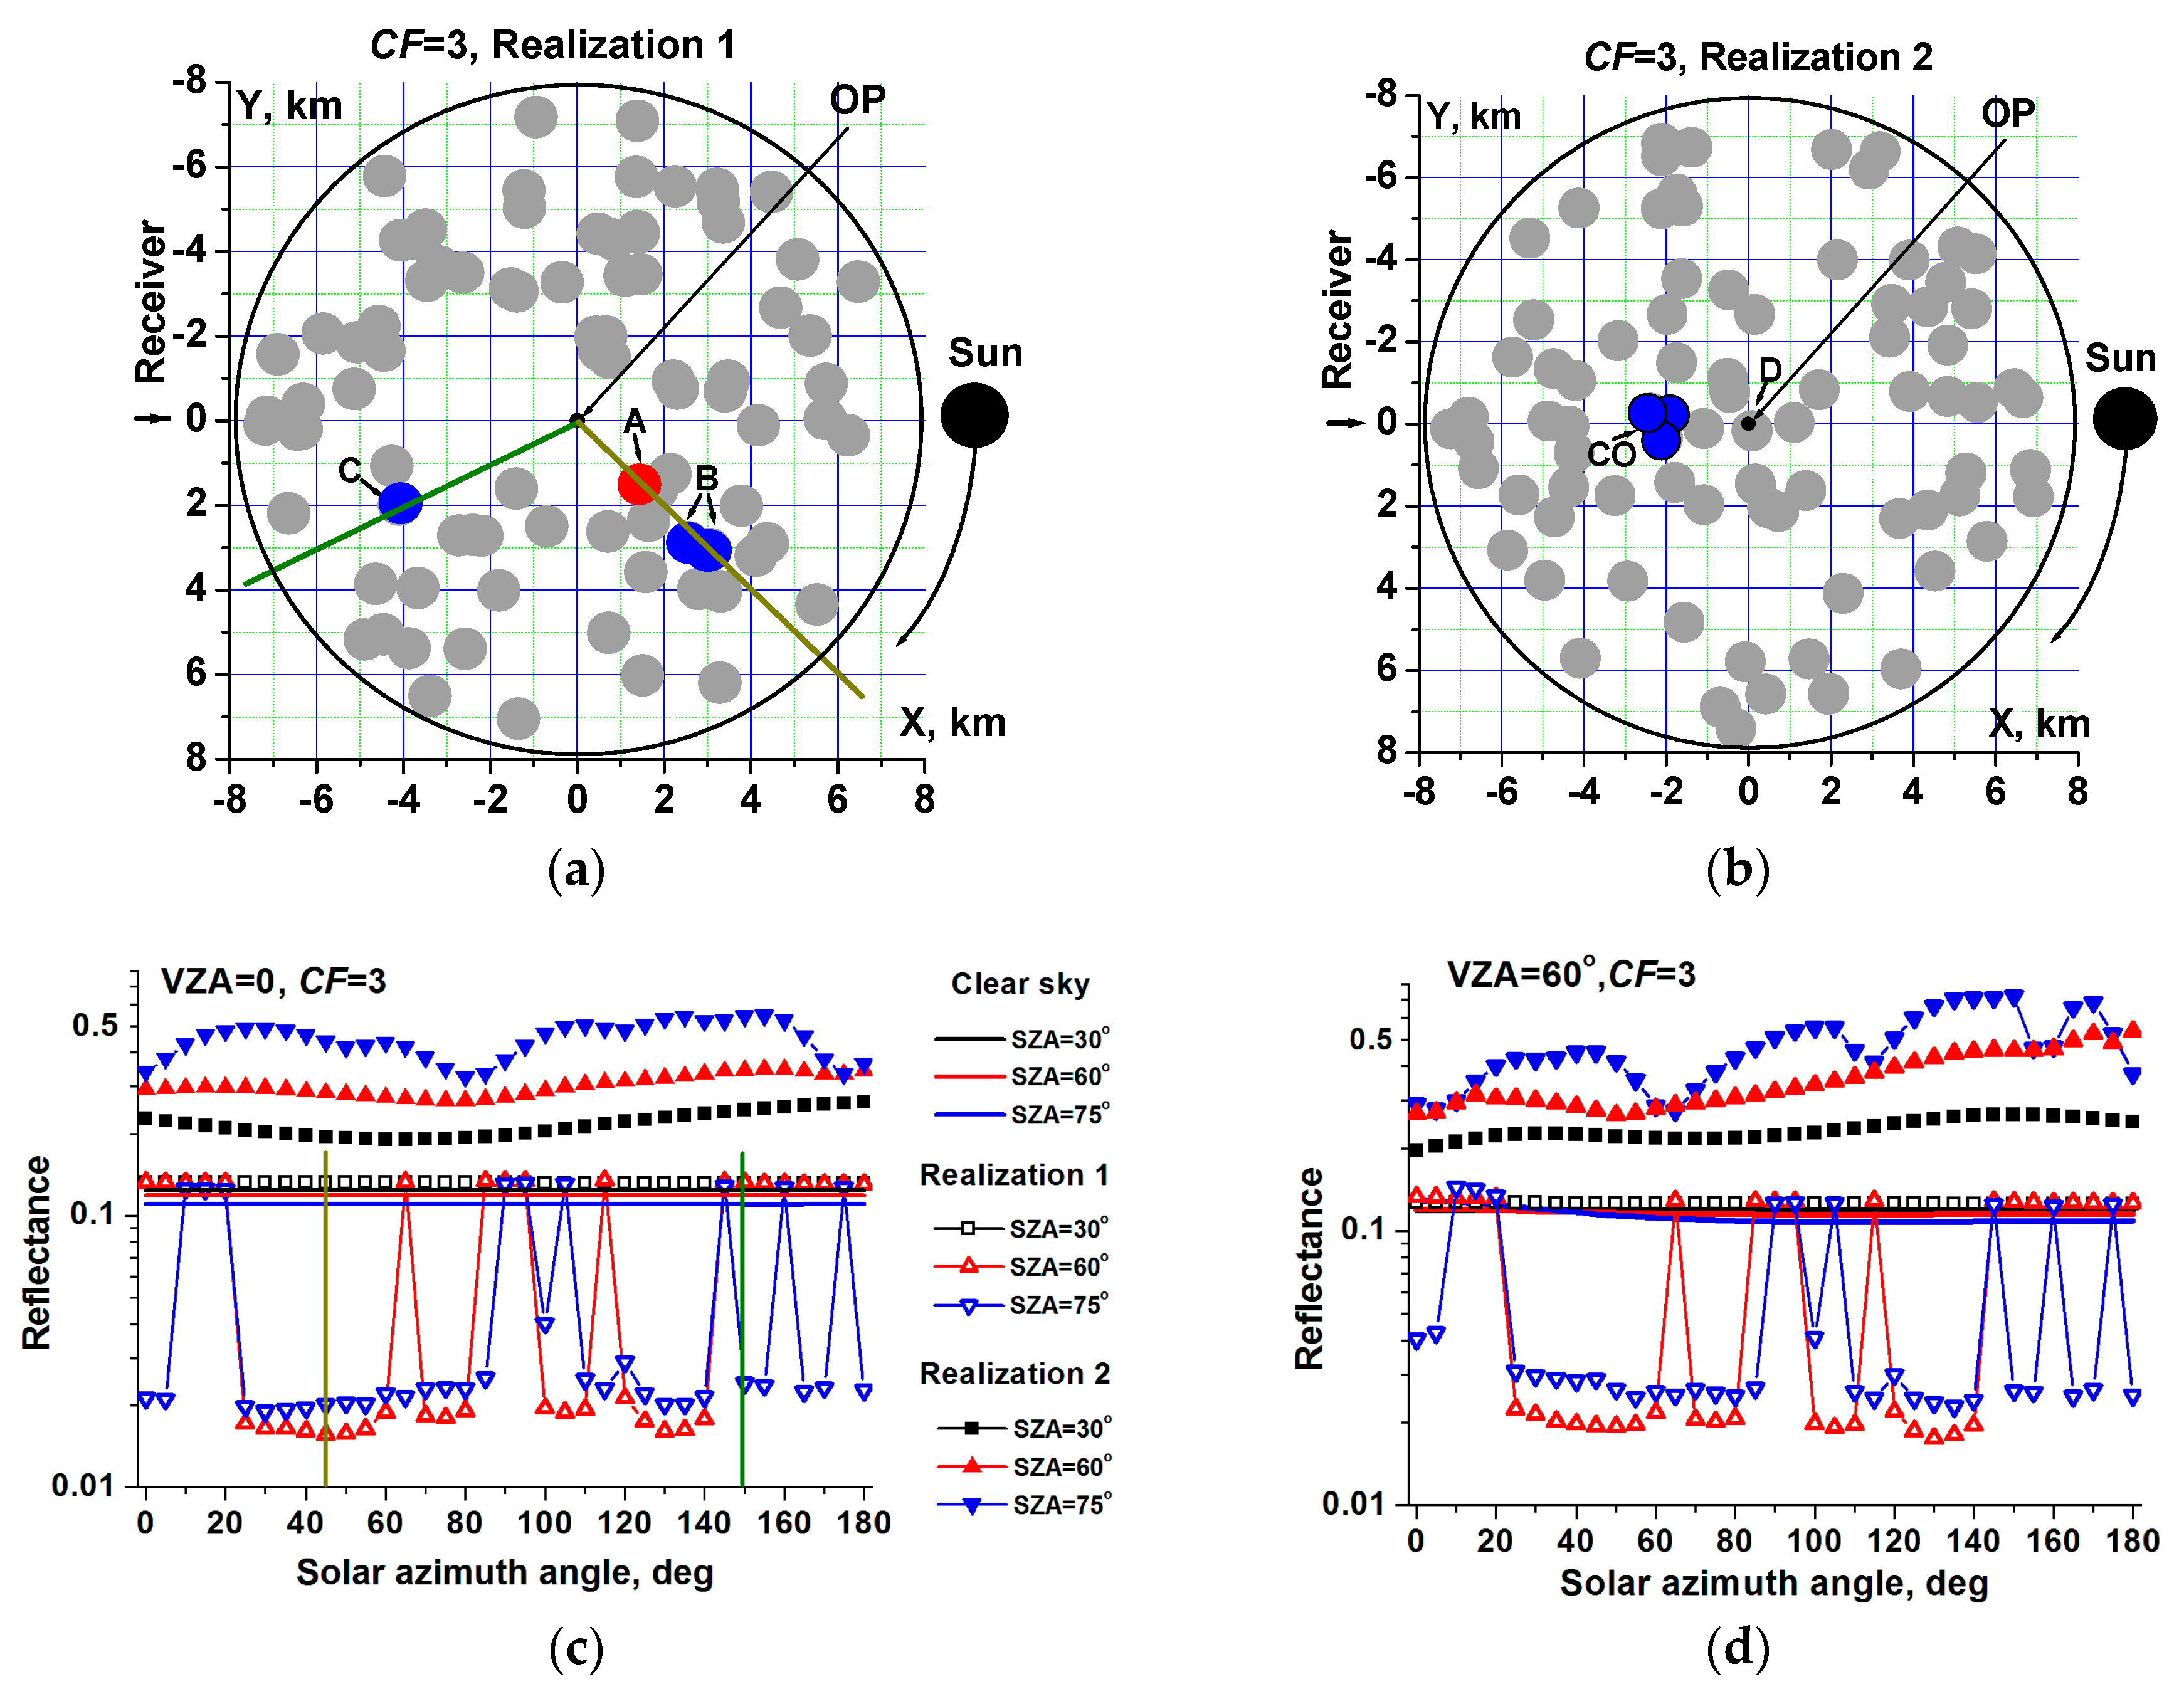
The reflection functions were simulated for the wavelength interval λ = 2.15 μm, where, due to low Rayleigh scattering and aerosol optical depths (τR(2.15 μm) = 0.0002 and τa(2.15 μm) = 0.0123), the effect of inhomogeneity on reflectance will be manifested most noticeably compared to, e.g., the visible range (λ = 0.55 μm). For analysis, we chose four cloud realizations, corresponding to cloud fractions CF = 3, as shown in Figure 3a,b, and CF = 6, as shown in Figure 4a,b, viewing zenith angles VZA = {0, 60°}, solar zenith angles SZA = {30°, 60°, 75°}, and azimuth angles SAA = {0, 5, 10, …, 175, 180°}. The calculations were performed using the same geometrical and optical cloud characteristics as in Section 3.1 (taking spectral variations into account [55]).
Figure 3 presents two cloud realizations at CF = 3 and the results of simulating the reflection functions for different sun-view geometries.
A specific feature of Realization 1, shown in Figure 3a, is that independent of the viewing angle, no clouds are present in the line of sight, hence the dependence of Rcld on the solar azimuth angle is determined predominantly by shadowing effects: R c l d (SAA) ≤ R c l r (SAA). In nadir-looking sensing, the shadowing of an observation point is determined by clouds, the centers of which are approximately at a distance Z c l d × t g ( SZA ) D c l d ( H c l d + Z c l d ) × t g ( SZA ) from the OP. Comparing Figure 3a,c at SZA = 60° and SZA = 75° shows that R c l d is almost an order of magnitude smaller than R c l r for those solar azimuth angles at which the direction “toward the Sun” is covered by clouds. For instance, at SAA = 45°, the line of sight is shadowed by cloud A (SZA = 60°) and a conglomerate of clouds B (SZA = 75°). At the same time, at SAA = 150°, the shadowing takes place only at SZA = 75° (cloud C). At SZA = 30°, clouds near the OP are absent; however, R c l d (SAA) is a little larger than R c l r (SAA) because LS is slightly illuminated by reflected radiation.
The configuration of the cloud field in Realization 2 is such that cloud D is immediately above the observation point, while at the oblique viewing angle VZA = 60°, the line of sight intersects the conglomerate of clouds CO, located along the OX axis, see Figure 3b. The results, described in Section 3.1, suggest that R c l d increases relative to R c l r , as shown in Figure 3c,d. Depending on illumination conditions, clouds in the vicinity of D and CO may, on the one hand, reduce the amount of direct solar radiation reaching them, and, on the other hand, favor an increased re-reflection of scattered solar radiation between them. Following from the calculation results, these factors may be manifested in the angular dependence R c l d (SZA, SAA), as shown in Figure 3c,d.
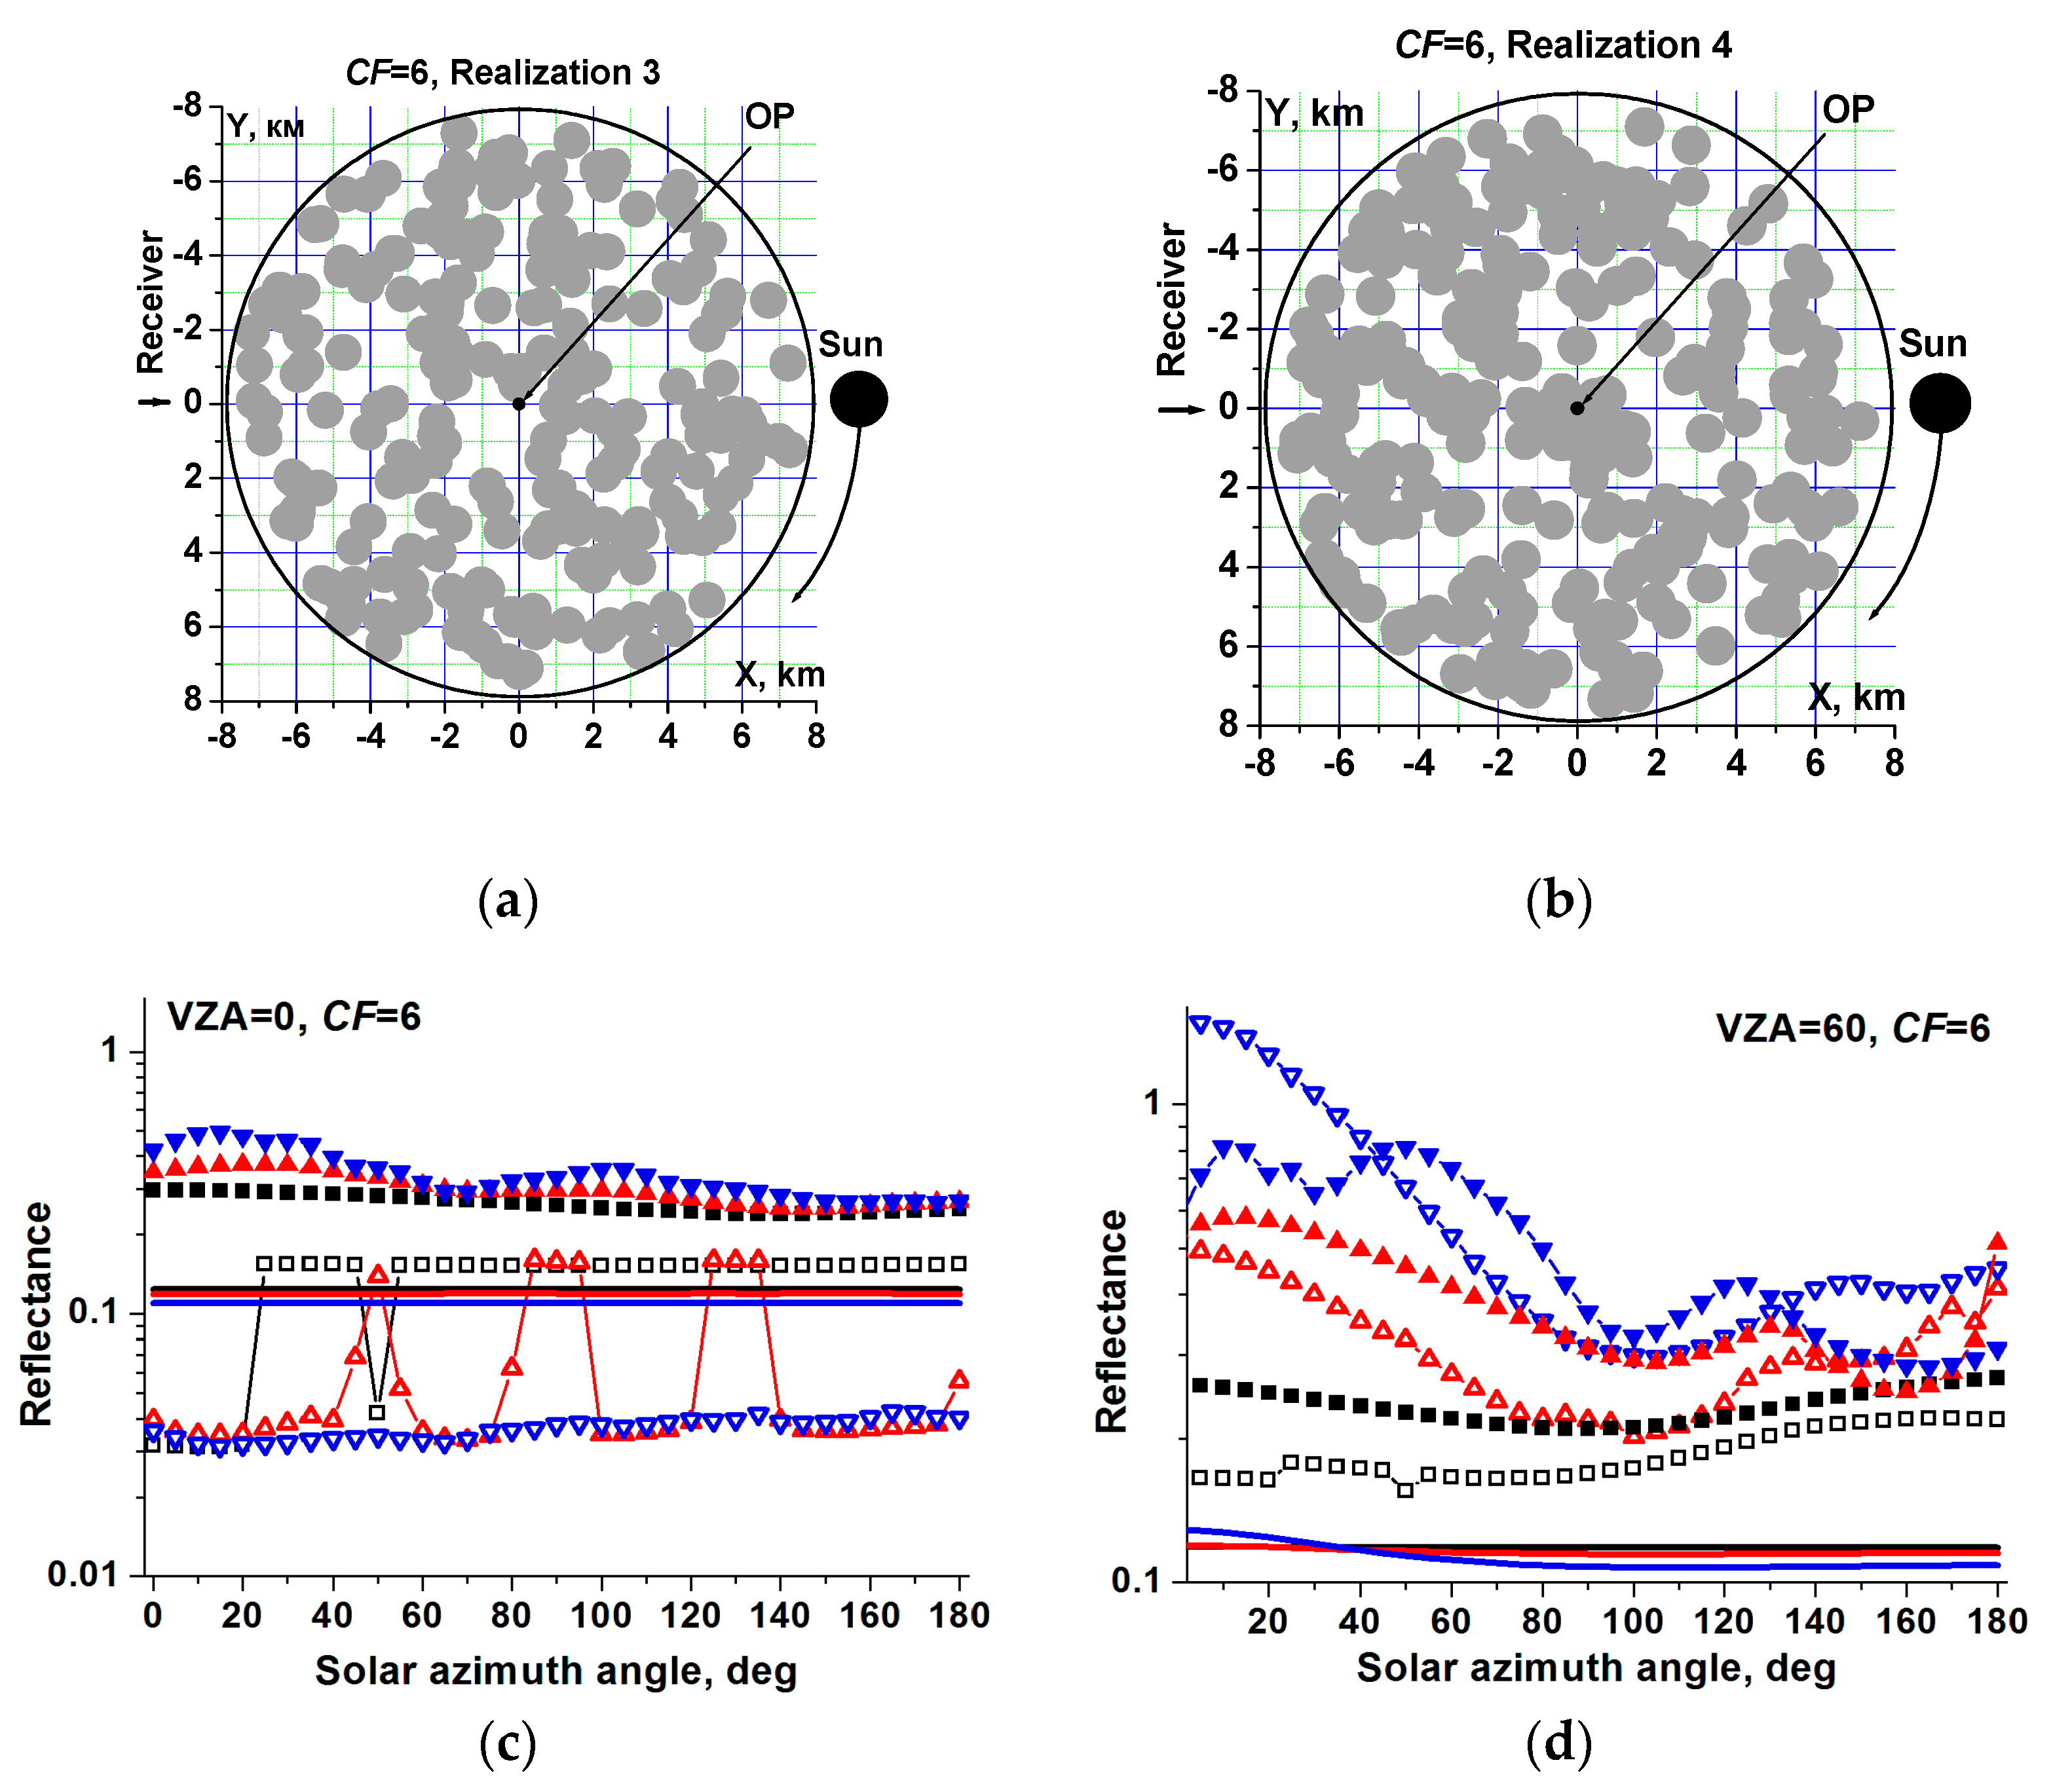
Figure 4a,b presents two cloud realizations at CF = 6.
As for CF = 3, the specific features of the field configurations are the absence (Realization 3) and presence (Realization 4) of clouds over the observation point.
In nadir-looking sensing, shown in Figure 4c, the reflection functions in Realization 3 depend on solar azimuth: Relationship R c l d (SAA) ≤ R c l r (SAA) in certain SAA ranges is a consequence of the effects of shadowing of the direction “toward the Sun.” A specific feature of Realization 4 is that the cloud over the OP is surrounded by a densely populated circle of other clouds. High reflectance of this section of the cloud field leads to an increase of R c l d relative to R c l r , independent of the solar zenith angle.
At oblique viewing angle VZA = 60°, the line of sight intersects the clouds in both realizations. In addition to the obvious relationship R c l d R c l r , presented in Figure 4d, the fanciful character of azimuth dependencies R c l d (SAA) in both cloud fields stems from the joint effect of mutual shadowing and re-reflection of radiation between the clouds, among which the key role is played by clouds located near the line of sight and in the direction “toward the Sun.”
We note that the radiation simulations using the mono-directional receiver make it possible to describe all details of the angular structure of reflected radiation. Obviously, passing to a receiver with a finite angular extent leads to a smoothing of the bidirectional reflectance, which in turn depends on the chosen spatial resolution and cloud sizes. In our work, we nonetheless considered a mono-directional receiver, which allowed us to understand precisely what factors influence the angular characteristics of reflected radiation in 3D cloud fields, and to what extent.

3.3. Averaging over Realizations

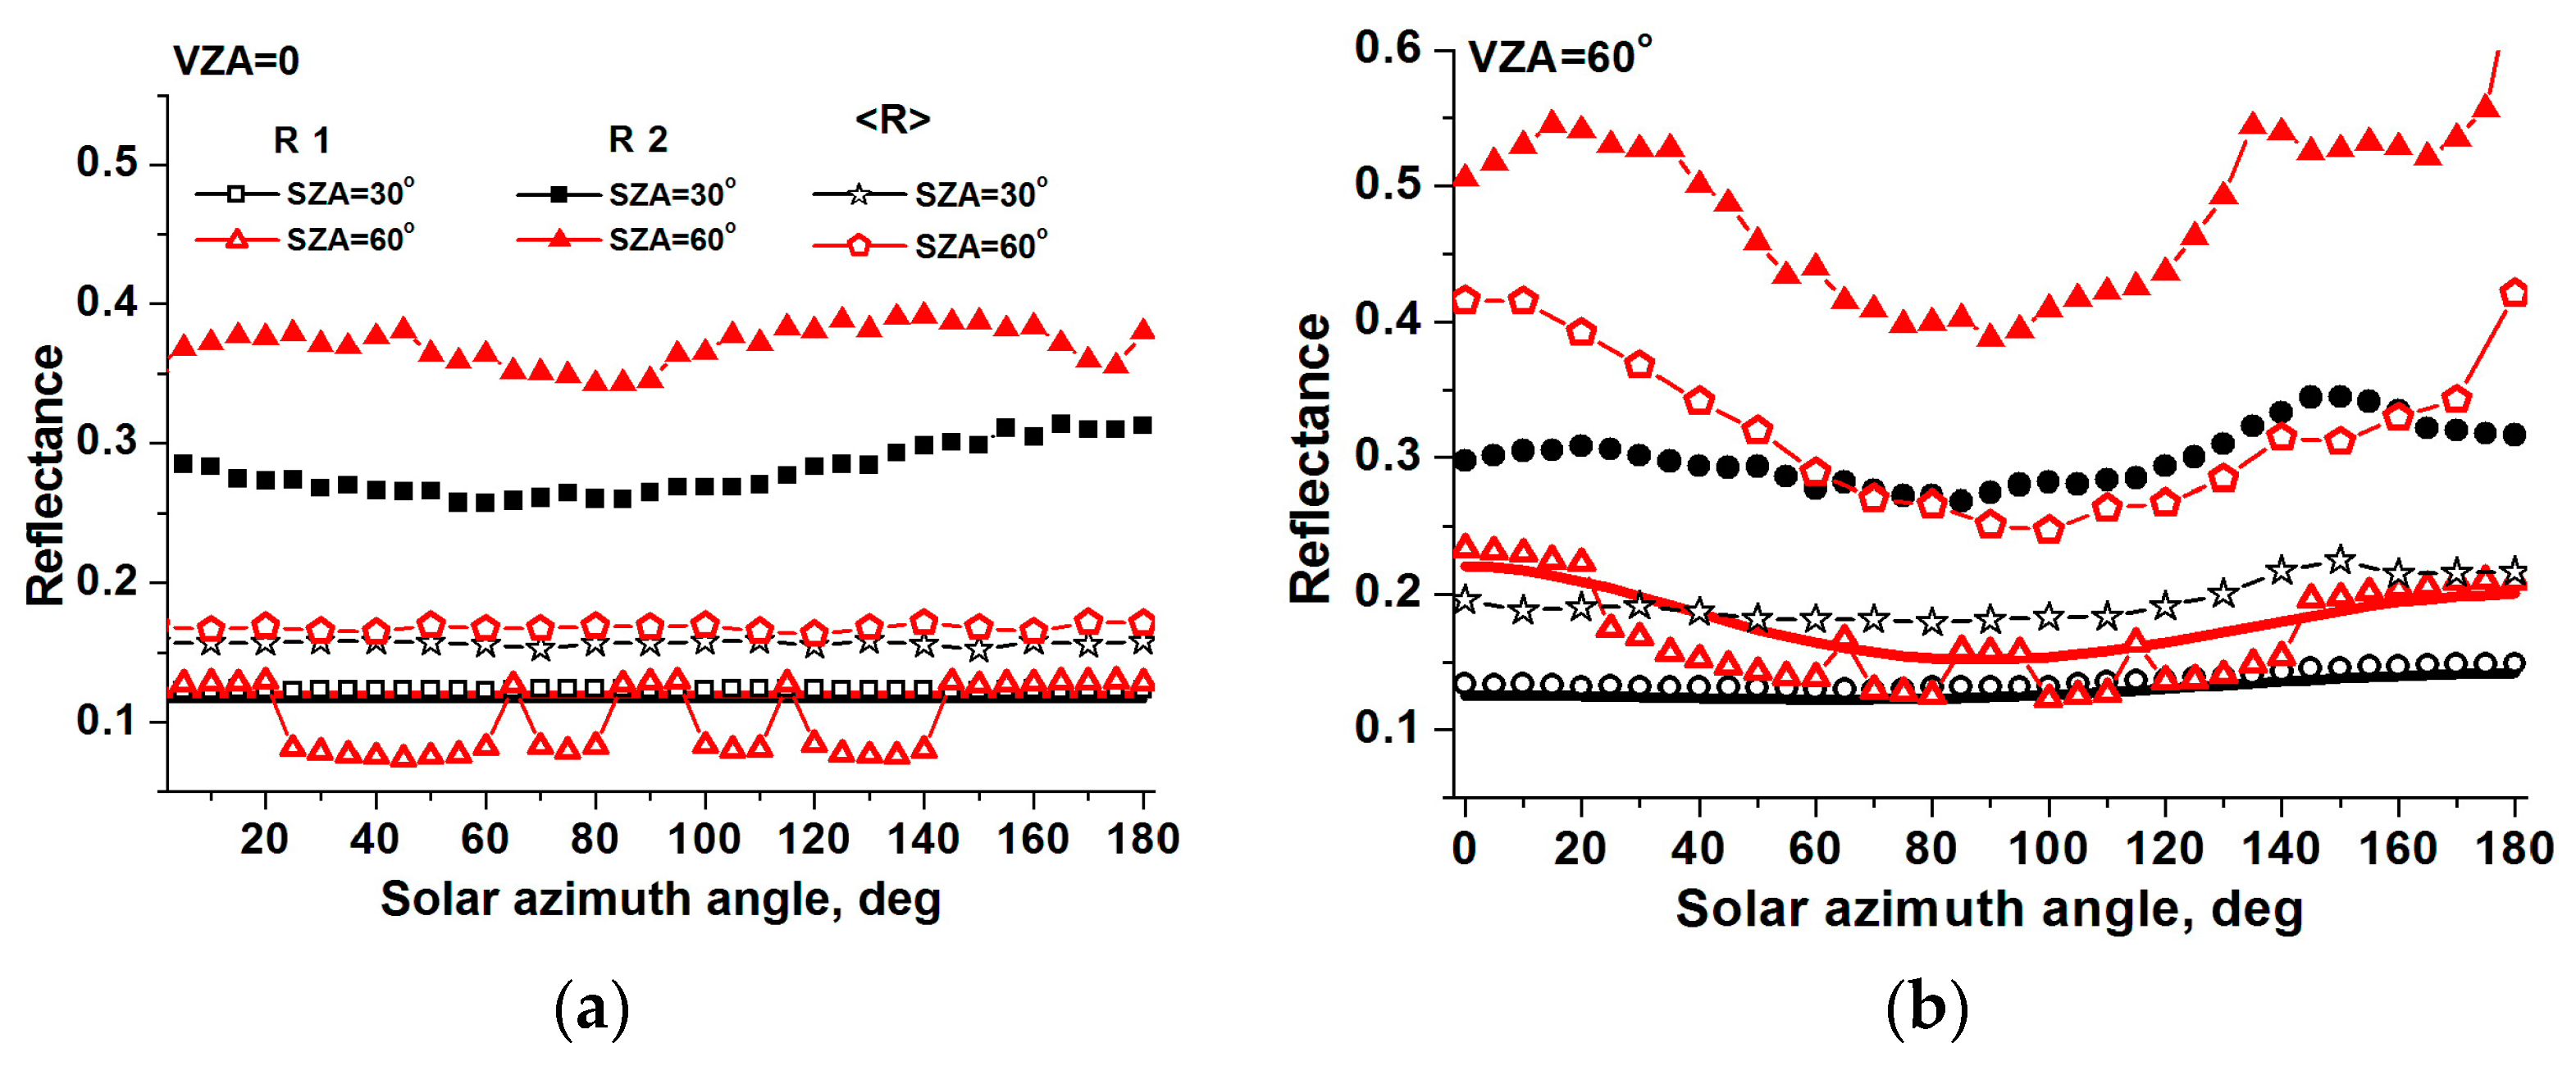
We will consider the results of simulations of reflection functions averaged over the set of cloud realizations (λ = 0.55 µm).
Figure 5 compares R with reflectance calculations in Realizations 1 and 2, shown in Figure 3a,b. First, the dependence of R on solar azimuth is smoothed out as compared to individual realizations because of averaging over the set of cloud configurations. Second, variations in the angular dependence of R ( SAA ) in the scattering phase function of cloud particles g c l d ( θ ) , shown in the inset of Figure 6a; θ is the scattering angle, and, to a lesser degree, in R(SAA) within Realization 2 (LS intersects the cloud) are quite matched. For instance, at VZA = 60°, the increase of SAA from 0° to 180° corresponds to a change of the scattering angles in the range 90° ≤ θ ≤ 150° at SZA = 30° and in the range 60° ≤ θ ≤ 180° at SZA = 60°, as shown in Figure 5b. The “backscatter” peak of the phase function causes an increase in cloud reflectance for the condition SZA = VZA = 60°. Local maxima at SAA ~140–145° are associated with an increase of g c l d ( θ ) in the rainbow region θ ~142°.
Next we consider the dependence of mean reflectance on cloud fraction, aspect ratio γ = H c l d / ( 2 p x ) , and optical depth for different viewing angles and illumination conditions.
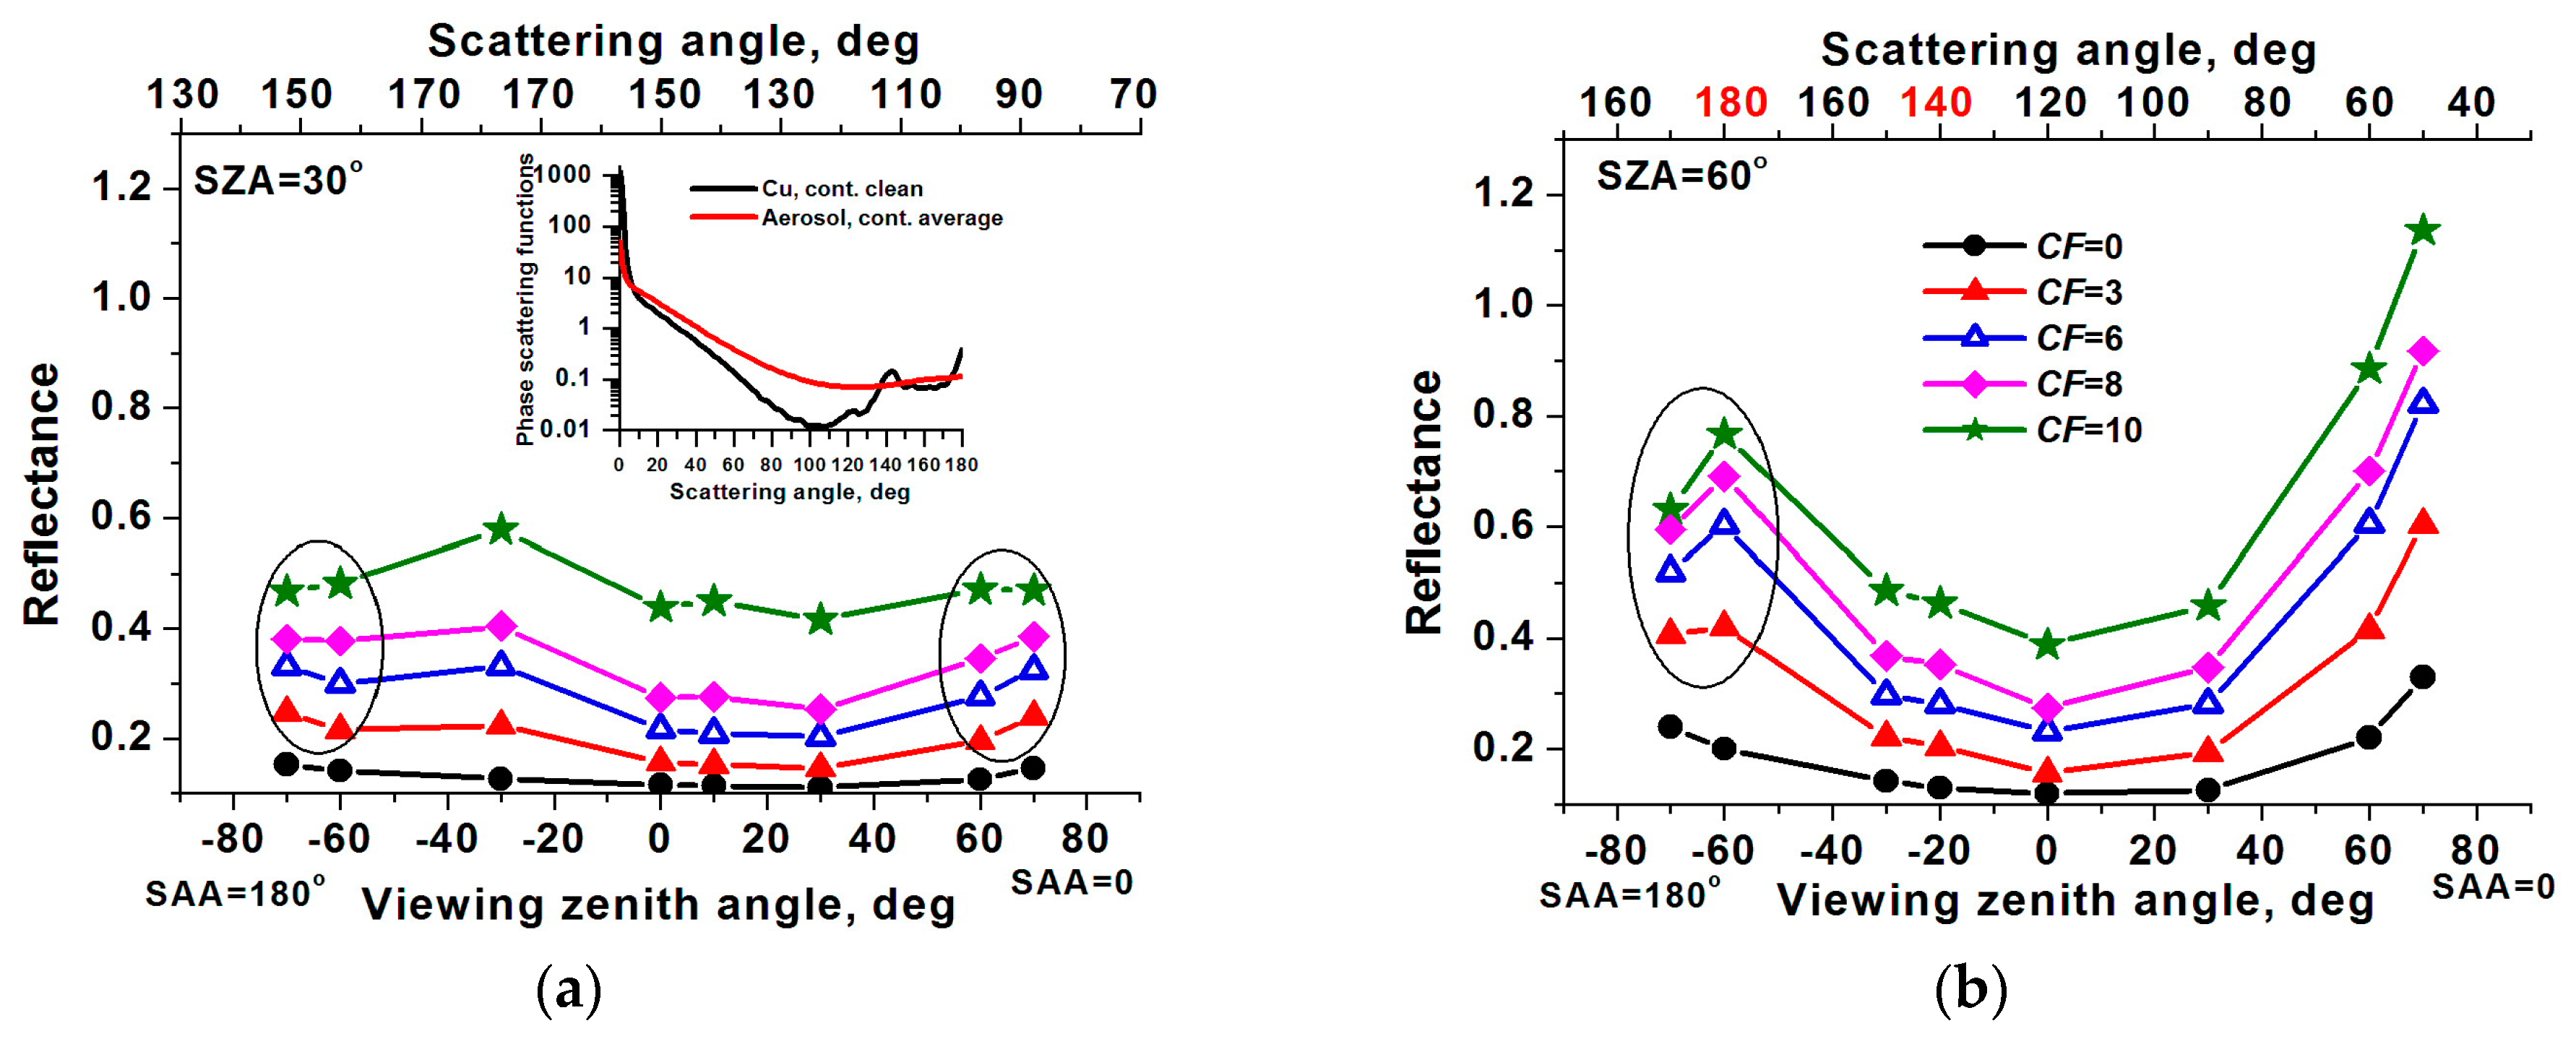
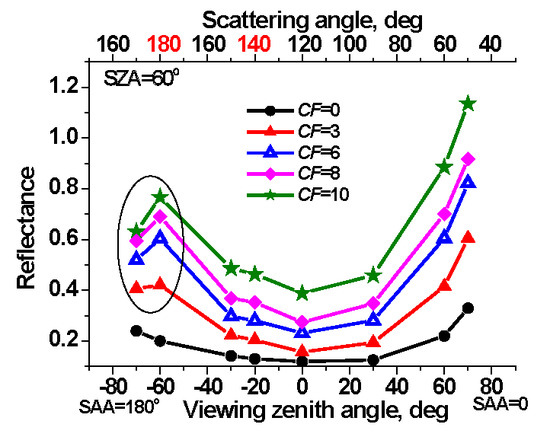
Figure 6 shows the zenithal dependence of R in the principal plane for different cloud fractions. When solar zenith angle is 30°, the simulation results in overcast clouds show a slight backscattering peak and darkening at SAA = 0 and SAA = 180° with increasing VZA (analogous results for small solar zenith angles (SZA ≤ 30°) from observations and simulations were presented in [35,63]).
A slightly different situation is observed in broken clouds. The formation of an angular structure of reflected radiation is affected by the presence of non-horizontal cloud surfaces: Radiation leaving through lateral cloud sides undergoes less scattering events and, as such, is more sensitive to the angular structure of the scattering phase function. Therefore, at SAA = 180°, owing to the presence of a g c l d ( θ ) peak in the rainbow region θ = 142°, mean reflectance increases as the viewing zenith angle grows from VZA = 60° to VZA = 70° at CF = 3 and CF = 6, in contrast to overcast clouds, as shown in Figure 6a. In the antisolar location (SAA = 0), the growth of g c l d ( θ ) with decreasing scattering angle causes mean reflectance to increase with growing VZA.
If SZA = 60°, the reflection functions have definite forward scatter and backscatter maxima, see Figure 6b. The peak in the “backward” direction (VZA = 60°, SAA = 180°) is most significantly manifested under the conditions of overcast clouds, and gradually decays with decreasing CF. Supposedly this is because the effect of peak g c l d (θ = 180°) is smoothed out in view of the decreased optical path in clouds directed “toward the receiver” at the small cloud fraction.
We will discuss how the azimuthal dependence of mean reflectance on aspect ratio γ = H c l d / ( 2 p x ) changes for a fixed cloud geometrical thickness Hcld.
General considerations dictate that for small solar and viewing zenith angles, the relative role of cloud lateral sides in the formation of a radiation field of individual clouds is fairly minor, and the main part of reflected radiation leaves through cloud tops. When CF and H are kept fixed, with an increase of SZA and/or VZA, the effect of lateral sides becomes stronger due to changes in the illumination conditions of clouds and in the optical path within cloud elements. In addition, the larger the cloud base, the longer the mean distance between the clouds, hence the smaller effect of the radiation interaction of the clouds.
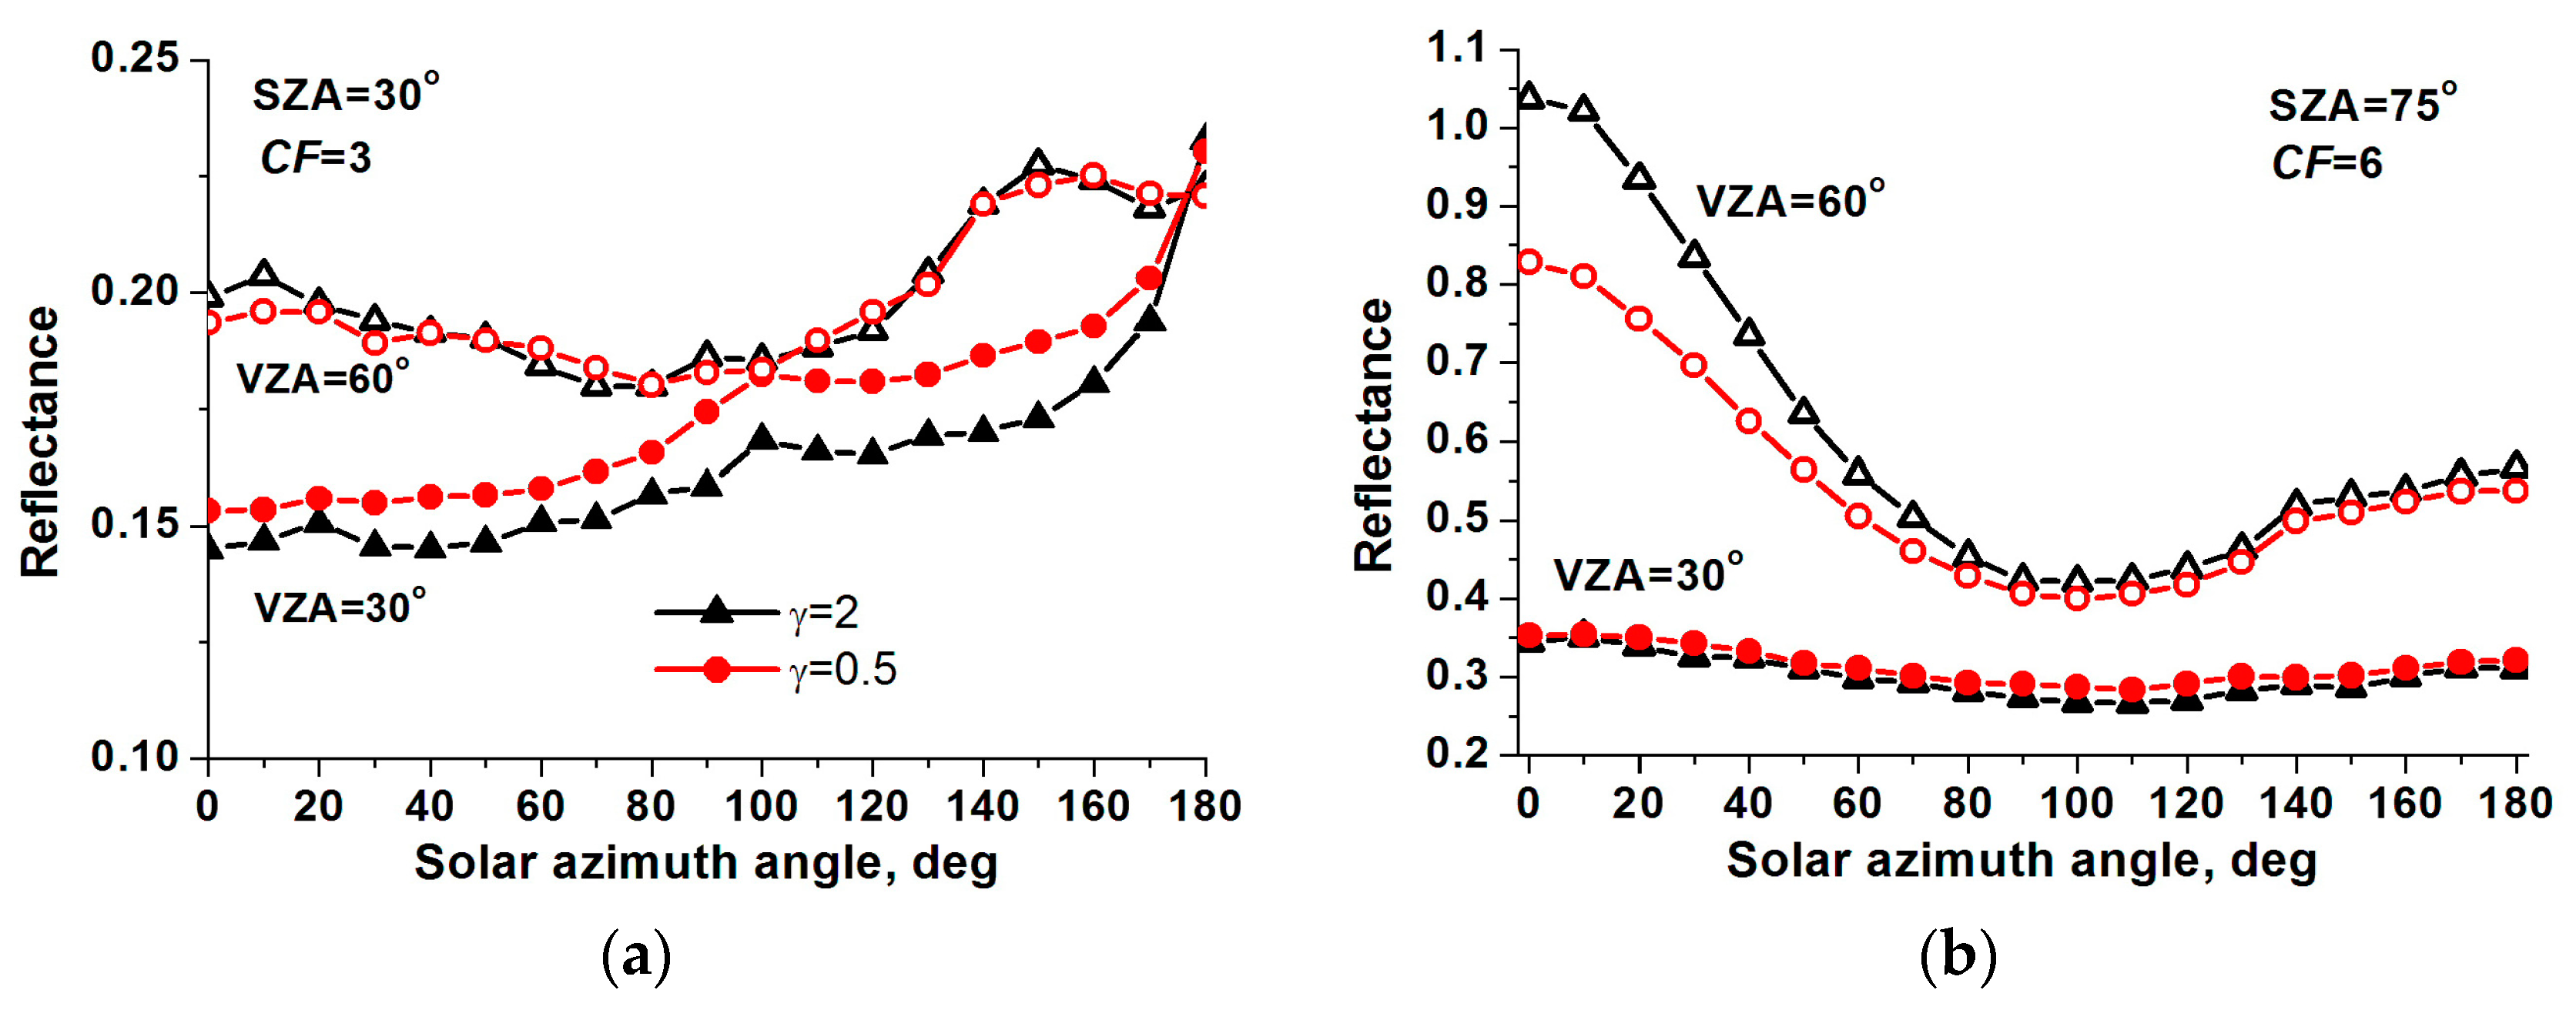
The joint effect of these competing factors can be estimated only on the basis of the numerical simulation results. We will consider examples of calculations for 0.5 γ 2 , see Figure 7.
Assume that CF = 3, see Figure 7a. When SZA = VZA = 30°, R ( γ = 0.5 ) exceeds R ( γ = 2 ) by about 10% owing to the dominating role of cloud top in the formation of the field of reflected radiation.
With a decreasing cloud base diameter at a fixed cloud fraction (CF = 6), the field of reflected radiation is formed under the influence of the above-mentioned competing factors. On the one hand, as SZA increases, the direct solar rays predominantly illuminate the upper part of the cloud. On the other hand, the optical path of radiation within the cloud directed “toward the receiver” decreases on average. The effects caused by the increase in aspect ratio mutually compensate each other at small viewing angles: At VZA = 30° the values R ( γ = 0.5 ) and R ( γ = 2 ) are comparable, see Figure 7b. As the viewing angle increases (VZA = 60°), the effect of increasing the optical path in clouds of large (2 km) diameter leads to a decrease of R ( γ = 0.5 ) relative to R ( γ = 2 ) by about 20% for SAA = 0, diminishing to ~3% at SAA = 180°.
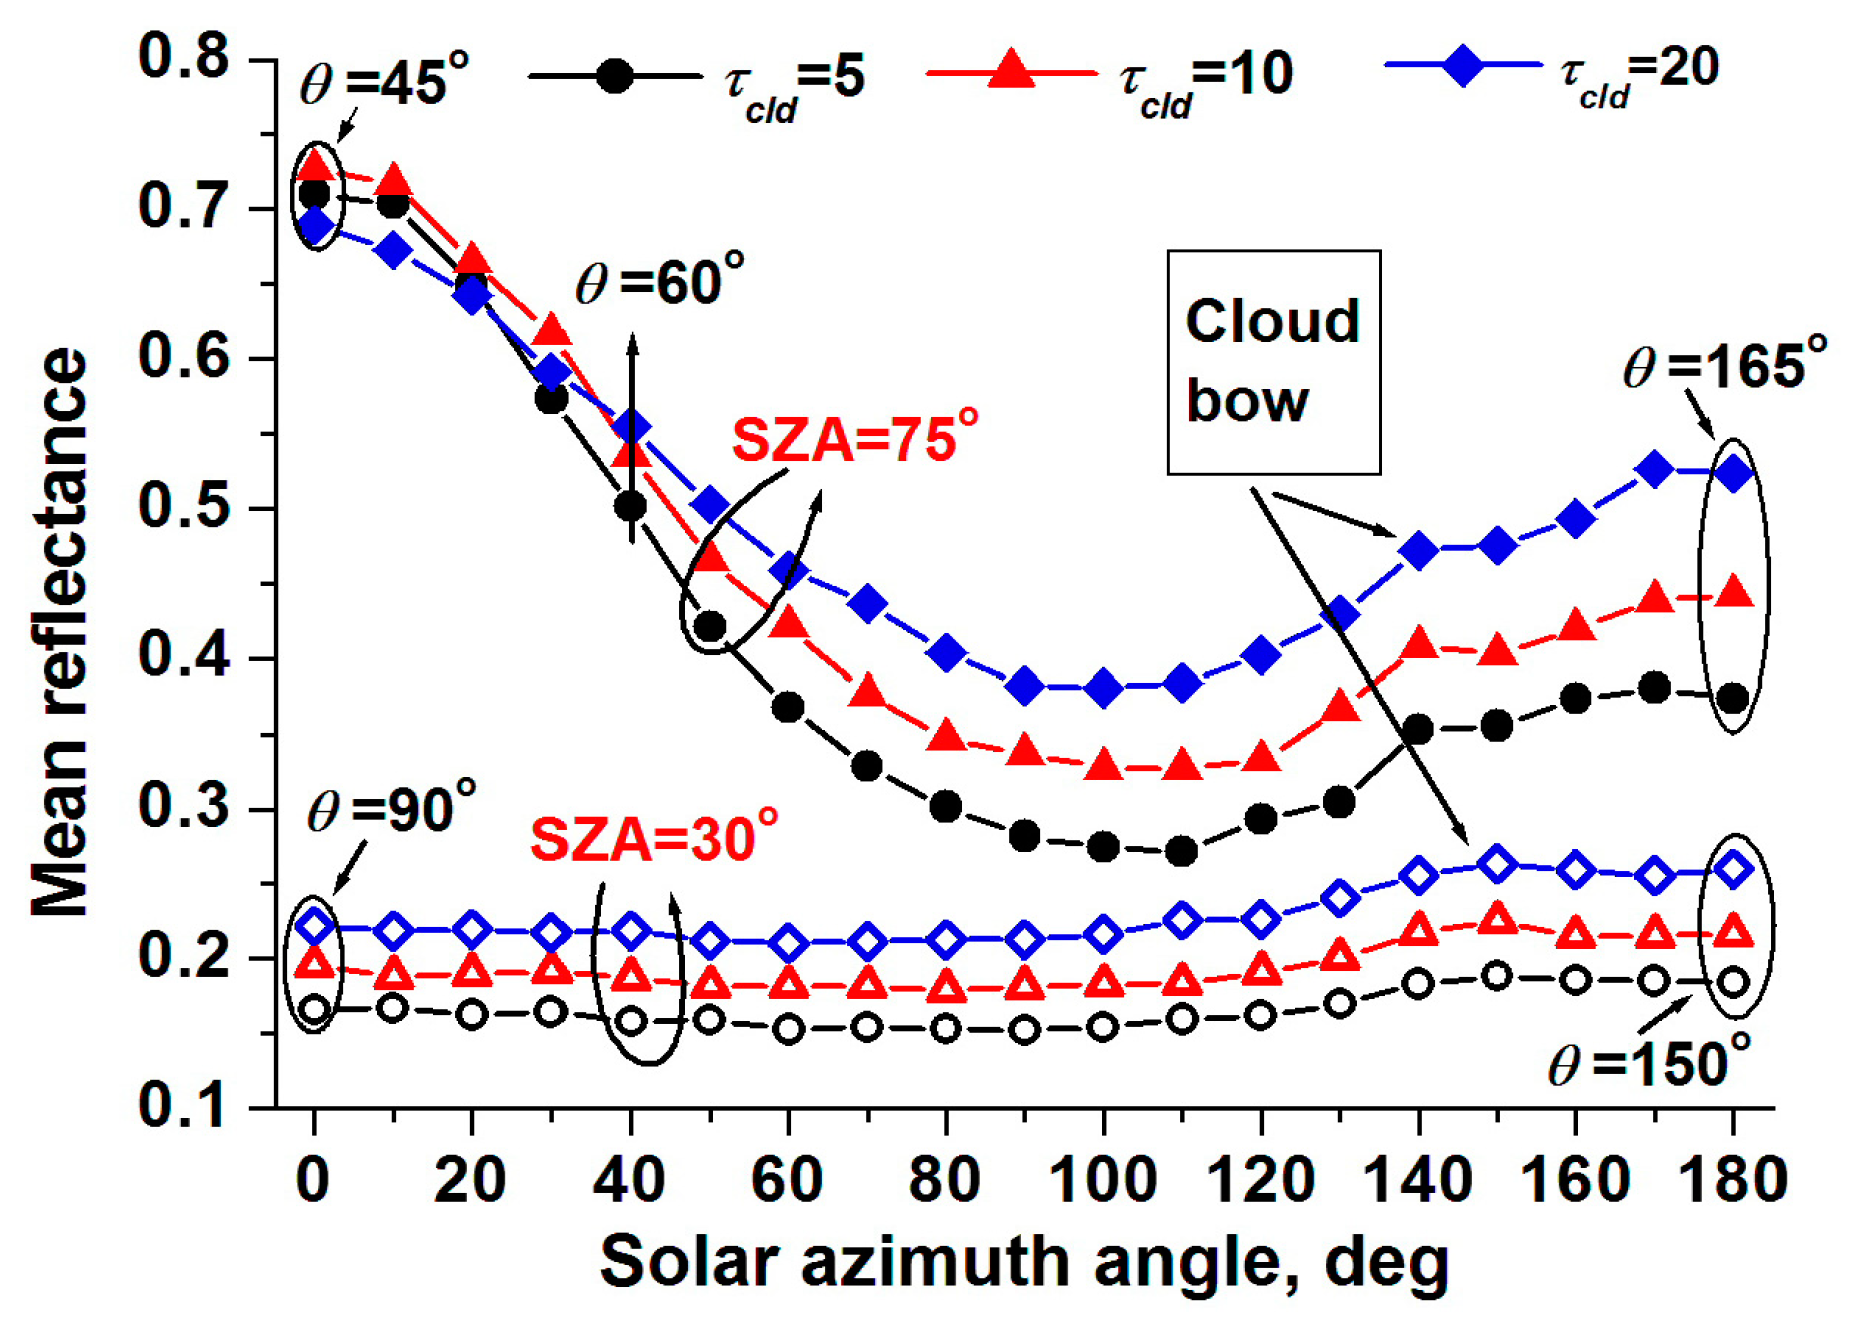
In conclusion, we will consider how the optical depth of broken clouds influences R ( SZA ,   SAA ) for 5 τ c l d 20 , see Figure 8. In the entire τ c l d variability range considered here, a weak dependence of mean reflectance on solar azimuth at SZA = 30° changes to a pronounced anisotropy of R ( SZA ,   SAA ) at SZA = 75°. Obviously, the largest variability range of the mean reflection functions is observed at small optical depths ( τ c l d = 5 ). Owing to the fact that less multiple scattering occurs in optically thinner clouds, reflectance is more sensitive to the cloud-scattering phase function, which is highly anisotropic.

4. Conclusions

In this study, we investigated the influence of the 3D effects of clouds on specific features of the formation of the bidirectional reflectance of liquid water clouds.
Bidirectional reflectances were simulated using original statistical algorithms entered into the MATHART software package. These algorithms ensure simulations of brightness fields of broken clouds, taking into account the effects of atmospheric sphericity. Molecular absorption in the UV, visible, and near-IR spectral ranges is accounted for using the k-distribution method. Effective coefficients of molecular absorption are calculated using modern databases of spectroscopic information for any spectral resolution. (The procedure of calculating the effective molecular absorption coefficients is not included in the MATHART software package and precedes the radiation calculations.) The cloud fields are simulated using the model of Poisson point fluxes in space; cloud elements are approximated by truncated paraboloids of rotation. The calculation of the average bidirectional reflectance is based on the numerical averaging of stochastic RTE. We note that in this paper we confined ourselves to the consideration of a mono-directional receiver, which allowed us to describe the detailed structure of a reflected radiation field.
Among the main factors influencing the reflection function formation in the 3D cloud field, we note the following.
With the appearance of an isolated cloud in the sky, reflectance is determined by the presence or absence of clouds on the line of sight, shading by clouds/non-obscuring directed “toward the Sun,” and illumination of the LS by cloud-reflected radiation. If the LS intersects the cloud, the reflection function substantially exceeds that obtained in clear-sky observations, especially if the point of LS entry into the cloud is sunlit. The reflectance decreases due to the effects of cloud shading of the LS and the observation point on the Earth’s surface.
The regularities of reflection formation in cloud fields are illustrated by the example of four different cloud realizations for small and moderate cloud fractions. Taking into account the random character of the distribution of cloud elements, reflectance for the specified illumination and observation conditions changes from one realization to another and, depending on the cloud configuration, may be either higher or lower than the clear-sky radiance. In addition to the above-mentioned 3D effects of isolated clouds, there are also the effects of radiation interaction, i.e., mutual shading and the effects of multiple scattering between clouds. The presented results show that the specific features of reflectances in a 3D cloud field are mainly determined by the localization of clouds relative to the line of sight and directed “toward the Sun.”
Passing from individual realization to averaging over an ensemble of cloud fields shows that, for specified viewing and solar zenith angles, the azimuthal dependence of the mean bidirectional reflectance is a smooth function. Also, an important circumstance is that for a fixed sensing geometry, the mean bidirectional reflectance may differ several-fold from the bidirectional reflectance in a specific cloud field. This may become important in interpreting the retrieval of such cloud characteristics as optical depth and effective particle size from the data of satellite sensing.
In the present work, we confined ourselves to the consideration of viewing geometries in which the solar and viewing zenith angles did not exceed 80°. At the same time, it should be noted that MATHART’s algorithms ensure the simulation of reflectance functions, taking into account the effects of atmospheric sphericity. Calculating the radiation characteristics for sensing geometries involving large viewing and solar zenith angles is highly important for interpreting data from a new NASA/NOAA/Air Force Deep Space Climate Observatory (DSCOVR) mission ([64,65]. A seemingly no less important aspect is the possibility of using the stochastic radiative transfer theory in a cloudy atmosphere to analyze spectral observations of variability in the Earth’s global reflectance, obtained from NASA’s Earth Polychromatic Imaging Camera (EPIC) onboard NOAA’s DSCOVR. The expedience of applying the stochastic radiative transfer equations was demonstrated previously [64,66] in estimating the sunlit leaf area index from DSCOVR EPIC data.

Author Contributions

Methodology, T.Z.; Radiation codes, T.Z., I.N.; Radiation calculation, I.N.; Analysis of calculation results, T.Z., I.N.; Writing, T.Z.; Figures, I.N.

Funding

This work was supported in part by the Russian Foundation for Basic Research (grant no. 16-01-00617-a).

Conflicts of Interest

The authors declare no conflicts of interest.

Abbreviations

LOClocal coordinate system
LSline of sight
MATHARTMonte CArlo Codes for THree-DimensionAl Radiative Transfer
OPobservation point
RTEradiative transfer equation;
SAAsolar azimuth angle
SZAsolar zenith angle
TOAtop of the atmosphere
VZAviewing zenith angle
A s surface albedo
CFcloud fraction
D c l d distance between the observation point and projection of paraboloid center onto Earth in local coordinate system
H c l d cloud geometrical thickness
Iintensity of solar radiation
I intensity of solar radiation, averaged over an ensemble of cloud realizations
N κ number of cloud field realizations
N χ number of photon trajectories
p x ,     p y semiaxes of cloud base
Rreflectance in an individual cloud realization
R reflectance, averaged over an ensemble of cloud realizations
R c l r clear-sky reflectance
R 0 the Earth’s radius
r e f effective radius of cloud particles
Scloud field area
Z c l d height of cloud bottom boundary
γcloud aspect ratio
φ c l d azimuth angle, characterizing the position of projection of paraboloid center onto the Earth in local coordinate system
σ c l d cloud extinction coefficient
τ c l d cloud optical depth
λwavelength

Appendix A

The efficiency of the algorithms can be increased, in particular through the use of modern technologies such as those based on graphic processors. However, here we discuss how the laboriousness of sequential programming codes can be decreased. In Appendix A we briefly dwell on issues determining the laboriousness of mean intensity I computations (Appendix A.1), and the choice of the sizes and position of the cloud field in space (Appendix A.2).

Appendix A.1. Laboriousness of Mean Intensity Computations

The above-described scheme for calculating the mean intensity using randomization envisages the simulation of a large number of cloud field realizations (Section 2.2.2).
The Poisson cloud model is quite economical because it requires the simulation of a comparatively small number of random quantities with prescribed distributions, i.e., the number of cloud centers, their coordinates, and, if necessary, the cloud sizes.
Another factor determining the efficiency of the algorithm of the I calculation is the number of cloud realizations N κ and photon trajectories N χ used for an approximate RTE solution in deterministic clouds. In addition to the statistics ( N κ , N χ ) ensuring the required accuracy of mean intensity calculations, we should also keep in mind the capabilities of the available calculation facilities determining computer time consumptions. Therefore, before solving specific tasks (sensing in near-nadir or near-horizon regions, twilight conditions, etc.), it is necessary to carry out a cycle of numerical experiments.
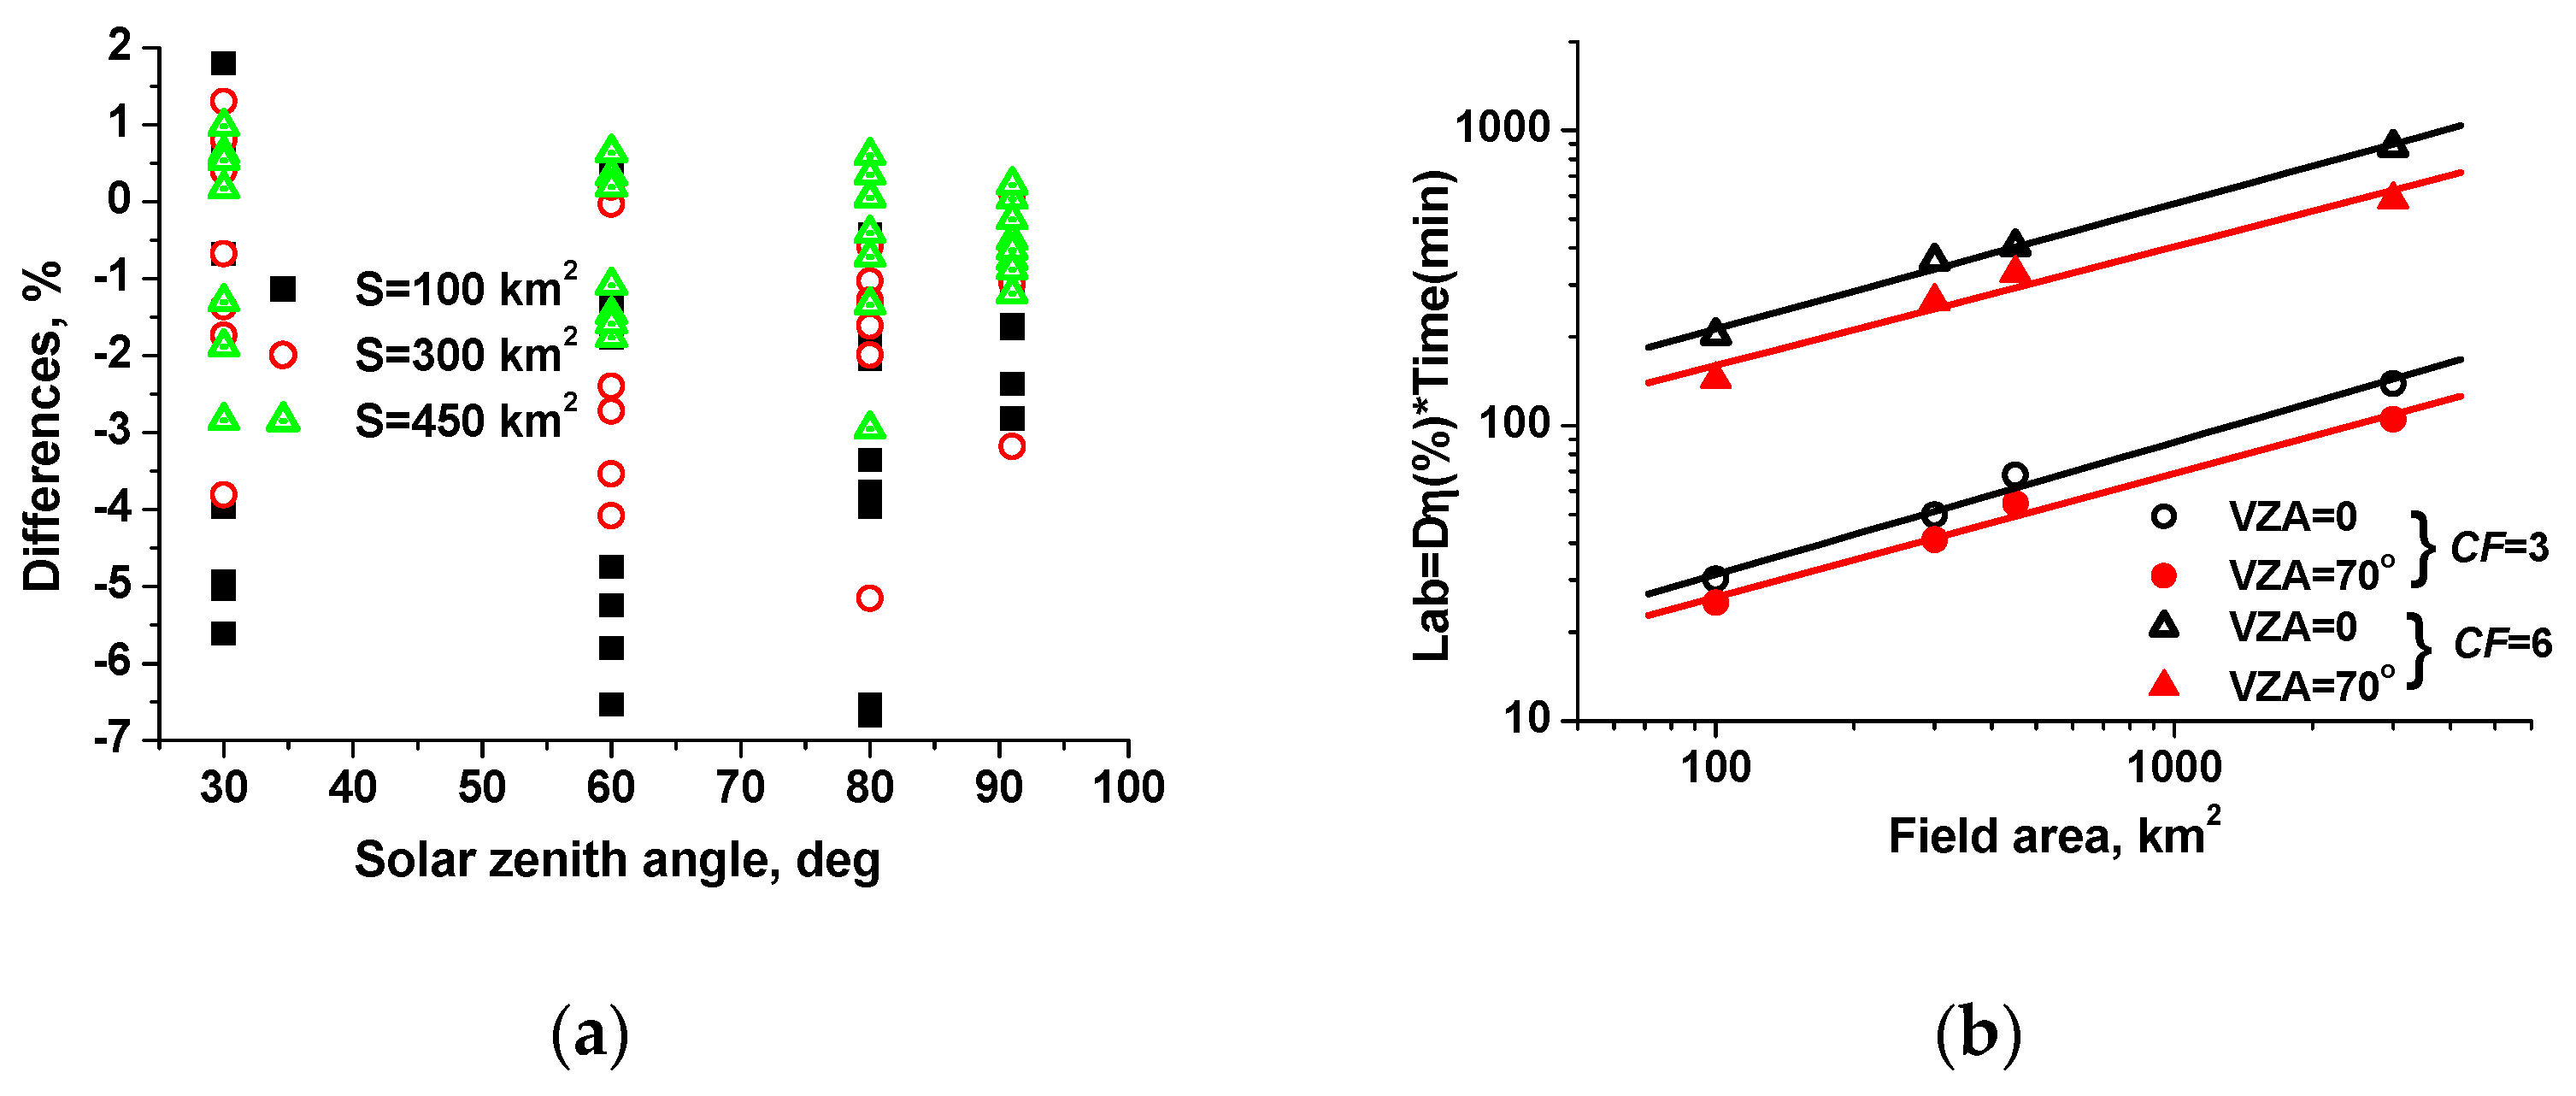
Using as an example the calculations in two wavelength intervals (0.67 and 0.94 μm) with two cloud fractions (CF = 3 and CF = 6), it was shown that the relative error of I calculations, averaged over the broad set of observation and illumination conditions 〈〉, mainly does not exceed 2–3%, provided that N κ × N χ > 10 6 and N κ 10 4 [52]. The numerical experiments were performed using a computer with an Intel Core i7-6700 processor and a clock rate of 3.4 GHz. For a fixed VZA (30°, 60°, 80°), a set of three SZA values (30°, 60°, 80°), three SAA values (0°, 90°, 180°), N κ = 10 4 , and N η = 10 2 , laboriousness Lab = 〈 (%)〉 × Time (min) did not exceed ~50–60 (% × min) for CF = 3 and ~200 (% × min) for CF = 6.

Appendix A.2. Size of Cloud Field and Its Position in Space
In intensity calculations both in a given cloud realization and in ensemble average, it is important to choose the sizes and positions of the cloud fields in space.
If research is aimed at identifying specific features of the formation of the angular structure of a radiation field as a function of a specific cloud configuration, the sizes of this field should be selected such that the photon trajectories would be simulated and the local estimates [60] would be calculated in a spatial domain containing the cloud field. For instance, for large solar zenith angles, the use of a small area S in calculating the field may result in, upon a photon reflection from underlying surface, the direction “toward the Sun” being free of clouds in most cases, somewhat distorting the simulation results.
On the other hand, the use of a cloud field with a large area in the calculations unavoidably leads to an increased laboriousness of the calculations. In intensity calculations within a spherical atmospheric model we suggest a trick, which is an analog of periodic conditions in the plane-parallel atmospheric model, making it possible to reduce the time to calculate the radiative characteristics. With this approach, it is essentially proposed that cloud fields of a large area S* are not to be simulated, but rather realizations of a smaller area S should be simulated and then “constructed” along (1) the direction of photon travel from one collision point to another and (2) the direction “toward the Sun.” We will explain this procedure with an example of photon trajectory modeling.
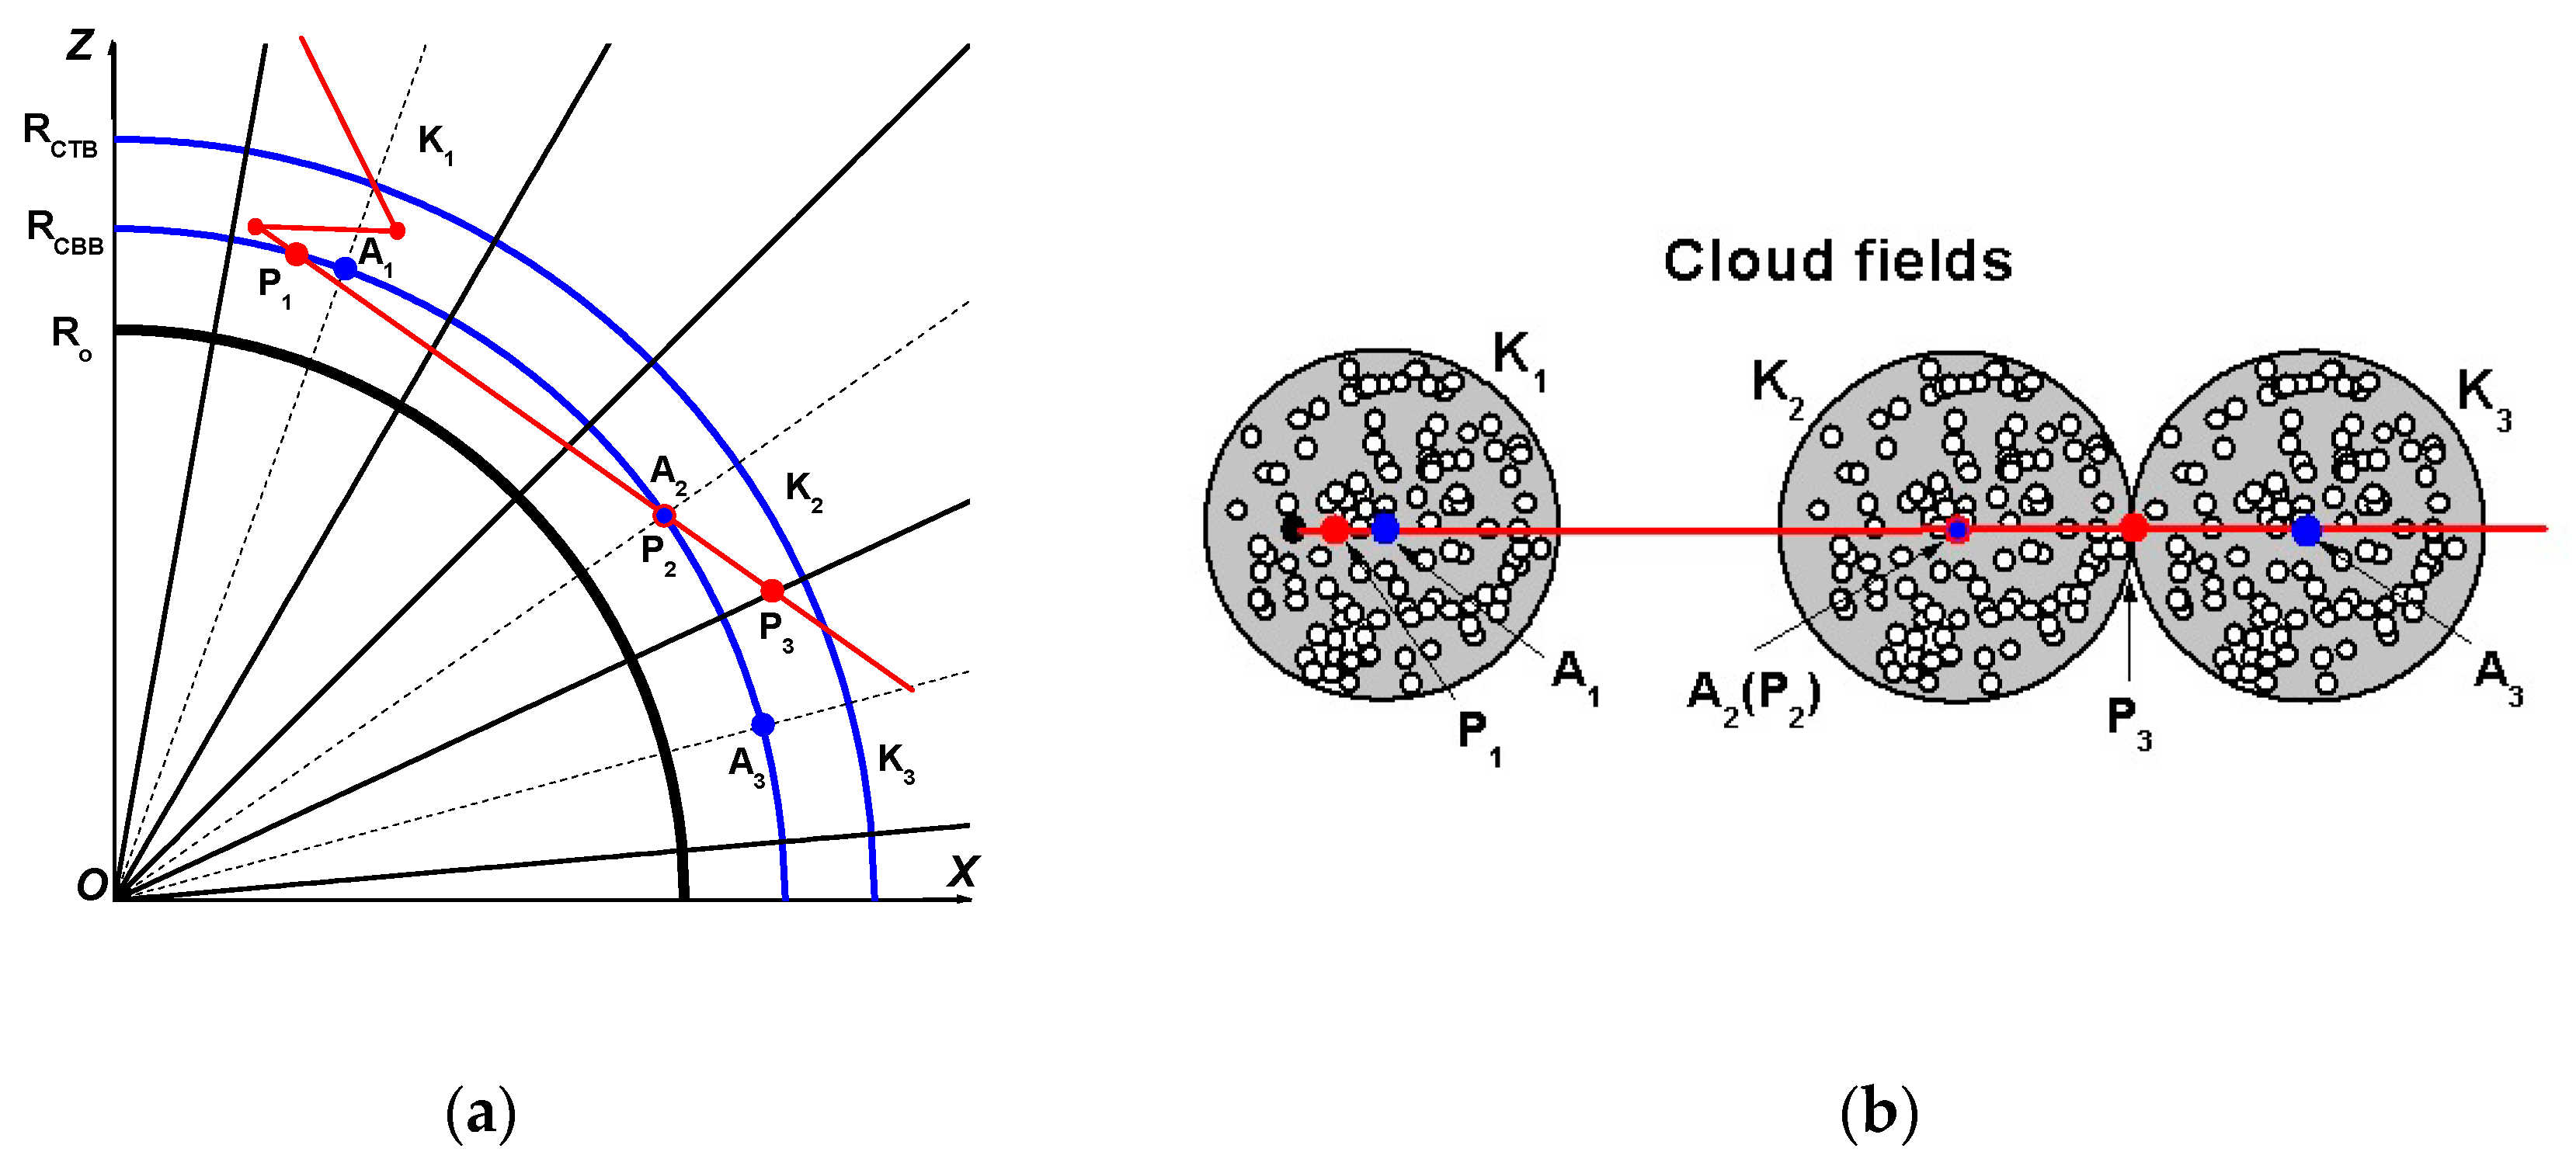
All cloud fields are simulated within cones Ki between two segments of sphere with radii defined by the cloud bottom boundary (CBB) and cloud top boundary (CTB). Cloud field 1 (the initial field) with area S is constructed such that the O A 1 axis of the cloud-containing cone K 1 passes through the center of the Earth (O) and the point where the photon trajectory first intersects CTB, as shown in Figure A1a. Trajectory modeling is performed according to standard procedures within the initial field until the photon leaves it through (i) CTB; (ii) CBB; and (iii) lateral edges (cone surface), as shown in Figure A1a.
Figure A1. Scheme of simulating (a) the set of cones (projection in the XOZ plane) and (b) cloud fields (projection in XOY plane).
Remotesensing 10 01342 g0a1
In situation (i), the photon that has travelled further may either escape from the atmosphere without returning to the cloud layer, or cross the cloud top boundary again. In the latter case, the intersection point of the trajectory and CTB will define the axis of the next cloud cone. Provided that the photon left the cloud layer through its bottom boundary (situation (ii)), it unavoidably will cross it again while traveling in the direction from subcloud layer to higher atmospheric layers (points P 1 and P 2 ). If P2 is outside the initial field, we simulate the next cloud cone K 2 with the axis O A 2 ( A 2 = P 2 ). Finally, after the photon leaves through the lateral side at point P 3 (situation (iii)), we construct cone K3 with the generatrix O P 3 : Cones K 2 and K 3 “touch” each other along the generatrix O P 3 . All cones at the CBB level have identical cross-sections and only differ by the directions of the O P i axes. Cloud realizations within new cones are “clones” of cloud field 1, and they are constructed through affine transformations of the coordinates of cloud centers in the initial field, see Figure A1b. This method of increasing the area of the cloud field for photon trajectory modeling can be considered an analog of periodic conditions in the plane-parallel model of the atmosphere. It is equally applicable to calculations of both intensity I and mean intensity I .
We will estimate the efficiency of this approach using as an example the I calculations at a wavelength of 0.55 µm for different cloud field areas S. Figure A2a presents the deviations of I S values calculated for S = 100, 300, and 450 km2, from reference values calculated for S* = 3000 km2: Dif S = 100 % ( I S I ) / I S . Symbols in the figure for the same SZA values correspond to the calculations for different cloud fractions (CF = 3 and CF = 6), surface albedos ( A s = 0.11 (grass) and A s = 0.74 (snow)), and viewing zenith angles (VZA = 0° and VZA = 70°). For each of these fixed sets of CF, A s , and VZA we performed averaging over solar azimuth angles (SAA = 0°, 90°, 180°, 270°).
Figure A2. (a) Relative differences in the mean intensity for different cloud field areas S from the reference calculations with S* = 3000 km2 and (b) laboriousness of the calculations as a function of S. Diameter of the base and geometrical thickness of the cloud are 1 km; extinction coefficient σcld = 10 km−1.
Remotesensing 10 01342 g0a2
From Figure A2a, it follows that with increasing cloud field area, there is a tendency for the difference | Dif S | to decrease, on average, from ~8% at S = 100 km2 to ~3% at S = 450 km2. Considering that the intensity computation error | D η | did not exceed 2–3% in most cases, modification of the algorithm based on the use of our approach insures a calculation accuracy no worse than that of the initial algorithm with a larger cloud field area. At the same time, the efficiency of the new algorithm increases by about a factor of two when the cloud field area decreases to 450 km2, as shown in Figure A2b. We note that this same trick can also be used to calculate the intensity in an individual realization; however, in this case the general information on the cloud field is lost, complicating the interpretation of the simulation results.

References

  1. Varnai, T.; Marshak, A. Observations of three-dimensional radiative effects that influence MODIS cloud optical thickness retrievals. J. Atmos. Sci. 2002, 59, 1607–1618. [Google Scholar] [CrossRef]
  2. Alexandrov, M.D.; Marshak, A.; Cairns, B.; Lacis, A.A.; Carlson, B.E. Automated cloud screening algorithm for MFRSR data. Geophys. Res. Lett. 2004, 31, L04118. [Google Scholar] [CrossRef]
  3. Horvath, A.; Davies, R. Anisotropy of water cloud reflectance: A comparison of measurements and 1D theory. Geophys. Res. Lett. 2004, 31, L01102. [Google Scholar] [CrossRef]
  4. Marshak, A.; Platnick, S.; Varnai, T.; Wen, G.; Cahalan, R.F. Impact of three-dimensional radiative effects on satellite retrievals of cloud droplet sizes. J. Geophys. Res. 2006, 111, D09207. [Google Scholar] [CrossRef]
  5. Koren, I.; Remer, L.A.; Kaufman, Y.J.; Rudich, Y.; Martins, J.V. On the twilight zone between clouds and aerosols. Geophys. Res. Lett. 2007, 34, L08805. [Google Scholar] [CrossRef]
  6. Wen, G.; Marshak, A.; Cahalan, R.F.; Remer, L.A.; Kleidman, R.G. 3-D aerosol-cloud radiative interaction observed in collocated MODIS and ASTER images of cumulus cloud fields. J. Geophys. Res. 2007, 112, D13204. [Google Scholar] [CrossRef]
  7. Chiu, J.C.; Marshak, A.; Knyazikhin, Y.; Pilewskie, P.; Wiscombe, W. Physical interpretation of the spectral radiative signature in the transition zone between cloud-free and cloudy regions. Atmos. Chem. Phys. 2009, 9, 1419–1430. [Google Scholar] [CrossRef] [Green Version]
  8. Varnai, T.; Marshak, A. MODIS observations of enhanced clear sky reflectance near clouds. Geophys. Res. Lett. 2009, 36, L06807. [Google Scholar] [CrossRef]
  9. Kassianov, E.I.; Ovchinnikov, M.; Berg, L.K.; McFarlane, S.A.; Flynn, C.J.; Ferrare, R.; Hostetler, C.; Alexandrov, M. Retrieval of aerosol optical depth in vicinity of broken clouds from reflectance ratios: Case study. Atmos. Meas. Technol. 2010, 3, 1333–1349. [Google Scholar] [CrossRef]
  10. Wen, G.; Marshak, A.; Levy, R.; Remer, L.; Loeb, N.; Varnai, T.; Cahalan, R. Implementation of the correction algorithm of the MODIS aerosol retrievals near clouds. J. Geophys. Res. 2013, 118, 9168–9181. [Google Scholar] [CrossRef]
  11. Marshak, A.; Evans, K.V.; Varnai, T.; Wen, G. Extending 3D near-cloud corrections from shorter to longer wavelengths. J. Quant. Spectrosc. Radiat. Transf. 2014, 147, 79–85. [Google Scholar] [CrossRef]
  12. Eck, T.F.; Holben, B.N.; Reid, J.S.; Arola, A.; Ferrare, R.A.; Hostetler, C.A.; Crumeyrolle, S.N.; Berkoff, T.A.; Welton, E.J.; Lolli, S.; et al. Observations of rapid aerosol optical depth enhancements in the vicinity of polluted cumulus clouds. Atmos. Chem. Phys. 2014, 14, 11633–11656. [Google Scholar] [CrossRef] [Green Version]
  13. Smirnov, A.; Holben, B.N.; Eck, T.F.; Dubovik, O.; Slutsker, I. Cloud screening and quality control algorithms for the AERONET database. Remote Sens. Environ. 2000, 73, 337–349. [Google Scholar] [CrossRef]
  14. Stevens, B.; Moeng, C.-H.; Ackerman, A.S.; Bretherton, C.S.; Chlond, A.; de Roode, S.; Edwards, J.; Golaz, J.-C.; Jiang, H.; Khairoutdinov, M.; et al. Evaluation of large-eddy simulations via observations of nocturnal marine stratocumulus. Mon. Weather Rev. 2005, 133, 1443–1462. [Google Scholar] [CrossRef]
  15. Mullamaa, Y.-A.R.; Sulev, M.A.; Pyldmaa, V.K.; Okhvril, K.A.; Niilisk, K.Y.; Allenov, M.I.; Chubakov, L.G.; Kuusk, A.E. Stochastic Structure of Cloud and Radiation Fields; Academy of Sciences of Estonian SSR, Institute of Physics and Astronomy: Tartu, Estonia, 1972. [Google Scholar]
  16. Kargin, B.A.; Prigarin, S.M. Imitational simulation of cumulus clouds for studying solar radiative transfer in the atmosphere by the Monte Carlo method. Atmos. Ocean. Opt. 1994, 7, 690–696. [Google Scholar]
  17. Geogdzhaev, I.V.; Kondranin, T.V.; Rublev, A.N.; Chubarova, N.E. Simulation of UV radiative transfer through broken clouds and comparison with experiment. Izv. Akad. Nauk SSSR Ser. Fiz. Atm. Okeana 1997, 33, 680–686. (In Russian) [Google Scholar]
  18. Cahalan, R.F. Bounded cascade clouds: Albedo and effective thickness. Nonlinear Proc. Geophys. 1994, 1, 156–167. [Google Scholar] [CrossRef]
  19. Marshak, A.; Davis, A.; Cahalan, R.F.; Wiscombe, W.J. Bounded cascade models as nonstationary multifractals. Phys. Rev. E 1994, 49, 55–69. [Google Scholar] [CrossRef]
  20. Titov, G. Statistical description of radiative transfer in clouds. J. Atmos. Sci. 1990, 47, 24–38. [Google Scholar] [CrossRef]
  21. Zuev, V.E.; Titov, G.A. Atmospheric Optics and Climate; Spektr: IAO SB RAS: Tomsk, Russia, 1996. (In Russian) [Google Scholar]
  22. Evans, K.F.; Wiscombe, W.J. An algorithm for generating stochastic cloud fields from radar profile statistics. Atmos. Res. 2004, 72, 263–289. [Google Scholar] [CrossRef]
  23. Hogan, R.J.; Kew, S.F. A 3D stochastic cloud model for investigating the radiative properties of inhomogeneous cirrus clouds. Q. J. R. Meteorol. Soc. 2005, 131, 2585–2608. [Google Scholar] [CrossRef] [Green Version]
  24. Venema, V.; Bachner, S.; Rust, H.W.; Simmer, C. Statistical characteristics of surrogate data based on geophysical measurements. Nonlinear Proc. Geophys. 2006, 13, 449–466. [Google Scholar] [CrossRef] [Green Version]
  25. Schmidt, K.S.; Venema, V.; Giuseppe, F.D.; Scheirer, R.; Wendisch, M.; Pilewskie, P. Reproducing cloud microphysics and irradiance measurements using three 3D cloud generators. Q. J. R. Meteorol. Soc. 2007, 133, 765–780. [Google Scholar] [CrossRef] [Green Version]
  26. Prigarin, S.M.; Marshak, A. A simple stochastic model for generating broken cloud optical depth and cloud-top height fields. J. Atmos. Sci. 2009, 66, 92–104. [Google Scholar] [CrossRef]
  27. Mikhailov, G.A. Optimization of Weighted Monte Carlo Methods; Nauka: Moscow, Russia, 1987. (In Russian) [Google Scholar]
  28. Avaste, O.A.; Vainikko, G.M. Solar radiative transfer in broken clouds. Izv. Acad. Sci. USSR Atmos. Ocean. Phys. 1974, 10, 1054–1061. [Google Scholar]
  29. Malvagi, F.; Byrne, R.N.; Pomraning, G.; Somerville, R.C.J. Stochastic radiative transfer in a partially cloudy atmosphere. J. Atmos. Sci. 1993, 50, 2146–2158. [Google Scholar] [CrossRef]
  30. Lane-Veron, D.E.; Somerville, R.C.J. Stochastic theory of radiative transfer through generalized cloud field. J. Geophys. Res. 2004, 109, D18113. [Google Scholar] [CrossRef]
  31. Doicu, A.; Efremenko, D.S.; Loyola, D.; Trautmann, T. Approximate models for broken clouds in stochastic radiative transfer theory. J. Quant. Spectrosc. Radiat. Transf. 2014, 145, 74–87. [Google Scholar] [CrossRef]
  32. Huang, D.; Liu, Y. A novel approach for introducing cloud spatial structure into cloud radiative transfer parameterizations. Environ. Res. Lett. 2014, 9, 124022. [Google Scholar] [CrossRef] [Green Version]
  33. Shabanov, N.V.; Knyazikhin, Y.; Baret, F.; Myneni, R.B. Stochastic modeling of radiation regime in discontinuous vegetation canopies. Remote Sens. Environ. 2000, 74, 125–144. [Google Scholar] [CrossRef]
  34. Huang, D.; Knyazikhin, Y.; Wang, W.; Deering, D.W.; Stenberg, P.; Shabanov, N.; Tan, B.; Myneni, R.B. Stochastic transport theory for investigating the three-dimensional canopy structure from space measurements. Remote Sens. Environ. 2008, 112, 35–50. [Google Scholar] [CrossRef]
  35. Stuhlmann, R.; Minnis, P.; Smith, G.L. Cloud bidirectional reflectance functions: A comparison of experimental and theoretical results. Appl. Opt. 1985, 24, 396–401. [Google Scholar] [CrossRef] [PubMed]
  36. Loeb, N.G.; Coakley, J.A., Jr. Inference of marine stratus cloud optical depths from satellite measurements: Does 1D theory apply? J. Clim. 1998, 11, 215–233. [Google Scholar] [CrossRef]
  37. Descloitres, J.; Buriez, J.C.; Parol, F.; Fouquart, Y. POLDER observations of cloud bidirectional reflectances compared to a plane-parallel model using the International Satellite Cloud Climatology Project cloud phase functions. J. Geophys. Res. 1998, 103, 11411–11418. [Google Scholar] [CrossRef] [Green Version]
  38. Loeb, N.G.; Davies, R. Angular dependence of observed reflectances: A comparison with plane parallel theory. J. Geophys. Res. 1997, 102, 6865–6881. [Google Scholar] [CrossRef] [Green Version]
  39. Cornet, C.; Davies, R. Use of MISR measurements to study the radiative transfer of an isolated convective cloud: Implications for cloud optical thickness retrieval. J. Geophys. Res. 2008, 113, D04202. [Google Scholar] [CrossRef]
  40. Loeb, N.G.; Varnai, T.; Davies, R. Effect of cloud inhomogeneities on the solar zenith angle dependence of nadir reflectance. J. Geophys. Res. 1997, 102, 9387–9395. [Google Scholar] [CrossRef] [Green Version]
  41. Loeb, N.G.; Varnai, T.; Winker, D.M. Influence of subpixel-scale cloud-top structure on reflectances from overcast stratiform cloud layers. J. Atmos. Sci. 1998, 55, 2960–2973. [Google Scholar] [CrossRef]
  42. Varnai, T.; Marshak, A. View angle dependence of cloud optical thicknesses retrieved by Moderate Resolution Imaging Spectroradiometer (MODIS). J. Geophys. Res. 2007, 112, D06203. [Google Scholar] [CrossRef]
  43. Kato, S.; Marshak, A. Solar zenith and viewing geometry-dependent errors in satellite retrieved cloud optical thickness: Marine stratocumulus case. J. Geophys. Res. 2009, 114, D01202. [Google Scholar] [CrossRef]
  44. Zhang, Z.; Ackerman, A.S.; Feingold, G.; Platnick, S.; Pincus, R.; Xue, H. Effects of cloud horizontal inhomogeneity and drizzle on remote sensing of cloud droplet effective radius: Case studies based on large-eddy simulations. J. Geophys. Res. 2012, 117, D19208. [Google Scholar] [CrossRef]
  45. Liang, L.; Di Girolamo, L. A global analysis on the view-angle dependence of plane-parallel oceanic liquid water cloud optical thickness using data synergy from MISR and MODIS. J. Geophys. Res. Atmos. 2013, 118, 2389–2403. [Google Scholar] [CrossRef] [Green Version]
  46. Horvath, A.; Seethala, C.; Deneke, H. View angle dependence of MODIS liquid water path retrievals in warm oceanic clouds. J. Geophys. Res. Atmos. 2014, 119, 8304–8328. [Google Scholar] [CrossRef] [PubMed] [Green Version]
  47. Wang, Y.; Lu, D.; Huo, J. Impact of cloud inhomogeneity on bi-directional reflectance. Chin. Sci. Bull. 2008, 53, 124–130. [Google Scholar] [CrossRef]
  48. Cahalan, R.; Oreopoulos, R.; Marshak, A.; Evans, K.F.; Davis, A.; Pincus, R.; Yetzer, K.; Mayer, B.; Davies, R.; Ackerman, T.; et al. The I3RC: Bringing together the most advanced radiative transfer tools for cloudy atmospheres. Bull. Am. Meteorol. Soc. 2005, 86, 1275–1293. [Google Scholar] [CrossRef]
  49. Kassianov, E.I. Stochastic radiative transfer in multilayer broken clouds. Part I: Markovian approach. J. Quant. Spectrosc. Radiat. Transf. 2003, 77, 373–393. [Google Scholar] [CrossRef]
  50. Zhuravleva, T.B.; Nasrtdinov, I.M.; Russkova, T.V.; Chesnokova, T.Y. Mathematical simulation of brightness fields in broken clouds for observations from Earth’s surface and from space in plane and spherical atmospheric models. In Proceedings of the 22nd International Symposium on Atmospheric and Ocean Optics: Atmospheric Physics, Tomsk, Russia, 30 June–3 July 2016; Volume 10035, p. 1003502. [Google Scholar] [CrossRef]
  51. Zhuravleva, T.B.; Nasrtdinov, I.M.; Russkova, T.V. Influence of 3D cloud effects on spatial-angular characteristics of the reflected solar radiation field. Atmos. Ocean. Opt. 2017, 30, 103–110. [Google Scholar] [CrossRef]
  52. Zhuravleva, T.B.; Nasrtdinov, I.M. Simulation of the mean intensity of reflected solar radiation in broken clouds: Spherical model of atmosphere. In Proceedings of the 23rd International Symposium on Atmospheric and Ocean Optics: Atmospheric Physics, Irkutsk, Russia, 3–7 July 2017; Volume 10466, p. 1046608. [Google Scholar] [CrossRef]
  53. Kopytov, N.P.; Mityushov, E.A. Universal algorithm for uniform distribution of points over random analytical surfaces in 3D space. Fundam. Issled. 2013, 4, 618–622. (In Russian) [Google Scholar]
  54. World Climate Research Programme, International Association for Meteorology and Atmospheric Physics; Radiation Commission. A Preliminary Cloudless Standard Atmosphere for Radiation Computation; World Climate Research Programme; WCP: Boulder, CO, USA, 1986; p. 112. [Google Scholar]
  55. Hess, M.; Koepke, P.; Schult, I. Optical properties of aerosols and clouds: The software package OPAC. Bull. Am. Meteorol. Soc. 1998, 79, 831–844. [Google Scholar] [CrossRef]
  56. Kneizys, F.X.; Robertson, D.S.; Abreu, L.W.; Acharya, P.; Anderson, G.P.; Rothman, L.S.; Chetwynd, J.H.; Selby, J.E.A.; Shetle, E.P.; Gallery, W.O.; et al. The MODTRAN 2/3 Report and LOWTRAN 7 Model; Abreu, L.W., Anderson, G.P., Eds.; Ontar Corporation: North Andover, MA, USA, 1996. [Google Scholar]
  57. Baldridge, A.M.; Hook, S.J.; Grove, C.I.; Rivera, G. The ASTER spectral library version 2.0. Remote Sens. Environ. 2009, 113, 711–715. [Google Scholar] [CrossRef]
  58. Goody, R.; West, R.; Chen, L.; Crisp, D. The correlated-k method for radiation calculations in nonhomogeneous atmospheres. J. Quant. Spectrosc. Radiat. Transf. 1989, 42, 539–550. [Google Scholar] [CrossRef]
  59. Marshak, A.; Davis, A.B. 3D Radiative Transfer in Cloudy Atmospheres; Marshak, A., Davis, A.B., Eds.; Springer: New York, NY, USA, 2005. [Google Scholar]
  60. Marchuk, G.I.; Mikhailov, G.; Nazaraliev, M.; Darbinjan, R.; Kargin, B.; Elepov, B. The Monte Carlo Methods in Atmospheric Optics; Springer: Heidelberg, Germany, 1980. [Google Scholar]
  61. Zhuravleva, T.B. Simulation of solar radiative transfer under different atmospheric conditions. Part I. The deterministic atmosphere. Atmos. Ocean. Opt. 2008, 21, 81–95. [Google Scholar]
  62. Feigelson, E.M.; Krasnokutskaya, L.D. Solar Radiation Fluxes in Clouds; Gidrometeoizdat: Leningrad, Russia, 1978. (In Russian) [Google Scholar]
  63. Gatebe, C.K.; King, M.D. Airborne spectral BRDF of various surface types (ocean, vegetation, snow, desert, wetlands, cloud decks, smoke layers) for remote sensing applications. Remote Sens. Environ. 2016, 179, 131–148. [Google Scholar] [CrossRef]
  64. Marshak, A.; Herman, J.; Szabo, A.; Blank, K.; Carn, S.; Cede, A.; Geogdzhayev, I.; Huang, D.; Huang, L.; Knyazikhin, Y.; et al. Earth observations from DSCOVR/EPIC Instrument. Bull. Am. Meteorol. Soc. 2018, in press. [Google Scholar] [CrossRef]
  65. Yang, W.; Marshak, A.; Várnai, T.; Knyazikhin, Y. EPIC Spectral Observations of Variability in Earth’s Global Reflectance. Remote Sens. 2018, 10, 254. [Google Scholar] [CrossRef]
  66. Yang, B.; Knyazikhin, Y.; Mõttus, M.; Rautiainen, M.; Stenberg, P.; Yan, L.; Chen, C.; Yan, K.; Choi, S.; Park, T.; et al. Estimation of leaf area index and its sunlit portion from DSCOVR 1019 EPIC data: Theoretical basis. Remote Sens. Environ. 2017, 198, 69–84. [Google Scholar] [CrossRef] [PubMed]
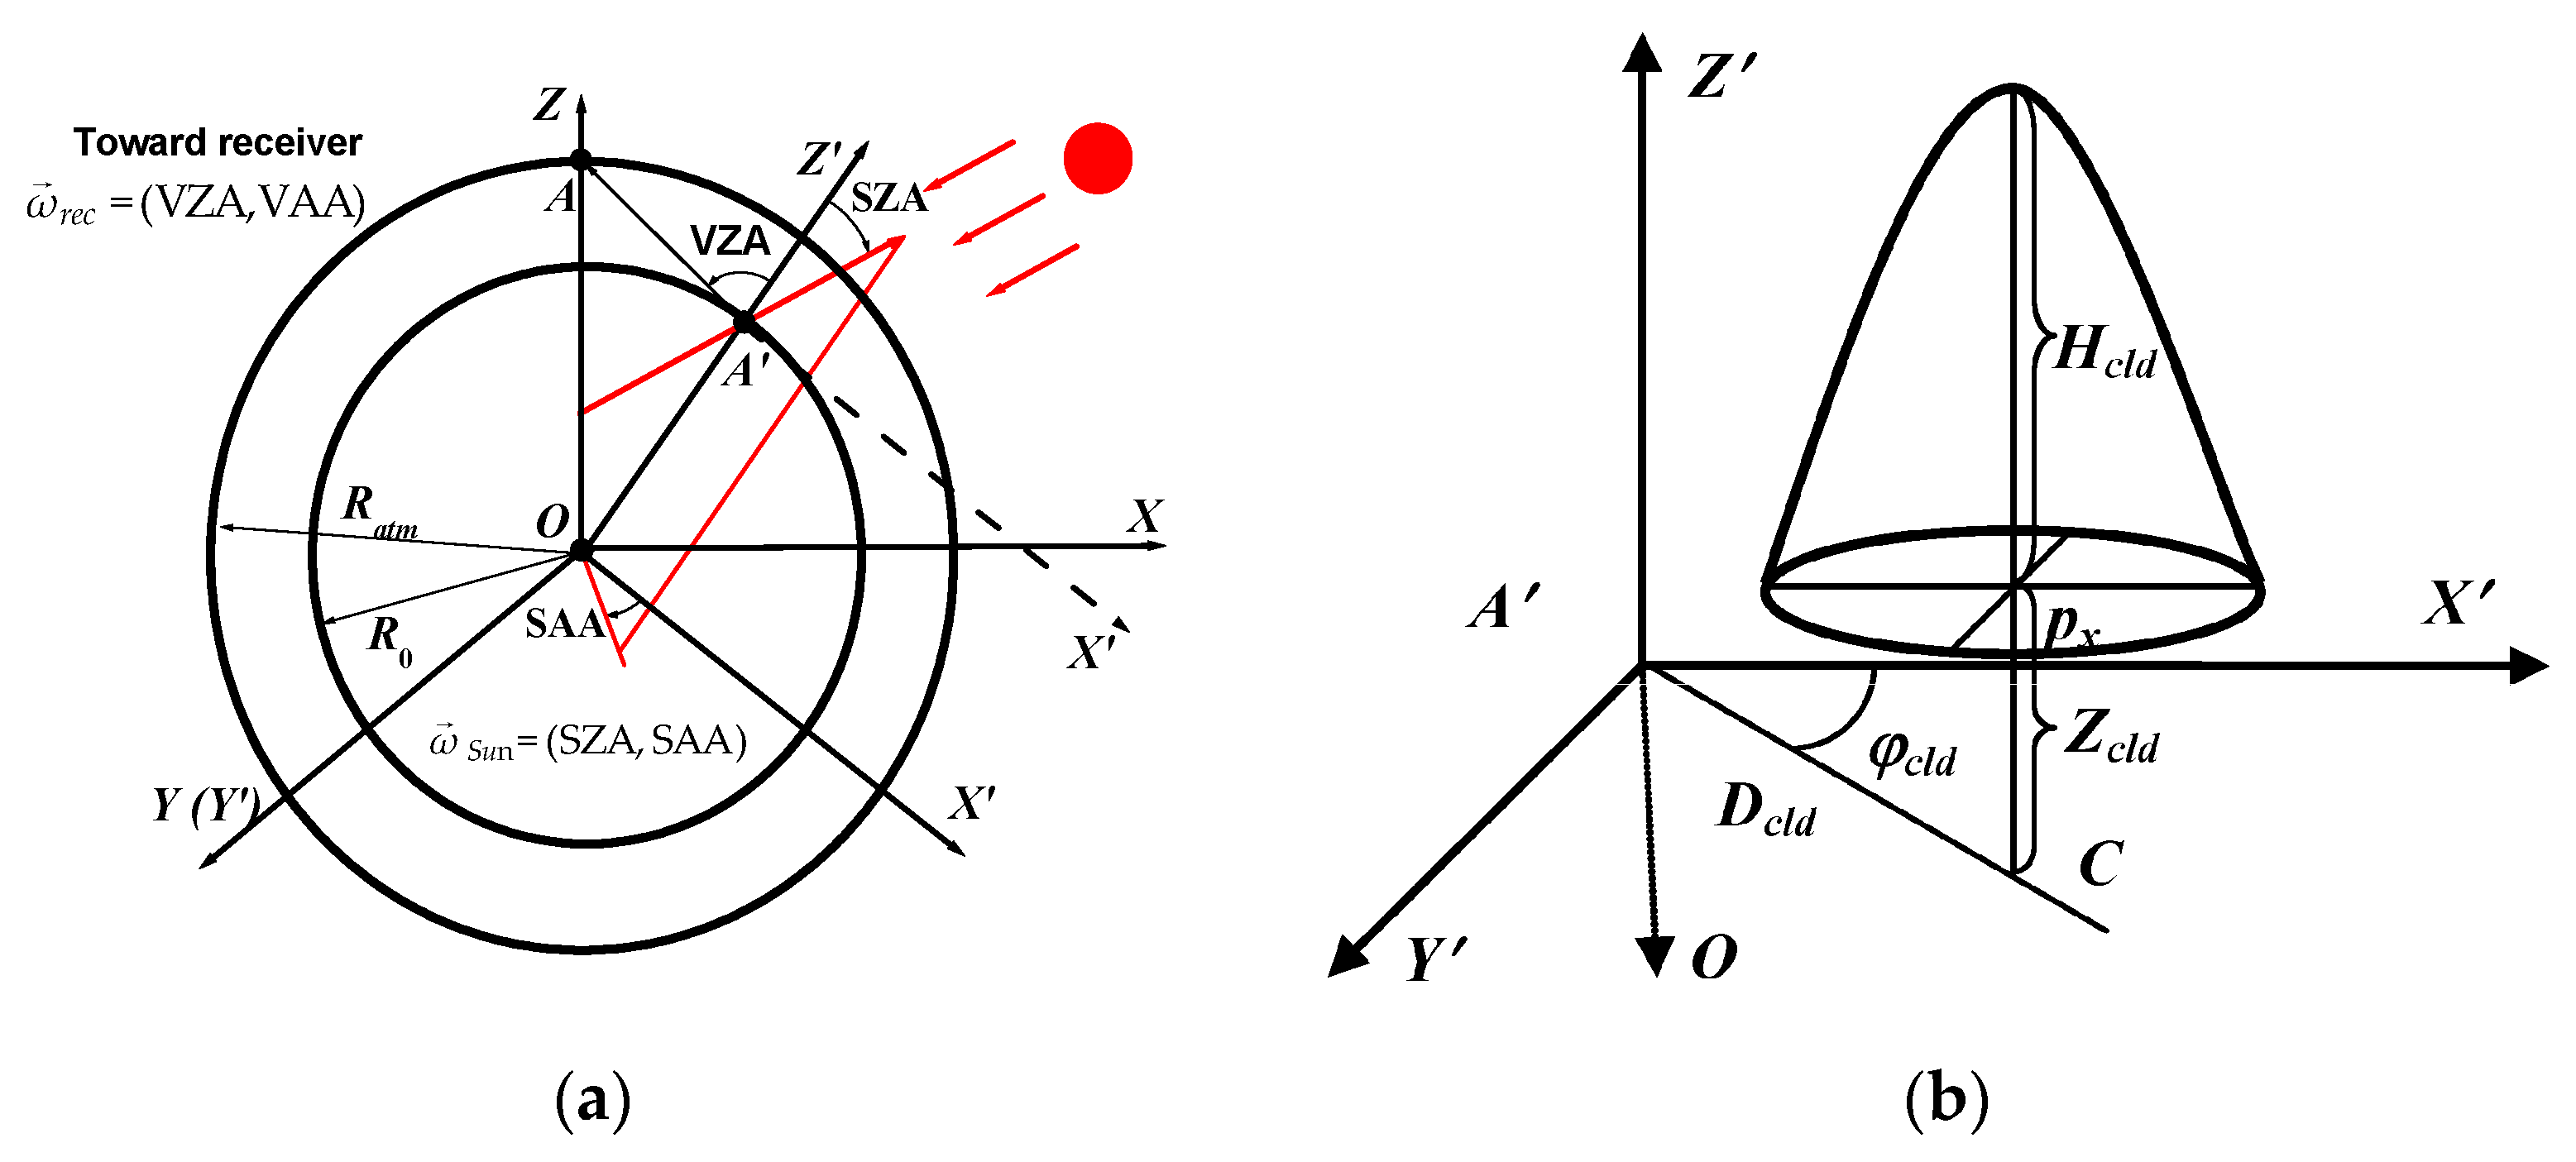
Figure 1. (a) Local and global coordinate systems in observations from space; and (b) scheme of the cloud position in the local coordinate system. Note: VZA, VAA are viewing zenith and azimuth angles, SZA, SAA are solar zenith and azimuth angles, D c l d is the distance between observation point A′ and the projection of paraboloid center onto the Earth (C), φ c l d is the azimuth angle between rays AX′ and AC, Z c l d is the height of the center of cloud base above the Earth’s surface, H c l d is the cloud geometric thickness, p x = p y are the semiaxes of paraboloid.
Remotesensing 10 01342 g001
Figure 2. (a,c,e) Schematic illustration of the sensing of isolated cloud for different illumination conditions; and (b,d) the dependence of reflectance R in the presence of cloud for different observation conditions compared to clear-sky conditions (grey straight lines).
Remotesensing 10 01342 g002aRemotesensing 10 01342 g002b
Figure 3. (a,b) Schematic image of two cloud realizations, and the dependence of reflectance on solar azimuth angles at (c) VZA = 0 and (d) VZA = 60° for different solar zenith angles, 0 ≤ SAA ≤ 180°; CF = 3, λ = 2.15 µm. Note: VZA is the viewing zenith angle, SAA is the solar azimuth angle and CF is the cloud fraction.
Remotesensing 10 01342 g003
Figure 4. (ad) Same as in Figure 3, but for CF = 6.
Remotesensing 10 01342 g004
Figure 5. Azimuthal dependence of reflection functions in Realizations 1 and 2, as well as of ensemble averages R at (a) VZA = 0 and (b) VZA = 60°, 0 ≤ SAA ≤ 180°, cloud fraction CF = 3; λ = 0.55 µm.
Remotesensing 10 01342 g005
Figure 6. Reflectance under the conditions of clear sky and overcast clouds and mean reflectance at CF = 3, CF = 6, and CF = 8. The cross section in the principal plane; (a) solar zenith angle (SZA) = 30° and (b) SZA = 60°. The negative viewing zenith angles are toward the Sun (SAA = 180°) and the positive angles are toward the antisolar location (SAA = 0), τ c l d = 10. The inset in panel (b) shows scattering phase functions of cloud and aerosol particles ([55], λ = 0.55 µm).
Remotesensing 10 01342 g006
Figure 7. Dependence of the mean reflectance on aspect ratio γ = H c l d / ( 2 p x ) at τ c l d = 10 for (a) SZA = 30°, CF = 3 and (b) SZA = 75°, CF = 6.
Remotesensing 10 01342 g007
Figure 8. Dependence of the mean reflectance on cloud optical depth for CF = 3, and SZA = 30 and 75°.
Remotesensing 10 01342 g008