Article

Consistent Calibration of VIRR Reflective Solar Channels Onboard FY-3A, FY-3B, and FY-3C Using a Multisite Calibration Method

1
Key Laboratory of Radiometric Calibration and Validation for Environmental Satellites, China Meteorological Administration, Beijing 100081, China
2
National Satellite Meteorological Center, China Meteorological Administration, Beijing 100081, China
3
Chinese academy of meteorological science, China Meteorological Administration, Beijing 100081, China
*
Author to whom correspondence should be addressed.
Remote Sens. 2018, 10(9), 1336; https://doi.org/10.3390/rs10091336
Submission received: 17 July 2018 / Revised: 9 August 2018 / Accepted: 19 August 2018 / Published: 22 August 2018

Abstract

:
The FengYun-3 (FY-3) Visible Infrared Radiometer (VIRR), along with its predecessor, the Multispectral Visible Infrared Scanning Radiometer (MVISR), onboard the FY-1C and FY-1D, has collected continuous daily global observations for 18 years. Achieving accurate and consistent calibration for VIRR reflective solar bands (RSBs) has been challenging, as there is no onboard calibrator and the frequency of in situ vicarious calibration is limited. In this study, a new set of reflectance calibration coefficients were derived for RSBs of the FY-3A, FY-3B, and FY-3C VIRRs using a multisite (MST) calibration method. This method is an extension of a previous MST calibration method, which relies on radiative transfer modeling over the multiple stable earth sites, and no synchronous in situ measurements are needed; hence, it can be used to update the VIRR calibration on a daily basis. The on-orbit radiometric changes of the VIRR onboard the FY-3 series were assessed based on analyses of new sets of calibration slopes. Then, all recalibrated VIRR reflectance data over Libya 4, the most frequently used stable Earth site, were compared with those provided from the Level 1B (L1B) product. Additional validation was performed by comparing the recalibrated VIRR data with those derived from radiative transfer simulations using measurements from automatic calibration instruments in Dunhuang. The results indicate that the radiometric response changes of the VIRRs onboard FY-3A and FY-3B were larger than those of FY-3C VIRR and were wavelength dependent. The current approach can provide consistent VIRR reflectances across different FY-3 satellite platforms. After recalibration, differences in top-of-atmosphere (TOA) reflectance data across different VIRRs during the whole lifetime decreased from 5–10% to less than 3%. The comparison with the automatic calibration method indicates that MST calibration shows good accuracy and lower temporal oscillations.

Graphical Abstract

1. Introduction

The Visible Infrared Radiometer (VIRR) aboard China’s FengYun-3 (FY-3) satellite mission, along with its predecessor, the Multispectral Visible Infrared Scanning Radiometer (MVISR) onboard the FY-1C and FY-1D satellites, have together collected over 18 years of continuous daily global observations [1]. This data record is valuable for quantitative remote sensing applications such as weather predictions, climate monitoring, and environmental research. Radiometric calibration is a vital first step in quantitative remote sensing applications. However, VIRR has no onboard calibration mechanism to track the sensor’s degradation drifts and to ensure that the calibration is stable and consistent throughout the mission time. This lack presents a major challenge to the use of VIRR data for studies requiring long-term observations derived from the sensor’s radiance products, such as climate studies.
Operational calibration of the VIRR solar reflectance channels is solely based on field vicarious calibration (VC) campaigns carried out over Dunhuang, China [2]. The Dunhuang VC is based on synchronous in situ measurements, and has been the baseline calibration approach for the FY satellites since 2002; the annual field campaign is routinely carried out in summer [3]. Although recent studies have demonstrated that China Radiometric Calibration Sites (CRCS) VC data have an average accuracy value of approximately 3% for visible (VIS) and near-infrared (NIR) window bands with respect to MODIS (Moderate Resolution Imaging Spectroradiometer) measurements [4], the limited frequency (once a year) is not sufficient for effective corrections for on-orbit drift in observed reflectance data retrieved by VIRR. Figure 1 shows a time series of the nadir (viewing angle within 10°) band 2 and band 7 reflectance data over the Libya 4 site, which is a frequently used stable Earth target [5,6,7]; these data were derived from the three VIRR sensors onboard FY-3A, FY-3B, and FY-3C. The current operational calibration of VIRR is clearly inconsistent across its entire lifetime and between different FY3 satellites.
In addition to VIRR, Advanced Very High-Resolution Radiometer (AVHRR) flown on the National Oceanic and Atmospheric Administration (NOAA) and European Organization for the Exploitation of Meteorological Satellites (EUMETSAT) is also a satellite sensor without an onboard calibration device. AVHRR was first on board the NOAA polar-orbiting satellite in 1978 and the series of AVHRR sensors have provided earth observation data for nearly 40 years. Abundant research has focused on recalibrating AVHRR reflective solar bands (RSBs) to produce consistently calibrated products suitable for climate applications. For example, Heidinger et al. [8] used time series of observations over stable desert sites to estimate the degradation rates of the calibration slope of NOAA-12 VIRR RSBs, while absolute calibration was achieved using a reference reflectance value for these sites derived from well-calibrated NOAA-9 data.
An alternative recalibration approach relies on a well-calibrated satellite sensor, such as MODIS, as a reference. Heidinger et al. [9] directly related the AVHRR reflectance data to MODIS records using Antarctic and desert targets and data from simultaneous nadir overpasses (SNOs) to calibrate all historic AVHRR sensors. The drawback of this approach lies in the fact that the derived time series of the AVHRR calibration coefficients are temporally matched to the MODIS observations. Thus, any systematic errors in MODIS observations would be transferred to the derived AVHRR calibration coefficients [10]. To avoid potential impacts of any such systematic errors, Wu et al. [10] merely used one-year observations from MODIS to build a site-specific BRDF model to normalize AVHRR-observed reflectance data while correcting the AVHRR calibration degradation by tracking long-term changes in the normalized reflectance ratios.
Many different post-launch calibration and monitoring approaches intended to increase the frequency of calibration updates for FY RSB sensors are also being developed at the National Satellite Meteorological Center (NSMC). These approaches include calibration monitoring by using deep convective clouds (DCCs) near the equator [11] and cross-calibration with sensors having an onboard calibration capability such as MODIS [12,13,14]. Recently, a multisite calibration tracking method based on stable earth sites and radiative transfer modeling without synchronous in situ measurements was proposed by Sun et al. [15] at the NSMC. However, the above methods focus on the MEdium-Resolution Spectral Imager (MERSI), another keystone payload onboard the FY-3 satellite series. Few studies were conducted on recalibration of VIRR.
The goal of this study was to use the multiple radiometrically stable sites as reference values to recalibrate VIRR solar reflectance channels so that they provide an accurate and temporally consistent basis for climate data records that rely on solar reflectance observations. The recalibration method for VIRR proposed here is based on the previous method proposed by Sun et al. [4], with some improvements. For example, two stable Earth sites with higher reflectances (>0.3) at the short wavelength range (<600 nm) were added to increase the dynamic range of the calibration reference at the short wavelength range. The reasons for and details of this improvement and other improvements are discussed in the methodology section.
Section 2 presents a detailed description of VIRR instrument specifications and the current operational calibration state. Section 3 provides a detailed description of the methodology used to derive the VIRR calibration coefficients via the multisite (MST) calibration method. As this method is an extension of method previously discussed by Sun et al. [15], the major improvements in the MST calibration method used in the current study are also addressed in this section. Section 4 presents the results and discussion, including estimates of on-orbit radiometric changes of VIRR onboard the FY-3 series based on the analysis of calibration slopes derived from the MST calibration method, and comparisons between the recalibrated VIRR reflectance results and those provided in the current operational Level 1B (L1B) product as well as those derived from radiative transfer simulations using measurements from automatic calibration instruments in Dunhuang. Finally, conclusions are given in Section 5.
The results of this study indicate that the proposed methodology is able to correct for significant drift in the VIRR reflectance data over the entire mission, providing consistent VIRR reflectances across different FY-3 satellite platforms.

2. Sensor Overview and Current Calibration State

The VIRRs onboard the three FY-3 satellites have 10 spectral bands, namely, 7 RSBs covering the wavelength range of 0.4–1.65 μm and 3 thermal emissive bands covering the wavelength range of 3.5–12.5 μm (Table 1). Figure 2 shows the spectral response functions (SRFs) of the VIRR RSBs. The VIRR is a cross track scanning radiometer that makes Earth view observations over a scan angle range of ±55.4° about nadir via a 45° scan mirror and a de-rotated K mirror. The VIRR collects data at nadir at a spatial resolution of 1100 m, and it covers a swath of 2048 km cross track by 1800 km (at nadir) along track for each scan, thus enabling complete global coverage in one day.
Because of the lack of an onboard calibration unit, the on-orbit calibration for VIRR solar bands relies on in situ calibration campaigns carried out over Dunhuang, China, which take place once per year. The Dunhuang test site, which is one of the CRCS for the VC of Chinese spaceborne sensors, was selected by the Working Group on Calibration and Validation (WGCV) of the Committee on Earth Observation Satellites (CEOS) as one of the instrumented reference sites in 2008 [3]. The site is spatially uniform and temporally stable with coefficients of variation (CVs) (standard deviation/mean) amounting to less than 2% and less than 3%, respectively, over the 10 km × 10 km central region. The surface reflectance is around 15–30% in the VIS/NIR spectral region. The site is clearly not Lambertian, and the surface bidirectional reflectance distribution function (BRDF) was modeled with field measurements in the summer of 2008. The aerosol loading is low, with an average optical depth of approximately 0.2 at 550 nm, except for during the dusty spring season [3]. During the calibration campaigns, satellite synchronization (1 h before and after satellite transit) measurements such as aerosol optical characteristics, surface reflectances, and temperature humidity profiles are carried out to obtain the calibration coefficients by using the reflectance-based calibration method [4]. The calibration uncertainty of the Dunhuang VC method is less than 5% for most solar bands, except the water absorption bands [15]. The operational calibration coefficient is updated if the current operational calibration error exceeds 5% compared with the in situ calibration campaign results.

3. Methodology

3.1.Selection of Calibration Sites

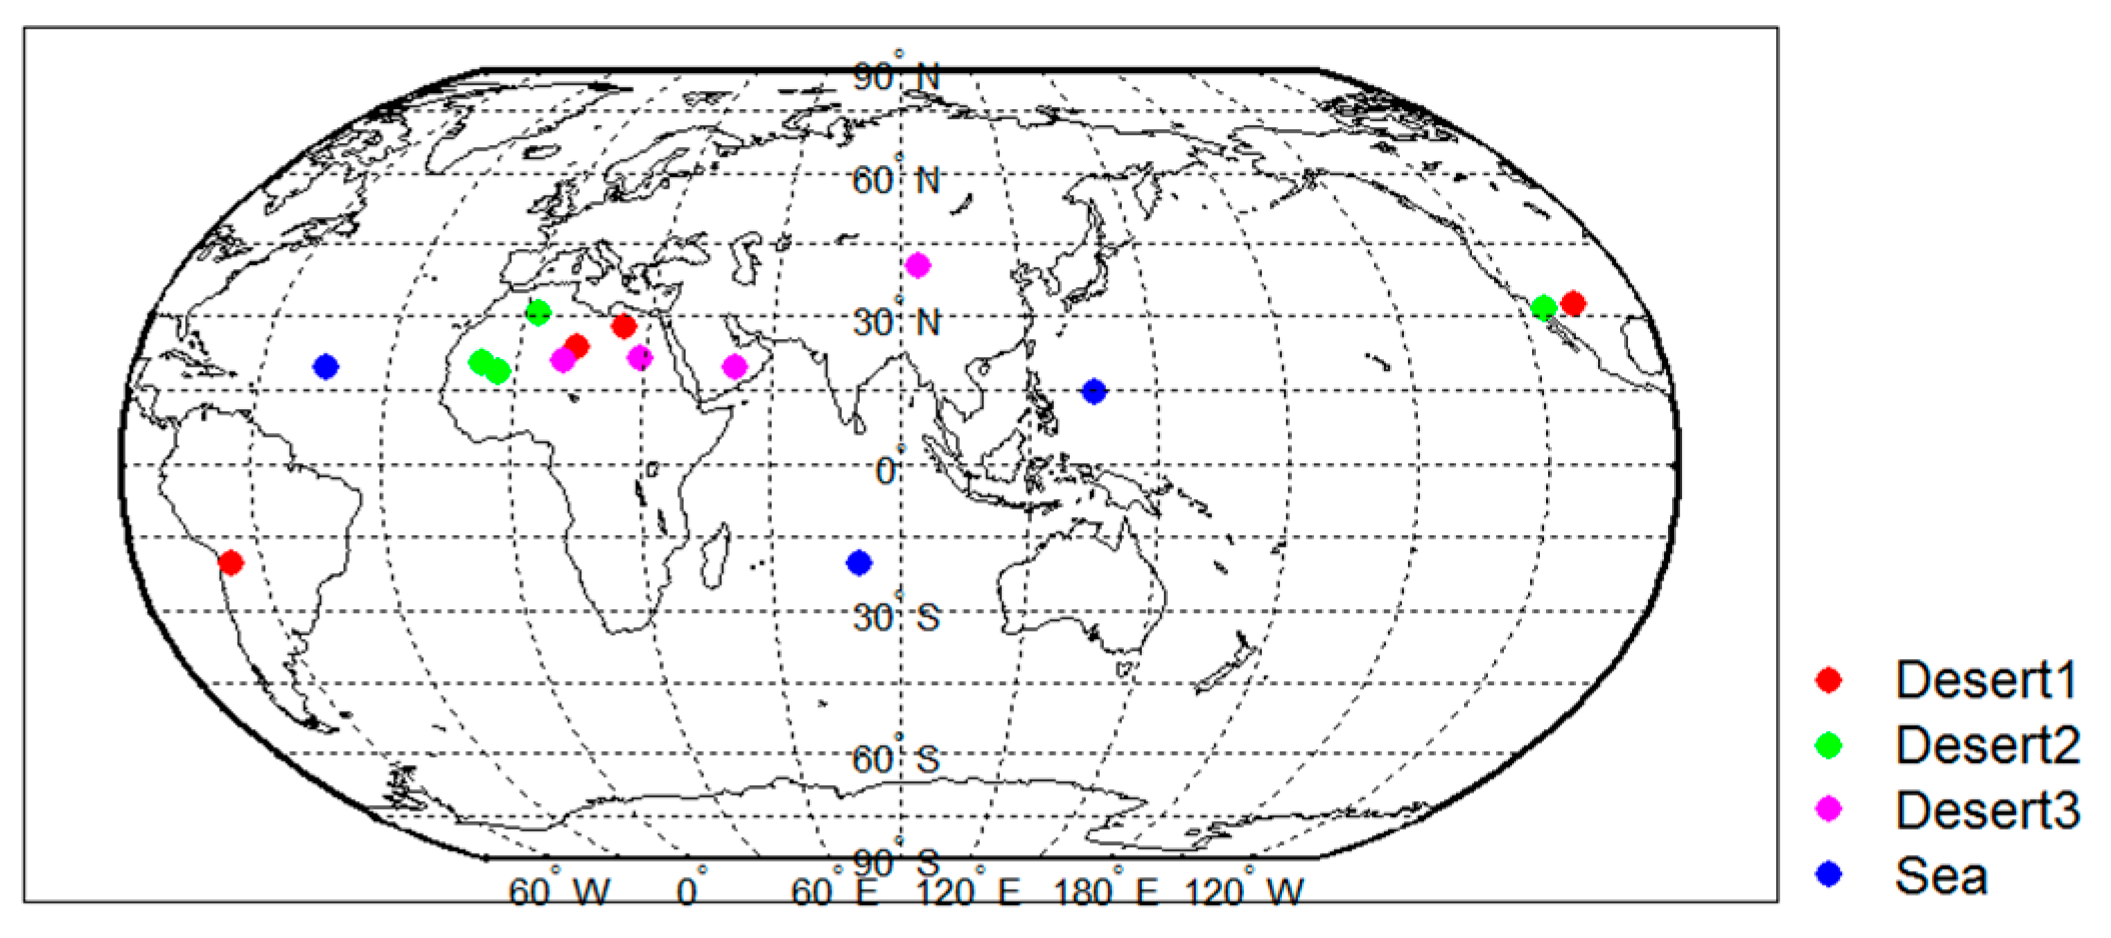
3.1.1. Calibration Test Sites

Given the rapidly growing number of Earth-observing satellites, it is increasingly urgent to assure the accuracy and consistent quality of their data. To address this issue, the U.S. Geological Survey (USGS), as a supporting member of the CEOS and the Global Earth Observation System of Systems (GEOSS), has established a set of nearly 40 prime calibration test sites for the post-launch characterization and calibration of space-based optical imaging sensors [16]. These test sites are characterized by high spatial uniformity, excellent radiometric stability, relative higher surface reflectance (>0.3), low aerosol loading, etc. [16,17].
Most of these calibration test sites have no in situ ground observation instruments; at the beginning, they were therefore used to evaluate the long-term stability of a sensor and to facilitate cross-comparison of multiple sensors [7,18,19]. Recent studies carried out by Sun et al. [15], Helder et al. [20], and Mishra et al. [5] show that the PICS also have the potential to be used for absolute calibration. The absolute calibration method proposed by Helder et al. [20] and Mishra et al. [5] was based on use of MODIS as the radiometer to develop a site-specific absolute calibration model to calibrate satellite instruments with spectral channels similar to MODIS. The drawback of this approach is that any systematic errors in MODIS calibration and uncertainties in the site’s atmospheric model would influence the calibration accuracy. Sun et al. [15] developed a multisite (MST) absolute calibration method without relying on a reference calibration sensor. Their method was a reflectance-based calibration method, which relied on radiative transfer modeling (RTM) over the multiple stable calibration sites, but the input parameters of the RTM were obtained from satellite and climatology datasets rather than in situ measurements; hence, high-frequency radiometric calibration could be ensured. This method has been successfully applied to MERSI onboard FY-3A and FY-3B. The accuracy of the calibration reference for MERSI in terms of relative bias is within 5% for the RSBs from 0.4 to 2.1 μm.

3.1.2. Calibration Sites Used for this Study

In the original MST calibration method proposed by Sun et al. [15], four desert sites (Libya 1, Libya 4, Arabia 2, and Dunhuang) and a dark ocean site (Lanai) were used. However, because the desert sites become darker toward the short wavelength bands and the reflectance is typically <0.3 at short wavelengths (<600 nm), the dynamic range of the calibration reference in the original MST calibration method is limited and reaches a maximum of only 0.2–0.25 [15]. To increase the dynamic range of the calibration reference, two stable calibration sites with higher reflectances (>0.3) at the short wavelength range of <600 nm were added: White Sands in the United States, centered at 32.92°N and 106.35°W, and the Uyuni Salt Flats in Bolivia, centered at 32.92°N and 106.35°W. These two sites are among the radiometric calibration test sites approved by the USGS [16]. A stable area of at least 10 km × 15 km exists within White Sands, which is highly uniform and exhibits nearly Lambertian reflectance in the visible and near-infrared range. The stable area within the Uyuni Salt Flats extends to at least 25 km × 25 km with an altitude of 3650 m; hence, this site is characterized by low atmospheric aerosol loading and a high probability of cloud-free weather.
Figure 3a shows the averaged spectral reflectances of the desert sites used by Sun et al. [15] and the newly included sites at White Sands and the Uyuni Salt Flats. The spectral reflectances of each site were calculated from the Ross-Li BRDF model:
  R ( θ , φ , ϕ , λ   ) = f i s o ( λ ) + f v o l ( λ ) K v o l ( θ , φ , ϕ ) + f g e o ( λ ) K g e o ( θ , φ , ϕ )
where θ, ϕ, and ф are the solar zenith, view zenith, and relative azimuth angles, respectively; λ is the band wavelength; Kvol and Kgeo are the model kernels; and fiso, fvol, and fgeo are the spectrally dependent BRDF kernel weights or parameters. Kvol and Kgeo are both related to viewing geometry. Kvol is derived from volume scattering radiative transfer models [21] and Kgeo, from surface scattering and geometric shadow casting theory [22]. The three BRDF kernel parameters were related to surface type and were generated from the 2010 MODIS global BRDF/Albedo model parameters product (MCD43C1 version 6). The MCD43C1 product supplies the weighting parameters associated with the Ross-Li BRDF model that best describe the anisotropy of each pixel. These three parameters (fiso, fvol, and fgeo) are provided for each of the MODIS spectral bands 1 through 7 (0.46, 0.555, 0.659, 0.865, 1.24, 1.64, and 2.13 µm), as well as for three broad bands (0.3–0.7 µm, 0.7–5.0 µm, and 0.3–5.0 µm) at a spatial resolution of 0.05° [23].
As shown in Figure 3a, the two newly included sites have a higher reflectance in the short wavelength region (<600 nm) than the other desert sites. The calibration reference (RTM-simulated TOA reflectance) obtained from these two sites was around 0.5 (Figure 3b), twice that for the desert sites (~0.22) under the same viewing geometries and the same atmospheric conditions. This increase is helpful for decreasing the calibration uncertainty and enabling better solutions to the nonlinear response problems of the instrument.
In addition to the above two high-reflectance sites, additional stable desert sites approved by the USGS as calibration test sites and deep ocean regions were added to generate more calibration data pairs and to decrease the calibration uncertainty further. Figure 4 shows the 16 stable sites used in this improved MST radiometric calibration method. According to the target’s brightness, the 16 stable sites were divided into four groups. The high-brightness desert sites denoted as Desert1 included White Sands, Uyuni Salt Flats, Libya 1, Libya 4, and Mali; the moderate-brightness desert sites denoted as Desert2 included Algeria 5, Mauritania 2, Sonora, and Arabia 2; the low-brightness desert sites denoted as Desert3 included Niger 2, Sudan 1, Dunhuang, and Tinga_Tingana; and the three dark-sea sites denoted as Sea included the Atlantic N, Indian Ocean, and Pacific N1 sites.

3.2. Identification of Cloud-Free Sites

A rectangular region of interest (ROI) consisting of a 3 × 3-pixel window centered at the calibration site was used to retrieve the grid-averaged VIRR digital counts (DN) and the view-geometry parameters (solar zenith, sensor zenith, and relative azimuth). The DN was then converted to TOA reflectance by using the operational calibration coefficients recorded in each LB VIRR HDF-format file:
  ρ λ = ( G a i n λ · D N λ + O f f e s t λ   ) d 2 / cos ( θ )
where ρ is the TOA reflectance; Gain and Offset are calibration gain and offset, respectively; θ is the solar zenith angle; and d is the Earth–Sun distance in astronomical units.
Two cloud-screening procedures proposed by Kim et al. [24] were applied to remove cloud-contaminated ROIs. First, spatial homogeneity, defined as the ratio of standard deviation in the ROI window to the mean ROI value, was tested. Screening was performed if the ratio was larger than 0.05 for any VIRR RSBs. Second, the ROI reflectance value was compared with its temporally neighboring ROIs’ reflectance. Local mean values were computed using 20 temporally neighboring data points; data points deviating from the local mean by more than a 2.0 standard deviation were considered to be contaminated.
After cloud-screening, ROIs with solar zenith angles larger than 60° were further disregarded for reliable RTM calculation and a sun-glint angle threshold of 40°, as well as a surface wind speed (calculated from datasets provided by the National Centers for Environmental Prediction (NCEP) [25] less than 7 ms−1 were applied to the ocean sites to avoid sun glint contamination and whitecap effects. In the original MST calibration method, only a spatial homogeneity test was considered in the cloud screening, and the wind speed threshold was not applied for ocean sites.

3.3. Calibration Reference Calculation

To derive an absolute calibration, a calibration reference value for these sites was needed. The calibration reference here was the 6SV radiative transfer model [26] (RTM)-simulated TOA reflectance over the identified cloud-free sites, accounting for the actual solar illumination and sensor viewing angles at the acquisition time, the VIRR SRFs, and the corresponding surface and atmospheric properties.
The surface reflectances for the desert sites and the Uyuni Salt Flats were obtained using Equation (1) based on the MCD43C1 products. As the calculated surface reflectance is MODIS spectral channel (bands 1 to 7) equivalent, the calculated results were interpolated with a cubic spline function to obtain a continuous surface reflectance spectrum. The VIRR channel equivalent surface reflectances were then calculated through convolution of the continuous surface reflectance spectrum with the band response functions of the VIRR. For the ocean sites, the surface property parameters were adopted from CLEARW surface model parameters provided in 6SV. The desert and maritime aerosol models provided in 6SV were assumed for land and ocean sites, respectively. Other atmospheric parameters (total column water vapor, total column ozone, and aerosol optical depth (AOD) at 550 nm) were taken from the MODIS global 1° × 1° atmospheric products (version 6.1) [27]; MYD08_D3 was used for the land sites and MOD08_D3 for the ocean sites. The former provided accurate estimates of AOD at 550 nm over bright surfaces using the Deep Blue aerosol retrieval algorithm [28].

3.4. Determining Calibration Coefficient

The time series of pairs of VIRR observed DN and 6SV simulated TOA reflectance data under cloud-free conditions were accumulated individually for each calibration site. Assuming that the satellite sensor’s calibration coefficient is constant for a short period, such as 10 days or 30 days, the calibration coefficient could be calculated based on the pairs of the time series collected from the 16 stable Earth sites during an accumulation period (e.g., 30 days) by solving the following the least squares problem:
  min   G λ , I λ F λ
where λ represents the band wavelength; Gλ and Iλ represent the unknowns, i.e., the calibration gain and offset for a certain spectral channel λ; and the objective function Fλ is expressed as:
  F λ = ( ρ λ * *   ( g , t ) G λ · D N λ ( g , t ) I λ ) 2
where g represents the gth stable target and g ≤ 16; t represents the satellite transit time; DNλ(g, t) is the digital count of the VIRR for the gth target at t time; and Gλ and Iλ are the slope and intercept of the calibration coefficient for band λ, respectively. Furthermore, ρ**λ(g, t) is the TOA reflectance factor for the gth target at t time, which is scaled to the RTM-calculated TOA reflectance times via the cosine of the solar zenith angle (cos(θ)) and divided by the squared Earth–Sun distance (d), as shown below:
  ρ λ * *   = 100 ρ λ * cos ( θ ) / d 2
where ρ*λ is the RTM-calculated TOA reflectance for band λ, θ is the solar zenith angle, and d is the Earth–Sun distance in astronomical units.
Figure 5a shows examples of the calibration scatter plots with an accumulation period of 30 days for FY-3B VIRR band 8 (505 nm) using the 16 stable Earth sites. By using multiple stable Earth sites, the calibration samples achieved better coverage of the sensor dynamic range than that from one site; this was helpful for reducing the calibration errors, which were mainly due to the calculated reflectance uncertainties from one site’s data. Figure 5b is similar to Figure 5a, but excluded calibration examples from White Sands and Uyuni Salt Flats; hence, the number of the calibration sample number from 185 to 171. In addition, the dynamic range of the calibration reference decreased. The calibration reference of FY-3B VIRR band 8 (505 nm) reached ~0.5 when White Sands and Uyuni Salt Flats were used, but deceased to ~0.3 when these two sites were excluded. This agrees well with the conclusions derived from the simulation experiment shown in Figure 3b.

4. Results and Discussion

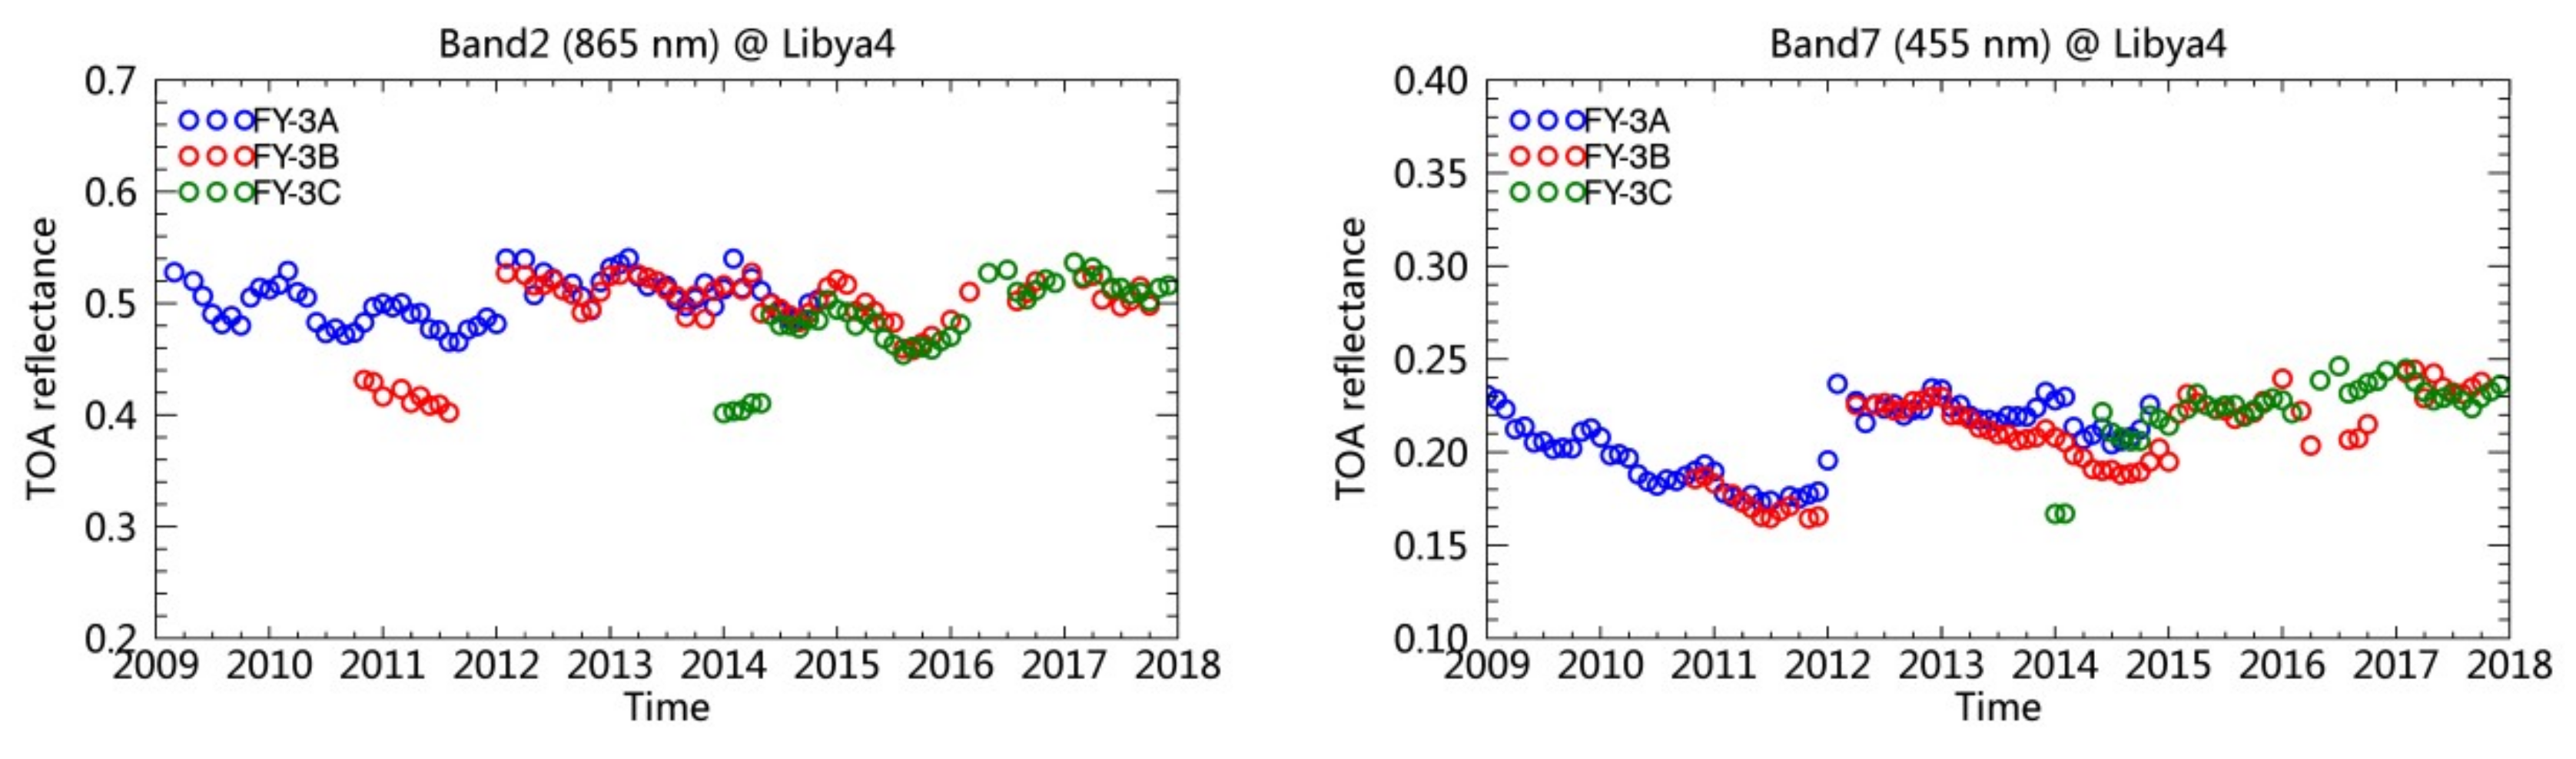
4.1. Time Series of the Calibration Slopes

The water vapor absorption channel of band 10 (Figure 2) is not discussed in this work. Figure 6 presents the calibration slopes since launch for the VIRR onboard FY-3A, FY-3B, and FY-3C. At the end of the lifetime, the orbit of the FY-3A satellite shifts with time, which influences the stability of the sensors flown on it; hence, the time period was limited to the end of 2014. The trends in the calibration slopes (open circles in Figure 6) showed a gradual increase over the mission lifetime, except for the longest wavelength band 6 with a central wavelength of 1595 nm. The operational calibration slopes derived from in situ Dunhuang VC data are also plotted in Figure 6, and these data are represented by the five-pointed stars. Except for band 6, the operational calibration slopes also tended to increase with time, which is in line with the trending in the calibration slopes derived from the MST calibration method. Although most of the operational calibration slopes agreed well with the MST calibration results, the operational calibration updates were too few to correct the sensor’s drift over time, which affected the consistency of calibration results, i.e., TOA reflectances, across the mission lifetime as shown in Figure 1.

4.2. Annual Change in the Calibration Slope

To estimate the on-orbit radiometric changes of the VIRR onboard the FY-3 series, the calibration slope of each band was normalized to the calibration slope on the first day (Figure 7). The fact that the normalized slopes were not equal to 1.0 reflects the magnitude of the radiometric changes of the VIRR and the adjustments were required on the current operational calibration coefficients. For example, the normalized slopes larger than 1.0 reflect the fact that the sensor’s radiometric performance decreased, and the current operational calibration coefficients need to be increased; conversely, those smaller than 1.0 indicate that the current operational calibration coefficients need to be decreased.
A simple linear regression model was applied to the time series of normalized calibration slopes to estimate the amount of radiometric changes in the VIRR. Table 2 summarizes the model coefficients derived from linear fitting along with the fitting error in terms of the root mean square error (RMSE) in each VIRR band. The slope values of the fitted lines were positive and ranged over the 10−5 to 10−4 level, which indicates that the VIRR calibration slope gradually increased and the radiometric performance drifted accordingly. The RMSEs of the linear fitting ranged from 0.5% to 4%, with the largest value corresponding to the largest fluctuations in the normalized calibration slope. The RMSEs tended to increase toward the shorter wavelength channels. When the aerosol particle size is the same, the aerosol scattering becomes stronger towards the shorter wavelength channel; hence, the uncertainty in the aerosol amount may introduce uncertainty into the calibration reference calculations when using an RTM, which will ultimately influence the calibration slope. It should be noted that for the longer wavelength channel 2 of 865 nm, the calibration slopes exhibited seasonal oscillations and the RMSE of the linear fitting was comparable to that of the shorter wavelength channels, i.e., blue and green channels of bands 8 and 9. The SRF profiles in Figure 1 show that band 2 is somewhat influenced by water vapor absorption, and hence, these seasonal oscillations in the calibration slopes may have been caused by the uncertainties in the water vapor amount provided from MOD08_D3 products.
The annual drift values in Table 2 represent the percentage change in the slope of the fit line, and these were calculated by estimating the normalized calibration slope at the end of one year (day 365) using the slope and intercept of the fit line and by using this value to calculate the percentage difference with respect to the intercept. Positive annual drift indicates a decrease in the radiometric performance, and so the calibration slope should be increased to compensate for the radiometric drift and make the calibration consistent across time. Figure 8 shows the annual drift of each channel for the VIRR onboard the FY-3 series. As shown in Figure 8, the radiometric response changes of the VIRR onboard FY-3A and FY-3B were similar and were wavelength dependent. Bands 7–9 with central wavelengths less than 600 nm showed larger amounts of degradation, particularly in the shortest band 7 (412 nm), which had the largest annual drift of approximately 7.2% and 8.2% for FY-3A and FY-3B, respectively; the red and NIR bands of bands 1 and 2 with central wavelengths of 600–900 nm also showed a moderate response decrease, with an annual drift of approximately 2–3%. The longest short-wave infrared (SWIR) channel of band 6 was the most stable, with annual degradation rates within 1%. However, no such wavelength-dependent radiometric response changes were found in FY-3C VIRR. The radiometric response changes in all RSBs of the FY-3C VIRR showed little differences, and the changes were moderate compared with those of FY-3B and FY-3A. Especially for the short wavelength channels of bands 7–9, the annual degradation rate for the FY-3C VIRR was around 2.5–4.1%, about half of the values for FY-3B and FY-3A. For the other three channels, the SWIR band 6 had a minimum degradation rate of 1.764%, and the red and NIR channels of bands 1 and 2 had a relatively larger degradation rate of ~4%.

4.3. Comparison of the Reflectance with L1B Operational Products

To further validate the calibration approach used in this study, we compared the recalibrated VIRR reflectances with those provided by the L1B operational product by using observations collected over the Libya 4 site. We chose this site since it is recognized as one of the most stable calibration reference sites and is frequently used in published research [5,7,8,9,19]. Figure 9 shows the time series of the recalibrated VIRR reflectances and those obtained from VIRR L1B operational L1B products over Libya 4 from January 2009 to December 2017. The reflectances were computed by averaging all of the pixels that fell within a 10 km × 10 km window centered on the target. Additionally, only near-nadir observations were used, and a limit of 10° was applied to the satellite viewing angle in order to minimize the changes in the TOA reflectance caused by the different viewing geometries.
For the operational reflectances over Libya 4 (Figure 9a,b), obvious jumps occurred at the beginning of 2012 for both the FY-3A VIRR (red symbols in Figure 9) and FY-3B VIRR (blue symbols in Figure 9); another jump at the beginning of 2016 was also found for the FY-3B VIRR, and a jump at the beginning of 2014 was found for the FY-3C VIRR. When compared with Figure 2, these jump times were found to be consistent with the calibration update times for the three VIRRs. In addition to the inconsistencies in the same VIRR across its lifetime, there was a mismatch between the different VIRRs for the operational reflectances. For example, during the period from the end of 2010 to the end of 2011, the operational reflectance of the FY-3B VIRR was lower than that of the FY-3A VIRR, and the difference was much larger for all the RSBs except for the SWIR band of channel 6 (1595 nm). Another gap was found in 2014, when FY-3C had just launched and had been operational for a few months; the pre-launch data were also used. Specifically, the operational reflectance of the FY-3C VIRR differed from that of the FY-3A and FY-3B VIRRs.
After recalibration using the MST calibration method, as shown in Figure 9c,d, these inconsistencies in the operational VIRR reflectances (Figure 9a,b), which were mainly detected during 2011, 2012, and 2014, were diminished. The recalibrated reflectances over Libya 4 were consistent across the different VIRRs and different times. The variation in terms of the CV, which was defined as the ratio of the standard deviation to the mean value in the reflectance time series, decreased to less than 3% (Figure 10a). However, before recalibration, the CV in the operational reflectance among different VIRRs was larger than 5% for most RSBs except for band 6; in particular, the CV of the short wavelength channels of bands 7–9 ranged from ~7% to ~10%, with a maximum in the shortest wavelength, band 7, and a minimum in the longest wavelength, band 9, among the three channels. Generally, the recalibrated VIRR reflectance data over Libya 4 from FY-3A to FY-3C were higher than those provided in the current L1B product (Figure 10b).

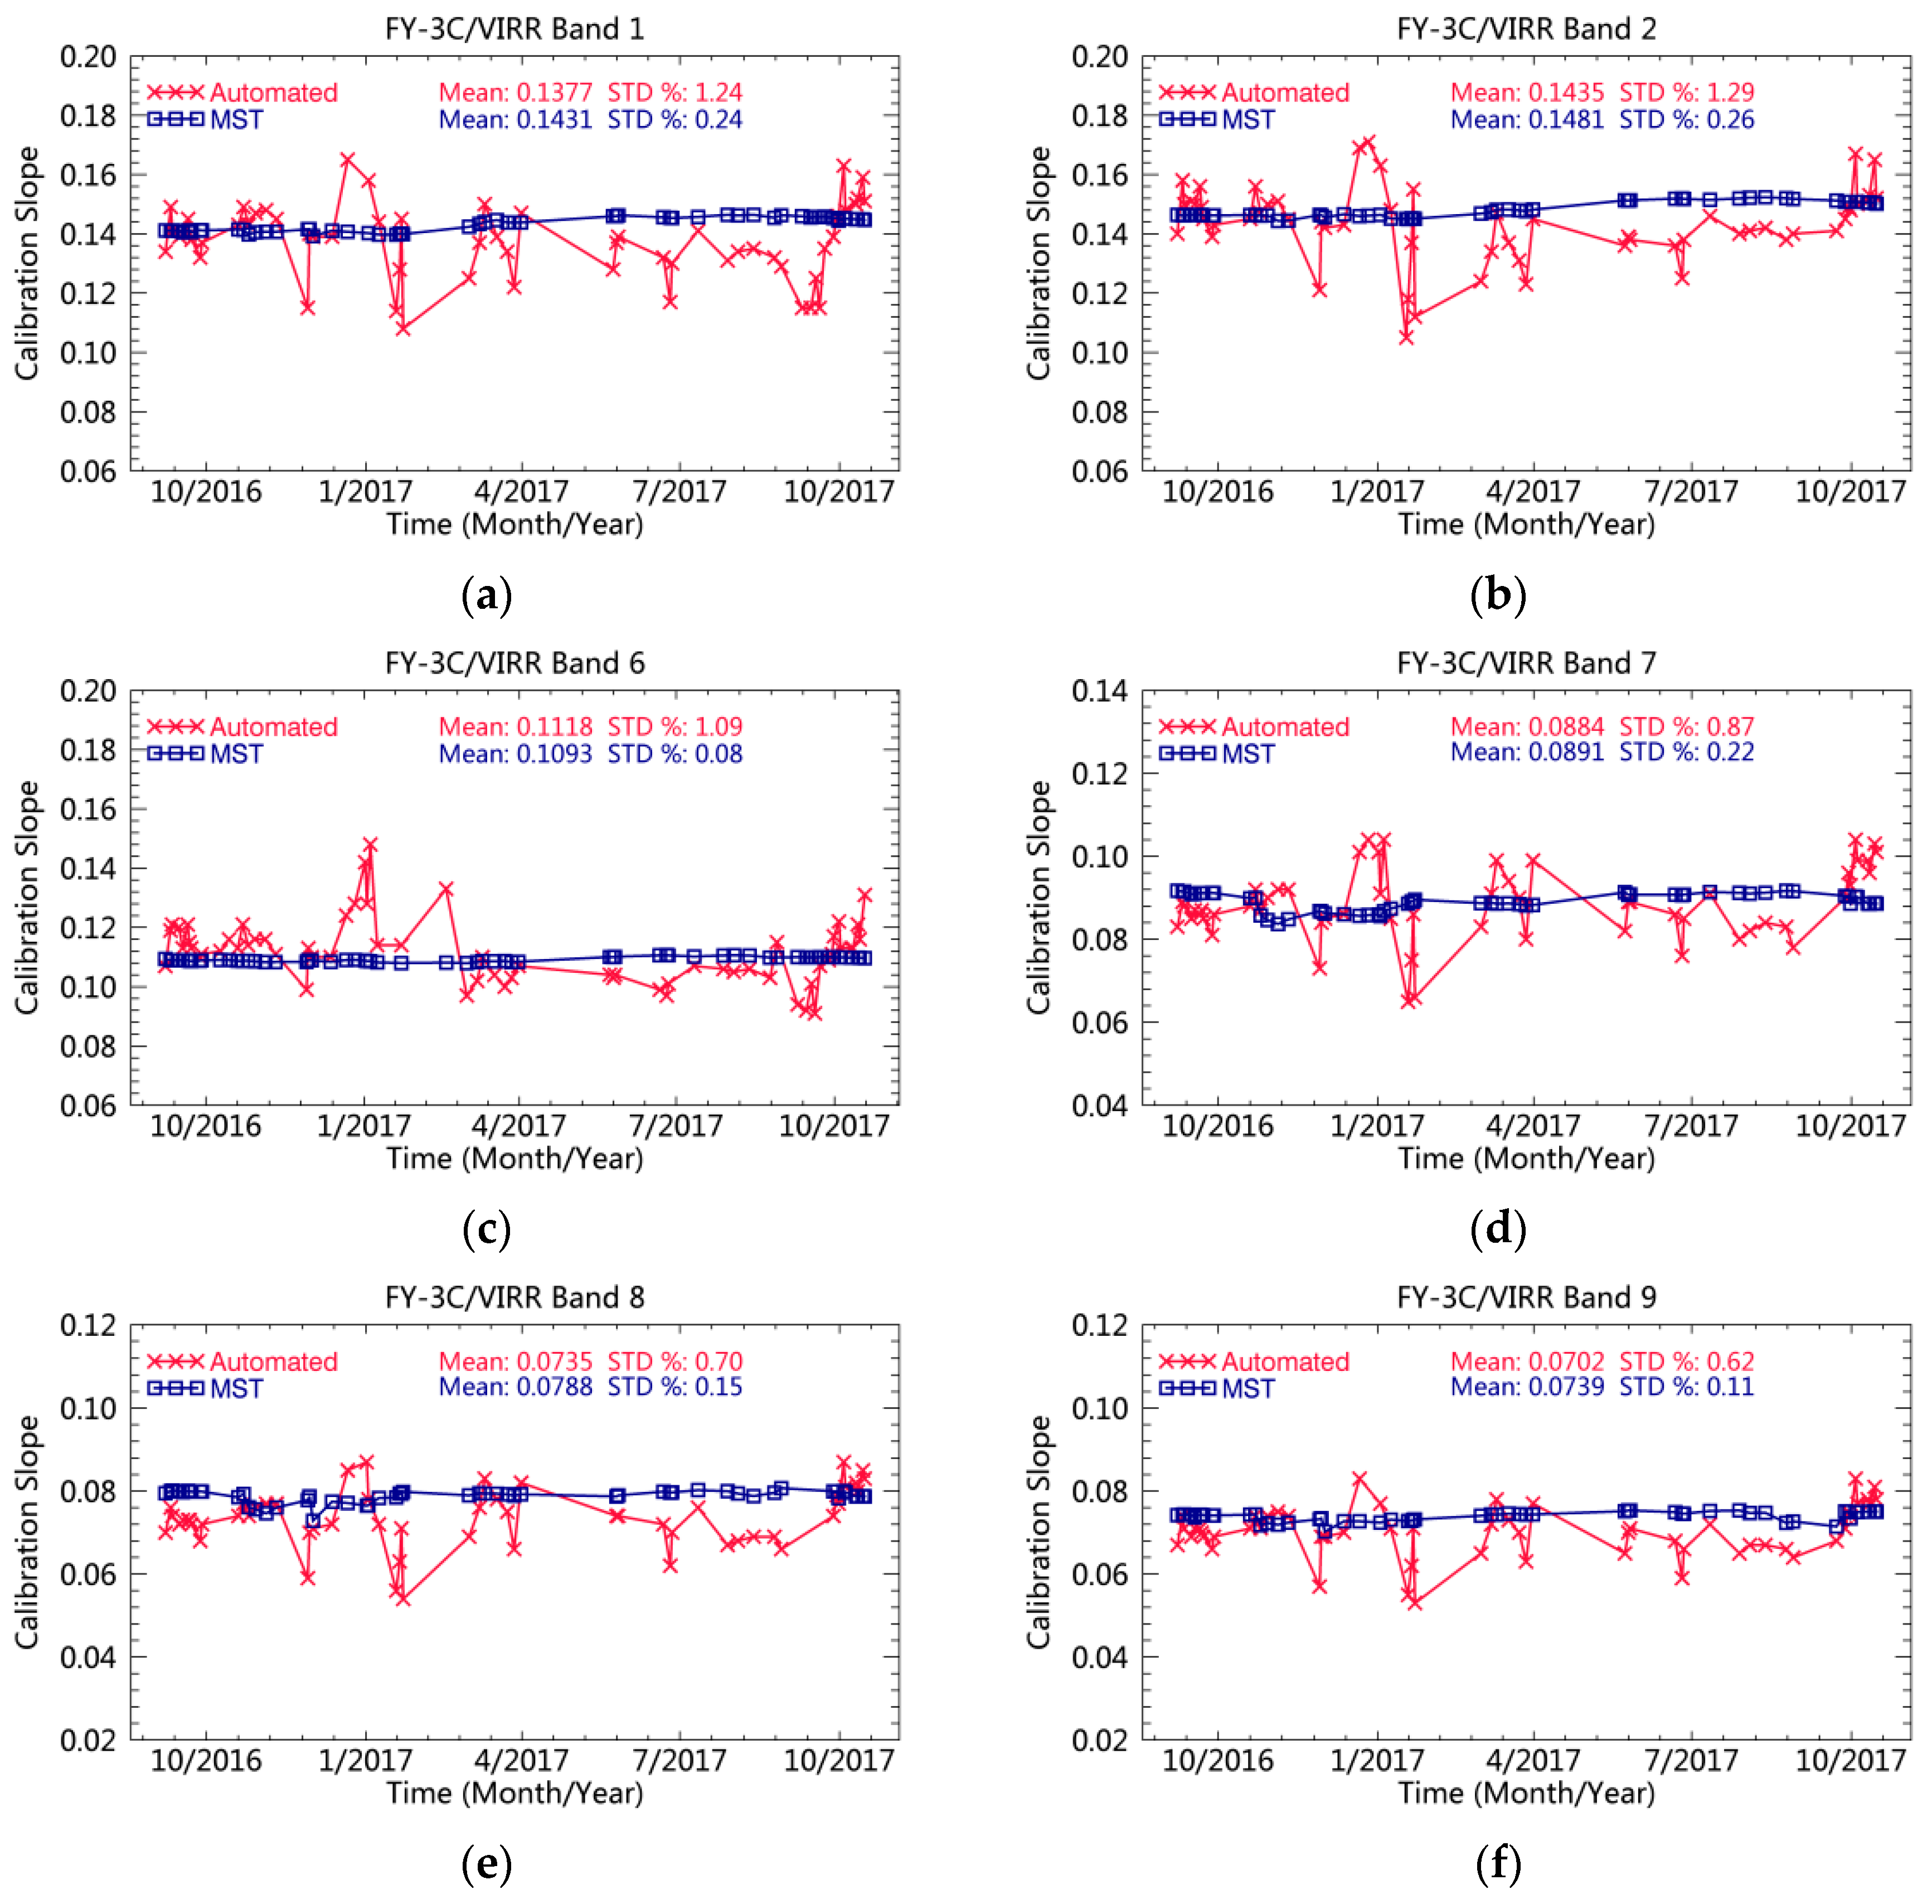
4.4. Comparison of the Calibration Slopes with the Automatic Calibration Results

Many automatic observation instruments designed and manufactured by the Anhui Institute of Optics and Fine Mechanics, Chinese Academy of Sciences, have been deployed at the CRCS site in Dunhuang to automatically gain accurate knowledge about atmospheric and surficial conditions. The major instrument for radiometric calibration is the automated test-site radiometer (ATR), which aims to obtain the surface reflectance of the Dunhuang Gobi automatically and continuously [29,30]. Once the surface reflectances were known, the calibration reference, i.e., the TOA reflectance over Dunhuang was also calculated using the 6SV code, and the atmospheric parameters were acquired from satellite products. The calibration reference uncertainty for this automatic calibration method was reported as the mean relative bias, within 5% and with a standard deviation of 2%, across the spectrum for visible to SWIR regions [30].
To further validate the calibration approach used in this study, the calibration slopes derived from the MST calibration method were compared with those from the automatic calibration approach.
Figure 11 shows the calibration slopes from September 2017 to October 2017 for the FY-3C VIRR derived using these two methods. The calibration samples of the MST calibration method comprised TOA reflectances from different sites with different reflectances within a period of 30 days, while there was only one TOA reflectance data point from the Dunhuang site that was taken on one particular day; hence, the MST calibration slopes were much smoother over time than the automatic calibration slopes, as shown in Figure 11. The standard deviations of the MST calibration slopes for all RSBs were within 0.3%, while the standard deviations of the automatic calibration slopes were ~5 times those of the MST calibration slopes and ranged from 0.62 to 1.29 (Table 3). The averaged calibration slopes for each FY-3C VIRR RSB during September 2016 to October 2017 derived from these two methods are listed in Table 3. Although large differences were obtained when comparing the daily calibration slopes from the two methods, the one-year averaged calibration slopes for each band agreed well with each method. The relative bias in the one-year averaged calibration slopes between the MST and automatic calibration methods were within ±5% for all the RSBs, except for band 8.

5. Conclusions

An absolute calibration method that uses multiple stable earth sites has been developed for the Visible Infrared Radiometer (VIRR) onboard the FengYun-3 (FY-3) satellite series; this method updates the calibration on a daily basis, thereby realizing better corrections of sensor drift and ensuring consistency in the calibration. The multisite (MST) calibration method was applied to recalibrate VIRR RSBs onboard FY-3A, FY-3B, and FY-3C; the results showed good accuracy and lower temporal oscillations compared with the results derived from the conventional automatic calibration method in operation at the Dunhuang site. Time series of new calibration coefficients since launch were obtained using the MST calibration approach for the VIRRs. The radiometric response changes of the VIRRs were analyzed by applying linear fits to the new calibration slope time series. Our results suggest the following conclusions:
Adding the White Sands and Uyuni Salt Flats sites to the calibration sites increased the dynamic range of the calibration reference (i.e., RTM-simulated TOA reflectance) at the short wavelength region (<600 nm), reaching ~0.5, about twice that of the original MST calibration method. This increase in the dynamic range of the calibration reference will be helpful by decreasing the calibration uncertainty and enabling better solutions to the nonlinear response problems.
The radiometric response changes of the VIRRs onboard FY-3A and FY-3B were wavelength dependent. Bands 7 and 8, with central wavelengths less than 600 nm, showed obvious degradation, particularly of band 7 (455 nm), with an annual degradation rate of approximately 7–8%; bands 1 and 2, with central wavelengths of 600–900 nm, showed a moderate response decrease, with an annual drift of approximately 2–3%; the longest short-wave infrared (SWIR) channel of band 6 was the most stable, with annual degradation rates within 1%. The radiometric response changes in all reflective solar bands (RSBs) of the FY-3C VIRR showed little differences and ranged from 1.8 to 4.1%.
The proposed calibration approach is able to correct for significant drift in the VIRR reflectances, and it provides consistent VIRR reflectances across different FY-3 satellite platforms. After applying the new calibration coefficients to the VIRR L1B DN (digital number) data, consistent calibration results were generated for VIRR RSBs onboard different FY-3 satellite platforms. The differences in the top-of-atmosphere (TOA) reflectance over Libya 4 across different VIRRs during the whole lifetime decreased from 5–10% to less than 3%.
The recalibrated FY-3C VIRR calibration slopes from the MST calibration method agree well with those from the conventional automatic calibration method. The relative difference in the one-year averaged calibration slopes between the MST and automatic calibration methods were less than ±5% for all the RSBs, except for band 8. The temporal oscillations in the MST calibration results were much smaller than those from the conventional automatic calibration method. The standard deviations in the MST calibration slopes for all RSBs were within 0.3%, while the standard deviations in the automatic calibration slopes were ~5 times those of the MST calibration slopes.

Author Contributions

Conceptualization, X.H.; Methodology, L.W. and X.H.; Formal Analysis, L.W.; Writing-Original Draft Preparation, L.W.; Writing-Review & Editing, X.H.; Validation, L.C. and L.H.; Funding Acquisition, X.H., L.W., and L.C.

Funding

This research was funded by the National Key R&D Program of China (Grant No. 2018YFB0504900, 2018YFB0504901), the National Natural Science Foundation of China (Grant No. 41401417, 41675036), and the Youth Talent Fund (Grant No. 201802QT006).

Acknowledgments

The authors thank the NASA Level-1 and Atmosphere Archive & Distribution System Distributed Active Archive Center (LAADS DAAC) for providing the MODIS data (https://ladsweb.modaps.eosdis.nasa.gov/), and National Oceanic and Atmospheric Administration, Earth System Research Laboratory, Physical Sciences Division (NOAA/ESRL PSD) for providing NCEPDOE AMIP Reanalysis-2 data (http://www.cdc.noaa.gov/). We are grateful to the anonymous reviewers for their insightful comments.

Conflicts of Interest

The authors declare no conflict of interest.

References

  1. Xu, N.; Chen, L.; Hu, X.; Zhang, L.; Zhang, P. Assessment and correction of on-orbit radiometric calibration for FY-3 VIRR thermal infrared channels. Remote Sens. 2014, 6, 2884–2897. [Google Scholar] [CrossRef]
  2. Li, Y.; Rong, Z.; Zheng, Z.; Liu, J.; Zhang, L.; Zhang, L.; Hu, X.; Zhang, Y.; Sun, L. Post launch site calibration of visible and near-infrared channels of FY-3A visible and infrared radiometers. Opt. Precis. Eng. 2009, 17, 2966–2973. [Google Scholar]
  3. Hu, X.; Liu, J.; Sun, L.; Rong, Z.; Li, Y.; Zhang, Y.; Zheng, Z.; Wu, R.; Zhang, L.; Gu, X. Characterization of CRCS Dunhuag test site and vicarious calibration utilization for Fengyun (FY) series sensors. Can. J. Remote Sens. 2010, 36, 566–582. [Google Scholar] [CrossRef]
  4. Sun, L.; Guo, M.; Xu, N.; Zhang, L.; Liu, J.; Hu, X. On-orbit response variation analysis of FY-3 MERSI reflective solar bands based on Dunhuang site calibration. Spectrosc. Spectr. Anal. 2012, 32, 1869–1877. [Google Scholar]
  5. Mishra, N.; Helder, D.; Angal, A.; Choi, J.; Xiong, X. Absolute calibration of optical satellite sensors using Libya 4 pseudo invariant calibration site. Remote Sens. 2014, 6, 1327–1346. [Google Scholar] [CrossRef]
  6. Wu, A.; Xiong, X.; Cao, C.; Angal, A. Monitoring MODIS Calibration Stability of Visible and Near-IR Bands from Observed Top-of-Atmosphere BRDF-Normalized Reflectances over Libyan Desert and Antarctic Surfaces. Available online: https://doi.org/10.1117/12.795296 (accessed on 19 August 2018).
  7. Bhatt, R.; Doelling, D.; Wu, A.; Xiong, X.; Scarino, B.; Haney, C.; Gopalan, A. Initial stability assessment of S-NPP VIIRS reflective solar band calibration using invariant desert and deep convective cloud targets. Remote Sens. 2014, 6, 2809–2826. [Google Scholar] [CrossRef]
  8. Heidinger, A.K.; Sullivan, J.T.; Rao, C.R. Calibration of visible and near-infrared channels of the NOAA-12 AVHRR using time series of observations over deserts. Int. J. Remote Sens. 2003, 24, 3635–3649. [Google Scholar] [CrossRef]
  9. Heidinger, A.K.; Straka, W.C.; Molling, C.C.; Sullivan, J.T.; Wu, X. Deriving an inter-sensor consistent calibration for the AVHRR solar reflectance data record. Int. J. Remote Sens. 2010, 31, 6493–6517. [Google Scholar] [CrossRef]
  10. Wu, A.; Xiong, X.; Angal, A. Derive a MODIS-Based Calibration for the AVHRR Reflective Solar Channels of the NOAA KLM Operational Satellites. IEEE Trans. Geosci. Remote Sens. 2013, 51, 1405–1413. [Google Scholar] [CrossRef]
  11. Chen, L.; Hu, X.; Xu, N.; Zhang, P. The application of deep convective clouds in the calibration and response monitoring of the reflective solar bands of FY-3A/MERSI (Medium Resolution Spectral Imager). Remote Sens. 2013, 5, 6958–6975. [Google Scholar] [CrossRef]
  12. Wu, R.; Yang, J.; Yang, Z.; Liu, J. Impacts of spectral response differences on SNO calibration-study examples of FY-3A/MERSI and EOS/MODIS. Remote Sens. Inf. 2011, 2, 51–57. [Google Scholar]
  13. Xu, N.; Chen, L.; Wu, R.; Hu, X.; Sun, L.; Zhang, P. In-Flight Intercalibration of FY-3C Visible Channels with AQUA MODIS. In Proceedings of the SPIE, Earth Observing Missions and Sensors: Development, Implementation, and Characterization III, Beijing, China, 26 November 2014. [Google Scholar]
  14. Hu, X.; Xu, N.; Wu, R.; Chen, L.; Min, M.; Wang, L.; Xu, H.; Sun, L.; Yang, Z.; Zhang, P. Performance Assessment of FY-3C/MERSI on Early Orbit. In Proceedings of the SPIE, Earth Observing Missions and Sensors: Development, Implementation, and Characterization III, Beijing, China, 26 November 2014. [Google Scholar]
  15. Sun, L.; Hu, X.; Guo, M.; Xu, N. Multisite calibration tracking for FY-3A MERSI solar bands. IEEE Trans. Geosci. Remote Sens. 2012, 50, 4929–4942. [Google Scholar] [CrossRef]
  16. Chander, G.; Christopherson, J.B.; Stensaas, G.L.; Teillet, P.M. Online Catalogue of World-Wide Test Sites for the Post-Launch Characterization and Calibration of Optical Sensors. In Proceedings of the International Astronautical Federation—58th International Astronautical Congress, Hyderabad, India, 24–28 September 2007. [Google Scholar]
  17. Teillet, P.M.; Barsi, J.A.; Chander, G.; Thome, K.J. Prime candidate Earth targets for the post-launch radiometric calibration of space-based optical imaging instruments. In Proceedings of the SPIE, Earth Observing Systems XII, San Diego, CA, USA, 5 October 2007. [Google Scholar]
  18. Smith, D.L.; Mutlow, C.T.; Nagaraja Rao, C.R. Calibration monitoring of the visible and near-infrared channels of the Along-Track Scanning Radiometer-2 by use of stable terrestrial sites. Appl. Opt. 2002, 41, 515–523. [Google Scholar] [CrossRef] [PubMed]
  19. Chander, G.; Xiong, X.; Choi, T.; Angal, A. Monitoring on-orbit calibration stability of the Terra MODIS and Landsat 7 ETM+ sensors using pseudo-invariant test sites. Remote Sens. Environ. 2010, 114, 925–939. [Google Scholar] [CrossRef]
  20. Helder, D.; Thome, K.J.; Mishra, N.; Chander, G.; Xiong, X.; Angal, A.; Choi, T. Absolute radiometric calibration of Landsat using a pseudo invariant calibration site. IEEE Trans. Geosci. Remote Sens. 2013, 51, 1360–1369. [Google Scholar] [CrossRef]
  21. Ross, J.K. The Radiation Regime and Architecture of Plant Stands; Springer Science & Business Media: Norwell, MA, USA, 1981; p. 392. [Google Scholar]
  22. Li, X.; Strahler, A.H. Geometric-optical bidirectional reflectance modeling of the discrete crown vegetation canopy: effect of crown shape and mutual shadowing. IEEE Trans. Geosci. Remote Sens. 1992, 30, 276–2922. [Google Scholar] [CrossRef]
  23. Gao, F.; Schaaf, C.; Strahler, A.; Roesch, A.; Lucht, W.; Dickinson, R. The MODIS BRDF/Albedo Climate Modeling Grid Products and the Variability of Albedo for Major Global Vegetation Types. J. Geophys. Res. 2005, 110. [Google Scholar] [CrossRef]
  24. Kim, W.; Cao, C.Y.; Liang, S.L. Assessment of Radiometric Degradation of FY-3A MERSI Reflective Solar Bands using TOA Reflectance of Pseudo-Invariant Calibration Sites. IEEE Geosci. Remote Sens. Lett. 2013, 11, 793–797. [Google Scholar]
  25. Kalnay, E.; Kanamitsu, M.; Kistler, R.; Collins, W.; Deaven, D.; Gandin, L.; Iredell, M.; Saha, S.; White, G.; Woollen, J.; et al. The NCEP/NCAR 40-year reanalysis project. Bull. Am. Meteorol. Soc. 1996, 77, 437–472. [Google Scholar] [CrossRef]
  26. Kotchenova, S.Y.; Vermote, E.F.; Matarrese, R.; Klemm, F.J. Validation of a vector version of the 6S radiative transfer code for atmospheric correction of satellite data. Part I: Path radiance. Appl. Opt. 2006, 45, 6762–6774. [Google Scholar] [CrossRef] [PubMed]
  27. Hubanks, P.A.; King, M.D.; Platnick, S.T.; Pincus, R.O. MODIS Atmosphere L3 Gridded Product Algorithm Theoretical Basis Document. Available online: https://eospso.nasa.gov/sites/default/files/atbd/atbd_mod30.pdf (accessed on 19 August 2018).
  28. Hsu, N.C.; Jeong, M.J.; Bettenhausen, C.; Sayer, A.M.; Hansell, R.; Seftor, C.S.; Huang, J.; Tsay, S.C. Enhanced Deep Blue aerosol retrieval algorithm: The second generation. J. Geophys. Res. Atmos. 2013, 118, 9296–9315. [Google Scholar] [CrossRef] [Green Version]
  29. Zhang, Y.; Li, X.; Rong, Z.; Zhang, L.; Hu, X.; Ba, X. China radiometric calibration sites ground-based automatic observing systems for CAL/VAL. In Proceedings of the SPIE, Sensors, Systems, and Next-Generation Satellites XIX, Toulouse, France, 12 October 2015. [Google Scholar]
  30. Lv, J.; He, M.; Chen, L.; Hu, X.; Li, X. Automated radiation calibration method based on Dunhuang radiometric calibration site. Acta Opt. Sin. 2017, 37, 1–8. [Google Scholar]
Figure 1. Time series of the nadir (viewing angle within 10°) (a) band 2 and (b) band 7 reflectance over Libya 4 from January 2009 to December 2017.
Remotesensing 10 01336 g001
Figure 2. SRFs of FY-3A MERSI RSBs. The gray line represents the water vapor absorption transmittance simulated by using MODTRAN.
Remotesensing 10 01336 g002
Figure 3. (a) Averaged spectral reflectance curves of the stable sites acquired from MODIS BRDF products in the year of 2010 and (b) TOA reflectance calculated from 6SV by using the averaged spectral reflectance curves under the following viewing geometries: sensor zenith angle (senz) of 18°, solar zenith angle (solz) of 60°, relative azimuth angle (raa) of 159°, and atmospheric condition aerosol optical depth (AOD) of 0.1.
Remotesensing 10 01336 g003
Figure 4. Locations of the calibration sites used in this study.
Remotesensing 10 01336 g004
Figure 5. Examples of scatter plots of simulated TOA reflectance data versus FY-3B VIRR-measured digital number data for band 8 (505 nm) on 1 May 2014. (a) All 16 stable sites were used; (b) White Sands and Uyuni Salt Flats data were excluded.
Remotesensing 10 01336 g005
Figure 6. Time series of the calibration slopes for the VIRR onboard (a,b) FY-3A, (c,d) FY-3B, and (e,f) FY-3C.
Remotesensing 10 01336 g006
Figure 7. Trends in the VIRR normalized calibration slopes for (a) FY-3A, (b) FY-3B, and (c) FY-3C.
Remotesensing 10 01336 g007
Figure 8. Annual change in the calibration slope derived by using the multisite (MST) calibration method for the FY-3A, FY-3B, and FY-3C VIRR.
Remotesensing 10 01336 g008
Figure 9. Time series of the nadir (viewing angle within 10°) reflectance data in RSBs over Libya 4 from January 2009 to December 2017. (a,b) Operational calibration results; (c,d) recalibrated results using the MST calibration method.
Remotesensing 10 01336 g009
Figure 10. (a) Coefficients of variation and (b) averaged value in the TOA reflectance among the three VIRR sensors onboard FY-3A, FY-3B, and FY-3C from January 2009 to December 2017 before and after consistent calibration.
Remotesensing 10 01336 g010
Figure 11. Time series of calibration slopes for the FY-3C VIRR from September 2016 to October 2017 derived from the MST and automatic calibration methods. (a,b) bands 1–2; (c,d) bands 6–7; (e,f) bands 8–9.
Remotesensing 10 01336 g011
Table 1. FY-3 (A, B, C)/VIRR spectral band specifications.
BandWavelength Range (μm)Spectral Bandwidth (μm)Spatial Resolution (m)Noise (Δ ρ or ΔK @300 K)Dynamic ( ρ or K)
10.58–0.680.1011000.1%0–100%
20.84–0.890.0511000.1%0–100%
33.55–3.930.3811000.3 K180–350 K
410.3–11.31.0011000.2 K180–330 K
511.5–12.51.0011000.2 K180–330 K
61.55–1.640.0911000.15%0–90%
70.43–0.480.0511000.05%0–50%
80.48–0.530.0511000.05%0–50%
90.53–0.580.0511000.05%0–50%
101.325–1.3950.0711000.19%0–90%
Table 2. Linear fit parameters for the normalized calibration coefficients of the FY-3A, FY-3B, and FY-3C VIRR.
BandSlopeAnnual Drift (%)InterceptRStd (cali)RMSEVar
FY-3A
17.685 × 10⁻⁵ 2.7081.0360.9760.0500.0110.012
24.929 × 10−51.7301.0380.8730.0360.0170.017
62.390 × 10−50.8511.0250.9200.0170.0060.007
72.077 × 10−47.1861.0550.9720.1360.0320.025
81.687 × 10−46.1551.0000.9870.1090.0170.018
91.302 × 10−44.7161.0070.9920.0840.0100.012
FY-3B
19.444 × 10−53.2401.0640.9720.0740.0170.020
26.469 × 10−52.2951.0290.9470.0520.0160.017
62.156 × 10−50.7940.9910.9540.0170.0050.006
72.355 × 10−48.2131.0470.9740.1820.0410.038
81.601 × 10−45.8281.0020.9860.1220.0200.023
91.269 × 10−44.4101.0500.9850.0970.0170.017
FY-3C
11.146 × 10−44.0481.0330.9660.0510.0130.015
21.075 × 10−43.8531.0180.9690.0470.0120.012
64.866 × 10−51.7641.0070.9440.0220.0070.008
71.190 × 10−44.0681.0680.8380.0610.0330.031
86.967 × 10−52.4531.0360.8260.0360.0200.023
98.750 × 10−53.0561.0450.8880.0420.0190.021
Table 3. Statistical summary of the calibration slope comparisons between the MST and automatic calibration methods.
Averaged Calibration SlopeSTD of Calibration SlopesRelative Difference in Calibration Slopes (%)
BandMSTAutoMSTAutominmaxstdmean
10.14310.13770.241.24−22.7817.299.03−3.74
20.14810.14350.261.29−27.6017.048.92−3.10
60.10930.11180.081.09−17.2236.2610.212.36
70.08910.08840.220.87−26.6121.1810.79−0.67
80.07880.07350.150.70−32.3513.799.42−6.73
90.07390.07020.110.62−27.5514.158.31−4.97

