Abstract
As the largest among terrestrial ecosystems, forests are vital to maintaining ecosystem services and regulating regional climate. The area and spatial distribution of trees in densely forested areas have been focused on in the past few decades, while sparse forests in agricultural zones, so-called agroforests or trees outside forests (TOF), have usually been ignored or missed in existing forest mapping efforts, despite their important role in regulating agricultural ecosystems. We combined Landsat and PALSAR data to map forests in a typical agricultural zone in the North China Plain. The resultant map, based on PALSAR and Landsat (PL) data, was also compared with five existing medium resolution (30–100 m) forest maps from PALSAR (JAXA forest map) and Landsat: NLCD-China, GlobeLand30, ChinaCover, and FROM-GLC. The results show that the PL-based forest map has the highest accuracy (overall accuracy of 95 ± 1% with a 95% confidence interval, and Kappa coefficient of 0.86) compared to those forest maps based on single Landsat or PALSAR data in the North China Plain (overall accuracy ranging from 85 ± 2% to 92 ± 1%). All forest maps revealed higher accuracy in densely forested mountainous areas, while the PL-based and JAXA forest maps showed higher accuracy in the plain, as the higher omission errors existed in only the Landsat-based forest maps. Moreover, we found that the PL-based forest map can capture more patched forest information in low forest density areas. This means that the radar data have advantages in capturing forests in the typical agricultural zones, which tend to be missing in published Landsat-based only forest maps. Given the significance of agroforests in regulating ecosystem services of the agricultural ecosystem and improving carbon stock estimation, this study implies that the integration of PALSAR and Landsat data can provide promising agroforest estimates in future forest inventory efforts, targeting a comprehensive understanding of ecosystem services of agroforests and a more accurate carbon budget inventory.
1. Introduction
Forests play an important role in maintaining ecosystem services [1], global climate change [2], and water conservation [3]. While the forest areas in densely forested regions have attracted much attention in the published research, sparse forests, particularly in drylands [4] and agricultural zones, have been addressed less. Forests in human-dominated agricultural zones, so-called agroforests [5], play a significant role in maintaining ecosystem services, such as carbon sequestration, biodiversity, and soil conservation [6,7,8]. In particular, agroforests can provide the functions of ecological corridors and buffer zones [9,10], as well as habitats for some wild species [11]. A recent study showed that 43% of the global agricultural land had at least 10% tree cover and that this increased by 2% from 2000 to 2010, which contributed more than 75% of carbon storage in the agricultural land regions [12]. Therefore, accurate agroforest information (e.g., spatial distribution) is important for the assessment of structural and functional attributes and management planning [12,13].
Published works have shown that the different maps have varying uncertainties, depending on the area of interest, cover types and available spatial predictors [14,15]. For example, in traditional agricultural areas, the spatial distribution of agroforests was substantially underestimated [15]. The missing agroforest spatial information and uncertainty in agricultural zones has impacted the assessment of agricultural ecosystem services [16]. Therefore, the spatial distribution and area information of agroforests are necessary for both understanding their role in regulating agricultural ecosystem and serving forest management.
Remote sensing-based forest mapping efforts have been shifting from coarse to medium resolution imagery [17]. While the coarse resolution datasets can reveal the general patterns of forest distribution and forest dynamics, these datasets miss details in small forest patches. With the developing technology and increasing data availability, especially, free Landsat data at 30-m spatial resolution, medium resolution forest maps of several forest attributes over large spatial extents have been possible [18]. Fine resolution products are expected to capture more information in sparsely forested areas such as typical agricultural zones. These optical remote sensing data, as the major data source for forest mapping, can promote forest mapping efforts with high temporal and spatial resolutions. However, Landsat data are more sensitive to the canopy level characteristics, and estimates of structural attributes can have a considerable commission error such as in high biomass crops or shrubs with high greenness and similar spectral signatures [15]. As the polarized signals of synthetic aperture radar (SAR) data can be transmitted and received in the horizontal or vertical dimensions by the L-band, the SAR data can provide more structural information and improve the accuracy of forest mapping by utilizing the higher penetration capacity of L-band [19,20,21]. In addition, due to the clouds and cloud shadows, many regions, especially tropical regions, cannot be accurately observed by Landsat, while SAR data can eliminate these negative effects [2,22,23]. Given these complementary advantages between optical and SAR remote sensing data, the integration of optical and SAR remote sensing data can benefit future forest mapping efforts [24].
While many studies have focused on the application of Landsat data and some studies have applied advanced land observation satellite (ALOS) phased array type L-band synthetic aperture radar (PALSAR) images or the combination of SAR and optical data, very limited efforts have been made to integrate both data types to enhance small-area forest inventory in typical agricultural regions where croplands are dominant, and most of the trees are planted along the highways, croplands or surrounding villages [24]. In general, there are two distinct approaches to integrate Landsat and PALSAR data. The first approach is to fuse Landsat and PALSAR data into a single dataset at the data level and then classify the fused image. Although some previous studies have focused on fusing Landsat and PALSAR data at the data level to obtain more spatial information [25,26,27], this approach can be problematic as the PALSAR data in this study is mosaicked and not obtained from a specific date and mismatched to the Landsat images. The second approach is to integrate Landsat and PALSAR data at the decision level [27]. Our previous studies have provided justification statements for combining spectral information from Landsat and structural information from PALSAR [28,29]. Previous efforts also indicated that a combination of different remote sensing techniques that assess both the horizontal and vertical structures of tree resources would be promising for agroforestry monitoring [14]. However, a systematic comparison between the integrated efforts and the maps from single optical/SAR data in typical agricultural zones in which the cropland areas account for the majority has not been conducted yet.
According to the Food and Agriculture Organization (FAO), forest definition is an area that has tree cover over 10%, tree height over 5-m and a minimum mapping unit of more than 0.5 ha. For agroforest with a smaller area, the forest definition in this paper did not consider the limitation of the minimum mapping unit. The objective of this study is to improve the accuracy of agroforest mapping by integrating Landsat and PALSAR data. Specifically, two questions regarding mapping agroforest will be answered: (1) Is the approach integrating Landsat and PALSAR data for mapping agroforests effective and robust in a typical agricultural zone, the North China Plain in China? (2) Can the approach combining Landsat and PALSAR data improve the delineation of agroforest compared to the existing five forest products based on the single data of Landsat or PALSAR? To achieve this objective, first, we produce a new forest map by integrating 25-m PALSAR and 30-m Landsat data in a typical agricultural zone, the North China Plain in China. Second, we compare our results with the single Landsat or PALSAR-based forest maps as well as the PALSAR/Landsat fusion approach. Third, we examine the uncertainty for the existing forest maps and provide implications for future forest mapping efforts. This study expects to provide effective information for future forest management and ecosystem service assessment in agricultural zones.
2. Data and Methods
2.1. Study Area
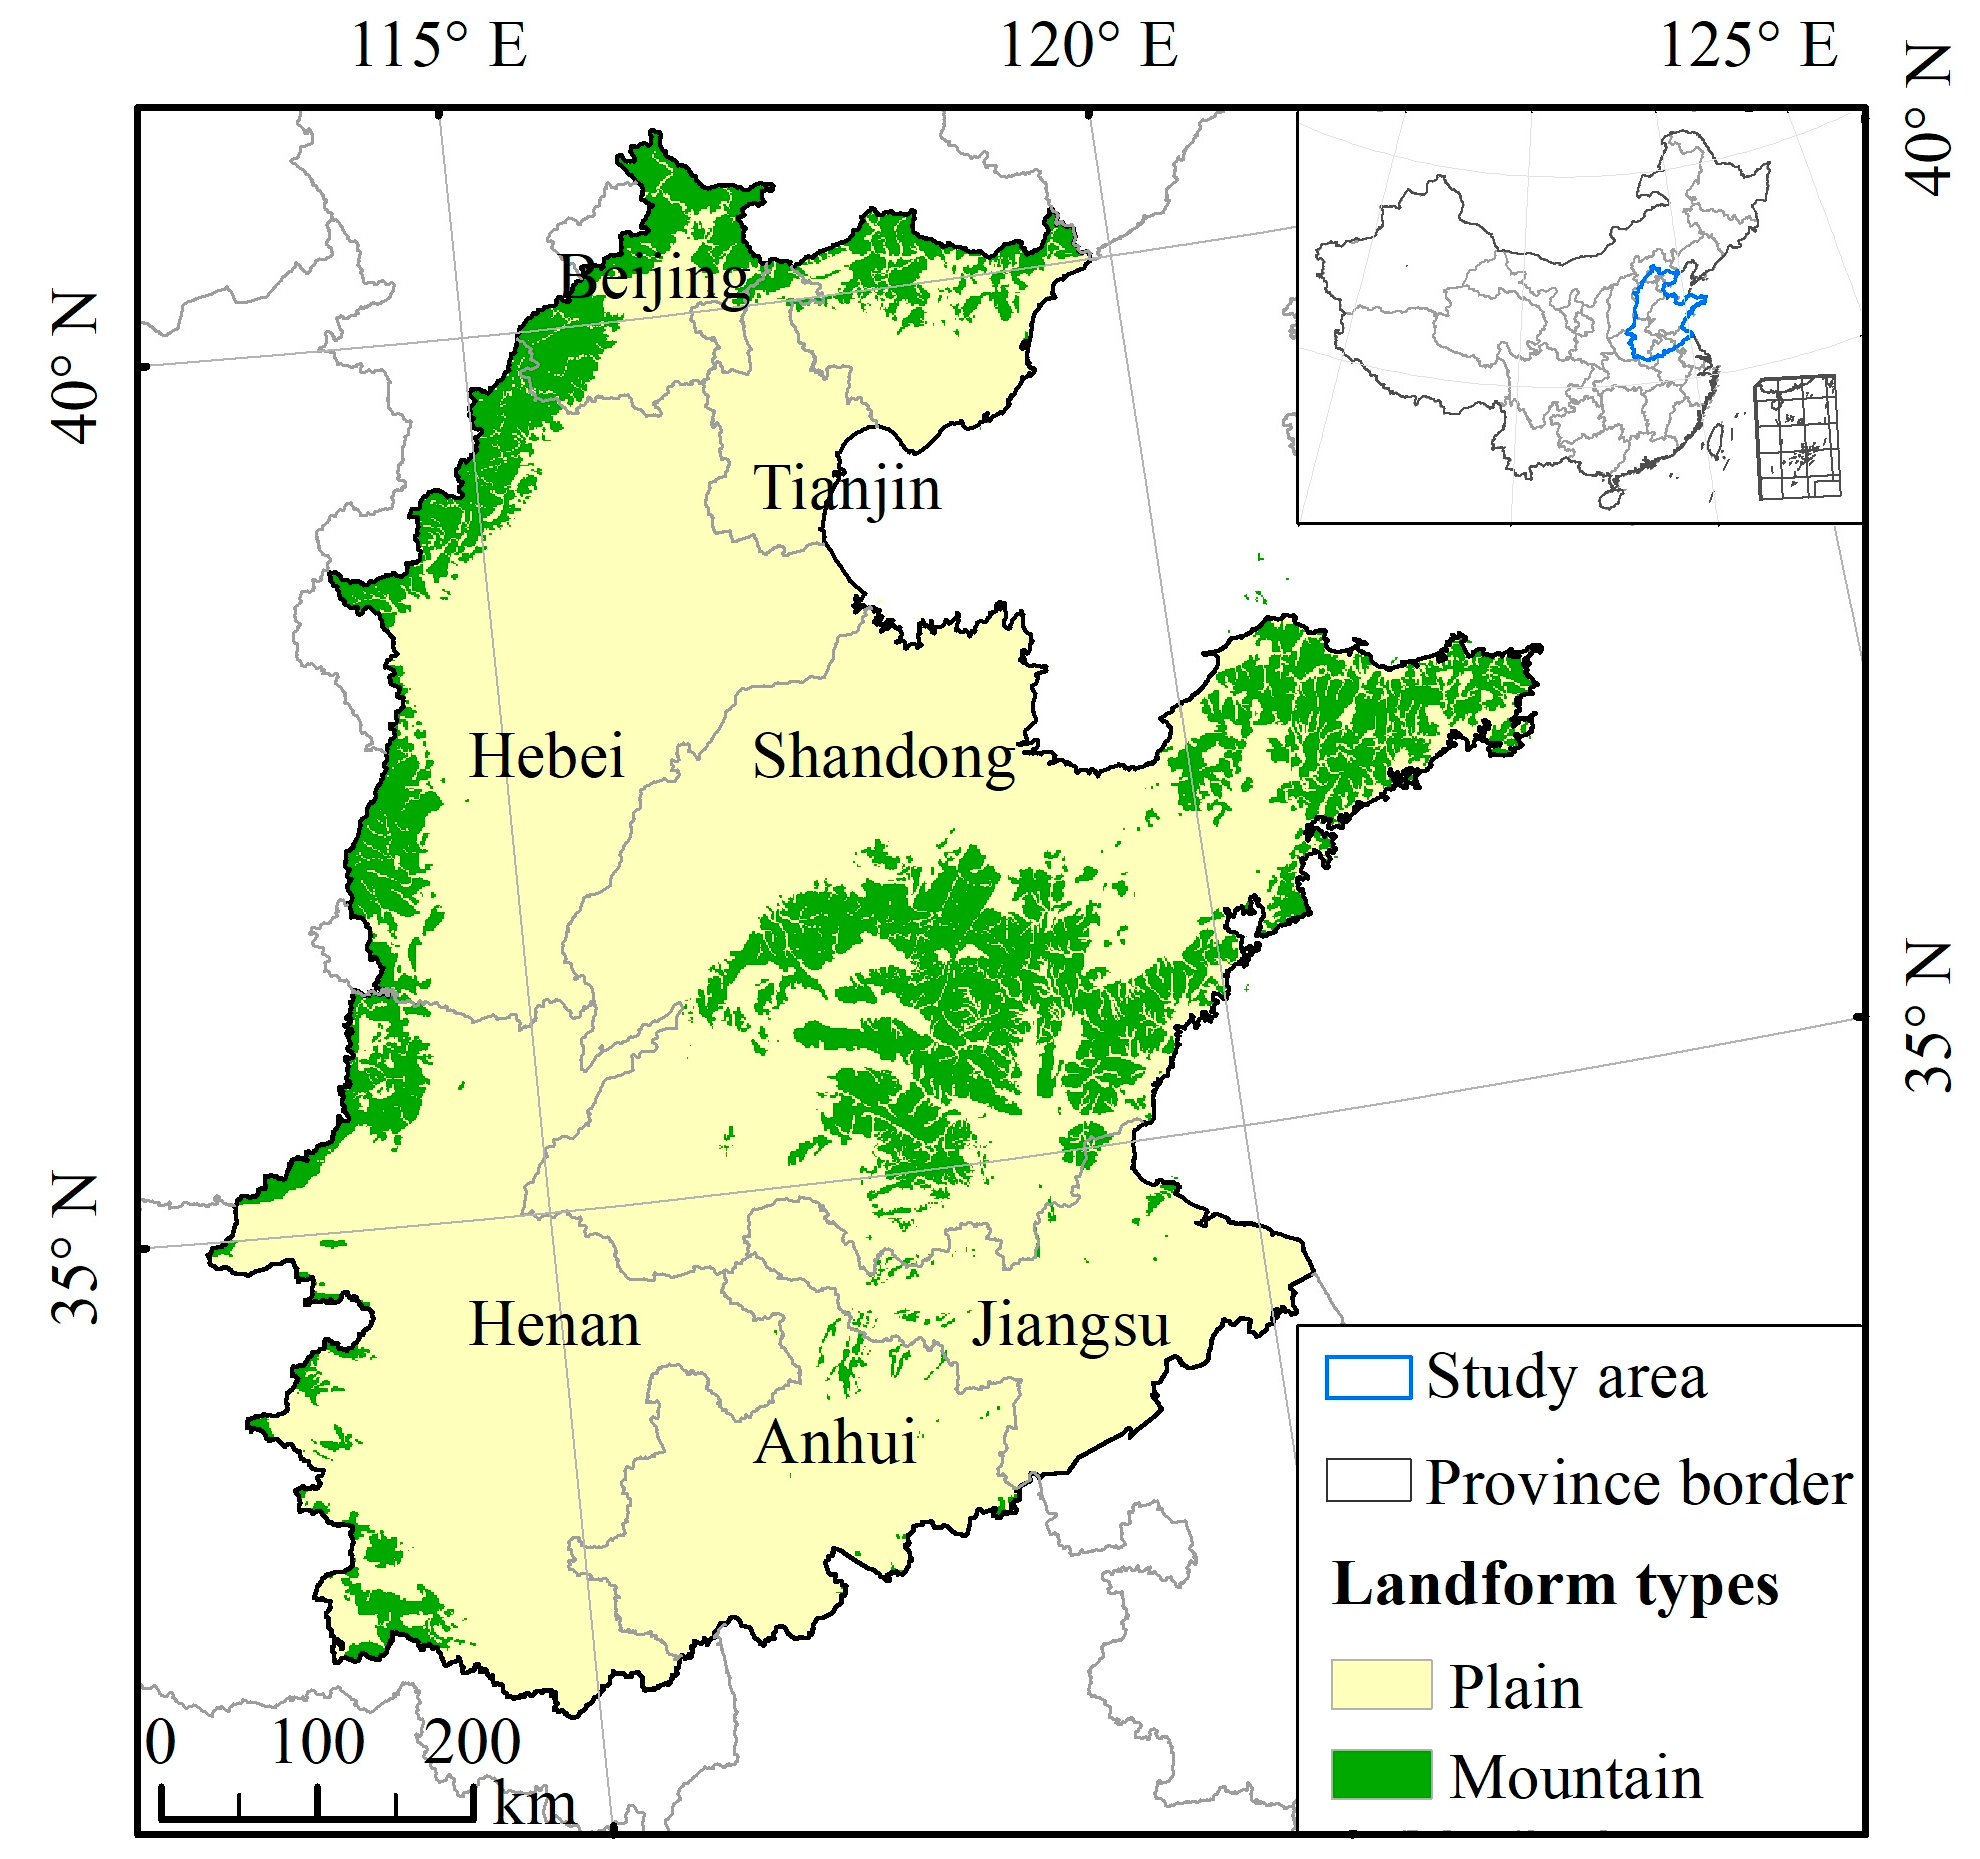
The North China Plain (NCP), also known as the Huang-Huai-Hai Plain, is located in northern China (Figure 1); it is a vital agricultural zone, as this region can provide 1/5 of the cultivated area for food in China [30]. The NCP (32°–42°24′N, 112°48′–122°45′E) covers an area of 44.17 million (m) ha and includes parts of 7 provinces/municipalities (Hebei, Henan, Shandong, Anhui, Jiangsu, Beijing, and Tianjin) [31,32]. It is warm-temperate and has a typical continental monsoon climate with annual precipitation ranging from 550 to 650 mm mostly in July to September accounting for 50–70% of the annual total precipitation [33].
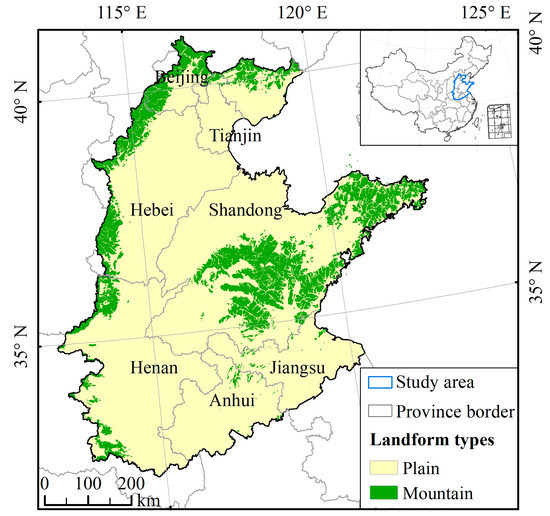
Figure 1.
The location and main landform types of the North China Plain (NCP) in China.
2.2. Data Preprocessing
2.2.1. PALSAR Dataset and Preprocessing
The 25-m ALOS PALSAR fine beam dual-polarization (FBD) products, generated from the data collected during June to October of 2010, were obtained from the Earth Observation Research Center, Japan Aerospace Exploration Agency (JAXA) (http://www.eorc.jaxa.jp/ALOS/en/palsarfnf/data/). Polarized signals can be transmitted and received in the horizontal or vertical dimensions by the L-band PALSAR, including horizontal transmission and reception (HH) and horizontal transmission and vertical reception (HV). The 2010 data was used in this study. However, one strip of data was replaced by the 2009 data due to a data quality issue. Not only the mosaic of HH and HV polarization data and local incidence angle but also the mask information (effective area, ocean flag, void area, layover and shadowing) were included in the dataset since the ALOS launched. All data were slope corrected and ortho-rectified using the 90-m Shuttle Radar Topography Mission (SRTM) digital elevation model (DEM) [34]. The geometric accuracy of the ortho-product was estimated at 12-m. The digital number (DN) values (amplitude values) were converted into a radar cross section in decibel (dB) using a calibration coefficient from JAXA [35,36].
where is the backscattering coefficient, DN is the digital number value in HH or HV, and CF is the absolute calibration factor of −83.
Further, the Ratio and Difference values were calculated using the resultant HH and HV backscattering coefficient in decibel. In which, HH and HV are raster data with 25-m resolution, as they produced effective land cover classification [26,37,38].
2.2.2. Landsat Images and Preprocessing
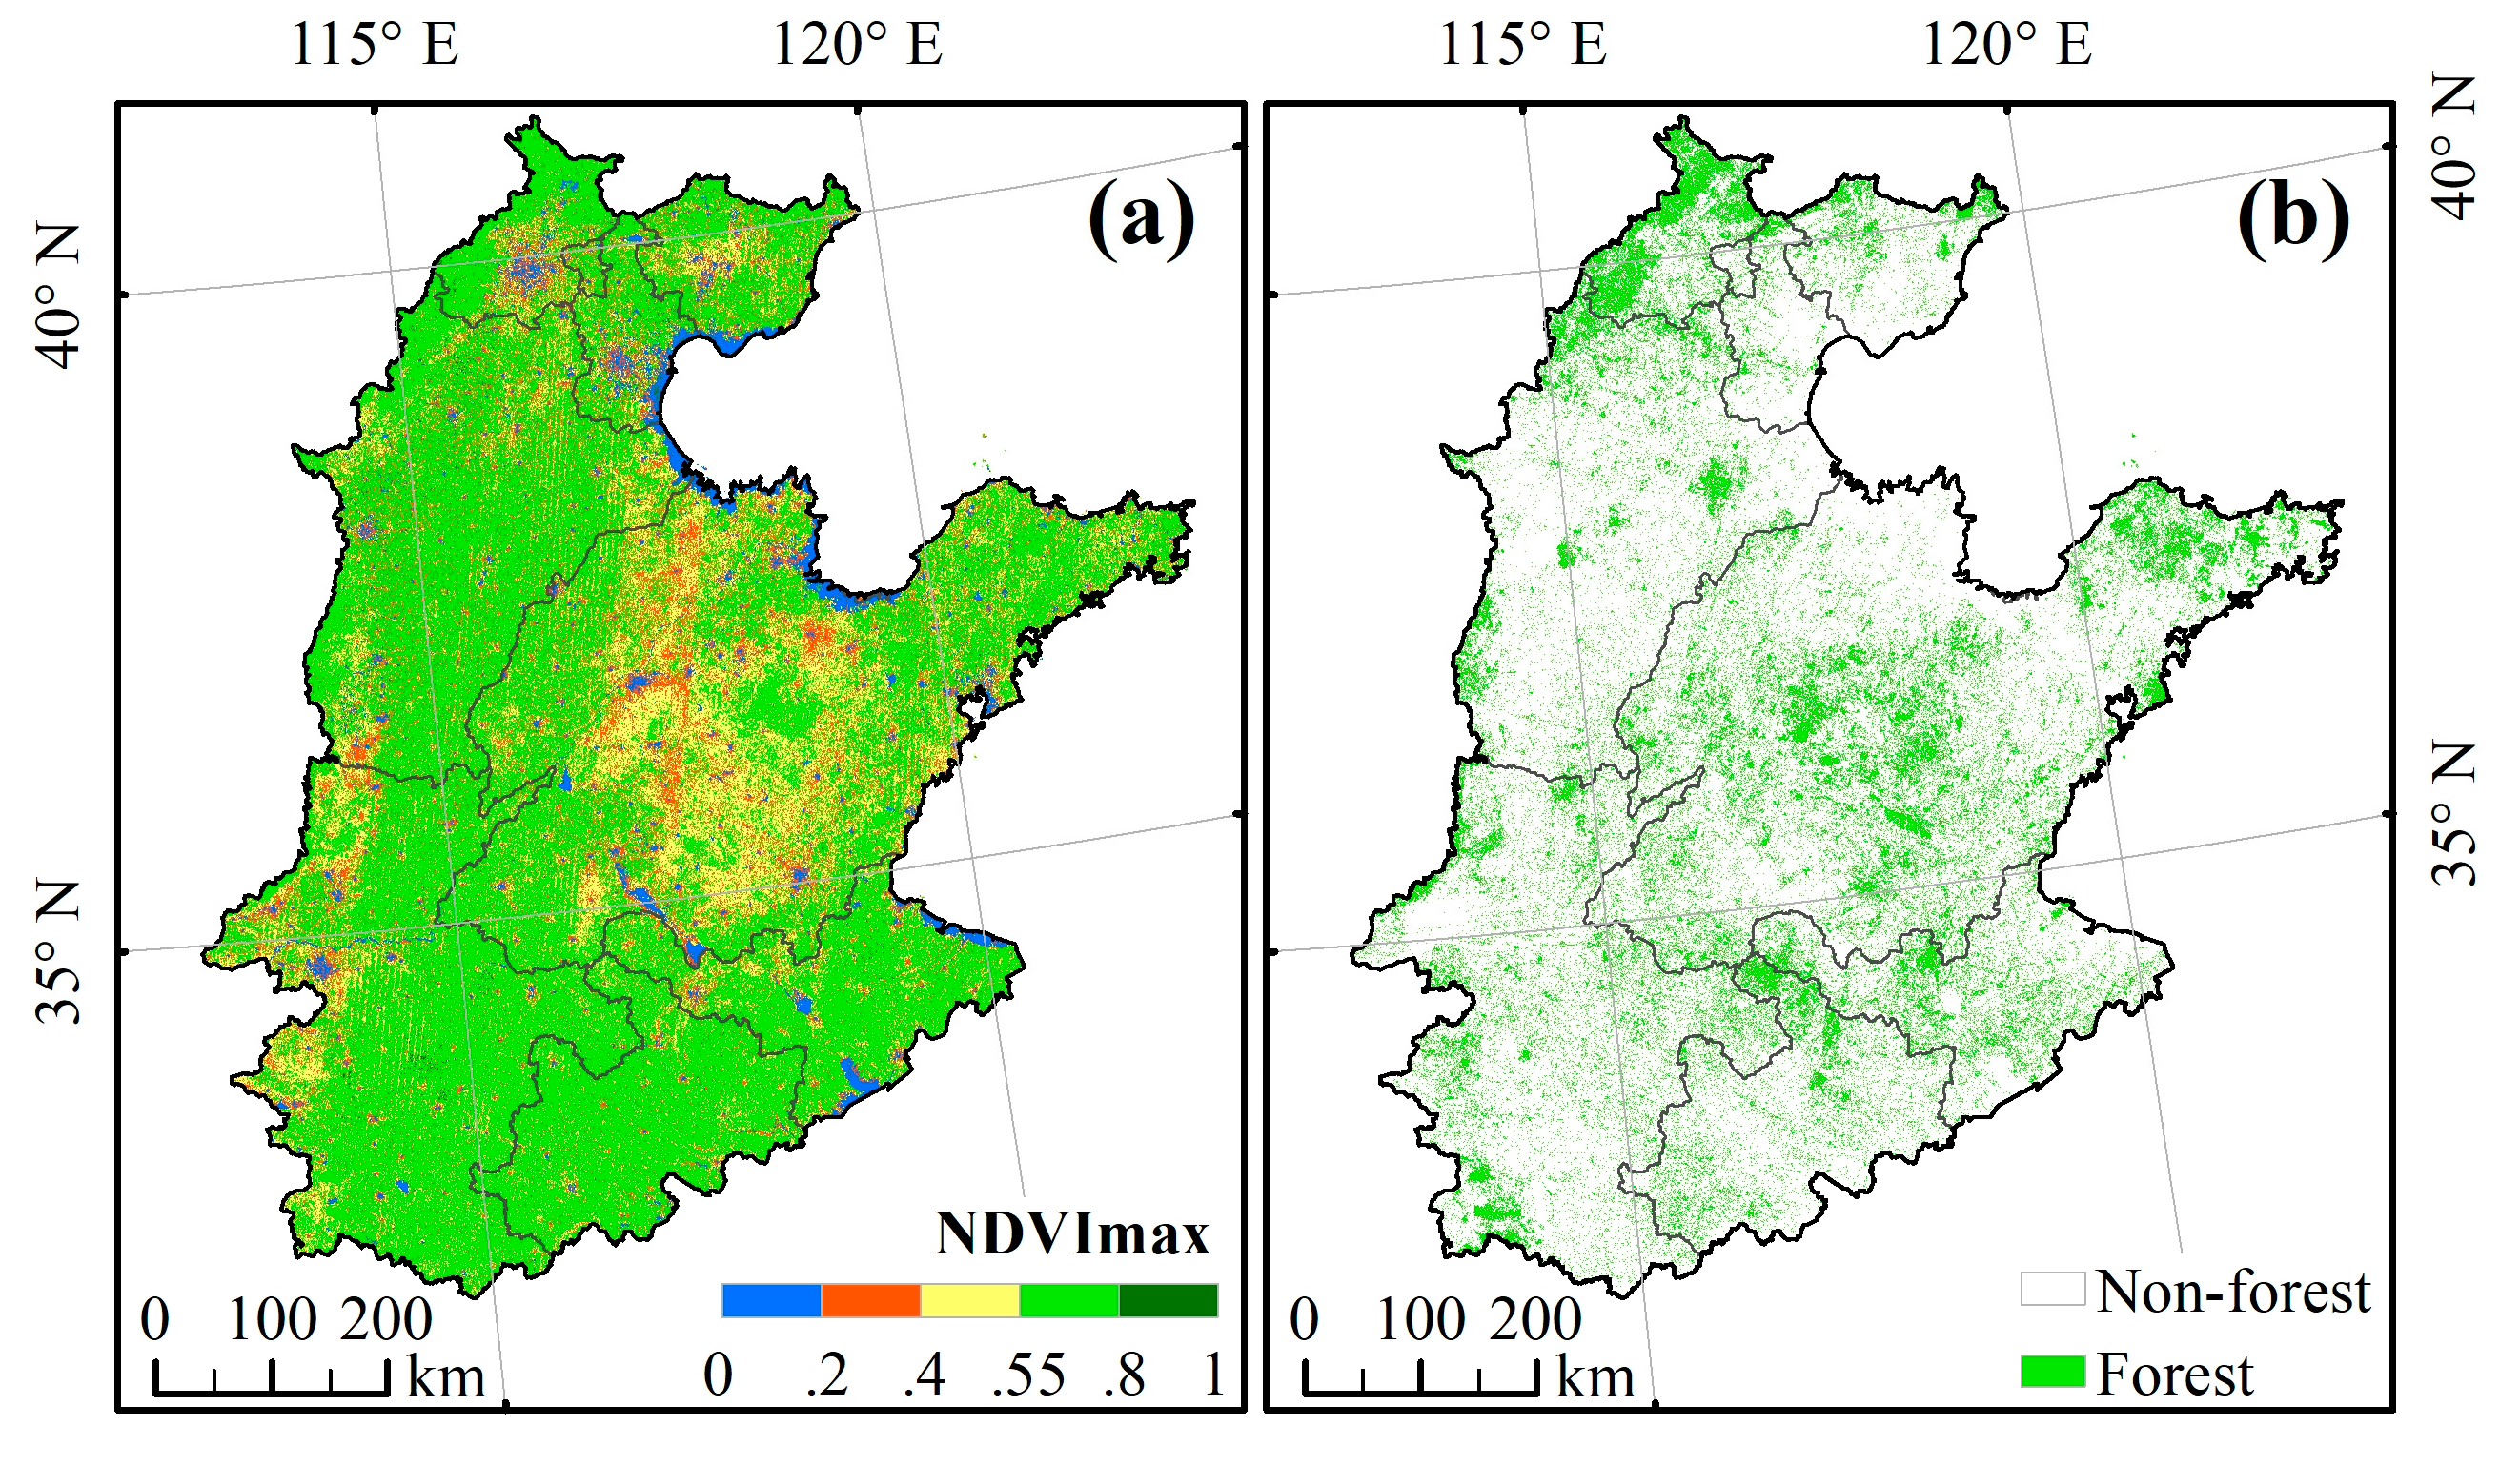
Some built-up lands, barren lands, and high biomass corn fields have a complex structure and rough land surface that may bring about high PALSAR backscattering coefficients similar to the forests. To reduce the commission error caused by some natural features (rocky lands) or manmade structures (urban, buildings), we generated an annual maximum NDVI (NDVImax) map to mask out such features with high backscattering coefficients (Figure 2a) [39,40]. Specifically, we utilized the annual total number of Landsat TM/ETM+ images in 2010 on the platform of Google Earth Engine (GEE), an open and powerful platform for satellite imagery downloading and processing, to calculate the NDVI values after removing all the bad observations based on the CFmask [41,42] and metadata layers, as the CFmask algorithm can provide cloud, cloud shadow, and snow mask for Landsat TM/ETM+ images.
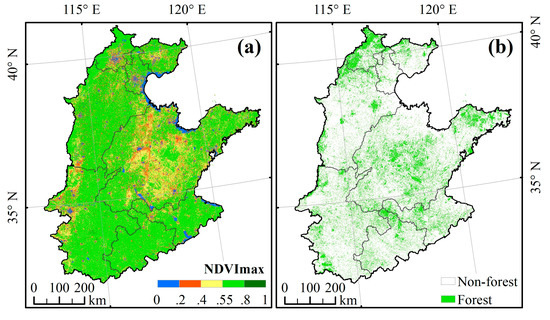
Figure 2.
Spatial distribution of annual maximum NDVI (a) and the PALSAR-based forest map (b) in the North China Plain (NCP) in 2010.
2.3. Mapping Algorithms
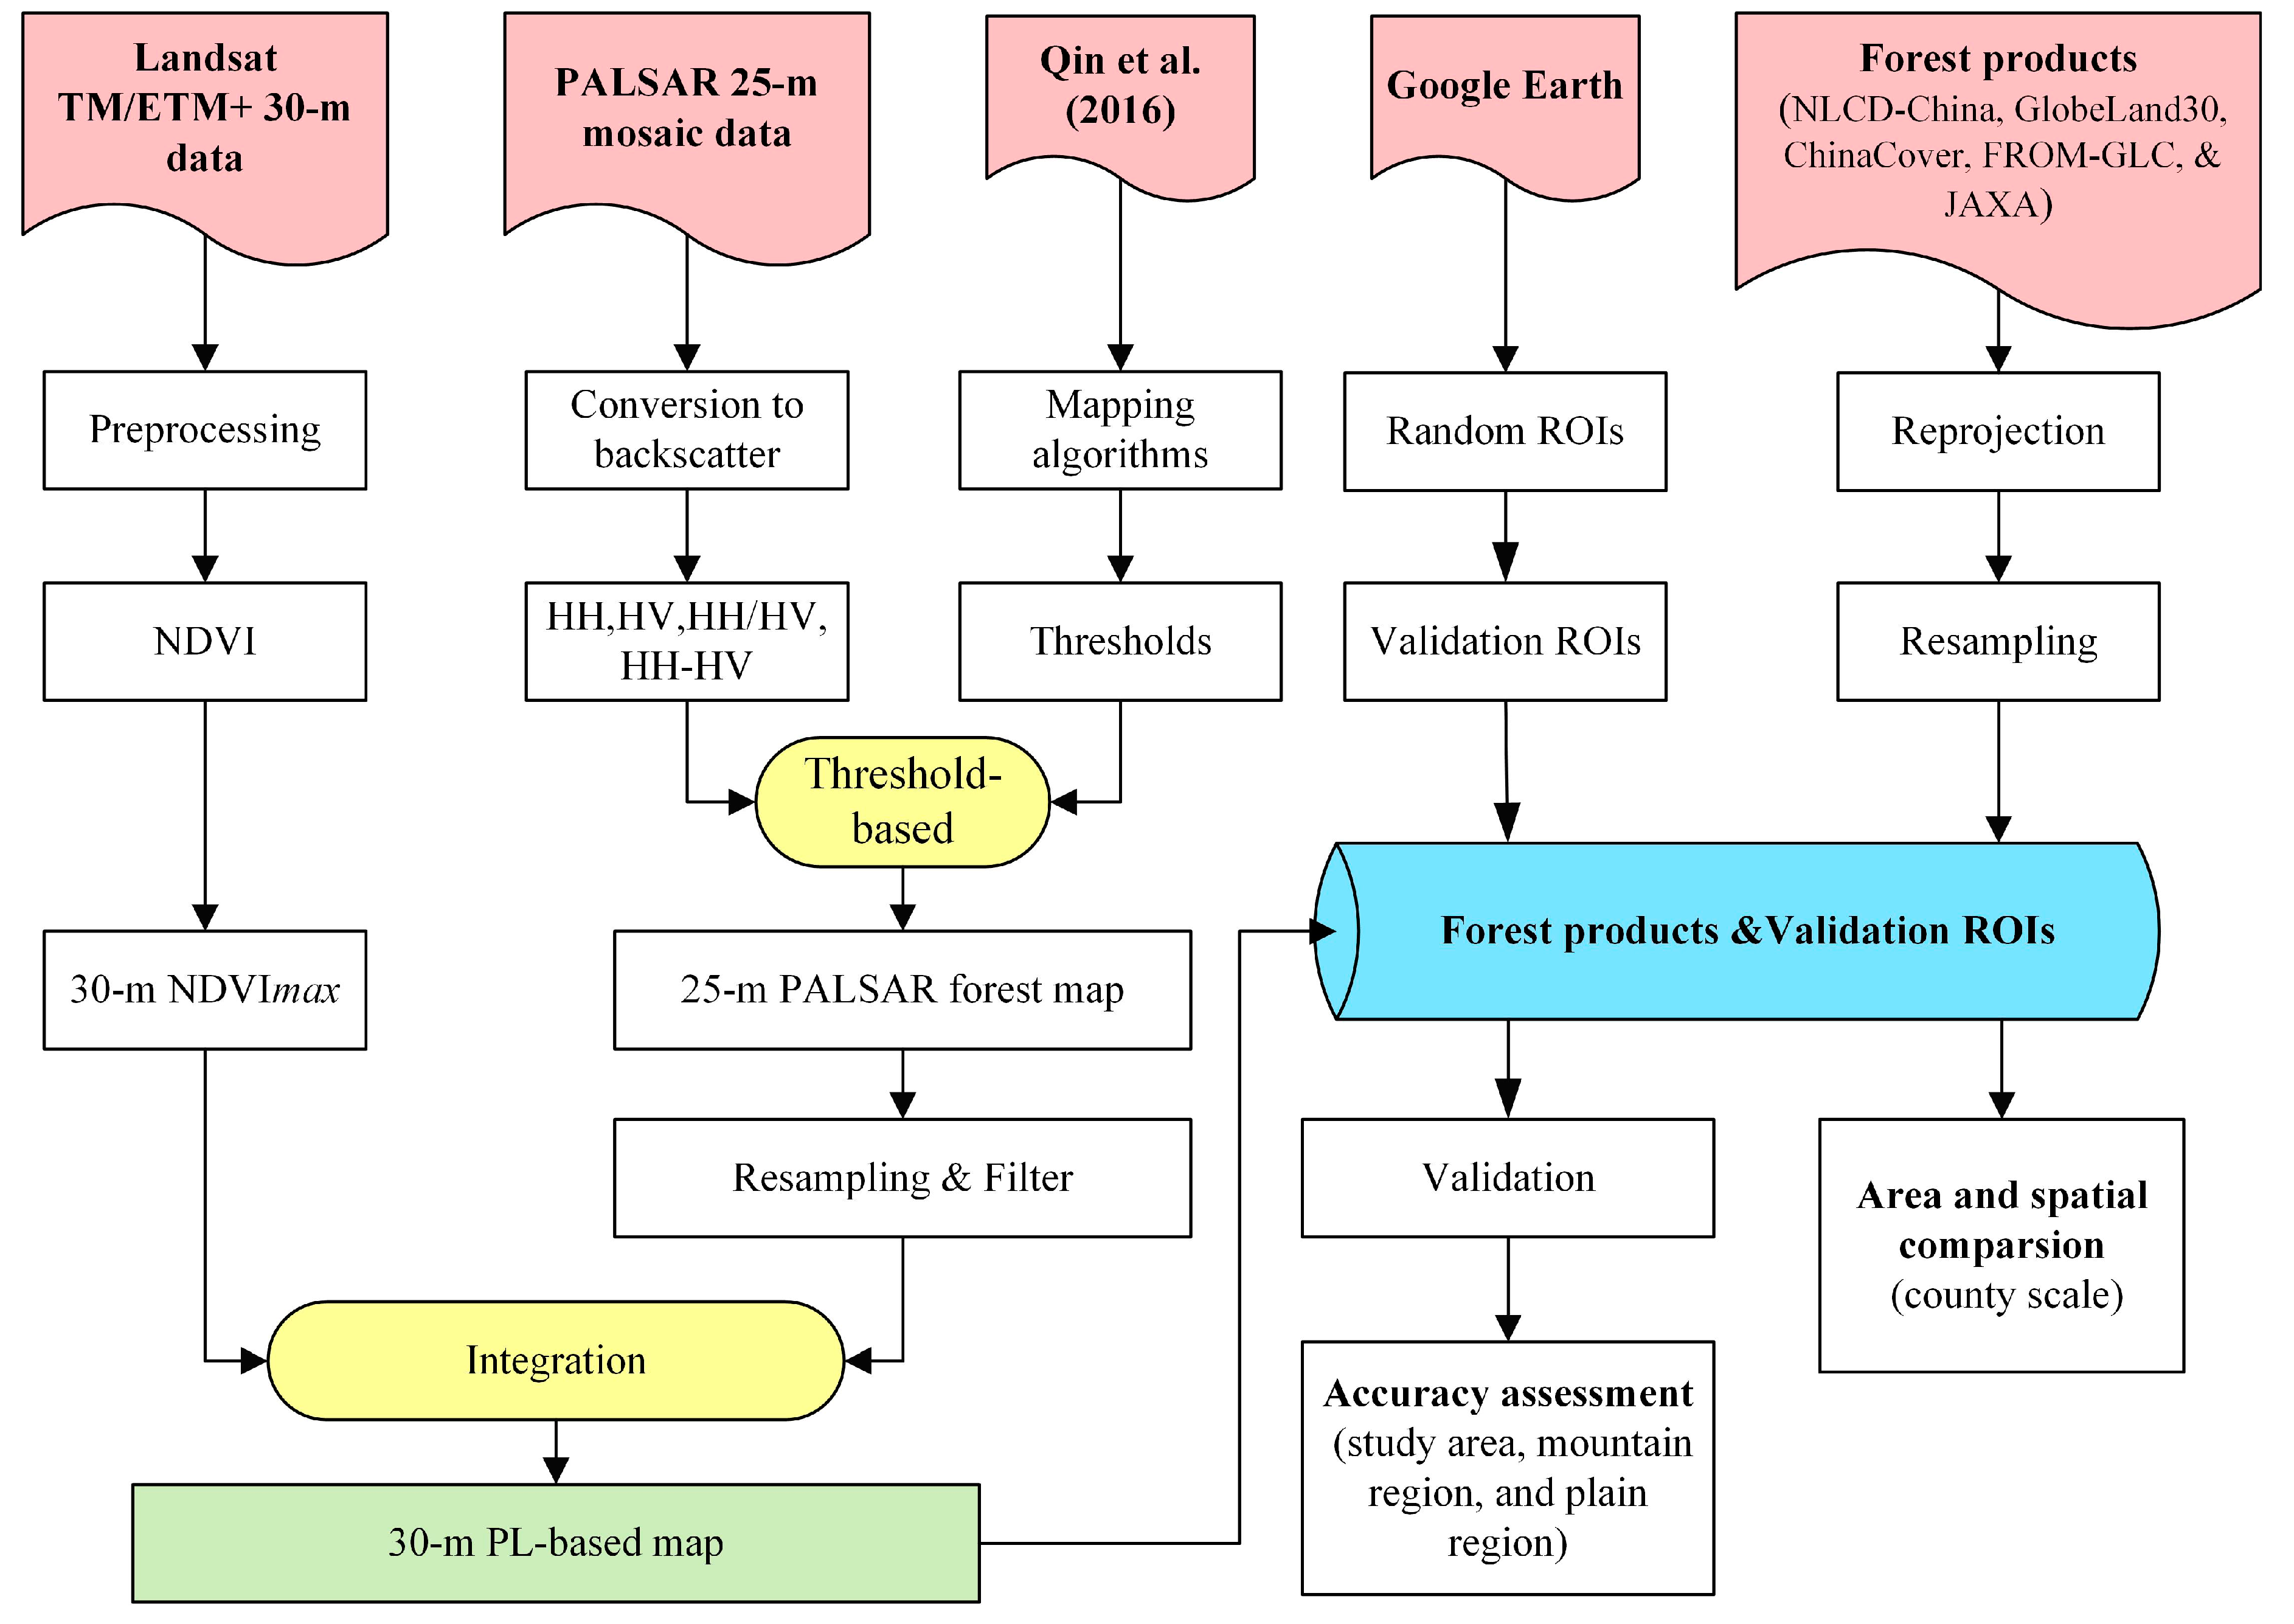
The previous studies found that the threshold-based approach for forest mapping is robust and extendable in different regions, such as the monsoon region in Asia and Oklahoma, USA [28,29]. In this study, we adopted the same thresholds and forest definition to generate a new forest map in the NCP by integrating PALSAR and Landsat data. A detailed workflow of mapping the forest and forest dataset comparison is presented in Figure 3.
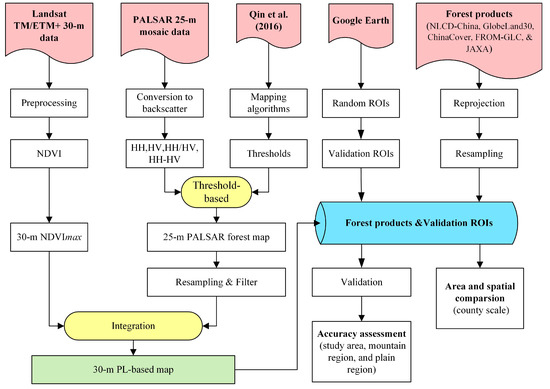
Figure 3.
Workflow of forest mapping based on PALSAR and Landsat data in North China Plain.
The first step of this workflow is to generate a forest baseline layer by using the 25-m PALSAR backscatter data (HH, HV, Ratio, and Difference) and a threshold-based approach. Basically, different land cover types (water, cropland, grassland, forest, and built-up land) showed different profiles through frequency distribution analyses of HH, HV, Ratio, and Difference values. Forests have higher backscatter values compared to croplands, grasslands, and water bodies. The same thresholds as previous studies [28,29,38] were used for the PALSAR-based forest baseline map, i.e., −16 < HV < −8, 2 < Difference < 8 and 0.3 < Ratio < 0.85. Second, a 25-m PALSAR-based forest layer was resampled using the nearest neighbor method to match Landsat images with 30-m spatial resolution; the result was also filtered using a 3 by 3 majority filter to reduce the salt-and-pepper noise in the forest maps (Figure 2b). Third, the vegetation and non-vegetation layer was generated using a threshold-based approach (NDVImax > 0.55, see Supplemental Information for the justification statement) based on the NDVImax data to reduce the commission error [28]. Finally, the resultant forest map (referred as PL-based forest map) was generated by combining the PALSAR-based forest baseline map and the vegetation layer from Landsat.
2.4. Regions of Interest (ROIs) for Product Validation
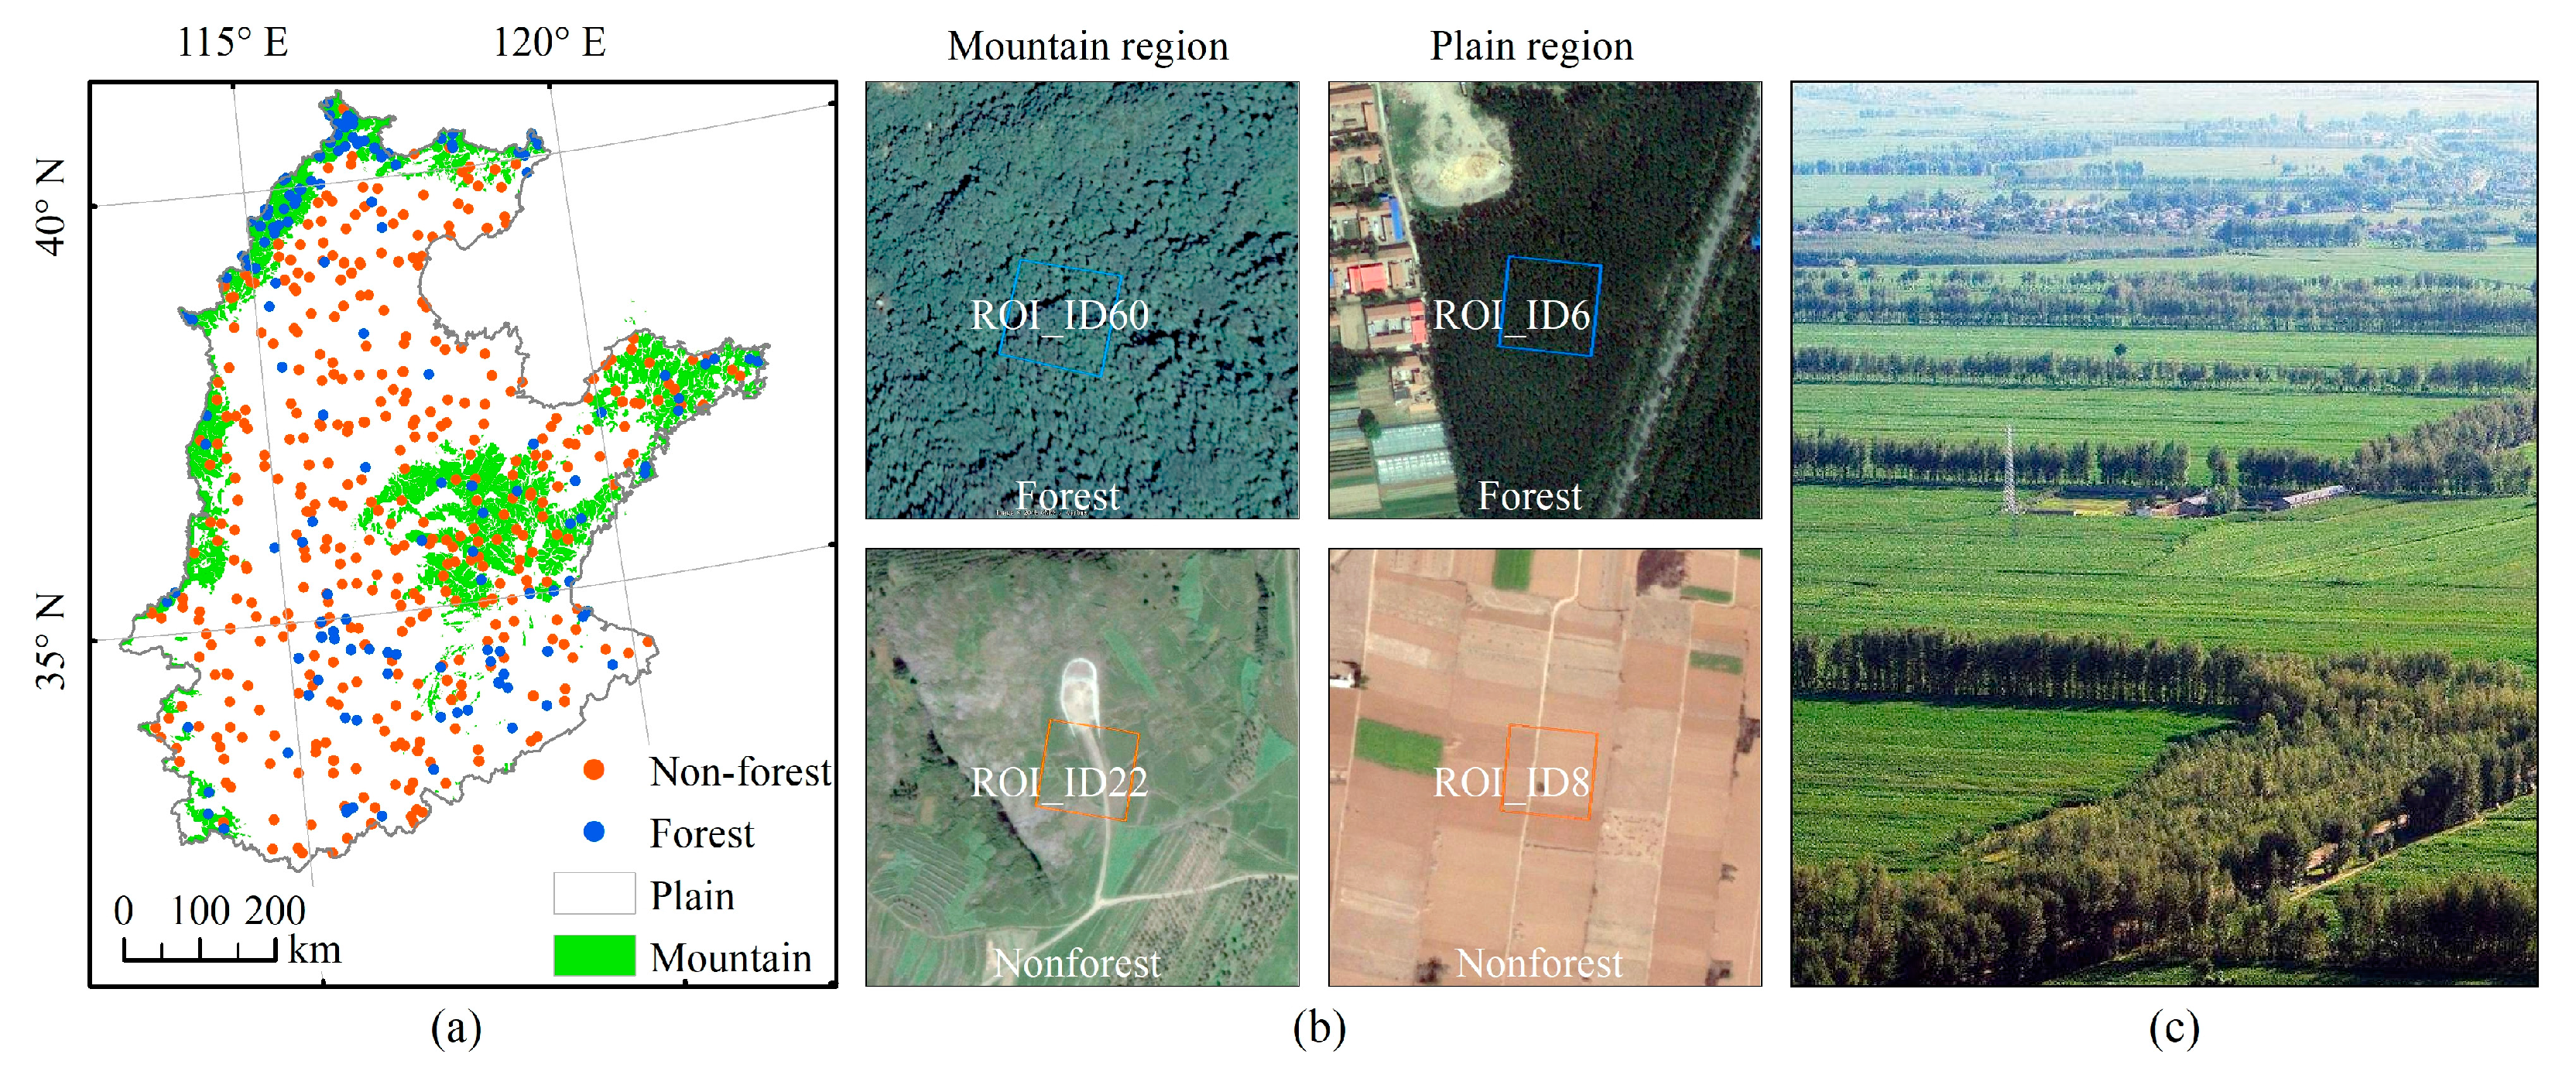
In this study, we applied Bowley’s proportional allocation statistical technique (Equation (4)) to attain validation samples [43] from the very high resolution (VHR) remote sensing images of Google Earth circa 2010 to guarantee equal probabilities of obtaining the validation samples. Google Earth has been widely used in land cover map validations [44]. First, the sampling was stratified by class (forest layer and non-forest layer), according to the PL-based forest map, and then the random points were generated in the ArcGIS software. Second, according to these random points, we established 30-m by 30-m squares as Regions of Interest (ROIs), which can guarantee landscape homogeneity and accuracy of the validation result [45,46]. Specifically, we dropped those vague ROIs to guarantee the quality of the ROIs. Finally, a total of 543 ROIs were obtained, including 147 forest ROIs and 396 non-forest ROIs (Figure 4a). Given a larger difference in the forest spatial distribution, the NCP was divided into mountain region and plain region based on different elevations (Figure 1). Figure 4b illustrates the four validation ROIs including the mountain region and plain region from the VHR images of Google Earth from around 2010.
where is the number of units allocated to each category of respondents, Nh is the number of respondents in each category, n is the total sample size, N is the total population.
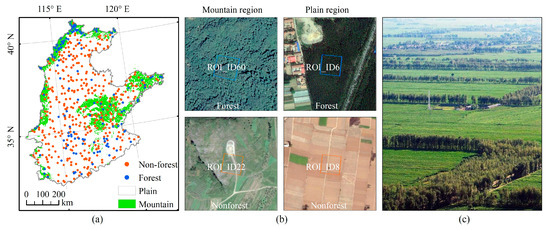
Figure 4.
Extraction of validation regions of interest (ROIs) for the resultant PL-based map. (a) Spatial distribution of validation ROIs; (b) four ROIs including the mountain region and plain region from the very high resolution (VHR) images of Google Earth from around 2010; (c) a typical agroforest landscape surrounding a crop field (the photo was taken in 2015).
2.5. Accuracy Assessment and Comparison with the Other Forest Maps
2.5.1. Accuracy Assessments of Various Forest Maps
To accurately assess the consistency and uncertainty of forest maps in the NCP, we collected five popular existing moderate resolution forest maps from 2010 (Table 1). The first was the JAXA forest map, which was generated by the Earth Observation Research Center, JAXA, using L-band PALSAR data. Four of them were generated based on Landsat: (1) NLCD-China land cover/use product, which was generated by the Chinese Academy of Sciences [47]. We resampled the NLCD-China forest map with 100-m spatial resolution to 30-m by using the nearest neighbor method to match other products. (2) GlobeLand30 product, which was generated by the National Geomatics Center of China (NGCC) [48]. (3) ChinaCover product, which was generated by the 10-year Environmental Monitoring Program in China [49]. (4) FROM-GLC Global Land Cover Data, which was generated by Tsinghua University [50].

Table 1.
A brief summary of five moderate resolution forest maps in this study.
The mutual ROIs (Figure 4a) were used to evaluate the accuracy of the PL-based and the other five forest maps in the NCP, using the confusion matrix method. Then, all the ROIs were divided into two parts to evaluate the accuracy of each forest map in the mountain region and plain region. Note that we also adjusted the accuracy assessment based on the area of each stratum following previous studies [51]. All the overall, producer, and user accuracies were presented with a 95% confidence interval.
2.5.2. Area Comparison Among the Various Forest Maps
We obtained the county-level administrative boundaries from NGCC. The forest areas of each county of the PL-based and the other five forest maps were calculated on the ArcGIS software and were compared and analyzed by the linear regression and correlation approaches.
2.5.3. Spatial Consistency of Different Forest Maps
The method of per-pixel comparison analysis was used to evaluate the spatial consistency of pairwise forest maps [45]. First, pairwise forest maps were overlaid to calculate the number of mutual forest pixels (AB); second, the spatial consistency index (X) of two forest maps was calculated using the following formula:
where A is the number of forest pixels in one dataset, B is the number of forest pixels in another dataset, and AB is the number of forest pixels in both datasets.
3. Results
3.1. Accuracy Assessment of the PL-Based Forest Map and the Other Five Products
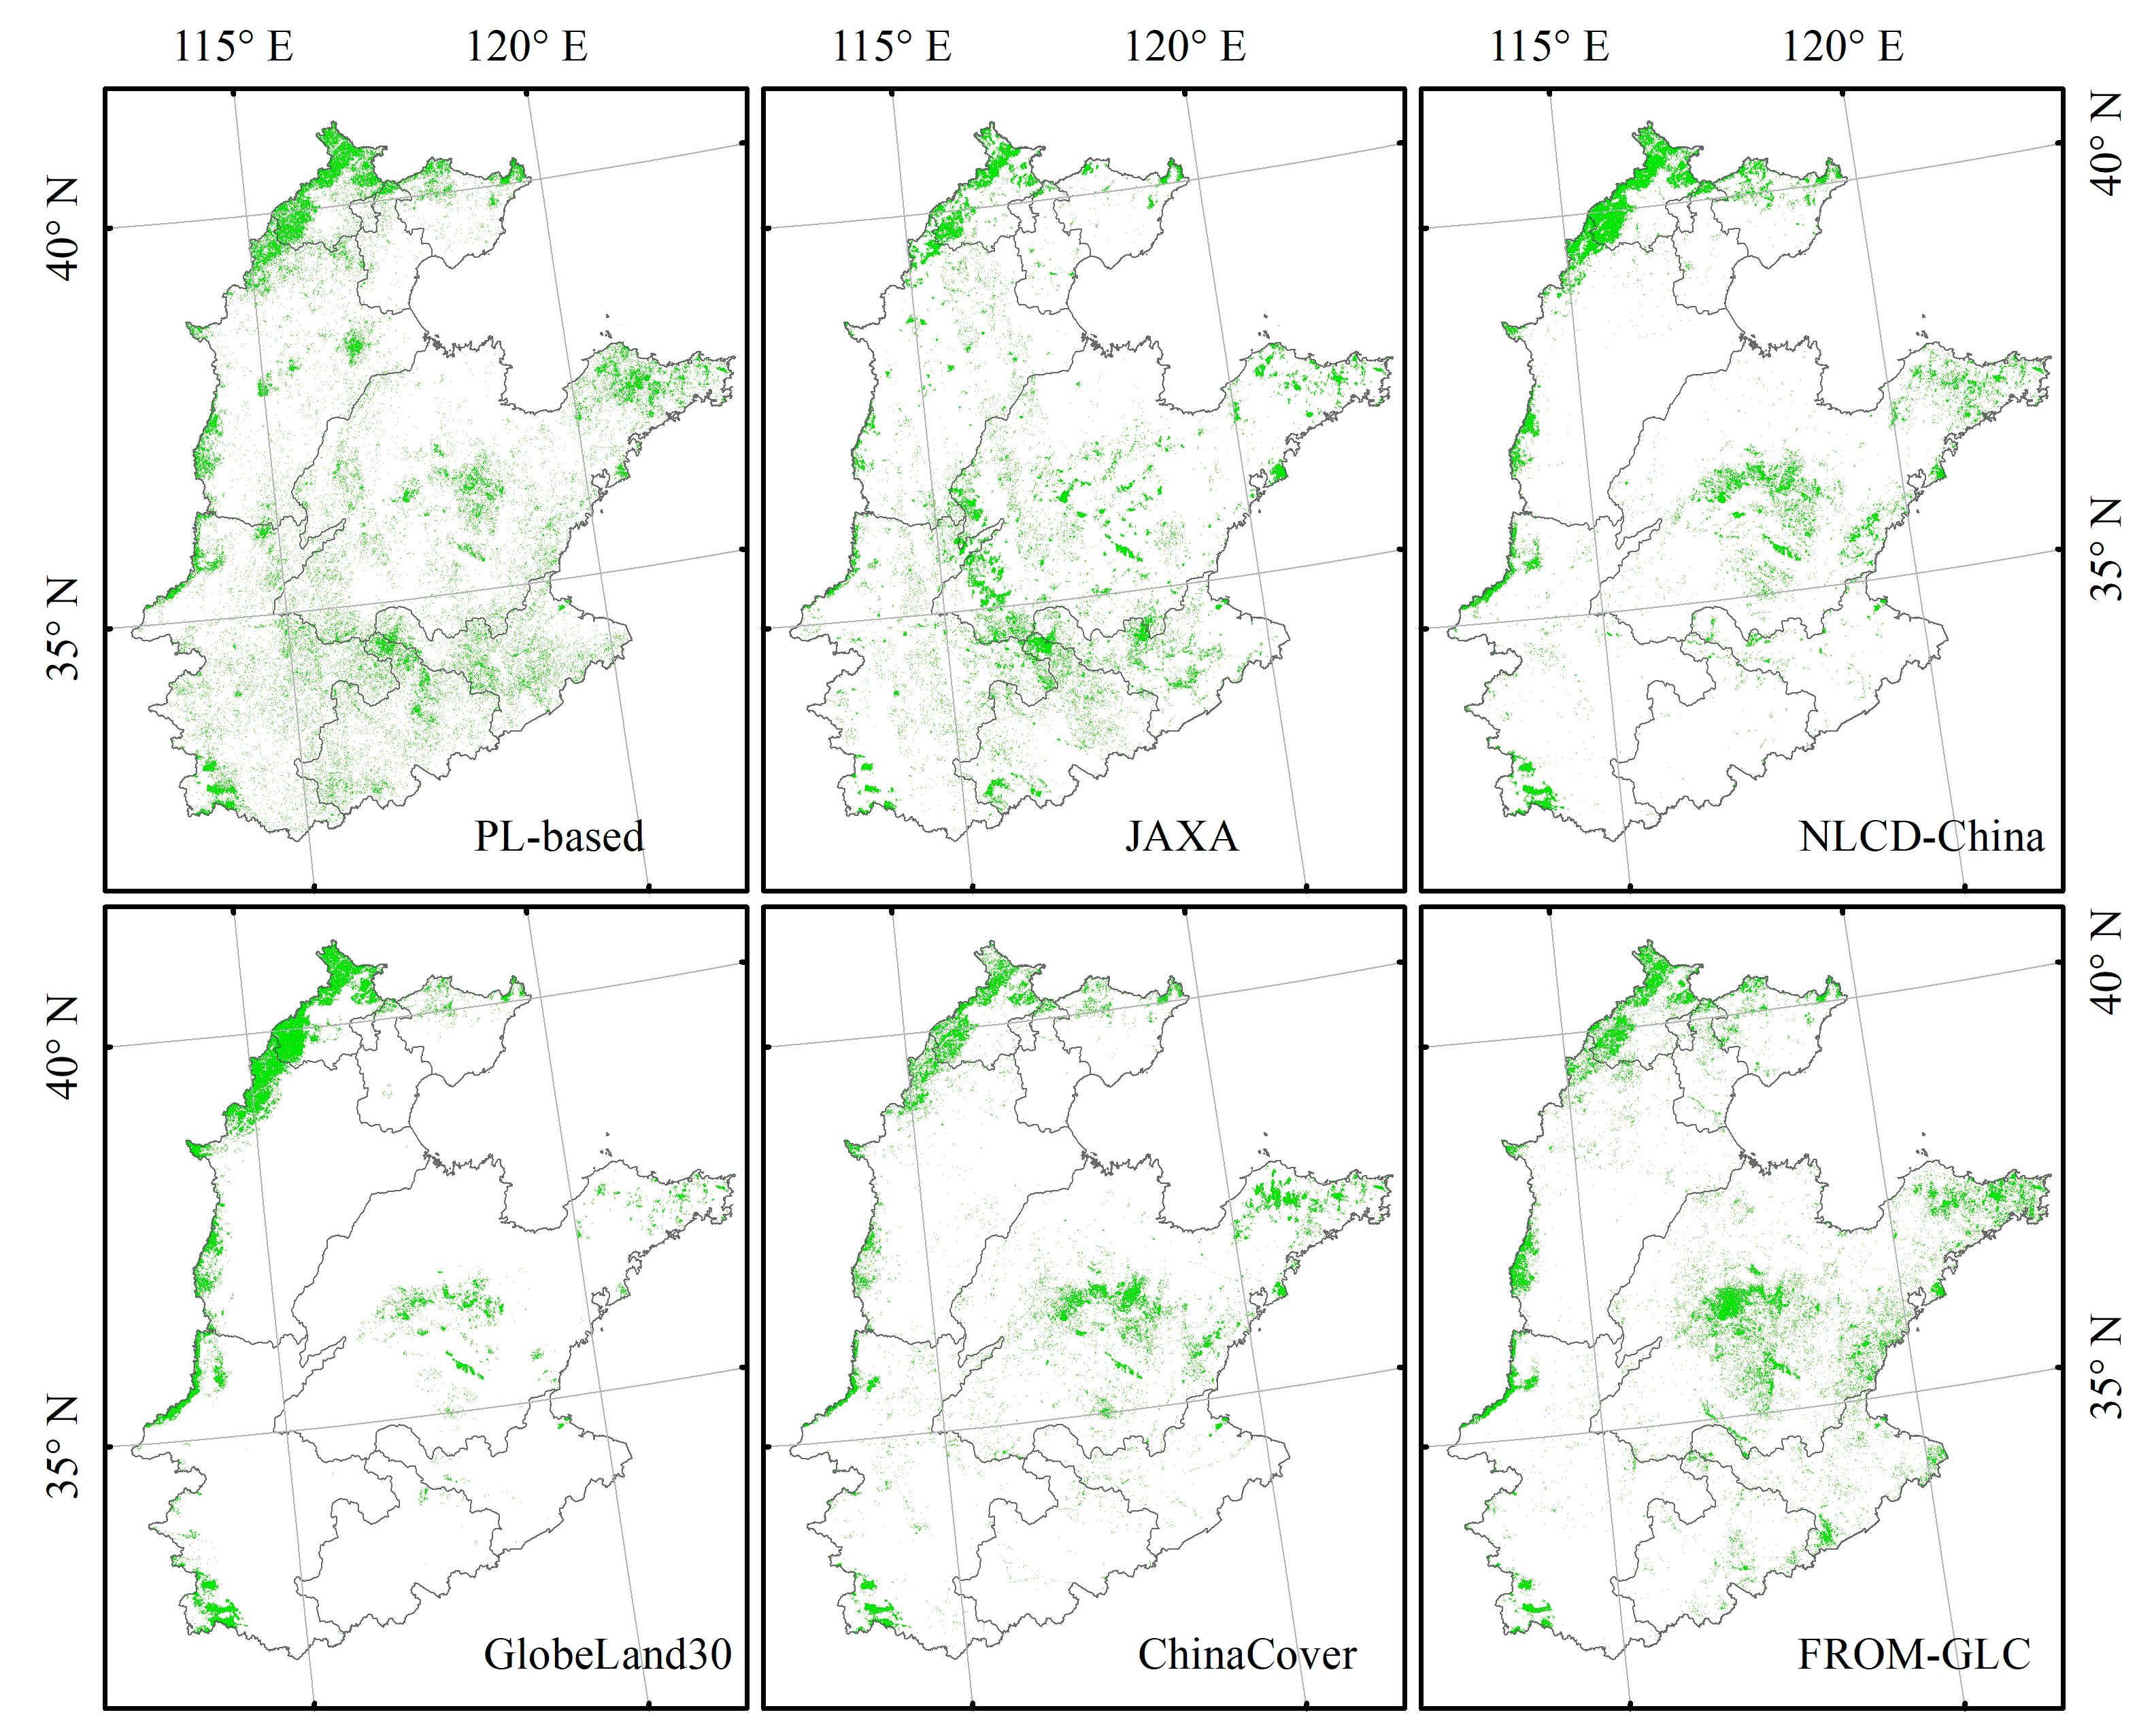
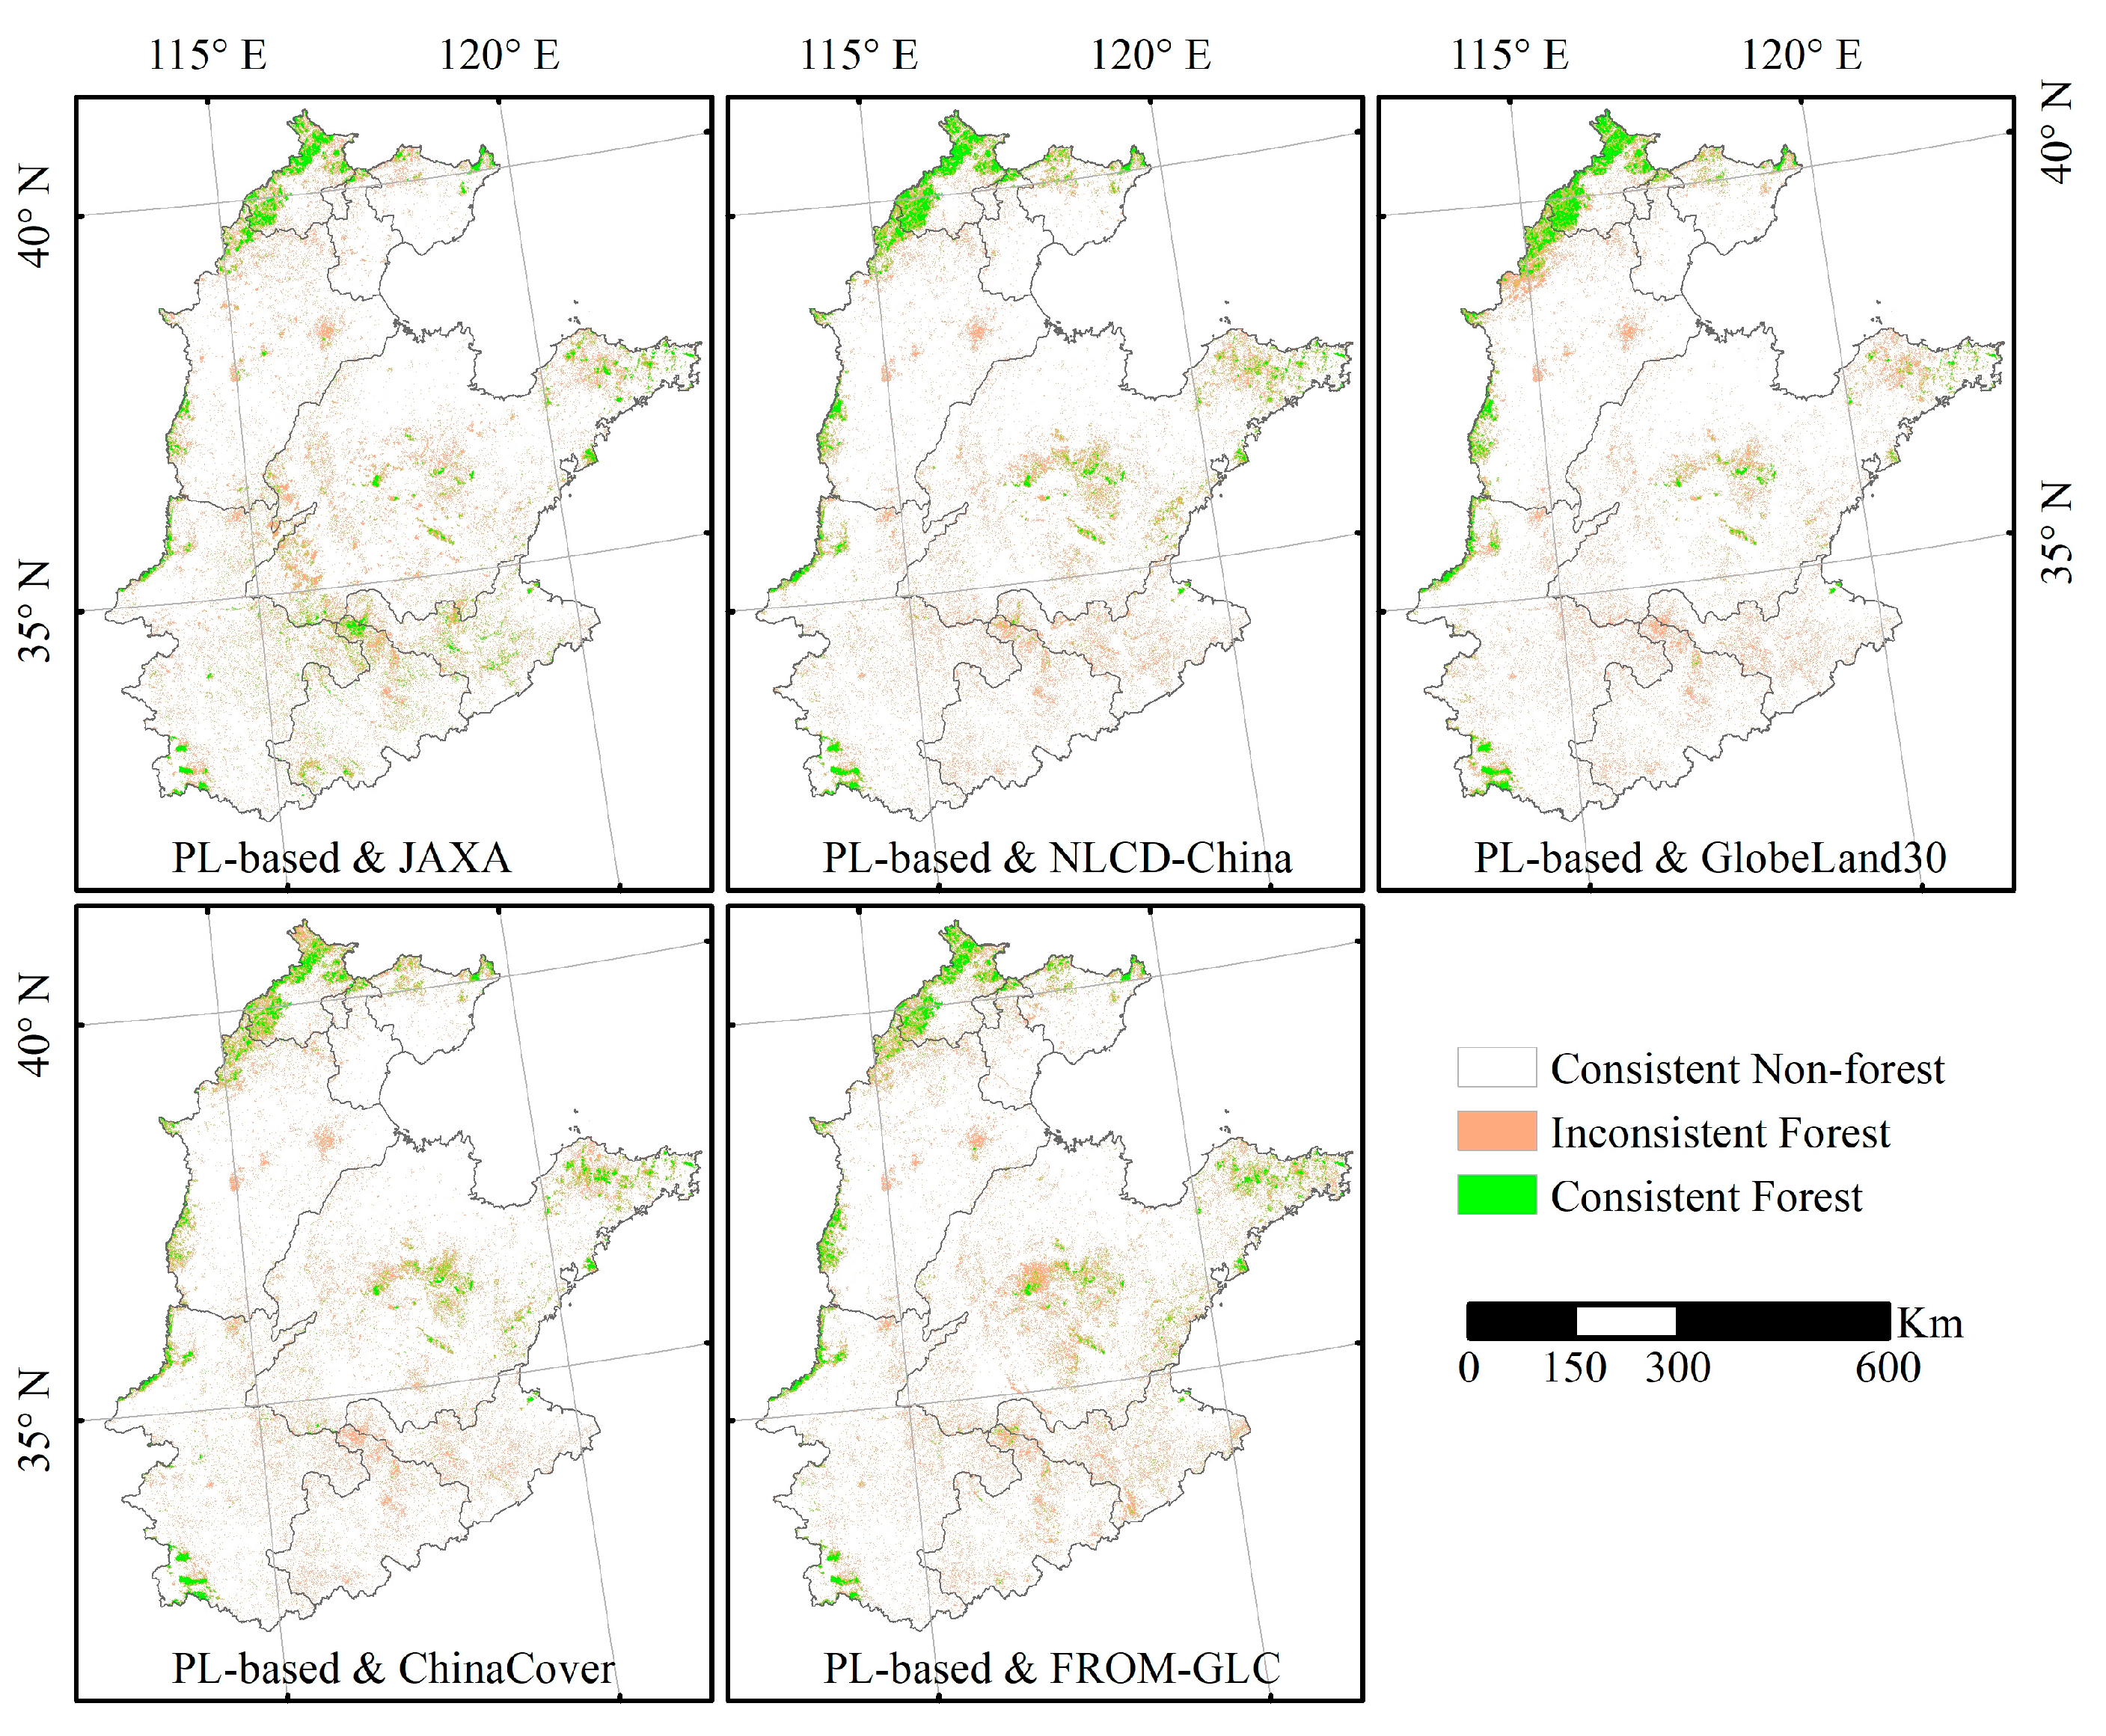
The spatial distribution of the PL-based and the other five forest maps are shown in Figure 5. All the maps show an intensive forest distribution in the mountainous regions, e.g., northwestern part and the Mountain Tai region, while in the plain region, the traditional agricultural production region, only PL-based and JAXA forest maps show the widespread spatial distribution of forest. That indicates that the PALSAR-based forest maps tend to capture more forests with lower forest coverage that is mainly distributed in a large number of patches with mixed pixels.
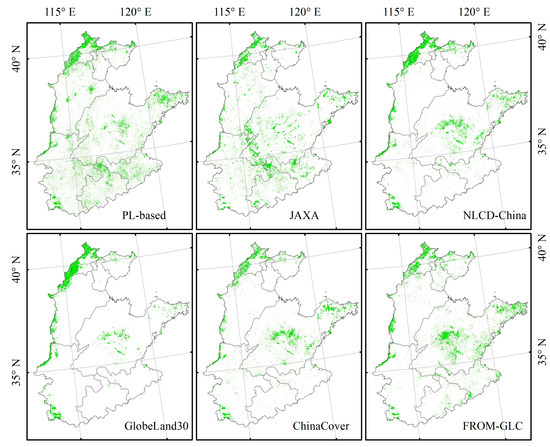
Figure 5.
Spatial distributions of the PL-based and other five forest maps.
3.1.1. Accuracy of the PL-Based and the Other Five Forest Maps
The overall accuracy of the PL-based forest map is 95 ± 1% (Table 2) with a 95% confidence interval [51]. The producer accuracy, user accuracy, and Kappa coefficient are 71 ± 5%, 92 ± 2%, and 0.86, respectively. Next, the overall accuracy of the JAXA forest map is 92 ± 1% with the Kappa coefficient of 0.76. The PALSAR-based forest map shows a higher overall accuracy, while the Landsat-based forest maps show slightly lower overall accuracy between 85 ± 2% and 87 ± 2%, and a Kappa coefficient from 0.56 to 0.64. The overall accuracy of each forest map in the mountain and plain region is calculated for further analysis. Although all forest maps show higher overall accuracy more than 80% in mountain and plain region, the producer accuracy and Kappa coefficient of all forest maps indicate a larger difference in the plain region and a smaller difference in the mountain region. Specifically, the producer accuracy of the PL-based and JAXA forest maps are 71 ±7% and 59 ± 8%, while the Landsat-based forest maps are less than 20% in the plain region. That means that the omission error of the Landsat-based forest maps is far higher than the PALSAR-based forest maps, and the radar data had a great advantage in estimating the agroforest area in the plain region. In addition, compared with the PL-based forest map, the JAXA forest map shows a higher omission error and commission error in the plain region.

Table 2.
Forest accuracy assessments of the PL-based and the other five forest maps. Accuracy measures are adjusted with the area of each stratum and presented by a 95% confidence interval.
3.1.2. Zoom-In Analyses of the PL-Based and the Other Five Forest Maps
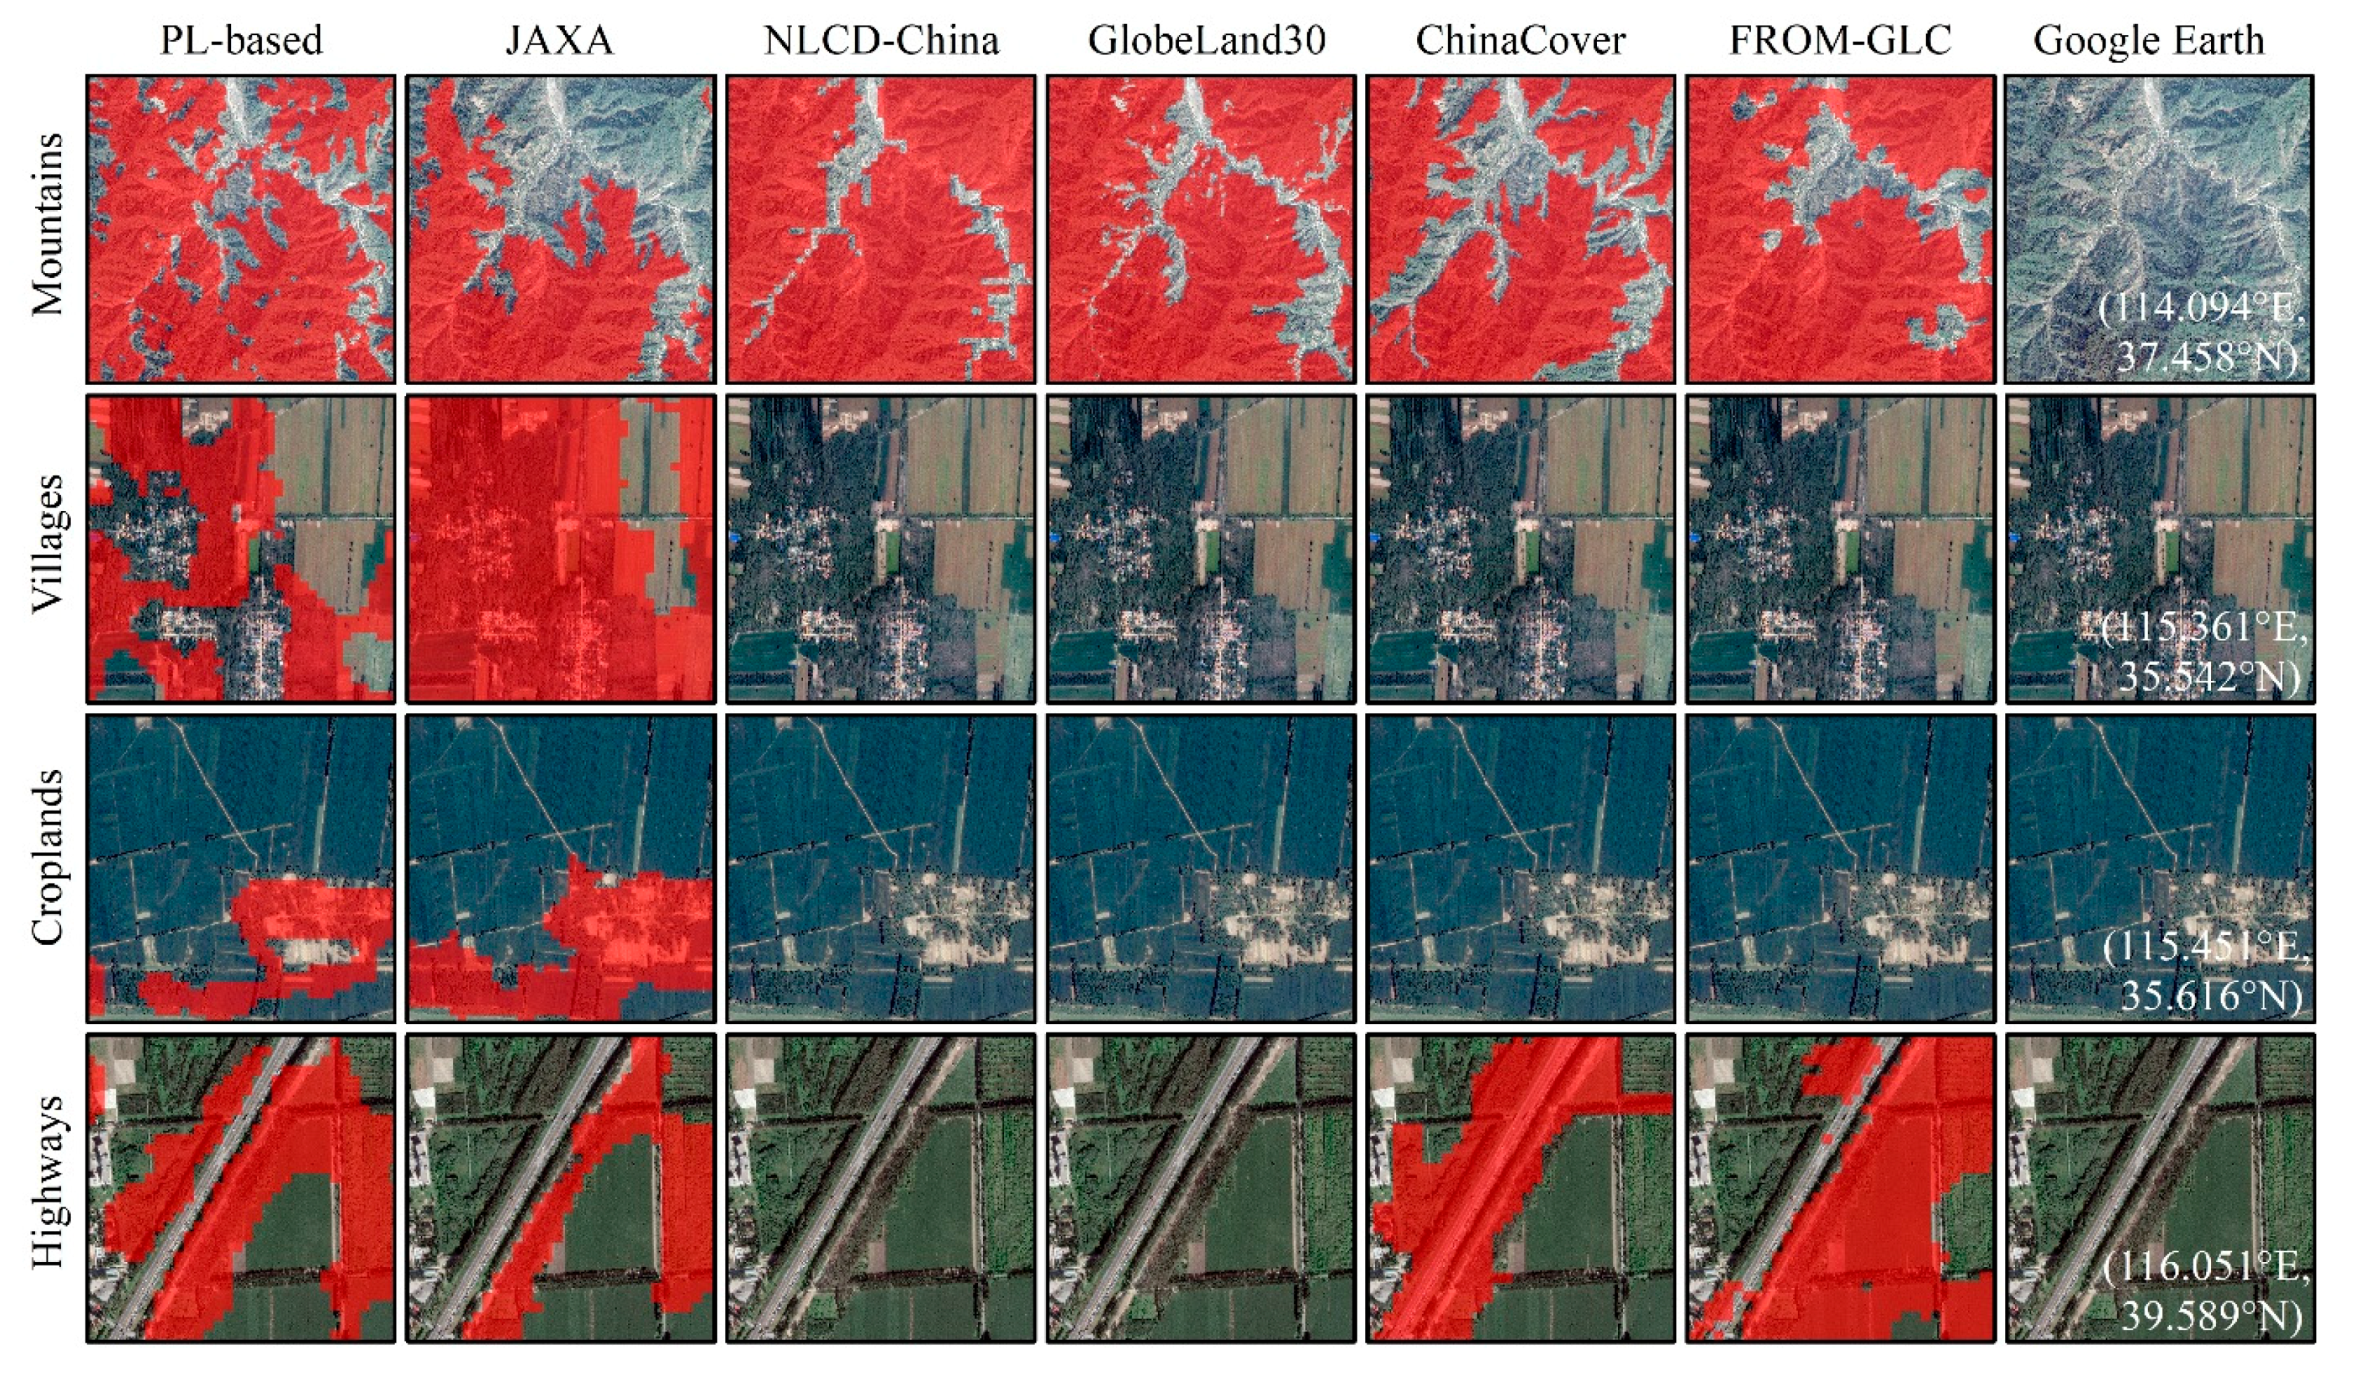
In this study, forest is mainly distributed in the mountain regions or surrounding villages, croplands, and highways. Here, we randomly select four case regions and show zoom-in maps with more details to analyze the discrepancy between the PL-based and other forest maps, which explains why the forest maps based on Landsat can have higher omission error (Figure 6).
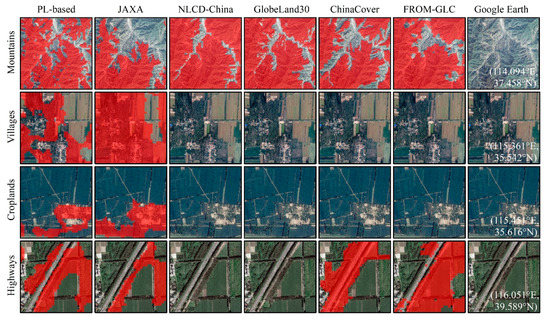
Figure 6.
A zoom-in comparison between the PL-based and the other five forest maps in randomly selected landscapes of mountains, villages, croplands, and highways.
In the mountain regions, highly consistency of spatial distribution are found in those of the forest maps; the PL-based, GlobeLand30, and ChinaCover forest maps show more details and texture features of forest; the JAXA forest area is underestimated due to a higher omission error, and the forest details are ignored in the NLCD-China forest map as well; and the forest area of FROM-GLC is overestimated due to higher commission error. In the surrounding villages and croplands, the spatial distribution of the PL-based forest map agrees well with Google Earth, while some buildings and croplands are identified as forest in the JAXA forest map. The forest area is vastly underestimated in the other forest maps. Last, on either side of the highway, good consistency is shown in the PL-based forest map and Google Earth; the area of JAXA forest map is slightly underestimated; the area of the NLCD-China and GlobeLand30 forests are seriously underestimated due to higher omission errors; the area of the ChinaCover and FROM-GLC forests are overestimated to some extent. Specifically, the PL-based forest map shows a good spatial distribution and consistency with Google Earth in four case regions. The JAXA and other Landsat-based forest maps show good spatial distribution and consistency with Google Earth in the mountain regions. The areas of these forest maps are overestimated or underestimated to some extent in the surrounding villages, croplands, and highways.
3.2. Forest Area Comparison Among Six Satellite-Based Forest Maps
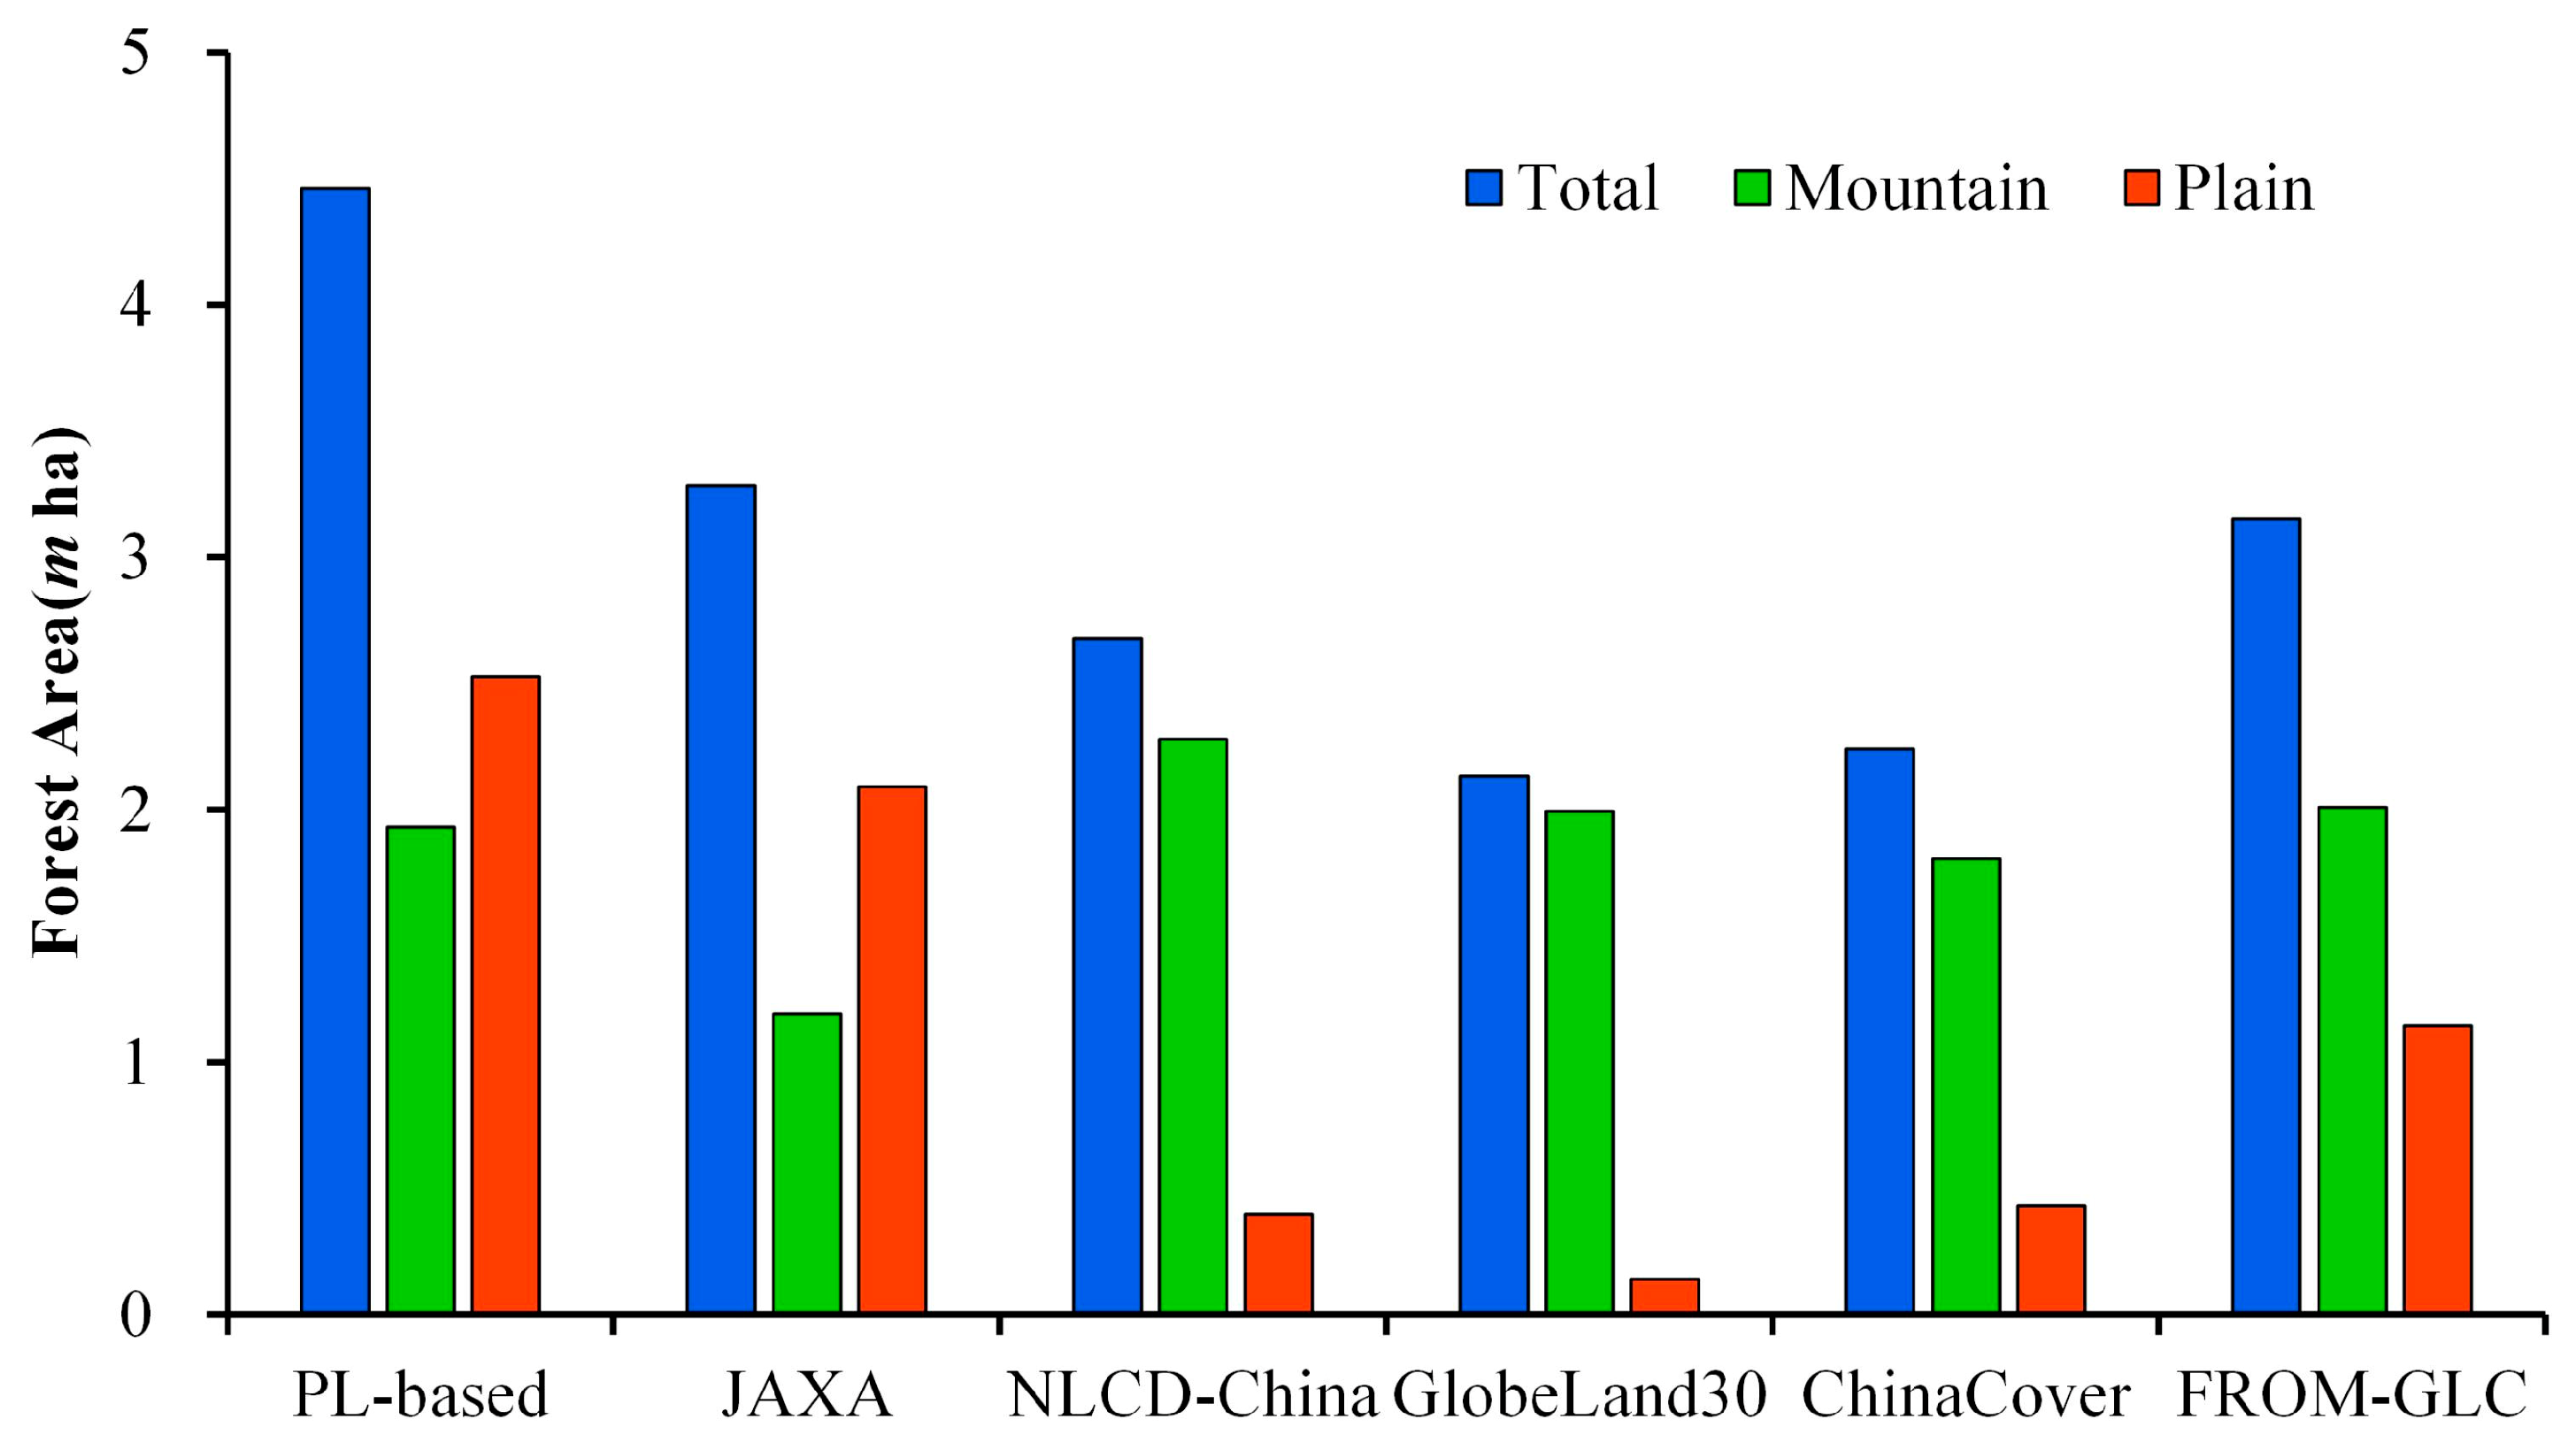
Figure 7 shows the forest areas of the PL-based and the other five forest maps in the NCP, mountain region, and plain region. The total forest area of the PL-based forest map is approximately 4.46 m ha in the NCP 2010, followed by JAXA (3.28 m ha) and the FROM-GLC forest map (3.15 m ha). The total forest area of the GlobeLand30 forest map is 2.13 m ha, which is the lowest among the six forest maps. In the mountain region, the estimated forest area among these forest maps shows a smaller difference, while the estimated forest area show a larger difference in the plain region. Specifically, the forest area of the PL-based forest map is 1.93 m ha in the mountain region, which is similar to the Landsat-based forest maps estimated forest area from 1.80 to 2.28 m ha. The larger difference exist between JAXA (1.19 m ha) and the other five forest maps in the mountain region, due to the higher omission error. In the plain region, the forest area estimated from the PL-based forest map (2.52 m ha) is similar to the JAXA forest map (2.08 m ha), but much higher than NLCD-China (0.40 m ha), GlobeLand30 (0.14 m ha), ChinaCover (0.43 m ha), and FROM-GLC (1.14 m ha) forest maps.
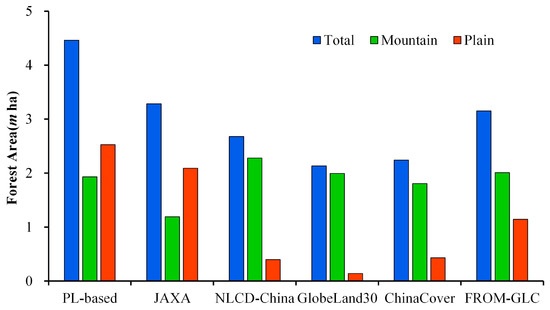
Figure 7.
Forest area in the study area according to the six satellite-based forest maps in 2010.
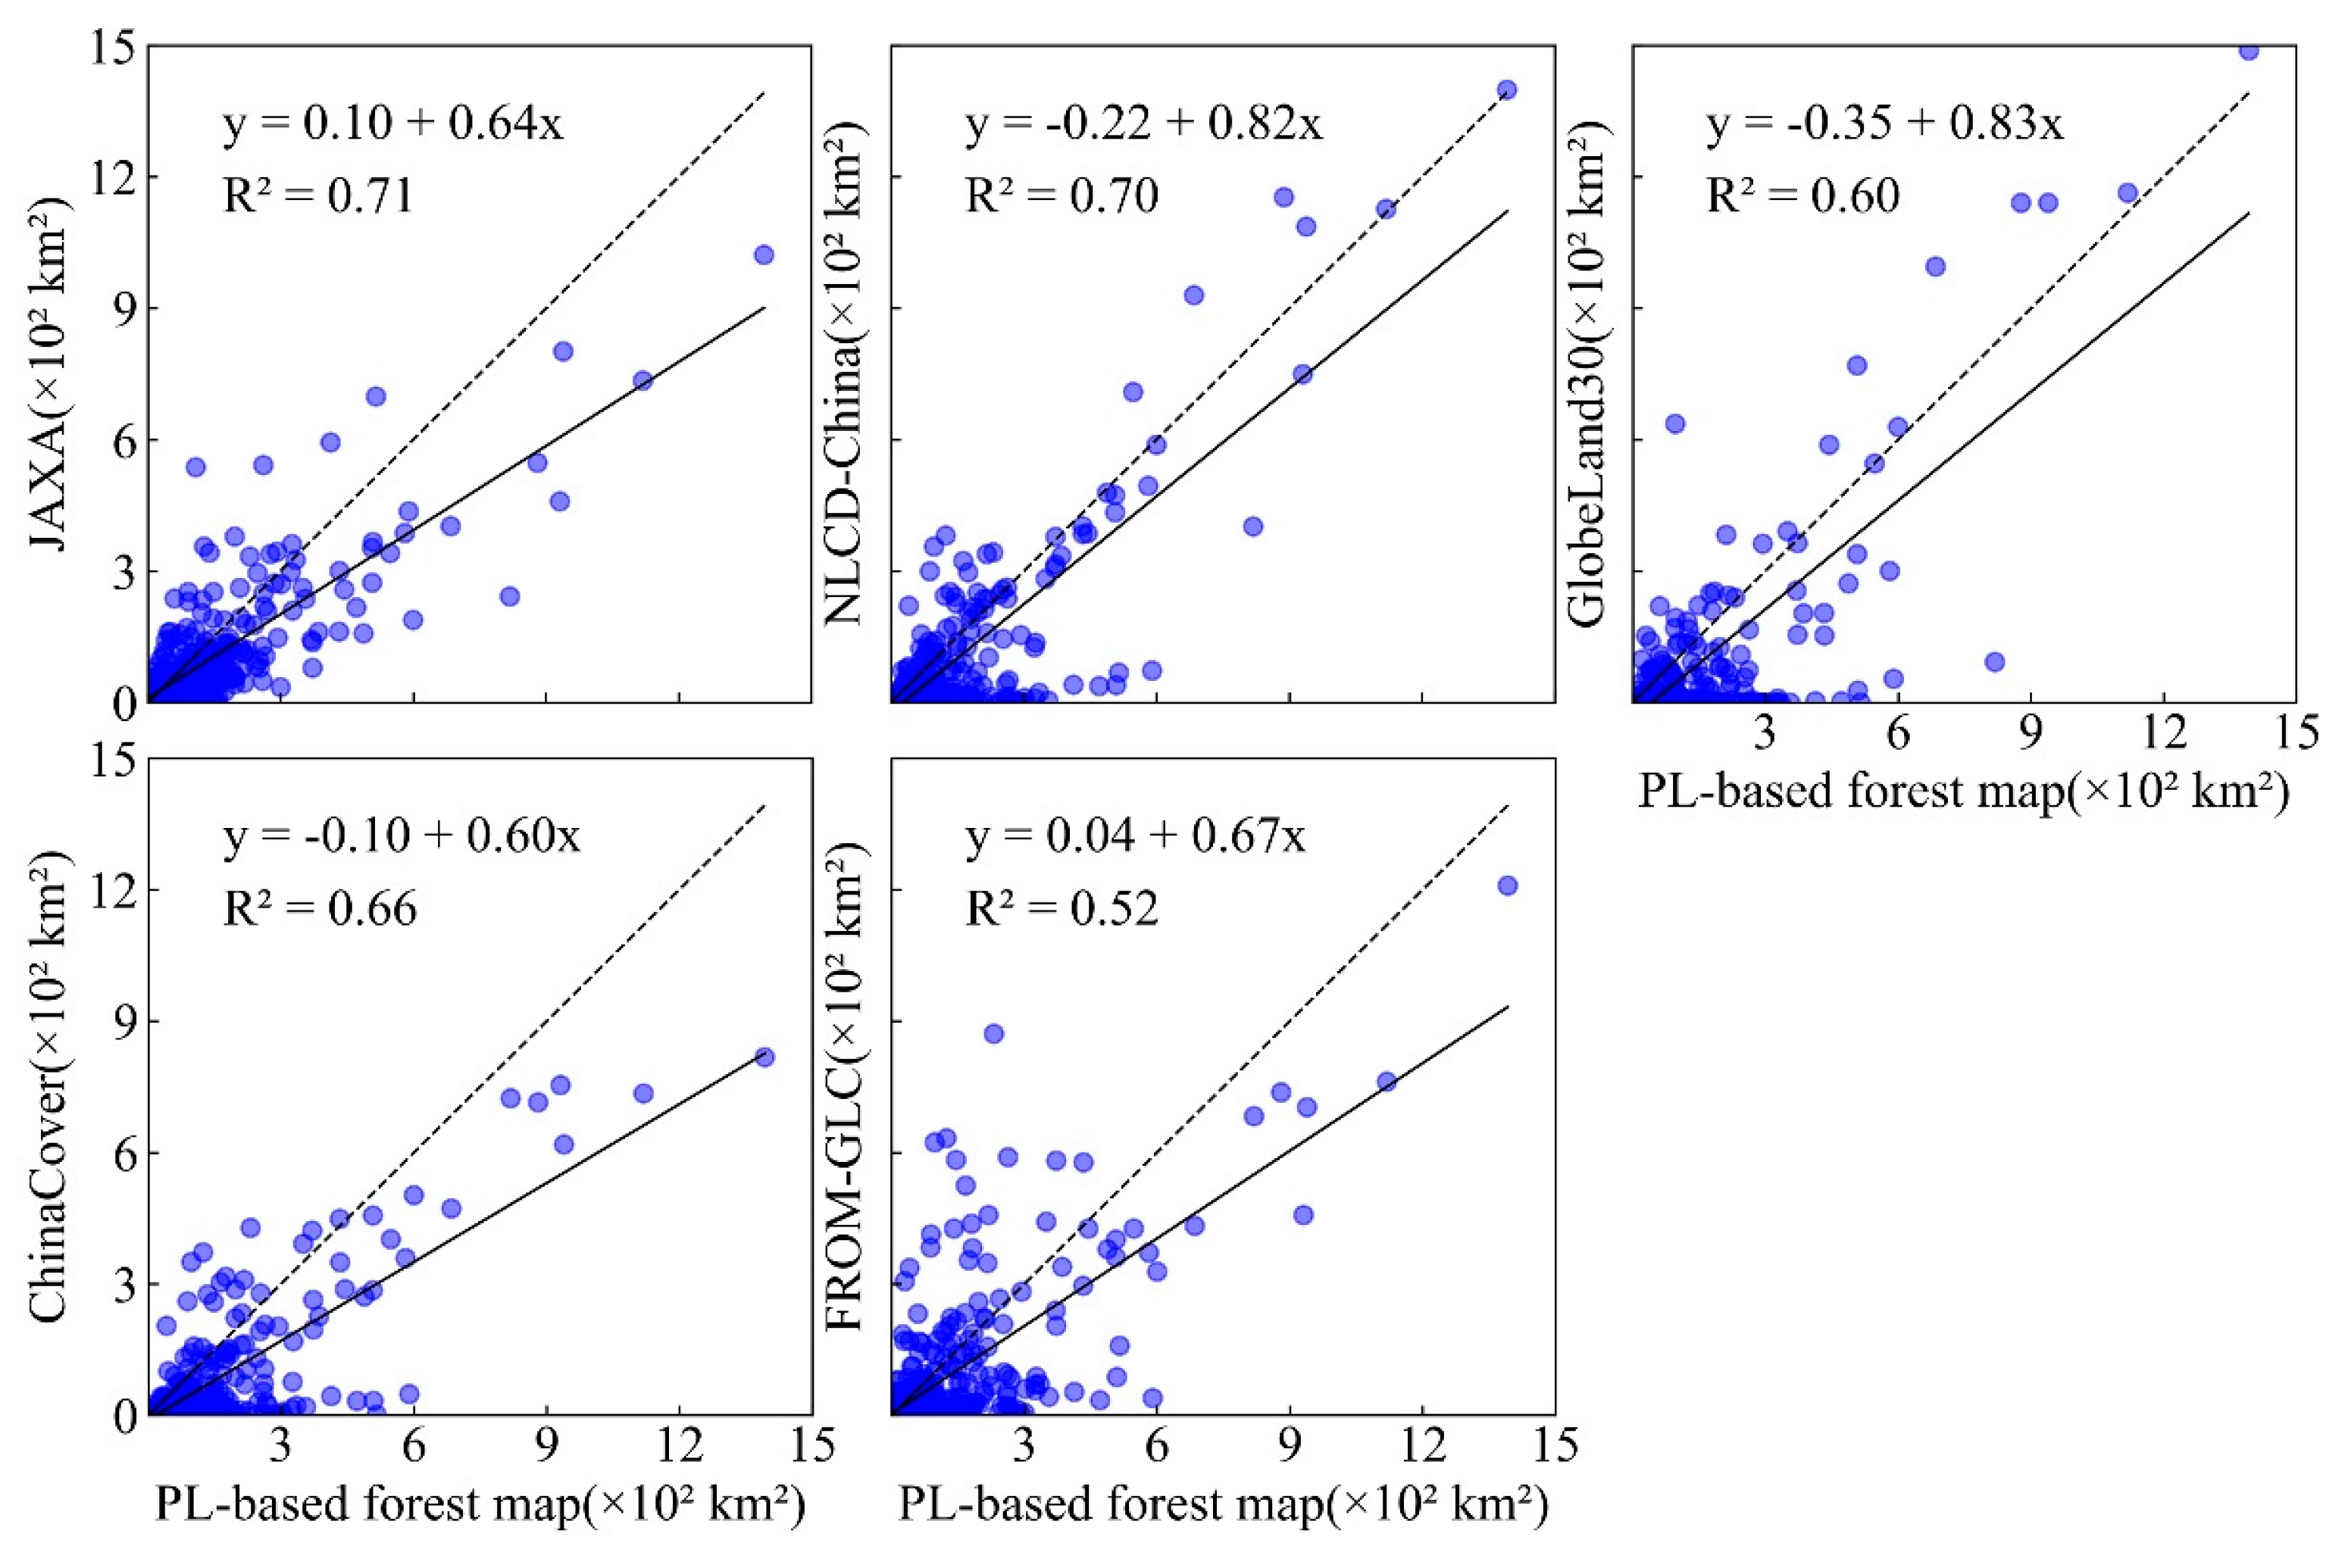
At the county scale, the good linear relationships between the PL-based and the other forest maps are found (Figure 8). The forest area of the PL-based map has a stronger linear relationship with the JAXA and NLCD-China forest maps (R2 = 0.71 and 0.70), but a weaker linear relationship with those of GlobeLand30, ChinaCover, and FROM-GLC forest maps; the value of R2 was 0.60, 0.66, and 0.52, respectively. The optical products tend to have lower forest area due to the forest area of partial counties being underestimated. The result of the linear relationships agrees with the accuracy of these forest maps in the plain region.
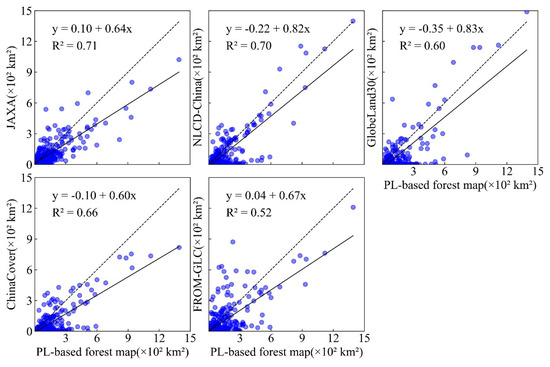
Figure 8.
Relationships of different forest maps in terms of county-level areas, using the PL-based forest map as the reference.
3.3. Spatial Consistency among the PL-Based and the Other Five Forest Maps
At the pixel scale, the spatial consistency and uncertainties are presented in Figure 9. The good spatial consistency mainly occurred in the mountain region with higher forest coverage, such as the Taihang Mountains. However, the low spatial consistency is widely distributed in the plain region with lower forest coverage, such as mainly agricultural zones in Shandong and Henan provinces.
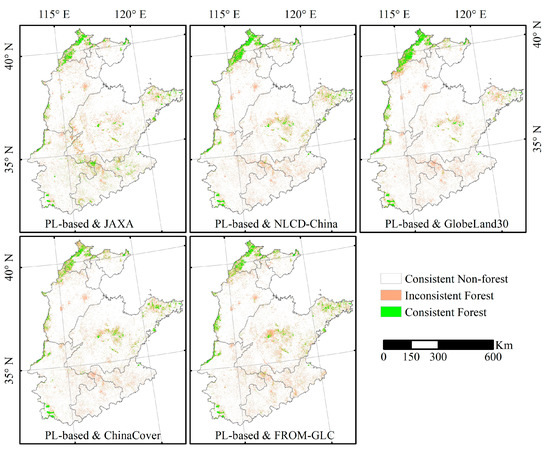
Figure 9.
Spatial comparison between the PL-based and other forest maps.
In detail, the spatial consistency index of the forests between PL-based and other forest maps is relatively low. In the NCP (Figure 10a), the highest spatial consistency index of the forests is presented between the NLCD-China and GlobeLand30 forest maps (0.58), while the lowest spatial consistency index of the forests is shown between the JAXA and FROM-GLC forest maps (0.28), and the spatial consistency index of the forests between PL-based and JAXA forest maps is 0.36. In the mountain region (Figure 10b), the highest spatial consistency index of the forests is presented between the NLCD-China and GlobeLand30 forest maps (0.63), while the lowest spatial consistency index of the forests is shown between JAXA and ChinaCover forest maps (0.48). In the plain region (Figure 10c), the highest spatial consistency index of the forests is presented between the PL-based and JAXA forest maps (0.24), while the lowest spatial consistency index of the forests is shown between the JAXA and GlobeLand30 forest maps (0.01). It is remarkable that the NLCD-China, Globeland30, ChinaCover, and FROM-GLC forest maps are generated based on Landsat data, which has a higher spatial consistency index of forests with each other, while the PL-based and JAXA forest maps are generated based on PALSAR data, which have lower spatial consistency index of forests with optical products.

Figure 10.
The spatial consistency index values among the six forest maps in the: (a) North China Plain (NCP); (b) mountain region; and (c) plain region.
3.4. Distribution of Areas with Different Forest Densities
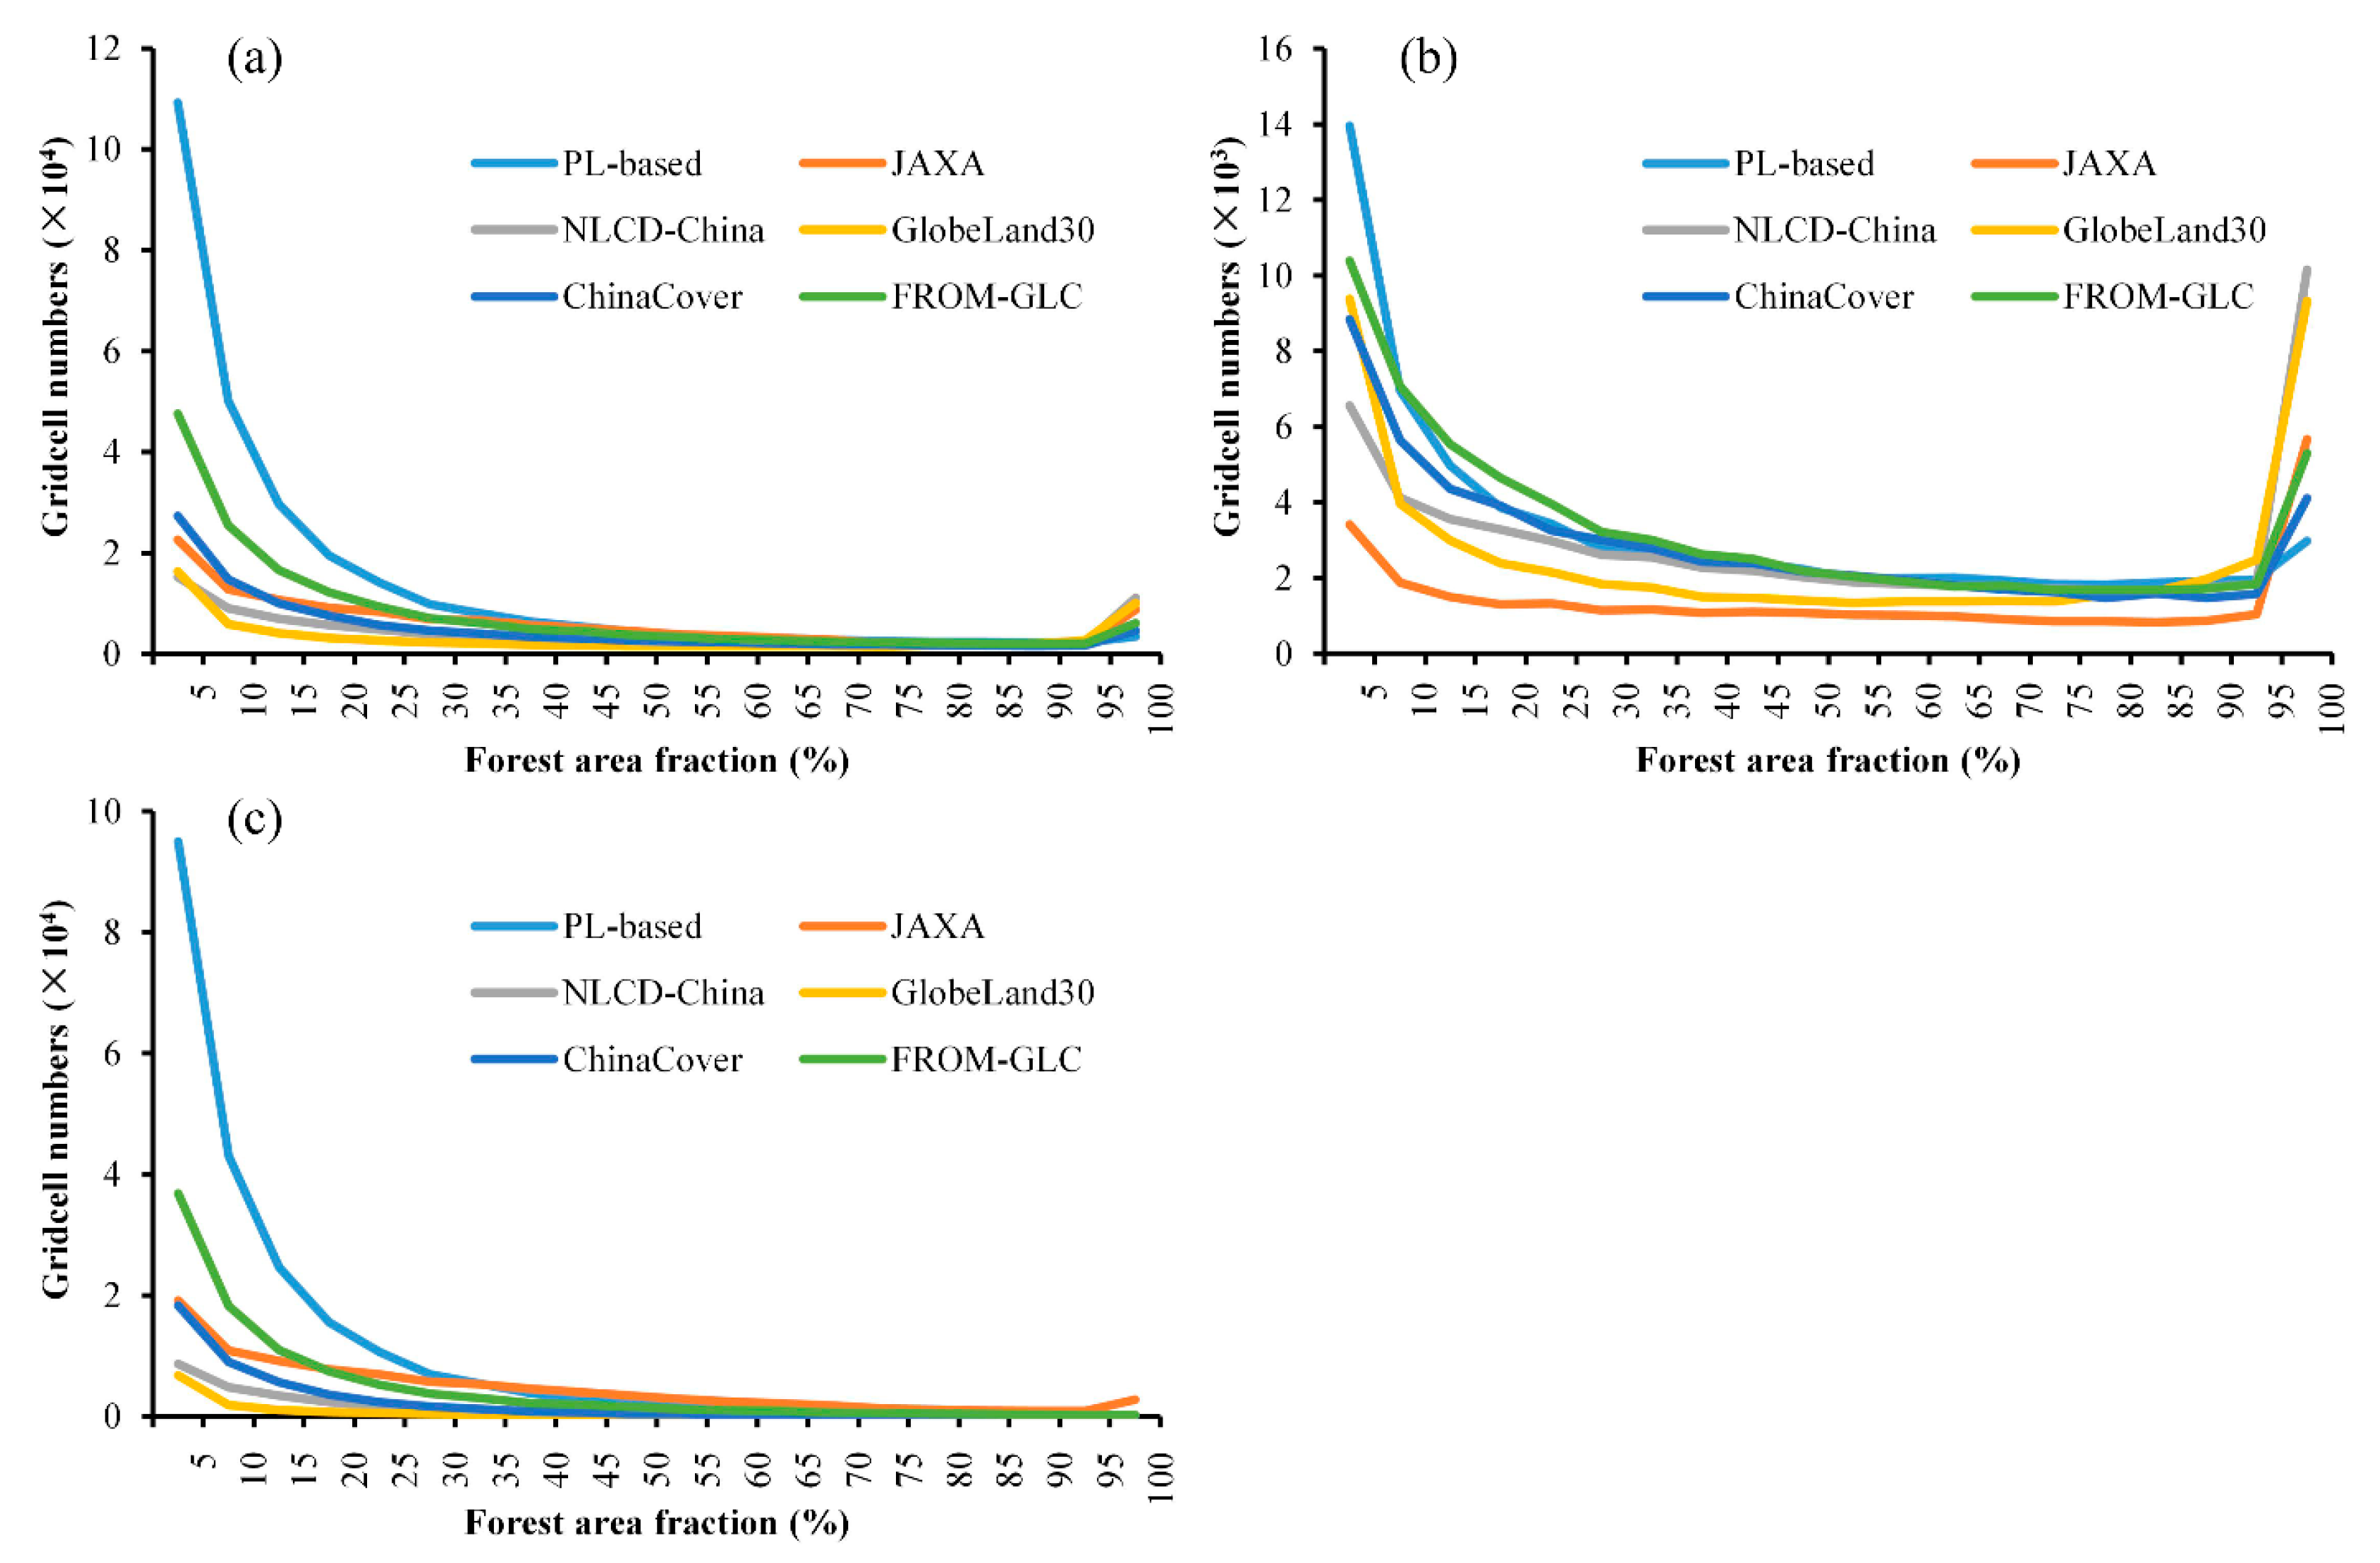
The PL-based forest map can capture more details of forests, i.e., forest patches, than the other five forest maps (Figure 6). Here, we aggregate the 30-m forest maps into 900-m gridcells with forest fraction values, to investigate the frequency of different sizes of forest patches. Figure 11 shows the distribution of areas with different forest densities using the forest fractional gridcells at 900-m resolution. The results show that the PL-based forest map has a higher frequency in the low forest proportion gradients than the other five forest maps, followed by the FROM-GLC (Figure 11a). That means the low proportion of forests can be better identified in the PL-based forest map.
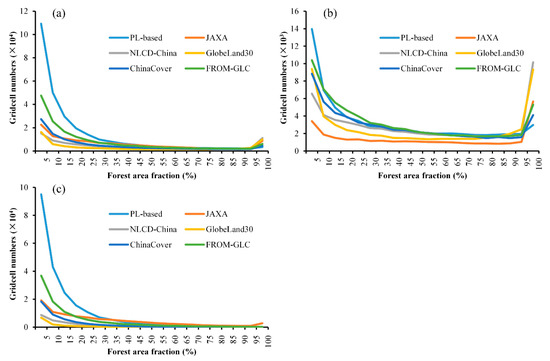
Figure 11.
The distribution of different intensity of forest fraction gridcells at 900-m resolution in the; (a) North China Plain (NCP); (b) mountain region; and (c) plain region according to the six different forest maps.
A similar result can also be found in the mountain and plain region, according to the analogous broken line graphs shown in Figure 11b,c. Specifically, the PL-based forest map presents a robust and stable ability to identify the low proportion of forests in the mountain and plain region, while the other forest maps have lower estimates in the areas with low forest density. To be specific, the Landsat-based forest maps have a higher intensity in the forest proportion gradients in the mountain region than in the plain region. Compared to the other forest maps, the JAXA forest map shows a lower intensity in the forest proportion gradients in the mountain region due to higher omission error, while it shows higher in the plain region. The gap between PL-based and Landsat-based forest maps is smaller in the mountain region than in the plain region. Along with the increase of forest proportion gradients, forests tend to be easily identified and omission errors decreased among the six forest maps.
4. Discussion
4.1. Advantages of Forest Mapping through Integrating PALSAR and Landsat Data
In this study, a new forest map at the spatial resolution of 30-m was generated, through integrating 25-m PALSAR data and 30-m Landsat TM/ETM+ images in the NCP. In a previous study, Qin et al. [40] generated a 50-m forest map based on 50-m PALSAR data and 250-m MODIS data in China in 2010. We further improved the method by applying 30-m Landsat images, which can better exclude built-up caused commission errors. Hence, the PL-based forest map integrated the advantages of forest structural information from L-band PALSAR data and spectral information from Landsat data. Compared with other forest maps based on single PALSAR or Landsat data, the PL-based forest map had highest accuracy in the study area (Table 2).
We also tested the data level fusion-based forest mapping method in this study (Supplemental Information). However, we found that the accuracy of that map is lower than the accuracy from this study (Table S1). That could be related to the time mismatch of the mosaicked PALSAR and Landsat images. A data fusion based on the original PALSAR and Landsat images with close dates could be more reasonable; however, it cannot be achieved due to the data unavailability of original PALSAR data. Therefore, we did not include the data level fusion-based forest map for inter-comparison in the main text. That approach will be considered in a future study.
Moreover, we found that the PALSAR-based forest maps had a higher accuracy than those based on Landsat in the traditional agricultural zone. In the NCP, the trees are mainly planted along the highways, croplands, or surrounding villages, and the forest areas in these regions were vastly underestimated according to the Landsat-based forest maps. The missing forest information in Landsat-based products was largely attributed to the mixture pixel issue. Both forests and high-biomass crops have high greenness values and their features are similar in the peak of the growing season, and forests tend to be misclassified as non-forests [15]. In contrast, the PALSAR data can penetrate the canopy of the forests using its L-band that allows vertical structure information usable for forest mapping. Moreover, the consistency between PALSAR and Landsat-based forest maps were higher in the mountain regions (Figure 6) while much lower in the plain regions. That showed the Landsat-based forest maps tended to have higher omission errors in low forest density areas while their accuracy was higher in high forest density area, which agreed with the previous study [15] about forest underestimation in low forest intensity drylands.
4.2. Uncertainty between the PL-Based and Other Forest Maps
Although the PL-based forest map showed a good spatial distribution and accuracy in the NCP, some uncertainties still existed. The first uncertainty comes from the data source. The PALSAR data were acquired from June to October, and the classification accuracy could be influenced by seasonal land changes during the period of June to October. For example, the radar backscatter of crops could increase in the growing season and a decrease in the harvest season of crops [21]. Hence, these pixels influenced by seasonal land changes could be misclassified by using annually composited images.
The second uncertainty resulted from the forest definition. The definition of forest was considered to play a critical role in the assessment of forest area [45]. In this study, we adopted the same definition of forest as that of JAXA and FAO: tree cover over 10% and tree height over 5-m. The forest area according to the PL-based forest map was 4.46 m ha in the NCP. Compared with the PL-based forest map, the NLCD-China and GlobeLand30 forest maps used a looser forest definition (only tree cover over 10%, no criteria for tree height); however, their forest areas were estimated less than the PL-based forest map (2.68 and 2.13 m ha, respectively). That could be related to the limitation of optical satellite data in separating forests and high-biomass crops. Although the PL-based forest map and the JAXA forest map adopted the same definition, the forest area according to the JAXA forest map (3.28 m ha) was also less than that of the PL-based forest map. The primary reason was that the JAXA forest map had a higher omission error than the PL-based forest map in the mountain regions. The application of the tree height over 5-m criteria was also challenging due to the reliability of training and validation samples. The PALSAR data are more correlated with tree structure and height; therefore, the involvement of PALSAR data could provide a more robust estimate in terms of tree height, than that based on the single optical data.
The third uncertainty derived from the algorithms of forest mapping. The PL-based forest map was produced based on a robust algorithm from our previous study, which adopted the improved thresholds for the algorithm and the involvement of finer resolution Landsat imagery. Our previous studies proved the reliability of uniform threshold values [40]. The JAXA forest map [2] provided a decision tree algorithm with smaller HV threshold values than the PL-based forest map; in addition, the object-based analyses after a segmentation process may cause the loss of sparse forest patches [2]. Hence, the JAXA forest map tended to miss those regions with lower forest coverage. The GlobeLand30 and ChinaCover also adopted a pixel-object-knowledge-based (POK-based) classification approach and an object-oriented classification algorithm, respectively. The segmentation processes could also introduce some potential information loss about sparse forests. The NLCD-China forest map was generated based on a visual interpretation approach. Compared with the PL-based forest map, this approach needed massive costs to achieve, and the accuracy of forest mapping relied on the experiences of professionals.
4.3. Implications for Future Forest Mapping
Compared with the other forest maps, the PL-based forest map in this study showed a higher accuracy and could discriminate more agroforests in the NCP, especially in the plain agricultural production regions. As the agroforests were mainly distributed along the croplands or surrounding villages, they had a direct impact on human livelihood and ecosystem services. For example, agroforests around villages can provide functions of greenery, embellishment, and shade; agroforests around croplands, named shelter-belt trees, can provide the function of water cleaning through reducing nutrient and soil runoff. These shelter-belt trees on croplands were widely distributed in the NCP and were established with a limited width, which can be discriminated by the PL-based forest map at 30-m resolution. Moreover, the shelter-belt trees on croplands also play an important role in regulating regional climate [52,53,54], including decreasing wind speed, regulating temperature, and increasing atmospheric humidity. Currently, the construction of shelter-belt trees on croplands still has some deficiencies owing to lack of data about its distribution. The PL-based forest map can provide detailed spatial distribution information, which has important implications for forest management. In addition, agroforest planting could contribute to food security by restoring the soil fertility for food crops in the typical agricultural area, while superfluous forest planting could occupy more croplands and threaten food security. Thus, how to make better use of the PL-based forest map to manage the agroforest resources is an important issue.
Accurate assessment of carbon budget was vital to acquaint the global carbon cycle and contemplate future climate change, especially in the context of global warming. Annual estimates due to deforestation and land use changes are still uncertain, and most of the underlying data cannot provide accurate forest information [55]. In this case, by picking up the missed agroforest information in the agricultural zone, carbon budget can be estimated with a higher accuracy [56]. The PL-based forest map integrated the advantage of forest spatial structural information and spectral information and can identify more detailed biomass information, which can help to reduce the uncertainty of the carbon budget.
5. Conclusions
Forest information is critical for assessing changes in biodiversity, carbon and water cycles in typical agricultural zones, and for supporting conservation management. However, several forest maps have large uncertainties in describing forests, owing to the differences of definitions, algorithms, and data sources. In this study, we generated a PL-based forest map with 30-m spatial resolution based on a decision tree approach, through integrating 25-m PALSAR data and 30-m Landsat TM/ETM+ images in the NCP from circa 2010. The PL-based forest map showed a higher overall accuracy (95 ± 1%) and Kappa coefficient (0.86). In the densely forested regions, all forest maps showed higher accuracies, while in plain regions the PL-based forest map showed higher accuracy than those from Landsat. We also found that the PL-based had the highest forest area (4.46 m ha) in the NCP, while the Landsat-based forest maps underestimated forest area (ranging from 2.13–3.15 m ha), especially in the plain region, mainly caused by a higher omission error. This indicated that the integration of PALSAR and Landsat data has more advantages in estimating forest area than that based on Landsat in the traditional agricultural production regions. This study suggested a promising approach to identify agroforests by integrating PALSAR and Landsat data in the future. The resultant PL-based forest map is expected to provide timely and effective information for guiding forest and agricultural management in this typical agricultural zone. In the future, the increasing availability of optical and microwave sensors could promote the data fusion and integration of different data sources, and further improve our capability for forest monitoring, carbon budget estimation, and agricultural management.
Supplementary Materials
The followings are available online at http://www.mdpi.com/2072-4292/10/9/1323/s1. Figure S1: The NDVImax histogram of training ROIs of forests and buildings; Figure S2: (a) RGB composite based on the fusion of Landsat and PALSAR imagery at data level in the North China Plain (NCP) in 2010 (R = Bnir, G = Bred, and B = Bgreen), (b) spatial distribution of training ROIs in the North China Plain (NCP); Figure S3: (a) Spatial distribution of the PL-based forest map, and (b) the fusion data-based forest map in the North China Plain (NCP) in 2010; Table S1: Confusion matrix of accuracy assessments of the PL-based and the fusion data-based forest map forest maps.
Author Contributions
J.D., X.X., and Z.Y. conceived and designed the experiments; Z.Y., W.C. performed the experiments; J.D., Z.Y., Y.Q., G.Z., W.C. analyzed the data; Z.Y. and J.D. wrote the paper; W.N., B.C., W.K., J.W. provided critical comments to improve the paper.
Funding
This study is funded by the Strategic Priority Research Program (XDA19040301) and Key Research Program of Frontier Sciences (QYZDB-SSW-DQC005) of the Chinese Academy of Sciences (CAS), the Open Fund of State Key Laboratory of Remote Sensing Science (OFSLRSS201606), the National Natural Science Foundation of China (31760181, 31400493), and International Fellowship Initiative, Institute of Geographic Sciences and Natural Resources Research, CAS (2017VP02).
Acknowledgments
The authors would like to thank the reviewers and editors who provided valuable comments and suggestions for this article.
Conflicts of Interest
The authors declare no conflict of interest.
References
- Foley, J.A.; DeFries, R.; Asner, G.P.; Barford, C.; Bonan, G.; Carpenter, S.R.; Chapin, F.S.; Coe, M.T.; Daily, G.C.; Gibbs, H.K. Global consequences of land use. Science 2005, 309, 570–574. [Google Scholar] [CrossRef] [PubMed]
- Shimada, M.; Itoh, T.; Motooka, T.; Watanabe, M.; Shiraishi, T.; Thapa, R.; Lucas, R. New global forest/non-forest maps from ALOS PALSAR data (2007–2010). Remote Sens. Environ. 2014, 155, 13–31. [Google Scholar] [CrossRef]
- Aubinet, M.; Grelle, A.; Ibrom, A.; Rannik, U.; Moncrieff, J.; Foken, T.; Kowalski, A.S.; Martin, P.H.; Berbigier, P.; Bernhofer, C.; et al. Estimates of the annual net carbon and water exchange of forests: The EUROFLUX methodology. Adv. Ecol. Res. 2000, 30, 113–175. [Google Scholar]
- Li, Y.; Yang, X.G.; Wang, W.F.; Chen, F. The possible effects of global warming on cropping systems in china: V. The possible effects of climate warming on geographical shift in safe northern limit of tropical crops and the risk analysis of cold damage in China. Sci. Agric. Sin. 2011, 44, 2876–2885. [Google Scholar]
- Dixon, R.K.; Winjum, J.K.; Schroeder, P.E. Conservation and sequestration of carbon - the potential of forest and agroforest management-practices. Glob. Environ. Chang. 1993, 3, 159–173. [Google Scholar] [CrossRef]
- Jose, S. Agroforestry for ecosystem services and environmental benefits: An overview. Agrofor. Syst. 2009, 76, 1–10. [Google Scholar] [CrossRef]
- Lal, R. Soil carbon sequestration impacts on global climate change and food security. Science 2004, 304, 1623–1627. [Google Scholar] [CrossRef] [PubMed]
- Albrecht, A.; Kandji, S.T. Carbon sequestration in tropical agroforestry systems. Agric. Ecosyst. Environ. 2003, 99, 15–27. [Google Scholar] [CrossRef]
- Rhr, S.; Vidal, D.B.; Piasentin, F.B.; Jardim, J.G.; Viana, T.G.; Menezes, A.A.; Dln, M.; Ahnert, D.; Baligar, V.C. Cabruca agroforests in southern Bahia, Brazil: Tree component, management practices and tree species conservation. Biodivers. Conserv. 2012, 21, 1055–1077. [Google Scholar]
- Perfecto, I.; Vandermeer, J. Biodiversity conservation in tropical agroecosystems. Ann. N. Y. Acad. Sci. 2008, 1134, 173–200. [Google Scholar] [CrossRef] [PubMed]
- Bhagwat, S.A.; Willis, K.J.; Birks, H.J.B.; Whittaker, R.J. Agroforestry: A refuge for tropical biodiversity? Trends Ecol. Evol. 2008, 23, 261–267. [Google Scholar] [CrossRef] [PubMed]
- Zomer, R.J.; Neufeldt, H.; Xu, J.C.; Ahrends, A.; Bossio, D.; Trabucco, A.; van Noordwijk, M.; Wang, M.C. Global tree cover and biomass carbon on agricultural land: The contribution of agroforestry to global and national carbon budgets. Sci. Rep. 2016, 6, 29987. [Google Scholar] [CrossRef] [PubMed]
- Hansen, M.C.; Stehman, S.V.; Potapov, P.V.; Loveland, T.R.; Townshend, J.R.; Defries, R.S.; Pittman, K.W.; Arunarwati, B.; Stolle, F.; Steininger, M.K. Humid tropical forest clearing from 2000 to 2005 quantified by using multitemporal and multiresolution remotely sensed data. Proc. Natl. Acad. Sci. USA 2008, 105, 9439–9444. [Google Scholar] [CrossRef] [PubMed]
- Schnell, S.; Kleinn, C.; Ståhl, G. Monitoring trees outside forests: A review. Environ. Monit. Assess. 2015, 187, 600. [Google Scholar] [CrossRef] [PubMed]
- Bastin, J.-F.; Berrahmouni, N.; Grainger, A.; Maniatis, D.; Mollicone, D.; Moore, R.; Patriarca, C.; Picard, N.; Sparrow, B.; Abraham, E.M.; et al. The extent of forest in dryland biomes. Science 2017, 356, 635–638. [Google Scholar] [CrossRef] [PubMed]
- De, B.M.; Aerts, R.; Honnay, O. A global meta-analysis of the biodiversity and ecosystem service benefits of coffee and cacao agroforestry. Agric. Ecosyst. Environ. 2013, 175, 1–7. [Google Scholar]
- Hansen, M.C.; Stehman, S.V.; Potapov, P.V. Quantification of global gross forest cover loss. Proc. Natl. Acad. Sci. USA 2010, 107, 8650–8655. [Google Scholar] [CrossRef] [PubMed]
- Deo, R.K.; Russell, M.B.; Domke, G.M.; Woodall, C.W.; Falkowski, M.J.; Cohen, W.B. Using Landsat time-series and LIDAR to inform aboveground forest biomass baselines in northern Minnesota, USA. Can. J. Remote Sens. 2017, 43, 28–47. [Google Scholar] [CrossRef]
- Kovacs, J.M.; Lu, X.X.; Flores-Verdugo, F.; Zhang, C.; Santiago, F.F.D.; Jiao, X. Applications of ALOS PALSAR for monitoring biophysical parameters of a degraded black mangrove (Avicennia germinans) forest. ISPRS J. Photogramm. Remote Sens. 2013, 82, 102–111. [Google Scholar] [CrossRef]
- Lucas, R.M.; Cronin, N.; Lee, A.; Moghaddam, M.; Witte, C.; Tickle, P. Empirical relationships between AIRSAR backscatter and LIDAR-derived forest biomass, Queensland, Australia. Remote Sens. Environ. 2006, 99, 407–425. [Google Scholar] [CrossRef]
- Baghdadi, N.; Boyer, N.; Todoroff, P.; Hajj, M.E.; Bégué, A. Potential of SAR sensors TerraSAR-X, ASAR/ENVISAT and PALSAR/ALOS for monitoring sugarcane crops on Reunion Island. Remote Sens. Environ. 2009, 113, 1724–1738. [Google Scholar] [CrossRef]
- Ju, J.; Roy, D.P. The availability of cloud-free Landsat ETM+ data over the conterminous United States and globally. Remote Sens. Environ. 2008, 112, 1196–1211. [Google Scholar] [CrossRef]
- Chen, B.; Li, X.; Xiao, X.; Zhao, B.; Dong, J.; Kou, W.; Qin, Y.; Yang, C.; Wu, Z.; Sun, R. Mapping tropical forests and deciduous rubber plantations in Hainan Island, China by integrating PALSAR 25-m and multi-temporal Landsat images. Int. J. Appl. Earth Obs. Geoinf. 2016, 50, 117–130. [Google Scholar] [CrossRef]
- Reiche, J.; Lucas, R.; Mitchell, A.L.; Verbesselt, J.; Hoekman, D.H.; Haarpaintner, J.; Kellndorfer, J.M.; Rosenqvist, A.; Lehmann, E.A.; Woodcock, C.E. Combining satellite data for better tropical forest monitoring. Nat. Clim. Chang. 2016, 6, 120–122. [Google Scholar] [CrossRef]
- Erasmi, S.; Twele, A. Regional land cover mapping in the humid tropics using combined optical and SAR satellite data—A case study from Central Sulawesi, Indonesia. Int. J. Remote Sens. 2009, 30, 2465–2478. [Google Scholar] [CrossRef]
- Walker, W.S.; Stickler, C.M.; Kellndorfer, J.M.; Kirsch, K.M.; Nepstad, D.C. Large-area classification and mapping of forest and land cover in the Brazilian amazon: A comparative analysis of ALOS/PALSAR and Landsat data sources. IEEE J. Sel. Top. Appl. Earth Obs. Remote Sens. 2010, 3, 594–604. [Google Scholar] [CrossRef]
- Lehmann, E.A.; Caccetta, P.A.; Zhou, Z.S.; Mcneill, S.J.; Wu, X.; Mitchell, A.L. Joint processing of Landsat and ALOS-PALSAR data for forest mapping and monitoring. IEEE Trans. Geosci. Remote Sens. 2011, 50, 55–67. [Google Scholar] [CrossRef]
- Qin, Y.; Xiao, X.; Wang, J.; Dong, J.; Ewing, K.; Hoagland, B.; Hough, D.; Fagin, T.; Zou, Z.; Geissler, G.; et al. Mapping annual forest cover in sub-humid and semi-arid regions through analysis of Landsat and PALSAR imagery. Remote Sens. 2016, 8, 933. [Google Scholar] [CrossRef]
- Qin, Y.; Xiao, X.; Dong, J.; Zhou, Y.; Wang, J.; Doughty, R.B.; Chen, Y.; Zou, Z.; Moore, B.; Qin, Y. Annual dynamics of forest areas in South America during 2007–2010 at 50-m spatial resolution. Remote Sens. Environ. 2017, 201, 73–87. [Google Scholar] [CrossRef]
- Song, W.; Deng, X.; Yuan, Y.; Wang, Z.; Li, Z. Impacts of land-use change on valued ecosystem service in rapidly urbanized North China Plain. Ecol. Model. 2015, 318, 245–253. [Google Scholar] [CrossRef]
- Mcvicar, T.R.; Zhang, G.; Bradford, A.S.; Wang, H.; Dawes, W.R.; Zhang, L.; Li, L.; Bradford, A.S. Monitoring regional agricultural water use efficiency for Hebei Province on the North China Plain. Crop Pasture Sci. 2002, 53, 55–76. [Google Scholar] [CrossRef]
- Jeong, S.J.; Ho, C.H.; Piao, S.; Kim, J.; Ciais, P.; Lee, Y.B.; Jhun, J.G.; Park, S.K. Effects of double cropping on summer climate of the North China Plain and neighbouring regions. Nat. Clim. Chang. 2014, 4, 615–619. [Google Scholar] [CrossRef]
- Lu, C.; Fan, L. Winter wheat yield potentials and yield gaps in the North China Plain. Field Crops Res. 2013, 143, 98–105. [Google Scholar] [CrossRef]
- Shimada, M.; Ohtaki, T. Generating large-scale high-quality SAR mosaic datasets: Application to PALSAR data for global monitoring. IEEE J. Sel. Top. Appl. Earth Obs. Remote Sens. 2010, 3, 637–656. [Google Scholar] [CrossRef]
- Rosenqvist, A.; Shimada, M.; Ito, N.; Watanabe, M. ALOS PALSAR: A pathfinder mission for global-scale monitoring of the environment. IEEE Trans. Geosci. Remote Sens. 2007, 45, 3307–3316. [Google Scholar] [CrossRef]
- Shimada, M.; Isoguchi, O.; Tadono, T.; Isono, K. PALSAR radiometric and geometric calibration. IEEE Trans. Geosci. Remote Sens. 2009, 47, 3915–3932. [Google Scholar] [CrossRef]
- Miettinen, J.; Liew, S.C. Separability of insular Southeast Asian woody plantation species in the 50 m resolution ALOS PALSAR mosaic product. Remote Sens. Lett. 2011, 2, 299–307. [Google Scholar] [CrossRef]
- Dong, J.; Xiao, X.; Sheldon, S.; Biradar, C.; Duong, N.D.; Hazarika, M. A comparison of forest cover maps in Mainland Southeast Asia from multiple sources: PALSAR, MERIS, MODIS and FRA. Remote Sens. Environ. 2012, 127, 60–73. [Google Scholar] [CrossRef]
- Gamon, J.A.; Field, C.B.; Goulden, M.L.; Griffin, K.L.; Hartley, A.E.; Joel, G. Relationships between NDVI, canopy structure, and photosynthesis in three Californian vegetation types. Ecol. Appl. 1995, 5, 28–41. [Google Scholar] [CrossRef]
- Qin, Y.; Xiao, X.; Dong, J.; Zhang, G.; Shimada, M.; Liu, J.; Li, C.; Kou, W.; Moore, B., III. Forest cover maps of China in 2010 from multiple approaches and data sources: PALSAR, Landsat, MODIS, FRA, and NFI. ISPRS J. Photogramm. Remote Sens. 2015, 109, 1–16. [Google Scholar] [CrossRef]
- Zhu, Z.; Woodcock, C.E. Automated cloud, cloud shadow, and snow detection in multitemporal Landsat data: An algorithm designed specifically for monitoring land cover change. Remote Sens. Environ. 2014, 152, 217–234. [Google Scholar] [CrossRef]
- Zhu, Z.; Wang, S.; Woodcock, C.E. Improvement and expansion of the Fmask algorithm: Cloud, cloud shadow, and snow detection for Landsats 4–7, 8, and Sentinel 2 images. Remote Sens. Environ. 2015, 159, 269–277. [Google Scholar] [CrossRef]
- Rao, J.N.K. Interplay between sample survey theory and practice: An appraisal. Surv. Methodol. 2005, 31, 117–138. [Google Scholar]
- Potere, D. Horizontal positional accuracy of google earth’s high-resolution imagery archive. Sensors 2008, 8, 7973–7981. [Google Scholar] [CrossRef] [PubMed]
- Yang, Y.; Xiao, P.; Feng, X.; Li, H. Accuracy assessment of seven global land cover datasets over China. ISPRS J. Photogramm. Remote Sens. 2017, 125, 156–173. [Google Scholar] [CrossRef]
- Mayaux, P. Validation of the global land cover 2000 map. IEEE Trans. Geosci. Remote Sens. 2006, 44, 1728–1739. [Google Scholar] [CrossRef]
- Liu, J.Y.; Liu, M.L.; Tian, H.Q.; Zhuang, D.F.; Zhang, Z.X.; Zhang, W.; Tang, X.M.; Deng, X.Z. Spatial and temporal patterns of China’s cropland during 1990–2000: An analysis based on Landsat TM data. Remote Sens. Environ. 2005, 98, 442–456. [Google Scholar] [CrossRef]
- Chen, J.; Chen, J.; Liao, A.; Cao, X.; Chen, L.; Chen, X.; He, C.; Han, G.; Peng, S.; Lu, M.; et al. Global land cover mapping at 30 m resolution: A POK-based operational approach. ISPRS J. Photogramm. Remote Sens. 2015, 103, 7–27. [Google Scholar] [CrossRef]
- Wu, B.; Yuan, Q.; Yan, C.; Wang, Z.; Yu, X.; Li, A.; Ma, R.; Huang, J.; Chen, J.; Chang, C. Land cover changes of China from 2000 to 2010. Quat. Sci. 2014, 34, 723–731. [Google Scholar]
- Gong, P.; Wang, J.; Yu, L.; Zhao, Y.; Zhao, Y.; Liang, L.; Niu, Z.; Huang, X.; Fu, H.; Liu, S.; et al. Finer resolution observation and monitoring of global land cover: First mapping results with Landsat TM and ETM+ data. Int. J. Remote Sens. 2013, 34, 2607–2654. [Google Scholar] [CrossRef]
- Olofsson, P.; Foody, G.M.; Herold, M.; Stehman, S.V.; Woodcock, C.E.; Wulder, M.A. Good practices for estimating area and assessing accuracy of land change. Remote Sens. Environ. 2014, 148, 42–57. [Google Scholar] [CrossRef]
- Zha, T. Structure and microclimate effects of shelter-belt on farmland in Ningxia. Sci. Soil Water Conserv. 2004, 2, 82–86. [Google Scholar]
- Zheng, X.; Zhu, J.J.; Yan, Y. Estimation of farmland shelterbelt area in the Three-North Shelter / Protective Forest Program regions of China based on multi-scale remote sensing data. Chin. J. Ecol. 2013, 1355–1363. [Google Scholar]
- Wang, H.; Hao, Z. A simulation study on the eco-environmental effects of 3N Shelterbelt in North China. Glob. Planet. 2003, 37, 231–246. [Google Scholar]
- Le Quéré, C.; Andres, R.J.; Boden, T.; Conway, T.; Houghton, R.A.; House, J.I.; Marland, G.; Peters, G.P.; Van der Werf, G.; Ahlström, A. The global carbon budget 1959–2011. Earth Syst. Sci. Data Discuss. 2012, 5, 1107–1157. [Google Scholar] [CrossRef]
- Schnell, S.; Altrell, D.; Ståhl, G.; Kleinn, C. The contribution of trees outside forests to national tree biomass and carbon stocks—A comparative study across three continents. Environ. Monit. Assess. 2015, 187, 4197. [Google Scholar] [CrossRef] [PubMed]
© 2018 by the authors. Licensee MDPI, Basel, Switzerland. This article is an open access article distributed under the terms and conditions of the Creative Commons Attribution (CC BY) license (http://creativecommons.org/licenses/by/4.0/).

