Abstract
The purpose of sea image enhancement is to enhance the information of the waves, whose contrast is generally weak. Enhancement effect is often affected by impulse-type noise and non-uniform illumination. In this paper, we propose a variational model for sea image enhancement using a solar halo model and a Retinex model. This paper mainly makes the following three contributions: 1. Establishing a Retinex model with noise suppression ability in sea images; 2. Establishing a solar-scattering halo model through sea image bitplane analysis; 3. Proposing a variational enhancement model combining the Retinex and halo models. The experimental results show that our method has a significant enhancement effect on sea surface images in different illumination environments compared with typical methods.
1. Introduction
Sea surface image enhancement is an important step in image preprocessing of marine remote sensing. By observing and processing enhanced sea surface background texture information, we can more accurately invert the ocean’s dynamic information from the sea surface or underwater. Sea images generally have more severe degradation than ordinary images with extremely low contrast, high noise, and non-uniform illumination. Therefore, the processing of sea images is difficult.
Frequently used image enhancement methods can include: histogram equalization (HE)-based enhancement methods, masking-based enhancement methods and Retinex-based enhancement methods, etc. Histogram equalization-based enhancement methods are based on the idea of stretching the dynamic range of an observed image, from inchoate global full gray-level histogram stretching methods [1,2] to the contrast-limited adaptive histogram equalization (CLAHE) method [3] and fast hue and range-preserving histogram method [4] proposed in recent years. Such methods mainly perform global stretching on the image according to the pixel gray value; however, they also amplify the influence of noise factors and illumination factors, leading to circumstances such as heavy noise and non-uniform illumination of sea images.
The masking-based method mainly performs band decomposition on images and enhances the details by a series of transformations and processing of high-frequency components, and then synthesizes the processed frequency bands to obtain enhanced images [5,6,7]. This method focuses on the design of reasonable frequency band decomposition methods and the selection of different frequency band enhancement methods according to different image characteristics. For example, Wang et al. [8] designed a multi-layer model and processed different layers according to their different luminance statistics, effectively achieving a naturalness-preserved image enhancement. This enhancement method requires that the image should have a higher administrative-level sense; however, the texture response in the sea image is very weak and it is almost impossible to obtain detailed information through delamination.
The Retinex-based method was first proposed by Land [9], and the basic idea is decomposing images into two parts, illumination and reflectance. Most early methods regard the reflectance part as an enhanced image, such as Signal-Scale Retinex (SSR) [10] or Multi-Scale Retinex (MSR) [11], etc. Although these methods can significantly enhance details, they also remove some of the non-smooth components that are mixed in illumination. Wang et al. [12] proposed obtaining the illumination and reflectance of a bright-pass filter, and Fu et al. [13] proposed a probabilistic method based on maximum a posteriori formulation; such improvements can make the enhanced images look more natural, but there are also situations where the illumination estimate is inaccurate. Since the Retinex-based method is usually performed in the logarithmic domain, the logarithmic transformation is not suitable for processing the strong noise hidden in sea images. Therefore, the effect of processing sea images using a Retinex-based method directly is not ideal.
Recently, variational-based image enhancement methods have been proposed and used based on the Retinex idea [14,15,16]. However, the difference is that variational models use an iterative approach to approximate illumination and reflectance terms. Ma et al. [17,18] designed an L1-based variational model for medical images to describe the Retinex model using a non-local TV regularized model and a Bregman iteration method. Fu et al. [19] developed a weighted variational model in the logarithmic domain for simultaneous reflectance and illumination estimation. Li et al. [20] analyzed the noisy image and considered that the logarithm transformation does not apply in the regularization term. A Retinex model considering additional noise terms and without logarithmic transformation is proposed, and optimized the function using an augmented Lagrange multiplier based on an alternating direction minimization algorithm. The essence of this method is an image-restoration method, which maintains the image structure and suppresses the influence of noise.
In this paper, we design a variational model suitable for panchromatic sea image enhancement following the total variation method. For our model, it is essential that illumination, noise, and the scattering characteristics of solar are fully considered, with the effects of ambient light and noise simultaneously removed through a special regularization term design, resulting in the best enhancement effect.
2. Model and Algorithm
2.1. Retinex Model with Noise Suppression
Mixed noise (mainly including additive Gaussian-type noise and impulse-type noise) has a very strong influence for panchromatic sea image enhancement. By observing contrast-adjusted sea surface images (as shown in Figure 1), we found that noise, especially impulse-type noise, sometimes cannot be ignored.
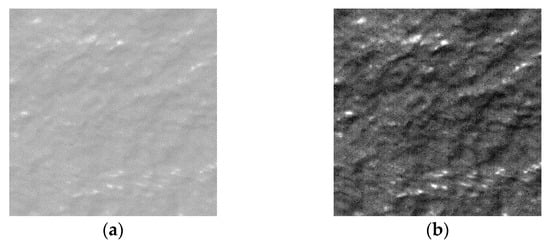
Figure 1.
(a) Original sea image; (b) Contrast-adjusted sea image.
For a noisy image, the noise model can be expressed as:
where f is a measured image, u is an unknown true image, H is a linear operator, Λ is the index set of certain pixels, which contains the original information and additive noise, ΛC is defined as the inpainting domain, which contains various randomness degradations such as impulse noise. It should be pointed out that both Λ and ΛC are unknown in this paper. N1 represents additive Gaussian-type noise on the domain Λ, N2 represents the value of impulse-type noise in the domain ΛC.
According to the ideal noise-free Retinex theory, the input image without noise can be decomposed into two parts: illumination and reflectance:
where O represents the noise-free input image, R represents reflectance components (noise-free), L represents illumination components (noise-free). Considering the sea surface image contains complex noise as shown in Equation (1), we introduce the additive Gaussian-type noise term N1 and the impulse-type noise term N2 into the ideal Retinex model, and Equation (2) at this time is expressed as:
In Equation (3), I represents the noisy input image, we use the variational method to accurately solve the reflection component R. The typical variational method for solving the Retinex model is usually performed in the logarithmic domain, but reference [20] points out the inapplicability of the logarithmic transformation. The main reason is that the following equation cannot be satisfied under noisy conditions:
and the noise term brings too much uncertainty in solving the log domain gradient. In this paper, we designed a target equation in the non-logarithmic domain, and we converted the problem from solving Equation (3) to the following problem:
where represents L2 norm and represents L1 norm. is the gradient operator, and is the gradient operator in horizontal direction. λ1, λ2 and λ3 are nonnegative parameters and their values determine the weight of corresponding regularization term. In Equation (5), is the fidelity term, which is used to minimize the distance between input image and recomposed image . is a first-order regularization item that restricts the total variation sparsity and piece-wise smoothness of a illumination image, is a first-order regularization term used to constrain the horizontal non-uniform of a reflectance image, is a regularization term for impulse-type noise, which requires is sparse.
By solving Equation (5), we can obtain the reflectance and illumination image after suppressing the abnormal noise points caused by overexposure or other reasons in sea surface images, and it basically meets the needs in actual quality sea image processing although its effectiveness is limited. However, for a strong noise situation such as Figure 1b, we need special treatment of Equation (5) to remove the noise, that is, we regard and as a whole without considering the influence of the illumination, and the rest remain unchanged, at this time we have:
the obtained by solving Equation (6) is the image after noise suppression. Then we can treat it as an observation image, resolve Equation (5) and obtain the reflectance and illumination image after suppressing.
2.2. Fitting Scattering Halo
For the noisy Retinex-based enhanced model (5) proposed in the previous section, the solution to the noisy Retinex model will be more accurate if we can apply the law of illumination changes. The influence of water vapor is a non-negligible important factor that causes significant non-uniform illumination in sea images. Due to the strong forward scattering of particles in the water vapor, solar forms a clear scattering halo in sea images, and the halo is not easily perceived in the sea background information (as shown in Figure 2).

Figure 2.
A sea image mixed with halo (image size 1024 × 1024).
After analyzing many airborne sea remote sensing images, we found that most of the sea images have ellipsoidal solar-scattering halos. In addition, by performing a bitplane decomposition on the image, we can fit the halo more intuitively. Assuming that the quantization bit number of the input image I is k, the input image can be expressed as:
where ai is the binary coefficient matrix of the (I + 1)th bitplane, the k binary coefficient matrices corresponding to k different bitplanes form k bitplane images. We perform bitplane decomposition on Figure 2, whose quantization bit number k is 8, and the decomposed image planes are shown in Figure 3.
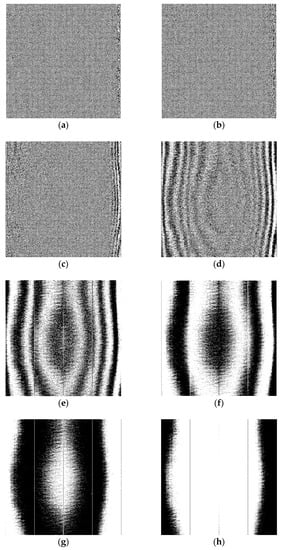
Figure 3.
Bitplane decomposition of an 8-bit sea surface image (a) Bitplane 1; (b) Bitplane 2; (c) Bitplane 3; (d) Bitplane 4; (e) Bitplane 5; (f) Bitplane 6; (g) Bitplane 7; (h) Bitplane 8.
It can be seen more clearly from the decomposed bitplane images that the shape of the scattering halo is approximately elliptical, and the basic equation can be expressed as:
The major semi-axis of the vertical direction after ellipse fitting is , the semi-minor axis of horizontal direction is: (the derivation steps are shown in Appendix A), where (Xc,Yc) is the geometric center of the fitted ellipse, , . To simplify the fitting formula, we consider the transformation law of major semi-axis direction and semi-minor axis direction to be approximately equal. Taking the horizontal data as an example for analysis, from many bitplane decomposition images, we can see that in different bitplane k, the number of black-and-white striped (with the center point as the origin and evenly spreading in the horizontal and vertical directions) interval pixels Dk satisfies the following rules:
where α is a fixed factor related to the height of the sun and the distance from the detector to the sea surface, the value of α remains unchanged in different bitplanes. Considering an image whose quantization bit number is k, the pixel value is continuously changed from 0 to at a pixel interval of 1. At this time, the number of black-and-white striped interval pixels Dk satisfies:
Therefore, it can be seen that the halo intensity in the sea image gradually decreases from the center of the ellipse toward the periphery. We use a Gaussian function to fit the change in intensity, and the fitting equation for the solar-scattering halo is:
where σ is the standard deviation of the model. In this paper, we take the standard deviation as half of the number of pixels on the major axis of the fitted ellipse. The normalized halo model of Figure 2 is drawn according to the fitting equation of (11), and its two-dimensional and three-dimensional normalized model are shown in Figure 4.
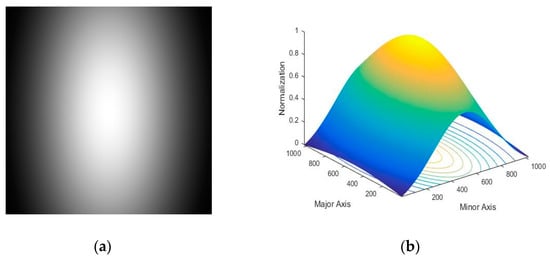
Figure 4.
Normalized model of scattering halo (a) Two-dimensional; (b) Three-dimensional.
Comparing Figure 4 with Figure 2 and Figure 3, our model shows consistency with the actual image. We use the neighborhood mean value Ia of the central pixel and the neighborhood mean value Ib of the edge pixels in the image as the two extreme values of the Gaussian function, Ia is defined as the mean value of the elliptical center pixel and its surrounding 17 × 17 pixels (if the region contains abnormal non-uniform noise, the abnormal point is removed), and Ib is defined as the mean value of the edge pixel and its surrounding 17 × 17 pixels (if several edge pixel regions can be found, the mean of all regions is used).and we can obtain the final solar-scattering halo fitting model:
In particular, when a sea image contains only a part of the elliptical halo, we intercept the corresponding position area in the model above and obtain the required halo components in the subsequent processing.
2.3. Final Variational Model
According to the Retinex method and the scattering halo model discussed above, the final variational model is constructed for sea surface image enhancement. The model constrains the noise and illumination in the regularization term simultaneously, and the image enhancement problem is transformed to solve the following minimization problem:
where achieves the purpose of constraining the change of illumination information by minimizing the gradient of the illumination image and the gradient of the illumination model. For uniform illumination conditions, .
To facilitate the solution, we convert the problem of Equation (13) to the anisotropic problem shown in Equation (14):
This optimization problem can be solved using Split Bregman iteration (first proposed by Goldstein and Osher in Reference [21]). First , and are replaced by new variables , and :
and this yields the following constrained optimization problem:
To solve this problem using Split Bregman method, we introduce new variables , , and convert Equation (16) into the following unconstrained optimization problem:
and then the unconstrained optimization problem can be solved by the iterative schemes below:
The numerical algorithm for solving Equation (18) is shown in Algorithm 1 below:
| Algorithm 1. Numerical Algorithm for Solving (13) |
| (1) Set the initial guesses , , . (2) Choose appropriate parameters , , , , , . (3) For k = 0, 1, ... ..., iterate the following function until convergence. |
In the algorithm above, all the parameters (, , , , , ) are positive constant, and their values determine the weight of corresponding regularization term., , , should be in [0.1, 1] according to the experiment and the laws found in the experiment. Too large or too small values can cause image degradation and distortion, and the brightness of the image will increase as their values increase. The value of , are more suitable between [10, 100] in our experiment, larger values means longer time consumption, and less image degradation. The parameters we choose are , in the following experiment. At the same time, the soft-threshold operator is introduced:
and the stopping criteria of iteration is:
where ε is an artificially selected convergence threshold, and threshold values of 0.001 are selected in all the experimental aspects of image enhancement in this paper. There are two reasons for us to choose this value: (1) The image enhancement effect obtained after iteration under the threshold value of 0.001 is basically optimal, we cannot significantly improve the enhancement effect by reducing it; (2) It is a relatively common iterative suspension threshold and we have investigated a large number of literatures and found that most of them choose this threshold value as the criterion for iteration stop. Satisfying this condition and the iteration ended, the obtained Rk is the final enhanced sea image.
3. Experimental and Discussion
3.1. Experiment Settings
To verify the effectiveness of the proposed algorithm, we chose three different illumination types of sea images as test data: uniform illumination image, elliptical non-uniform illumination image, and partial elliptical non-uniform illumination image. The test images were panchromatic (image size: 1024 × 1024) and acquired by our self-developed high-resolution camera mounted on an airborne platform, and the imaging sensor of camera is manufactured by DALSA, Canada.
All verification tests used a PC running Windows 7 OS with Intel (R) Xeon (R) CPU E5-1620 v2 @3.70GHz and MATLAB R2015a. The convergence threshold ε for stopping criteria of iteration was set as 0.001.
We also compared the results using our method with those using the other six state-of-the-art image enhancement methods: HE, SSR [10], MSR [11], Naturalness-Preserved Enhancement (NPE) algorithm [8], Simultaneous Reflectance and Illumination Estimation (SRIE) model [19], and Probabilistic method for Image Enhancement (PIE) [13]. The six comparison methods above basically cover the typical methods involved in the introduction: HE-based enhancement methods, masking-based enhancement methods, Retinex-based enhancement methods and total variation methods.
3.2. Sea Image Enhancement
Typical images selected in this paper are shown in Figure 5a, Figure 6a and Figure 7a, where Figure 5a is a uniform illumination image, Figure 6a is an elliptical non-uniform illumination image, and Figure 7a is a partial elliptical non-uniform illumination image. Comparisons of enhanced images using different methods are shown in Figure 5, Figure 6 and Figure 7.
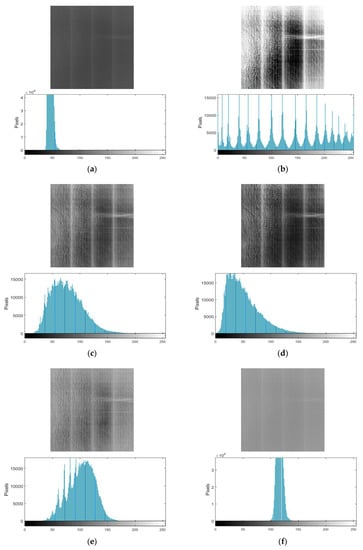
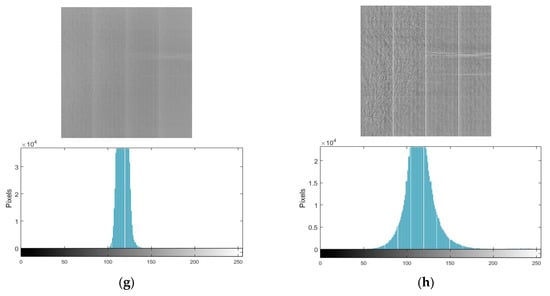
Figure 5.
Enhancement result of uniform illumination image using different image enhancement methods (a) Original; (b) HE; (c) SSR; (d) MSR; (e) NPE; (f) SRIE; (g) PIE; (h) Our method.
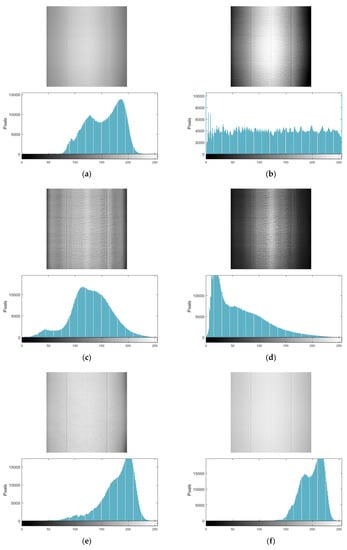
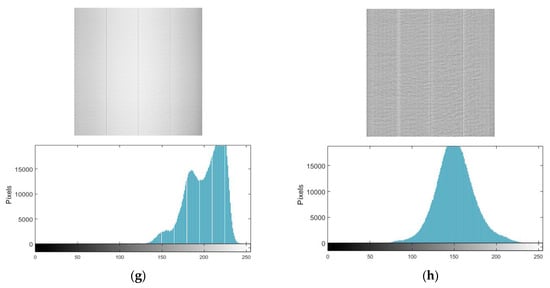
Figure 6.
Enhancement result of elliptical non-uniform illumination image using different image enhancement methods (a) Original; (b) HE; (c) SSR; (d) MSR; (e) NPE; (f) SRIE; (g) PIE; (h) Our method.
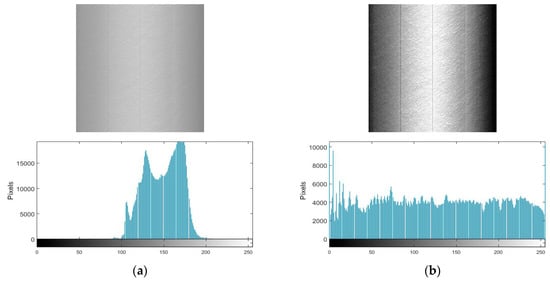
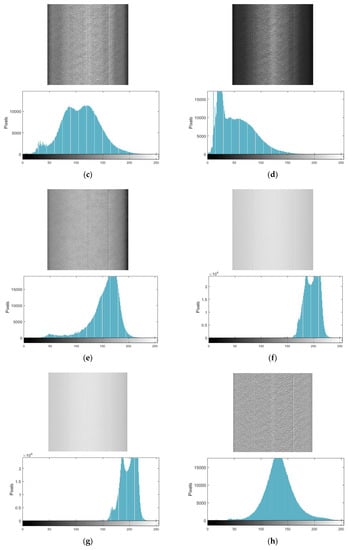
Figure 7.
Enhancement result of partial elliptical non-uniform illumination image using different image enhancement methods (a) Original; (b) HE; (c) SSR; (d) MSR; (e) NPE; (f) SRIE; (g) PIE; (h) Our method.
In Figure 5a, Figure 6a and Figure 7a, the sea surface image is affected by the reflectivity, whose contrast is low, and the texture features are extremely insignificant. Under uniform light conditions, the image is less affected by illumination, and the relative difference in texture information is significant even when the exposure intensity is weak. For images formed under non-uniform illumination conditions, we regard the sea surface ripples as the background information. When the strong forward scattering of particles in the water vapor (large proportion) couples to the background information (small proportion), the relative differences between the texture information to be observed becomes smaller, making image enhancement more difficult.
For the uniform lighting scene, several enhancement methods used in the experiment effectively improved the global background gray level of the image. However, for SRIE and PIE methods, the difference between texture features was not effectively stretched after enhancing the global brightness, and the phenomena were basically the same (see Figure 5f,g). It is assumed that this was affected by the excessive estimation of the illumination components by the SRIE method and the PIE method. Both illumination components contained a certain amount of sea texture information, resulting in distortion of the reflectance component. The contrast value of the HE method (Figure 5b) was the largest among all the methods, but it did not take into account noise and illumination. In a uniform illumination environment, a large amount of image noise was amplified with the texture of the image. At the same time, the HE method stretched the gray level of the image globally, which caused the bright area of the image to become brighter, and the dark area of the image to become darker, which was unfavorable to the observation of the details of the dark area. Both the SSR and MSR methods had low luminance average values when dealing with uniformly illuminated sea images (Figure 5c,d), and the details of dark area were not significant which was similar to that of HE method. The NPE method was a relatively good processing method. For the relative difference in texture information of sea surface images under uniform illumination, an ideal layered effect of wave information and local information was obtained. After the corresponding enhancement process was performed on different layers, the final effect was synthesized. The gray value range of the image enhanced by the NPE method (Figure 5e) was appropriate; however, the image noise was also enhanced as high-frequency information. Areas with less texture information were kept in dark colors, which was hard to observe after contrasting with surrounding bright areas.
The subjective observations of the images acquired through the different enhancement methods used in the experiments are quite different for the non-uniform illumination images shown in Figure 6a and Figure 7a. Each method had specific enhancements and characteristics for the elliptical non-uniform illumination image (Figure 6) and the partial elliptical non-uniform illumination image (Figure 7).
Although enhanced images using the HE method (Figure 6b and Figure 7b) had uniform gray distribution, the simultaneous processing of the stretching transformation enhanced the global brightness difference of the image, leading to the reduction of texture details in the center of the halo (bright area) and the edge of the halo (dark area). The enhanced images using SSR method (Figure 6c and Figure 7c) had more appropriate gray mean value than those using MSR methods (Figure 6d and Figure 7d), and inaccurate estimation of illumination were found in enhanced images using an SSR method or MSR method, which was particularly evident in the global non-uniformity after image enhancement. Similar to uniform illumination, the SRIE method (Figure 6f and Figure 7f) and the PIE method (Figure 6g and Figure 7g) had the problem of excessive estimating illumination components under non-uniform illumination. The result of NPE (Figure 6e and Figure 7e) was worse than that of uniform illumination, the main reason being that texture information in the image was weak due to the heavy water vapor and halo at this time, and it cannot achieve the purpose of distinguishing each frequency detail information through multi-scale layering.
Our model achieved the constraint of illumination by modeling the halo under different illumination conditions and solving . At the same time, we considered the characteristics of various noises and constrain noise information, and the final enhanced image simultaneously removed illumination and noise effects. Therefore, regardless of the uniform illumination environment in Figure 5, or the non-uniform illumination environments shown in Figure 6 and Figure 7, the sea surface image enhanced by our method basically maintained a stable gray mean value and gray range, various types of noise were effectively suppressed, and the texture features and details of each area had been preserved as much as possible. In subjective human observation, our image enhancement result was the softest and most delicate.
To verify the correctness of the texture enhanced by the algorithm in this paper, we used the image shown in Figure 6a to illustrate. It has a specific ship wake texture feature, which is more significant and regular than the water body. We first cropped the partial wake image and performed the contrast stretching operation to express the feature more clearly. At the same time, the enhanced partial image was cropped, and the comparison between the original image and the enhanced image is shown in Figure 8. We can see that our texture information is basically accurate by comparing the wake details in the two images from Figure 8.
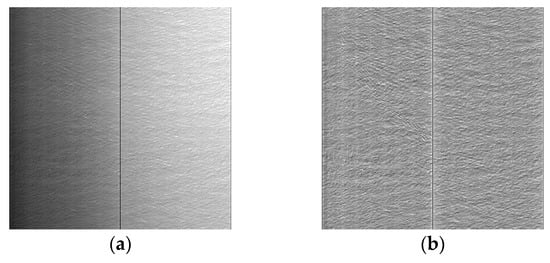
Figure 8.
Comparison between texture of the original ship wake image and the enhanced ship wake image (a) Original ship wake image; (b) Enhanced ship wake image.
3.3. Objective Quality Assessments
To investigate the differences between the algorithms, we also selected three objective quality assessments of the sea to objectively evaluate the performance of the algorithm in addition to the subjective visual experience. Since the purpose of sea image enhancement is to obtain a suitable gray value range and a clear texture expression, we chose the image mean value M, contrast value C, DEAV (Developed Edge Algorithm Value) value (from Point Sharpness Method [22]) D as an objective evaluation indices. For an image of size m × n, their definitions are:
where P (i,j) is the gray value of each pixel in the enhanced image, s is the number of neighboring points, dP is the amplitude of the grayscale change, and dx is the distance increment between pixels.
In the evaluation indexes above, the mean value of an image is used to represent the global gray level. The contrast is used to represent the bright and dark difference of the whole image, and the DEAV value is used to represent the intensity of the image gray-level change. The mean value should not be too large or too small, and it is more appropriate to be half of the quantified maximum value. The image with a high contrast value gives a more vivid and prominent feeling, and the visual sense of change is stronger. Larger DEAV value means sharper image gray value change, more significant image edges and texture features, and higher image clarity. We used the evaluation indexes above to evaluate the original image and the enhanced image of each method in Figure 5–7; the evaluation results are shown in Figure 9.
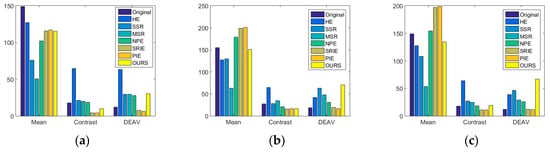
Figure 9 shows that the average gray value of our enhanced images was always between 120–150, and no over-lighting or under-lighting occurred. This depended on our model’s ability to remove the illumination in general, and the sea reflection was basically maintained at that order of magnitude. For the contrast evaluation, compared with other types of non-variational methods (HE, SSR, MSR, NPE), the contrast of our method was relatively small, because the contrast calculation is performed globally. The methods with large contrast had retained the influence of illumination too much, and the difference between the bright and dark areas was large. Since the feeling of change at this time was too much from the image globality, this led to the problem that the image was unnatural, and the local observability was deteriorated. In the DEAV evaluation, our method had the highest DEAV value (70.2 for elliptical and 66.9 for partial elliptical) for non-uniform illumination images, indicating that the enhanced image detail retention was better, and the image sharpness was the highest. For uniform illumination image, our method was lower than the HE method; this is mainly caused by the HE method also enhanced the noise, and a large amount of non-uniform noise was amplified and mistaken for image detail changes.
3.4. Noise Suppression
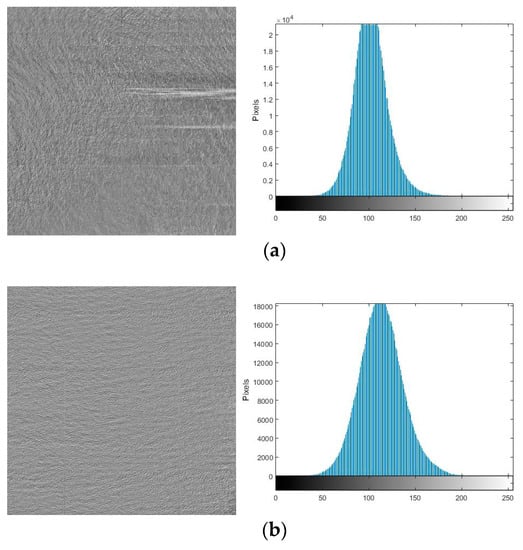
To verify the ability to suppress noise of our method, we tested Figure 1b with significant noise and it was processed using Equations (5) and (6) respectively. The processed images are shown in Figure 10b,c, and the noise terms are shown in Figure 11a,b.
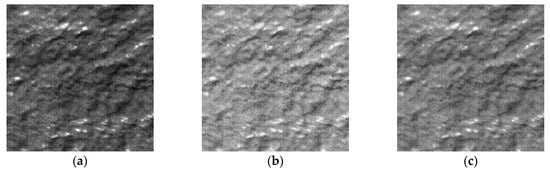
Figure 10.
Denoising results of our method (a) Original noisy image; (b) Denoising result using Equation (5); (c) Denoising result using Equation (6).
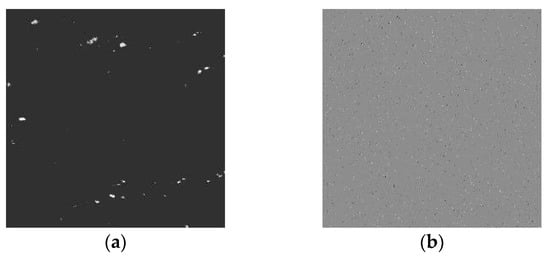
Figure 11.
Noise term of our method (a) Noise term of Equation (5); (b) Noise term of Equation (6).
3.5. Convergence Rate and Computational Time
It is worth mentioning that the convergence rate and the computational time in this paper are affected by our chosen stopping criteria of iteration threshold ε and the input image size. It should be pointed out that this paper selects three threshold values of 0.01, 0.05, 0.001 when verifying the relationship between the computational time and the iteration threshold ε. Among the three values, 0.001 is the threshold value for ensuring the optimal enhancement effect. The quality of the image will be significantly degraded when the threshold value is 0.1; 0.05 is a medial value. The three threshold values represent three typical effects after image enhancement, while clearly reflecting the time-consuming changes. We illustrated it with the typical iteration of Figure 2. The relationship between iteration number and ε, iteration number and image size are shown in Figure 12. In addition, the computational times with respect to different ε and image size are shown in Table 1.
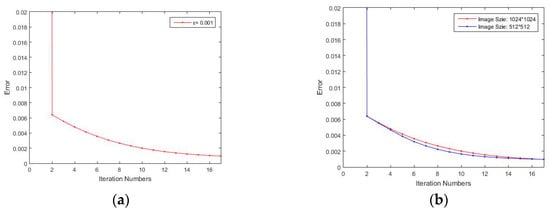
Figure 12.
The relationship between iteration number and the variation of the parameters (a) The relationship between iteration numbers and stopping threshold ε; (b) The relationship between iteration number and image size (ε = 0.001).

Table 1.
Computational times in seconds.
We can see from Figure 12 that the iterations are in a trend of continuous convergence. In addition, smaller image size means higher iteration efficiency. It can also be seen from Table 1 that smaller iteration stopping threshold means more time-consuming. This is because smaller error between actual image and reflectance image requires greater number of iterations. The other images show the same iteration characteristics, which will not be included here.
3.6. Further Correction
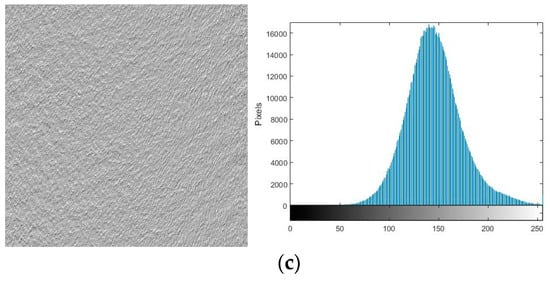
To eliminate the influence of weakly responsive pixels between the output taps of the self-developed camera, we further corrected the enhanced image obtained using Moment Matching [23] to make the image more viewable. The correction uses the following equation:
where R is an enhanced image, and are the variance and mean value of R, and are the variance and mean value of the image row, Fc is the corrected image.
We used the equation above to correct the images in Figure 5h, Figure 6h, and Figure 7h. The corrected images and histograms are shown in Figure 13. It can be seen that pixels with weaker response between the various taps can be effectively corrected, and the visual effect of the image can be effectively improved.
4. Conclusions
In this paper, a variational model considering the effects of illumination and noise simultaneously for sea image enhancement was proposed. The solar-scattering halo model design was completed by bitplane decomposition, and an iterative solving equation considering Retinex theory in the non-logarithmic domain was established. The final image enhancement result of our model was obtained by constraining the illumination and the halo in different situations. The experimental results show that the gray range of the enhanced sea surface image obtained by our method was suitable and stable (always between 120–150, and no over- or under-lighting occurred), the texture details were clear and natural with the highest DEAV value (70.2 for elliptical and 66.9 for partial elliptical) for non-uniform illumination images, and the visual effects were optimal compared with several other state-of-the-art image enhancement methods. However, due to too many constraints in the proposed method, it takes a long time in the iteration process. Our next goal is to shorten the time-consuming nature of our algorithm. At the same time, exploring the possibility of our method in other applications (such as underwater image enhancement, haze image enhancement, etc.) will also constitute future work.
Author Contributions
Conceptualization, M.S., H.Q. and G.J.; Data curation, M.S.; Formal analysis, M.S.; Methodology, M.S.; Software, M.S.; Supervision, H.Q. and G.J.; Validation, H.Q.; Writing—original draft, M.S.; Writing—review & editing, G.Z. and S.T.
Funding
This research was funded by [the Major Projects of the Ministry of Science and Technology] grant number [2016YFB0501202], [the Natural Science Foundation of Jilin Province, China] grant number [20170101164JC], [Science and technology development plan item of Jilin Province] grant number [20180201015GX], [the Youth Science Foundation of Jilin Province, China] grant number [20180520193JH].
Conflicts of Interest
The authors declare no conflict of interest.
Appendix A
Derive the major semi-axis and the semi-minor axis from Equation (8):
The basic equation of the ellipse is:
Suppose the ellipse does not translate and only rotate θ, we set the original coordinates to (u, v) and the new coordinate to (x, y):
The standard ellipse formula can be expressed as:
where a is the major semi-axis, b is the semi-minor axis. Rotate θ, there is:
Compared with the basic equation, we can get:
Then we can get:
Then suppose the ellipse does not rotate and only translate (uc, vc), The standard ellipse formula can be expressed as:
where is the parameter we need to solve. By rotating it at angle θ, we can see that this equation is exactly the same as Equation (A3) defined above. If rotate at angle θ, there will be:
Then we can follow steps above and get:
Appendix B
Deriving the iterative function in the algorithm from Equation (18):
For , , to minimize their functions we simply set their first variational derivational equal to zero:
Then we can get:
For , , , , we also simply set their first variational derivational equal to zero and get:
Then we can get:
Then we introduce the soft-threshold operator , and obtain the final iterative function:
Appendix C
The iterative function of Equation (6) according to the method of Appendix B:
References
- Gonzalez, R.C. Digital Image Processing; Prentice Hall: Upper Saddle River, NJ, USA, 2008. [Google Scholar]
- Bovik, A.C. Handbook of Image and Video Processing; Academic: New York, NY, USA, 2010. [Google Scholar]
- Pizer, S.M.; Johnston, R.E.; Ericksen, J.P.; Yankaskas, B.C.; Muller, K.E. Contrast-limited adaptive histogram equalization: Speed and effectiveness. In Proceedings of the First Conference on Visualization in Biomedical Computing, Atlanta, GA, USA, 22–25 May 1990; pp. 337–345. [Google Scholar]
- Nikolova, M.; Steidl, G. Fast hue and range preserving histogram specification: Theory and new algorithms for color image enhancement. IEEE Trans. Image Process. 2014, 23, 4087–4100. [Google Scholar] [CrossRef] [PubMed]
- Polesel, A.; Remponi, G.; Mathews, V.J. Image enhancement via adaptive unsharp masking. IEEE Trans. Image Process. 2000, 9, 505–510. [Google Scholar] [CrossRef] [PubMed]
- Deng, G. A generalized unsharp masking algorithm. IEEE Trans. Image Process. 2011, 20, 1249–1261. [Google Scholar] [CrossRef] [PubMed]
- Wang, S.; Zheng, J.; Li, B. Parameters-adaptive nighttime image enhancement with multi-scale decomposition. IET Comput. Vis. 2016, 10, 425–432. [Google Scholar] [CrossRef]
- Wang, S.; Luo, G. Naturalness preserved image enhancement using a priori multi-layer lightness statistics. IEEE Trans. Image Process. 2018, 27, 938–948. [Google Scholar] [CrossRef] [PubMed]
- Land, E.H.; McCann, J.J. Lightness and Retinex theory. J. Opt. Soc. Am. 1971, 61, 1–11. [Google Scholar] [CrossRef] [PubMed]
- Hines, G.; Rahman, Z.U.; Jobson, D.; Woodell, G. Singel-scale Retinex using digital signal processors. In Proceedings of the Global Signal Processign Conference, San Jose, CA, USA, 27–30 September 2004. [Google Scholar]
- Jobson, D.J.; Rahman, Z.-U.; Woodell, G.A. A multiscale Retinex for bridging the gap between color images and the human observation of scenes. IEEE Trans. Image Process. 1997, 6, 965–976. [Google Scholar] [CrossRef] [PubMed]
- Wang, S.; Zheng, J.; Hu, H.-M.; Li, B. Naturalness preserved enhancement algorithm for non-uniform illumination images. IEEE Trans. Image Process. 2013, 22, 3538–3548. [Google Scholar] [CrossRef] [PubMed]
- Fu, X.; Liao, Y.; Zeng, D.; Huang, Y.; Zhang, X.-P.; Ding, X. A probabilistic method for image enhancement with simultaneous illumination and reflectance estimation. IEEE Trans. Image Process. 2015, 24, 4965–4977. [Google Scholar] [CrossRef] [PubMed]
- Ng, M.K.; Wang, W. A total variation model for Retinex. SIAM J. Imaging Sci. 2011, 4, 345–365. [Google Scholar] [CrossRef]
- Kimmel, R.; Elad, M.; Shaked, D.; Keshet, R.; Sobel, I. A variational framework for Retinex. Int. J. Comput. Vis. 2003, 52, 7–23. [Google Scholar] [CrossRef]
- Wang, W.; Ng, M.K. A nonlocal total variation model for image decomposition: Illumination and reflectance. Numer. Math. Theory Method. Appl. 2014, 7, 334–355. [Google Scholar]
- Ma, W.; Morel, J.M.; Osher, S.; Chien, A. An L1-based variational model for Retinex theory and its applications to medical images. In Proceedings of the Computer Vision and Pattern Recognition, Providence, RI, USA, 20–25 June 2011; pp. 153–160. [Google Scholar]
- Ma, W.; Osher, S. A TV bregman iterative model of Retinex theory. Inverse Probl. Imaging 2012, 6, 697–708. [Google Scholar] [CrossRef]
- Fu, X.; Zeng, D.; Huang, Y.; Zhang, X.-P.; Ding, X. A weighted variational model for simultaneous reflectance and illumination estimation. In Proceedings of the Computer Vision and Pattern Recognition, Las Vegas, NV, USA, 27–30 June 2016; pp. 2782–2790. [Google Scholar]
- Li, M.; Liu, J.; Yang, W.; Sun, X.; Guo, Z. Structure-revealing low-light image enhancement via robust Retinex model. IEEE Trans. Image Process. 2018, 27, 2828–2841. [Google Scholar] [CrossRef] [PubMed]
- Goldstein, T.; Osher, S. The split Bregman alogrithm for L1 regularized problems. SIAM J. Imaging Sci. 2009, 2, 323–343. [Google Scholar] [CrossRef]
- Wang, H.; Zhong, W.; Wang, J.; Xia, D. Research of measurement for digital image definition. J. Image Graph. 2004, 9, 828–831. [Google Scholar]
- Gadallah, F.L.; Csillag, F.; Smith, E.J.M. Destriping multisensor imagery with moment matching. Int. J. Remote Sens. 2000, 21, 2505–2511. [Google Scholar] [CrossRef]


© 2018 by the authors. Licensee MDPI, Basel, Switzerland. This article is an open access article distributed under the terms and conditions of the Creative Commons Attribution (CC BY) license (http://creativecommons.org/licenses/by/4.0/).